
PRODUCTIVITY IMPROVEMENT OF CUTTING, SEWING AND …€¦ · 7.3.1 Future State of Cutting 65 7.3.2...
106
PRODUCTIVITY IMPROVEMENT OF CUTTING, SEWING AND FINISHING SECTIONS OF A GARMENT FACTORY THROUGH VALUE STREAM MAPPING – A CASE STUDY By Md. Moin Uddin A project submitted to the Department of Industrial and Production Engineering, Bangladesh University of Engineering and Technology, in partial fulfillment of the requirements for the degree of Master of Engineering in Industrial and Production Engineering. DEPARTMENT OF INDUSTRIAL & PRODUCTION ENGINEERING BANGLADESH UNIVERSITY OF ENGINEERING AND TECHNOLOGY DHAKA-1000, BANGLADESH October, 2015
Transcript of PRODUCTIVITY IMPROVEMENT OF CUTTING, SEWING AND …€¦ · 7.3.1 Future State of Cutting 65 7.3.2...

PRODUCTIVITY IMPROVEMENT OF CUTTING, SEWING AND
FINISHING SECTIONS OF A GARMENT FACTORY THROUGH VALUE
STREAM MAPPING – A CASE STUDY
By
Md. Moin Uddin
A project submitted to the Department of Industrial and Production Engineering, Bangladesh
University of Engineering and Technology, in partial fulfillment of the requirements for the
degree of Master of Engineering in Industrial and Production Engineering.
DEPARTMENT OF INDUSTRIAL & PRODUCTION ENGINEERING
BANGLADESH UNIVERSITY OF ENGINEERING AND TECHNOLOGY
DHAKA-1000, BANGLADESH
October, 2015
ii

iii

iv
DEDICATION
This project is dedicated to my parents whose tireless encouragement helps me to advance in
future.

v
ACKNOWLEDGEMENT
First, I am very much grateful to the most powerful, the gracious almighty Allah for giving me
knowledge, energy and patience for completing the project work successfully.
I would like to express my deepest indebtedness and gratitude to my project supervisor, Dr.
Abdullahil Azeem, Professor, Department of Industrial and Production Engineering (IPE),
Bangladesh University of Engineering and Technology (BUET), Dhaka, for his continuous
guidance, invaluable suggestions, constructive comments and endless encouragement throughout
the progress and preparation of this project work.
I am very much thankful to Mr. K. M. Rezaul Hasanat CEO & Chairman, Viyellatex Ltd. for
giving me opportunity to implement new methods and ideas in his factory. I also express my
gratitude to Mr. Parvez Saiful Islam (COO), Mr. Javed Iqbal (DGM), Mr. Abdur Razzak (Head
of production), Mr. Robiul Islam (Head of Eco-Couture), Mr. Abul Kalam Azad, Mr. Nazmul
Alam and workers and staffs of viyellatex Ltd. Gazipur, for their cordial support and cooperation
by providing me the respective information, valuable time and great support during the
assessment and implementation phase while I was working there as Head of IE and Lean, and
also for my project work. I am also thankful to my colleagues Mr. Mahabub Alam, Executive
(Lean), and my team who has given their support and cooperation all time.
In addition, thanks are due to those who helped me directly and indirectly during the different
stages of the project work.
Finally, I would like to convey my sincere gratitude to my parents whose continuous inspiration,
sacrifice and support encouraged me to complete the project successfully.

vi
ABSTRACT On time delivery with quality and quantity is important for any manufacturing industry. At
present, lead time is decreasing day by day and customer requirements also continuously
changing. To fulfill customer demand whole production system should be more capable and
efficient. For this reason productivity is important for manufacturing industries. Productivity can
be defined as a ratio between output and input.
Manufacturing industries are always having lots of production processes for desired products.
Out of these processes some are not essential and do not add any value to the product. Most of
time, management is not quite aware of the non-value-adding processes. If we observe a
garments production line we will see that there were lots of In-process inventories and waiting
time between almost every sequential operation. No strict and precise work distribution was
followed by many workers. Material’s used to travel large distance from input receiving to
needle check and cartooning. Many of these movements and handlings are totally unnecessary.
Sometimes reworks are increasing the total completion time. As a result, the productivity was
hampered. So, a smooth, streamlined and continuous flow is really necessary to avoid all such
unexpected occurrence.
The objective of value stream mapping is to identify value-added activities and non-value-added
activities. Value stream maps should reflect what actually happens rather than what is supposed
to happen so that opportunities for improvement can be identified. Value Stream Mapping is
often used in process cycle-time improvement projects since it demonstrates exactly how a
process operates with detailed timing of step-by-step activities. It is also used for process
analysis and improvement by identifying and eliminating time spent on non-value-added
activities.
The present study focuses on improving the overall productivity of cutting, sewing and finishing
sections through value stream mapping (VSM). Different techniques like process integration, job
sharing, multitasking etc. will be implemented to improve the current state situation. Three
different product lines (Jacket, Polo shirt, and tee shirt) will be considered to implement this
study, and the productivity as well as line efficiency will be compared before and after
implementing the technique.

vii
TABLE OF CONTENTS
CONTENTS PAGE NO
Acknowledgement v
Abstract vi
List of Tables xii
List of Figures xiii
CHAPTER 1: INTRODUCTION
1.1 Introduction 1
1.2 Rationale of the study 2
1.3 Background of the project 2
1.4 Problem statement 3
1.5 Objective of the study 3
1.6 Methodology 3
CHAPTER 2: LITERATURE REVIEW
2.1 Introduction 4
2.2 Historical Background 4
2.2.1 The Ford System 6
2.2.2 Just in Time and Toyota Production System 7
2.2.3 Lean Manufacturing 8
CHAPTER 3: LEAN MANUFACTURING
3.1 Introduction 10
3.2 Principle of Lean Manufacturing 10
3.3 Value & Waste 11

viii
3.3.1 Types of waste 11
3.3.2 Overproduction 11
3.3.3 Waiting 12
3.3.4 Inventory or work in process (WIP) 12
3.3.5 Over processing 13
3.3.6 Transportation 13
3.3.7 Unnecessary motion 14
3.3.8 Defects 14
3.4 Push System 15
3.5 Pull System 15
3.6 Workplace Organization-5S 15
3.6.1 First pillar: Sort (Seiri) 15
3.6.2 Second pillar: Set in Order (Seiton) 16
3.6.3 Third pillar: Shine (Seiso) 16
3.6.4 Fourth pillar: Standardize (Seiketsu) 16
3.6.5 Fifth pillar: Sustain (shitsuke) 17
3.6.6 The Benefits of 5S 18
3.7 Visual Management 18
3.8 Kanban 19
3.9 Quick Changeover 19
3.10 Kaizen 20
3.11 Total Productive Maintenance 22
3.12 Poka Yoke 22
3.13 Lean Manufacturing Benefits 22
CHAPTER 4: VALUE STREAM MAPPING
4.1 Introduction 23
4.2 Value Stream Mapping (VSM) 23

ix
4.2.1 Value Adding Activity 24
4.2.2 Non-Value Adding Activity 25
4.2.3 Necessary Non-Value Adding Activity 25
4.3 Steps of Value Stream Mapping 25
4.4 Value Stream Mapping Symbols 26
4.4.1 Symbols in VSM 26
4.5 Methods of Designing a Value Stream Mapping 31
4.6 Importance of Value Stream Mapping 32
CHAPTER 5: VSM CURRENT STATE MAP
5.1 Introduction 33
5.2 Methods apply for designing current state map 33
5.3 Value stream mapping data details 33
5.4 Current State of Cutting, Sewing and Finishing 35
5.4.1 Current State of Cutting 35
5.4.2 Current State of Sewing 36
5.4.3 Current State of Finishing 37
5.4.4 Combined Current State map of Cutting, Sewing and Finishing 38
5.4.5 Result analysis of current state map 39
5.4.6 Current value adding, non-value adding and unavoidable non value adding graph 39
5.4.7 Current Efficiency and Productivity graph of traditional lines 40
5.4.8 Current Traditional line Layout 41
5.5 Improvement areas of Current State 42
5.5.1 Cutting section 42
5.5.2 Sewing section 42
5.5.3 Finishing section 43

x
CHAPTER 6: FUTURE STATE MAPPING AND IMPLEMENTATION
6.1 Introduction 44
6.2 Drawing Future state VSM 44
6.3 Future VSM implementation project team 44
6.3.1 Responsibilities of Team 50
6.3.1.1 Project Champion Responsibilities 50
6.3.1.2 Project Manager Task 50
6.3.1.3 Project Team Leader Task 50
6.3.1.4 Execution Team member Task 50
6.3.1.5 Supporting Team member Task 50
6.3.2 Company Profile 51
6.4 Kaizen Events/Blitz 51
6.4.1 Cutting Implementation 52
6.4.2 Sewing Implementation 55
6.4.2.1 Operator Reduction 55
6.4.2.2 Helper Reduction 55
6.4.2.3 Process Improvement 56
6.4.2.4 Reduce WIP 57
6.4.2.5 System development and Layout 58
6.4.2.6 Synchronization of production target 60
6.4.2.7 Quality implementation 60
6.4.3 Finishing Implementation 63
CHAPTER 7: DATA ANALYSIS AND RESULTS
7.1 Introduction 64
7.2 Data analysis 64
7.3 Summary after implementation of future state map 65

xi
7.3.1 Future State of Cutting 65
7.3.2 Future State of Sewing 66
7.3.3 Future State of Finishing 67
7.3.4 Combined Future State map of Cutting, Sewing and Finishing 68
7.4 Result analysis of implemented future state map 69
7.5 Final Results 71
CHAPTER 8: CONCLUSIONS AND RECOMMENDATIONS
8.1 Conclusions 73
8.2 Recommendations 74
REFERENCES 75
APPENDICES
Appendix A: VSM Current Data Log Sheet (Cutting ) 77
Appendix B: VSM Current Data Log Sheet (Sewing ) 78
Appendix C: VSM Current Data Log Sheet (Finishing ) 81
Appendix D: Current state line graph 82
Appendix E: Skill Matrix Process name 83
Appendix F: Skill Matrix Inventory 84
Appendix G: Task Comparison of Helper Replacement 85
Appendix H: Future state Line Graph 86
Appendix I: VSM Future Data Log Sheet (Cutting ) 87
Appendix J: VSM Future Data Log Sheet (Sewing ) 88
Appendix K: VSM Future Data Log Sheet (Finishing ) 90
Appendix L: Automation of Bundling System 91
xii
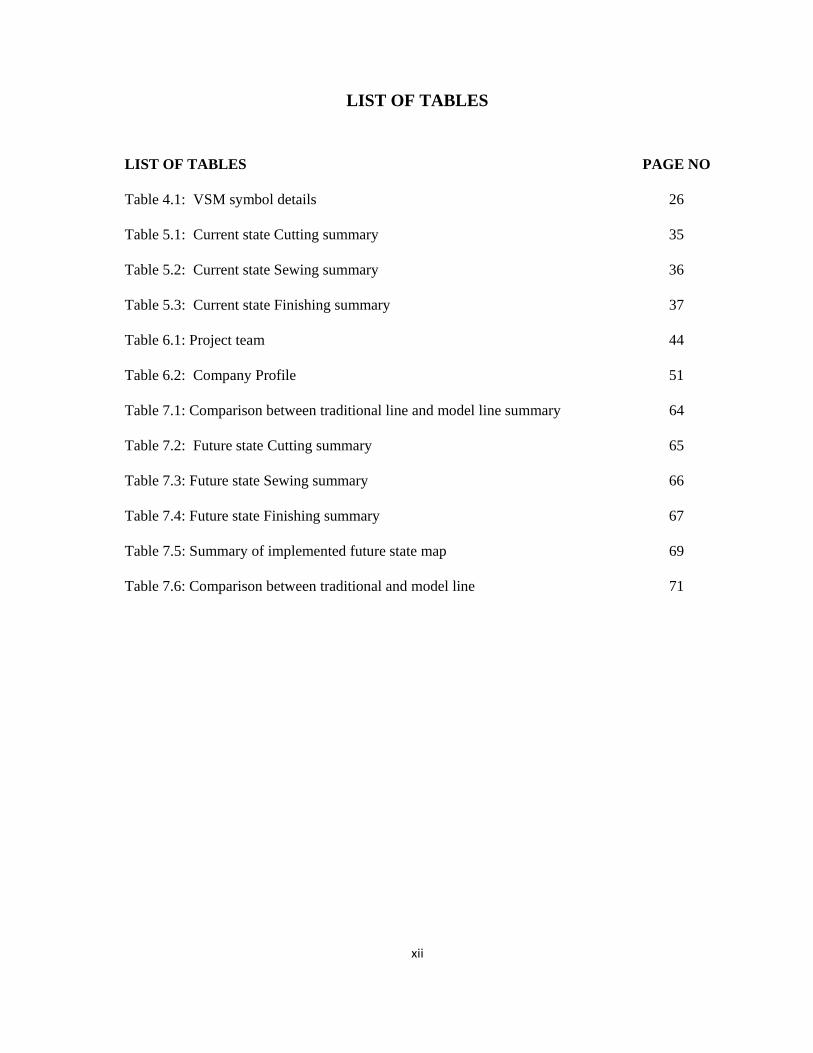
LIST OF TABLES
LIST OF TABLES PAGE NO
Table 4.1: VSM symbol details 26
Table 5.1: Current state Cutting summary 35
Table 5.2: Current state Sewing summary 36
Table 5.3: Current state Finishing summary 37
Table 6.1: Project team 44
Table 6.2: Company Profile 51
Table 7.1: Comparison between traditional line and model line summary 64
Table 7.2: Future state Cutting summary 65
Table 7.3: Future state Sewing summary 66
Table 7.4: Future state Finishing summary 67
Table 7.5: Summary of implemented future state map 69
Table 7.6: Comparison between traditional and model line 71
xiii
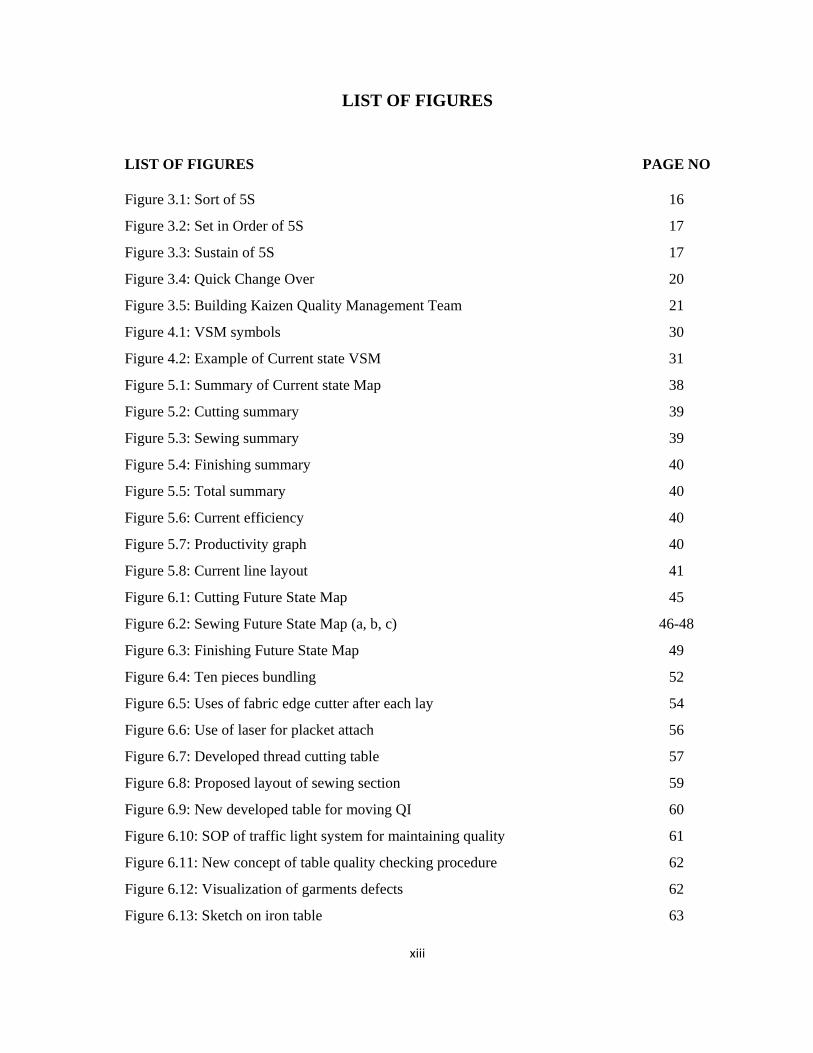
LIST OF FIGURES
LIST OF FIGURES PAGE NO
Figure 3.1: Sort of 5S 16
Figure 3.2: Set in Order of 5S 17
Figure 3.3: Sustain of 5S 17
Figure 3.4: Quick Change Over 20
Figure 3.5: Building Kaizen Quality Management Team 21
Figure 4.1: VSM symbols 30
Figure 4.2: Example of Current state VSM 31
Figure 5.1: Summary of Current state Map 38
Figure 5.2: Cutting summary 39
Figure 5.3: Sewing summary 39
Figure 5.4: Finishing summary 40
Figure 5.5: Total summary 40
Figure 5.6: Current efficiency 40
Figure 5.7: Productivity graph 40
Figure 5.8: Current line layout 41
Figure 6.1: Cutting Future State Map 45
Figure 6.2: Sewing Future State Map (a, b, c) 46-48
Figure 6.3: Finishing Future State Map 49
Figure 6.4: Ten pieces bundling 52
Figure 6.5: Uses of fabric edge cutter after each lay 54
Figure 6.6: Use of laser for placket attach 56
Figure 6.7: Developed thread cutting table 57
Figure 6.8: Proposed layout of sewing section 59
Figure 6.9: New developed table for moving QI 60
Figure 6.10: SOP of traffic light system for maintaining quality 61
Figure 6.11: New concept of table quality checking procedure 62
Figure 6.12: Visualization of garments defects 62
Figure 6.13: Sketch on iron table 63

xiv
Figure 7.1: Summary of Future State Map 68
Figure 7.2: Future state Cutting summary 70
Figure 7.3: Future state Sewing summary 70
Figure 7.4: Future state Finishing summary 70
Figure 7.5: Future state Total summary 70
Figure 7.6: Comparison of line Efficiency 71
Figure 7.7: Comparison of Productivity 71
Figure 7.8: Comparison of line WIP 72
Figure 7.9: Comparison of Lead time 72
Figure 7.10: Comparison of Value adding 72
Figure 7.11: Comparison of Non-Value adding 72

1
CHAPTER ONE
INTRODUCTION
1.1 Introduction
Industrialization is the key to the economical development of the country. The Ready Made
Garments (RMG) industry is the major export – base (75%) for Bangladesh and it has major
impact on country’s economy, as well as on society, because of large number of worker
involvement. To meet the ever increasing demand of the mass population and the international
demand of the textile products, the emerging and important sector of national economy, the
RMG sector has the great chance and opportunity to improve the productivity. Because of being
technologically labor dependent it has a large number of worker involvement and most of them
are female worker so it helps in socio – economical development of the poor fraction of
population of the country. So the females are playing an important role in the largest foreign
exchange earning sector of our country and they are becoming conscious about women rights by
their economic independency. The garments industries in Bangladesh do have the organizational
structure but do not have the proper job description of the employees so the problem arises from
the mid-level management. Description of rules and responsibilities along with power and
authority is essential for smooth production running of any organization. In today’s competitive
world the manufacturers needs to be conscious about time, cost, quality and delivery. To be the
champion in business these four components should be given most priority along with good
management skill and innovative technological aspects of modern development. The present
situation of the RMG sector is not in a satisfying one and in the last year there was a massive
worker agitation because of salary structure, working environment, compliance issues and other
human rights. The local garment manufacturers are facing fierce competition in Quota and GSP
free market as per WTO agreement and they are well behind from the competing countries like
India, Sri Lanka, China, Indonesia and Vietnam etc. In order to face the challenges Bangladeshi
manufacturers have to apply new methods, tools and techniques in different area of production
and operation management and in other business areas.
After the World War II Japanese manufacturers, particularly in the automotive industry, were
faced with the dilemma of shortages of material, financial and human resources. Eiji Toyoda and
Taiichi Ohno at the Toyota Motor Company in Japan pioneered the concept of the Toyota
Production System (TPS), or what is known today as “Lean Manufacturing”. Lean
manufacturing is a new term defined by Womack and Jones that helps the manufacturer to

2
produce quality product with less material, greater efficiency, shorter lead time, and in timely
manner. Lean has many tools for better manufacturability and it needs proper guideline,
management involvement, appropriate knowledge and overall factory transformation to the
system.
Productivity can be defined as a ratio between output and input. Productivity improvement is a
critical success factor and the foundation of profitability [1]. Productivity measurement is a long-
term measurement. Any changes in dynamic potential show a growth or reduction of figures over
a long period [2].
The thesis addresses the application of lean manufacturing concepts to the mass production
sector (RMG) with a focus on the value chain of garment industry including cutting, sewing,
finishing. The objective of the study is to investigate the present status of the industry, scope of
improvement and the benefit gain by the implementation of new tools of lean manufacturing.
1.2 Rationale of the study
The challenges faced by local apparel manufactures can be addressed by the systematic analysis
of the manufacturing system and link their problem with the lean tools and techniques to create
value for customers.
The application of lean manufacturing in a business or manufacturing environment, describes a
philosophy that incorporates a collection of tools and techniques into the business processes to
optimize time, human resources, assets, and productivity, while improving the quality level of
products and services to their customers. If the application of lean manufacturing produces
positive impact on productivity, quality and lead time it may have snow ball effects on the whole
apparel sector of the country.
1.3 Background of the project
The application of lean manufacturing concept in RMG sector is totally new in Bangladesh. So
there is a great necessity to study the scope of implementation and the areas of improvement and
the step by step methodology to do it in a positive and learned thinking. The productivity,
efficiency and effectiveness are increasingly becoming the burning issue in today’s economy. To
survive in the hard contest economy the industry should develop itself with systematic
identification and elimination of waste, productivity improvement, cost reduction, employee
benefit incentives and social welfare activities. Now a days the buyers are searching market for

3
lower price and they are getting new exporter on their hand with their requirement. So the profit
margin is narrowing and the competition is expanding as a result the production process and new
technology is the only way to cope up the crisis. The project work tries to find out the common
phenomenon to implement lean tools and the barriers to overcome.
1.4 Problem statement
The ever increasing demand from buyer’s side to reduce cost, improve quality and shorter period
of lead time as well as smaller quantity orders as well as increasing of labor cost has forced the
local apparel manufactures to search for improving labor productivity, quality and reducing lead
time to stay competitive in the business and thrive. In this scenario, application of tools and
techniques of Lean manufacturing and industrial engineering could benefit the local apparel
manufactures tremendously.
1.5 Objective of the study
The specific objectives of this project work are:
1. To identify different types of waste in cutting, sewing and finishing sections
2. To improve productivity of assembly lines by implementing different process
improvement techniques using existing resources
The possible outcome of the proposed work is to develop an improved production line model
that can enhance the overall productivity of the system.
1.6 Methodology
The methodology of the study will be as follows:
1. Collecting information from the cutting, sewing and finishing departments
2. Developing a current state map using the collected information
3. Analyzing the current state map to identify the potential areas for improvement
4. Define value adding & non value adding task
5. Make a summary sheet percentage of value adding & non value task
6. Reduce non value added task by process improvement
7. Designing a future state map by eliminating wastes reduce lead time also
8. Analyzing improvement compared to present state

4
CHAPTER TWO
LITERATURE REVIEW
2.1 Introduction
Lean manufacturing is a set of tools and methodologies that aims for the continuous elimination
of all waste in the production process i.e. a system for improving productivity & product quality.
Laconically more value with less work.
Lean manufacturing is a manufacturing philosophy that shortens the time between the customer
order and the product build or shipment by eliminating sources of waste. Another way of looking
at lean is that it aims to achieve the same output with less input- less time, less space, less human
effort, less machinery, less material, less costs. Today's manufacturers must be innovative while
focusing on waste reduction, improved lead-time, maximized flexibility, and upgraded quality.
Lean manufacturing concepts are proven strategies to help manufacturers obtain these attributes.
2.2 Historical Background
The industrial revolution has begun 1860. After 1885 the Henry Ford model of assembly line
production caused a manufacturing transformation from individual craft production to mass
production. Ford was able to transform iron ore into an automobile in just 33 hours.
Sakichi Toyoda learned carpentry from his father in and eventually applied that skill to designing
and building wooden spinning machines. In 1894 he began to make manual looms that were
cheaper but worked better than existing looms. Sakichi Toyoda establishes Toyota Spinning &
Weaving Co., Ltd, in 1918 later referred to as Japan’s King of Inventors.
By 1925, and even though GM’s cost always remained higher than Ford’s, Sloan’s strategy was
working. He commented: “Ford’s precious volume, upon which all depended, began slipping.”
Ford responded by cutting prices to the bone, to no avail: the fact was that even at this price, the
Model T no longer provided an attractive value proposition to the customer, and by 1928 was
driven from the market.
Ford made history of the horse and buggy, so too did GM's Alfred P. Sloan make history of the
Model T. Ford made Model T-Car which was mass produced and was cheap. Customer could get
any color of model T as long as it was black. Sloan repositioned the car companies to create a
five-model product range from Chevrolet to Cadillac. The challenge in manufacturing during the
1930s shifted to product variety. As Sakichi found that his mother, grandmother & their friends
5
had to so hard spinning & weaving. In 1926, He started Toyoda Automatic Loom Works with the
help of steam engine.
His mistake-proof loom (when thread breaks, the m/c stopped) became Toyoda’s most popular
model, and in 1929 he sent his son, Kiichiro, to England to negotiate the sale of the patent rights
to Platt Brothers, the premier maker of spinning and weaving equipment. His son negotiated a
price of $500,000 and in 1930 he used that capital to start building the Toyota Motor
Corporation. In 1933 Automobile Department is created within Toyoda Automatic Loom Works.
Sakichi Toyoda was undoubtedly aware that the world was changing and power looms would
become yesterday’s technology while automobiles were tomorrow’s technology. But more than
this, he had put his mark on the industrial world through loom making and wanted his son to
have his opportunity to contribute to the world. He explained to Kiichiro: “Everyone should
tackle some great project at least once in their life. I devoted most of my life to inventing new
kinds of looms. Now it is your turn. You should make an effort to complete something that will
benefit society.”
Kiichiro’s father sent him to the prestigious Tokyo Imperial University to study mechanical
engineering; he focused on engine technology. Despite his formal engineering education, he
followed in his father’s footsteps of learning by doing. In 1935 First Model A1 passenger car
prototype is completed through trial & error. (Over four five years in rural village, industrious
almost illiterate pheasant, automotive factory develop, after few years first car rolled out)
Kichiro built Toyota Automotive Company on his father’s philosophy and management
approach, but added his own innovations. For example, while Sakichi Toyoda was the father of
what would become the jidoka pillar of the Toyota Production System, Just-In-Time was
Kiichiro Toyoda’s contribution. His ideas were influenced by a study trip to Ford’s plants in
Michigan to see the automobile industry as well as seeing the U.S. supermarket system of
replacing products on the shelves just in time as customers purchased them. In 1937 Toyoda
Automatic Loom founded as Toyota Motor Co., Ltd. As the 1950s began, demand for specialized
products started to take hold. Not only were products more specialized, but they also had limited
life cycles. Batch manufacturing methods had arrived! What is the optimum amount? How
much is too much? In the 1950s, American style supermarket appeared in Japan in Japan,
initiated new thinking & limited application. In 1956, Ohno visited America to learn first-hand
(genchi genbutsu) how supermarket operated. Around the early 1960s, as computing power
began to be more cost effective, early pioneers began the development and installation of the
early computer-based MRP systems. While an MRP system is a valuable weapon in the

6
manufacturing arsenal, practitioners continue to grapple with the still conflicting objectives of
batch manufacturing and optimizing inventories. During the 1950s and 1960s Toyota contended
that the standard thinking of Cost plus Profit equals Sales Price was incorrect. It believed that
Profit equals Sales Price minus Costs. From this premise, Toyota concentrated on the
management of costs means wastes and wastes of all varieties were targeted for elimination.
Key areas targeted were work-in-process inventory and safety stock. While many companies in
the United States and Europe were attempting to calculate the optimum batch sizes for
production, Toyota worked toward the goal of being able to build a mix of products in a one-
piece flow. Having the capability to build a mix of products in a one-piece flow (mixed-product
Lean line) satisfied many key objectives for Toyota, raising productivity and reducing costs and
inventory while simultaneously creating rapid customer response.
Through the 1960s and into the 1970s, these two models of manufacturing developed down
separate paths. One sought better ways to manage batch production by making ongoing
improvements to the MRP planning model, while the other concentrated on finding and fine-
tuning ways to allow a one-piece flow of a mix of products
By the 1980’s Toyota had increasingly become known for the effectiveness with which it had
implemented Just-In-Time (JIT) manufacturing systems. Many product markets in the United
States and Europe started to come under pressure from Japanese manufacturers. Western
manufacturers began to lose market share. Some manufacturers faded away while others began
to look diligently for better ways to compete. Many abandoned the old batch manufacturing
models in favor of the more responsive method of Toyota and 1990 the term “Lean
Manufacturing” or “Lean Production” first appeared in the book “The Machine that Changed the
World” by James P Womack, Daniel T Jones, Daniel Roos.
2.2.1 The Ford System
Starting about 1910, Ford and Charles E. Sorensen [3], fashioned the first comprehensive
Manufacturing Strategy. They took all the elements of a manufacturing system-- people,
machines, tooling, and products-- and arranged them in a continuous system for manufacturing
the Model T automobile. Ford is considered by many to be the first practitioner of Just in Time
and Lean Manufacturing.
Ford's success inspired many others to copy his methods. But most of those who copied did not
understand the fundamentals.

7
For example, Ford production [4] depended on a labor force that was so desperate for money and
jobs that workers would sacrifice their dignity and self-esteem. The prosperity of the 1920's and
the advent of labor unions produced conflict with the Ford system. Product proliferation also put
strains on the Ford system.
At General Motors, Alfred P. Sloan took a more pragmatic approach to production and
developed business strategies for managing very large enterprises and dealing with variety. By
the mid 1930's General Motors had passed Ford in domination of the automotive market.
2.2.2 Just in Time and Toyota Production System
The Allied victory and the massive quantities of material behind it caught the attention of
Japanese industrialists. They studied American production methods with particular attention to
Ford practices and the Statistical Quality Control practices of Ishikawa, Edwards Deming, and
Joseph Juran. At Toyota Motor Company, Taichii Ohno and Shigeo Shingo, began to incorporate
Ford production, Statistical Process Control and other techniques into an approach called Toyota
Production System or Just in Time [5]. They recognized the central role of inventory.
The Toyota people also recognized that the Ford system had contradictions and shortcomings,
particularly with respect to employees. With General Douglas MacAurthur [6] actively
promoting labor unions in the occupation years, Ford's harsh attitudes and demeaning job
structures were unworkable in post-war Japan. Toyota soon discovered that factory workers had
far more to contribute than just muscle power. This discovery probably originated in the Quality
Circle movement. Ishikawa, Deming, and Juran all made major contributions to the quality
movement. It culminated in team development and cellular manufacturing.
Another key discovery involved product variety. Shingo, at Ohno's suggestion, went to work on
the setup and changeover problem. Reducing setups to minutes and seconds allowed small
batches and an almost continuous flow like the original Ford concept.
All of this took place between about 1949 and 1975. To some extent it spread to other Japanese
companies. When the productivity and quality gains became evident to the outside world,
American executives traveled to Japan to study it. They brought back, mostly, the superficial
aspects like kanban cards and quality circles. Most early attempts to emulate Toyota failed
because they were not integrated into a complete system and because few understood the
underlying principles [7].

8
2.2.3 Lean Manufacturing
Liker and Wu [8] define “lean” as “a philosophy of manufacturing that focuses on delivering the
highest-quality product at the lowest cost and on time. It is a system of production that also takes
a value stream focus. The ‘value stream’ consists of all the steps in the process needed to convert
raw material into the product the customer desires.”
Although lean manufacturing has its origins in the automobile manufacturing sector, other
industries have adopted the practices to improve their own operations. Womack and Jones [9]
offer several case studies of firms making radically different products, including stretch-
wrapping machines, wire management systems and power protection devices, and aircraft
engines, among others. Liker [10] reports improvements for a tannery, a maker of sealing
components, a scientific products company, a maker of outdoor cedar products (including
birdhouses), a manufacturer of seismic exploration equipment, and companies in the automobile
supply chain.
In the late 1980s, the International Motor Vehicle Program (IMVP) at the Massachusetts Institute
of Technology (MIT) studied automobile manufacturers and compared the United States,
Europe, and Japan, to learn the source of the Japanese advantage. The book that was published
from this project, The Machine that Changed the World, [11] introduced the term “lean
manufacturing” to the United States. The authors argued that rather than one or another
particular cultural factor, process improvement, or organizational technique being responsible for
Japan’s success, it was the manufacturing system as a whole. They found that a comprehensive
system based on, among other things, maintaining minimal inventories and very high quality,
was the basis for the success of the Japanese manufacturers, particularly Toyota. There are many
overlaps with the total quality management (TQM) system, although the authors never mention
this (Babson, 1995).
Indeed, a number of books written prior to the work of Womack and his associates addressed
many of the same concepts. Ohno wrote Toyota Production System: Beyond Large-Scale
Production in 1978 [12], Shingo’s A Study of the Toyota Production System from an Industrial
Engineering Viewpoint was first translated into English in 1981, Monden wrote Toyota
Production System in 1983, Goldratt and Cox published the first edition of The Goal in 1984,
Schonberger penned World Class Manufacturing in 1986, and Suzaki wrote The New
Manufacturing Challenge in 1987 [13].

9
However, The Machine that Changed the World [11] was an enormously popular book with
managers and was a tremendous sales document for the lean manufacturing system. A second
book by two of the same authors, Womack and Jones, Lean.
Lean Thinking [9], has offered another take on lean manufacturing, and provides examples of
companies outside the automobile sector that had successfully adopted the system.
More recently, two books – Running Today’s Factory (1999) by Charles Standard and Dale
Davis and The Toyota Way [10], by Jeffery Liker – have provided a more clear description of
Lean Manufacturing Principles and how to apply them.
A research work carried out on “Analysis of Apparel Production Systems to Support Quick
Response Replenishment” by Russel E. King (Team Leader), Thom J. Hodgson (NCSU
Engineering); Trevor Little, Carol Carrere (NCSU Textiles); Michelle Benjamin, Tim Currin
(Textile Clothing Technology Corporation). The goal of this project was to determine the
structure and operational policies of apparel supply systems to best support rapid replenishment
to retail in order to maximize performance and productivity.
A paper named “An Integrated Methodology for More Effective Setup Reduction” was presented
at the IIE Solutions 2001 conference organized by the Institute of Industrial Engineers, in Dallas,
TX (21-23 May 2001). This paper describes how setup time is being reduced when different
types of IE Techniques and SMED are combined together.

10
CHAPTER THREE
LEAN MANUFACTURING
3.1 Introduction
Lean thinking focuses on value- added flow and the efficiency of the overall system. A part
sitting in a pile of inventory is waste and the goal is to keep product flowing and add value as
much as possible. The focus is on the overall system and synchronizing operations so that they
be aligned and produced products at a steady pace.
3.2 Principle of Lean Manufacturing
Key principles behind Lean Manufacturing can be summarized as follows:
1. Recognition of waste – The first step is to recognize what does and does not create value
from the customer’s perspective. Any material, process or feature which is not required
for creating value from the customer’s perspective is waste and should be eliminated.
2. Standard processes- Lean requires an the implementation of very detailed production
guidelines, called Standard Work, which clearly state the content, sequence, timing and
outcome of all actions by workers. This eliminates variation in the way that workers
perform their tasks.
3. Continuous flow- Lean usually aims for the implementation of a continuous production
flow free of bottlenecks, interruption, detours, back flows waiting. When this is
successfully implemented. The production cycle time can be reduced by as much as 90%.
4. Pull-production- Also called Just-in- Time (JIT), Pull- production aims to produce only
what is needed, when it is needed. Production is pulled by the downstream workstation so
that each workstation should only produce what is requested by the next workstation.
5. Quality at the Source- Lean aims for defects to be eliminated at the source and for quality
inspection to be done by the workers as part of the in-line production process.
6. Continuous improvement – A continuous improvement mentality is necessary to reach
the company’s goals. The term “Continuous improvement” means incremental
improvement of products, processes, or services over time, with the goal of reducing
waste to improve workplace functionality, customer service, or product performance.

11
Lean requires striving for perfection by continually removing layers of waste as they are
uncovered. This in turn requires a high level of worker involvement in the continuous
improvement process.
7. Customer focus – A lean manufacturing enterprise thinks more about its customers than it
does about running machines fast to absorb labor and overhead. Ensuring customer input
and feedback assures quality and customer satisfaction, all of which support sales.
8. Value –In lean production, the value of a product is defined slowly by the customer. The
product must meet the customer’s needs at both a specific time and price. Identifying the
value in lean production means to understand all the activities required to produce a
specific product, and then to optimize the whole process from the view of the customer.
9. Perfection - The concept of perfection in lean production means that there are endless
opportunities for improving the utilization of all types of assets. The systematic
elimination of waste will reduce the costs of operating the extended enterprise and fulfils
customer’s desire for maximum value at the lowest price [14]
3.3 Value & Waste
Waste is anything that does not contribute to transforming a part to the customer’s needs. The
aim of Lean Manufacturing is the elimination of waste in every area of production including
customer relations, product design, supplier networks, and factory management. Its goal is to
incorporate less human effort, less inventory, less time to develop products and less space to
become highly responsive to customer demand while producing top quality products in the most
efficient and economical manner possible. Essentially, a “waste” is anything that the customer is
not willing to pay for [15].
3.3.1 Types of waste
There are seven types of waste which are following-
3.3.2 Overproduction
Producing more material than the customer demand or produce it before it is need is termed as
overproduction. Overproduction means making more than is required by the next process,
making earlier than is required by the next process, or making faster than is required by the next
process. The corresponding Lean principle is to manufacture based upon a pull system, or

12
producing products just as customers order them. It is visible as storage of material. It is the
result of producing to speculative demand. Causes of overproduction time include:
Just in case logic
Lack of feedback from downstream process
Lack of balance between
Misuse of automation.
3.3.3 Waiting
Material waiting is not material flowing through value-added operations. This includes waiting
for material, information, equipment, tools, etc. Lean demands that all resources are provided on
a just-in-time (JIT) basis- not too soon, not too late [16].
Waiting for a machine to process should be eliminated. The principle is to maximize the
utilization or efficiency of the worker instead of maximizing the utilization of the machines.
Causes of waiting time include:
Long set up times
Lack of balance between processes namely engineering, workload, automation,
scheduling etc.
Unplanned maintenance
Lack of redundancy wherever possible
Quality problems in upstream process.
3.3.4 Inventory or work in process (WIP)
Work in Process (WIP) Inventory is material between operations due to large lot production or
processes with long cycle times. Material sits taking up space, costing money, and potentially
being damaged. Related to Overproduction, inventory beyond that needed to meet customer
demands negatively impacts cash flow and uses valuable floor space. Causes of work in process
time include:
Poor communication
Inadequate market research
Just in case logic
Fluctuations in materials procurement
Poor scheduling.

13
Protecting the company from inefficiencies and unexpected problems
Product complexity
Unbalanced workload
Unreliable shipments by suppliers
Misunderstood communications
Reward systems.
3.3.5 Over processing
Correction, or reprocessing, is when something has to be re-done because it wasn’t done
correctly the first time. Taking unneeded steps to process the parts, inefficiently processing due
to poor tool and product design, causing unnecessary motion and producing defects. Waste is
generated when providing higher-quality products than is necessary.
This not only results in inefficient use of labor and equipment but the act of re-processing often
causes disruptions to the smooth flow of production and therefore generates bottlenecks and
stoppages. Also, issues associated with reworking typically consume a significant amount of
management time and therefore add to factory overhead costs. Causes for over processing waste
include:
Product changes without process changes
Just-in-case logic
True customer requirements undefined
Over processing to accommodate downtime
Lack of communication
Redundant approvals
3.3.6 Transportation
Transportation includes any movement of materials that does not add any value to the product,
such as carrying work in process (WIP) long distances, creating inefficient transport, or moving
materials, parts, or finished goods into or out of storage or between processes.
The idea is that transportation of materials between productions stages should aim for the ideal
that the output of one process is immediately used as the input for the next process.
Transportation between processing stages results in prolonging production cycle times, the

14
inefficient use of labor and space and can also be a source of minor production stoppages.
Causes of transportation time include:
Poor plant layout
Poor understanding of the process flow for production
Large batch sizes, long lead times and large storage areas.
3.3.7 Unnecessary Motion
Motion includes any unnecessary physical motions or walking by workers which diverts them
from actual processing work. For example, any wasted motion employees have to perform
during the course of their work, such as looking for, reaching for, or stacking parts, tools,
difficult physical movements due to poorly designed ergonomics, which slow down the workers.
Also, walking is waste. Causes of motion waste include:
Unskilled people and machine ineffectiveness
Inconsistent work methods
Unfavorable facility or cell layout
Poor workplace organization and housekeeping
Extra “busy” movements while waiting.
3.3.8 Defects
Production of defective parts or correction, repair or rework, scrap, replacement production,
errors in paperwork, provision of incorrect information about the product, late delivery, and
inspection mean wasteful handling, time, and effort. Defects emerge from one or more of these
items:
Poor product design
Misunderstanding of customer needs
Lack of skills and work instructions
Unsatisfactory planned maintenance
Low quality
Storages of process control.

15
3.4 Push System
In a push system, the demand (often forecast because the lead times are so long) is converted to a
schedule for each operation. The material is released to the first operation, as dictated by the
schedule, and it is progressed ("pushed") through the subsequent operations.
3.5 Pull System
In a pull system, the demand (often customer demand as lead times are usually short) is the
production schedule of the last operation. This operation asks the previous operation for work
only when it needs it to fulfill the customer demand. The previous operation then asks the one
before it and so on. The fundamental rule is that material is only worked on if the customer
demands it. In this way material is "pulled" through the previous operations [17].
3.6 Workplace Organization-5S
The Five S’s are some rules for workplace organization which aim to organize each worker’s
work area for maximum efficiency [18].
3.6.1 First pillar: Sort (Seiri)
Sort what is needed and what is not needed so that the things that are frequently needed are
available nearby and as easy to find as possible. Things which are less often used or not needed
should be relocated or discarded.
An effective visual method to identify these unneeded items is called “red tagging”, which
involves evaluating the necessity of each item in a work area & dealing with it appropriately. A
red tag is placed on all items that are not important for operations or that is not in the proper
location or quantity.

16
Figure 3.1: Sort of 5S
3.6.2 Second pillar: Set in Order (Seiton)
Set in order – Arrange essential things in order for easy access. The objective is to minimize the
amount of motion required in order for workers to do their jobs. For example, a tool box can be
used by an operator or a maintenance staff who must use various tools. In the tool box, every tool
is placed at a fixed spot that the user can quickly pick it up without spending time looking for it.
This way of arrangement can also help the user be immediately aware of any missing tools.
3.6.3 Third pillar: Shine (Seiso)
Shine means keep machines and work areas clean so as to eliminate problems associated with
un-cleanliness. In some industries, airborne dust is among the causes of poor product surface or
color contamination. To be more aware of dust, some companies paint their working places in
light colors and use a high level of lighting.
3.6.4 Fourth pillar: Standardize (Seiketsu)
Standardize is make the first 3S’s a routine practice by implementing clear procedures for
sorting, straightening and scrubbing.
SORT

17
Figure 3.2: Set in Order of 5S
3.6.5 Fifth pillar: Sustain (shitsuke)
Sustain – Promote, communicate and train in the 5 S’s to ensure that it is part of the company’s
corporate culture. This might include assigning a team to be responsible for supervising
compliance with the 5 S’s.
Figure 3.3: Sustain of 5S
Set in Order
SUSTAIN

18
3.6.6 The benefits of 5S
Improves safety
Better working environment
5S can significantly improve space utilization space
Easy retrieval of material, information, tools etc.
Reduce quality problems
Lower costs
Increased customer satisfaction and
Discipline in workplace etc.
3.7 Visual Management
Visual Management systems enable factory workers or anyone interested to be well informed
about production procedures, status and other important information for them to do their jobs as
effectively as possible. Large visual displays are generally much more effective means of
communication to workers on the factory floor than written reports and guidelines and therefore
should be used as much as possible. When it comes to improving compliance with a process,
visual presentation helps the team better understand a complicated process including the correct
sequence of events, the correct way to perform each action, internal and external relationships
between actions, and other factors which may help them to improve. These visual tools may
include the following:
a. Visual Displays - Charts, metrics, procedures and process documentation which are
reference information for production workers. For example, trend chart of yield performance,
% variation of defect rate, month-to-date shipping volume status, etc.
b. Visual Controls – Indicators intended to control or signal actions to group members. This
may include production status information, quality tracking information, etc. For example,
color-coded panel for temperature or speed setting control limits that help an operator
quickly identify process is out of the control range. Kanban cards are another example of
visual controls. Lines on the floor to delineate storage areas, walkways, work areas etc.
Lights to indicate production status.

19
c. Visual process indicators – These communicate the correct production processes or flow of
materials. For example, this would include the use of painted floor areas for non-defective
stock and scrap or indicators for the correct flow of materials on the factory floor. Visual
Workplace Supports the “Eight Zeros”
i. Zero waste
ii. Zero defects
iii. Zero downtime
iv. Zero customer complains
v. Zero injuries
vi. Zero delays
vii. Zero loss
viii. Zero changeovers
3.8 Kanban
Kanban is the Japanese word for card or signal. In terms of card, a kanban is used to make issues
like inventory status, parts location and production status more visible. In terms of signal, a
kanban authorizes the previous stage of production to make more parts.
A kanban uses a designated workspace between operations to balance supply with demand. It
means a visible record. Kanban triggers mechanism to make or move material. The result is that
kanbans create a simple to operate, visible control system that offers the opportunity to delegate
routine material control transactions to the shop floor. It is simple and inexpensive. It sets
priority, limits inventory, and exposes problems.
3.9 Quick Changeover
Elapsed time between the last good piece from previous product, and the first good piece from
next product at the right speed.

20
Figure 3.4: Quick Change Over
Lean Manufacturing aims to reduce unnecessary downtime due to machine setup or product
changeovers since machine downtime is a significant source of unnecessary waste. This requires
a culture of continuous improvement in which the company is continuously trying to find ways
to reduce changeover and setup times. Often quicker changeover times can be achieved to some
degree by having very standardized (and well-documented) configuration settings for the
production of particular products so that there is no uncertainty about how to reconfigure the
equipment during a changeover. Companies with a wide range of product mix, color and
specifications often underestimate the conversion cost every time the production process is
halted to replace molds, clean leftover materials with a different color or specification, adjust
machine settings, etc.
Other ways to minimize the changeover/setup time include changing the physical layout of a
process, having all materials and tools needed available, and using dual/spare storage bin to
eliminate cleaning downtime.
3.10 Kaizen
It is a Japanese term for “continuous improvement”, with an emphasis on small incremental
improvements. A main theme of Kaizen is to create a culture of continuous improvement, largely
by assigning responsibility to workers, and encouraging them, to identify opportunities for
improvement.
A company can never be perfectly efficient. Lean Manufacturing requires a commitment to
continuous improvement, and preferably a systematic process for ensuring continuous
improvement, whereby the company constantly searches for non value-added activities and ways

21
to eliminate those. The focus of continuous improvement should be on identifying the root
causes of non-value-added activities and eliminating those by improving the production process.
Two main opportunities for improvement are:
1. The elimination of Muda (waste) from processes
2. The correction of any issues/problems within processes in addition to Muda
The relevance of Muda is that it both directly causes problems and also hides or disguises other
issues or problems that are occurring within a process. It is therefore the most important element
to eliminate from a process. In manufacturing companies, Kaizen consists of eliminating waste
in machinery, workers and production methods. (Graphic Products, Inc. 2000)
Figure 3.5: Building Kaizen Quality Management Team
22
3.11 Total Productive Maintenance (TPM)
TPM is a scientific company – wide approach in which every employee at every level in the
organization is concerned about the maintenance, the quality and efficiency of their equipment.
A comprehensive system for reducing breakdowns and improving quality – by involving all
employees in the elimination of waste of time and resources caused by production equipment
[19].
3.12 POKA YOKE
Poka Yoke means Yokeru (avoid) Poka (mistake). Applying mistake proofing concepts to
process or product improvements allow you to take a proactive approach to eliminating errors at
their source before they become defects. Sorts "Good" from "Bad" practices / services, reduces
problems before they are seen by customers, does not stop source of problems, does not prevent
work defects, and does not prevent defects from getting to the customer, feedback very slow,
often non-existent.
3.13 Lean Manufacturing Benefits
Organized and ‘visual’ workplace, Lower space/facility requirements, Improved use of floor
space, Allows more strategic management focus, Improved knowledge retention, New
employees fit in more quickly with less training, Cross-trained employees, Flexible work cells
with flexible people, Small batch operations more cost effective, Productivity / Capacity
increase, Inventory reduction, Cost reduction, Improved efficiency, Improved communication,
Improved profit margins, Improved customer relations, Quality improvement, Improved vendor
support and quality, Higher labor efficiency and quality, Reduced scrap and waste, Reduced
cycle time, Reduced obsolescence, High quality and reliability, Lower overall costs, Self-
directed work teams, Lead time reduction, Fast market response, Longer machine life, Improved
flexibility in reacting to changes, Increased shipping and billing frequencies [20].

23
CHAPTER FOUR
VALUE STREAM MAPPING
4.1 Introduction
Value stream mapping (VSM) is the visual representation or documentation of the flow of
information material, or people from receipt of customer order to delivery of finished product. It
can be applied in manufacturing industries as well as service industries. This chapter gives an
overall idea about value adding activity, non-value adding activity and necessary non value
adding activity. This chapter also shows various symbols that are used to develop a Value Stream
Mapping of a production process and finally discusses about the steps of producing Value
Stream Mapping.
4.2 Value Stream Mapping (VSM)
A value stream is all the actions (both value added and non-value added) currently required to
produce a product and analyze the current material and information flow necessary through the
input to output [21]. It is also a technique for creating “one page picture” of all the processes that
occurs in a company. Companies are experiencing intense competitive pressure due to
globalization; hence they cannot afford to operate with wastes in their processes [22]. It’s a
sophisticated flow charting method that uses symbols, metrics, and arrows to help visualize
processes and track performance. This method helps determine which steps of a process add
value and which do not. Value Stream Mapping (VSM) is the process of mapping the material
and information flows for components and sub-assemblies in a value chain from raw material to
the customer. Womack and Jones (1996) define VSM as a tool, which allows identify ways to
get material and information to flow without interruption, improve productivity and
competitiveness, and help people implement system rather than isolated process improvements.
Womack & Jones (1996), and Rother & Shook (1999) described value-stream maps as “material
and information flow maps”, which are one-page diagrams showing the processes used to make a
product. VSM is used to identify the sources of waste in the value stream as basis for
implementation plan that helps to see and focus on flow with a vision of and ideal. In a lean
improvement initiative, most of the improvement comes from squeezing out a large number of
non-value-added steps. In the process, the value-added time can also be reduced [10].
The goal of VSM is to identify, demonstrate and decrease waste in the process. Waste being any
activity that does not add value to the final product, often used to demonstrate and decrease the

24
amount of ‘waste’ in a manufacturing system. VSM can thus serve as a starting point to help
management, engineers, production associates, schedulers, suppliers, and customers recognize
waste and identify its causes. As a result, Value Stream Mapping is primarily a communication
tool, but is also used as a strategic planning tool, and a change management tool.
The process usually includes the physically mapping of the "Current State" while also focusing
on where you get to, or the "Future State" map, which can serve as the foundation for other Lean
improvement strategies. Somehow, a fundamental limitation of VSM is that it is a manual
method for mapping and analysis of the flows of products, materials, people, information, etc. in
manufacturing facilities [23].
The concept of a value stream borrows from Michael Porter’s Value Chain framework. The
value chain is a model that helps analyze specific activities through which firms create value and
competitive advantage. By locating the value creating processes next to one another and by
processing one unit at a time, work flows smoothly from one step to another and finally to the
customer. This chain of value-creating processes is called a value stream. A value stream is
simply all the things done to create value for the customer. It requires identifying all steps
necessary to design order and produce the product across the whole value stream, to highlight
non-value adding waste. The whole value stream covers processes from ordering raw materials
to delivery of the finished product to the customer.
Value Stream Mapping is a pencil and paper tool that helps you to see and understand the flow of
material and information as a product makes its way through the value stream. The meaning is
simple: Follow a product’s production path from customer to supplier, and carefully draw a
visual representation of every process in the material and information flow. Then ask a set of key
questions and draw a “future state” map of how value should flow [14].
In Lean Manufacturing, the value of a product is defined solely based on what the internal &
external customer actually requires and is willing to pay for. Production operations can be
grouped into following three types of activities:
4.2.1 Value Adding Activity
Value-added activities are activities which transform the materials onto the exact product that the
customer requires, or those activities that, in the eyes of the end customer, make a product more
valuable. A value adding activity is simple to define; it results in something that customer would
pay for. It include the operation like conversion of input into useful end product.

25
4.2.2 Non-Value Adding Activity
Non-value-added activities are the activities that aren’t required for transforming the materials
into the product that the customer wants. Anything which is non-value-added may be defined as
waste. Anything that adds unnecessary times, effort or cost is considered non-value-added.
Another way of looking to waste is that it is any material or activity for which the customer is
not willing to pay. Testing or inspecting materials is also considered as waste since this can be
eliminated in so far as the production process can be improved to eliminate defects from
occurring.
4.2.3 Necessary Non-Value Adding Activity
Those activities that, in the eyes of the end customer, do not make a product more valuable, but
are necessary unless the existing supply process is radically changed. This type of waste is more
difficult to remove in the short term and should be a target for longer term radical change. For
example, high levels of inventory may be required as buffer stock, although this could be
gradually reduced as production becomes more stable.
4.3 Steps of Value Stream Mapping
Value stream mapping is done in two steps.
a. Current state
A visual tool that documents the current condition of a manufacturing environment. A present-
state value stream map captures all of the details of manufacturing processes just as they exist at
the moment the map is produced, including any flaws or errors.
b. Future state
A visual tool that shows how a value stream can look after improvements have been
implemented. A future-state value stream map is an ideal view of a value stream and represents
the goal of a lean initiative.
Taking a value stream perspective means working on the big picture, not just individual
processes, and improving the whole, not just optimizing the parts. Identifying the differences in
the current and future states yields a roadmap for improvement activities [24].
26
4.4 Value Stream Mapping Symbols
Numerous symbols are used in VSM to represent steps along the value stream path. Use the tools
below to become acquainted with these symbols and how they can be used to illustrate processes.
When mapping, focus should be horizontal across systems and departments, from order to
delivery, not vertical in the departmental silo.
4.4.1 Symbols in VSM
There are internationally recognized symbols for lean manufacturing to represent these value
streams. At first we describe different symbols and their meanings-
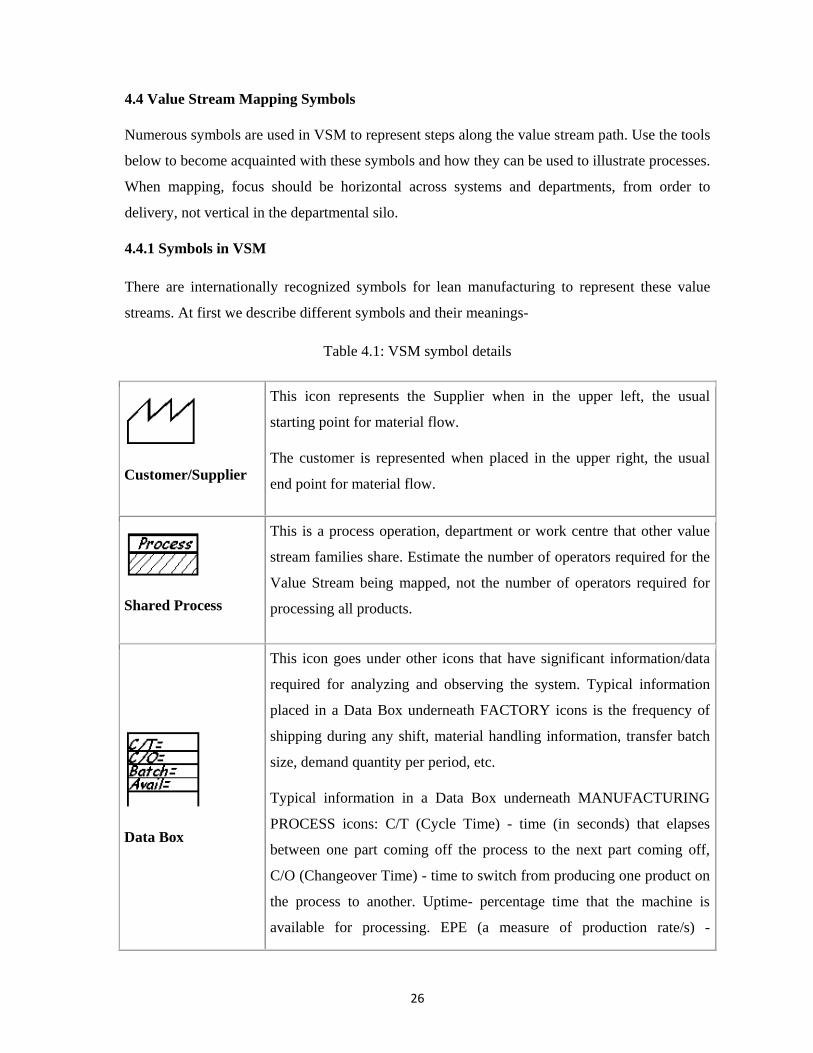
Table 4.1: VSM symbol details
Customer/Supplier
This icon represents the Supplier when in the upper left, the usual
starting point for material flow.
The customer is represented when placed in the upper right, the usual
end point for material flow.
Shared Process
This is a process operation, department or work centre that other value
stream families share. Estimate the number of operators required for the
Value Stream being mapped, not the number of operators required for
processing all products.
Data Box
This icon goes under other icons that have significant information/data
required for analyzing and observing the system. Typical information
placed in a Data Box underneath FACTORY icons is the frequency of
shipping during any shift, material handling information, transfer batch
size, demand quantity per period, etc.
Typical information in a Data Box underneath MANUFACTURING
PROCESS icons: C/T (Cycle Time) - time (in seconds) that elapses
between one part coming off the process to the next part coming off,
C/O (Changeover Time) - time to switch from producing one product on
the process to another. Uptime- percentage time that the machine is
available for processing. EPE (a measure of production rate/s) -

27
Acronym stands for "Every Part Every___". Number of operators - use
OPERATOR icon inside process boxes. Number of product variations,
Available Capacity, Scrap rate, Transfer batch size (based on process
batch size and material transfer rate)
Work cell
This symbol indicates that multiple processes are integrated in a
manufacturing work cell. Such cells usually process a limited family of
similar products or a single product. Product moves from process step to
process step in small batches or single pieces.
Inventory
These icons show inventory between two processes. While mapping the
current state, the amount of inventory can be approximated by a quick
count, and that amount is noted beneath the triangle. If there is more
than one inventory accumulation, use an icon for each. This icon also
represents storage for raw materials and finished goods.
Shipments
This icon represents movement of raw materials from suppliers to the
Receiving dock/s of the factory. Or the movement of finished goods
from the Shipping dock/s of the factory to the customers.
Push Arrow
This icon represents the “pushing” of material from one process to the
next process. Push means that a process produces something regardless
of the immediate needs of the downstream process.
Supermarket
This is an inventory “supermarket” (kanban stockpoint). Like a
supermarket, a small inventory is available and one or more downstream
customers come to the supermarket to pick out what they need. The
upstream work center then replenishes stocks as required. When
continuous flow is impractical, and the upstream process must operate in
batch mode, a supermarket reduces overproduction and limits total
inventory.

28
Material Pull
Supermarkets connect to downstream processes with this "Pull" icon that
indicates physical removal.
FIFO Lane
First-In-First-Out inventory. Use this icon when processes are connected
with a FIFO system that limits input. An accumulating roller conveyor is
an example. Record the maximum possible inventory.
Safety Stock
This icon represents an inventory “hedge” (or safety stock) against
problems such as downtime, to protect the system against sudden
fluctuations in customer orders or system failures. Notice that the icon is
closed on all sides. It is intended as a temporary, not a permanent storage
of stock, thus there should be a clearly-stated management policy on
when such inventory should be used.
External Shipment
Shipments from suppliers or to customers using external transport.
Production Control
This box represents a central production scheduling or control
department, person or operation.
Electronic
Information
This wiggle arrow represents electronic flow such as electronic data
interchange (EDI), the Internet, Intranets, LANs (local area network),
WANs (wide area network). You may indicate the frequency of
information/data interchange, the type of media used ex. fax, phone, etc.
and the type of data exchanged.
Production Kanban
This icon triggers production of a pre-defined number of parts. It signals
a supplying process to provide parts to a downstream process.

29
Withdrawal Kanban
This icon represents a card or device that instructs a material handler to
transfer parts from a supermarket to the receiving process. The material
handler (or operator) goes to the supermarket and withdraws the
necessary items.
Signal Kanban
This icon is used whenever the on-hand inventory levels in the
supermarket between two processes drops to a trigger or minimum point.
When a Triangle Kanban arrives at a supplying process, it signals a
changeover and production of a predetermined batch size of the part
noted on the Kanban. It is also referred as “one-per-batch” kanban.
Kanban Post
A location where kanban signals reside for pickup. Often used with two-
card systems to exchange withdrawal and production kanban.
Go
See
Gathering of information through visual means.
Kaizen Burst
These icons are used to highlight improvement needs and plan kaizen
workshops at specific processes that are critical to achieving the Future
State Map of the value stream.
Operator
This icon represents an operator. It shows the number of operators
required to process the VSM family at a particular workstation.
Timeline
The timeline shows value added times (Cycle Times) and non-value
added (wait) times. Use this to calculate Lead Time and Total Cycle
Time.

30
At a glance necessary VSM symbols or icon.
Figure 4.1: VSM symbols

31
4.5 Methods of Designing a Value Stream Mapping
According to Tapping and Shuker (2003) the steps of producing value stream mapping are
following:
Step – 1: To begin with, draw the external (or internal) customer and supplier and list their
requirements per month, e.g. in items, pieces, etc.
Step – 2: Next step is to draw the basic processes in the sequencing order in the value stream by
listing the process attributes, i.e. Cycle time, changeover time, quantity of operators, available
working time, etc.
Step – 3: Then, to draw queue times between processes, e.g. how many days or hours
components wait until the next process.
Step – 4: The following step is to draw all communications that occur within the value stream,
i.e. information flow.
Step – 5: And finally, to draw push or pull icons to identify the type of workflow, i.e. physical
flow.
When mapping, focus should be horizontal across systems and departments, from order to
delivery, not vertical in the departmental silo.
Figure 4.2: Example of Current state VSM

32
4.6 Importance of Value Stream Mapping
• It shows the linkage between the information flow and the material flow
• Creates a vision of the future by uncovering wastes and opportunities to create flow - and
making them visible to all
• It helps visualize more than just the single-process level, i.e. assembly, welding etc.
• It ties together lean concepts and techniques and helps avoid “cherry picking”
• It makes decisions about the flow apparent, so easily can discuss them
• Prioritizes activities needed to achieve the future state
• Enables broad participation in shaping the future
• It forms the basis of an implementation plan
• It provides a common language for talking about manufacturing processes
It is much more useful than quantitative tools and layout diagrams that produce a tally of non-
value added steps, lead time, and distance travelled, the amount of inventory, and so on.

33
CHAPTER FIVE
VSM CURRENT STATE MAP
5.1 Introduction
To eliminate waste first we have to develop a value stream for the current system. The Value
Stream Mapping (VSM) is a visualization tool by this method we can easily identify the different
value added and non-value added activities. It helps to understand and streamline work processes
using the tools and techniques of Lean Manufacturing.
5.2 Methods apply for designing current state map
The first step is to draw the current state value stream mapping to take a snapshot of how things
are being done now. To collect data for VSM, core team was trained on how to collect data and
exercise was carried out to ensure that core team was capable to collect date accurately. Material
flow related data was collected by physically following the material from cutting to sewing to
finishing.
Following are the steps how current steps are drawn.
First select the process of a product which we want to design the VSM
Collect the information walk through and identify the main process (i.e. how many
process boxes from store to delivery)
Note the all data information
Mention value added & non value added work
Fill the data box about non value added & Value added work
Mention non value added work- (cycle time, actual time, activities, defects, WIP,
transport, waiting)
Calculation & make a process chart of value added & non value added work
Make a summary sheet percentage of value added & non value added
5.3 Value stream mapping data details
In Value Stream Mapping data boxes there are some data uses, which details are following
34
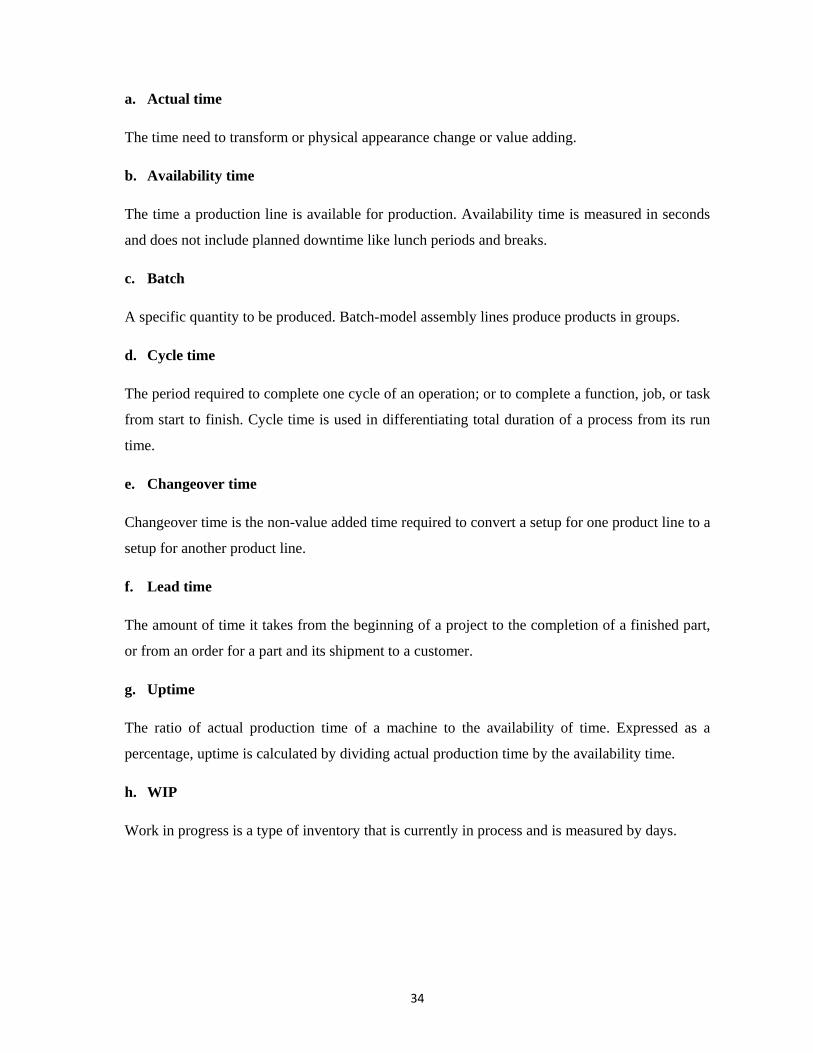
a. Actual time
The time need to transform or physical appearance change or value adding.
b. Availability time
The time a production line is available for production. Availability time is measured in seconds
and does not include planned downtime like lunch periods and breaks.
c. Batch
A specific quantity to be produced. Batch-model assembly lines produce products in groups.
d. Cycle time
The period required to complete one cycle of an operation; or to complete a function, job, or task
from start to finish. Cycle time is used in differentiating total duration of a process from its run
time.
e. Changeover time
Changeover time is the non-value added time required to convert a setup for one product line to a
setup for another product line.
f. Lead time
The amount of time it takes from the beginning of a project to the completion of a finished part,
or from an order for a part and its shipment to a customer.
g. Uptime
The ratio of actual production time of a machine to the availability of time. Expressed as a
percentage, uptime is calculated by dividing actual production time by the availability time.
h. WIP
Work in progress is a type of inventory that is currently in process and is measured by days.

35
5.4 Current State of Cutting, Sewing and Finishing
The current state map of cutting, sewing and finishing of a polo shirt has drawn by taking all
necessary data of data log sheet (Appendix- A, B, and C). Also identified the value adding, non-
value adding and unavoidable non value added activities. Following are the current state
summary.
5.4.1 Current State of Cutting
Table 5.1: Current state Cutting summary
Cutting Current State Cycle Time (min) 412 Actual Time (min) 42
Workers 32 Quantity Outputs (pcs) 1100
Batch Size (pcs) 1100 Waste
Transportations (feet) 330 Defects
Waiting Time (min) 2853
Total value added time = 42 min
Total non-value added time = 2984 min
Total unavoidable time = 239 min
Total time = VA time + NVA time + UNVA time
= 42 + 2984 + 239 min
= 3265 min
Total Lead time = 3265 min
% of value added time= 1.29%
% of non-value added time= 91.39%
% of unavoidable non value added time= 7.32%

36
5.4.2 Current State of Sewing
Table 5.2: Current state Sewing summary
Sewing Current State Cycle Time (min) 15.99 Actual Time (min) 2.84 Workers 45 Quantity Output (pcs) 1040 No of Activities 74 Batch Size (pcs) 25 Available Time 480 Up time 100% Productivity 2.89 Waste Change over 4.27 Transportations (feet) 191 Defects 118 Waiting Time (min) 944.84
Total value added time = 2.84 min
Total non-value added time = 944.84 min
Total unavoidable time = 12.01 min
Total time = VA time + NVA time + UNVA time
= 2.84 + 944.84 + 12.01 min
= 959.69 min
Total Lead time = 959.69 min
% of value added time = 0.30%
% of non-value added time = 98.45%
% of unavoidable non value added time = 1.25%
37
5.4.3 Current State of Finishing
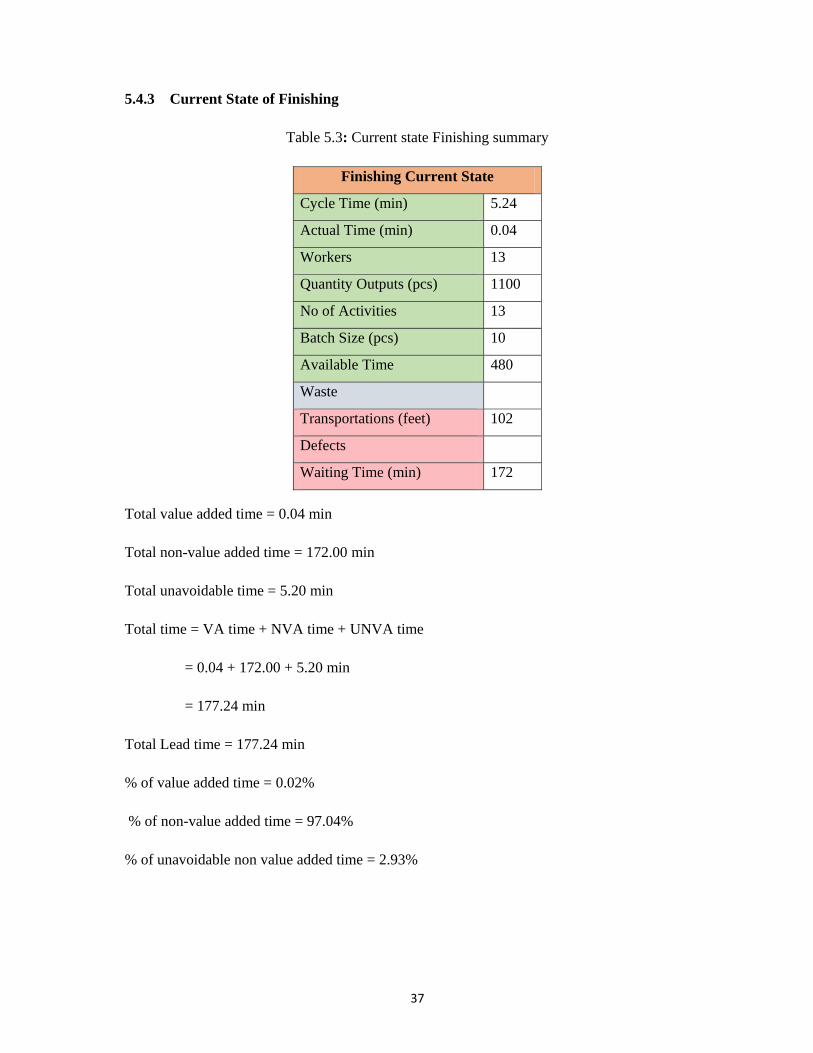
Table 5.3: Current state Finishing summary
Finishing Current State
Cycle Time (min) 5.24
Actual Time (min) 0.04
Workers 13
Quantity Outputs (pcs) 1100
No of Activities 13
Batch Size (pcs) 10
Available Time 480
Waste
Transportations (feet) 102
Defects
Waiting Time (min) 172
Total value added time = 0.04 min
Total non-value added time = 172.00 min
Total unavoidable time = 5.20 min
Total time = VA time + NVA time + UNVA time
= 0.04 + 172.00 + 5.20 min
= 177.24 min
Total Lead time = 177.24 min
% of value added time = 0.02%
% of non-value added time = 97.04%
% of unavoidable non value added time = 2.93%

38
5.4.4 Combined Current State map of Cutting, Sewing and Finishing
Stor
e to
Fin
ish
Stor
es
Cus
tom
er
Info
rmat
ion
Man
uIn
vent
ory
Push
Bar
Supp
lier
Ele
ctro
nic
Sea
Land
Kai
zen
Supe
r
Proc
ess
Tra
nspo
rt
Blit
zes
unn
mar
ket
Man
ual
Flow
C/T
(Min
)41
2C
/T(M
in)
15.9
9C
/T(M
in)
5.24
Act
ual t
ime
42A
ctua
l tim
e2.
84A
ctua
l tim
e0.
04W
orke
rs32
Wor
kers
45W
orke
rs13
Qty
Out
put
1100
Qty
Out
put
1040
Qty
Out
put
1100
No.
of a
ctiv
ities
74N
o. o
f act
iviti
es13
Bat
ch s
ize
25B
atch
siz
e10
Ava
ilabl
e tim
e48
0A
vaila
ble
time
480
Up
time
100%
Up
time
4570
Pro
duct
ivity
2.89
2184
Prod
uctiv
ity44
4W
aste
Was
teW
aste
Cha
nge
Ove
r4.
27C
hang
e O
ver
Tra
nspo
rtat
ion
(fee
t)19
1T
rans
port
atio
n (F
eet)
102
Def
ect
Def
ect
118
Def
ect
Wai
ting
Tim
e28
53W
aitin
g T
ime
944.
84W
aitin
g T
ime
172
2984
944.
8417
2
Lea
d t
ime
(Min
)32
65L
ead
tim
e (
Min
)95
9.69
Lea
d t
ime
(M
in)
177.
24L
ead
tim
e (
Min
)44
01.9
3 T
TL
Non
val
ue
add
ed29
8491
.39%
TT
L N
on v
alu
e ad
ded
944.
8498
.45%
TT
L N
on v
alu
e ad
ded
172.
0097
.04%
TT
L N
on v
alu
e ad
ded
4100
.84
93.1
6%T
otal
Val
ue
Ad
ded
421.
29%
Tot
al V
alu
e A
dd
ed2.
840.
30%
Tot
al V
alu
e A
dd
ed0.
040.
02%
Tot
al V
alu
e A
dd
ed44
.88
1.02
%T
otal
Un
avoi
dab
le23
97.
32%
Tot
al U
nav
oid
able
12.0
11.
25%
Tot
al U
nav
oid
able
5.20
2.93
%T
otal
Un
avoi
dab
le25
6.21
5.82
%
Figu
re 5
.1: S
umm
ary
of C
urre
nt S
tate
Map
VA
LU
E S
TR
EA
M M
AP
PIN
G O
F C
UR
RE
NT
ST
AT
ED
ate
of th
e M
appi
ng
ICO
NS
LE
GE
ND
Val
ue S
trea
m
Cha
mpi
on
Map
ping
Mem
bers
Le
an F
orum
Mem
bers
Sum
mar
y of
Cu
rren
t st
ate
Map
Pro
du
ct-P
olo
shir
t
Sale
s &
Dis
trib
uti
on
Hea
d o
f C
utt
ing
Hea
d o
f Se
win
gH
ead
of
Fin
ish
ing
Cu
ttin
gSe
win
gF
inis
hin
g
Bat
ch s
ize
1100
Tot
al S
um
mar
yF
inis
hin
gSe
win
gC
utt
ing
Tra
nspo
rtat
ion
(Fee
t)�
330
42 239
0.04
12.0
15.
22.
84
Inventory
Inventory
Custom
erSupp
lier

39
5.4.5 Result analysis of current state map
Total value added time = 44.88 min
Total non-value added time = 4100.84 min
Total unavoidable time = 256.21 min
Total time = VA time + NVA time + UNVA time
= 44.88 + 4100.84 + 256.21 min
= 4401.93 min
Total Lead time = 4401.93 min
% of value added time = 1.02%
% of non-value added time = 93.16%
% of unavoidable non value added time = 5.82%
5.4.6 Current value adding, non-value adding and unavoidable non value adding graph
98.45%
0.30%
1.25%
Sewing Summary
TTL Non valueadded
Total ValueAdded
TotalUnavoidable
Figure 5.2: Cutting summary Figure 5.3: Sewing summary
91.39%
1.29%7.32%
Cutting Summary
TTL Nonvalue added
Total ValueAdded
TotalUnavoidable

40
93.16%
1.02%5.82%
Total Summary
TTL Non valueadded
Total ValueAdded
TotalUnavoidable
Figure 5.4: Finishing summary Figure 5.5: Total summary
5.4.7 Current Efficiency and Productivity graph of traditional lines
Figure 5.6: Current efficiency Figure 5.7: Productivity graph
97.04%
0.02%2.93%
Finishing Summary
TTL Nonvalue added
Total ValueAdded
TotalUnavoidable

41
5.4.8 Current Traditional line layout
Figure 5.8: Current line layout

42
5.5 Improvement areas of Current State
5.5.1 Cutting section
Fabric spreading time is too much for manual laying.
After each laying fabric edge cutting by one scissor man.
Using more helper for each laying
Number is not starting from 1st stack of cutting
Need helper for numbering
Helper use for transportation in cutting place to numbering area
Cuff collar cannot supply from cutting
Input cannot control from cutting ultimate result is high WIP
Using separate table for cutting, numbering, checking and bundling
Properly not maintaining cut panel rack
There is a transportation between cutting to sewing
5.5.2 Sewing section
a) Process
Not multi-tasking practices
Using helper for front and back match
Using helper for body with sleeve match
Helper using for placket, collar and button hole marking
Surging of cuff and collar
Don’t thread trimming by operator
No bundle wise flow in sewing line from beginning to ending
Less use of guide, folder and attachment
Bundle pickup, dispatch and arranging system is not proper way i.e. disorganized way
Do not use laser for marking
Less Job sharing practices
Not multi-machine operating by one worker
Not machine cleaning by operator
There is a transportation and waiting time from sewing to fusing section
43
b) Quality checking
Each line QI 6 to 7 (3 for before iron and others for after iron)
Not QI for inline quality check but one AQC for each two lines
One for measurement check
Not visualization of defects
Measurement checking by normal measurement tape
Two workstation for garments quality check
5.5.3 Finishing section
Each line 7 to 8 person working ( two for ironing and others for packing and folding)
There is a transportation from sewing output to finishing and one guy is responsible for
transportation.
Don’t measurement sketch on iron table for this reason most of the time garments shape
is not ok or measurement variation.
Hang tag, folding, poly and barcode every process is doing by separate worker

44
CHAPTER SIX
FUTURE STATE MAPPING AND IMPLEMENTATION
6.1 Introduction
Value stream mapping is important to identify non value adding task and time. We can reduce
non value adding activities by increase value adding activities through a future state mapping.
All the activities which we will implement in future all are given in future state map.
6.2 Drawing Future State VSM
For designing a future a state map we have to prepare and begin actively using an
implementation plan that describes, on one page, how to achieve the future state plan. The
propose Future State VSM is drawn by showing different types of Lean concept of kaizen,
process merging, job sharing, multitasking, multi-machine operating and operation change,
reduce transportation on the improvement areas of Current State VSM. The Production unit
needs to work with the required rate of production and to maintain the quality and efficiency
also. Figure 6.1, 6.2, 6.3 is showing the future state mapping.
6.3 Future VSM implementation project team
After designing the future state map and implement the Kaizen Event and other improvements a
project team has been formed and also design their regular task.
Table 6.1: Project team
Project Champion Mr. Javed Iqbal
Project Manager Mr. Moin Uddin,
Project Team Leader Mr. Mahabub Alam, Mr. Hasan Ali
Execution Team member Mr. Akter, Mr. Monibur Rahman, Mr. Homayun Kabir, Mr.
Selim Reza,
Supporting Team member Mr. Nuruzzaman, Mr. Moshiur, Mr. Tanvir
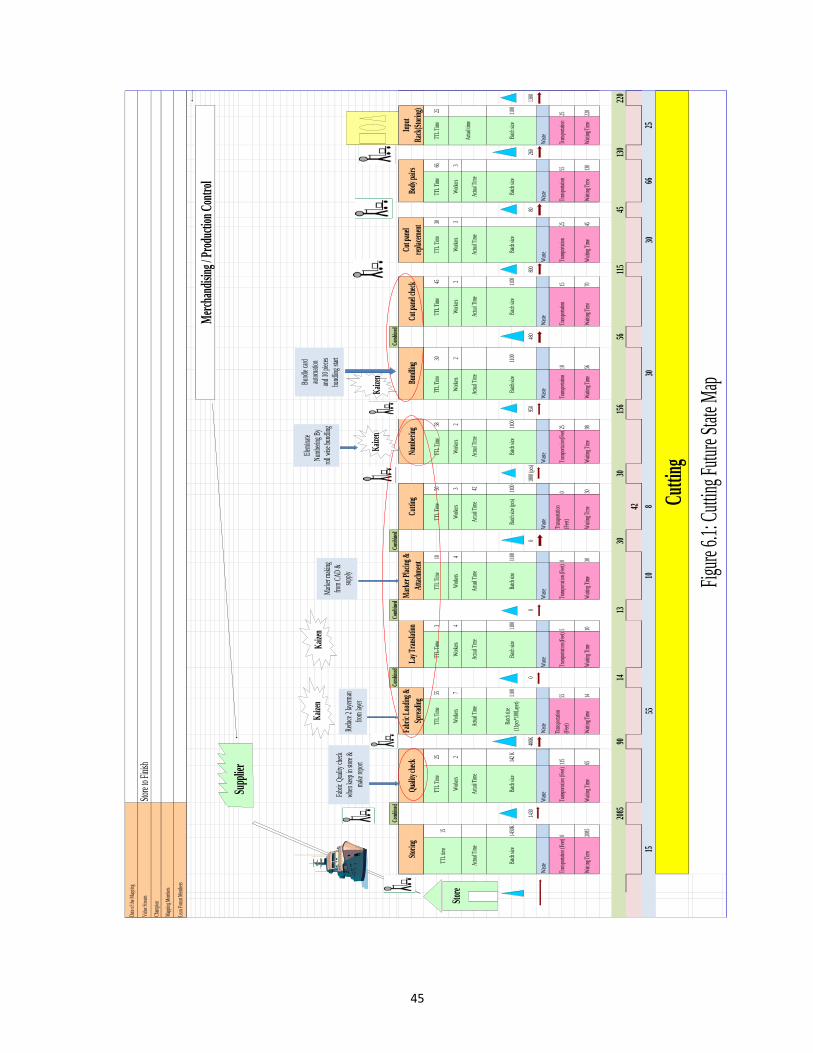
45
Date o
f the M
apping
Value
Strea
m
Cham
pion
Mappi
ng Me
mbers
Lean F
orum M
ember
s
Worke
rs2
Worke
rs7
Worke
rs4
Worke
rs4
Worke
rs3
Worke
rs2
Worke
rs2
Worke
rs2
Worke
rs3
Worke
rs3
1430
400K
00
0180
0 (pcs)
950480
80080
260130
0
Waste
Waste
Waste
Waste
Waste
Waste
Waste
Waste
Waste
Waste
Waste
Waste
2085
9014
1330
30156
56115
45130
220
Figure
6.1: C
utting
Future
State
Map
Merch
andisin
g / Pro
ductio
n Cont
rol
Cuttin
g30
3066
2515
5510
842
130Wa
iting T
ime220
30Wa
iting T
ime30
Waitin
g Time
98Wa
iting T
imeWa
iting T
ime208
5Wa
iting T
ime65
Waitin
g Time
14Wa
iting T
imeWa
iting T
ime
5Tra
nsporta
tion (F
eet)
56Wa
iting T
ime70
Waitin
g Time
45Wa
iting T
ime
25Tra
nsporta
tion55
Transp
ortation
25
25Tra
nsporta
tion10
Transp
ortation
15Tra
nsporta
tion
10
0Tra
nsporta
tion
(Feet)
0Tra
nsporta
tion(Fe
et)Tra
nsporta
tion (F
eet)0
Transp
ortation
(Feet
)115
Transp
ortation
(Fe
et)55
Transp
ortation
(Feet
)
Batch
size
Batch
size
1100
1100
Batch
size
1100
Batch
size
1100
Batch
size
1100
Batch
size
1100
Batch
size (p
cs)110
0Bat
ch siz
e
Actua
l Time
Actua
l Time
Batch
size
1430K
Batch
size
142 K
Batch
size
(11pcs
*100La
yer)
1100
Batch
size
Actua
l Time
Actua
l Time
Actua
l Time
42Ac
tual T
imeAc
tual T
imeAc
tual T
imeAc
tual T
imeAc
tual T
ime
45TT
L Time
50TT
L Time
58TT
L Time
30TT
L Time
55TT
L Time
3TT
L Time
10TT
L Time
TTL t
ime15
TTL T
ime25
TTL T
ime
Storin
gQu
ality c
heck
Fabri
c Load
ing &
Sprea
ding
Lay T
ransla
tionMa
rker P
lacing
& Att
achme
ntCu
tting
Comb
ined
Comb
ined
Comb
ined
Comb
ined
Comb
ined
Numb
ering
Bundl
ingCu
t pane
l check
Cut p
anel
replac
ement
Body
pairs
Input
Rack(
Storin
g)
Store t
o Finis
h
25
Actua
l time
30TT
L Time
66TT
L Time
Actua
l Time
Elemin
ateNu
mberin
g By
roll wi
se bun
dling
Marke
rmaki
ng fro
m CAD
& sup
ply
Bundl
ecard
aut
omatio
nand
10 pie
cesbun
dling s
tart
Store
Kaize
nKa
izen
Kaize
nKa
izen
Suppl
ier
Fabric
Qualit
y chec
k wh
en kee
p in sto
re &
make
report
Reduc
e2 lay
erman
from l
ayer

46
C/T
0.26
C/T
0.15
C/T
0.18
C/T
0.2C/T
0.2
2C/T
0.3
0C/T
0.1
5C/T
0.3
5C/T
0.2
3C/T
0.2
2C/T
0.1
8C/T
0.2
5C/T
0.2
5C/T
0.3
8C/T
0.4
3
Actual
time
0.13
Actua
l time
Actua
l time
0.03
Actua
l time
Actua
l time
0.03
Actual
time
Actua
l time
0.03
Actua
l time
Actua
l time
0.02
Actua
l time
0.05
Actua
l time
0.03
Actual
time
0.10
Actua
l time
Actual
time
0.05
Actua
l time
0.05
Qty Ou
tput
1100
Worke
rs1
Worke
rs1
Worke
rs1
Worke
rs1
Worke
rs1
Worke
rs1
Worke
rs1
Worke
rs1
Worke
rs1
Worke
rs1
Worke
rs1
Worke
rs1
Worke
rs1
Worke
rs1
Qty Ou
tput
1180
Qty Ou
tput
1200
Qty Ou
tput
1160
Qty Ou
tput
1120
Qty Ou
tput
1100
Qty Ou
tput
1090
Qty Ou
tput
1120
Qty Ou
tput
1120
Qty Ou
tput
1110
Qty Ou
tput
1115
Qty Ou
tput
1120
Qty Ou
tput
1130
Qty Ou
tput
580Qty
Outpu
t540
Activi
ties1
Activi
ties2
Activi
ties1
Activi
ties1
Activit
ies2
Activi
ties2
Activi
ties1
Activi
ties1
Activi
ties1
Activi
ties2
Activit
ies1
Activi
ties1
Activit
ies2
Activi
ties2
Batch
size
25Bat
ch size
25Bat
ch siz
e25
Batch
size
25Bat
ch size
25Bat
ch siz
e25
Batch
size
25Bat
ch siz
e25
Batch
size
25Bat
ch siz
e25
Batch
size
200Bat
ch siz
e200
Batch
size25
Batch
size25
Availa
ble tim
e480
Availa
ble tim
e480
Availa
ble tim
e480
Availa
ble tim
e480
Availa
ble tim
e480
Availa
ble tim
e480
Availa
ble tim
e480
Availa
ble tim
e480
Availa
ble tim
e480
Availa
ble tim
e480
Availa
ble tim
e480
Availa
ble tim
e480
Availa
ble tim
e480
Availa
ble tim
e480
Up tim
e0
Up tim
e100
%Up
time
0Up
time
100%
Up tim
e0
Up tim
e100
%Up
time
0Up
time
100%
Up tim
e100
%Up
time
100%
Up tim
e100
%Up
time
0Up
time
100%
Up tim
e100
%
0Eff
iciency
0.59
10Eff
iciency
0.62
10Eff
iciency
0.50
40Eff
iciency
0.51
20Eff
iciency
0.69
20Eff
iciency
0.34
30Eff
iciency
0.82
10Eff
iciency
0.537
10Eff
iciency
0.51
10Eff
iciency
0.42
40Eff
iciency
0.58
40Eff
iciency
0.59
25Eff
iciency
0.46
21Eff
iciency
0.48
30
Waste
Waste
Waste
Waste
Waste
Waste
Waste
Waste
Waste
Waste
Waste
Waste
Waste
Waste
Waste
Chang
e Over
Chang
e Over
Chang
e Over
Chang
e Over
Chang
e Over
Chang
e Over
Chang
e Over
Chang
e Over
Chang
e Over
Chang
e Over
Chang
e Over
Chang
e Over
Chang
e Over
Chang
e Over
Transp
ortation
2
Transp
ortation
2
Transp
ortation
2
Transp
ortation
2
Transp
ortation
2
Transp
ortation
2
Transp
ortation
2
Transp
ortation
2Tra
nsporta
tion
2tran
sportat
ion
2Tra
nsporta
tion 2
Transp
ortation
2
Transp
ortation
2Tra
nsporta
tion
2
Defec
t 0
Defec
t 0
Defec
t 0
Defec
t 0
Defec
t 0
Defec
t 0
Defec
t 0
Defec
t 4
Defec
t 2
Defec
t 5
Defec
t 0
Defec
t 0
Defec
t 5
Defec
t 5
Waitin
g Time
0Wa
iting T
ime15
Waitin
g Time
0Wa
iting T
ime28
Waitin
g Time
7Wa
iting T
ime7
Waitin
g Time
Waitin
g Time
30Wa
iting T
ime4.8
Waitin
g Time
9Wa
iting T
ime8
Waitin
g Time
12Wa
iting T
ime13
Waitin
g Time
15
1000
150
287
70
304.8
98
1213
15
Figure
6.2(a)
: Sewin
g Futu
re State
Map
Stores
Pus
h Bar
0.15
0.15
0.20.1
90.3
00.1
20.3
30.3
80.3
50.2
10.1
70.1
50.1
50.2
50.1
30.0
50.0
50.0
30.0
20.0
50.0
30.1
0.13
0.03
0.03
147
89
1011
125
613
Waitin
g Time
100
Transp
ortation
30Bat
ch size
Nose
tuck
Front
& Back
par
t matc
hSho
ulder
joint
Plack
et Fusi
ngPla
cket m
ark
for Ro
lling
Placke
t Rolli
ngFro
nt par
t mark
for
placke
t joint
Placke
t joint
Placke
t Sci
ssorin
g
Comb
ined
Label
attach
Should
er T/S
Collar
Cuttin
gCo
llar m
ark
for joi
ning
Collar
joint
Collar
joint
Invent
ory
ICON
S LEG
END
Manua
lEle
ctronic
Inform
ation
Custo
mer, S
upplier
Sewing
25
12
34
Opera
tion
Chang
eOp
eration
Ch
ange
Placke
t Seci
ssorin
g by
nose tu
ck ope
rator
Helpe
r Elim
inate b
ycom
bindly
suppl
y from
cut
tingMa
rkingh
elper
elimina
te by
collar
mark
& cut
ting fro
m cutti
ng
Markin
ghelp
er Eli
minate
by
using
Cut m
ark in
Placke
t
Body
mark
helper
elim
inate
by usi
ng lase
r
Kaize
nKa
izen
Kaize
n
Kaize
n

47
Sea
Proces
sSup
er mark
et
C/T
0.20
C/T
0.2C/T
0.3
7C/T
0.3
7C/T
0.2
5C/T
0.2
8C/T
0.7
0C/T
0.8
C/T
0.3C/T
0.2
5C/T
0.4
2C/T
0.4
7C/T
0.4
6C/T
0.2
6C/T
0.3
3C/T
0.3
2
Actual
time
0.05
Actual
time
Actual
time
0.07
Actual
time
0.07
Actual
time
0.08
Actual
time
0.07
Actual
time
0.07
Actual
time
0.1Act
ual tim
e0.1
Actual
time
Actual
time
0.05
Actual
time
0.05
Actual
time
0.08
Actual
time
Actual
time
0.12
Actual
time
0.10
Worke
rs1
Worke
rs1
Worke
rs1
Worke
rs1
Worke
rs1
Worke
rs1
Worke
rs1
Worke
rs1
Worke
rs1
Worke
rs1
Worke
rs1
Worke
rs1
Worke
rs1
Worke
rs1
Worke
rs1
Worke
rs1
Qty Ou
tput
1140
Qty Ou
tput
1140
Qty Ou
tput
540Qty
Outpu
t560
Qty Ou
tput
1080
Qty Ou
tput
1120
Qty Ou
tput
540Qty
Outpu
t520
Qty Ou
tput
1100
Qty Ou
tput
1110
Qty Ou
tput
580Qty
Outpu
t550
Qty Ou
tput
1000
Qty Ou
tput
1080
Qty Ou
tput
1040
Qty Ou
tput
1040
Activit
ies2
Activit
ies1
Activit
ies1
Activit
ies1
Activit
ies1
Activit
ies1
Activit
ies2
Activit
ies2
Activit
ies2
Activit
ies1
Activit
ies2
Activit
ies2
Activit
ies2
Activit
ies1
Activit
ies2
Activit
ies2
Batch s
ize25
Batch s
ize25
Batch s
ize25
Batch s
ize25
Batch s
ize25
Batch s
ize25
Batch s
ize25
Batch s
ize25
Batch s
ize25
Batch s
ize25
Batch s
ize25
Batch s
ize25
Batch s
ize25
Batch s
ize25
Batch s
ize25
Batch s
ize25
Availa
ble tim
e480
Availa
ble tim
e480
Availa
ble tim
e480
Availa
ble tim
e480
Availa
ble tim
e480
Availa
ble tim
e480
Availa
ble tim
e480
Availa
ble tim
e480
Availa
ble tim
e480
Availa
ble tim
e480
Availa
ble tim
e480
Availa
ble tim
e480
Availa
ble tim
e480
Availa
ble tim
e480
Availa
ble tim
e480
Availa
ble tim
e480
Up tim
e100
%Up
time
0Up
time
100%
Up tim
e100
%Up
time
100%
Up tim
e100
%Up
time
100%
Up tim
e100
%Up
time
100%
Up tim
e0
Up tim
e100
%Up
time
100%
Up tim
e100
%Up
time
0Up
time
100%
Up tim
e100
%
Efficie
ncy0.4
7540
Efficie
ncy0.4
835
Efficie
ncy0.4
220
Efficie
ncy0.4
38
Efficie
ncy0.5
615
Efficie
ncy0.6
5287
Efficie
ncy0.7
980
Efficie
ncy0.8
750
Efficie
ncy0.6
925
Efficie
ncy0.5
830
Efficie
ncy0.5
118
Efficie
ncy0.5
420
Efficie
ncy0.9
645
Efficie
ncy0.5
950
Efficie
ncy0.7
2125
Efficie
ncy0.6
990
Waste
Waste
Waste
Waste
Waste
Waste
Waste
Waste
Waste
Waste
Waste
Waste
Waste
Waste
Waste
Waste
Change
Over
Change
Over
Change
Over
0.32
Change
Over
0.25
Change
Over
Change
Over
Change
Over
Change
Over
Change
Over
Change
Over
Change
Over
Change
Over
Change
Over
3.1Cha
nge Ov
erCha
nge Ov
erCha
nge Ov
er
Transp
ortation
2Tra
nsporta
tion 2
Transp
ortation
2Tra
nsporta
tion 2
Transp
ortation
2
Transp
ortation
2Tra
nsporta
tion 2
Transp
ortation
2Tra
nsporta
tion 2
Transp
ortation
2
Transp
ortation
2Tra
nsporta
tion2
Transp
ortation
10Tra
nsporta
tion2
Transp
ortation
2Tra
nsporta
tion2
Defec
t 4
Defec
t 0
Defec
t 12
Defec
t 12
Defec
t 0
Defec
t 0
Defec
t 12
Defec
t 12
Defec
t 6
Defec
t 0
Defec
t 5
Defec
t 5
Defec
t 5
Defec
t 0
Defec
t 10
Defec
t 0
Waitin
g Time
15Wa
iting T
ime12
Waitin
g Time
6Wa
iting T
ime4
Waitin
g Time
8Wa
iting T
ime8
Waitin
g Time
90Wa
iting T
ime55
Waitin
g Time
8Wa
iting T
ime10
Waitin
g Time
7Wa
iting T
ime9
Waitin
g Time
30Wa
iting T
ime5
Waitin
g Time
23Wa
iting T
ime56
1512
64
88
9055
810
79
305
2356
0.26
Figure
6.2(b)
: Sewin
g Futu
re State
Map
Transp
ort
Land
Kaizen
Blitze
s
Runne
r
0.37
0.42
0.38
0.21
0.22
0.17
0.21
0.63
0.70.2
00.2
50.1
50.3
0.20.3
0.10
0.05
0.05
0.08
0.12
0.07
0.08
0.07
0.07
0.10.1
00.0
50.0
7
2526
2728
2930
1920
2122
2324
1516
1718
Sleeve
openi
ng tuc
k
Comb
ined
Collar
piping
Takt Ti
me
Pitch
Manua
l Pull
Flow
Sewing
Daily
Qty
Placke
t box
Sleeve
hem
rolling
Collar
piping
scis
soring
Collar
piping
T/S
Sleeve
& bod
y ma
tch
Sleeve
joint
Sleeve
joint
Sleeve
arm
mhole
T/S
Armm
hole
thr
ead cu
tBo
ttom he
mCo
llar pip
ing
T/SPla
cket C
losing
Placke
t patter
n T/S
Placke
t box
Opera
tion
Chang
eOp
eration
Ch
ange
Collar
piping
cuttin
g by
operato
r
Sleeve
Match
hel
per red
uce by
ma
intain c
ut pane
l Elim
inate t
hread
trimmin
g hel
per, by
opera
tor Elim
inate
operati
on
Jobsha
ring &
reduce
one o
perato
r
Comb
ined
Kaize
nKa
izen
Custo
mer

48
C/T 0.59
C/T 0.55
C/T 0.42
C/T 0.28
C/T 0.42
C/T 0.46
C/T 0.23
C/T 0.32
C/T 0.25
C/T 0.20
C/T 0.38
C/T 0.32
C/T 0.4
C/T 0.4
C/T 0.3
C/T 0.80
Actual tim
e0.10
Actual tim
e0.10
Actual tim
e0.07
Actual tim
e0.08
Actual tim
e0.08
Actual tim
e0.1
Actual tim
e0.06
Actual tim
e0.20
Actual tim
eActu
al time
0.10Actu
al time
Actual tim
eActu
al time
Actual tim
eActu
al time
Actual tim
e0.42
Workers
1Work
ers1
Workers
1Work
ers1
Workers
1Work
ers1
Workers
1Work
ers1
Workers
1Work
ers1
Workers
1Work
ers1
Workers
1Work
ers1
Workers
1Work
ers
Qty Output
550Qty O
utput530
Qty Output
1100Qty O
utput1070
Qty Output
1060Qty O
utput1060
Qty Output
1070Qty O
utput1060
Qty Output
1060Qty O
utput1060
Qty Output
530Qty O
utput580
Qty Output
430Qty O
utput410
Qty Output
450Qty O
utput1040
Activities
3Activ
ities3
Activities
2Activ
ities2
Activities
2Activ
ities2
Activities
1Activ
ities1
Activities
1Activ
ities1
Activities
2Activ
ities1
Activities
1Activ
ities1
Activities
1Activ
ities4
Batch size
25Batch
size25
Batch size
25Batch
size25
Batch size
25Batch
size25
Batch size
25Batch
size25
Batch size
25Batch
size25
Batch size
25Batch
size25
Batch size
15Batch
size15
Batch size
15Batch
size100
Available
time480
Available
time480
Available
time480
Available
time480
Available
time480
Available
time480
Available
time480
Available
time480
Available
time480
Available
time480
Available
time480
Available
time480
Available
time480
Available
time480
Available
time480
Available
time480
Up time
100%Up ti
me100%
Up time
100%Up ti
me100%
Up time
100%Up ti
me####
Up time
100%Up ti
me100%
Up time
0Up ti
me100%
Up time
0Up ti
me0
Up time
0Up ti
me0
Up time
0Up ti
me100%
Efficiency
0.6855
Efficiency
0.6145
Efficiency
0.9652
Efficiency
0.6225
Efficiency
0.9338
Efficiency
1.0257
Efficiency
0.5118
Efficiency
0.7123
Efficiency
0.5517
Efficiency
0.4418
Efficiency
0.4240
Efficiency
0.3930
Efficiency
0.3338
Efficiency
###44
Efficiency
0.25350
Efficiency
1.7380
Waste
Waste
Waste
Waste
Waste
Waste
Waste
Waste
Waste
Waste
Waste
Waste
Waste
Waste
Waste
Waste
Change O
verChan
ge Over
Change O
verChan
ge Over
Change O
ver0.1
Change O
verChan
ge Over
0.15Chan
ge Over
Change O
verChan
ge Over
0.35Chan
ge Over
Change O
verChan
ge Over
Change O
verChan
ge Over
Change O
ver
Transport
ation2
Transport
ation2
Transport
ation2
Transport
ation2
Transport
ation 2
Transport
ation 2
Transport
ation 2
Transport
ation 2
Transport
ation 2
Transport
ation 2
Transport
ation 2
Transport
ation 2
Transport
ation 3
Transport
ation 3
Transport
ation 3
Transport
ation 65
Defect
3Defe
ct 3
Defect
0Defe
ct 0
Defect
4Defe
ct 4
Defect
0Defe
ct 0
Defect
0Defe
ct 0
Defect
0Defe
ct 0
Defect
0Defe
ct 0
Defect
0Defe
ct 0
Waiting T
ime32
Waiting T
ime26
Waiting T
ime29
Waiting T
ime17
Waiting T
ime26
Waiting T
ime62
Waiting T
ime8
Waiting T
ime13
Waiting T
ime11
Waiting T
ime28
Waiting T
ime21
Waiting T
ime17
Waiting T
ime12
Waiting T
ime14
Waiting T
ime6
Waiting T
ime27
4332
2629
1726
628
1311
2821
1712
146.3
27
0.240.32
Sewing
Figure 6.2
(C): Sewi
ng Future S
tate Map
0.120.49
0.380.25
0.100.38
0.450.35
0.20.36
0.170.10
0.100.07
0.080.08
0.420.10
0.060.20
0.10
4445
4637
3839
4041
4231
3233
3435
36
Body turn
& threa
d trim
mingSide
seam join
tSide
seam join
tSleev
e outside
tuck
Side vent
tuckSide
vent join
tThre
ad cut
Quality ch
eckQual
ity check
Quality C
heckSize
label Hea
t Pres
singSide
vent T/S
Bartack
Button ho
leMar
k for butt
on attac
h Butt
on attach
Eliminate
quality Ch
eckCom
bined
Combine
dProc
ess Merge
Process M
erge
Kaizen
Kaizen
Kaizen
Reduced

49
C/T
0.88
C/T
0.77
C/T
0.63
C/T
0.53
C/T
0.4C/T
0.2
8C/T
0.3
2C/T
0.4
C/T
0.3C/T
0.1
8C/T
0.0
7C/T
0.4
8
Actua
l time
Actua
l time
Actua
l time
Actua
l time
Actua
l time
Actua
l time
Actua
l time
Actua
l time
Actua
l time
Actua
l time
Actua
l time
0.04
Actua
l time
Worke
rs1
Worke
rs1
Worke
rs1
Worke
rs1
Worke
rs1
Worke
rs1
Worke
rs1
Worke
rs1
Worke
rs1
Worke
rs1
Worke
rs1
Worke
rs2
Qty O
utput
1100
Qty O
utput
1100
Qty O
utput
350
Qty O
utput
380
Qty O
utput
490
Qty O
utput
1040
Qty O
utput
1040
Qty O
utput
1040
Qty O
utput
1040
Qty O
utput
1040
Qty O
utput
1200
Qty O
utput
1200
Activ
ities
1Ac
tivitie
s1
Activ
ities
1Ac
tivitie
s1
Activ
ities
1Ac
tivitie
s1
Activ
ities
1Ac
tivitie
s2
Activ
ities
1Ac
tivitie
s1
Activ
ities
1Ac
tivitie
s1
Batch
size
20Ba
tch siz
e20
Batch
size
10Ba
tch siz
e10
Batch
size
10Ba
tch siz
e15
Batch
size
5Ba
tch siz
e6
Batch
size
6Ba
tch siz
e3
Batch
size
120
Batch
size
10
Avail
able t
ime
480
Avail
able t
ime
480
Avail
able t
ime
480
Avail
able t
ime
480
Avail
able t
ime
480
Avail
able t
ime
480
Avail
able t
ime
480
Avail
able t
ime
480
Avail
able t
ime
480
Avail
able t
ime
480
Avail
able t
ime
480
Avail
able t
ime
480
Up tim
e0
Up tim
e0
Up tim
e0
Up tim
e0
Up tim
e0
Up tim
e0
Up tim
e0
Up tim
e0
Up tim
e0
Up tim
e0
Up tim
e10
0%Up
time
0
Effici
ency
2.02
55Eff
icienc
y1.7
646
Effici
ency
0.46
23Eff
icienc
y0.4
29
Effici
ency
0.41
48Eff
icienc
y0.6
117
Effici
ency
0.69
9Eff
icienc
y0.8
711
Effici
ency
0.65
11Eff
icienc
y0.3
915
Effici
ency
0.18
200
Effici
ency
1.20
Waste
Waste
Waste
Waste
Waste
Waste
Waste
Waste
Waste
Waste
Waste
Waste
Chang
e Over
Chang
e Over
0Ch
ange O
ver0
Chang
e Over
0Ch
ange O
verCh
ange O
ver0
Chang
e Over
0Ch
ange O
ver0
Chang
e Over
0Ch
ange O
verCh
ange O
verCh
ange O
ver
Transp
ortati
on
65Tra
nsport
ation
3Tra
nsport
ation
3
Transp
ortati
on
3Tra
nsport
ation
3
Transp
ortati
on 3
Transp
ortati
on
3Tra
nsport
ation
3
Transp
ortati
on
3Tra
nsport
ation
10
Transp
ortati
on
3Tra
nsport
ation
0
Defec
t 0
Defec
t 0
Defec
t 0
Defec
t 0
Defec
t 0
Defec
t 0
Defec
t 0
Defec
t 0
Defec
t 0
Defec
t 0
Defec
t 0
Defec
t 0
Waitin
g Tim
e24
Waitin
g Tim
e19
Waitin
g Tim
e17
Waitin
g Tim
e11
Waitin
g Tim
e21
Waitin
g Tim
e9
Waitin
g Tim
e8
Waitin
g Tim
e13
Waitin
g Tim
e6
Waitin
g Tim
e4
Waitin
g Tim
eWa
iting T
ime
40
2419
1711
219
813
64
40
0.28
0.48
Figure
6.3:
Finish
ing Fu
ture S
tate M
ap
0.32
0.40.3
0.18
0.03
Finish
ing0.8
80.7
70.6
30.5
30.4
0.04
5657
5850
5152
5354
5547
4849
Foldi
ngpo
lyBa
rcode
Atta
ch on
po
lyM
etal P
assCa
rtonin
g Iro
ning
Quali
ty Ch
eck
Top s
ide
Quali
ty Ch
eck
Top s
ide
Quali
ty Ch
eck(M
easur
emen
t)Siz
e wise
gr
oupin
gHa
ng/Pr
ice ta
g att
achIro
ning
Proce
ss Me
rge
Inven
tory
Job s
harin
g
Proce
ss M
erge
distan
ce

50
6.3.1 Responsibilities of Team
6.3.1.1 Project Champion Responsibilities
Champion is someone with the authority and the responsibility to allocate the organizations
resources. The champion should possess the following attributes:
A sense of Project ownership
Authority to make change happen across functions and departments
Authority to select the implementation core team
Authority to commit resources
6.3.1.2 Project Manager Task
Planning and Controlling and follow up the team
Regular basis meeting with team
Provide necessary guideline and direction
Communication with project champion
6.3.1.3 Project Team Leader Task
Communication with Team regular basis
Give information to team according to project manager direction
Regularly monitor and control project team
Implement new good ideas other teams
Create benchmarking for project products
6.3.1.4 Execution Team member Task
Execution the new layout according to team leader direction
Communication with production team regularly
Motivation workers
Logistics support (Guide, Folder arrangement)
Regularly time study
Skill matrix creation
Productivity analysis daily basis
Layout design and comparison
Measure improvement daily basis
6.3.1.5 Supporting Team member task
Capacity study and line graph make
Production study
Time study and cycle time check

51
Hourly production follow up the team
Record data before and after layout change
Task comparison
Take picture and video
6.3.2 Company profile
The selected apparel manufacturing plant is Viyellatex Ltd. Viyellatex is an export oriented knit
garment manufacturing unit established in 1996. Now it is the ISO, Accord certified knit
garments in Bangladesh. Main products are T-shirt, Polo Shirt, Trouser, Jacket and Fancy
products etc. Currently it has 100 sewing lines in which most of the machines has auto trimmer
and mostly oil-free dry head machine with the capacity of 2-2.5 million pieces. It is located at
Sataish Road, Gazipura, Tongi Gazipur, Bangladesh. Viyellatex Ltd. has backward and forward
linkage sister companies.
Table 6.2: Company Profile
Factory name: Viyellatex Factory address: 297, Khortoil, Tongi, Gazipura-1712, Bangladesh Total direct labour: 5000 persons (Cutting, Sewing and finishing) Product range: T-shirt, Polo shirt, Jacket, Fancy product, Kids wear etc. Sewing lines: 100 lines Sewing operators per line: For Basic-22, Semi Critical-32, Critical-48 Helpers per line: Basic-8, Semi Critical-10, Critical-12 Daily working hours: 8 Selected product for mapping: Polo shirt (Cutting, Sewing and Finishing) Absenteeism: 5.5% Days for order changeover: 23
6.4 Kaizen Events/Blitz
Traditionally, kaizen has meant making small, incremental improvements over a long period of
time. A blitz is an intense and lightning-quick version of the kaizen process used to implement a
variety of Lean techniques in a hurry, usually three to eight days in length. It is also sometimes
called a Kaizen Event. It’s easy to understand why lean manufacturers are embracing the kaizen
blitz. Improvement in a Lean organization must be an ongoing process and the structure of a

52
kaizen blitz is one of the surest ways to augment continual change, increase efficiency and
generate savings.
Following are the improvement ideas and implemented in Future state VSM.
6.4.1 Cutting Implementation
a. Team concept and training
Team building is important to achieve a goal. It is quiet impossible for one or two person to
overcome and follow up a lots of process perfectly and nicely. As a result many people are
engaged here to accomplish the task properly. So for team work need training and team building
session that will help the people work together. Training is important to make the people
knowledgeable about their task and responsibilities. By training we can easily adopt new concept
and implement it.
b. Starting ten pieces bundling system
Traditional bundling system is more than twenty to thirty pieces in a one bundle. But our new
concept is bundle is no more than ten pieces for tee shirt, polo shirt and five pieces for jacket
product. If the bundle is small it will easy to handling and can easily arrange it.
Before Kaizen After Kaizen
Figure 6.4: Ten pieces bundling
c. Maintaining serial in all ten pieces bundle to eliminate front with back and body with
sleeve matching
In traditional system we can see that all time one or two person is engage for match front with
back and body with sleeve. Now to reduce the helper we have to maintain serial in one bundle
than we can easily match front, back and sleeve without any problem.

53
d. Start all parts in one bundle together such as front, back, and sleeve cut panel
In traditional system all parts are delivered as a separate bundle. As a result operator cannot find
it easily and not interest to match it. So our new concept is we will deliver all parts suppose
front, back and sleeve together also maintain serial from cutting.
e. Utilization of band knife machine for small parts cutting to keep dimensional accuracy
In current conditions people are not using band knife machine for small parts cutting. As a result
the shape of the cut panel is not good. So our new concept for small piece cutting we cannot use
normal straight knife cutter we will use band knife machine to keep small parts shape accuracy.
f. Start without numbering bundling system by implementing roll wise cutting system
Our new idea is from now we will not use sticker attach on cut panel we will cut the fabrics
according to role wise and cannot amalgamate one role to another role if there are no shading
issue may come. Because sticker is use only for shading purpose.
g. Maintain on time input of all parts
To reduce changeover and through time also non production time we will ensure that all parts are
provided together and at a time.
h. Use same table for laying, cutting, checking and bundling to reduce transportation
To reduce transportation time on cutting section we will use same table for cutting numbering
also check and bundling.
i. Elimination of bundle card writing helper by bundle card automation
Previously six to seven helper is engaged for bundle card writing and sometimes they cannot
supply it quickly as urgent requirement. Now new concept, we will make it automation of paper
printing (see appendix-L). As a result no need extra four to five helper.
j. Using light box for cut panel & fabric check
Traditional systems only fabric checking by light box but sometimes some cut panel problem
cannot identified through normal light also some embroidery and print panel problem cannot
identified. So if we use lighting box for checking cut panel it will more helpful for identified
fabric defects quickly and accurately. As a result cutting defects will be reduced.

54
k. Uses of fabric edge cutter m/c after each laying
Traditional systems after each laying two scissor man cut the fabric with the help of scissor. But
now our implement concept is we will use fabric edge cutter for each lay cutting. The following
figure showing this-
Before Kaizen After Kaizen
Figure 6.5: Uses of fabric edge cutter after each lay
l. WIP control by providing daily basis input from cutting
Traditional systems there are no control of WIP. Cutting is providing all the cut panel what they
have cut, but now our concept cutting will deliver only the daily basis requirement which is
generated by planning. And by this way we can keep control sewing WIP.
m. Reduce layer man by using auto spreading machine
Traditional systems for fabric laying no spreader machine is using. But if we use spreader
machine for each laying than we can easily reduce laying man for each table laying.
n. Reduce cutting transportation by keep cutting near sewing department
Traditional systems cutting is another floor or building for central cutting maintain. But it is not
good for all times. If we keep the cutting near sewing we can easily communicate cutting
problem and can solve the problem very quickly also reduce the transportation time and
manpower. So our proposal is cutting should be near or parallel with sewing dept. it will be more
effective for reduce cutting problem.

55
6.4.2 Sewing Implementation
Different types of improvement activities have been done in sewing section which are following:
6.4.2.1 Operator Reduction
a. Two machine operating by one operator
Normally one operator operate one machines but now one operator will operate two machines at
a time. So we can easily reduce one operator from one machines, by process scanning.
b. Multi-tasking by one operator
Previously one person doing one task suppose operator is only operating machine but not thread
cutting. Now our new concept is all worker will do two or three task at a time. For example each
operator will be thread trimming after sewing and some operator will be marking and sewing at a
time.
c. Job sharing
Previously operator cannot share the job. But now our target is one operator will share two
process each hour, suppose half hour will do collar joint and another half hour will do another
process collar top stitch.
6.4.2.2 Helper Reduction
Helper can be reduced by different ways following are some procedure also see appendix G.
a. Marking and thread trimming by operator
In our project team we started new concept that every operator will be trimming their extra
thread end after sewing, if we no need use extra helper for thread trimmings.
b. Elimination of matching through nicely arrange cut panel and all parts keep together in
bundle
To reduce helper for front with back and body with sleeve, we will arrange the bundle serially
and together and flow them together so for this reason we have no need extra two helper for front
back match and body with sleeve match.

56
c. By using laser
Laser is now a popular technology in garments. By this we can easily reduce any marking
procedure. For our model team we developed a laser system which will reduce placket and front
body marking for placket joint. Here we will use two laser straight / line and cross laser.
Before Kaizen After Kaizen
Figure 6.6: Use of laser for placket attach
6.4.2.3 Process Improvement
a. Use guide or folder or attachment
We have started use of guide and folder and attachment for better quality and keep two parts
alignment parallel.
b. Cuff and collar cutting from cutting dept.
Previously we need two persons for collar marking and collar surging but now new concept is we
will arrange the cuff and collar form cutting department. and both marking and surging by band
knife machine. Finally we can easily reduce both two persons from sewing line.
c. Combined two process together
Sometimes one process capacity is low and another process capacity is high at that time if we
combined two process together it will be balanced.
Ex- Side vent tack & top stitch
Ex-Opening tack & Chap tack
Ex- lining & bone make together

57
d. Operation Change
Due to not proper operation balancing there is some transportation in the line so we have
changed some operation at the end to beginning of the line in our project team.
e. Development of thread cutting table
Traditional system thread cutting is doing by normal flat table. For our project team we have
developed a table where table top will be hole, and this hole will help to fall down the thread into
down word and it has developed due to lose thread is one kind of defects which is not acceptable
in quality inspections.
Before Kaizen After Kaizen
Figure 6.7: Developed thread cutting table
6.4.2.4 Reduce WIP
a. Properly job distribution and line balancing
To reduce WIP it is important properly work distribution. Without proper work balance there
will be a bottleneck and it will create the WIP. So from the line balancing graph we have to
properly balancing the graph.
b. Keep 10 pieces bundling system
If twenty five or more pieces keep in one bundle it will create WIP in lines. Lean concept is
single piece flow in assembly line and if we cannot do this we have to keep it as much as low
quantity. We observe in knit factory that production quantity is higher than others. For this small
quantity bundle is difficult. So our target is to keep the bundle size minimum ten pieces, which
will help us to maintain WIP minimum quantity level.

58
c. Maintain two bundle flow
Traditional system there are no control of bundle flow. For our project team we will maintain
two bundle flow from the starting to ending. As a result we can control line WIP and can easily
identify the bottleneck process also balance the line.
6.4.2.5 System development and Layout
a. Development of skill matrix
Skill matrix is a process and operator list chart which is categories into good, batter and best of
different types of machine process. Then according to process categorization necessary operators
are arrange which is called skill inventory and this inventory is keep up to date to find out a best
operator for emergency crisis. To implement future state map there is a skill matrix has been
made and skill inventory has done (See appendix- E, F).
b. Reduce changeover time or through put time
By arranging input and all types of machines and necessary guide and attachment before starting
a new layout, also complete special requirement or comment at PP stage. As a result through put
time and changeover time can be reduced easily.
c. For critical item make the layout preparation section & assembly section
For critical layout suppose Jacket or fancy item make the layout two portions. One is
preparations section and another one is assembly section. Independent parts will make from
preparations section and sometimes this line will help other line at a time. Then the parts will go
to assembly line for complete the garments.
d. Small and zigzag layout system
Traditional layout was u-shape and straight flow. As a result there were some transportation and
sometimes it was difficult to job share. But new concept is straight line and zigzag flow so
transportation will be low and process can be easily shared. Following are new proposed layout-

59
Figure 6.8: Proposed layout of sewing section

60
6.4.2.6 Synchronizations of production target
a. General target for sewing
Traditional system only target is given for sewing and for operator. So each hour later supervisor
take all responsibilities to give the production.
b. Should be target for quality and Finishing also
New concept production target is not only for sewing but quality, and finishing also. Each hour
later they have to take responsibilities to give the production. Otherwise there will be back log
production to quality and finishing.
6.4.2.7 Quality implementation
a. Increase process QI by reducing table QI
Traditionally all QI is working on table and one AQC is responsible for two lines, result is it is
tough for him to monitor two lines at a time. If we increase line QI who will work on the inline
critical process each hour. He will check all the critical process and share with production
supervisor regularly. Following are developed in line quality process checking table.
Figure 6.9: New developed table for moving QI
b. Implementation of traffic light system
It is a quality system designed to identify problems and get help from management to solve those
problems. The purpose of this system is to identify quality problems within the needlepoint and
to immediately give remedies to stop it from recurring.

61
The chart always starts with YELLOW and moves to either RED or GREEN but will never
directly between RED and GREEN. In other words RED and GREEN are always separated by
YELLOW.
Otherwise, GREEN CARD [If no faults]
RED CARD [If one pcs fault]
RED CARD [If one pcs fault or none remain at]
YELLOW CARD [If no faults]
GREEN CARD [If no faults]
Figure 6.10: SOP of Traffic Light System for maintaining quality
c. Eliminate garments measurement by sketching measurement in QI table
One QI is always responsible for check garments measurement. We can reduce it by drawing
sketch on QI table. When the QI check the garments they will put the garments on the drawing
sketch and easily can confirm the measurement. Following are some example-
1st check (7 pcs)
2nd check (7 pcs)
3rd check (7 pcs)
Start (yellow)
4th check (7 pcs)

62
Before Kaizen After Kaizen
Figure 6.11: New concept of table quality checking procedure
d. To easily identification of defects and its locations using visual sketching of garments
Visual management is good for take any decision. By this we can more easily take any types of
decision. So if the QI put mark on sketch what they are finding in each checking. After complete
the check they can easily identified where the problem locations and what is the frequency and
which operator is responsible for this defects. They can share it with superior or operator and can
solve it very quickly.
Figure 6.12: Visualization of garments defects
e. After checking keep the garments size wise separately
Sometimes one person is responsible for size wise garments grouping. But if we keep it
separately size wise after checking and mark the table size wise then no need extra person for
size wise grouping.
Before Kaizen After Kaizen

63
6.4.3 Finishing Implementation
a. Reduce transportation by integration of finishing with sewing output
In traditional lines sewing and finishing section is separate for this there is a small transportation
between them. Our new concept is sewing and finishing will merge together. Result is no extra
transportation and waiting time between them and no need extra man for transportation. And if
we can keep all the department near and parallel it will be more effective layout.
b. Folding and poly together (one for jacket, two for t- shirt & polo shirt)
In traditional system one person is always engage for folding and one for poly but new concept is
both two process is done by one person and ultimately there capacity will be equally utilized.
Otherwise according to time study poly man capacity is more than folding man. As a result
process will be merged.
c. Barcode and sticker attach by one person
Traditional system one person is engage for bar code attach and another one for sticker attaching.
But if we can do both task by one person it will be more effective.
d. For accurate shape of garments use marking on iron table
In traditional system after completing the garments when iron man ironing the garments he has
no idea about the garments shape. Result is measurement and shape is uneven and not exactly.
But if we make a sketch on iron table it will be more helpful about the garments shape. When
iron man ironing the garments he will keep the garments on the sketch it will be helpful to keep
the garments its perfect shape also.
Before Kaizen After Kaizen
Figure 6.13: Sketch on iron table

64
CHAPTER SEVEN
DATA ANALYSIS AND RESULTS
7.1 Introduction
A Future state map is generated based on the current state map to improve the value-adding time
by eliminating the non-value adding time in the current system. To implement future state
different types of kaizen has done and different initiative has taken. The process time is
shortened by the proper follow up and motivation, delay time is removed by proper planning,
controlling and the schedule is maintained with the help of all related and concerned people.
7.2 Data analysis
After implementation of different kaizen on current state following is the comparison between current and implemented future state, and for line balancing graph (see appendix D, and H).
Table 7.1: Comparison between traditional line and model line summary
Comparison Criteria Traditional line Model line
No of Machine 31 28
No of Operator 31 27
No of Helper 11 2
No of QI 6 3
No of Iron 2 2
No of Packing worker 8 6
Total worker 58 40
Quantity Output 1040 960
Avg. Working Hour 8 8
Avg. Hourly Production 130 120
Output Min 8840 8160
Input Min 20160 13920
Average sewing Efficiency 43.85% 58.62%
Productivity 2.24 3.00
No of Defects 118 20
WIP 2184 420
Process Integration or merge 0 7
Multi machine operating 0 1
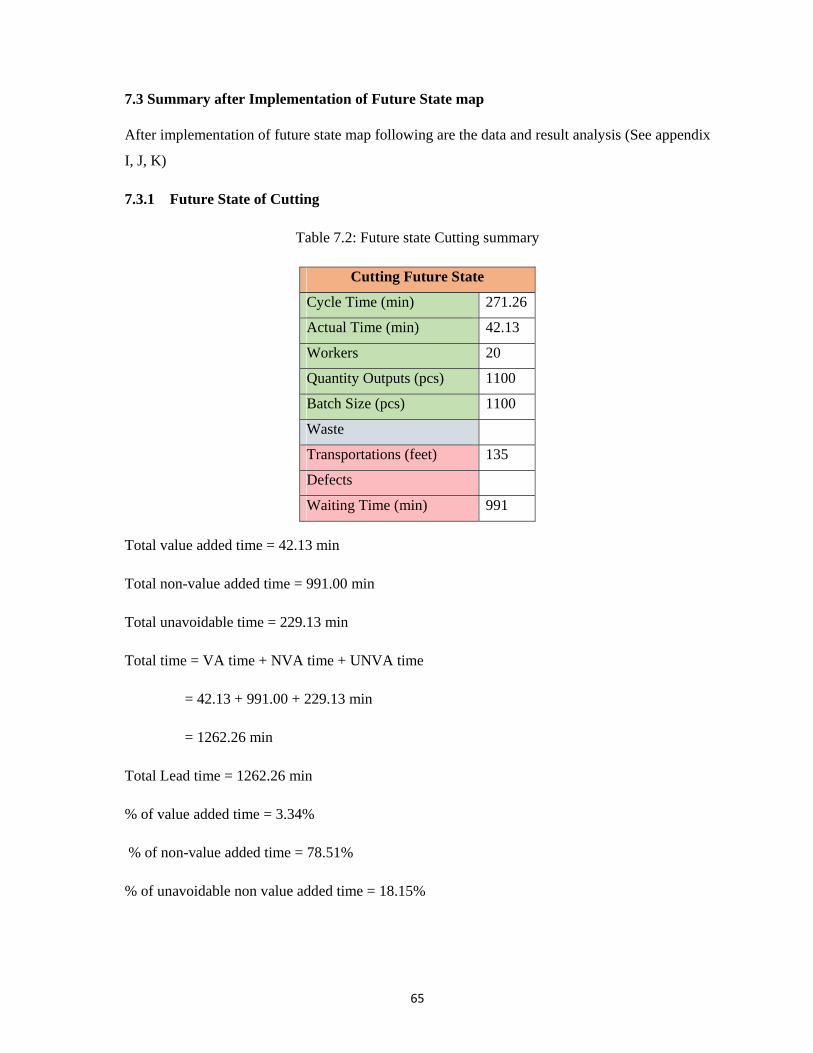
65
7.3 Summary after Implementation of Future State map
After implementation of future state map following are the data and result analysis (See appendix
I, J, K)
7.3.1 Future State of Cutting
Table 7.2: Future state Cutting summary
Cutting Future State
Cycle Time (min) 271.26
Actual Time (min) 42.13
Workers 20
Quantity Outputs (pcs) 1100
Batch Size (pcs) 1100
Waste
Transportations (feet) 135
Defects
Waiting Time (min) 991
Total value added time = 42.13 min
Total non-value added time = 991.00 min
Total unavoidable time = 229.13 min
Total time = VA time + NVA time + UNVA time
= 42.13 + 991.00 + 229.13 min
= 1262.26 min
Total Lead time = 1262.26 min
% of value added time = 3.34%
% of non-value added time = 78.51%
% of unavoidable non value added time = 18.15%

66
7.3.2 Future State of Sewing
Table 7.3: Future state Sewing summary
Sewing Future State Cycle Time (min) 14.34 Actual Time (min) 2.50 Workers 29 Quantity Output (pcs) 960 No of Activities 62 Batch Size (pcs) 10 Available Time 480 Up time 100% Productivity 4.14 Waste Change over 4.39 Transportations (feet) 146 Defects 20 Waiting Time (min) 318
Total value added time = 2.50 min
Total non-value added time = 318.00 min
Total unavoidable time = 11.87 min
Total time = VA time + NVA time + UNVA time
= 2.50 + 318.00 + 11.87 min
= 332.37 min
Total Lead time = 332.37 min
% of value added time = 0.75%
% of non-value added time = 95.68%
% of unavoidable non value added time = 3.57%

67
7.3.3 Future State of Finishing
Table 7.4: Future state Finishing summary
Finishing Future State Cycle Time (min) 5.30 Actual Time (min) 0.04 Workers 13 Quantity Outputs (pcs) 960 No of Activities 13 Batch Size (pcs) 10 Available Time 480 Waste Transportations (feet) 53 Defects Waiting Time (min) 123
Total value added time = 0.04 min
Total non-value added time = 123 min
Total unavoidable time = 5.26 min
Total time = VA time + NVA time + UNVA time
= 0.04 + 123.00 + 5.26 min
= 128.30 min
Total Lead time = 128.30 min
% of value added time = 0.03%
% of non-value added time = 95.87%
% of unavoidable non value added time = 4.10%

68
7.3.4 Combined Future State map of Cutting, Sewing and Finishing
Stor
e to
Fin
ish
Stor
es
Cus
tom
er
Info
rmat
ion
Man
uIn
vent
ory
Push
Bar
Supp
lier
Ele
ctro
nic
Sea
Land
Kai
zen
Supe
r
Proc
ess
Tra
nspo
rt
Blit
zes
unn
mar
ket
Man
ual
Flow
C/T
(Min
)27
1.26
C/T
(Min
)14
.34
C/T
(Min
)5.
30A
ctua
l tim
e42
.13
Act
ual t
ime
2.50
Act
ual t
ime
0.04
Wor
kers
20W
orke
rs29
Wor
kers
11Q
ty O
utpu
t11
00Q
ty O
utpu
t96
0Q
ty O
utpu
t96
0N
o. o
f act
iviti
es62
No.
of a
ctiv
ities
13B
atch
siz
e10
Bat
ch s
ize
10A
vaila
ble
time
480
Ava
ilabl
e tim
e48
0U
p tim
e10
0%U
p tim
ePr
oduc
tivity
4.14
Prod
uctiv
ity10
.91
100
Was
teW
aste
Was
teC
hang
e O
ver
4.39
Cha
nge
Ove
rT
rans
port
atio
n (f
eet)
146
Tra
nspo
rtat
ion
(Fee
t)53
Def
ect
Def
ect
20D
efec
t W
aitin
g T
ime
991
Wai
ting
Tim
e31
8W
aitin
g T
ime
123
991
318
123
Lea
d t
ime
(Min
)12
62.2
6L
ead
tim
e (
Min
)33
2.37
Lea
d t
ime
(M
in)
128.
30L
ead
tim
e (
Min
)17
22.9
3 T
TL
Non
val
ue
add
ed99
1.00
78.5
1% T
TL
Non
val
ue
add
ed31
8.00
95.6
8% T
TL
Non
val
ue
add
ed12
3.00
95.8
7% T
TL
Non
val
ue
add
ed14
32.0
083
.11%
Tot
al V
alu
e A
dd
ed42
.13
3.34
%T
otal
Val
ue
Ad
ded
2.50
0.75
%T
otal
Val
ue
Ad
ded
0.04
0.03
%T
otal
Val
ue
Ad
ded
44.6
72.
59%
Tot
al U
nav
oid
able
229.
1318
.15%
Tot
al U
nav
oid
able
11.8
73.
57%
Tot
al U
nav
oid
able
5.26
4.10
%T
otal
Un
avoi
dab
le24
6.26
14.2
9%
VA
LU
E S
TR
EA
M M
AP
PIN
G O
F F
UT
UR
E S
TA
TE
MA
PD
ate
of th
e M
appi
ng
ICO
NS
LE
GE
ND
Val
ue S
trea
m
Cha
mpi
on
Map
ping
Mem
bers
Le
an F
orum
Mem
bers
Sum
mar
y of
Fu
ture
Sta
te M
apP
rod
uct
-Pol
o sh
irt
Sale
s &
Dis
trib
uti
on
Hea
d o
f C
utt
ing
Hea
d o
f Se
win
gH
ead
of
Fin
ish
ing
Cu
ttin
gSe
win
gF
inis
hin
g
Bat
ch s
ize
1100
2093
420
Tra
nspo
rtat
ion
(Fee
t)�13
5
42.1
32.
500.
04
Figu
re 7
.1: S
umm
ary
of F
utur
e St
ate
Map
Tot
al S
um
mar
y
229.
1311
.87
5.26
Cu
ttin
gSe
win
gF
inis
hin
g
Inventory
Inventory
Custom
erSupp
lier
Kai
zen
Proc
essr
azin
g
Ope
ratio
n sc
anni
ng

69
7.4 Result analysis of implemented future state map
Total value added time = 44.67 min
Total non-value added time = 1432 min
Total unavoidable time = 246.26 min
Total time = VA time + NVA time + UNVA time
= 44.67 + 1432 + 246.26 min
= 1722.93 min
Total Lead time = 1722.93 min
% of value added time = 2.59%
% of non-value added time = 83.11%
% of unavoidable non value added time = 14.29%
Following are the implemented future state map value adding, non-value adding and unavoidable
non value adding time summary:
Table 7.5: Summary of implemented future state map
Criteria Implement Future State Map
Time Percentage
Lead time (min) 1722.93
Non Value adding time 1432.00 83.11%
Value adding time 44.67 2.59%
Unavoidable non value adding time 246.26 14.29%

70
Following are the future state map cutting, sewing, finishing and total summary graph:
95.68%
0.75%
3.57%
Sewing summary
TTL Non valueadded
Total Value Added
Total Unavoidable
Figure 7.2: Future state Cutting summary Figure 7.3: Future state Sewing summary
83.11%
2.59%
14.29%
Total summary
TTL Non valueadded
Total Value Added
Total Unavoidable
Figure 7.4: Future state Finishing summary Figure 7.5: Future state Total summary
78.51%
3.34%
18.15%
Cutting summary
TTL Non valueadded
Total Value Added
Total Unavoidable
95.87%
0.03%
4.10%
Finishing summary
TTL Non valueadded
Total Value Added
Total Unavoidable

71
7.5 Final Results
Following are the final comparison between traditional line vs model line-
Table 7.6: Comparison between traditional and model line
Performance
measure
Unit of
Measurement
Tradition
al line
Model line Improvement
percentage
Line efficiency Percentage 43.85% 58.62% 33.68%
Line productivity Labour per hour (pcs) 2.24 3.00 33.92%
WIP reduction Pieces 2184 420 80.76%
Lead time reduction Percentage 4401.93 1722.93 60.85%
Value adding time
increased
Percentage 1.02% 2.59% 153.92%
Non value adding
time reduced
Percentage 93.16% 83.11% 10.78%
Following are the traditional and model line efficiency, productivity, WIP, lead time, value
adding, and non-value adding time comparison graph:

72
Figure 7.6: Comparison of line Efficiency Figure 7.7: Comparison of Productivity
Figure 7.8: Comparison of line WIP Figure 7.9: Comparison of Lead time
Figure 7.10: Comparison of Value adding Figure 7.11: Comparison of Non-Value adding

73
CHAPTER EIGHT
CONCLUSIONS AND RECOMMENDATIONS
8.1 Conclusions
The value stream mapping method (VSM) is a visualization tool oriented to the Toyota
Production System. It helps to understand and streamline work process using the tools and
technique of lean manufacturing. The goal of VSM is to identify, demonstrate and elimination of
waste in the process. Before eliminating waste, we must be able to see it. If we can identify
waste, we can target it for elimination. But if we cannot see it, it will remain and add cost.
Without VSM problem cannot be identified easily and cannot reduced. VSM can serve as a
starting point to help management, engineers, production associates, schedulers, suppliers, and
customers, recognize waste and identify its causes. As a result value stream mapping is primarily
a communication tool, but is also used as a strategic planning tool and a change management
tool.
If we look back of current state assessment. It is found that value adding time is 1.02%, waiting
time is 93.16%, line efficiency 57.29% and productivity 2.37 per person per hour. The line is not
properly balanced and lots of transportation also need more space. The helper, operator ratio was
1:2.81. Which shows huge opportunities for improvement in those areas.
Before implementation of tools & techniques of lean manufacturing we have to train the people
specially supervisor and make them knowledgeable about different types of waste and how to
identify waste also how to reduce waste. Also train the operator how to handling the garments &
operating or stitching. It has started 10 pieces bundling system from cutting. Then follow up the
line regularly and capacity study time to time. Also train about kaizen how small change make
their work simple and improve visibility of off-standards and they were introduced to changing
for better.
After implementation of team work, different kaizen blitz, process integration, job sharing, multi
machine operating and balancing the task also eliminating unnecessary activities, team achieved
58.62% line efficiency, productivity achieved 3 per person per hour, lead time reduction 60.85%,
and value adding time increased 153.92% also non value adding time reduction is 10.78%.
Besides defects, WIP, transportation, and helper also reduced than previous traditional systems.
74
8.2 Recommendations
The study was done with a limited scope. The future works may include super market pull
between cuttings and sewing section also implementation of JIT and Kanban system to keep WIP
at minimum level. The future works may also include helper less Zero defect line where each
operator will be the quality at the source and creation of standard operating procedure (SOP) for
each sections and for Incentive policy also.

75
REFERENCES
[1] Kapyla, J., Jaaskelainen, A. and Lonnqvist, A., “Identifying future challenges for productivity
research: evidence from Finland”, International Journal of Productivity and Performance
Management, Vol. 59(7), pp. 607-623, 2009.
[2] Heap, J., “Stormy productivity ahead”, International Journal of Productivity and
Performance Management, Vol. 56(2), pp. 170-177, 2007.
[3] Bicheno, J., “The Lean Toolbox”, PICSIE Books, Buckingham, 2nd Edition, 2000.
[4] Bhote K. R., “The Ultimate Six Sigma: Beyond Quality Excellence to Total Business
Excellence”, AMACOM, 2002.
[5] Sun, S., “The Strategic Role of Lean Production in SOE’s Development”, International
Journal of Business & Management, Vol. 6(2), 2011.
[6] Black J. T. and Hunter S. L., “Lean Manufacturing System and Cell Design”, SME, 2003.
[7] Burkett, M., AMR Report, Enhancing Lean Manufacturing with Software Applications, Jan.
2002.
[8] Bossert J., “Lean and Six Sigma – Synergy Made in Heaven”, Quality Progress, vol. 36(7),
pp. 31-32, 2003.
[9] Womack, J. P. and Daniel T. J., “Lean Thinking”, Simon and Schuster, New York, 1996.
[10] Liker, J. K., “The Toyota Way: 14 Management Principles from the World's Greatest
Manufacturer”, McGraw-Hill, APA 6th Edition, 2004.
[11] Womack, J., Daniel J., and Daniel R., “The Machine that Changed the World”, Harper
Collins, 1990.
[12] Ohno, T., ‘Toyota Production System’, Taylor & Francis, New Edition, 1988.
[13] Schonberger, R. J., “World Class Manufacturing: the lessons of simplicity applied”, New
York, The Free Press, 1986.
[14] Womack, J. P. and Jones, D. T., Lean Thinking: Banish Waste and Create Wealth in Your
Corporation, New York, Simon & Schuster, 1995.
76
[15] Hines, P., and Taylor, D., Going Lean, Lean Enterprise Research Center, 2000.
[16] Hasin, A., A., “Quality Control and Management”, Bangladesh Business Solutions, 1st
Edition, 2007.
[17] Harrison, A., “Just-in-time Manufacturing in Perspective”, Prentice Hall, 1992.
[18] Hirano, H., “5S for Operators: 5 Pillars of the Visual Workplace”, Taylor & Francis, New
Edition, 1998.
[19] Nakajima, S., TPM Development Program: Implementing Total Productive Maintenance,
Productivity Press, Cambridge MA, 1989.
[20] Holweg M., “The genealogy of lean production”, Science Direct, Journal of Operations
Management, Vol. 25, pp. 420–437, 2007.
[21] Hines, P. and Rich, N., “The seven value stream mapping tools”, International Journal of
Operations & Production Management, Vol. 17, pp. 46-64, 1997.
[22] Ramesh, V., Prasad, K. V. S., Srinivas, T. R., “Implementation of a Lean Model for
Carrying out Value Stream Mapping in a Manufacturing Industry”, Journal of Industrial and
Systems Engineering, Vol. 2(3), pp. 180-196, 2008.
[23] Rother, M. and Shook J., “Learning to see: Value stream mapping to create value and
eliminate MUDA”, Lean Enterprise Institute Brookline, Massachusetts, USA, 1999.
[24] Millard, R. L., “Value Stream Analysis and Mapping for Product Development”, Master’s
Thesis in Aeronautics and Astronautics, Massachusetts Institute of Technology, 2001.

77
APPENDICES

78
Appendix A: Current Data Log Sheet (Cutting)
Act
ivity
Tot
al ti
me
(min
)
Act
ual t
ime
(min
)
Wor
kers
Bat
ch si
ze
Tra
nspo
rtat
ion
(fee
t)
Wai
ting
Tim
e
Storing 15 0 0 1430 kg 0 2085
Quality check 25 0 2 142 kg 115 65
Fabric loading spreading 55 0 7 1100 kg 55 14
Lay Translation 3 0 7 1100 kg 5 10
Marker Placing & Attaching 10 0 4 1100 kg 0 30
Cutting 50 42 3 1100 (pcs) 0 30
Numbering 58 0 2 1100 (pcs) 25 98
Bundling 30 0 2 1100 (pcs) 10 56
Cut panel check 45 0 2 1100 (pcs) 15 70
Cut panel replacement 30 0 3 0 25 45
Body pairs 66 0 3 0 55 130
Input Rack (storing) 25 0 0 1100 (pcs) 25 202

79
Appendix B: Current Data Log Sheet (Sewing)
Act
ivity
C/T
(min
)
Act
ual t
ime
(min
)
Wor
kers
Qua
ntity
Out
put
No
of A
ctiv
ities
Bat
ch si
ze (p
cs)
Up
time
Eff
icie
ncy
(%)
Cha
nge
Ove
r
Tra
nspo
rtat
ion
Def
ect
Wai
ting
Tim
e
Placket Fusing 0.26 0.13 0 1100 0 30 100% 0.00 0.0 25 0 100Placket mark for rolling 0.15 0 1 1180 1 25 0 0.59 0.0 2 0 0
Placket Rolling 0.18 0.03 1 1200 2 25 100% 0.62 0.0 2 0 15 Front part mark for placket join 0.2 0 1 1160 1 25 0 0.50 0.0 2 0 0
Placket join 0.22 0.03 1 1120 1 25 100% 0.51 0.0 2 0 28
Placket scissoring 0.30 0 1 1100 2 25 0 0.69 0.0 2 0 7
Nose tack 0.15 0.03 1 1090 2 25 100% 0.34 0.0 2 0 7 Front &Back part match 0.35 0 1 1120 1 25 0 0.82 0.0 2 0 0
Shoulder join 0.23 0.02 1 1120 1 25 100% 0.537 0.0 2 4 30
Label attach 0.22 0.05 1 1110 1 25 100% 0.51 0.0 2 2 4.8
Shoulder T/s 0.18 0.03 1 1115 2 25 100% 0.42 0.0 2 5 9
Collar Cutting 0.25 0.10 1 1120 1 200 100% 0.583 0.0 2 0 8 Collar mark for joining 0.25 0 1 1130 1 200 0 0.589 0.0 2 0 12
Collar join 0.38 0.05 1 580 2 25 100% 0.46 0.0 2 5 13
Collar join 0.43 0.05 1 540 2 25 100% 0.48 0.0 2 5 15
Collar piping 0.20 0.05 1 1140 2 25 100% 0.475 0.0 2 4 15 Collar piping scissoring 0.2 0 1 1140 1 25 0 0.48 0.0 2 0 12
Collar piping T/S 0.37 0.07 1 540 1 25 100% 0.42 0.32 2 12 6
Collar piping T/S 0.37 0.07 1 560 1 25 10% 0.43 0.25 2 12 4

80
Appendix B: Current Data Log Sheet (Sewing continued)
Act
ivity
C/T
(min
)
Act
ual t
ime
(min
)
Wor
kers
Qua
ntity
Out
put
No
of A
ctiv
ities
Bat
ch si
ze (p
cs)
Up
time
Eff
icie
ncy
(%)
Cha
nge
Ove
r
Tra
nspo
rtat
ion
Def
ect
Wai
ting
Tim
e
Placket closing 0.25 0.08 1 1080 1 25 100% 0.56 0.0 2 0 8 Placket pattern T/S 0.28 0.07 1 1120 1 25 100% 0.65 0.0 2 0 8
Placket box 0.70 0.07 1 540 2 25 100% 0.79 0.0 2 12 90
Placket box 0.8 0.1 1 520 2 25 100% 0.87 0.0 2 12 55
Sleeve hem 0.3 0.1 1 1100 2 25 100% 0.69 0.0 2 6 8 Sleeve &body Match 0.25 0 1 1110 1 25 0 0.58 0.0 2 0 10
Sleeve join 0.42 0.05 1 580 2 25 100% 0.51 0.0 2 5 7
Sleeve join 0.47 0.05 1 550 2 25 100% 0.54 0.0 2 5 9 Sleeve armhole T/S 0.46 0.08 1 1000 2 25 100% 0.96 3.1 10 5 30
Armhole thread cut 0.26 0 1 1080 1 25 0 0.59 0.0 2 0 5
Bottom hem 0.33 0.12 1 1040 2 25 100% 0.72 0.0 2 10 23 Sleeve opening tuck 0.32 0.10 1 1040 2 25 100% 0.69 0.0 2 0 56
Side seam join 0.59 0.10 1 550 3 25 100% 0.68 0.0 2 3 32
Side seam join 0.55 0.10 1 530 3 25 100% 0.61 0.0 2 3 26 Sleeve outside tack 0.42 0.07 1 1100 2 25 100% 0.96 0.0 2 0 29
Side vent tack 0.28 0.08 1 1070 2 25 100% 0.62 0.0 2 0 17
Side vent joint 0.42 0.08 1 1060 2 25 100% 0.93 0.1 2 4 26 Side vent top stitch 0.46 0.1 1 1060 2 25 100% 1.02 0.0 2 4 62
Barrack 0.23 0.06 1 1070 1 25 100% 0.51 0.15 2 0 8
Button hole 0.32 0.20 1 1060 1 25 100% 0.71 0.0 2 0 13

81
Appendix B: Current Data Log Sheet (Sewing continued)
Act
ivity
C/T
(min
)
Act
ual t
ime
(min
)
Wor
kers
Qua
ntity
Out
put
No
of A
ctiv
ities
Bat
ch si
ze (p
cs)
Up
time
Eff
icie
ncy
(%)
Cha
nge
Ove
r
Tra
nspo
rtat
ion
Def
ect
Wai
ting
Tim
e
Button attach mark 0.25 0 1 1060 1 25 0 0.55 0.0 2 0 11
Button attach 0.20 0.10 1 1060 1 25 100% 0.44 0.35 2 0 28
Body turn & thread trimming 0.38 0 1 530 2 25 0 0.42 0.0 2 0 21
Thread cut 0.32 0 1 580 2 25 0 0.39 0.0 2 0 17
Quality check 0.37 0 1 430 1 15 0 0.33 0.0 3 0 12
Quality check 0.4 0 1 410 1 15 0 0.34 0.0 3 0 14
Quality Check 0.27 0 1 450 1 15 0 0.25 0.0 3 0 6
Size label Heat Pressing 0.80 0.42 1040 4 100 100% 1.73 0.0 65 0 27

82
Appendix C: Current Data Log Sheet (Finishing)
Act
ivity
C/T
(min
) A
ctua
l tim
e (m
in)
Wor
kers
Qua
ntity
Out
put
No.
of A
ctiv
ities
Bat
ch si
ze (p
cs)
Eff
icie
ncy
(%)
Cha
nge
Ove
r
Tra
nspo
rtat
ion
Def
ect
Wai
ting
Tim
e
Ironing (1) 0.88 0.00 1 1100 1 20 2.02 0 65 0 24
Ironing (2) 0.77 0.00 1 1100 1 20 1.76 0 0 0 19
Quality check top side (1) 0.63 0.00 1 350 1 10 0.46 0 2 0 17
Quality check top side (2) 0.53 0.00 1 380 1 10 0.42 0 2 0 11
Quality check (measurement) 0.40 0.00 1 490 1 10 0.41 0 2 0 21
Size wise grouping 0.28 0.00 1 1040 1 15 0.61 0 2 0 9
Hang /price tag attach 0.32 0.00 1 1040 1 5 0.69 0 2 0 8
Folding 0.40 0.00 1 1040 2 6 0.87 0 5 0 13
Poly 0.30 0.00 1 1040 1 6 0.65 0 5 0 6
Barcode attach on poly 0.18 0.00 1 1040 1 3 0.39 0 10 0 4
Metal pass 0.07 0.04 1 1200 1 120 0.18 0 0 0 0
Cartooning 0.48 0.00 2 1200 1 10 1.20 0 0 0 40

83
Appendix D: Current state line graph
31 Present Graph Date: Performance: 77% Total Operator: 312043 Previous Graph Date: Prod. Start Date: Balance (%): 68% Total Asst. Operator: 11M&S Lowest Capacity/Hr: 135 Pcs SMV: Efficiency: 45% Total: 42POLO Capacity Achieved: 130 Pcs TACCT: Prod. Gap: 4% Study By: Mahabub
Sl. Optn
Name ID Operation Time Capacity Sl. Optn
Name ID Operation Time Capacity
1 1 Placket mark for rolling SNL 9 348 29 25 Bottom hem FL 20 1572 2 Placket Rolling SNL 11 285 30 26 Sleeve Opening tack SNL 19 1653 3 Front part mark for placket join M 12 261 31 27 Side seam join OL 35 894 4 Placket join SNL 13 241 32 27 Side seam join OL 36 875 5 Placket scissoring M 18 174 33 28 Sleeve out side tack SNL 22 1426 6 Nose tack SNL 9 348 34 29 Side vent tack SNL 17 1847 7 Front &Back part match M 21 149 35 30 Side vent joint SNL 25 1258 8 Shoulder join OL 14 224 36 31 Side vent top stitch SNL 22 1429 9 Lable attatch SNL 13 241 37 32 Bartack BKT 14 22410 10 Shoulder T/s FL 11 285 38 33 Button hole HOLE 19 16511 11 Collar Cutting V-TRIM 15 209 39 34 Button attatch mark M 15 20912 12 Collar mark for joining M 15 209 40 35 Button attatch BTN 12 26113 13 Collar join SNL 23 136 41 36 Body turn & thread trimming M 23 13614 13 Collar join SNL 26 120 42 37 Thread cut M 19 16515 14 Collar piping SNL 12 26116 15 Collar piping scissering M 12 26117 16 Collar piping T/S SNL 22 14218 16 Collar piping T/S SNL 22 14219 17 Placket closeing SNL 15 20920 18 Placket pattern T/S SNL 17 18421 19 Placket box SNL 45 7022 19 Placket box SNL 48 6523 20 Sleeve hem FL 18 17424 21 Sleeve &body Match M 15 20925 22 Sleeve join OL 22 14226 22 Sleeve join OL 25 12527 23 Sleeve armmhole T/S FL 21 14928 24 Armmhole thread cut M 16 196
Item : 11.10
Team : 1-Aug-15 1stStyle : 25-Jul-15
Buyer : 8.50348
285
261
241
174
348
149
224 241 2
85
209
209
257
261
261 285
209
184
135 1
74 2
09
268
149
196
157
165
176
142
204
144
142
224
165 2
09
286
158 179
135
0
50
100
150
200
250
300
350
400
1 2 3 4 5 6 7 8 9 10 11 12 13 14 15 16 17 18 19 20 21 22 23 24 25 26 27 28 29 30 31 32 33 34 35 36 37 38 39 40 41
Capacity CL UCL LCL

84
Appendix E: Skill Matrix Process name
Category
M/C ProcessProduction/
HrProcess
Production/Hr
ProcessProduction
/Hr
Zipper joint 60 Patch label join 100 Back neck piping 150
Zipper top 65 Placket 1/16 top 150 V‐make 140
Collar band joint 70 Placket kacha 140 Flag label joint 160
Placket box 80 Bone joint with rolling 70 Sleeve 1/4 tack 140
Placket box(X) 60 Waist belt tack 70 Sleeve opening tack 140
Side vent join 80 Pattern top 140 Placket Rolling 160
Side vent top 80 Moon joint 110
V‐neck tack with body 130 Placket joint 115
Back neck tape top 140 Placket joint(Stripe) 80
Collar joint 130 Back Neck tape joint 120
Collar top with label 130 Bone top 80
Collar & Zipper mouth closing 50 Pocket joint 80
Bone tack 60 Pocket joint(Diamond) 60
Bottom joint 80 Hood join 80 Back rise 160
Cuff joint 80 Sleeve join 100 Front rise 160
Mora sleeve joint 65 Side seam (Solid) 90 Moon overlock 180
Round Neck joint (without rollar) 160 In seam 100 Shoulder join 160
V‐Neck joint 140
Side seam (Stripe) 55
Blind sleeve Hem 70
Waist belt join 80
Body hem (with thread cut) 160 Sleeve hem (open) 160 Shoulder top 160
Slv hem(Round/ Churi hem) 120 Arm hole piping 140 Front neck top 170
Side top 80 Cuff top 120 Moon top 170
Neck binding 150 Front V‐neck top 140 Back Neck piping 180
Leg hem 80 Hood hem 80
Arm hole top 120
Waist belt top 120
Snap button (3) 60 Double needle CS 120
Hole stitch (3) 120 Bartack (2) 160
Zig zag 100 Button stitch (3) 120
SPECIAL
A(Very Good) B(Good) C(Medium)
SNL
OL
FL

85
Appendix F: Skill Matrix Inventory
Summary Plain m/c Over lock m/c Flat lock m/c Others Total
A 11 3 3 2 19 B 7 8 6 1 22 C 2 4 5 1 12
No Operator Name
ID No Process Name Plain m/c
O/L m/c
F/Lm/c
Others
1 Shajada W-1811471 B/k part label attach & Thread cut B C 2 Nurjahan W-4812364 Placket rolling & T/C B C C 3 Parul 3121649 Placket join A B 4 Khadeja 320499 Nose tack & scissoring A 5 Mahabuba 3115500 Sleeve & bottom hem B A 6 Toli 3112084 Sleeve & bottom hem C A 7 Jorina 316347 Shoulder join &Thread cut B B 8 Jismin 3121460 Shoulder T/S &Thread cut B B 9 Nazmul 3120678 Collar join A C 10 Sharmin 3118663 Collar piping & Scissoring A B 11 Shalma W-4811474 Collar piping T/S & T/C B B 12 Halima 3121624 Collar join & Collar piping T/S A C 13 Kalpona 3119539 Placket closing & T/C B B 14 Jahanara 3119442 Placket closing & T/C A B 15 Moni 3113645 Placket box T /S A B 16 Monora 3113742 Placket box T /S A B 17 Moksuda 3124190 Sleeve join & T/S B A 18 Laily 3121418 Sleeve arm hole T/S & TC B A 19 Shorifa 319611 Side seam join & T/C C A 20 Kuddus 3114577 Side seam join & Sleeve join C A 21 Shobuj 3121886 Sleeve inside & Outside tuck & TC A C C 22 Sharmin 3115402 Sleeve inside & Outside tuck & TC B C 23 Lipe 3116266 Side vent tuck & T/S & TC A B C 24 Kohenur W-5111633 Side vent tuck & T/S & TC A B 25 Shano W-4815031 Bar tack & Button B 26 Rima 3116127 Button hole & button attach Mark A 27 Ranoka 3115952 Button attach A
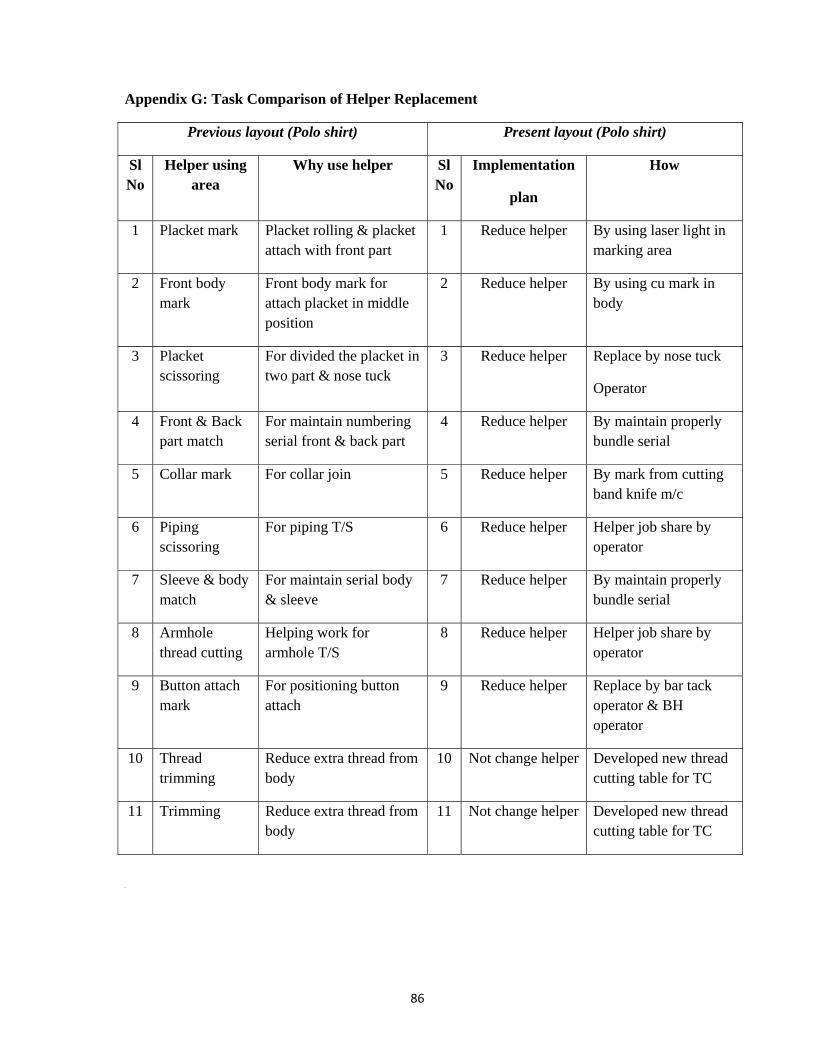
86
Appendix G: Task Comparison of Helper Replacement
Previous layout (Polo shirt) Present layout (Polo shirt)
SlNo
Helper using area
Why use helper SlNo
Implementation
plan
How
1 Placket mark Placket rolling & placket attach with front part
1 Reduce helper By using laser light in marking area
2 Front body mark
Front body mark for attach placket in middle position
2 Reduce helper By using cu mark in body
3 Placket scissoring
For divided the placket in two part & nose tuck
3 Reduce helper Replace by nose tuck
Operator
4 Front & Back part match
For maintain numbering serial front & back part
4 Reduce helper By maintain properly bundle serial
5 Collar mark For collar join 5 Reduce helper By mark from cutting band knife m/c
6 Piping scissoring
For piping T/S 6 Reduce helper Helper job share by operator
7 Sleeve & body match
For maintain serial body & sleeve
7 Reduce helper By maintain properly bundle serial
8 Armhole thread cutting
Helping work for armhole T/S
8 Reduce helper Helper job share by operator
9 Button attach mark
For positioning button attach
9 Reduce helper Replace by bar tack operator & BH operator
10 Thread trimming
Reduce extra thread from body
10 Not change helper Developed new thread cutting table for TC
11 Trimming Reduce extra thread from body
11 Not change helper Developed new thread cutting table for TC
H
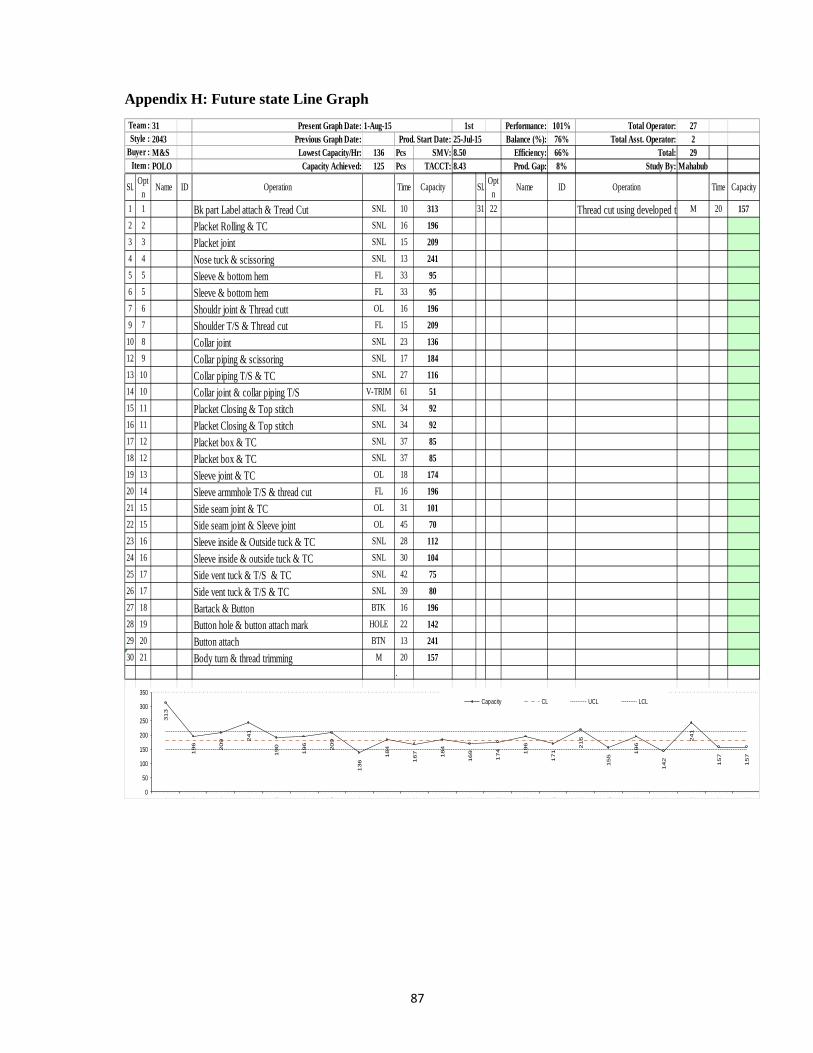
87
Appendix H: Future state Line Graph
31 Present Graph Date: Performance: 101% Total Operator: 272043 Previous Graph Date: Prod. Start Date: Balance (%): 76% Total Asst. Operator: 2M&S Lowest Capacity/Hr: 136 Pcs SMV: Efficiency: 66% Total: 29POLO Capacity Achieved: 125 Pcs TACCT: Prod. Gap: 8% Study By: Mahabub
Sl. Optn
Name ID Operation Time Capacity Sl. Optn
Name ID Operation Time Capacity
1 1 Bk part Label attach & Tread Cut SNL 10 313 31 22 Thread cut using developed th M 20 1572 2 Placket Rolling & TC SNL 16 1963 3 Placket joint SNL 15 2094 4 Nose tuck & scissoring SNL 13 2415 5 Sleeve & bottom hem FL 33 956 5 Sleeve & bottom hem FL 33 957 6 Shouldr joint & Thread cutt OL 16 1969 7 Shoulder T/S & Thread cut FL 15 209
10 8 Collar joint SNL 23 13612 9 Collar piping & scissoring SNL 17 18413 10 Collar piping T/S & TC SNL 27 11614 10 Collar joint & collar piping T/S V-TRIM 61 5115 11 Placket Closing & Top stitch SNL 34 9216 11 Placket Closing & Top stitch SNL 34 9217 12 Placket box & TC SNL 37 8518 12 Placket box & TC SNL 37 8519 13 Sleeve joint & TC OL 18 17420 14 Sleeve armmhole T/S & thread cut FL 16 19621 15 Side seam joint & TC OL 31 10122 15 Side seam joint & Sleeve joint OL 45 7023 16 Sleeve inside & Outside tuck & TC SNL 28 11224 16 Sleeve inside & outside tuck & TC SNL 30 10425 17 Side vent tuck & T/S & TC SNL 42 7526 17 Side vent tuck & T/S & TC SNL 39 8027 18 Bartack & Button BTK 16 19628 19 Button hole & button attach mark HOLE 22 14229 20 Button attach BTN 13 24130 21 Body turn & thread trimming M 20 157
.
Item : 8.43
Team : 1-Aug-15 1stStyle : 25-Jul-15
Buyer : 8.50313
196
209 2
41
190
196
209
136
184
167 184
169
174 196
171
216
155
196
142
241
157
157
0
50
100
150
200
250
300
350
1 2 3 4 5 6 7 8 9 10 11 12 13 14 15 16 17 18 19 20 21 22
Capacity CL UCL LCL
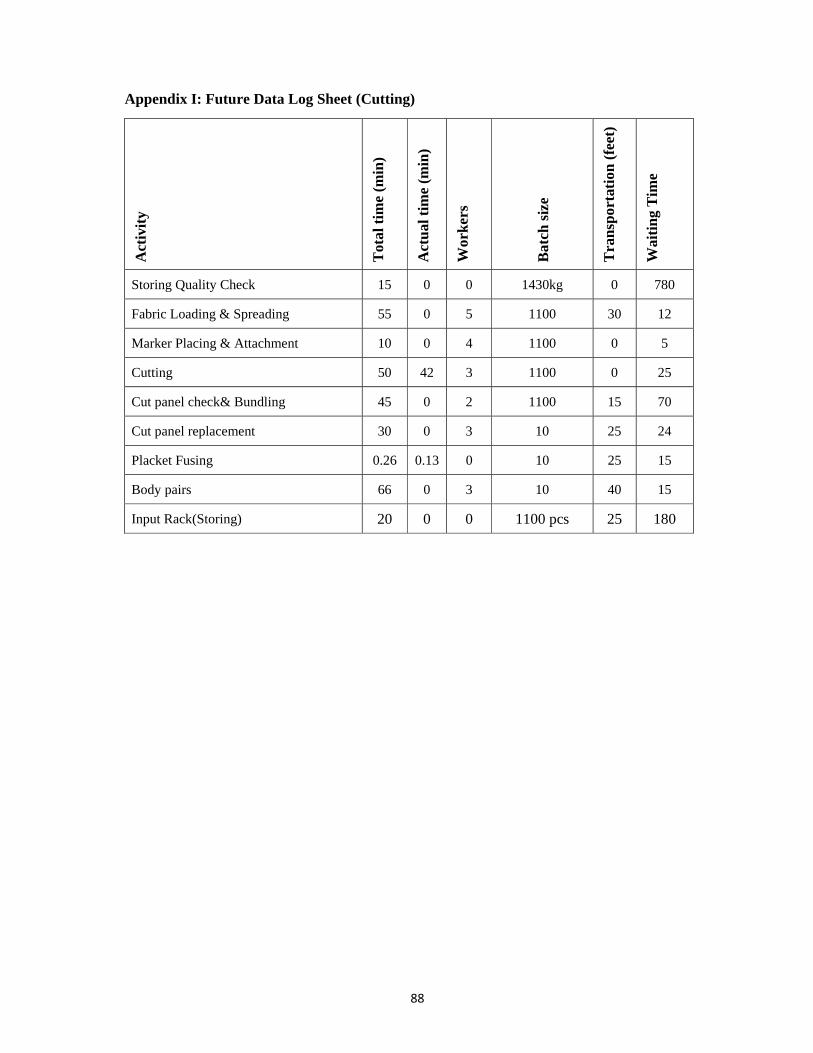
88
Appendix I: Future Data Log Sheet (Cutting)
Act
ivity
Tot
al ti
me
(min
)
Act
ual t
ime
(min
)
Wor
kers
Bat
ch si
ze
Tra
nspo
rtat
ion
(fee
t)
Wai
ting
Tim
e
Storing Quality Check 15 0 0 1430kg 0 780
Fabric Loading & Spreading 55 0 5 1100 30 12
Marker Placing & Attachment 10 0 4 1100 0 5
Cutting 50 42 3 1100 0 25
Cut panel check& Bundling 45 0 2 1100 15 70
Cut panel replacement 30 0 3 10 25 24
Placket Fusing 0.26 0.13 0 10 25 15
Body pairs 66 0 3 10 40 15
Input Rack(Storing) 20 0 0 1100 pcs 25 180

89
Appendix J: Future Data Log Sheet (Sewing)
Act
ivity
C/T
(min
)
Act
ual t
ime
(min
)
Wor
kers
Qua
ntity
Out
put
No
of A
ctiv
ities
Bat
ch si
ze (p
cs)
Up
time
Eff
icie
ncy
(%)
Cha
nge
Ove
r
Tra
nspo
rtat
ion
Def
ect
Wai
ting
Tim
e
Bake part Label attach & Tread Cut 0.22
0.05
1
1110
2
10
100%
0.51
0.00
2
1
0
Placket Rolling & TC 0.27 0.03 1 1100 2 10 100% 0.61 0.00 2 0 0 Placket joint 0.25 0.03 1 1110 1 10 100% 0.58 0.00 2 1 5
Nose tuck & scissoring 0.25 0.02 1 1115 2 10 100% 0.58 0.00 2 1 4
Sleeve & bottom hem 0.55 0.12 1 540 2 10 100% 0.62 0.00 2 2 8
Sleeve & bottom hem 0.61 0.12 1 510 2 10 100% 0.65 0.00 2 1 6 Should joint & Thread cut
0.28
0.02
1
1050
2
10
100%
0.62
0.00
2
0
10
Shoulder T/S & Thread cut
0.29
0.03
1
1060
2
10
100%
0.63
0.00
2
2
9
Collar joint 0.40 0.05 1 800 1 10 100% 0.67 0.00 2 2 6 Collar piping & scissoring
0.33
0.05
1
1070
2
10
100%
0.72
0.00
2
0
8
Collar piping T/S & TC 0.45 0.07 1 820 2 10 100% 0.77 0.32 2 1 6 Collar joint & collar piping T/S
1.01
0.12
1
380
2
10
100%
0.80
0.32
2
0
9
Placket Closing & Top stitch
0.57
0.10
1
520
2
10
100%
0.61
0.00
2
0
8
Placket Closing & Top stitch
0.49
0.10
1
580
2
10
100%
0.59
0.00
2
0
7
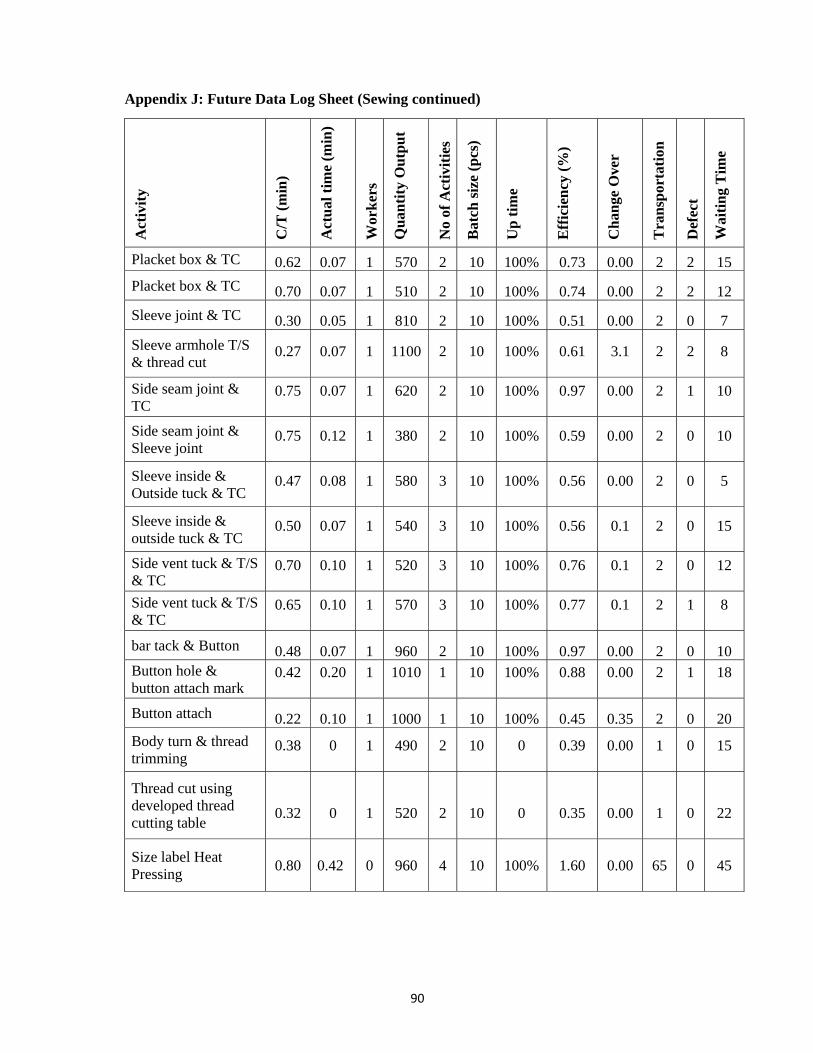
90
Appendix J: Future Data Log Sheet (Sewing continued)
Act
ivity
C/T
(min
)
Act
ual t
ime
(min
)
Wor
kers
Qua
ntity
Out
put
No
of A
ctiv
ities
Bat
ch si
ze (p
cs)
Up
time
Eff
icie
ncy
(%)
Cha
nge
Ove
r
Tra
nspo
rtat
ion
Def
ect
Wai
ting
Tim
e
Placket box & TC 0.62 0.07 1 570 2 10 100% 0.73 0.00 2 2 15 Placket box & TC 0.70 0.07 1 510 2 10 100% 0.74 0.00 2 2 12 Sleeve joint & TC 0.30 0.05 1 810 2 10 100% 0.51 0.00 2 0 7 Sleeve armhole T/S & thread cut
0.27
0.07
1
1100
2
10
100%
0.61
3.1
2
2
8
Side seam joint & TC
0.75
0.07
1
620
2
10
100%
0.97
0.00
2
1
10
Side seam joint & Sleeve joint
0.75
0.12
1
380
2
10
100%
0.59
0.00
2
0
10
Sleeve inside & Outside tuck & TC
0.47
0.08
1
580
3
10
100%
0.56
0.00
2
0
5
Sleeve inside & outside tuck & TC
0.50
0.07
1
540
3
10
100%
0.56
0.1
2
0
15
Side vent tuck & T/S & TC
0.70
0.10
1
520
3
10
100%
0.76
0.1
2
0
12
Side vent tuck & T/S & TC
0.65
0.10
1
570
3
10
100%
0.77
0.1
2
1
8
bar tack & Button 0.48 0.07 1 960 2 10 100% 0.97 0.00 2 0 10 Button hole & button attach mark
0.42
0.20
1
1010
1
10
100%
0.88
0.00
2
1
18
Button attach 0.22 0.10 1 1000 1 10 100% 0.45 0.35 2 0 20 Body turn & thread trimming
0.38
0
1
490
2
10
0
0.39
0.00
1
0
15
Thread cut using developed thread cutting table 0.32
0
1
520
2
10
0
0.35
0.00
1
0
22
Size label Heat Pressing
0.80
0.42
0
960
4
10
100%
1.60
0.00
65
0
45

91
Appendix K: Future Data Log Sheet (Finishing)
Act
ivity
C/T
(min
) A
ctua
l tim
e (m
in)
Wor
kers
Qua
ntity
Out
put
No.
of A
ctiv
ities
Bat
ch si
ze (p
cs)
Eff
icie
ncy
(%)
Cha
nge
Ove
r
Tra
nspo
rtat
ion
Def
ect
Wai
ting
Tim
e
Ironing 0.88 0 1 450 1 10 0.83 0 2 0 10
Ironing 0.77 0 1 530 1 10 0.85 0 2 0 15
Quality Check Top side & Measurement 0.63 0 1 400 1 10 0.53 0 2 0 18
Quality Check Top side & Measurement 0.53 0 1 420 1 10 0.46 0 2 0 11
Quality Check Top side & Measurement 0.4 0 1 430 1 10 0.36 0 2 0 10
Hang/Price tag and barcode attach on poly 0.45 0 1 970 2 5 0.91 0 2 0 15
Folding & Poly 0.52 0 1 520 2 5 0.56 0 3 0 9
Folding & Poly 0.57 0 1 450 2 5 0.43 0 30 0 25
Metal Pass 0.07 0.04 1 960 1 120 0.14 0 8 0 0
Cartooning 0.48 0 2 1000 1 10 1.00 0 0 0 10

92
Appendix L: Automation of Bundling System