Customer Service in Deregulating Electricity Service Industries
Upload
dinhnguyetCategory
view
216download
0
111 Sparks Street, Suite 500 Ottawa, Ontario K1P 5B5
613-233-8891, Fax 613-233-8250 [email protected]
Productivity Growth in Service Industries:
A Canadian Success Story
Someshwar Rao Industry Canada
Andrew Sharpe
Centre for the Study of Living Standards
Jianmin Tang Industry Canada
February 2004 CSLS Research Report 2004-01


Productivity Growth in Service Industries: A Canadian Success Story
TABLE OF CONTENTS Abstract ................................................................................................................... 5
Executive Summary ....................................................................................................... 6
I Introduction......................................................................................................... 8
Data Sources ................................................................................................... 9 Motivation of the Paper ................................................................................. 10 Organization of the Paper .............................................................................. 10
II. Comparison of Output and Employment Shares and Labour Productivity
Levels in the Canadian and U.S. Service Sectors ...................................... 11 Real Output .................................................................................................... 11 Employment....................................................................................................14 Labour Productivity Levels............................................................................ 15
III. Productivity Growth in Service Industries in Canada and the
United States................................................................................................. 19 IV. Sources of Real Output and Labour Productivity Growth in Canadian
and U.S. Service Industries ......................................................................... 22 Sources of Gross Output Growth in Canadian and
U.S. Service Industries............................................................................. 22 Sources of Labour Productivity Growth in Canadian and
U.S. Service Industries............................................................................. 25 V. Contributions of Services Industries to Business Sector Output and
Productivity Growth in Canada and the United States............................ 28 VI. Factors Accounting for the Relative Success of Service Sector
Productivity Growth in Canada ................................................................. 29 Post-1995 Acceleration of Productivity Growth in the Canadian
Service Industries..................................................................................... 29 Faster Productivity Growth in the Canadian Service Sector than its U.S.
Counterpart .............................................................................................. 30
VII. Conclusions ......................................................................................................... 33 References ....................................................................................................................... 35 Appendix: Data Sources and Measurement Issues ....................................................... 37 List of Exhibits, Tables and Figures..............................................................................39
Tables and Figures ..........................................................................................41


5
Abstract
The Canadian service sector has performed well in recent years in terms of labour and multifactor productivity growth, both in absolute terms and relative to the United States, offsetting much of the poorer performance of the manufacturing sector. Service sector labour productivity growth has also shown a marked acceleration in both Canada and the United States in recent years relative to earlier periods. The objective of this paper is to identify the factors behind this relative Canadian success story. The sources of the acceleration in service sector labour productivity growth were different in the two countries. In Canada, increased multifactor productivity growth was responsible for 70 per cent of the labour productivity growth acceleration. In the United States, on the other hand, increased capital intensity and intermediate input intensity were the most important contributors to the service sector labour productivity growth acceleration. In Canada, the contribution of capital intensity growth to service sector labour productivity growth actually fell between 1981-1995 and 1995-2000. The factor driving Canada’s superior service sector labour productivity growth has been better multifactor productivity growth, suggesting a productivity convergence to the U.S. level. A faster pace of human capital accumulation relative to the United States, as measured by growth in the proportion of workers with a university degree, fostered the catch-up process of Canadian service industries.

6
Executive Summary
The Canadian service sector has performed well in recent years in terms of labour and multifactor productivity growth, both in absolute terms and relative to the United States, offsetting much of the poorer performance of the manufacturing sector. Service sector labour productivity growth has also shown a marked acceleration in both Canada and the United States in recent years relative to earlier periods. The main objective of this paper is to provide an in-depth analysis of the output and productivity performance of service industries in Canada relative to other Canadian industries and their U.S. counterparts. The following are the key findings:
• Service industries account for over 70 per cent of total real GDP and over three quarters of total employment in Canada, and their importance is growing.
• Large inter-industry variation in the service sector labour productivity levels in Canada and the United States can be explained by traditional factors such as differences in capital-labour ratios and human capital.
• The inter-industry shifts in employment in the service sector between 1981-1995 and the second half of the 1990s exerted a downward pressure on aggregate service sector labour productivity growth in Canada. On the other hand, the employment shifts among service industries increased the aggregate service sector labour productivity growth in the United States.
• The Canadian service sector outperformed its U.S. counterpart during the period 1981-2000 and in the 1981-1995 and 1995-2000 sub-periods in terms of output growth and labour productivity growth. However, the labour productivity level in the Canadian service sector in 2000 was still about 15 per cent below the U.S. level.
• The service sector made the largest contribution to growth in business sector labour productivity and MFP in Canada during the 1981-1995 and 1995-2000 periods. In contrast, the manufacturing sector made the largest contribution to the business sector productivity performance in the United States.
• Canada’s superior labour productivity performance was largely due to much better growth in multifactor productivity (MFP), suggesting a productivity convergence to the U.S. level. A faster pace of human capital accumulation relative to the United States, as measured by growth in the proportion of workers with a university degree, fostered the catch-up process in Canadian service industries.
• Labour productivity growth in the service sector accelerated in both Canada and the United States in the latter half of the 1990s compared to the 1981-95 period by around 1 percentage point. Retail trade, other services, and business services were

7
the largest contributors to the productivity growth acceleration in both countries.
• The sources of the acceleration in labour productivity growth were different in the two countries. In Canada, increased MFP growth was responsible for close to 70 per cent of the labour productivity growth acceleration. The remaining acceleration was due to the increase in intermediate input intensity, while the capital contribution was significantly lower in the second half of the 1990s than in the first period. In the United States, on the other hand, capital accumulation and the intermediate input intensity were responsible for the service sector labour productivity growth acceleration in the latter half of the 1990s.
In short, to date the service sector has been a success story in terms of
productivity growth. However, to further close the remaining Canada-U.S. service sector productivity gap, Canadian service industries need to make significant progress in narrowing the human and physical capital intensity gaps. They also need to catch-up to their U.S. counterparts in R&D intensity and the share of ICT capital in total capital.

8
Productivity Growth in Service Industries: A Canadian Success Story
I. Introduction1
Canada's productivity and real income increased at a considerably slower pace in the post-1973 period compared to the 1946-73 period. In addition, Canada has lagged behind the United States in terms of aggregate labour productivity growth in the 1990s, particularly when measured in terms of the business sector. 2 As a result, the U.S.-Canada productivity gap increased in the last decade. There is a general consensus that trend labour productivity growth increased significantly in both Canada and the United States in the second half of the 1990s. Given that factors of production and innovation activities are becoming increasingly footloose, it is important that Canada improves its relative productivity performance vis-à-vis its southern neighbour. Otherwise, because of a falling relative standard of living it may be difficult to attract and retain capital, skilled workers and higher value added activities to Canada. This could set in motion a vicious cycle of net out-migration of those internationally mobile resources and weak economic growth. Therefore, it is important to better understand productivity trends in Canada and the United States.
To date, a disproportionate portion of productivity research in Canada has focused on manufacturing industries, partly because of the availability of good quality data on output and inputs in manufacturing and partly because of the dominant role of manufactured products in international trade. Service sector productivity has been neglected, as the quality of data for many service industries is poor and because many services are non-traded and less subject to international competitive pressures.
But service industries account for more than 70 per cent of real GDP and
employment in Canada and their importance is growing. This means that it is productivity trends in the service sector, not manufacturing, that are the driving force behind aggregate productivity growth and hence real income growth. In addition, service exports, especially commercial services, are increasing at a healthy pace. Furthermore, the interdependence between manufacturing and service industries has been increasing steadily. Hence, productivity improvements in service industries can be crucial for improving the competitive position of Canadian manufacturing industries. Therefore, it is
1 This paper was presented at the Industry Canada Conference on Service Industries and the Knowledge-based Economy, Winnipeg, Manitoba, October 16-18, 2003. It is a preliminary paper and comments are welcome. We would like to thank Richard G. Harris for very useful comments on the paper and Renée St-Jacques for comments and support. We would also like to thank Jeremy Smith for research assistance. 2 From 1989 to 2002, business sector output per hour advanced at a 2.2 per cent average annual rate in the United States versus 1.7 per cent in Canada. Total economy output per hour grew at a 1.8 per cent average annual rate in the United States and a 1.5 per cent average annual rate in Canada over the same period. For a detailed recent discussion of aggregate labour productivity trends in Canada and the United States since 1987, see Smith (2004).

9
important to do an in-depth analysis of productivity trends in Canadian service industries. The goal of this paper is to do precisely that. The main objectives of the paper are:
• to analyze output and employment growth in Canadian service industries, with a comparison to the United States;
• to compare and contrast the productivity performance of Canadian service
industries with that of manufacturing and primary industries; • to examine the role of inter-industry shifts in service industries on aggregate
service sector productivity growth; • to compare and contrast the output and productivity performance of Canadian
service industries with that of their U.S. counterparts over the past two decades; and
• to analyze possible reasons for relatively strong productivity performance in
Canadian service industries. Data Sources
The paper uses two major sources of data. The first source of data is the productivity database maintained by the Centre for the Study of Living Standards (CSLS) which is based on input and output data from Statistics Canada, covering the period 1987-2002. A similar database for the United States has also been constructed based on data from the U.S. Bureau of Economic Analysis, covering the period 1987-2001.
The second is a data set constructed as part of a joint project between Industry
Canada, Statistics Canada, and Harvard University directed by Dale Jorgenson of Harvard University that focused on the impact of information and communications technologies (ICTs) on productivity growth (Ho, Rao and Tang, 2003). This project developed comparable KLEMS (capital, labour, energy, materials and services) estimates for both Canada and the United States for 40 industries for the 1981-2000 period and used this database to examine the sources of economic and productivity growth in the two countries. The appendix discusses some technical details of this database.
There are a number of differences between the two databases. First, the first data
set is based on the North American Industry Classification System (NAICS) for Canada and the Standard Industrial Classification (SIC) for the United States, while the second uses the SIC for both countries. Second, the first uses a value added approach for the estimates of output and labour productivity while the second uses a gross output framework for the calculation of labour and multifactor or total factor productivity estimates.

10
Motivation of the Paper The performance of the Canadian service sector has been strong in recent years. Output and labour productivity growth picked up significantly in the second half of the 1990s relative to the 1981-95 period. The Canadian service sector has outperformed the U.S. service sector in terms of output, labour productivity, and multifactor productivity in both the 1981-95 and 1995-2000 periods. In terms of the 1995-2000 period, this situation is not well known or recognized because of the superior productivity performance of the U.S. economy at the aggregate level. It has been the very strong productivity performance in the U.S. goods sector, particularly manufacturing, not services that accounts for the overall superior U.S. business sector productivity performance.
The key research question motivating this paper is hence why has the Canadian
service sector performed so well in terms of labour and multifactor productivity in recent years, both in absolute terms and relative to the United States, offsetting much of the poorer performance of the manufacturing sector (Bernstein, Harris and Sharpe, 2002). Possible explanations include technological convergence toward the best practise country, that is the United States; greater accumulation of human capital; greater competition in service industries; employment shifts to high productivity level industries; and more effective use of ICTs, among others. Organization of Paper
The paper consists of seven sections. The second section looks at output and employment shares and labour productivity levels in the Canadian and U.S. service industries. The third section examines productivity trends in service industries in Canada and the United States, and the impact of inter-industry employment shifts on aggregate service sector productivity growth. The fourth section, based on data from the Jorgenson project on ICT (Ho, Rao and Tang, 2003), examines the sources of output and labour productivity growth in service industries in Canada and the United States in the 1981-1995 and 1995-2000 periods. The fifth section, also based on data from the Jorgenson project, analyzes the absolute contribution of service industries to aggregate output, labour productivity and multifactor productivity growth in Canada and the United States, again in the 1981-1995 and 1995-2000 periods. The sixth section examines the factors that account for the relative successful productivity performance of the Canadian service sector, both in terms of its acceleration in productivity growth relative to the pre-1995 period and its higher productivity growth than its U.S. counterpart since 1981. The final section concludes.

11
II. Comparison of Output and Employment Shares and Labour Productivity Levels in the Canadian and U.S. Service Sectors
Before beginning discussion of service sector trends it is useful to present a
number of caveats that the reader should bear in mind. First, the service sector is a very heterogeneous category responsible for the lion’s share of the economy’s output and employment. It encompasses all non-goods producing industries. Consequently, the characteristics of the different industries that comprise the service sector are very diverse, some well above the overall sector average, some well below. This means that the usefulness of the service sector as a frame of reference for productivity analysis or as an analytical category in general may be limited. From the point of view of productivity analysis, it may be more useful to focus at the industry level.
Second, two definitions of services are often used and it is important not to
confuse them. The first is the service sector broadly defined, which includes all service-producing industries. The second is a narrow definition of services that under the SIC definition included what were called business, community and personal services (including health and education). This industry is sometimes referred to as “services”. In this paper the broad definition of services is used.
Third, productivity measurement problems are generally recognized as severe in
services producing industries, reflecting the non-marketed nature of output in the non-business services (public administration, and most of health and education in Canada), difficulties in the conceptual definition of output in certain industries such as insurance and banking, and difficulties in capturing quality changes (both improvements and deteriorations) in certain sectors. Real Output Canada According to official GDP estimates produced by Statistics Canada, the service sector, as defined as the sum of all industries excluding primary industries, manufacturing and construction, is by far the largest sector in the Canadian economy. On a NAICS basis, the service sector in 2001 accounted for 70.8 per cent of total real (1997$) output, compared to 18.0 per cent for the manufacturing sector, 5.9 per cent for primary industries, and 5.4 per cent for the construction sector (Table 1). There has been a slight upward trend over time in the importance of the service sector in total output. In 1987, it accounted for 69.4 per cent of GDP, more than one percentage point less than the level in 2001.
Within the service sector, the finance, insurance, real estate and leasing and management industry (FIRE) was the most important, accounting for 28.0 per cent of the
12
service sector and 19.8 per cent of Canadian real GDP.3 All the other service sector industries shares of total economy GDP ranged between one and five per cent. United States According to SIC data from the U.S. Bureau of Economic Analysis, the service sector accounted for almost four fifths (77.3 per cent) of total economy GDP in the United States in 2001, up from 75.1 per cent in 1987 (Table 2). In comparison, manufacturing real output represented 15.8 per cent of total GDP, while construction and primary industries (agriculture, forestry and fisheries, and mining) represented 4.0 per cent and 2.9 per cent of GDP respectively. As was the case in Canada, FIRE accounted for the largest share of the service sector in terms of real output with 19.6 per cent of total economy output, tying with the services industry. Health services and business services were the largest contributors to the output of the services industry, representing 5.3 and 4.9 per cent of total economy output respectively in 2001. Canada-United States Comparison The comparison between the Canadian and U.S. service sector is made difficult by the use of different classification systems and different aggregation conventions in the two countries. Statistics Canada uses the new North American Industrial Classification System (NAICS) while the U.S. statistical agencies have not fully converted to NAICS and are still mostly using the Standard Industrial Classification (SIC) system, which was superceded in Canada in 2000.4 It is nevertheless possible to compare roughly the relative sizes of the different service industries. The U.S. service sector is composed of six industries, with 3 sub-industries under the transportation and public utilities industry and 14 sub-industries under the catchall services industry. The Canadian service sector is the sum of 14 industries. To make comparisons possible, some industries have to be aggregated. By adding the real output shares of utilities and transportation and warehousing in Canada, we obtain a share of 7.4 per cent in 2001, which is comparable in magnitude to the 8.3 per cent share of the U.S. transportation and public utilities industry.
A similar procedure can be used to compare the real output shares of public administration. The U.S. SIC does not have a public administration industry. It is rather called government, and it is much larger than the Canadian public administration industry (11.8 per cent of total GDP versus 5.7 per cent in 2001). This may be due to different treatment of public goods provided by the state, namely healthcare, social assistance and education. These account for a large proportion of government expenditure in Canada, yet these activities are counted in the individual health care and social assistance, and 3 Included in FIRE is imputed rent of owner occupied dwellings and resource royalties, which account for 60 per cent of FIRE output but for which no employment is associated. Consequently, the employment share of FIRE is much smaller than the output share. 4 The Bureau of Labor Statistics mostly completed the transition to NAICS in 2003. The Bureau of Economic Analysis, the source for the data used in this paper, will not release data based on NAICS until its June 2004 GDP by industry release.

13
education services industries. Presumably these two industries include both private and public activities, although the former category is likely to be very small relative to the latter. In the United States, the government industry includes all activities of general government and government enterprises, and it appears that the social services, educational services and health services sub-industries of the services industry include only privately funded activities. It is therefore possible to sum the output shares of government, social services, educational services and health services in the United States and public administration, education services and healthcare and social assistance in Canada to determine the proportion of government and all private and public health, education and social services in total economy output. This share was 16.2 per cent in Canada and 18.4 per cent in the United States in 2001.5
Although they have the same names, the trade industries in the two countries have very different relative importance in terms of real output shares. Retail trade has almost twice the importance in the United States as it has in Canada (10.1 per cent compared to 5.5 per cent in 2001). Wholesale trade is also much larger in the United States, with a real output share of 8.0 per cent of total GDP compared to 5.8 per cent in Canada in 2001. However, two factors complicate these comparisons. First of all, food services are included in the U.S. retail trade industry but in the Canadian accommodation and food services industry. And second, the traditional distinction between wholesale and retail activities has been blurred in recent decades by the increasing tendency for single vertically integrated firms to have activities in both sectors. This blurring may mean that it is difficult for statistical agencies in the two countries to define activities as taking place within the retail or wholesale sectors in the same way. A more comparable comparison of the relative importance of business service industries output in the aggregate (business) economy between Canada and the United States is from the Jorgenson project database (Table 3). An attempt has been made to make definitions comparable for business sector industries.6 It shows major differences in importance for certain sectors, although these differences to a large degree reflect differences in the business/non-business mix in industry activity between countries. The most important is health services which in 2000 accounted for 14.5 per cent of business sector value added in the United States compared to only 3.2 per cent in Canada. Indeed, this difference accounts for the significantly greater size of the service sector in the U.S. business sector relative to the business sector in Canada (69.0 per cent versus 61.2 per cent in 2000). Given the slow productivity growth in this sector, this much greater weight of health services produces a downward bias on productivity growth in the U.S. business sector relative to that in Canada. FIRE is also more important in the United States than in Canada: 16.6 per cent of business sector value added versus 14.2 per cent in 2000. In
5 A brief note of caution is called for in adding the real output shares of U.S. industries. These real output shares are based on output data expressed in chained dollars, which are not additive. Therefore, when real output shares are added for U.S. industries the result is not expected to be as accurate as the individual shares. In Canada the GDP by industry data have only recently become available in chained dollars and only as far back as 1997 thus far. Therefore, the data used in this paper are based on fixed-weight dollars that are additive. 6 The appendix discusses the technical details and comparability of these data.

14
contrast, transportation is more important in Canada (6.2 per cent versus 3.3 per cent in 2000) as is other services (7.7 per cent versus 4.9 per cent). Employment Canada Employment in the Canadian service sector represented 75.2 per cent of all jobs in Canada in 2001, up from 71.2 per cent in 1987 (Table 1). The second most important major sector was manufacturing, with 15.1 per cent of jobs. The construction and primary sectors accounted for 5.6 and 4.1 per cent respectively of jobs in Canada. The retail trade industry was the largest employer within the service sector in 2001 with 16.1 per cent of the sector’s employment, or 12.1 per cent of all jobs in Canada. Health care and social assistance was the second largest employer in the sector with 10.2 per cent of all jobs. Utilities industries, although they accounted for 2.7 per cent of Canadian GDP in 2001, were the smallest employers with 0.8 per cent of all Canadian jobs. United States The U.S. service sector was by far the largest employer in the United States in 2001 with a share of total employment of 79.4 per cent, considerably above the Canadian share of 75.2 per cent (Table 2). This share was up from 75.0 per cent in 1987. The manufacturing sector was the second largest employer with 12.1 per cent of all jobs, followed by construction (5.7 per cent) and primary industries (2.8 per cent). The catchall services industry represented 31.2 per cent of jobs. Health services was the most important component of the services industry, representing 7.5 per cent of total economy employment in 2001, followed by business services (7.0 per cent). Retail trade was the second largest employer, accounting for 17.0 per cent of all jobs. The smallest employment share of the six major service industries was in wholesale trade with 4.7 per cent of all jobs. Canada-United States Comparison Although the Canadian and U.S. service sectors both account for 75-80 per cent of total employment in both countries, the distribution among service sector industries differs in the two countries. The most notable difference is in the retail trade industry. In 2001, 17.0 per cent of the U.S. employed worked in that industry compared to only 12.1 per cent in Canada. However, this is probably mostly due to a definitional difference: restaurants are included in retail trade in the United States but in accommodation and food services in Canada. The transportation and utilities (the sum of transportation and warehousing and utilities in Canada) industry on the other hand, employs relatively more persons in Canada than in the United States. This industry accounted for 5.1 per cent of all jobs in the United States in 2001 compared to 6.0 per cent in Canada. The Canadian FIRE industry employs relatively more persons than its U.S. counterpart, 5.8 per cent of all employed versus 5.7 per cent in the United States. The wholesale trade industry was

15
larger in the United States, with 3.7 per cent and 4.7 per cent of all workers employed in the industry in Canada and the United States respectively. The U.S. government industry is larger than its Canadian public administration counterpart. Its employment share in 2001 was 15.7 per cent, compared to 5.1 per cent in Canada. This large discrepancy is probably the result of different industry definitions in the two countries, as discussed briefly above. Labour Productivity Levels Canada While being the largest sector both in terms of real output and employment, the service sector has slightly below average labour productivity (real output per worker). In 2001, the average worker in the service sector produced 94.2 per cent of the real output of the average worker in the economy as a whole (Table 1). This was the lowest relative productivity level at the four sector level, with the construction sector only slightly ahead at 95.7 per cent of the total economy output per worker level. In comparison, labour productivity was higher in manufacturing at 119.1 per cent of the total economy average, and much higher in primary industries, at 142.9 per cent of the total economy average.
Two service industries had labour productivity levels three times higher than the total economy average in 2001. The utilities industry, with a GDP share of 2.7 per cent and an employment share of 0.8 per cent, had a relative labour productivity level of 335.4 per cent of the total economy average. Just slightly ahead, the FIRE industry had a 341.3 per cent relative productivity level. At the other end of the spectrum, labour productivity was significantly lower in the accommodation and food services industry, at 37.0 per cent of the total economy average. Table 4 also provides estimates of labour productivity levels (defined as gross output per hour worked) for service industries relative to the all business industries average in Canada in 1981, 1995 and 2000 based on data from the Jorgenson project. In contrast to the relative levels based on value added, service industries tended to have much lower relative levels than goods industries when output is defined in terms of gross output. The average relative level for the total service industry in 2000 was only 60.0 per cent of the average for the business sector, compared to 107.4 per cent for primary industries and 162.1 per cent for manufacturing. In other words, the level of labour productivity in manufacturing was nearly three times greater (2.7 to be precise) than that in the service sector. The difference between the gross output and GDP based measures of relative labour productivity levels across countries are largely due to differences in the intermediate input intensity among industries. For example, the intermediate input intensity in the manufacturing sector in 2000 was almost five times that in the service sector (Table 5). It should be noted that labour productivity level comparisons across industries are more meaningful when based on value added per worker than on gross output per worker because of this difference in the intensity of intermediate input use.

16
Within the service sector there was large variation in relative productivity levels. Certain service sectors had well above average levels, including electric utilities (244.6 per cent of the business sector average), gas utilities (172.2 per cent), communications (161.7 per cent), and FIRE (143.7 per cent). On the other hand, a number of industries had well below average, including retail trade (34.2 per cent), other services (40.1 per cent), health services (41.1 per cent), business services (48.8 per cent), and private education (49.6 per cent). Much of the industry variation in relative labour productivity levels can be explained by industry differences in the degree of capital intensity (Table 4). Rates of return on capital tend toward equalization across industries. Consequently, output per worker must be greater in capital intensive than in non-capital intensive industries to provide a competitive return on the greater amount of capital invested in the industry. It is no surprise that electric utilities, the most capital-intensive industry, has the highest productivity level. Indeed, in 2000, the correlation coefficient between labour productivity based on gross output and capital intensity levels was a high 0.88.7 United States
The relative productivity level of the service sector was similar in the United States to that of Canada. The service sector had slightly below average labour productivity, 97.4 per cent of the total economy level in 2001 (Table 2). The manufacturing sector was the most productive with a relative labour productivity level of 130.6 per cent, followed by the primary sector (103.3 per cent). Labour productivity was below average in the construction sector (69.7 per cent). Across the six major industries of the service sector, FIRE had by far the highest level of labour productivity at 344.2 per cent of the total economy average. The retail trade industry had the lowest level of labour productivity in 2001 (59.4 per cent).
Table 4 provides estimates of labour productivity levels (defined as gross output per hour worked) for service industries relative to the average for the business sector in the United States in 1981, 1995 and 2000 based on data from the Jorgenson project. In contrast to the relative productivity levels based on value added, service industries tended to have much lower relative levels than goods industries. The average relative level for
7 There is also a relationship between capital intensity and relative wages, with the most capital-intensive industries tending to have the highest relative wages. Average hourly labour compensation in the Canadian service sector in 2000 was 4.2 per cent higher than the business sector average (Table 6). Average hourly labour compensation was higher in manufacturing, representing 112.4 per cent of the average. The construction sector had only 97.5 per cent of the average hourly labour compensation of the business sector, and the primary sector only 85.9 per cent. Average hourly labour compensation in the service sector aggregate slightly decreased relative to the business sector average between 1981 and 2000. Average hourly labour compensation was highest in FIRE (155.5 per cent of the average), health services (142.6 per cent) and electric utilities (136.6 per cent of the average). The service industries with the lowest average hourly labour compensation were other services (61.2 per cent of the average) and retail trade (67.0 per cent of the average). Three other service industries had average hourly labour compensation below the business sector average: gas utilities (99.4 per cent), business services (96.3 per cent) and transportation (94.8 per cent).

17
the total service sector in 2000 was only 71.4 per cent of the average for the business sector (above the 60.0 per cent recorded in Canada), compared to 170.8 per cent for manufacturing. Once again as expected, the two measures of relative labour productivity are quite different across industries because of large differences in intermediate input intensities (Table 5).
Within the service sector there was again large variation in relative productivity levels (Table 4). Certain service industries had well above average levels, including electric utilities (382.9 per cent of the average for the business sector), gas utilities (362.4 per cent), communications (178.0 per cent), and FIRE (174.4 per cent). On the other hand, a number of industries had well below average levels, including retail trade (39.4 per cent), private education (43.7 per cent), health services (56.0 per cent), business services (56.5 per cent), and other services (59.9 per cent). Again, much of the industry variation in relative labour productivity levels can be explained by industry differences in the degree of capital intensity. The correlation coefficient between labour productivity and capital intensity levels by industry in the United States in 2000 was 0.93 (Table 4).8 Canada-United States Comparison a) Relative productivity levels within a country The fact that the U.S. service sector had slightly higher labour productivity than the Canadian service sector relative to the total economy (Tables 1 and 2) is not necessarily reflected in individual service industries. In the transportation and utilities industry, Canada had in 2001 a relative labour productivity level of 125.4 per cent compared to a 165.9 per cent level in the United States.9 The relative labour productivity level in FIRE was also higher in the United States in 2001. This industry’s labour productivity level represented 341.3 per cent of the total economy average in Canada and 355.1 per cent in the United States. The U.S. trade industries on the other hand, were relatively more productive than their Canadian counterparts in 2001. Wholesale trade industries’ relative productivity level was 165.8 per cent of the total economy average while it was 157.4 per cent in
8 A strong relationship between capital intensity and wages is also evident in the U.S. data. Table 6 shows that service sector average hourly labour compensation in 2000 in the United States was, like in Canada, slightly above the business sector average (106.5 per cent of the average). Average hourly labour compensation rose relative to the business sector average between 1981 and 2000 starting at 78.7 per cent of the average. Only manufacturing average hourly labour compensation was higher in 2000, at 132.9 per cent of the average. Average hourly labour compensation also increased relative to the business sector average in 10 out of the 11 service industries. The three U.S. service industries with the highest average hourly labour compensation in 2000 were electric utilities (237.5 per cent of the average), FIRE (159.4 per cent) and wholesale trade (128.7 per cent). Average hourly labour compensation was lowest in other services (54.7 per cent of the average), followed by retail trade (66.5 per cent of the average) and private education (76.7 per cent of the average). 9 The figure of 125.4 for Canada is obtained by dividing the sum of the output shares for transportation and warehousing and utilities by the sum of the employment shares for the same two industries.

18
Canada. Retail trade industries’ labour productivity level was well below average in both countries but it was relatively higher in the United States, at 59.6 per cent of the total economy average compared to 45.4 per cent in Canada. The remaining service industries had below average labour productivity levels, as is reflected by the services industry relative labour productivity level in the United States (65.8 per cent), and in all the other Canadian service industries not previously noted, with the exception of information and cultural industries. b) Relative productivity levels across countries
Comparison of labour productivity levels across countries cannot be made by converting productivity levels expressed in domestic currency into a common currency with the market exchange rate. Purchasing power parity (PPP) exchange rates must be used. However, the GDP PPP is not appropriate as such a PPP may not equalize the price of goods produced in a particular industry across countries. Rather PPPs must be estimated on an industry basis, which is an onerous task. For this reason, there are few reliable estimates of labour productivity levels of Canadian service industries relative to comparable U.S. industries. Table 7 based on data from the Jorgenson project provides estimates of labour productivity levels (value added per hour worked) in 2000 for Canadian service industries relative to their U.S. counterparts. Those estimates are based on PPPs for the specific service industries. The average level of labour productivity in the total service sector in Canada in 2000 was 83.8 per cent of the U.S. level. The labour productivity level gap is consistent with lower levels of human capital, lower R&D intensity and the lower share of ICT capital in total capital in Canada (Tables 8, 9 and 10). This was a markedly superior performance to that of the manufacturing sector where the Canadian sector attained only 65.8 per cent of the U.S. level. However, it was an inferior performance to that of the primary industries (86.7 per cent of the U.S. level) and construction, an impressive 144.9 per cent of the U.S. level. Within the total service industry labour productivity levels in three Canadian industries exceeded their U.S. counterparts: private education (169.1 per cent of the U.S. level), communications (135.6 per cent), and gas utilities (115.0 per cent). Private health services had the same labour productivity level in both countries and that of retail trade was almost identical (98.9 per cent). On the other hand, the level of labour productivity in FIRE in Canada was only 63.9 per cent of the U.S. productivity level. It was 71.3 per cent for wholesale trade and 72.7 per cent for transportation.10 10 A study by Van Ark, Monnikhof and Mulder (1999) also provides some estimates of Canada-U.S. relative productivity levels in the service sector based on detailed industry PPPs. They find that in 1990 Canada had a level of value added per hour in the transport and communication sector of 74.1 per cent of the United States and in retail and wholesale trade 51.1 per cent. They also estimated productivity relatives of 75.4 per cent for manufacturing and 89.9 per cent for the total economy. This final figure and the much lower relative levels for the other three sectors would imply that certain service industries have relative labour productivity levels above the total economy average.

19
III. Productivity Growth in Service Industries in Canada and the United States11
In the 1981-1995 period, labour productivity growth in the Canadian business sector service sector, based on gross output and hours worked, was 1.4 per cent per year, below that of manufacturing (2.8 per cent) and primary industries (2.9 per cent), but superior to construction’s -0.4 per cent (Table 11). The U.S. business sector component of the service sector experienced even weaker productivity growth at a modest 0.7 per cent annual rate, also below that in manufacturing and primary industries, but better than in construction. Within the Canadian service sector, some industries did very well such as communications and wholesale trade, which had average annual labour productivity growth rates of 4.7 per cent and 3.1 per cent respectively in 1981-1995. But others of course, did poorly. The private education, health services and gas utilities industries suffered declines in labour productivity between 1981 and 1995, 4.8 per cent, 2.1 per cent and 0.8 per cent per year respectively.12
Exhibit 1
Labour Productivity Growth in Business Sector Service Industries in Canada and the United States, 1981-1995 and 1995-2000
1.37
2.29
0.70
1.92
0.0
0.5
1.0
1.5
2.0
2.5
1981-1995 1995-2000
CanadaUnited States
Source: Table 11. 11 Note that the data discussed from here onwards are from Ho, Rao and Tang (2003). These data refer only to the business sector and the business sector component of the primary, manufacturing, construction and service sectors. Hereafter, the term service sector is used to the business sector component of the service sector. 12 Note from Table 11 that several other service industries have displayed negative productivity growth in one or both of the periods examined and in one or both countries. This phenomenon is described in more detail in Sharpe, Rao and Tang (2002), and possible explanations are advanced as well. The explanations focus on measurement error. If the measured negative or near-zero labour productivity growth in the several service industries in Table 11 is indeed due to measurement error, this implies that the service sector would be even more of a success story in terms of productivity growth if the output of these industries were measured accurately.

20
Labour productivity growth in business sector service industries improved between 1995 and 2000 compared to the previous period in both Canada and the United States. In Canada, average annual growth increased to 2.3 per cent, an acceleration of 0.9 points over the 1981-1995 period (Table 11). This was now better than that experienced in manufacturing (2.0 per cent). Labour productivity growth in the U.S. service sector improved even more, 1.2 points to 1.9 per cent, but this advance was not sufficient to catch up to its Canadian counterpart (Exhibit 1). In Canada, the communications industry continued to experience the most rapid labour productivity growth (6.2 per cent), followed by private education (4.8 per cent) and retail trade (4.3 per cent). Health services continued to suffer a decline in labour productivity (-2.1 per cent).
Exhibit 2
Comparison of Productivity Growth in Business Sector Service Industries in Canada and the United States
Industries with
No. of Industries (out of 11) where Absolute Improvement Growth in Canada Exceeded U.S. between 81-95 and 95-00 ______________________________________________________________________
81-95 95-00 Chg. 95-00 to 81-95 Canada U.S. Labour Productivity 5 8 5 7 7 Multifactor Productivity 6 8 8 8 5 ______________________________________________________________________ Source: Table 11 for labour productivity and Table 18 for multifactor productivity. Exhibit 2 provides information on the number of business sector industries that experienced higher labour and multifactor productivity growth in Canada than in the United States in the 1981-95 and 1995-2000 periods and greater acceleration between periods as well as the number of service industries in each country that experienced an absolute improvement in productivity growth rates between periods. In terms of labour productivity, eight of 11 service industries experienced higher growth in Canada than in the United States in the 1995-2000 period, up from five in the 1981-95 period. This pattern was consistent with overall faster total service sector labour productivity growth. However, only five services industries had a larger improvement in labour productivity growth between the 1981-95 and 1995-2000 periods in Canada than in the United States. Seven service industries in both countries enjoyed an absolute improvement or acceleration in labour productivity growth between periods.

21
Canada did somewhat better relative to the United States in terms of multifactor
productivity. While the number of services industries that experienced faster multifactor productivity growth in Canada than in the United States was the same or slightly better in the 1981-1995 and 1995-2000 periods as for labour productivity growth (six and eight respectively), eight of out 11 service industries in Canada had a larger improvement in multifactor productivity growth between periods. Equally, eight Canadian service industries experienced faster multifactor productivity growth in the 1995-2000 period relative to the 1981-95 period, compared to only five in the United States.
Table 12 provides information on the contribution by industry to the labour productivity acceleration in the total business sector service sector in Canada and the United States between 1981-95 and 1995-2000. In Canada, the largest contribution to the acceleration came from retail trade, which accounted for 44.8 per cent of the acceleration, other services (43.4 per cent), business services (16.7 per cent), and FIRE (9.0 per cent). In the United States, the largest industry contribution to the service sector labour productivity acceleration was again by retail trade (44.3 per cent), followed by health services (25.7 per cent), business services (21.1 per cent), and other services (14.0 per cent). The difference in the labour productivity growth acceleration in the service sector between the two countries in the post-1995 period (0.3 points greater in the United States) was entirely due to the increased adverse impact of inter-industry shifts in hours among service industries on the aggregate service sector labour productivity growth in Canada (Table 13). The negative impact increased from -0.1 per cent during the 1981-1995 period to -0.4 per cent in the post-1995 period. On the other hand, in the United States, the negative impact of the employment shifts on aggregate service sector labour productivity growth was smaller in the latter half of the 1990s, compared to the 1981-1995 period. In other words, the Canada-U.S. productivity growth gap during the 1995-2000 period would have increased from 0.4 per cent to 0.6 per cent without the employment shifts.
22
IV. Sources of Real Output and Labour Productivity Growth in Canadian and U.S. Service Industries
Sources of Gross Output Growth in Canadian and U.S. Service Industries Table 14 shows the average annual growth rate of gross output, and the percentage point contributions to the growth rate from multifactor productivity (MFP), ICT and non-ICT capital, university and non-university labour, and intermediate goods for four major industry groupings in the business sector and 11 service industries in Canada and the United States over the 1981-95 period. Table 15 provides estimates for the 1995-2000 period. The contributions for capital, labour and intermediate goods are obtained by weighting the growth rate of each variable by its share of total income. MFP is obtained as a residual, being the difference between output growth and input growth. This procedure allows one to identify what each variable has contributed to gross output growth during a period, based on the assumptions of neoclassical growth accounting.13 These estimates have been developed as part of the Jorgenson project on the impact of ICT on productivity. The methodology for the estimates is developed in Ho, Rao and Tang (2003) and is described in the appendix of this paper.
The following section describes trends in service gross output and its sources in Canada and compares them to other major industries and to the United States service industry, for each period. Four major sectors are included: the service sector, construction, manufacturing, and primary industries. Eleven service industries are included: transportation, communications, electric utilities, gas utilities, wholesale trade, retail trade, FIRE, business services, health services, private education, and other services.
Service sector gross output grew at an average annual rate of 3.4 per cent between 1981 and 1995 in Canada (Table 14). This was above that for construction (-0.1 per cent), manufacturing (2.3 per cent) and primary industries (2.3 per cent). It was also slightly higher than the U.S. service industry growth rate of 3.3 per cent. Within the Canadian service industry, business services achieved the highest average annual gross output growth rate at 5.3 per cent, followed closely by communications (5.0 per cent), and wholesale trade (4.6 per cent). The weakest growth occurred in the private education industry (1.8 per cent). Gross output growth was faster in Canada than in the United States in only 4 of 11 service industries (communications, electric utilities, gas utilities, and wholesale trade) despite the overall faster total service sector growth. The largest difference between growth rates in the two countries was in the gas utilities industry, where gross output advanced 2.3 per cent per year in Canada, compared to a 3.7 per cent decline in the United States.
13 The key assumption is that the income share of a factor of production represents its marginal product and hence its contribution to output. Two conditions for this assumption to hold are that factor and product markets are competitive and constant returns to scale prevail.

23
Gross output growth was much stronger in the 1995-2000 period than in the 1981-1995 period in both Canada and the United States (Table 15). All four major industry sectors and nine of the 11 service industries experienced faster growth in both countries (the exceptions were electric utilities and gas utilities in Canada and transportation and wholesale trade in the United States). Gross output growth in Canada was again faster in the total service industry (5.8 per cent per year) than in the other three major sectors: manufacturing (5.3 per cent), construction (3.6 per cent), and primary industries (3.2 per cent). This was also the situation in the United States. The Canadian service sector continued to outpace the U.S. sector in 1995-2000, with the annual growth differential rising to 1.1 percentage points per year from only 0.1 points in 1981-95. Eight of 11 service sector industries experienced faster output growth in Canada than in the United States (the exceptions were communications, electric utilities and FIRE). The private education industry experienced massive output growth between 1995 and 2000 in Canada, with output rising 22.4 per cent per year. At the other end of the spectrum, electric utilities gross output only grew 0.7 per cent.
Growth in non-ICT capital made the largest contribution to gross output growth
between 1981 and 1995 in the Canadian service industry, excluding growth in intermediate inputs. Multifactor productivity (Table 14) played almost no role in gross output growth (0.1 percentage points). In the U.S. service industry, university labour growth and non-ICT capital growth made the largest contributions (0.6 points each). MFP growth in the United States had a negative impact of 0.2 per cent on gross output growth. Out of the 11 service sector industries that compose the business sector service industry aggregate in Canada, no variable systematically made the largest impact on output growth, but ICT capital had the smallest impact in six industries. MFP also had a negative impact on gross output growth in six service sector industries (Table 14). The largest was in the private education industry, where MFP reduced gross output by 2.7 percentage points per year.
Non-university labour growth contributed the most to gross output growth
between 1995 and 2000 in the Canadian service industry (0.9 points). Non-ICT capital growth on the other hand had the smallest impact (0.5 points). In the U.S. service industry ICT capital had the most important impact (0.9 points). The contribution of university labour varied greatly by industry. In three of the 11 Canadian service sector industries, it had the largest impact on growth of the four types of capital and labour growth while in six industries, it had the smallest impact. MFP growth (Table 15) picked up substantially in the 1995-2000 period to 0.7 per cent per year from 0.1 per cent in the 1981-1995 period and consequently made a negative contribution to gross output growth in only two industries (gas utilities (-1.0 points) and health services (-3.8 points)).

24
Exhibit 3
Sources of Gross Output Growth in the Business Sector Services Aggregate in Canada and the United States, 1981-95 and 1995-2000
(Average annual rate of change for gross output and MFP and percentage point contributions for inputs)
Canada United States
81-95 95-00 Chg. 81-95 95-00 Chg. Gross Output 3.36 5.75 2.39 3.30 4.63 1.33 MFP 0.09 0.73 0.64 -0.20 -0.16 0.04 Total Capital 0.92 0.95 0.03 1.06 1.53 0.47 ICT Capital 0.33 0.50 0.17 0.46 0.88 0.42 Non-ICT Capital 0.59 0.45 -0.14 0.60 0.65 0.05 Total Labour 1.04 1.63 0.59 1.15 1.20 0.05 University Labour 0.48 0.76 0.28 0.61 0.68 0.07 Non-University Labour 0.56 0.87 0.31 0.54 0.52 -0.02 Intermediate Goods 1.31 2.44 1.13 1.29 2.06 0.77 ________________________________________________________________________ Source: Tables 14 and 15
The key features of the sources of real output growth in the total service industry
in Canada and the United States over the past two decades (Exhibit 3) are highlighted below.
• Output growth in the service industry was much faster in Canada in the 1995-2000 period than in the 1981-95 period: 5.8 per cent per year versus 3.7 per cent.
• Output growth was slightly stronger in Canada than in the United States in the
1981-1995 period and considerably stronger in the 1995-2000 period. • Multifactor productivity growth was also much faster in Canada in the 1995-2000
period than in 1981-95: 0.7 per cent per year versus 0.1 per cent. • Multifactor productivity growth was slightly stronger in Canada than in the
United States in the 1981-1995 period and considerably stronger (0.9 percentage points per year) in the 1995-2000 period.

25
• The contributions of ICT capital, university labour and non-university labour to output growth were all greater in Canada in the 1995-2000 period than in 1981-1995. The contribution of non-ICT capital however was less.
• The contribution of ICT capital to service sector output growth was greater in the
United States than in Canada in both periods, with the differences 0.4 points greater in the 1995-2000 period. The contribution of this factor was greater in the more recent period in both countries.
Sources of Labour Productivity Growth in Canadian and U.S. Industries In the same manner that gross output growth was decomposed using growth accounting assumptions to reflect the contribution of growth in inputs and MFP, labour productivity can be decomposed into the contribution of MFP and the changes in the intensity of the four types of capital and labour input use. Capital intensity is defined as the ratio of capital to labour input. Labour intensity is defined as the ratio of labour input, which includes adjustment for greater labour quality (i.e. differences in experience based on gender and age groups, and more educated workers) to actual hours worked unadjusted for quality. The percentage point contributions are presented for four major industry groupings and 11 service industries for Canada and the United States in Tables 16 and 17 for the 1981-1995 and 1995-2000 periods respectively.14
The most important contribution to labour productivity growth in the Canadian service industry between 1981 and 1995 was made by intermediate input intensity growth (0.6 points), while the smallest were made by MFP (0.1 per cent) and non-university labour intensity (-0.1 points). In the American service industry, ICT capital intensity
14 The service sector is the least intensive of the four major sector groupings in intermediate inputs. This is not surprising since services do not involve much material transformation. In 2000, intermediate input intensity in the Canadian service sector was 42.5 per cent of the business sector average, compared to 75.2 per cent in construction, 85.0 per cent in primary industries and 197.3 per cent in manufacturing (Table 5). The U.S. service industry was also well below the average in intermediate input intensity at 51.8 per cent of the average. Intermediate input intensity was fairly constant relative to the average between 1981 and 2000 but this was not the case in each individual service industry. The three most intermediate input intensive service industries in Canada in 2000 were FIRE at 112.0 per cent of the average, followed by electric utilities and communications industries with intensity levels equal to 95.6 per cent and 74.0 per cent of the average respectively. The least intermediate input intensive industries were health services, retail trade and private education with respective relative intensities of 18.7 per cent, 24.1 per cent and 26.7 per cent of the average. In the U.S. service industry, the most intermediate input intensive service industry in 2000 was gas utilities at 494.3 per cent of the average, followed by electric utilities and communications industries with relative intensities of 230.4 per cent and 157.1 per cent of the average. The U.S. utilities were much more intermediate input intensive than manufacturing, which seems strange. The least intermediate input intensive service industries were the same as in Canada. Retail trade had a relative intermediate input intensity of 29.8 per cent, while private education had a 34.9 per cent relative intensity. Business and health services industries had intermediate input intensity levels equal to 36.0 and 36.1 per cent of the average respectively.

26
growth made the most important contribution to labour productivity growth, while MFP made a contribution of -0.2 per cent. Intermediate input intensity growth contributed the most to labour productivity growth in the Canadian service industry during the 1995-2000 period. This statement was also true for three of the 11 service industries for the same period. And as for five of the 11 service industries, non-university labour intensity growth was the least important to labour productivity in the service industry aggregate. The story was quite similar in the U.S. service industry as intermediate input intensity and non-university labour intensity growth were respectively the largest and smallest contributors to labour productivity growth. MFP growth had an even larger negative impact on labour productivity growth in the health services industries during the 1995-2000 period than it did in the previous period as it reduced that industry’s labour productivity average annual growth rate by 3.8 percentage points per year. MFP also had a negative impact in the gas utilities industry by reducing labour productivity growth by almost one percentage point each year on average.
Exhibit 4
Sources of Labour Productivity Growth in the Business Sector Services Aggregate in Canada and the United States, 1981-95 and 1995-2000
(Average annual rate of change for gross output per hour and MFP and percentage point contributions for inputs)
Canada United States
81-95 95-00 Chg. 81-95 95-00 Chg. Labour Productivity 1.37 2.29 0.92 0.70 1.92 1.22 MFP 0.09 0.73 0.64 -0.20 -0.16 0.04 Total Capital Intensity 0.40 0.16 -0.28 0.48 0.91 0.43 ICT Capital Intensity 0.28 0.40 0.12 0.38 0.76 0.38 Non-ICT Capital Intensity 0.16 -0.24 -0.40 0.10 0.15 0.05 Total Labour Intensity 0.23 0.27 0.04 0.13 0.15 0.02 University Labour Intensity 0.32 0.36 0.04 0.23 0.23 0.00 Non-University Labour Intensity -0.09 -0.09 0.00 -0.10 -0.08 0.02 Intermediate Goods Intensity 0.61 1.13 0.52 0.29 1.03 0.74 ________________________________________________________________________ Source: Tables 16 and 17

27
The key characteristics of the sources of labour productivity growth in the business sector service sector in Canada and the United States over the past two decades (Exhibit 4) are highlighted below.
• Labour productivity growth in the service sector was much faster in Canada in the 1995-2000 period than in the 1981-95 period: 2.3 per cent per year versus 1.4 per cent, an acceleration of 0.9 percentage points.
• Labour productivity growth was considerably stronger in Canada than in the
United States in the 1981-1995 period (0.7 percentage points) and somewhat stronger in the 1995-2000 period (0.4 points).
• As noted under sources of output growth, multifactor productivity growth was
also much faster in Canada in the 1995-2000 period than in 1981-95: 0.7 per cent per year versus 0.1 per cent. Multifactor productivity growth was slightly stronger in Canada than in the United States in the 1981-1995 period and considerably stronger (0.9 percentage points per year) in the 1995-2000 period.
• The contribution to labour productivity growth from ICT capital (relative to
labour) was somewhat greater in the 1995-2000 period (0.4 points) than in the 1981-1995 period (0.3 points) in Canada. The contribution of non-ICT capital was less in the more recent period (-0.2 points versus 0.2 points). The contribution of university labour was in the 0.3-0.4 point range in both periods while that of non-university labour was -0.1 points in both periods.
• In the United States ICT capital contributed 0.8 points to labour productivity
growth in the 1995-2000 period, up from 0.4 points in the 1981-1995 period and accounted for 31 per cent of the acceleration in service sector labour productivity growth, compared to only 13 per cent in Canada. The contribution of the other three inputs was less than that of ICT capital and was virtually unchanged between periods.

28
V. Contributions of Services Industries to Business Sector Output and Productivity Growth in Canada and the United States15
In Canada and the United States, output growth defined in terms of value added in the service sector contributed by far the most of any sector to aggregate (business sector) value added growth in both the 1981-95 (Figure 1) and 1995-2000 periods (Figure 2). This is not surprising given the fact that it represented in 2001 61.2 per cent of value added and 66.3 per cent of hours worked in the business sector. Over the 1981-95 period, the three most important service industries in terms of their percentage point contribution to business sector output growth in Canada were FIRE, wholesale trade, and business services, and in the United States, FIRE, health services and wholesale trade. In the 1995-2000 period, business services had the largest impact in Canada, while FIRE and wholesale trade came second and third. In the United States, FIRE was still the most important contributor, followed by business services and health services. The service sector was again the most important contributor to aggregate labour productivity growth between 1981 and 1995 in Canada (Figure 3). This was, perhaps surprisingly given its large labour input share, not the case in the United States where manufacturing made the largest contribution to labour productivity growth. Very strong labour productivity growth in U.S. manufacturing accounts for this development.16 In both countries, wholesale trade and FIRE made the largest contributions to aggregate labour productivity among the service industries. Falling labour productivity in health services had a negative impact on aggregate labour productivity in both countries.
In the 1995-2000 period, the service sector continued to have the largest impact on aggregate labour productivity growth in Canada while manufacturing continued to be most important in the United States (see Figure 4). FIRE was the most important service industry in terms of impact on aggregate labour productivity growth in both countries, followed by retail trade. Health services again contributed negatively to aggregate labour productivity growth in Canada during the period.
There was a major difference in the contribution of the service sector to aggregate (business sector) multifactor productivity growth between Canada and the United States in both the 1981-95 and 1995-2000 periods. In the first period, the service sector made a relatively small positive contribution in Canada and a significant negative contribution in the United States given the negative MFP growth rate (Figure 5). Manufacturing was by far the most important contributor to aggregate MFP growth in both countries, although the contribution was twice as large in the United States. Primary industries also were
15 In Figures 1 through 6, the industry contributions to total business sector output and labour productivity growth are defined as the given industry’s output or productivity growth rate multiplied by its labour share, and are expressed in percentage points. 16 Tang and Wang (2004) have proposed a decomposition of an industry’s contribution to aggregate labour productivity growth into 1) that industry’s own labour productivity growth; 2) growth in the industry’s labour share; and 3) growth in the real price of that industry’s output. They find, based on this decomposition and in contrast to the results reported here, that the service sector was the most important contributor to aggregate labour productivity growth by several orders of magnitude in both Canada and the United States.

29
important in Canada. In terms of service industries, wholesale trade made a large positive contribution in both countries. Most service industries in both countries made negative contributions, with health services being particularly important in the United States. During the 1995-2000 period, the service sector in Canada made a much larger contribution to aggregate MFP growth than in the previous period (Figures 5 and 6). The contribution also greatly exceeded that of the manufacturing sector. In contrast, the service sector continued to make a negative contribution to MFP growth in the United States. Manufacturing continued to drive aggregate MFP growth. FIRE made the largest contribution to MFP growth among the service industries in Canada, closely followed by retail trade. In the United States retail trade made the most important contribution. Negative MFP growth in health services in both countries had the worst impact on aggregate MFP growth. VI. Factors Accounting for the Relative Success of Service Sector
Productivity Growth in Canada This paper has identified and documented two stylized facts or developments that have been used to argue that the productivity performance of the Canadian service sector since 1995 represents a relative success story, at least compared to the productivity performance of the Canadian manufacturing sector. The first development is the acceleration of labour and multifactor productivity growth in service industries in Canada in 1995-2000 relative to 1981-95, in contrast to a lack of acceleration in most of the goods producing sector. The second is the more rapid labour and multifactor productivity growth in the Canadian service sector than its U.S. counterpart in both the 1981-1995 and 1995-2000 periods. The objective of this section is to shed light on the factors behind these two developments. Post-1995 Acceleration of Productivity Growth in the Canadian Service Industries As shown earlier in the paper, labour productivity growth in the business sector service industries in Canada accelerated 0.9 percentage points per year from an average annual rate of 1.4 per cent in 1981-95 to 2.3 per cent in 1995-2000 (Table 11) and multifactor productivity growth accelerated 0.6 percentage points from 0.1 per cent to 0.7 per cent per year between the two periods (Table 18). In contrast, labour productivity growth fell in manufacturing from 2.8 per cent per year in the 1981-95 period to 2.0 per cent in 1995-2000, and labour productivity growth in construction rose only 0.7 points with growth of -0.44 per cent and 0.33 per cent per year in the respective periods. The primary sector showed a very strong acceleration in labour productivity growth between the two periods, of 2.3 percentage points from growth of 2.9 per cent to 5.2 per cent per year. However, given its small labour share, the primary sector is a small contributor to overall business sector labour productivity growth.

30
The total service sector labour productivity acceleration can be decomposed from both a sources of growth or growth accounting perspective and industry contribution perspective. In a gross output framework, the sources of growth approach include four components: changes in capital intensity, changes in labour quality (labour intensity), changes in the intensity of intermediate goods use, and multifactor productivity growth.
Exhibit 4 showed that 0.6 points, or 70 per cent, of the 0.9 point labour
productivity acceleration in the service sector in Canada in 1995-2000 relative to 1981-95 was accounted for by the acceleration in multifactor productivity growth. An additional 0.5 points can be explained by the increased intermediate goods intensity, although the interpretation of this development is problematic (a value added framework that excluded intermediate goods would be easier to interpret intuitively).
Greater capital intensity and improvements in labour quality in production were
not behind the acceleration. Improvements in labour quality made virtually no contribution to the service sector labour productivity growth acceleration. Overall, the pace of capital intensity growth was actually slower in the 1995-2000 period than in 1981-95 so capital intensity actually made a negative contribution of 0.3 points to the acceleration. This development was explained by a significant falloff in the rate of non-ICT capital intensity growth, with the contribution falling from 0.2 percentage points per year to -0.2 percentage points between periods. The pace of ICT capital intensity increased, with the contribution of this input increasing 0.1 points between periods from 0.3 to 0.4 points.
Table 12 shows that four service industries accounted for the lion’s share of the 0.9 point acceleration of labour productivity growth in the service sector between 1981-95 and 1995-2000. In order of importance they were retail trade, other services, business services and FIRE. Negative contributions to the acceleration were made by wholesale trade and transportation. Faster Productivity Growth in the Canadian Service Sector than its U.S. Counterpart A key finding of the paper is the faster labour and multifactor productivity growth recorded in the business sector service industries in Canada than in the United States (Tables 11 and 18). In the 1981-95 period labour productivity growth was 1.4 per cent per year in Canada versus 0.7 per cent in the United States while the figures for multifactor productivity growth were 0.1 per cent and -0.2 per cent respectively. In the 1995-2000 period average annual labour productivity growth was 2.3 per cent in Canada versus 1.9 per cent in the United States while the figures for multifactor productivity were 0.7 per cent versus -0.2 per cent. This situation lies in marked contrast to manufacturing where labour and multifactor productivity growth were greater in the United States than in Canada in both the 1981-95 and 1995-2000 periods (Tables 16 and 17). A key aspect of the strong labour productivity performance of the service sector in Canada in the post-1995 period has been that it was based on very strong multifactor

31
productivity growth and not on increased capital intensity. This has not been the case in the U.S. service sector where multifactor productivity growth has been negative and increased capital accumulation or capital intensity has accounted for nearly one half of productivity growth (Exhibit 4), with increased ICT capital intensity in turn responsible for the lion’s share of the greater overall capital intensity. As discussed in the third section of the paper, inter-industry employment shifts in the service sector had a downward effect on service sector labour productivity growth in Canada in the 1995-2000 period, while they had a positive effect in the United States. Thus these shifts cannot account for the superior productivity growth performance of the Canadian service sector relative to its U.S. counterpart. Indeed, Canada’s superior service sector labour productivity growth, when measured by the pure productivity effect, was even stronger than when measured by actual productivity growth that includes shift effects. A key explanation for the faster productivity growth in the Canadian service sector in the 1981-2000 period is the higher U.S. productivity level. This gap means that Canadian service industries had the possibility or potential to converge toward the U.S. level through technological catch-up, that is, adoption of best practice techniques used by the world leader, generally the United States. Table 7 shows that in 2000 the relative labour productivity of the Canadian service industry was 83.8 per cent of the U.S. level. Service sector labour productivity growth was 0.37 percentage points per year faster in Canada than in the United States in the 1995-2000 period and 0.67 points in the 1981-1995 period. This implies that the Canada/U.S. relative labour productivity level was 82.0 per cent in 1995 and 72.6 per cent in 1981. The greater gap in the 1981-95 period compared to the more recent period is consistent with the greater productivity growth rate differential in the first period. The larger the gap, the greater the potential for catch-up. Table 7 also shows relative labour productivity levels for specific service industries. There was some tendency for Canadian service industries whose relative labour productivity gap is greater than the total service sector average to have a larger positive labour productivity growth rate differential with their U.S. counterpart in the 1995-2000 period. Transportation, FIRE, and other services (72.7 per cent, 63.9 per cent, and 84.1 per cent respectively of the U.S. labour productivity level) conform to this pattern, while wholesale trade, at 71.3 per cent of the U.S. productivity level in 2000, experienced slower productivity growth than its U.S. counterpart.
On the other hand, the three Canadian service industries with relative labour productivity levels higher than their U.S. counterparts in 2000 (communications, gas utilities and private education) had labour productivity growth rate differentials with the United States greater than the overall service sector differential of 0.37 percentage points in 1995-2000. These faster growth rates cannot be accounted for by convergence. However, these industries are small and made only a small contribution to the overall superior productivity performance of the service sector.

32
In addition to technological convergence, another reason for the faster productivity growth in the Canadian service sector compared to the U.S. sector over the past two decades has been the catch-up in the educational attainment of workers in the Canadian service sector relative to their U.S. counterparts.17 To be sure, the proportion of university-educated workers in the total service industry has been and continues to be much higher in the United States, contributing to the Canada-U.S. service sector relative labour productivity gap of 16 per cent (in 2000). For example, in 2000, 30.3 per cent of employees in U.S. service industries had a university degree or above, compared to only 19.5 per cent in Canada (Table 9). But over the 1981-2000 period, the rate of growth in the proportion of university-trained workers advanced at a 2.4 per cent average annual rate in Canada compared to 1.7 per cent in the United States, reducing the gap in the proportion of university trained workers in the service sector between the countries from 12.1 points to 10.9 points.
In his comments on this paper, Richard Harris of Simon Fraser University has raised a third possible explanation for higher service sector productivity growth in Canada compared to the United States. It is possible that some low-productivity services incidental to manufacturing activities have been outsourced in the United States but not in Canada such that the statistical systems capture this low-productivity activity as taking place within the service sector in the United States but within the manufacturing sector within Canada. This would account for the difference between manufacturing and service productivity growth performance between the two countries: the low-productivity manufacturing-related services would be counted in the service sector in the United States, boosting manufacturing productivity growth and depressing service productivity growth; while the opposite would hold for Canada.
This implies that Canada’s service sector success relative to the United States and lagging manufacturing sector productivity growth may both be reversed if Canada begins to adopt the same outsourcing procedures as the United States. Unfortunately, this hypothesis cannot be adequately tested without a close examination of the way service activities are classified in both countries at a very detailed level. But this is an appealing explanation since it addresses both the manufacturing and service sector productivity growth gaps, and may prove to be correct if Canadian service sector productivity growth
17Since 1981, the percentage of persons employed with a university degree has been rising in the service sector aggregate in Canada as well as all the industries that compose it, with the exception of the health services industry (Table 9). The proportion of workers with a university degree was higher in business sector service industries than in the good producing sectors. In 2000, 19.5 per cent of service sector workers had this qualification, compared to 11.8 per cent in manufacturing, 9.2 per cent in primary industries, and 6.1 per cent in construction. In the United States in 2000, the proportion of workers with a university degree was higher than in Canada in all the industries, within and without the service industry. That proportion has also risen in all industries since 1981. The Canadian service industry with the highest proportion of workers with a university degree in 2000 was private education, with 53.7 per cent. Business services and health services industries came second and third with 42.5 per cent and 36.9 per cent of their workers with a university degree. The transportation industry came last with 7.2 per cent. In the United States in 2000, private education came first as well with 65.1 per cent of its workers having a university degree. Health services followed with 42.8 per cent and finance, insurance and real estate with 41.9 per cent. Retail trade had the lowest proportion of workers with a university degree with 15.4 per cent.

33
begins to fall towards that of the United States while manufacturing productivity growth begins to rise towards that in the United States in the next few years. VII. Conclusions
The objective of this paper has been to provide an in-depth analysis of output and productivity performance of service industries in Canada relative to other Canadian industries and their U.S. counterparts. The main conclusion is that the Canadian service sector has been a relative success story in terms of productivity growth. Both labour and multifactor productivity showed an impressive acceleration in growth between the 1981-1995 and 1995-2000 periods, and the acceleration would have been even greater had the relative labour shares of some lower productivity service industries not increased between these periods. Retail trade and business services were the largest contributors to this acceleration in labour productivity growth.
The performance of the U.S. service sector has been somewhat different. Service
sector labour productivity growth accelerated in the United States between 1981-1995 and 1995-2000 to a greater degree than in Canada, but Canada outperformed the United States in terms of service sector labour productivity growth in both periods. Service sector MFP growth in the United States was negative in both periods, with virtually no acceleration in growth between the two periods, in marked contrast to the Canadian experience.
The superior performance of the Canadian service sector in terms of labour
productivity growth relative to the U.S. service sector is in marked contrast to the dismal relative performance of Canada’s manufacturing sector, which has a large and widening labour productivity gap with the U.S. manufacturing sector. Despite Canada’s superior service sector productivity performance though, the level of service sector labour productivity in Canada in 2000 was still about 15 per cent below that in the United States.
The sources of the acceleration in service sector labour productivity growth were
different in the two countries. In Canada, increased MFP growth was responsible for 70 per cent of the labour productivity growth acceleration. In the United States, on the other hand, increased capital intensity and intermediate input intensity were the most important contributors to the service sector labour productivity growth acceleration. In Canada, the contribution of capital intensity growth to service sector labour productivity growth actually fell between 1981-1995 and 1995-2000.
In both the 1981-1995 and 1995-2000 periods the service sector was the most
important contributor to Canadian business sector labour productivity growth. In terms of business sector MFP growth, the service sector went from being only the third most important contributor in 1981-1995 – behind both manufacturing and the primary sector but ahead of construction – to being the most important contributor in the 1995-2000 period, with a contribution almost twice that of manufacturing.

34
The contribution of the service sector to U.S. business sector productivity growth has been smaller than has been the case for Canada. The largest contributor to both business sector labour and multifactor productivity growth in the United States was manufacturing in both the 1981-1995 and 1995-2000 periods. Although the service sector was the second most important contributor to U.S. business sector labour productivity growth in both periods – ahead of the primary and construction sectors – it made large negative contributions to business sector MFP growth, making it the least important contributor in both periods.
The factor driving Canada’s superior service sector labour productivity growth has been better MFP growth, suggesting a productivity convergence to the U.S. level. A faster pace of human capital accumulation relative to the United States, as measured by growth in the proportion of workers with a university degree, fostered the catch-up process of Canadian service industries. There are several areas in which further research is needed. The first is the extent to which the measured superior labour productivity growth of the Canadian service sector is due to a different organization of some production activities between the service and manufacturing sectors across Canada and the United States. Two other suggestions for future research include an extension to analysis at the provincial rather than strictly national level, and an investigation into any cyclical element to the post-1995 labour productivity growth acceleration in the Canadian service sector.18
The performance of the Canadian service sector in terms of productivity growth is a success story both relative to other Canadian industries and relative to the U.S. service sector. However, to further close the remaining Canada-U.S. service sector productivity gap, Canadian service industries need to make significant progress in narrowing the human and physical capital intensity gaps.19 They also need to catch-up to their U.S. counterparts in R&D intensity (Table 8) and the share of ICT capital in total capital (Table 10).
18 Another possible issue to address in future work on the Canadian service sector is how sensitive the conclusions reached thus far are to the particular growth accounting framework utilized. Most of the results discussed here are based on a KLEMS gross output framework, but the differences in the intensity of intermediate input use between Canada and the United States may suggest that some results are not completely comparable across the two countries. It would hence be interesting for future work to determine if these conclusions also hold with a value added definition of real output. 19 See Rao, Tang, and Wang (2002) for the skill gap, and Rao, Tang, and Wang (2003) for the investment gap.

35
References Bernstein, Jeffrey I., Richard G. Harris and Andrew Sharpe (2002) “Explaining the
Widening Canada-US Productivity Gap in Manufacturing”, International Productivity Monitor 5, (Fall) pp. 3-22.
Gu, Wulong, and Jean-Pierre Maynard, “The Changing Composition of the Canadian
Workforce, 1961-95,” in Industry-Level Productivity and International Competitiveness Between Canada and the United States. Edited by Dale W. Jorgenson and Frank C. Lee. Research Monograph, Ottawa: Industry Canada, 2001.
Harchaoui, Tarek, F. Tarkhani, C. Jackson and P. Armstrong, “A Comparison of Canada-
U.S. Economic Growth in the Information Age, 1981-2000: The Importance of Investment in Information and Communication Technologies,’’ Monthly Labor Review, October 2002, 31-47.
Ho, Mun, Someshwar Rao and Jianmin Tang (2003) “Sources of Output Growth in
Canadian and U.S. Industries in the Information Age,” paper presented at the annual meting of the Canadian Economics Association, Carleton University, Ottawa, Ontario, May 31-June 2, revised version June 20.
Jorgenson, Dale W., Mun S. Ho, and Kevin J. Stiroh, “Growth of U.S. Industries and
Investments in Information Technology and Higher Education.” Research Paper, Harvard University, 2002
Lee, Frank C. and Jianmin Tang, 2000, “Productivity Levels and International
Competitiveness Between Canadian and U.S. Industries,” American Economic Review 90, no. 2 (May): 176-79
Rao, Someshwar, Jianmin Tang, and Weimin Wang, 2002, “The Importance of Skills for
Innovation and Productivity,” International Productivity Monitor 4, (Spring) pp. 15-26.
Rao, Someshwar, Jianmin Tang, and Weimin Wang, 2003, “Canada’s Recent
Productivity Record and Capital Accumulation,” International Productivity Monitor 7, (Fall), forthcoming.
Sharpe, Andrew, Someshwar Rao and Jianmin Tang, 2002, “Perspectives on Negative
Productivity Growth in Service Sector Industries in Canada and the United States”, Paper presented at Workshop on Service Sector Productivity, May 17, 2002, Brookings Institution, Washington, D.C.
Smith, Jeremy (2004) “Aggregate Labour Productivity Growth in Canada and the United
States: Definitions, Trends and Measurement Issues,” International Productivity Monitor, forthcoming.

36
Tang, Jianmin and Weimin Wang, 2004, “Sources of Aggregate Labour Productivity Growth in Canada and the United States”, Canadian Journal of Economics (forthcoming).
Triplett, J., 2001, Handbook on Quality Adjustment of Price Indexes For Information and
Communication Technology Products, DSTI/EAS/IND/SWP(2001)12, OECD, Paris.
Van Ark, Bart, Erik Monnikhof and Nanno Mulder (1999) “Productivity in Services: an
international comparative perspective,” Canadian Journal of Economics, Volume 32, Number 2, pp, 471-499.

37
Appendix
Data Sources and Measurement Issues
This appendix is based on Ho, Rao and Tang (2003). The KLEMS data for the Canada and U.S. business sectors cover the 1981-2000 period. The business sector does not include imputed rents from owner-occupied dwellings or government. These data include volume indexes of gross output, capital services, labour services, intermediate inputs, the number of hours at work and cost in dollars of each of these inputs. The data source for the U.S. data is Jorgenson, Ho and Stiroh (2002). For their study, they have developed such a dataset for 44 industries, which are collapsed into 34 common industries using Tornqvist aggregation indexes. The Canadian data are obtained from the Canadian Productivity Accounts which produce and maintain a consistent set of detailed industry (122 industries) and aggregated data on inputs and outputs (current prices and chained Fisher indexes) for productivity measurement and related economic performance analysis.20 The 122 industries are aggregated into the 34 industries in the same fashion. The Canadian and U.S. data used in this study employ concepts and methods which accord with the OECD productivity manual, thereby making the comparison between the two countries reliable. Gross output and intermediate input values come from a time series of consistent input-output tables. The price indexes for output also are from Statistics Canada and are also used to construct prices of intermediate inputs. The input-output tables are generally recorded in a very similar fashion in Canada and the United States. Thus, output and intermediate inputs are fairly comparable. However, our construction of capital and labour inputs is more complicated and some elaboration is needed. Capital Input The capital stock for each type of asset is constructed from investment in constant dollars. The comparability of investment deflators is thus important for comparing capital input in the two countries. This is especially true for ICT assets (computer equipment, communications equipment, and software) which have become increasingly important in total machinery and equipment (M&E) investment.21 The investment price indexes for those assets diverge significantly across OECD countries due to different methodologies used in estimating the indexes.22 However, the methods used by Canada and the United States to develop the ICT price indexes are fairly similar. Statistical agencies in Canada and the United States have worked very closely and made extensive use of the hedonic regression technique and the matching model technique in estimating
20 The P-level has a total of 123 industries. The present study excludes owner-occupied dwellings (P116). 21 In 2000, ICT investment in Canada was $34 billion, representing 37 per cent of M&E investment, compared to less than $6 billion, or 19 per cent of the overall M&E investment, in 1981. Similar changes occurred in the United States. In 2000 ICT investment was US$424 billion (39 per cent of M&E), compared to US$62 billion (21 per cent) in 1981. 22 For instance, the fall in computer prices in European countries in the early 1990s ranged from 10 to 47 per cent (Triplett, 2001, p.4).

38
the prices of ICTs. A detailed documentation of the methodologies used to construct ICT price indexes is given in Ho, Rao, and Tang (2003). The capital stock for the United States is estimated from investment data in the Tangible Wealth Survey produced by the Bureau of Economic Analysis (BEA). For Canada, capital stock data are constructed from investment series by asset classes from input-output tables and depreciation rates based on age-price profiles (Harchaoui et al. 2002). There are 28 non-residential asset types in the Canadian classification, and 52 in the U.S. The capital stocks are estimated for all types of assets owned by each industry using the perpetual inventory method and geometric depreciation. On the basis of the translog index, capital stocks of different assets are then aggregated into capital input using user costs as weights, which accounts for difference in quality or marginal productivity of those assets. Labour Input
In our framework the labour input for each industry is not a simple sum of hours worked but a translog aggregate over different groups using labour compensation as weights. The labour force categories for the two countries are similar except for education.23 These include seven age groups, two sexes, two classes of employment and four (for Canada) or six (for the United States) educational attainment groups. Our experiments with the U.S. data show that the difference in education classification has only a small impact on the labour input estimates. A detailed description of the labour data development is given in Gu and Maynard (2000) for Canada, and Jorgenson, Ho and Stiroh (2002) for the United States.24
23 Note, however, that the educational classification is not entirely consistent over time in both countries. The educational classification in the Labour Force Survey changed in 1990 in Canada (Gu and Maynard, 2000). A similar change also took place in the U.S. Current Population Survey in 1992 and in the Census of Population in 1990 (Jorgenson, Ho and Stiroh, 2002). 24 Labour compensation for self-employed workers in an industry is imputed under the assumption that the hourly compensation is the same between paid and self-employed workers.

39
List of Exhibits, Tables and Figures Exhibits Exhibit 1: Labour Productivity Growth in Business Sector Service Industries in Canada
and the United States, 1981-1995 and 1995-2000 Exhibit 2: Comparison of Productivity Growth in Business Sector Service Industries in
Canada and the United States Exhibit 3: Sources of Gross Output Growth in the Business Sector Services Aggregate in
Canada and the United States, 1981-95 and 1995-2000 Exhibit 4: Sources of Labour Productivity Growth in the Business Sector Services
Aggregate in Canada and the United States, 1981-95 and 1995-2000 Tables Table 1: Output and Employment Shares and Labour Productivity of Canadian Industries Table 2: Output and Employment Shares of U.S. Industries Table 3: Industry Shares of Value Added and Hours in the Business Sector in Canada and
the United States Table 4: Labour Productivity and Capital Input Intensity Levels in Canadian and U.S.
Business Sector Industries Table 5: Intermediate Input Intensity in Canadian and U.S. Business Sector Industries
(Business Sector=100 in each year for each country) Table 6: Average Hourly Labour Compensation in Canadian and U.S. Business Sector
Industries (Business Sector=100 in each year for each country) Table 7: Labour Productivity Levels in Canadian Industries Relative to the United States
(United States=100), 2000 Table 8: R&D Intensity and Distribution Table 9: Hours Worked by Persons with a University Degree and Above (per cent of total
hours worked) Table 10: ICT Capital Input as a Percentage of Total Capital Input (per cent) Table 11: Labour Productivity Growth in Business Sector Industries in Canada and the
United States (Compound Average Annual Growth Rates) Table 12: Contribution by Industry to the Service Sector Labour Productivity Growth
Acceleration Table 13: Decomposition of Labour Productivity in total service sector in Canada and the
United States Table 14: Sources of Gross Output Growth in Canadian and U.S. Business Sector
Industries, 1981-1995 Table 15: Sources of Gross Output Growth in Canadian and U.S. Business Sector
Industries, 1995-2000 Table 16: Sources of Labour Productivity Growth in Canadian and U.S. Business Sector
Industries, 1981-1995

40
Table 17: Sources of Labour Productivity Growth in Canadian and U.S. Business Sector Industries, 1995-2000
Table 18: Multifactor Productivity Growth in Business Sector Service Industries in Canada and the United States (Compound Average Annual Growth Rates)
Figures Figure 1: Contributions to Business Sector Output Growth by Sector in Canada and the
United States, 1981-1995 Figure 2: Contributions to Business Sector Output Growth by Sector in Canada and the
United States, 1995-2000 Figure 3: Contributions to Business Sector Labour Productivity Growth by Sector in
Canada and the United States, 1981-1995 Figure 4: Contributions to Business Sector Labour Productivity Growth by Sector in
Canada and the United States, 1995-2000 Figure 5: Contributions to Business Sector MFP Growth by Sector in Canada and the
United States, 1981-1995 Figure 6: Contributions to Business Sector MFP Growth by Sector in Canada and the
United States, 1995-2000

41
Table 1: Output and Employment Shares and Labour Productivity of
Canadian Industries
Output (Real GDP) Employment
Relative Labour
Productivity (Total
Economy=100)
1987 1995 2001 1987 1995 2001 2001 Aggregate Service Sector 69.4 71.0 70.8 71.2 74.9 75.2 94.2 Utilities 3.7 3.4 2.7 1.0 0.9 0.8 335.4 Wholesale Trade 4.3 5.0 5.7 3.4 3.2 3.7 155.0 Retail Trade 5.6 5.0 5.5 12.8 12.5 12.1 45.1 Transportation and Warehousing 4.7 4.9 4.7 5.2 5.0 5.1 92.2 Information and Cultural Industries 3.0 3.5 4.0 2.6 2.6 2.7 150.0 FIRE 17.8 19.6 19.8 6.1 6.4 5.8 341.3 Professional and Scientific Services 2.9 3.3 4.4 3.9 5.0 6.5 67.4 Administrative and Support Services 1.6 1.9 2.1 2.1 3.0 3.7 57.4 Education Services 5.9 5.3 4.7 6.4 7.0 6.4 72.8 Health Care and Social Assistance 6.9 6.8 5.8 9.3 10.4 10.2 57.2 Arts, Entertainment and Recreation 1.0 0.9 0.9 1.4 1.7 2.0 45.5 Accommodation and Food Services 2.8 2.5 2.4 5.7 6.1 6.5 37.0 Other Services 2.5 2.4 2.4 5.1 4.9 4.5 52.6 Public Administration 6.8 6.6 5.7 6.2 6.2 5.1 111.8 Construction 6.7 5.1 5.4 6.0 5.5 5.6 95.7 Primary Industries 6.8 6.9 5.9 6.3 5.4 4.1 142.9 Manufacturing Industries 17.1 17.1 18.0 16.6 14.3 15.1 119.1 Total Economy 100 100 100 100 100 100 100
Sources: Unpublished data provided by Statistics Canada Division of Industry Measures and Division of Labour Statistics. November 2003. Note: Real GDP is in 1997 constant (Laspeyres fixed-weight) dollars and labour productivity is real GDP per worker. Industries are based on NAICS. Relative labour productivity levels are calculated by dividing the output shares by the employment shares. FIRE refers to finance, insurance and real estate, leasing and management.

42
Table 2: Output and Employment Shares of U.S. Industries
Output (Real GDP) Employment
Relative Labour
Productivity (Total
Economy=100)
1987 1995 2001 1987 1995 2001 2001 Aggregate Service Sector 75.1 75.7 77.3 75.0 77.8 79.4 97.4 Transportation & Public Utilities 7.5 8.5 8.3 4.8 4.8 5.1 164.1 Transportation 2.6 3.0 2.9 2.9 3.2 3.3 87.2 Communications 2.2 2.7 3.4 1.1 1.0 1.2 295.0 Electric, gas and sanitary services 2.7 2.8 2.1 0.8 0.7 0.6 360.8 Wholesale Trade 5.8 6.4 8.0 5.2 5.0 4.7 168.9 Retail Trade 8.3 8.6 10.1 17.1 17.2 17.0 59.4 FIRE 19.0 18.6 19.6 6.1 5.6 5.7 344.2 Services 19.2 20.1 19.6 24.8 29.0 31.2 62.9 Hotels and other lodging places 0.8 0.8 0.7 1.3 1.3 1.3 52.2 Personal services 0.7 0.6 0.6 1.4 1.4 1.4 44.0 Business services 3.0 4.2 4.9 4.2 5.6 7.0 70.0 Auto repair, services, and parking 0.9 0.9 0.9 1.0 1.1 1.1 81.5 Miscellaneous repair services 0.3 0.3 0.2 0.5 0.5 0.4 51.0 Motion pictures 0.3 0.3 0.3 0.4 0.5 0.5 59.6 Amusement and recreation services 0.6 0.7 0.7 0.9 1.2 1.3 54.5 Health services 6.4 5.9 5.3 6.1 7.4 7.5 71.0 Legal services 1.6 1.4 1.3 0.9 1.0 0.9 139.4 Educational services 0.8 0.8 0.7 1.4 1.6 1.8 39.1 Social services 0.5 0.7 0.6 1.7 2.2 2.4 24.5 Membership organizations 0.6 0.7 0.5 1.4 1.6 1.7 29.5 Other services 2.5 2.7 2.8 2.2 2.7 3.1 90.4 Private households 0.2 0.2 0.1 1.3 0.9 0.8 13.3 Public Administration 15.3 13.6 11.8 17.1 16.2 15.7 75.2 Construction 4.5 4.0 4.0 5.4 5.1 5.7 69.7 Primary Industries 3.4 3.1 2.9 3.3 3.1 2.8 103.3 Manufacturing Industries 17.0 17.1 15.8 16.2 14.0 12.1 130.6 Total Economy 100 100 100 100 100 100 100 Sources: BEA Website, www.bea.gov, January 17, 2003. Note: Real GDP is in 1996 Fisher chained-weight dollars, workers are defined as full time plus part time employees plus the self-employed, and labour productivity is real GDP per worker. Industries are based on SIC. Relative labour productivity levels are calculated by dividing the output shares by the employment shares.

43
Table 3: Industry Shares of Value Added and Hours in the Business Sector in
Canada and the United States
Canada
United States
Industry
1981 1995 2000 1981 1995 2000 Value Added Share (%)
Service Industries 51.3 59.0 61.2 55.9 67.7 69.0 Transportation 6.6 6.1 6.2 4.5 3.9 3.3 Communications 2.9 3.1 2.7 2.7 2.7 2.9 Electric utilities 3.1 4.0 3.3 2.4 2.4 2.1 Gas utilities 0.4 0.5 0.4 0.6 0.4 0.3 Wholesale trade 5.9 7.0 7.2 7.6 7.0 6.7 Retail trade 7.8 7.2 7.7 9.2 8.5 8.3 FIRE 11.0 13.7 14.2 11.8 15.9 16.6 Business services 4.2 6.3 8.3 3.4 6.7 8.4 Health services 2.3 3.3 3.2 9.2 14.5 14.5 Education, private 0.1 0.1 0.3 0.7 0.9 1.0 Other services 7.0 7.7 7.7 3.8 4.8 4.9 Construction 10.1 6.7 6.8 6.8 5.2 5.3 Manufacturing 25.0 26.2 24.6 27.9 23.2 22.0 Primary Industries 13.5 8.1 7.1 9.5 4.0 3.8 Business Sector 100 100 100 100 100 100
Hours Share (%) Service Industries 57.4 65.0 66.3 61.6 69.8 71.5 Transportation 6.8 7.0 6.8 3.7 4.2 4.3 Communications 1.5 1.4 1.1 1.6 1.2 1.4 Electric utilities 0.8 0.8 0.7 0.6 0.5 0.4 Gas utilities 0.1 0.2 0.1 0.3 0.2 0.1 Wholesale trade 6.6 7.0 7.8 7.0 6.4 6.2 Retail trade 14.3 15.0 13.6 17.4 17.8 17.2 FIRE 6.7 7.1 6.6 6.6 6.6 6.7 Business services 5.5 8.3 11.1 4.2 7.6 9.5 Health services 1.9 3.5 4.2 12.8 16.8 17.2 Education, private 0.1 0.1 0.3 1.3 1.5 1.6 Other services 13.0 14.7 14.0 6.0 6.9 6.9 Construction 9.7 8.7 8.8 6.4 6.8 7.7 Manufacturing 23.8 19.2 19.4 24.9 18.7 16.7 Primary Industries 9.1 7.2 5.5 7.1 4.6 4.1 Business Sector 100 100 100 100 100 100 Source: The KLEMS database from Ho, Rao and Tang (2003).

44
Table 4: Labour Productivity and Capital Input Intensity Levels in Canadian and
U.S. Business Sector Industries
Canada
United States
1981 1995 2000 1981 1995 2000 Labour Productivity Level (Average for Business Sector=100)
Service Industries 64.9 60.7 60.0 82.4 75.5 71.4 Transportation 69.9 68.0 64.0 94.4 87.5 77.1 Communications 91.0 134.8 161.7 153.1 191.9 178.0 Electric utilities 280.1 275.2 244.6 311.4 343.3 382.9 Gas utilities 236.7 164.5 172.2 632.3 365.9 362.4 Wholesale trade 54.0 64.0 61.1 61.9 80.8 79.7 Retail trade 34.7 31.3 34.2 44.0 40.3 39.4 FIRE 137.2 138.1 143.7 162.4 176.9 174.4 Business services 52.7 48.6 48.8 75.0 60.7 56.5 Health services 89.4 51.8 41.1 76.6 62.3 56.0 Education, private 112.2 44.2 49.6 65.4 52.9 43.7 Other services 47.7 38.6 40.1 67.8 62.5 59.9 Construction 107.7 78.7 70.5 116.2 86.0 73.4 Manufacturing 146.9 166.9 162.1 122.2 153.3 170.8 Primary Industries 80.6 93.7 107.4 79.2 85.2 84.4
Capital Input Intensity Level (Average for Business Sector=100) Service Industries 69.1 72.5 62.9 106.5 111.3 113.7 Transportation 63.3 57.8 54.9 139.9 78.9 78.5 Communications 204.4 292.0 355.6 265.0 428.3 429.8 Electric utilities 996.4 920.2 703.6 971.9 1072.0 1056.7 Gas utilities 676.9 580.0 653.5 419.6 492.2 576.1 Wholesale trade 63.2 60.5 51.4 44.6 86.6 117.6 Retail trade 16.9 18.5 18.9 29.3 34.3 34.6 FIRE 198.2 236.2 214.4 430.8 476.5 458.8 Business services 10.6 25.2 33.9 68.5 76.2 98.7 Health services 61.1 31.5 21.4 49.1 53.8 59.1 Education, private 5.0 9.7 4.3 11.2 9.3 8.7 Other services 23.0 29.2 26.1 70.8 67.7 62.3 Construction 30.6 28.2 23.0 54.1 31.3 31.3 Manufacturing 125.3 123.0 105.6 116.6 133.8 139.5 Primary Industries 175.0 176.3 208.5 122.8 123.7 115.5
Correlation between Labour Productivity and Capital Intensity Levels Correlation Coefficient 0.91 0.91 0.88 0.63 0.88 0.93 Sources: The KLEMS database from Ho, Rao and Tang (2003). Note: Government sector is excluded. Labour productivity is gross output per hour worked and capital intensity is capital input per hour worked (capital including M&E, structure, land and inventories).

45
Table 5: Intermediate Input Intensity in Canadian and U.S. Business
Sector Industries (Average for Business Sector=100 in each year for each country)
Canada
United States
1981 1995 2000 1981 1995 2000 Service Industries 41.7 41.3 42.5 55.4 52.6 51.8 Transportation 63.7 59.4 55.2 85.9 80.2 70.4 Communications 46.8 69.2 74.0 121.1 153.5 157.1 Electric utilities 60.1 94.1 95.6 201.5 220.4 230.4 Gas utilities 46.7 38.6 40.6 733.5 532.2 494.3 Wholesale trade 37.8 41.8 40.0 50.4 53.9 53.0 Retail trade 22.7 21.1 24.1 32.4 31.4 29.8 FIRE 94.1 101.8 112.0 92.4 113.3 120.9 Business services 25.5 29.2 32.0 37.9 32.0 36.0 Health services 26.8 19.8 18.7 40.1 37.2 36.1 Education, private 89.2 38.0 26.7 42.3 40.1 34.9 Other services 32.6 30.4 33.4 49.4 51.2 51.4 Construction 116.0 84.5 75.2 108.6 89.7 81.4 Manufacturing 167.9 201.2 197.3 144.5 175.4 189.8 Primary Industries 74.4 73.0 85.0 91.5 82.3 77.0 Sources: The KLEMS database from Ho, Rao and Tang (2003). Note: intermediate input intensity is defined as intermediate goods per hour worked.
Table 6: Average Hourly Labour Compensation in Canadian and U.S. Business Sector Industries (Average for Business Sector=100 in each year for each country)
Canada
United States
1981 1995 2000 1981 1995 2000 Service Industries 104.5 95.0 104.2 78.7 101.3 106.5 Transportation 97.5 86.0 94.8 109.5 87.8 87.4 Communications 115.3 107.2 104.8 102.0 97.9 125.1 Electric utilities 155.1 143.0 136.6 140.7 168.5 237.5 Gas utilities 130.4 105.4 99.4 106.5 85.4 116.6 Wholesale trade 100.1 102.0 107.7 107.8 117.4 128.7 Retail trade 61.8 58.0 67.0 55.8 63.2 66.5 FIRE 109.4 121.7 155.5 89.1 137.8 159.4 Business services 94.8 84.6 96.3 72.3 90.4 95.9 Health services 189.7 166.0 142.6 78.2 113.4 112.7 Education, private 169.9 146.8 117.0 66.5 76.5 76.7 Other services 52.5 55.1 61.2 45.4 53.3 54.7 Construction 109.3 95.4 97.5 122.5 102.7 92.4 Manufacturing 107.7 106.9 112.4 111.5 120.8 132.9 Primary Industries 78.5 102.8 85.9 87.2 75.2 68.2 Sources: The KLEMS database from Ho, Rao and Tang (2003). Note: it is assumed that the self-employed earn the same hourly compensation as paid workers.

46
Table 7: Labour Productivity Levels in Canadian
Industries Relative to the United States, 2000 (United States=100)
Industry
Relative Labour Productivity Level
Service Industries 83.8 Transportation 72.7 Communications 135.6 Electric utilities 96.0 Gas utilities 115.0 Wholesale trade 71.3 Retail trade 98.9 FIRE 63.9 Business services 90.8 Health services 99.7 Education, private 169.1 Other services 84.1 Construction 144.9 Manufacturing 65.8 Primary Industries 86.7 Business Sector 84.4
Sources: The KLEMS database from Ho, Rao and Tang (2003). Note: Government sector is excluded. Labour productivity is defined as real value added per hour worked, where value added is derived from gross output and intermediate input. For service, construction, and primary industries, industry level value added PPPs in 2000 are derived from the implicit value added PPPs in 1993 from Lee and Tang (2000), using value added deflators from Canada and the United States. Health services and education are mostly private in the United States while in Canada, they are mostly public. The relative labour productivity levels for the manufacturing and business sectors are from Rao, Tang, and Wang (2003).

47
Table 8: R&D Intensity and Distribution
R&D Intensity
Canada U.S. Industry 1987 1996 1999 1987 1996 1999
Total Services* 0.51 0.73 0.72 0.35 0.69 1.16 Wholesale and retail trade; repairs 0.20 0.67 0.69 0.49 1.25 Transport and storage 0.09 0.03 0.05 0.09 0.15 Post and telecommunications 0.75 0.68 0.35 1.52 Financial intermediation 0.59 0.41 0.30 0.23 0.21 Real estate, renting and business activities 0.80 1.07 1.11 Electricity, Gas and Water Supply 1.32 0.93 0.70 0.19 0.17 0.07 Construction 0.01 0.07 0.06 0.09 0.16 Manufacturing 3.05 3.62 3.66 9.49 8.89 8.27
R&D Distribution
Total Services* 24.89 30.29 28.96 8.51 18.63 34.36 Wholesale and retail trade; repairs 2.88 7.09 7.29 4.42 12.60 Transport and storage 0.49 0.11 0.24 0.15 0.14 Post and telecommunications 2.68 1.98 0.86 2.84 Financial intermediation 4.39 2.71 1.90 0.90 2.02 Real estate, renting and business activities 14.45 18.39 18.67 . Electricity, Gas and Water Supply 5.03 2.91 1.61 0.29 0.24 0.08 Construction 0.09 0.32 0.25 0.20 0.12 Manufacturing 67.27 62.95 67.33 91.49 80.84 64.95 Sources: OECD BERD and STAN databases. Note: R&D intensity is defined as R&D expenditure as percentage of value added. *Total services here includes only the selected services industries in the table.

48
Table 9: Hours Worked by Persons with a University Degree and Above
(per cent of total hours worked)
Canada
United States
1981 1995 2000 1981 1995 2000 Service Industries 9.86 16.97 19.48 21.92 28.15 30.34 Transportation 3.75 6.75 7.24 10.04 16.93 16.99 Communications 10.04 21.30 21.97 18.89 32.80 35.13 Electric utilities 13.75 20.41 20.74 17.39 28.72 31.66 Gas utilities 10.15 18.76 19.15 17.05 25.76 28.38 Wholesale trade 6.12 13.50 14.42 21.03 25.08 24.89 Retail trade 4.15 8.41 9.26 11.97 13.90 15.42 FIRE 13.43 24.39 25.49 27.47 39.49 41.89 Business services 33.16 42.20 42.47 37.13 37.60 38.61 Health services 40.23 31.73 36.85 34.76 40.21 42.80 Education, private 32.53 44.29 53.66 54.07 63.46 65.09 Other services 4.69 10.00 11.06 9.73 15.34 17.75 Construction 4.13 5.66 6.14 8.91 10.94 10.32 Manufacturing 6.49 10.98 11.78 13.17 20.01 21.61 Primary Industries 4.83 7.53 9.16 10.57 18.25 14.33 Business Sector 8.05 14.17 16.25 18.10 24.99 26.69 Sources: The KLEMS database from Ho, Rao and Tang (2003).
Table 10: ICT Capital Input as a Percentage of Total Capital Input (per cent)
Canada
United States
Industry
1981 1995 2000 1981 1995 2000 Service Industries 2.3 9.8 19.0 3.6 16.3 32.2 Transportation 1.5 6.8 13.2 2.1 11.3 23.1 Communications 33.3 43.9 51.0 51.5 53.6 60.1 Electric utilities 0.5 2.2 6.5 1.1 5.9 8.6 Gas utilities 0.1 1.9 6.5 2.7 16.5 21.1 Wholesale trade 0.4 5.8 13.8 4.6 31.6 54.0 Retail trade 0.5 7.5 21.5 0.9 8.9 19.3 FIRE 0.9 6.5 14.6 1.3 9.8 23.6 Business services 1.7 17.9 30.9 6.8 33.1 58.5 Health services, private 0.6 5.4 9.4 1.9 14.7 31.4 Education, private 5.1 23.4 38.4 2.8 11.7 25.5 Other services 1.4 10.7 19.4 2.1 6.4 12.8 Construction 0.2 2.5 5.5 0.1 6.0 13.7 Manufacturing 0.5 3.5 6.3 1.5 9.0 18.5 Primary Industries 0.2 0.5 1.1 0.5 2.3 4.6 Business Sector 1.3 6.5 12.5 2.7 13.7 27.8 Source: The KLEMS database from Ho, Rao and Tang (2003). Note: Capital input or service equals capital stock multiplied by its user cost. Total capital includes M&E, structure, land and inventories.

49
Table 11: Labour Productivity Growth in Business Sector Industries in Canada and the
United States (Compound Average Annual Growth Rates)
Canada
United States
Industry
1981-1995 1995-2000 Difference 1981-1995 1995-2000 Difference Service Industries 1.37 2.29 0.92 0.70 1.92 1.22 Transportation 1.64 1.33 -0.31 0.79 0.50 -0.29 Communications 4.65 6.18 1.53 2.94 1.54 -1.40 Electric utilities 1.71 0.17 -1.54 2.02 5.22 3.20 Gas utilities -0.76 3.45 4.21 -2.58 2.85 5.43 Wholesale trade 3.06 1.59 -1.47 3.23 2.78 -0.45 Retail trade 1.12 4.28 3.16 0.71 2.59 1.88 FIRE 1.88 3.33 1.45 1.94 2.75 0.81 Business services 1.26 2.61 1.35 -0.19 1.62 1.81 Health services -2.06 -2.11 -0.05 -0.16 0.93 1.09 Education, private -4.81 4.81 9.62 -0.19 -0.78 -0.59 Other services 0.34 3.27 2.93 0.74 2.20 1.46 Construction -0.40 0.33 0.73 -0.83 -0.14 0.69 Manufacturing 2.75 1.95 -0.80 2.94 5.20 2.26 Primary Industries 2.92 5.26 2.34 1.85 2.86 1.01 Business Sector 1.44 1.93 0.49 1.30 2.31 1.01 Source: The KLEMS database from Ho, Rao and Tang (2003). Note: FIRE refers to finance, insurance and real estate, and includes leasing and management services. Labour productivity is defined as gross output per hour worked for industries and value added per hour worked for the business sector.

50
Table 12: Contribution by Industry to the Service Sector Labour Productivity
Growth Acceleration
Canada
United States
Industry
1981-1995 1995-2000 Difference 1981-1995 1995-2000 Difference
Services Industries Labour Productivity
Growth (per cent)
1.37
2.29
0.92
0.70
1.92
1.22 Contribution Distribution (percentage points)
Transportation 14.4 5.1 -2.7 5.3 1.6 -1.5 Communications 8.6 4.2 0.4 7.2 1.5 -3.3 Electric utilities 1.7 0.1 -1.3 2.2 1.7 1.3 Gas utilities -0.1 0.2 0.6 -1.0 0.3 1.5 Wholesale trade 26.9 6.6 -10.6 38.2 13.2 -7.8 Retail trade 21.7 34.2 44.8 22.5 34.3 44.3 FIRE 17.3 12.8 9.0 23.7 14.0 5.9 Business services 11.3 14.2 16.7 -2.0 10.5 21.1 Health services -7.3 -4.5 -2.1 -4.2 12.0 25.7 Education, private -0.7 0.7 1.9 -0.5 -0.9 -1.3 Other services 6.2 26.3 43.4 8.7 11.6 14.0 Total 100 100 100 100 100 100 Source: The KLEMS database from Ho, Rao and Tang (2003). Notes: Labour productivity is gross output per hour worked. FIRE refers to finance, insurance and real estate, and includes leasing and management services. An industry’s contribution is its labour productivity growth multiplied by its average hours share in total service hours.

51
Table 13: Decomposition of Labour Productivity in total service sector in Canada
and the United States
1981-1995 1995-2000 Differences
Canada Annual Labour Productivity Growth Rate 1.37 2.29 0.92 Pure labour productivity growth effect 1.43 2.64 1.21 Level effect from change in relative size -0.06 -0.35 -0.29
United States
Annual Labour Productivity Growth Rate 0.70 1.92 1.22 Pure labour productivity growth effect 1.00 2.04 1.04
Level effect from change in relative size -0.30 -0.12 0.18 Sources: The KLEMS database from Ho, Rao and Tang (2003). Notes: The decomposition is based on the technique from Tang and Wang (2004). An aggregate labour productivity growth can be generally decomposed into three components: the pure labour productivity effect from growth in labour productivity of individual service industries; the relative change size effect from the change in relative hours worked share among services industries; and the interaction term from the first two effects. The level effect in this table includes the relative change size effect and the interaction term. The results are calculated on the basis of 11 service industries as shown in Table 12.
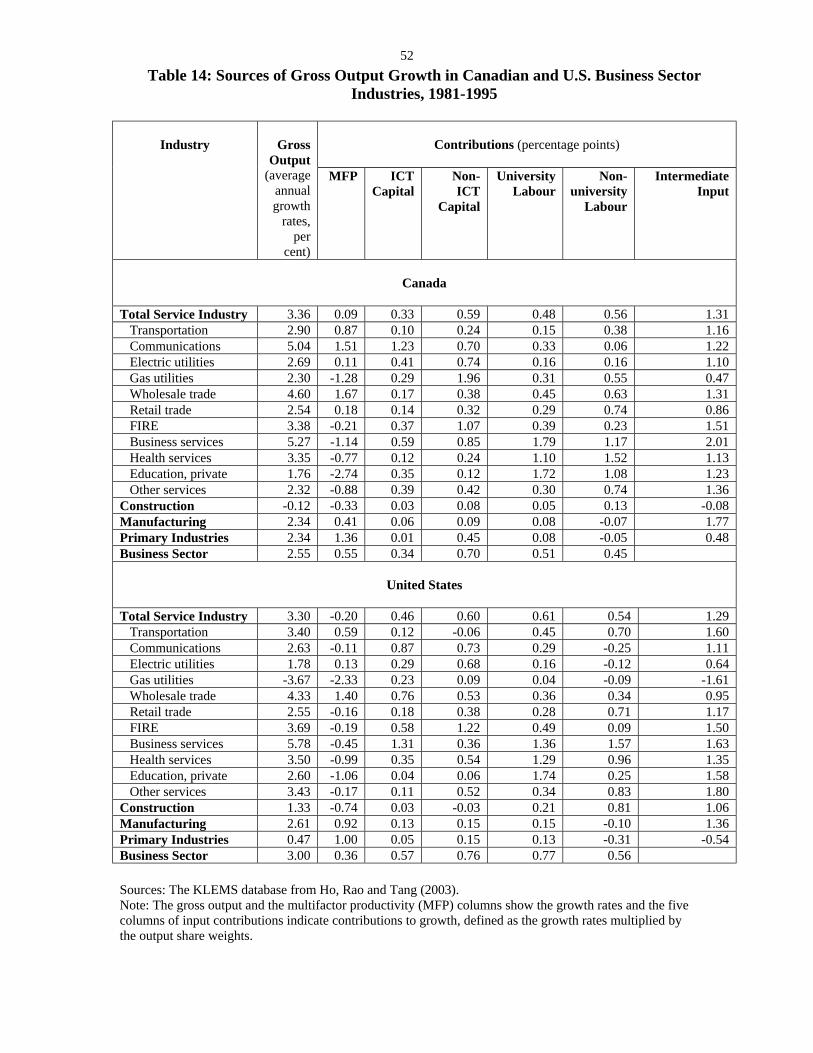
52
Table 14: Sources of Gross Output Growth in Canadian and U.S. Business Sector Industries, 1981-1995
Contributions (percentage points)
Industry
Gross
Output (average
annual growth
rates, per
cent)
MFP ICT Capital
Non-ICT
Capital
University Labour
Non-university
Labour
Intermediate Input
Canada
Total Service Industry 3.36 0.09 0.33 0.59 0.48 0.56 1.31 Transportation 2.90 0.87 0.10 0.24 0.15 0.38 1.16 Communications 5.04 1.51 1.23 0.70 0.33 0.06 1.22 Electric utilities 2.69 0.11 0.41 0.74 0.16 0.16 1.10 Gas utilities 2.30 -1.28 0.29 1.96 0.31 0.55 0.47 Wholesale trade 4.60 1.67 0.17 0.38 0.45 0.63 1.31 Retail trade 2.54 0.18 0.14 0.32 0.29 0.74 0.86 FIRE 3.38 -0.21 0.37 1.07 0.39 0.23 1.51 Business services 5.27 -1.14 0.59 0.85 1.79 1.17 2.01 Health services 3.35 -0.77 0.12 0.24 1.10 1.52 1.13 Education, private 1.76 -2.74 0.35 0.12 1.72 1.08 1.23 Other services 2.32 -0.88 0.39 0.42 0.30 0.74 1.36 Construction -0.12 -0.33 0.03 0.08 0.05 0.13 -0.08 Manufacturing 2.34 0.41 0.06 0.09 0.08 -0.07 1.77 Primary Industries 2.34 1.36 0.01 0.45 0.08 -0.05 0.48 Business Sector 2.55 0.55 0.34 0.70 0.51 0.45
United States
Total Service Industry 3.30 -0.20 0.46 0.60 0.61 0.54 1.29 Transportation 3.40 0.59 0.12 -0.06 0.45 0.70 1.60 Communications 2.63 -0.11 0.87 0.73 0.29 -0.25 1.11 Electric utilities 1.78 0.13 0.29 0.68 0.16 -0.12 0.64 Gas utilities -3.67 -2.33 0.23 0.09 0.04 -0.09 -1.61 Wholesale trade 4.33 1.40 0.76 0.53 0.36 0.34 0.95 Retail trade 2.55 -0.16 0.18 0.38 0.28 0.71 1.17 FIRE 3.69 -0.19 0.58 1.22 0.49 0.09 1.50 Business services 5.78 -0.45 1.31 0.36 1.36 1.57 1.63 Health services 3.50 -0.99 0.35 0.54 1.29 0.96 1.35 Education, private 2.60 -1.06 0.04 0.06 1.74 0.25 1.58 Other services 3.43 -0.17 0.11 0.52 0.34 0.83 1.80 Construction 1.33 -0.74 0.03 -0.03 0.21 0.81 1.06 Manufacturing 2.61 0.92 0.13 0.15 0.15 -0.10 1.36 Primary Industries 0.47 1.00 0.05 0.15 0.13 -0.31 -0.54 Business Sector 3.00 0.36 0.57 0.76 0.77 0.56
Sources: The KLEMS database from Ho, Rao and Tang (2003). Note: The gross output and the multifactor productivity (MFP) columns show the growth rates and the five columns of input contributions indicate contributions to growth, defined as the growth rates multiplied by the output share weights.

53
Sources: The KLEMS database from Ho, Rao and Tang (2003).
Table 15: Sources of Gross Output Growth in Canadian and U.S. Business Sector Industries, 1995-2000
Contributions (percentage points)
Industry
Gross
Output (average
annual growth
rates, per
cent)
MFP ICT Capital
Non-ICT
Capital
University Labour
Non-university
Labour
Intermediate Input
Canada
Total Service Industry 5.75 0.73 0.50 0.45 0.76 0.87 2.44 Transportation 3.78 0.39 0.24 0.65 0.13 0.81 1.55 Communications 5.69 1.71 2.04 0.97 0.01 -0.05 1.01 Electric utilities 0.67 0.80 0.45 -1.31 0.03 0.06 0.64 Gas utilities 0.99 -0.95 0.69 1.61 -0.10 -0.34 0.07 Wholesale trade 6.71 0.85 0.38 0.57 0.56 1.88 2.46 Retail trade 5.50 1.86 0.39 0.39 0.20 0.46 2.20 FIRE 4.99 0.96 0.59 0.46 0.25 0.32 2.41 Business services 11.37 0.15 0.65 1.05 2.68 2.20 4.64 Health services 4.55 -3.78 0.09 0.15 5.00 1.23 1.85 Education, private 22.35 4.33 0.12 0.03 8.84 4.07 4.96 Other services 5.38 0.97 0.32 0.19 0.25 0.77 2.88 Construction 3.62 0.19 0.04 0.16 0.14 1.11 1.97 Manufacturing 5.26 0.48 0.10 0.46 0.13 0.52 3.56 Primary Industries 3.15 -0.12 0.05 1.61 0.08 -0.03 1.56 Business Sector 5.00 1.11 0.58 1.04 0.87 1.41
United States
Total Service
Industry
4.63
-0.16
0.88
0.65
0.68
0.52
2.06 Transportation 2.81 -0.22 0.40 0.45 0.18 0.67 1.33 Communications 6.41 -1.20 1.84 0.90 0.52 0.59 3.76 Electric utilities 2.87 2.33 0.22 0.21 0.00 -0.40 0.50 Gas utilities -0.65 0.33 0.34 0.34 -0.04 -0.26 -1.36 Wholesale trade 4.16 0.08 1.41 0.55 0.24 0.43 1.45 Retail trade 4.17 1.31 0.30 0.44 0.33 0.31 1.47 FIRE 5.26 0.01 1.18 1.00 0.44 0.17 2.45 Business services 8.15 -1.38 1.76 0.83 1.50 1.87 3.59 Health services 3.67 -1.07 0.57 0.53 1.37 0.57 1.71 Education, private 2.87 -1.55 0.09 0.07 2.24 0.41 1.62 Other services 4.42 0.51 0.23 0.48 0.31 0.49 2.40 Construction 4.48 -0.95 0.12 0.41 0.18 1.49 3.23 Manufacturing 5.18 1.69 0.28 0.32 0.12 0.01 2.75 Primary Industries 2.62 1.69 0.09 0.37 -0.34 0.08 0.73 Business Sector 4.54 0.81 1.15 0.98 0.82 0.78
Note: The gross output and the multifactor productivity (MFP) columns show the growth rates and the five columns of input contributions indicate contributions to growth, defined as the growth rates multiplied by the output share weights.

54
Table 16: Sources of Labour Productivity Growth in Canadian and U.S. Business Sector Industries, 1981-1995
Contributions (percentage points)
Industry
LP
(average annual growth
rates, per
cent)
MFP ICT Capital
Inten-sity
Non-ICT
Capital Intensity
University Labour Quality
Non-university
Labour Quality
Intermediate Input
Intensity
Canada
Total Service Industry 1.37 0.09 0.28 0.16 0.32 -0.09 0.61 Transportation 1.64 0.87 0.08 0.02 0.12 -0.05 0.59 Communications 4.65 1.51 1.14 0.61 0.31 -0.03 1.11 Electric utilities 1.71 0.11 0.39 0.09 0.13 0.03 0.96 Gas utilities -0.76 -1.28 0.25 0.08 0.19 -0.02 0.01 Wholesale trade 3.06 1.67 0.15 0.07 0.36 -0.01 0.82 Retail trade 1.12 0.18 0.13 0.13 0.24 0.03 0.40 FIRE 1.88 -0.21 0.34 0.60 0.31 -0.09 0.93 Business services 1.26 -1.14 0.50 0.43 0.74 -0.09 0.82 Health services -2.06 -0.77 0.09 -0.64 -0.95 0.30 -0.09 Education, private -4.81 -2.74 0.26 -0.03 0.40 -0.36 -2.34 Other services 0.34 -0.88 0.35 0.16 0.22 -0.05 0.54 Construction -0.40 -0.33 0.03 0.06 0.06 0.07 -0.29 Manufacturing 2.75 0.41 0.06 0.11 0.10 0.02 2.06 Primary Industries 2.92 1.36 0.02 0.64 0.10 0.06 0.75 Business Sector 1.44 0.55 0.31 0.28 0.42 -0.11
United States
Total Service Industry 0.70 -0.20 0.38 0.10 0.23 -0.10 0.29 Transportation 0.79 0.59 0.09 -0.39 0.26 -0.09 0.33 Communications 2.94 -0.11 0.90 0.77 0.31 -0.16 1.23 Electric utilities 2.02 0.13 0.31 0.82 0.19 -0.09 0.67 Gas utilities -2.58 -2.33 0.25 0.26 0.06 -0.03 -0.80 Wholesale trade 3.23 1.40 0.71 0.39 0.19 -0.02 0.57 Retail trade 0.71 -0.16 0.17 0.19 0.11 0.02 0.39 FIRE 1.94 -0.19 0.54 0.55 0.29 -0.14 0.90 Business services -0.19 -0.45 0.90 -0.41 -0.19 0.06 -0.11 Health services -0.16 -0.99 0.28 0.09 0.25 0.04 0.17 Education, private -0.19 -1.06 0.04 -0.02 0.69 -0.19 0.36 Other services 0.74 -0.17 0.08 0.16 0.19 -0.13 0.61 Construction -0.83 -0.74 0.03 -0.14 0.09 0.06 -0.13 Manufacturing 2.94 0.92 0.13 0.18 0.16 -0.03 1.57 Primary Industries 1.85 1.00 0.05 0.53 0.19 -0.12 0.20 Business Sector 1.30 0.36 0.50 0.24 0.41 -0.21
Note: The labour productivity (LP) and the multifactor productivity (MFP) columns show the growth rates and the five columns of input contributions indicate contributions to growth, defined as the growth rates multiplied by the output share weights. Sources: The KLEMS database from Ho, Rao and Tang (2003)

55
Table 17: Sources of Labour Productivity Growth in Canadian and U.S. Business Sector Industries, 1995-2000
Contributions (percentage points)
Industry
LP (average annual growth rates, per cent)
MFP ICT Capital
Inten- sity
Non-ICT
Capital Intensity
University Labour Quality
Non-university
Labour Quality
Intermediate Input
Intensity
Canada
Total Service Industry 2.29 0.73 0.40 -0.24 0.36 -0.09 1.13 Transportation 1.33 0.39 0.21 0.24 0.05 0.01 0.43 Communications 6.18 1.71 2.11 1.07 0.05 0.08 1.15 Electric utilities 0.17 0.80 0.43 -1.62 0.01 0.02 0.53 Gas utilities 3.45 -0.95 0.73 3.14 0.02 0.04 0.48 Wholesale trade 1.59 0.85 0.29 -0.25 0.11 0.03 0.55 Retail trade 4.28 1.86 0.37 0.22 0.12 -0.07 1.77 FIRE 3.33 0.96 0.54 -0.04 0.10 0.03 1.74 Business services 2.61 0.15 0.46 0.42 0.04 0.02 1.52 Health services -2.11 -3.78 0.05 -0.45 2.06 -0.29 0.30 Education, private 4.81 4.33 -0.02 -0.32 2.31 -0.08 -1.41 Other services 3.27 0.97 0.27 -0.08 0.13 0.04 1.94 Construction 0.33 0.19 0.03 -0.08 0.05 0.06 0.07 Manufacturing 1.95 0.48 0.08 -0.01 0.04 0.01 1.35 Primary Industries 5.26 -0.12 0.06 2.35 0.14 0.27 2.57 Business Sector 1.93 1.09 0.48 -0.07 0.44 0.00
United States
Total Service Industry 1.92 -0.16 0.76 0.15 0.23 -0.08 1.03 Transportation 0.50 -0.22 0.35 0.16 0.01 0.02 0.18 Communications 1.54 -1.20 1.03 0.17 0.10 -0.11 1.54 Electric utilities 5.22 2.33 0.29 1.27 0.15 -0.12 1.30 Gas utilities 2.85 0.33 0.48 0.94 0.06 -0.06 1.08 Wholesale trade 2.78 0.08 1.32 0.38 0.01 0.03 0.95 Retail trade 2.59 1.31 0.28 0.25 0.17 -0.22 0.80 FIRE 2.75 0.01 1.05 0.09 0.12 -0.07 1.55 Business services 1.62 -1.38 1.33 0.11 -0.08 0.03 1.62 Health services 0.93 -1.07 0.50 0.23 0.47 0.00 0.80 Education, private -0.78 -1.55 0.07 -0.01 0.71 -0.07 0.08 Other services 2.20 0.51 0.20 0.13 0.19 -0.22 1.39 Construction -0.14 -0.95 0.09 0.14 -0.07 0.06 0.60 Manufacturing 5.20 1.69 0.28 0.33 0.13 0.02 2.77 Primary Industries 2.86 1.69 0.10 0.44 -0.33 0.13 0.84 Business Sector 2.31 0.81 1.02 0.31 0.30 -0.13
Sources: The KLEMS database from Ho, Rao and Tang (2003). Note: The labour productivity (LP) and the multifactor productivity (MFP) columns show the growth rates and the five columns of input contributions indicate contributions to growth, defined as the growth rates multiplied by the output share weights.

56
Table 18: Multifactor Productivity Growth in Business Sector Service Industries in Canada
and the United States (Compound Average Annual Growth Rates)
Canada
United States
Industry
1981-1995 1995-2000 Difference 1981-1995 1995-2000 Difference Services Industries 0.09 0.73 0.64 -0.20 -0.16 0.04 Transportation 0.87 0.39 -0.48 0.59 -0.22 -0.81 Communications 1.51 1.71 0.20 -0.11 -1.20 -1.09 Electric utilities 0.11 0.80 0.69 0.13 2.33 2.20 Gas utilities -1.28 -0.95 0.33 -2.33 0.33 2.66 Wholesale trade 1.67 0.85 -0.82 1.40 0.08 -1.32 Retail trade 0.18 1.86 1.68 -0.16 1.31 1.47 FIRE -0.21 0.96 1.17 -0.19 0.01 0.20 Business services -1.14 0.15 1.29 -0.45 -1.38 -0.93 Health services -0.77 -3.78 -3.01 -0.99 -1.07 -0.08 Education, private -2.74 4.33 7.07 -1.06 -1.55 -0.49 Other services -0.88 0.97 1.85 -0.17 0.51 0.68 Construction -0.33 0.19 0.52 -0.74 -0.95 -0.21 Manufacturing 0.41 0.48 0.07 0.92 1.69 0.77 Primary Industries 1.36 -0.12 -1.48 1.00 1.69 0.69 Business Sector 0.55 1.11 0.56 0.36 0.81 0.45 Source: The KLEMS database from Ho, Rao and Tang (2003). Note: FIRE refers to finance, insurance and real estate, and includes leasing and management services.

57
Figure 1: Contributions to Business Sector Output Growth by Sectorin Canada and the United States, 1981-1995 (average annual change,percentage points)
Service industries
Construction
Manufacturing
Primary industries
Total
0.0 0.5 1.0 1.5 2.0 2.5 3.0 3.5-0.5
CanadaUnited States
Source: KLEMS database from Ho, Rao, and Tang (2003)Note: Output is defined as value added.
Figure 2: Contributions to Business Sector Output Growth by Sectorin Canada the United States, 1995-2000 (average annual change,percentage points)
Service industries
Construction
Manufacturing
Primary industries
Total
0.0 1.0 2.0 3.0 4.0 5.0 6.0
CanadaUnited States
Source: KLEMS database from Ho, Rao, and Tang (2003)Note: Output is defined as value added.
Figure 3: Contributions to Business Sector Labour Productivity Growth bySector in Canada and the United States, 1981-1995 (average annual change,percentage points)
Service industries
Construction
Manufacturing
Primary industries
Total
0.0 0.5 1.0 1.5 2.0-0.5
CanadaUnited States
Source: KLEMS database from Ho, Rao, and Tang (2003)Note: Labour productivity is defined as value added per hour worked.

58
Figure 4: Contributions to Business Sector Labour Productivity Growth by Sector in Canada and the United States, 1995-2000 (average annual change, percentage points)
Service industries
Construction Manufacturing
Primary industries
Total
0.0 0.5 1.0 1.5 2.0 2.5 3.0 -0.5
Canada United States
Source: KLEMS database from Ho, Rao, and Tang (2003) Note: Labour productivity is defined as value added per hour worked.
Figure 5: Contributions to Business Sector MFP Growth by Sector in Canada and the United States, 1981-1995 (average annual change, percentage points)
Service industries
Construction
ManufacturingPrimary industries
Total
0.0 0.2 0.4 0.6 0.8 -0.2 -0.4
Canada United States
Source: KLEMS database from Ho, Rao, and Tang (2003)
Figure 6: Contributions to Business Sector MFP Growth by Sector in Canada and the United States, 1995-2000 (average annual change, percentage points)
Service industries
Construction Manufacturing
Primary industries
Total
0.0 0.2 0.4 0.6 0.8 1.0 1.2 -0.2
Canada United States
Source: KLEMS database from Ho, Rao, and Tang (2003)