PRODUCTIVITY EFFECTS OF LAND REFORM: A Study of ...webfac/bardhan/papers/number42.pdf · government...
45
PRODUCTIVITY EFFECTS OF LAND REFORM: A Study of Disaggregated Farm Data in West Bengal, India 1 Pranab Bardhan 2 and Dilip Mookherjee 3 September 15, 2008 Abstract We study the impact of reforms in land property rights on farm productivity in the Indian state of West Bengal spanning 1982–95. Our analysis is distinguished from earlier studies by use of a disaggregated farm panel, controls for farm extension programs administered by local governments, and for endogeneity of program implementation. We find statistically significant effects of tenancy registration on productivity in tenant farms, but larger general equilibrium spillover effects on non- tenant farms. The productivity effects of tenancy reform were overshadowed by farm input services and infrastructure spending by local governments. 1 For research support we are grateful to the MacArthur Foundation Inequality Network and the National Science Foundation (Grant No. SES-0418434). Monica Parra Torrado and Neha Kumar provided outstand- ing research assistance. We thank officials of the West Bengal government who granted access to the data; to Sankar Bhaumik and Sukanta Bhattacharya of the Department of Economics, Calcutta University who led the village survey teams; to Bhaswar Moitra and Biswajeet Chatterjee of the Department of Economics, Jadavpur University who led the teams that collected the farm data; to Indrajit Mallick and Sandip Mitra who helped us collect other relevant data. We are specially grateful to Asim Dasgupta for his encour- agement, help and advice. For useful discussions and comments we thank Debu Bandyopadhyay, Abhijit Banerjee, Eli Berman, Sam Bowles, James Boyce, Maitreesh Ghatak, Bhaswar Moitra, Sandip Mitra, T.N. Srinivasan, MacArthur Inequality network members, and seminar participants at Brown, UC San Diego, Monash, Stanford, Tufts, and the World Bank. 2 Department of Economics, University of California, Berkeley 3 Department of Economics, Boston University 1
Transcript of PRODUCTIVITY EFFECTS OF LAND REFORM: A Study of ...webfac/bardhan/papers/number42.pdf · government...

PRODUCTIVITY EFFECTS OF LAND REFORM:
A Study of Disaggregated Farm Data in West Bengal, India 1
Pranab Bardhan2 and Dilip Mookherjee3
September 15, 2008
Abstract
We study the impact of reforms in land property rights on farm productivity in the Indian state
of West Bengal spanning 1982–95. Our analysis is distinguished from earlier studies by use of a
disaggregated farm panel, controls for farm extension programs administered by local governments,
and for endogeneity of program implementation. We find statistically significant effects of tenancy
registration on productivity in tenant farms, but larger general equilibrium spillover effects on non-
tenant farms. The productivity effects of tenancy reform were overshadowed by farm input services
and infrastructure spending by local governments.
1For research support we are grateful to the MacArthur Foundation Inequality Network and the National
Science Foundation (Grant No. SES-0418434). Monica Parra Torrado and Neha Kumar provided outstand-
ing research assistance. We thank officials of the West Bengal government who granted access to the data;
to Sankar Bhaumik and Sukanta Bhattacharya of the Department of Economics, Calcutta University who
led the village survey teams; to Bhaswar Moitra and Biswajeet Chatterjee of the Department of Economics,
Jadavpur University who led the teams that collected the farm data; to Indrajit Mallick and Sandip Mitra
who helped us collect other relevant data. We are specially grateful to Asim Dasgupta for his encour-
agement, help and advice. For useful discussions and comments we thank Debu Bandyopadhyay, Abhijit
Banerjee, Eli Berman, Sam Bowles, James Boyce, Maitreesh Ghatak, Bhaswar Moitra, Sandip Mitra, T.N.
Srinivasan, MacArthur Inequality network members, and seminar participants at Brown, UC San Diego,
Monash, Stanford, Tufts, and the World Bank.2Department of Economics, University of California, Berkeley3Department of Economics, Boston University
1

1 Introduction
Land reforms represent policies with significant promise to increase farm productivity as well
as reduce rural poverty in developing countries. These reforms include land redistribution,
titling programs and regulation of tenancy contracts. A large theoretical literature going
back to Adam Smith, Alfred Marshall and John Stuart Mill has focused on the potentially
productivity enhancing impact of such reforms, a theme echoed in more recent literature
as well.4 The potentially beneficial incentive effects of these reforms stem from reduction
in sharecropping distortions, agency costs of hired labor, and improved access to credit.
On theoretical grounds however, the productivity effects are ambiguous as there are a
number of possible opposing effects as well, such as loss of scale economies, investment
capacity or incentives of owners, and reduced ability of owners to control their tenants.5
In addition, land reforms could have general equilibrium implications for local prices of
key factor inputs, the distribution of land across size classes and ownership forms, and the
nature of local governance that affect infrastructure and farm extension programs. Such
general equilibrium or governance impacts are less well understood or emphasized in existing
literature.
Empirical evidence on the productivity effects of land reforms has been provided in
recent years by Besley and Burgess (2000) and Banerjee, Gertler and Ghatak (2002) in
the context of Indian agriculture. They employ official government data at relatively high
levels of aggregation. Besley-Burgess examine the effects of land reform legislations on
growth and poverty reduction in a panel of different Indian states. Banerjee et al study
the effect of implementation of a given tenancy reform (Operation Barga) within the state
of West Bengal on rice yields in a panel of different districts, and interpret the effects in
terms of reduction of sharecropping distortions. Operation Barga registered sharecropping
contracts, protecting sharecroppers from eviction, and legislated minimum shares accruing
4For a short history of the classical debates on this question, see Johnson (1950). For a survey of the
more recent theoretical literature on sharecropping see Singh (1989) and Bardhan and Udry (1999). Also
see Binswanger et al (1993) for a survey of the literature on land reform in developing countries.5See Banerjee, Gertler and Ghatak (2002) for analysis of some of these contrasting effects of tenancy
regulations.
2

to the tenant.6
Compared to Besley and Burgess, the Banerjee et al paper pertains to a substantially
lower level of aggregation (districts rather than states) and uses a more reliable measure
of sharecropping reform (the proportion of tenants registered, rather than the number of
legislative amendments). Yet, the level of aggregation is still too high for the results to be
interpretable as the effects on sharecropping distortions alone. A more direct test would
require use of data at the level of individual farms, distinguishing between effects on tenant
and owner-cultivated farms, and between partial and general equilibrium effects. That is
the purpose of this paper.
We use a disaggregated farm panel in West Bengal, which has implemented a range
of reforms in land property rights and local governance since the late 1970s. This state
experienced a spurt in the rate of growth of agricultural production starting in the 1980s,
associated with large increases in the adoption of high yielding varieties (HYV) rice. We are
also interested in understanding the main causes of this growth; in particular the role of the
land reforms, as distinguished from farm extension programs, changes in market prices, or
autonomous processes of diffusion of HYV rice. Our analysis is distinguished from previous
studies by its use of more reliable farm production data, the level of disaggregation, controls
for other farm extension programs administered by local governments, and for potential
endogeneity of program implementation.
Our principal results are the following. Tenancy reforms had a statistically significant,
positive impact on farm productivity. However, we cannot precisely distinguish differences
in impact between tenant and owner-cultivated farms. There were large spillovers to non-
tenant farms, indicating the existence of a significant general equilibrium impact of the
tenancy reform. Hence the productivity impact of the reforms cannot be understood in
terms of reduction of sharecropping distortions in tenant farms alone. We explore a number
of possible channels of productivity spillovers from tenant to owner-cultivated farms. The
evidence is not consistent with various channels such as effects on the cost of credit, seeds,
land markets, improved targeting of extension programs by local governments, or diffusion of
6Further details of the program are provided in Section 2 below.
3

high-yielding rice varieties. It is possible, however, that they operated via local groundwater
markets: increased demand for water by tenants may have stimulated increased investment
in tubewells and thereby lowered the equilibrium price of groundwater. We are exploring
this channel in our currently ongoing research.
A second set of results concern the relative contribution to farm productivity growth of
land titling programs, the tenancy regulation program, and various farm extension programs
administered by local governments. We find no statistically significant effects of the land
titling program. The contribution of the tenancy regulation program is small, of the order
of 5%, in contrast to the estimate of 20% provided by Banerjee et al (2002). At the same
time the role of farm extension programs was much larger, ranging between 75% growth
over 1982–95 resulting from irrigation, and over 100% growth for supply of seeds, fertilizers
and credit.7 In particular the supply of agricultural minikits (containing HYV seeds and
fertilizers) had large effects on adoption of high-yielding rice varieties, whereas the tenancy
program had no significant effect on these adoption rates.8
Section 2 describes the context of West Bengal agriculture, the various land reform and
extension programs, and the nature of our data. Section 3 provides the main empirical
estimates of the programs on farm productivity. Section 4 explores possible channels of
impact, including direct tests for sharecropping distortion in tenant farms, and various
channels for spillovers to non-tenant farms. Section 5 concludes.
7These pertain to the effect of growth in these factors alone, which over-predict the actual growth ob-
served. There are many other controls in our regression, including common year effects and price changes,
which presumably caused actual productivity growth to be lower than is predicted by these input supply
programs alone.8Specifically, the bulk of the productivity impact of the tenancy reform consisted of increased yields of
traditional rice varieties, and similar increases in areas cropped under both traditional and new rice varieties.
4
2 Background and Data Description
2.1 Land Reform Programs
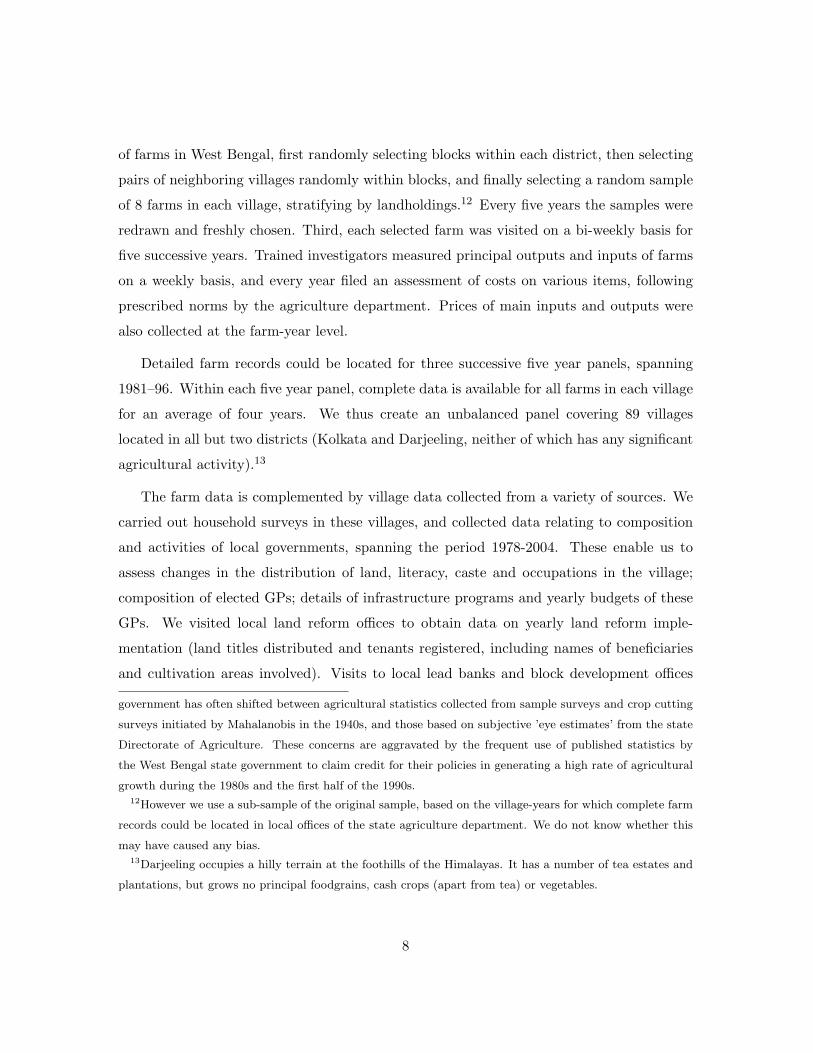
Following Independence in 1947, land reforms were an important priority for newly elected
governments at both the central and state levels in India. These included abolition of
intermediary landlords (zamindars), redistribution of lands above mandated ceilings, and
regulation of tenancy. Responsibility for agricultural policy is vested in state governments
under the Indian Constitution. Respective states proceeded to enact suitable legislation in
the early 1950s, with encouragement and assistance from the central government.
Like many other states, West Bengal faced a large number of problems with regard
to implementation of land reform laws until the late 1960s, owing to loopholes in legisla-
tion, poor land records and lack of political will (associated with the control of the state
government by the Congress party, whose rural base rested on the support of landlords).
From 1966 until 1971 a number of coalition governments were formed, in some of which
Left parties (including the Communist Party of India (Marxist), or CPM) played part. The
late 1960s also witnessed an armed peasant uprising in the state associated with extreme
Left-wing parties utilizing guerrilla tactics, which seriously threatened law and order in the
state. Partly for these reasons, elected governments in the 1970s were more resolved to
implement land reforms, by closing legal loopholes, and reinforcing administrative efforts.
A new Land Reforms Act was passed in 1971, redefining land ceilings that formed the basis
of land redistribution programs. In 1977 a Left-front coalition headed by the CPM won
an absolute majority in the state government. From the very beginning implementation of
land reforms was a top priority for this government, along with delegation of delivery of
development and welfare programs to a newly created three-tier system of directly elected
local governments. This Left coalition has subsequently remained in power at the state level
until the present day, thus enabling these reforms in land reform implementation and local
governance to be continued over successive decades.
There were two principal land reform programs. The first represents appropriation of
lands (a process known as vesting) above the legislated ceilings from large landowners, and
5

subsequent distribution of this land to the landless in the form of titles to small land plots
(called pattas). Most of the vesting had been carried out prior to 1978.9 According to
the Left Front government’s own admission, it had been unable to markedly increase the
extent of land vested over the amount available in 1978; hence its main initiative has been
the distribution of vested land in the form of land titles. Hence we shall focus on the
distribution of land titles to the poor. For the state as a whole, P.S. Appu (1996, Appendix
IV.3) estimates the extent of land distributed until 1992 at 6.72% of its operated area,
against a national average of 1.34%.10
The other land reform program involved registration of tenancy contracts. In 1977 the
newly elected Left Front government amended the 1971 Land Reforms Act, making share-
cropping hereditary, rendered eviction by landlords a punishable offense, and shifted the
onus of proof concerning identity of the actual tiller on the landlord. Subsequently they
initiated a mass mobilization drive with the assistance of farmer unions (Kisan Sabha) and
newly empowered local governments to identify sharecropping tenants and induce them to
register their contracts with the local Land Records office. Registration was also accom-
panied by a floor on the share accruing to tenants, amounting to 75% (replaced by 50% if
the landlord pays cost of all non-labor inputs). Over a million tenants were registered by
1981, up from 242,000 in 1978 (Lieten (1992, Table 5.1)), increasing to almost one and a
half million by 1990. Lieten (1992, p. 161) estimates on the basis of different assumptions
concerning the actual number of sharecroppers in the state, that upwards of 80% of all
sharecroppers were registered in the state by the early 1990s, while Banerjee et al (2002,
p.242) estimate this proportion to be around 65%.
These land reforms were complemented with creation of a three tier system of panchay-
ats or elected local governments (Gram Panchayats (GPs)), who were delegated responsi-
bility for delivery of various input supply services and local infrastructure. The principal
responsibilities entrusted to the panchayats included implementation of land reforms, of
9We were able to get data on the time pattern of vesting in 34 of our sample villages, where we found
70% had been vested prior to 1978.10Only one other state (Jammu and Kashmir) achieved a higher percentage, with the vast majority of
states distributing less than 1.5% of operated area.
6

the two principal poverty alleviation schemes (the Integrated Rural Development Program
which gave subsidized credit to the poor, and employment programs such as Food for Work
(FFW), National Rural Employment Program (NREP), Rural Labour Employment Guar-
antee Program (RLEGP) in the 1980s which were merged into the Jawahar Rozgar Yojana
(JRY) from 1989 onwards), distribution of subsidized agricultural inputs (in the form of
minikits containing seeds, fertilizers and pesticides), local infrastructure projects (including
roads and irrigation), and miscellaneous welfare schemes (old-age assistance, disaster relief,
housing programs for the poor etc.). The bulk of the funds (78% in our sample) for these
programs were devolved to the local governments under various schemes sponsored by the
central and state government. The funds percolated down from the central government to
GPs through the state government, its district-wide allocations, and then down through the
upper tiers of the panchayats at the block and district levels. Upper tiers of the panchayats
thus affected allocation across different GPs, while the main role of the GP was to select
beneficiaries of these schemes within their jurisdiction.
2.2 Data
Our study is based on data from cost of cultivation surveys carried out by the Department
of Agriculture of the state government. These surveys were carried out for the purpose of
estimating agricultural costs of principal crops in the state. These are aggregated at the
state level and eventually sent to the Commission for Agricultural Costs and Prices at the
central government in New Delhi, which uses this information to set foodgrain prices on a
cost-plus basis.
A number of reasons make the data from these surveys especially reliable. First, the
surveys are not used by the government to estimate agricultural production levels in the
state. So they are not subject to reporting biases that have been argued to afflict published
statistics of the state government used by most previous studies (including Besley-Burgess
(2000) and Banerjee et al (2002)).11 Second, the surveys selected a stratified random sample
11Considerable doubt has been raised about the reliability of agricultural output data of the West Bengal
state government, by Boyce (1987) and Datta Ray (1994). They describe how the West Bengal state
7
of farms in West Bengal, first randomly selecting blocks within each district, then selecting
pairs of neighboring villages randomly within blocks, and finally selecting a random sample
of 8 farms in each village, stratifying by landholdings.12 Every five years the samples were
redrawn and freshly chosen. Third, each selected farm was visited on a bi-weekly basis for
five successive years. Trained investigators measured principal outputs and inputs of farms
on a weekly basis, and every year filed an assessment of costs on various items, following
prescribed norms by the agriculture department. Prices of main inputs and outputs were
also collected at the farm-year level.
Detailed farm records could be located for three successive five year panels, spanning
1981–96. Within each five year panel, complete data is available for all farms in each village
for an average of four years. We thus create an unbalanced panel covering 89 villages
located in all but two districts (Kolkata and Darjeeling, neither of which has any significant
agricultural activity).13
The farm data is complemented by village data collected from a variety of sources. We
carried out household surveys in these villages, and collected data relating to composition
and activities of local governments, spanning the period 1978-2004. These enable us to
assess changes in the distribution of land, literacy, caste and occupations in the village;
composition of elected GPs; details of infrastructure programs and yearly budgets of these
GPs. We visited local land reform offices to obtain data on yearly land reform imple-
mentation (land titles distributed and tenants registered, including names of beneficiaries
and cultivation areas involved). Visits to local lead banks and block development offices
government has often shifted between agricultural statistics collected from sample surveys and crop cutting
surveys initiated by Mahalanobis in the 1940s, and those based on subjective ’eye estimates’ from the state
Directorate of Agriculture. These concerns are aggravated by the frequent use of published statistics by
the West Bengal state government to claim credit for their policies in generating a high rate of agricultural
growth during the 1980s and the first half of the 1990s.12However we use a sub-sample of the original sample, based on the village-years for which complete farm
records could be located in local offices of the state agriculture department. We do not know whether this
may have caused any bias.13Darjeeling occupies a hilly terrain at the foothills of the Himalayas. It has a number of tea estates and
plantations, but grows no principal foodgrains, cash crops (apart from tea) or vegetables.
8

generated yearly data on distribution of IRDP credit and agricultural minikits in each vil-
lage. GP records yielded yearly allocation of spending and scale of various infrastructure
projects. We also collected data on rainfall from local recording centers of the state Me-
teorological department, leading economic indicators at the district or regional level from
published statistics of the state government, and outcomes of elections to the state and
national legislatures in each constituency spanning the sample areas.
Summary statistics concerning the villages in our sample are provided in Table 1. The
sample includes 89 villages in 57 GPs. Each GP consists of ten to twenty elected members
of a council governing administration of the jurisdiction of the GP, which usually consists
of eight to fifteen villages or mouzas. On average each district comprises 20 blocks and
200 GPs. Table 1 shows the principal demographic and asset distribution changes in the
sample villages between 1978 and 1998, based on an indirect household survey administered
in each village in 1998.14 The distribution of cultivable non-patta land (i.e., excluding land
distributed through the land reforms) shows increasing landlessness, as well as a redistri-
bution of land from large to small landowning households, resulting from splitting of large
landholdings (via market sales of land and household sub-division).
Table 2 indicates the extent of land reform implemented in our sample by 1998. Ap-
proximately 5.4% of cultivable land was distributed to 15% of the population in the form of
registered land titles. Approximately 6% of cultivable land involved leased lands on which
tenants (bargadars) were recorded. However, 2% had already been registered by 1978, so
the incremental area covered by the program since 1978 was 4%. The proportion of house-
holds registered by 1998 was 4.4%. Aggregating the two programs, therefore, about 11.5%
of operational land area was affected, and 20% of all households benefited.
Table 3 depicts trends in agricultural inputs provided by the GPs in our sample vil-
14This involved selection of voter lists for 1978 and 1998, and interviews with four or five different senior
citizens in each village to identify land and demographic status of each household for those two years
respectively. The details of this survey are described further in Bardhan and Mookherjee (BM, hereafter)
(2004b). In particular the land distribution obtained thereby when aggregated to the district level matches
quite closely the distributions reported in the state Agricultural Census as well as National Sample Survey
(NSS) decadal surveys of operational holdings in West Bengal.
9

lages between 1982–95.15 The 1980s witnessed larger supplies of IRDP credit and minikits
compared with the 1990s. One out of every nine households received minikits in the 1980s,
containing seeds, fertilizers and pesticides. The bulk of employment funds were spent by
GPs on building and maintenance of local roads; these employment programs created 2-4
mandays of employment per household every year. There was also expansion of areas irri-
gated by state canals. Greater expansions were witnessed in medium and small irrigation
projects, many of which were managed by panchayat officials. Spending on irrigation by
the panchayats was highest during the early part of the period, fell sharply throughout the
1980s, and stabilized thereafter. A similar trend was observed for GP spending on local
roads, except that there was an upturn towards the end of the period.
The last two rows of Table 3 provide (for the sake of comparison) the land reforms imple-
mented at these corresponding years: these peaked in the first half of the 1980s and tailed
away thereafter. Clearly, these became insignificant relative to input and infrastructure
provision from the mid-1980s onwards.
Table 4 shows average allocation of cropped area across different crops in our farm
sample, and their respective yields (measured by value added per acre). Rice accounted
for two-thirds of cropped area, with HYV rice accounting for 28% on average across the
entire period. HYV rice yields were two and a half times those of traditional rice varieties.
Only potatoes generate a higher return (measured by value added per acre) than HYV rice;
however the short potato season (which lasts 70-90 days) limits the acreage devoted to this
crop. Other cash crops such as jute and tobacco generate high returns, followed by pulses,
vegetables and oilseeds, with wheat generating the lowest returns.
Table 5 shows changes over time in cropping patterns, yields and incomes: these are
weighted averages across farms in the sample for the beginning and end of each separate
panel (1982–85, 1986–90 and 1991–96).16 Cropped area per farm grew at a modest rate
15These averages use operational land area in different villages as weights, the reason the numbers reported
here differ from the unweighted averages reported in BM (2004a, 2006).16Cropped area per farm and hired labor employed are not weighted. The three panels contained 56, 155
and 131 farms respectively. We do not report averages for the first year 1981 of the first panel, owing to
many missing observations for that year.
10

(about 10%) for each five year period in the 1980s, but did not grow in the 1990s. HYV
rice adoption rates grew dramatically, from 1 to 8% in the first panel, 16 to 32% in the
second panel, and 46 to 53% in the third. Value added per acre in rice grew analogously,
by almost 50%, 80% and 30% in the three panels. Farm incomes grew at similar rates,
indicating the importance of rice in the growth process. The wage rate of hired workers
remained stationary throughout the 1980s, but grew about 20% in the first half of the 1990s.
Employment rates increased during the 1980s, but fell by about 15% during the early 1990s.
Hence incomes of agricultural workers, the poorest section of the rural population, grew at
a modest rate.
Table 6 shows the fraction of farms which leased in land, and associated areas leased in,
for different years in the sample, averaged across all the farms in the sample for any given
year. This is based on the cost of cultivation survey: we infer if a farm is leasing in land for
production of a specific crop in any given year if some rent is paid to a landlord.17 In the
first panel lasting until 1985, there seems to be a downward trend in the extent of tenancy,
with the percent land area leased falling from 13% to 7%. In later panels (1986–90, 1991–
95) no trends are visible, averaging between 1–2% during 1986–90 and around 6% during
1991–95. The proportion of farms leasing in land seems rather low, ranging between 1–2%.
In comparison Table 2 calculated on the basis of the village land records and the indirect
household survey shows that 3–4% of households in the sample villages were registered in
the program. So there is possibly some under-representation of tenants in the sample.
Further information concerning the nature of tenancy contracts is not available in the
cost of cultivation surveys. For the state of West Bengal as a whole, the Operational
Holdings survey of the National Sample Survey (NSS) for the year 1991-92 indicates that
14% of all operational holdings (and 10.4% of the area) was leased in. Of these 3.7% were
fixed rent tenants, while 8.8% were sharecroppers. Of the total area leased in, about 48%
was on sharecropped contracts, and 19% on fixed rent contracts. Hence on the basis of the
NSS estimates the extent of sharecropping tenancy in the state seems rather low, of the
17Indeed, we do not know what part of the land devoted to that crop was leased in. So we assume that
all of it was. This implies that the tenancy area estimate is biased upward.
11

order of 5% of operational area. It seems unlikely on this basis that the tenancy registration
program could explain a rise in farm yields of the order of 20% estimated by Banerjee et al
(2002), or a rise in the adoption rate of HYV rice to over 30% of total cropped area by the
mid-90s.
The NSS 1991-92 survey also indicates two thirds of all tenancy leases exceeded two
years in duration, and 48% exceeded five years in duration. Short term leases of a year
or less accounted for 22%. Details concerning tenant crop shares are not available from
any source, apart from the survey carried out by Banerjee et al (2002) for a sample of 20
villages, who report that the proportion of tenants with crop shares exceeding 75% rose
from approximately 5% to approximately 20% with the reforms, and those exceeding 50%
rose from 17% to 39%. There is a significant peak at a crop share of exactly 50%, which
fell from approximately 80% to approximately 60%. Hence the program appears to have
raised crop shares for approximately 20% of the tenants. This reduces the incidence of the
program even further. In summary, the extent of area covered by the tenancy registration
program appears quite limited, and there is some under-representation of the incidence of
tenancy in our sample compared to the entire state.
3 Estimating Effects of Programs on Farm Yields
3.1 Effect of Land Reforms: Theoretical Hypotheses
The effect of land reforms on farm productivity have been the topic of a large literature
in development economics. The classic arguments concern Marshallian inefficiencies arising
from sharecropping, where the share paid to the landlord acts as a tax on the tenant’s ef-
fort. Sharecropper registration can raise farmer incentives by capping this implicit tax rate.
Other incentive effects arise from removing the right of landlords to evict tenants: the direc-
tion of these are ambiguous, owing to conflicts between different effects.18 Eviction threats
can be used by landlords as an incentive device, the removal of which could dull tenant
18Regulation of eviction rights may be needed in the absence of the ability of landlords to commit to leases
of long duration.
12

incentives. On the other hand, security of tenure may promote longer time horizons for the
tenant and thereby increase investment incentives. These issues are discussed in Bardhan
(1984), Dutta, Ray and Sengupta (1989) and Banerjee, Gertler and Ghatak (2002).19 In
addition, registered sharecroppers were eligible to apply for production loans from formal
credit channels, which could reduce their credit costs (owing to significant differences in
interest rates between formal and informal credit sources).20
The incentive effects of redistributing land ownership have also been discussed in pre-
vious literature (Bardhan (1973), Berry and Cline (1979), Eswaran and Kotwal (1986),
Binswanger et al (1993), Mookherjee (1997)). In general, the effect depends on the extent
of economies or diseconomies of scale. Given the advantages of family labor cultivation over
hired labor, and the relative lack of important sources of scale economies (such as mecha-
nization) in rice cultivation, one might expect small farms to be more productive than large
farms. While such a pattern has frequently been empirically observed, it is possible that
they reflect differences in unobserved soil characteristics between small and large farms. If
more productive lands are more prone to fragmentation, small farms may be expected to
have more fertile soils, in which case observed yield differences between small and large
farms overstate the effect of land redistribution programs.
As explained previously the land titling program mainly concerned distribution of ti-
tles to land that had previously been appropriated from those holding surplus land above
legislated land ceilings. Distribution of already-vested lands would enable them to be ac-
tively cultivated instead of lying fallow, in which case one would expect a rise in production
yields. Of course these yield improvements would be negligible if the transferred lands
were of inferior quality or of very small size. The average size of land parcels distributed
19The theoretical literature (see, e.g., Mookherjee (1997)) also clarifies that the reforms can raise farm
productivity but typically do not constitute a Pareto improvement. Landlords and those with more land
than the ceiling allows are typically rendered worse off, while tenants and recipients of land titles are better
off. This also explains why sharecropping as an institution persists, despite the existence of associated
distortions. Voluntary sales of land to tenants or landless households would therefore not occur in a laissez
faire economy.20We have learnt this from interviews with government and bank officials, as well as sharecroppers. We
do not, however, have data on access and costs of credit.
13

was approximately half an acre, compared with an average size of 1.5 acres for plots regis-
tered under Operation Barga, the tenancy registration program. Moreover, while the latter
were cultivable by their very nature, approximately half of all titles distributed consisted
of non-cultivable land. We have also been told by bank officials and farmers that we inter-
viewed that farmers were not eligible for bank loans on the basis of the titles received in the
land reform program, mainly owing to the uneconomically small size and poor quality of
the land parcels concerned. Therefore the productivity impact of the land titling program
could be expected to be less significant than the effects of tenancy registration, and we focus
principally on the latter.
3.2 Impact of Operation Barga on Farm Value Added Per Acre
Column 1 in Table 7 presents an OLS panel regression of farm value added per acre on
a dummy for farms leasing in land, and on the percent of land registered in the village
until the previous year, apart from farm, year dummies and controls for farm acreage. 21
Note that the tenancy dummy of obtained from the farm cost of cultivation data, while the
tenancy registration rate is obtained from the land records office pertaining to the village
as a whole. The reason we do the latter is that we do not know if the tenant farmer in
question had registered in any given year. Hence we use the registration rate in the village as
a proxy for the likelihood that a randomly chosen tenant farmer has been registered. Even
if a particular tenant did not register, the option to register would be expected to raise the
bargaining power and hence the share accruing to the tenant. Hence the registration rate
in the village is also a reasonable indicator of this outside option effect.
To control for possible endogeneity of the leasing decision, the second column replaces
the current lease dummy by the fraction of years in the sample (that the farmer appears)
that it leased in land. By construction this is a farm-related variable that does not change
21We know from some of the literature on agency problems with respect to hired labor in conjunction
with credit market imperfections may cause farms to rely on family labor as far as possible (Eswaran and
Kotwal (1986)). Given family size, increases in cropped area cause increasing reliance on hired labor, which
therefore tends to increase agency problems and lowers farm profits. We therefore need to include controls
for cropped area in the regression to capture this effect.
14

across years, and represents differences in the average extent of leasing across farms. The
interaction of this variable with the extent of tenancy registration in the village represents
variations in the effect of the program across tenant and non-tenant farms.
These two columns in Table 7 show that the effect of leasing and its interaction with
tenancy registration rates in the village have the signs that would be expected from the
Marshall-Mill theory of sharecropping distortions, but these effects are statistically insignif-
icant.
The next set of columns in Table 7 include possible spillover effects of the tenancy
registration program on non-tenant farms, as well as controls for the land titling program
and other extension programs implemented by local governments. We add the tenancy
registration rate as a regressor, besides its interaction with leasing. Note that we use the
percent area registered as estimated from the local land records, rather than the proportion
of tenants registered (the measure used by Banerjee et al). The proportion of area registered
obviously represents more closely to the incidence of the program in the village, compared
with the proportion of tenants registered. The latter proportion averages around 50% in
the sample, and 65% for all West Bengal in 1993, in contrast to less that 5% operational
area that was covered by the program.
Note also that the registration rate pertains to the village as a whole: this regressor
by itself (i.e., controlling for its interaction with the lease dummy or fraction) represents a
common effect of the program on the profitability of all farms in the village in future years,
via general equilibrium, governance or learning spillovers.
The regressions in columns 3,4 of Table 7 also add as controls the distribution of land
titles to poor households, and various farm input supply and infrastructure programs ad-
ministered by GPs: specifically, cumulative lagged values of: (a) proportion of cultivable
land distributed in the form of pattas; (b) minikits distributed in the village per household,
(c) IRDP credit subsidy delivered per household, (c) log of the cumulative GP expendi-
tures (in constant 1980 prices) per household on local irrigation and road projects, and (d)
cumulative mandays of employment generated by GP programs per household. Additional
controls include annual rainfall at the nearest weather station, the log of the rice price
15

received by the farmer, canals and roads provided by the state government in the district,
apart from farm and year effects. The regression specification is thus:
Vfvt = β1Lfvt+β2Lfvt∗Bv,t−1+β3Afvt+β4A2fvt+β5Bv,t−1+β6Pv,t−1+β7Ev,t−1+γf +δt+εfvt
where Lfvt denotes the dummy for whether farm f in village v in year t leased in land,
Bv,t−1 denotes cumulative proportion of agricultural land registered under Operation Barga
in village until year t − 1, Afvt is the gross cropped area in the farm in year t, Pv,t−1 is the
cumulative proportion of cultivable land in the village distributed in the form of land titles,
Ev,t−1 is the cumulative per capita delivery of extension services to the village until year
t − 1. The coefficients β5, β6, β7 represent spillover effects of village development programs
delivered by GPs on future profits of all farms in the village, in contrast to β2 which is the
direct effect on farms leasing in land owing to a reduction in sharecropping distortions.
We see now that inclusion of the village controls representing different government in-
terventions results in a higher coefficient on the interaction of leasing with Operation Barga
implementation.22 However, in no version is this coefficient statistically significant, even at
10% significance level.
More surprising is the strong significance of the spillover effects of the tenancy regis-
tration program, the delivery of kits, credit and local irrigation. These represent common
effects of these interventions on profitability of all farms in the village, most of which we
know (from Table 6) were not leasing any land at all. The estimated spillover effect of
tenancy registration on non-tenant farms is larger than the point estimate of the direct
impact on the tenant farms.
22This reflects a negative partial correlation between Barga implementation and delivery of minikits, the
program which we shall see was the largest significant source of farm productivity growth. A regression of
% land registered on all the other programs, controlling for village and year effects, shows a statistically
significant (at 1%) and negative effect of cumulative minikits delivered per household. In other words,
Operation Barga tended to be implemented more vigorously in villages with relatively slow growth in minikit
delivery. Hence controlling for the latter results in an increase in the estimated effect of Operation Barga.
16
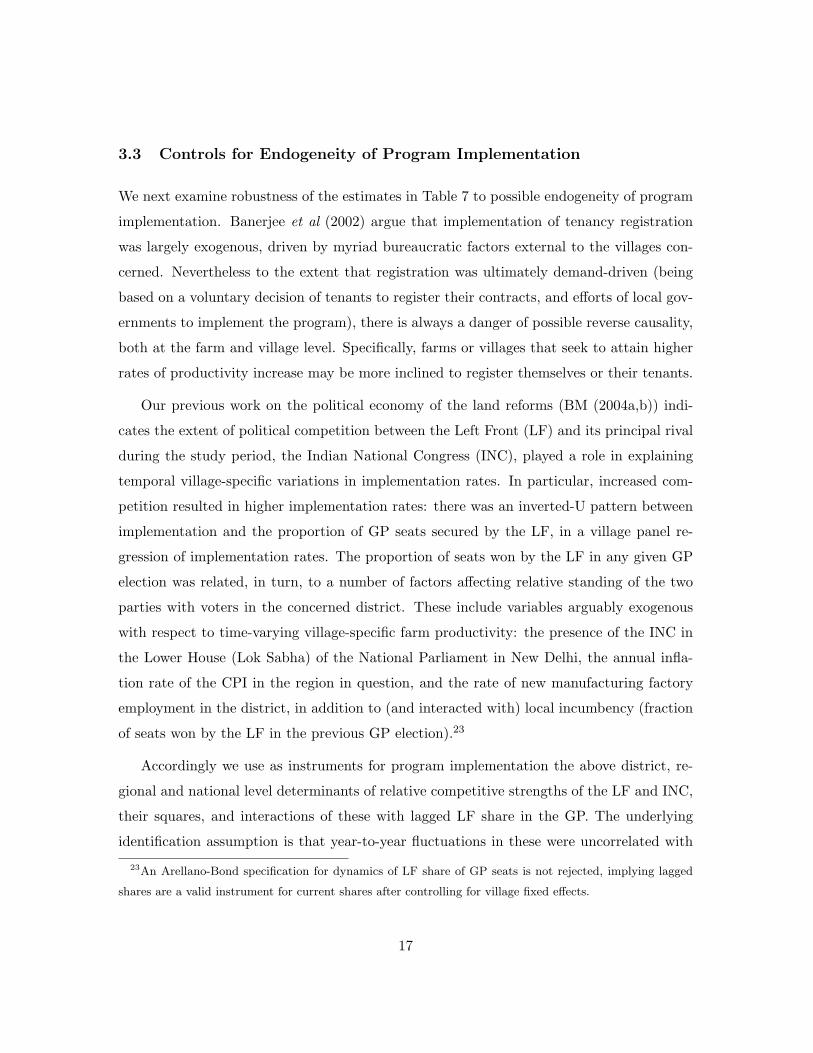
3.3 Controls for Endogeneity of Program Implementation
We next examine robustness of the estimates in Table 7 to possible endogeneity of program
implementation. Banerjee et al (2002) argue that implementation of tenancy registration
was largely exogenous, driven by myriad bureaucratic factors external to the villages con-
cerned. Nevertheless to the extent that registration was ultimately demand-driven (being
based on a voluntary decision of tenants to register their contracts, and efforts of local gov-
ernments to implement the program), there is always a danger of possible reverse causality,
both at the farm and village level. Specifically, farms or villages that seek to attain higher
rates of productivity increase may be more inclined to register themselves or their tenants.
Our previous work on the political economy of the land reforms (BM (2004a,b)) indi-
cates the extent of political competition between the Left Front (LF) and its principal rival
during the study period, the Indian National Congress (INC), played a role in explaining
temporal village-specific variations in implementation rates. In particular, increased com-
petition resulted in higher implementation rates: there was an inverted-U pattern between
implementation and the proportion of GP seats secured by the LF, in a village panel re-
gression of implementation rates. The proportion of seats won by the LF in any given GP
election was related, in turn, to a number of factors affecting relative standing of the two
parties with voters in the concerned district. These include variables arguably exogenous
with respect to time-varying village-specific farm productivity: the presence of the INC in
the Lower House (Lok Sabha) of the National Parliament in New Delhi, the annual infla-
tion rate of the CPI in the region in question, and the rate of new manufacturing factory
employment in the district, in addition to (and interacted with) local incumbency (fraction
of seats won by the LF in the previous GP election).23
Accordingly we use as instruments for program implementation the above district, re-
gional and national level determinants of relative competitive strengths of the LF and INC,
their squares, and interactions of these with lagged LF share in the GP. The underlying
identification assumption is that year-to-year fluctuations in these were uncorrelated with
23An Arellano-Bond specification for dynamics of LF share of GP seats is not rejected, implying lagged
shares are a valid instrument for current shares after controlling for village fixed effects.
17

farm productivity in each village, after accounting for their effect on various programs
affecting productivity of local farms. The validity of this assumption depends on the com-
prehensiveness of the set of programs that we include as controls.
One cannot be completely sure of course that all relevant direct channels of influence
have been controlled for. But our IV estimates should remove a large source of local
time-varying sources of unobserved village-level factors affecting farm productivity growth,
predicting them instead on the basis of political and economic factors on a substantially
wider geographic area (interacted with local incumbency patterns). The direction of bias
associated with potential endogeneity of implementation rates at the local level can be
inferred by comparing OLS and IV estimates.
Other extension programs are instrumented by the scale of the corresponding program
at the level of the state, interacted with the same variables affecting political competition.
The idea here is that temporal fluctuations in the scale of these programs in the state as a
whole resulted from financial, administrative and political factors at the level of the state
government. These percolated down to villages and farms within those villages through a
hierarchical system, with relative allocations across different villages determined partly by
the same variables representing political competition at the district or regional levels.
We use this method to control for endogeneity of the three principal programs: IRDP
credit, minikits, and sponsored program grants devolved to GPs out of which local irrigation
projects are funded. The scale of the program at the state level is estimated by the average
supply of the program across all sample villages in any given year.
The detailed set of instruments is therefore the following: lagged cumulatives of (a)
percent Congress seats in Parliament in the previous General Election, interacted with
lagged Left share of GP seats; (b) local inflation rate of cost of living, interacted with lagged
Left share of GP seats; (c) lagged Left share of GP seats; (d) squares of the above variables;
(e) interactions of the previous variables with IRDP credit, minikits, and sponsored program
funds, averaged across all GPs in that year. F-statistics and partial-R sq. for first stage
regressions are reported at the bottom of the Table, all of which are significant.
Column 1 of Table 8 shows the IV estimates of the regression previously reported in
18

column 3 of Table 7. The IV estimate of the spillover effect of the tenancy registration pro-
gram, and of the minikits distributed, is approximately twice the size of the OLS estimate.
Both are statistically significant at the 1% level. The IRDP credit disbursement effect also
gains in significance, and now the employment mandays generated by local infrastructure
programs also becomes significant at the 5% level.
The fact that the IV estimates are substantially larger than the OLS estimates possibly
reflects the tendency for land reform and farm extension programs to be more vigorously
implemented in villages where other sources of farm productivity growth were lower, i.e.,
they were implemented more vigorously in lagging regions. This may have owed to the
efforts of the concerned local governments to speed up development of the lagging regions,
and the greater desire of farms in these regions to catch up with those in other regions.
Even if one may doubt whether the exclusion restrictions are exactly valid for the set of
instruments we use, the fact that the OLS results are strengthened in the IV regressions
indicates that it is unlikely that the were driven by endogeneity of program implementation.
The estimated differential impact of tenancy registration on yields of tenant farms vis-
a-vis owner-cultivated farms is however unchanged; it continues to remain insignificant
statistically. Hence controlling for endogeneity of program implementation appears to raise
the spillover effect of tenancy registration, without enabling us to precisely measure the
direct incentive effects of the reforms. To doubly verify our interpretation of the spillover
effects, columns 2 and 3 of Table 8 re-run the same regression in OLS and IV for the sample
consisting of pure owner-cultivated farms, and find the same results.
Next, Table 9 reports corresponding OLS and IV regressions at a higher level of aggrega-
tion: average yields in the village (computed using the village sample of farms and weighting
their respective yields by their relative cropped areas). This allows us to study heterogene-
ity of treatment impacts on (and changes in composition within the village across) farms of
differing sizes. It controls for one set of possible general equilibrium impacts: changes in the
distribution of cropped area in the village between marginal farms (with operational holding
below 2.5 acres), medium (between 2.5 and 5 acres) and big farms, and the proportion of
these respective areas operated by tenant farms. Interactions of the latter with the extent
19

of tenancy registration in the village are reported in the first three rows, thus allowing the
direct incentive effect of the reform to depend on farm size.
We see that the OLS estimate of the direct effect of the reform is significant (at the 10%
level) for medium sized farms, and is substantially larger than the previous estimates of the
average (direct) effect on all tenant farms. For medium sized farms the direct effect is also
substantially larger than the spillover effect. This suggests substantial heterogeneity across
different size categories in the direct productivity effects of Operation Barga on tenant
farms. However, the IV estimate of the direct effect is statistically insignificant, though
of similar magnitude as the OLS estimate. Hence the direct effects of the tenancy reform
continue to be imprecisely estimated.
At the same time, the spillover effects continue to be large and significant, though
somewhat smaller in magnitude than the farm-level estimate. Presumably induced effects
of the programs on the distribution across farms within the village cause some reduction in
the productivity effect, but they are not large enough to nullify the increase in intra-farm
productivity.
To assess the relative quantitative significance of the direct and spillover effects, as well
as of the land reforms relative to farm input services, Table 10A calculates the predicted
impact of different programs on farm yields. We calculate the percent change in value added
per acre between 1982 and 1995 in a hypothetical village in which the proportion of land
registered under Operation Barga was equal to the weighted average for the entire sample
(with weights proportional to operational areas of cultivation). We compare this with the
change predicted by a hypothetical change in cumulative supply of kits, credit and GP
expenditures on irrigation, equal to the weighted average of the observed changes in the
sample villages (with weights again taken proportional to operational areas). We calculate
the impact of tenancy registration to be of the order of 5% for yields on non-tenant farms.
This estimate would be higher for tenant farms, depending on which estimate of the direct
productivity impact on tenant farms we take. Tables 7 and 8 indicates the direct impact
is smaller than the general spillover effect, while Table 9 indicates it may be two to three
times larger for medium-sized farms. This indicates a range of 8 to 20% increase in yields
20
for tenant farms.
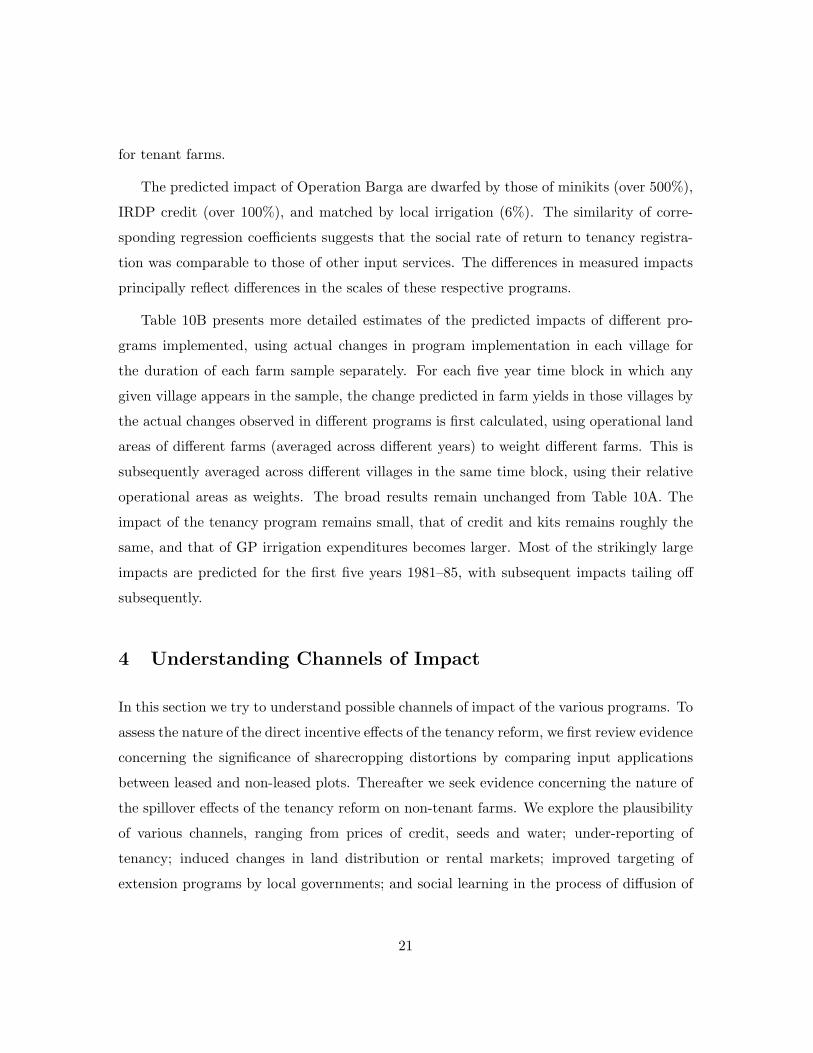
The predicted impact of Operation Barga are dwarfed by those of minikits (over 500%),
IRDP credit (over 100%), and matched by local irrigation (6%). The similarity of corre-
sponding regression coefficients suggests that the social rate of return to tenancy registra-
tion was comparable to those of other input services. The differences in measured impacts
principally reflect differences in the scales of these respective programs.
Table 10B presents more detailed estimates of the predicted impacts of different pro-
grams implemented, using actual changes in program implementation in each village for
the duration of each farm sample separately. For each five year time block in which any
given village appears in the sample, the change predicted in farm yields in those villages by
the actual changes observed in different programs is first calculated, using operational land
areas of different farms (averaged across different years) to weight different farms. This is
subsequently averaged across different villages in the same time block, using their relative
operational areas as weights. The broad results remain unchanged from Table 10A. The
impact of the tenancy program remains small, that of credit and kits remains roughly the
same, and that of GP irrigation expenditures becomes larger. Most of the strikingly large
impacts are predicted for the first five years 1981–85, with subsequent impacts tailing off
subsequently.
4 Understanding Channels of Impact
In this section we try to understand possible channels of impact of the various programs. To
assess the nature of the direct incentive effects of the tenancy reform, we first review evidence
concerning the significance of sharecropping distortions by comparing input applications
between leased and non-leased plots. Thereafter we seek evidence concerning the nature of
the spillover effects of the tenancy reform on non-tenant farms. We explore the plausibility
of various channels, ranging from prices of credit, seeds and water; under-reporting of
tenancy; induced changes in land distribution or rental markets; improved targeting of
extension programs by local governments; and social learning in the process of diffusion of
21

HYV rice varieties.
4.1 Sharecropping Distortions
The principal finding above is that the direct incentive effects of the tenancy reform were
weaker and less precisely measured, compared with the spillover effects. One can seek
evidence in alternate ways of the importance of sharecropping distortions, by comparing
inputs applied in tenant and non-tenant farms, using the methodology of Shaban (1987)
and Braido (2006) to compare factor allocations across sharecropped plots and owned plots
in ICRISAT data from South and Central India. Table 11 compares the ratio of input
expenditures to the value of output between leased and non-leased plots in HYV and non-
HYV rice cultivation respectively. The regressions include farmer and year dummies: hence
they compare inputs applied by the same farmer between leased and non-leased plots in
the cultivation of the same crop. Since the dependent variable divides input expenditures
by the value of output, this controls for heterogeneity between leased and non-leased plots
(assuming a Cobb-Douglas specification of the production function, as explained in further
detail by Braido (2006)).
The first column of Table 11 shows that farmers significantly under-applied (by about
20%) inputs to leased plots compared with owned plots in HYV rice cultivation. However
the third column shows no significant difference in non-HYV rice cultivation. The second
and fourth columns interact the leased dummy with the extent of land registered in the
village. In the case of HYV rice, the extent of under-application fell by 12% (as a result
of 100% registration), but this is statistically insignificant. Since the area registered was
substantially smaller than 100%, the evidence shows little direct impact on incentives of
farmers to apply inputs on leased plots. In the case of non-HYV rice, tenancy registration
has a negative, insignificant effect on the application of inputs in leased plots. Hence we
have some direct evidence of the existence of sharecropping distortions but this is limited to
HYV rice, and even there we obtain very limited evidence that it was reduced significantly
by the tenancy registration program.
22
4.2 GE Effects: Credit or Seed Prices
One possible channel of general equilibrium impact on the village economy might operate
via induced changes in the demand and hence prices of key factors such as credit, seeds
or fertilizers. For instance, if registration of tenancy status rendered sharecroppers eligible
for credit from banks at interest rates substantially below informal interest rates, informal
interest rates within the village for crop loans may have declined. This could generate a
spillover to owner-cultivated farms in the same village. Unfortunately the farm data does
not include information about actual interest rates paid by farmers, so we cannot directly
check for pecuniary externalities through the informal interest rate.
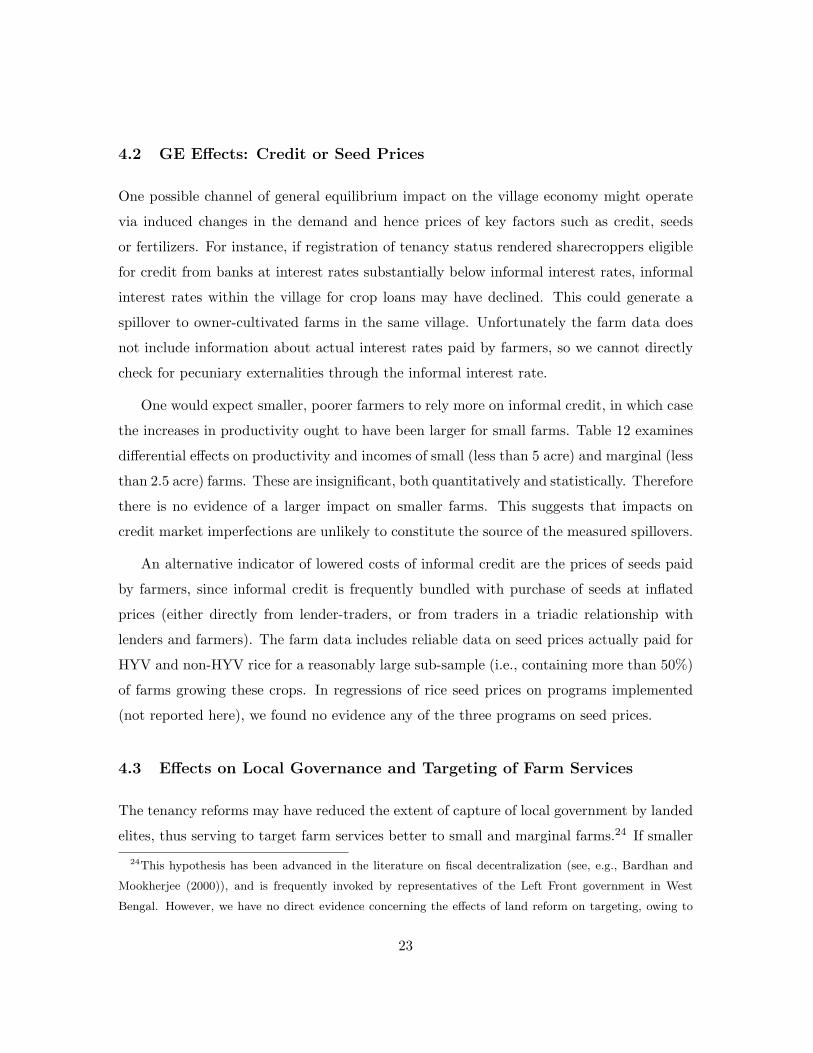
One would expect smaller, poorer farmers to rely more on informal credit, in which case
the increases in productivity ought to have been larger for small farms. Table 12 examines
differential effects on productivity and incomes of small (less than 5 acre) and marginal (less
than 2.5 acre) farms. These are insignificant, both quantitatively and statistically. Therefore
there is no evidence of a larger impact on smaller farms. This suggests that impacts on
credit market imperfections are unlikely to constitute the source of the measured spillovers.
An alternative indicator of lowered costs of informal credit are the prices of seeds paid
by farmers, since informal credit is frequently bundled with purchase of seeds at inflated
prices (either directly from lender-traders, or from traders in a triadic relationship with
lenders and farmers). The farm data includes reliable data on seed prices actually paid for
HYV and non-HYV rice for a reasonably large sub-sample (i.e., containing more than 50%)
of farms growing these crops. In regressions of rice seed prices on programs implemented
(not reported here), we found no evidence any of the three programs on seed prices.
4.3 Effects on Local Governance and Targeting of Farm Services
The tenancy reforms may have reduced the extent of capture of local government by landed
elites, thus serving to target farm services better to small and marginal farms.24 If smaller
24This hypothesis has been advanced in the literature on fiscal decentralization (see, e.g., Bardhan and
Mookherjee (2000)), and is frequently invoked by representatives of the Left Front government in West
Bengal. However, we have no direct evidence concerning the effects of land reform on targeting, owing to
23

farms are more productive than large farms25, this may conceivably raise productivity in
the former group, as well as on the average farm.
However, there is no evidence consistent with this hypothesis. Table 12 showed that
the impact on small or marginal farms did not significantly exceed that on larger farms.
Moreover, in Tables 7 and 8 when we added controls for the proportion of various farm
services delivered to small and marginal farms, it turned out to have insignificant impact,
and did not alter any of the results reported in those tables.
4.4 Undisclosed Tenancy
The measured spillovers could conceivably reflect undisclosed tenancy: in the presence of
sharecropper regulations some landlords may lease land to tenants only if the latter did
not disclose the leasing relationship.26 We have noted in Section 2 that our sample seems
to under-represent the extent of tenancy, by comparing with the land records or NSS data
for the state as a whole. It is conceivable therefore that some farms claiming to be owner-
cultivated were actually tenant farms. The presence of the registration program is likely to
raise the bargaining power of these tenants, so some of the measured spillover effects may
reflect the positive incentive effects of this.
However, we remain skeptical of this possible explanation. Given the political climate
within which these land reforms were implemented, i.e., with LF-led local governments
hostile to the interests of large landowners, the tendency or such under-reporting should
be more pronounced for small farmers leasing in land from big landowners. We would thus
expect a larger measured impact on small and marginal farms. But Table 12 showed that
the spillover effects did not differ significantly across farms of varying size.
the difficulty of statistically identifying this effect in a convincing manner.25Indeed, we do find in our sample that farm value added per acre is declining significantly in farm cropped
area26We thank Maitreesh Ghatak for this observation.
24

4.5 Induced Changes in Land Distribution
An alternative general equilibrium impact of tenancy reforms could be on the distribution
of land, via land markets or household fragmentation. However, these would operate by
affecting the distribution of cultivated land across farms of varying size and ownership
type, and thus cannot explain changes in the productivity within farms that have been
documented in the previous section to form the bulk of the overall effect. Such effects could
arise only if the programs affected the extent to which individual farms tended to lease in
land, or by affecting the size of a representative farm (and of course, provided leasing or
size had significant productivity effects).
Table 6 indicated no pronounced trends in the extent of leasing. Exploring this issue
more carefully, we regressed the proportion of farmers leasing, or area leased within the
village, on the various programs implemented, after controlling for farm, year dummies and
other controls used in Tables 7 and 8. None of the programs displayed any significant effects.
The regressions in Tables 7 and 8 indicate a significant negative relationship between
cropped area and farm productivity, after controlling for farm and year dummies, and all
the other controls in those regressions.27 Is it conceivable that the tenancy program raised
farm productivity by inducing a shrinkage in cropped area of the representative farm? Note
first that this cannot explain the results of Tables 7,8 because those regressions included
farm size among the controls.
Moreover, there is evidence that the tenancy registration program induced an expansion
of cropped area. Table 13 presents IV regressions of gross cropped area in the farm as
a whole, as well as to HYV rice, non-HYV rice and potatoes, on the various programs
implemented, controlling for farm and year dummies. The tenancy program induced a
significant net expansion of cropped area, represented principally with increased cropping
of both traditional and HYV rice varieties. There is no significant impact of any of the
farm extension programs on aggregate cropped area. Hence there is no evidence that the
27Farm cropped area and its square formed part of the controls in those regressions, whose coefficients
were not reported there. A doubling of cropped area was associated with a 10% reduction of farm value
added per acre, which was statistically significant at the 1% level in all the regressions in Tables 7,8.
25

programs raised farm productivity on account of shrinking farm size or cropped area.
4.6 Adoption and Diffusion of HYV Rice
Table 13 also provides useful information about the impact of the programs on adoption of
HYV rice. The tenancy program was associated with a uniform expansion of areas allocated
to both traditional and HYV rice, at the expense of area allocated to potatoes. Hence the
evidence does not show a significant impact of Operation Barga on HYV rice adoption
vis-a-vis traditional varieties, after controlling for farm and year dummies. It is therefore
unlikely that social learning in the process of diffusion of HYV rice constituted an important
source of spillover.
On the other hand, the minikits distributed induced a significant expansion of HYV rice
area, as well as area allocated to potatoes, and an insignificant effect on non-HYV rice area.
Therefore the minikit distribution program seems to have increased incentives to adopt
HYV rice and high-value cash crops such as potatoes (refer Table 4) vis-a-vis traditional
rice varieties. The estimated impact of minikit supply on area allocated to HYV rice was
also ten times larger than the effect of tenancy registration.28 This probably accounts for
the larger productivity impact of the minikits than the tenancy reform.
4.7 Irrigation
Finally, tenancy reform may have affected access to groundwater irrigation. It is well
known that the period covered here displayed a substantial increase in irrigation. This was
partly on account of the high water needs of the summer boro rice crop, which is mostly a
HYV crop. Table 14 shows that farm area irrigated by shallow tubewells29 rose from 7.6%
28With 10% land registered, the area allocated to HYV rice increased by approximately .07 acres. The
increase in minikits supplied was of the order of 1 minikit per household, implying an increase in HYV rice
area by approximately 0.7 acres.29The shallower ones among these consist of wells with a depth of 30–50 feet, costing Rs. 11-12,000 each.
The deeper ones, referred to as submersible or min-deep tubewells have an average depth of 180 feet and
cost Rs. 50,000 each. These are operated with either diesel pumpsets or electricity.
26

in 1981 to over 31% in 1995, while from government canals rose from 5.2 to 5.8%, deep
tubewells30 rose from 2.8 to 4.5%, and ponds or river lift schemes (usually constructed by
local governments) rose from 7.5 to 14.8%.31
Shallow tubewells represent a form of (mostly) private investment in irrigation. The
investment required in a shallow tubewell is typically beyond the capacity of small and
marginal farmers, who purchase water from larger farmers that can afford to invest in
them. Detailed case studies in Moitra and Das (2004) of a number of villages indicate that
in the early 1980s the government provided subsidies and loans to farmers in order to invest
in shallow tubewells. Later in the 1980s as the water depth fell, investments switched to the
deeper submersible wells or dugwells which were more expensive, and in which most of the
investments were private and unsubsidized. The significant expansion in these tubewells
(combined with their role in expanding boro rice cultivation) have raised questions among
various commentators about whether the expansion in farm productivity in West Bengal
owes more to private investment than government land reforms and extension programs
(e.g., Harriss (1993), Moitra and Das (2004)).
It is possible, however, that part of the expansion in private irrigation investments may
have been stimulated by the tenancy reform. The tenancy reform may have increased the
incentive of tenants to apply water in their farms, and thus shifted the demand function
for groundwater outwards. This in turn could have stimulated investments in tubewells
by water sellers. The process may have been reinforced by increased access to credit for
registered tenants in the early 1980s, for which there are several anecdotal accounts. Since
investments in tubewells are lumpy and involve significant fixed costs, the net effect may
30These have a depth of between 200-500 feet, and cost approximately Rs 200,000. These are usually
provided by the government.31These numbers are calculated for the sample villages on the basis of a 2004 direct household survey of
their landholding histories that we have conducted. For each village a random sample of approximately 20
households per village, stratified by landholding, was selected. The reported areas irrigated average across
all the households in the sample. These numbers correspond closely with those reported by the West Bengal
Census of Minor Irrigation for 1993-94, which reports a 340% rise in shallow tubewells, 161% in dugwells and
45% in deep tubewells in the state between 1987 and 1994. See also Moitra and Das (2004) for a detailed
account of groundwater investments in West Bengal.
27

have been to lower the marginal cost, and hence price, of groundwater.32
In ongoing work with Neha Kumar, we are currently trying to find evidence of such
linkages of tenancy reform and tubewell investments. Our preliminary findings do indeed
find evidence that tenancy reforms and minikit distribution programs had a significant effect
on lowering the cost of irrigation. We expect to report these findings in a subsequent paper.
5 Concluding Comments
To summarize, we have found significant effects of Operation Barga on rice yields and
farm value added per acre, somewhat smaller in magnitude compared with Banerjee et
al, using data from an independent source at a disaggregated farm level, with controls for
endogeneity of program implementation and other concurrent farm extension programs. The
quantitative magnitude of these effects were small compared to those of agricultural kits,
credit and local irrigation facilities delivered by local governments. The effectiveness and
significance of the latter in particular is striking, indicating the importance of public supplies
of agricultural support services in sustaining productivity growth in developing countries.
The importance of their role may arise from a combination of factors: credit constraints
that restrict the ability of most farmers to purchase these inputs on the market, pecuniary
externalities or spillovers in learning associated with inputs that are complementary to
adoption of high-yielding rice varieties, and the public good character of local road and
irrigation programs.
We found evidence that the program raised yields on tenant farms relative to non-tenant
farms, which indicate their role in reducing sharecropping distortions. But this evidence
was statistically less reliable, owing perhaps to the low incidence of leasing. The point
32This is analogous to the effect of expanding market size in stimulating investments in R&D, as modelled
by Dasgupta and Stiglitz (1980) for instance. Suppose there is a Cournot oligopoly of water sellers, who
first select a level of investment in fixed costs, where higher investments lower the marginal costs of supply.
At a second stage, they compete in selling water and earn a margin above marginal costs in equilibrium.
A rightward shift in the demand curve for water will stimulate greater investment, and lower the marginal
cost and price of water at the second stage.
28

estimates imply that the impact of the program on growth of farm yields was quantitatively
much smaller than the impact of farm input supply programs. This owed to the small scale
of the program, related in turn to the low incidence of leasing.
On the other hand, our results support Banerjee et al with regard to the benign impact
of tenancy reform on farm productivity, though we offer a different and more detailed ac-
count of the channels of these impacts. Our quantitative estimate of the effect is somewhat
smaller than theirs, for two reasons. One, they were predicting yields at a much higher level
of aggregation, therefore included effects of the reforms on composition of farms between
different size categories and tenurial status. Second, they did not control for many other
programs administered by local governments that were correlated with implementation of
Operation Barga. Nevertheless, the measured impact is still statistically significant and
robust to alternative data sources, specifications, controls and treatment of possible en-
dogeneity concerns. The low impact of the program relative to other infrastructural and
extension services provided by local governments owed partly to the low incidence of tenancy
in West Bengal villages.
Our interpretation of the effects of the tenancy reform also differs considerably from
earlier literature, which have focused on Marshall-Mill incentive effects alone. We were
surprised by the large spillover effects of the reforms to non-tenant farms, reflecting general
equilibrium or other spillover effects. Identification of the precise channel of such spillovers
is a challenging task: we did not find evidence consistent with a variety of possible channels
in the paper. Our ongoing work suggests that induced effects on private investments in
groundwater irrigation formed one channel by which these reforms caused productivity
improvements to spread to non-tenant farms.
References
Appu P.S. (1996), Land Reforms in India, Delhi: Vikas Publishing House.
Banerjee A., P. Gertler, and M. Ghatak (2002), Empowerment and Efficiency: Tenancy
Reform in West Bengal, Journal of Political Economy, 110(2), 239-280.
29

Bardhan P. (1973), “Size, Productivity and Returns to Scale: An Analysis of Farm-Level
Data in Indian Agriculture,” Journal of Political Economy, 81(6), 1370–86.
—————- (1984), Land, Labor and Rural Poverty (Delhi: Oxford University Press; New
York: Columbia University Press).
Bardhan P. and D. Mookherjee (2000), “Capture and Governance at Local and National
Levels,” American Economic Review, Papers and Proceedings, May 2000, 135-139.
—————– (2004a), “Poverty Alleviation Effort of West Bengal Panchayats,” Economic
and Political Weekly, February 28 2004.
—————– (2004b), “Ideology versus Electoral Competition in Redistributive Politics:
Land Reform in West Bengal,” working paper, Boston University. Title of 2008 revision:
“Determinants of Redistributive Politics: An Empirical Analysis of Land Reforms in West
Bengal, India.”
—————— (2006), “Pro-Poor Targeting and Accountability of Local Governments in
West Bengal,” Journal of Development Economics, 79, 303-327.
Bardhan P. and C. Udry, Development Microeconomics, Oxford University Press, Oxford,
1999.
Bell C. (1977), ”Alternative Theories of Sharecropping: Some Tests Using Evidence from
Northeast India”, Journal of Development Studies, 13 (4), 317-46.
Binswanger H., Deininger K., and Feder G. (1993), “Power, Distortions, Revolt and Reform
in Agricultural Land Relations,” in J. Behrman and T.N. Srinivasan (Ed.), Handbook of
Development Economics, vol. III, Amsterdam: Elsevier.
Besley T. and R.Burgess (2000), “Land Reform, Poverty Reduction, and Growth: Evidence
From India”, Quarterly Journal of Economics, May, 389–430.
Boyce J. (1987), Agrarian Impasse in Bengal: Institutional Constraints to Technological
Change, Oxford: Oxford University Press.
30

Braido L. (2006), ‘Evidence on the Incentive Properties of Share Contracts,’ mimeo, Getulio
Vargas Foundation, Rio de Janeiro.
Chiappori P.A. and B. Salanie (2001), ”Testing Contract Theory: A Survey of Some Recent
Work” , in Advances in Economics and Econometrics, vol 1, M. Dewatripont, L. Hansen
and S. Turnovsky eds, Cambridge University Press.
Dasgupta P. and J. Stiglitz (1980), “ ”, Economic Journal.
Datta Ray S. (1994), “Growth of Agriculture in West Bengal,” Economic and Political
Weekly, 29(47), 19 Nov 1994, 2999-3000.
Dutta, B., D. Ray and K. Sengupta (1989), “Contracts with Eviction in Infinitely Repeated
Principal Agent Relationships,” in Pranab Bardhan (ed.) The Economic Theory of Agrarian
Institutions, Clarendon Press, Oxford.
Eswaran M. and A. Kotwal (1986), “Access to Capital and Agrarian Production Organiza-
tion,” Economic Journal.
Grossman G. and E. Helpman, “Electoral Competition and Special Interest Politics,” Re-
view of Economic Studies, 63, 265-286, 1996.
Harriss J. (1993), “What is Happening in Rural West Bengal? Agrarian Reform, Growth
and Distribution,” Economic and Political Weekly, June 12 1993, 1237–1247.
Honore B. (1992), ‘Trimmed LAD and Least Squares Estimation of Truncated and Censored
Regression Models with Fixed Effects,’ Econometrica 60(3), 533-566.
Johnson D.G. (1950), ”Resource Allocation under Share Contracts”, Journal of Political
Economy, 58(2), 111-23.
Lieten G.K. (1992), Continuity and Change in Rural West Bengal. Sage, New Delhi and
London.
Moitra B. and Das P.K. (2004), ‘Groundwater Markets in West Bengal, India: Emer-
gence, Evolution and Market Structure’, SANEI V Report, October 2004. Available at
http://www.jueconomics.in/faculty/papers/.
31

Mookherjee D. (1997), ‘Informational Rents and Property Rights in Land,’ in Property
Relations, Incentives and Welfare, J. Roemer (ed.), MacMillan Press.
Sengupta S. and H. Gazdar (1996), “Agrarian Politics and Rural Development in West Ben-
gal,” in Dreze J. and A. Sen, Editors, Indian Development: Selected Regional Perspectives,
Oxford India Paperbacks, Oxford University Press, New Delhi.
Shaban R. (1987), ‘Testing Between Competing Models of Sharecropping,’ Journal of Po-
litical Economy, 95(5), 893–920.
Singh N. (1989), ”Theories of Sharecropping”, in P. Bardhan (ed.), The Economic Theory
of Agrarian Institutions, Clarendon Press, Oxford.
32

33
TABLE 1: VILLAGE CHARACTERISTICS
IN SAMPLE VILLAGES, 1978 AND 1998
1978 1998
Number of households 228 398
Operational land-household ratio (acre/hh) 1.54 0.87
% households landless 47.3 52.3
% households marginal (0–2.5 acres) 35.2 39.1
% households small (2.5–5 acres) 11.2 6.4
% households medium (5–12.5 acres) 4.7 2.0
% households big (12.5– acres) 1.6 0.3
% land small 56.7 73.9
% land medium 23.9 18.5
% land big 19.5 7.6
% poor households low caste 38.3 39.8
% upto small households illiterate 44.1 31.9
% big households illiterate 4.4 3.2
% households in nonagricultural occupation 41.1 51.4
Population-Bank ratio 41.6 23.1
‘Poor’ household is either landless or marginal landowner
‘Upto small’ household is either landless, marginal or small landowner
All land information pertains to distribution of cultivable non-patta land owned
Source: indirect household survey;
Population-bank ratio from West Bengal Economic Review, various years

TABLE 2: LAND REFORMS
1978 Average 1998 Average
% land area appropriated 16.4* 15.3
% land area, titles distributed 1.4 5.4
% households receiving titles 4.9 14.9
% land area, tenancy registration 2.4 6.1
% households registered 3.1 4.4
% tenants registered 43.4 51.2
Average across sample villages, weighted by operational land areas
Source: Block Land Records Offices for land reforms implemented
Indirect household survey, for distribution of operational land and tenancy)
*Only available for 34 villages
TABLE 3: TRENDS IN PUBLIC SUPPLIES OF AGRI. INPUTS
1982 1985 1990 1995
Minikits per household 0.11 0.11 0.08 0.06
IRDPa Credit per household 36 29 25 18
Loc. Govt. Irrigation Expenditureb 5233 4265 1485 2627
Loc. Govt. Road Expenditurec 6470d 4501 2501 4572
Loc. Govt. Employment Mandays per household 3.9 3.0 2.2 1.9
Area Irrigated by State Canals (hectares) 72793 72168 79774 84672
State Road Length (Km) 1271 1282 1309 1320
Cumulative % land area, titles distributed 4.5 5.8 6.2 6.3
Cumulative % land area with tenancy registration 1.9 4.2 4.9 5.1
Rows 1–5: Average yearly flow in sample villages, wtd. by land areas
Rows 6–7: stocks at district level, West Bengal government data
a: IRDP Credit Subsidy, 1980 prices;
b,c: Expenditure out of Employment Program Funds, 1980 prices; d: for year 1983
Source: Block Agricultural Dev. Offices, Lead Banks,
Gram Panchayat budgets, West Bengal Economic Review
34

TABLE 4: CROPPING PATTERNS AND RETURNS
Percent of Total Value Added
Total Cropped Area per acre
Area Devoted (1980 prices)
Rice (HYV) 27.5 4137
Rice (non-HYV) 40.0 1925
Potato 3.2 6831
Jute 11.9 3497
Wheat 4.6 1347
Pulses and Vegetables 5.1 2172
Oilseeds 5.9 1808
Tobacco 1.4 3266
Simple Average across sample villages
Source: Cost of Cultivation Surveys
TABLE 5: TRENDS IN FARM PRODUCTIVITY, INCOMES, WAGES
1982 1985 1986 1990 1991 1995
Cropped Area (acres)∗ .99 1.07 .97 1.06 .98 .98
% Rice Area HYV 1.24 7.63 16.54 32.92 45.87 52.70
Rice Value Added per acre 1055 1565 1624 2983 4135 5546
Value Added per acre 703 854 913 1272 1293 1454
Value Added per farm 7613 10915 11223 19070 20553 27349
Hired Labor Wage Rate .57 .54 .83 .76 .81 .99
Hired Labor Annual Hrs/Acre 180 188 242 279 319 265
Averaged across farms, weighted by cropped areas, excepting ∗
All rupee figures deflated by cost of living index, 1974=100
Source: Cost of Cultivation Surveys
35

36
TABLE 6: TENANCY TRENDS
YEAR % FARMS LEASING % AREA LEASED
1982 2.13 12.98
1983 3.24 10.34
1984 4.41 13.11
1985 3.38 6.94
1986 0.44 1.2
1987 0.44 1.14
1988 1.02 2.26
1989 0.73 0.89
1990 0.43 2.07
1991 1.17 6.54
1992 2.5 10.33
1993 2.35 3.86
1994 2.41 6.31
1995 1.98 4.27
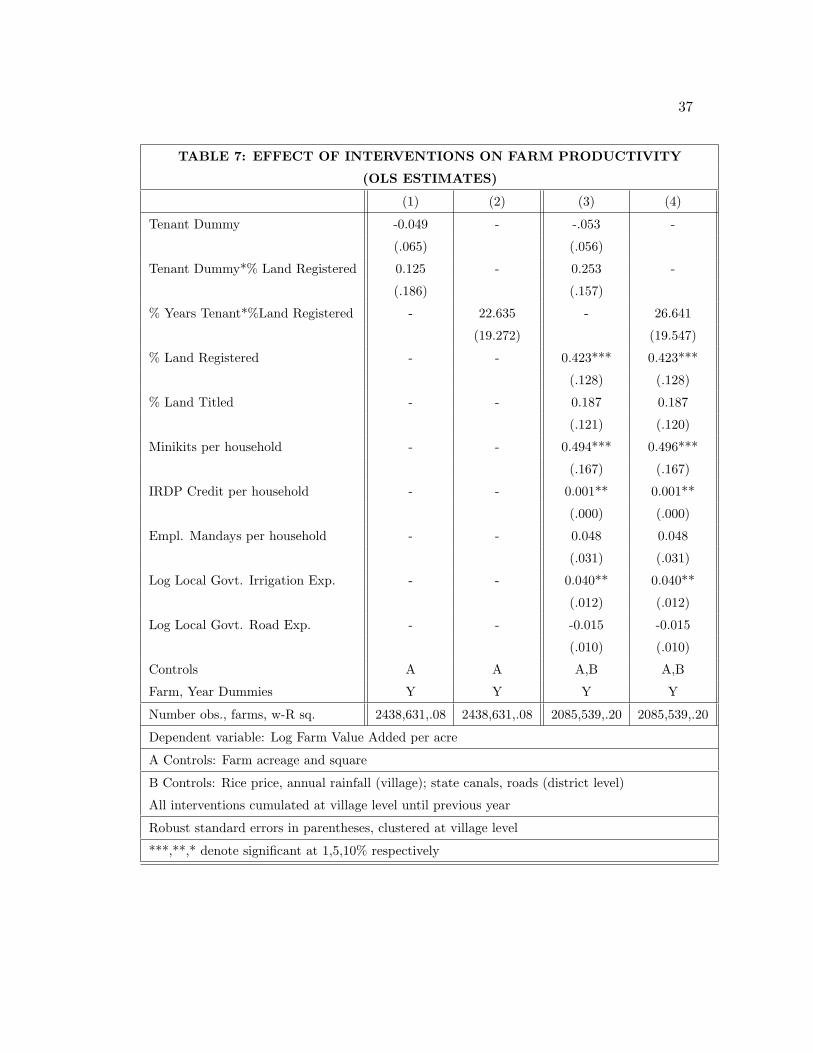
37
TABLE 7: EFFECT OF INTERVENTIONS ON FARM PRODUCTIVITY
(OLS ESTIMATES)
(1) (2) (3) (4)
Tenant Dummy -0.049 - -.053 -
(.065) (.056)
Tenant Dummy*% Land Registered 0.125 - 0.253 -
(.186) (.157)
% Years Tenant*%Land Registered - 22.635 - 26.641
(19.272) (19.547)
% Land Registered - - 0.423*** 0.423***
(.128) (.128)
% Land Titled - - 0.187 0.187
(.121) (.120)
Minikits per household - - 0.494*** 0.496***
(.167) (.167)
IRDP Credit per household - - 0.001** 0.001**
(.000) (.000)
Empl. Mandays per household - - 0.048 0.048
(.031) (.031)
Log Local Govt. Irrigation Exp. - - 0.040** 0.040**
(.012) (.012)
Log Local Govt. Road Exp. - - -0.015 -0.015
(.010) (.010)
Controls A A A,B A,B
Farm, Year Dummies Y Y Y Y
Number obs., farms, w-R sq. 2438,631,.08 2438,631,.08 2085,539,.20 2085,539,.20
Dependent variable: Log Farm Value Added per acre
A Controls: Farm acreage and square
B Controls: Rice price, annual rainfall (village); state canals, roads (district level)
All interventions cumulated at village level until previous year
Robust standard errors in parentheses, clustered at village level
***,**,* denote significant at 1,5,10% respectively

38
TABLE 8: EFFECT OF INTERVENTIONS ON FARM PRODUCTIVITY
(IV ESTIMATES)
Full Sample Owner-Cultivators Owner-Cultivators
Only Only
IV OLS IV
Tenant Dummy -0.034 - -
(.058)
Tenant Dummy*% Land Registered 0.224 - -
(.182)
% Land Registered 0.901*** 0.432*** 0.885***
(.238) (.131) (.257)
% Land Titled 0.104 0.178 0.225
(.163) (.148) (.503)
Minikits per household 0.890*** 0.505*** 0.878***
(.239) (.173) (.295)
IRDP Credit per household 0.001*** 0.001** 0.001***
(.000) (.000) (.000)
Empl. Mandays per household 0.111** - -
(.05)
Log Local Govt. Irrigation Exp. 0.036* 0.039*** 0.034*
(.019) (.012) (.018)
Log Local Govt. Road Exp. -0.026** -0.016 -0.025*
(.010) (.010) (.010)
Controls A,B A,B A,B
Farm, Year Dummies Y Y Y
Number obs., farms 2075,534 1993,520 1981,516
Instrumented: %Land Registered, %Land Titles, Minikits and IRDP per hh
First stage F values 2080.4, 26.16, 60.63, 23.71;
p-values 0.00,0.00,0.00,0.00; partial R-sq. .95,.48,.62,.36 respectively
Dependent variable: Log Farm Value Added per acre
A Controls: Farm acreage and square
B Controls: Rice price, annual rainfall (village); state canals, roads (district level)
All interventions cumulated at village level until previous year
Robust standard errors in parentheses, clustered at village level
***,**,* denote significant at 1,5,10% respectively

39
TABLE 9: EFFECT OF INTERVENTIONS ON VILLAGE PRODUCTIVITY
OLS IV
%Marginal Farms Leasing*% Land Registered -0.605 1.801
(5.341) (5.227)
%Medium Farms Leasing*% Land Registered 1.922* 1.829
(1.066) (1.526)
%Large Farms Leasing*% Land Registered -7.286 -5.674
(10.230) (10.850)
% Land Registered 0.385*** 0.683***
(.135) (.226)
% Land Titled 0.069 0.018
(.111) (.169)
Minikits per household 0.397** 0.636***
(.173) (.273)
IRDP Credit per household 0.000 0.001
(.000) (.000)
Empl. Mandays per household 0.043*** 0.093***
(.026) (.047)
Log Local Govt. Irrigation Exp. 0.039*** 0.035**
(.013) (.017)
Log Local Govt. Road Exp. -0.012 -0.020
(.012) (.012)
Controls B,C B,C
Farm, Year Dummies Y Y
Number obs., villages 261,67 261,67
Marginal Farm: <2.5 acres; Medium Farm: between 2.5 and 5 acres; rest Large Farms
Instrumented in Col. 2: %Land Registered, %Land Titles, Minikits and IRDP per hh
Dependent variable: area wtd. average of log farm value added per acre in each village-year
B Controls: Rice price, annual rainfall (village); state canals, roads (district level)
C Controls: % village area distribution between size classes, and % of each size class leasing in
All interventions cumulated at village level until previous year
Robust standard errors in parentheses, clustered at village level
***,**,* denote significant at 1,5,10% respectively

40
TABLE 10A: IMPLIED EFFECTS ON FARM PRODUCTIVITY
FOR AVERAGE VILLAGE
WTD MEAN WTD MEAN IV COEFF PRED. IMPACT
1982 1995 VA/ACRE
% Land Registered .019 .051 .714 +5%
Minikits/HH .11 1.26 .694 +528%
IRDP Credit/HH 36 359 .0012 +144%
Loc. Govt. Irrig. Exp. 4.04 4.74 0.037 +6%
Predicted change of value added per acre implied by estimated coefficients
resulting in a hypothetical village from change in concerned program
equal to weighted average of observed changes in the entire sample between 1982-95
TABLE 10B: AVERAGE PREDICTED EFFECT (% CHANGE) IN
FARM PRODUCTIVITY, DIFFERENT PERIODS
1981-85 1986-90 1991-1995
% Land Registered .18 .81 .89
Minikits/HH 428.34 79.64 8.58
IRDP Credit/HH 82.56 17.72 9.91
Loc. Govt. Irrig. Exp. 74.21 3.86 1.39
Average of predicted percent change of value added per acre in sample villages implied by
estimated coefficients and actual changes observed in those villages;
Operational land areas used as weights

41
TABLE 11: COMPARING INPUT ALLOCATIONS IN RICE CULTIVATION
BETWEEN LEASED AND OWNED PLOTS
HYV Rice non-HYV Rice
Leased Dummy -.21*** -.22 -.06 -.08
(.08) (.14) (.08) (.17)
Leased Dummy*% Land Registered .12 -2.52
(.10) (3.16)
No. obs., farms 1828,576 1590,496 2234,660 1911,572
Within-R sq. .031 .037 .06 .08
OLS Regressions; Dependent Variable: Log of Input Expenditures/Value of Output
All regressions include farm and year dummies
Robust standard errors in parentheses, clustered at village level
***,**,* denote significant at 1,5,10% respectively

42
TABLE 12: LAND REFORM AND PUBLICLY SUPPLIED INPUTS:
DIFFERENTIAL EFFECTS ON SMALL, MARGINAL FARMS
Log Farm Value Added Log Farm Value Added
Per Acre (IV) Per Acre (IV)
% Land Registered 0.694** 0.681***
(.263) (.251)
% Land Registered*Small Farm 0.029
(.026)
% Land Registered*Marginal Farm -0.021
0.019)
% Land Titled 0.592 0.542
(0.631) (0.437)
% Land Titled*Small Farm -0.097
(0.379)
% Land Titled*Marginal Farm -0.085
(0.189)
Minikits/HH 0.562** 0.608**
(0.250) (0.251)
Minikits/HH*Small Farm 0.036
(0.028)
Minikits/HH*Marginal Farm -0.003
(0.026)
IRDP Credit/HH 0.001*** 0.001**
(0.00) (0.001)
IRDP Credit/HH*Small Farm -0.00
(0.00)
IRDP Credit/HH*Marginal Farm 0.00
(0.00)

43
TABLE 12 continued
Log Farm Value Added Log Farm Value Added
Per Acre (IV) Per Acre (IV)
(Log) Loc. Govt. Irrigation Exp. 0.029* 0.029**
(0.014) (0.015)
LG Irrig Exp*Small Farm -0.011
(0.008)
LG Irrig Exp*Marginal Farm -0.016*
(0.009)
(Log) LG Road Exp. -0.023 0.019*
(0.014) (0.011)
LG Road Exp*Small Farm 0.000
(0.011)
LG Road Exp*Marginal Farm -0.003
(0.008)
LG Empl. Mandays/HH 0.208** 0.125**
(0.081) (0.052)
Mandays/HH* Small Farm -0.108
(0.081)
Mandays/HH*Marginal Farm -0.002
(0.044)
No. Obs., farms, Within-R sq. 2091,542, .16 2091,542, .17
Small: < 5 acres; Marginal:< 2.5 acres
Controls: farm,year dummies; A,B (Table 8)
IV regression, details as in Table 8
Robust standard errors in parentheses, clustered at village level
***,**,* denote significant at 1,5,10% respectively

44
TABLE 13: IMPACT OF INTERVENTIONS ON CROPPING PATTERNS
TOTAL HYV RICE LOCAL RICE POTATO
AREA AREA AREA AREA
IV IV IV IV
% Land Registered 1.245** 0.738* 0.765** -0.226**
(0.523) (0.382) (0.366) (0.110)
% Land Titled 0.225 0.465 -0.622 0.045
(0.678) (0.466) (0.695) (.196)
Minikits/HH 0.830 0.748** .125 .264*
(0.522) (0.349) (.455) (.155)
IRDP Credit/HH 6.2e-4 1.7e-4 1.2e-4 -1.9e-4
(6.7e-4) (5.8e-4) (7.5e-4) (1.8e-4)
Log Rice Price 0.257 0.175* -0.056 -0.057
(real)b (0.332) (0.162) (.104) (.046)
Number obs., farms 2071, 539 2099,542 2099, 542 2099, 542
Within-R sq. .05 .04 .03 .07
b: Deflated using regional CPI for Agricultural Workers
Other controls in previous tables included
Robust standard errors in parentheses, clustered at village level
***,**,* denote significant at 1,5,10% respectively

45
TABLE 14: IRRIGATION EXPANSION, BY SOURCE
Year Canals Deep Tubewells River lift/pond Shallow Tubewell Others
1981 5.20 2.81 7.5 7.62 0.45
1982 5.20 2.81 7.45 8.79 0.46
1983 5.21 2.92 7.54 9.03 0.46
1984 5.22 3.08 8.17 10.97 0.46
1985 5.22 3.22 8.67 13.18 0.46
1986 5.27 3.30 9.08 14.09 0.48
1987 5.28 3.42 9.32 14.81 0.48
1988 5.35 3.55 9.43 15.56 0.54
1989 5.4 3.66 9.97 17.01 0.54
1990 5.41 4.05 11.9 19.43 0.55
1991 5.42 4.10 12.09 20.85 0.55
1992 5.45 4.3 12.43 23.22 0.55
1993 5.45 4.35 12.52 24.27 0.56
1994 5.47 4.41 13.44 29.29 0.68
1995 5.82 4.51 14.85 31.39 0.68
Average fraction of cultivable area in sample villages irrigated, by source
Source: Household Land Survey Data