Productivity and its measurement, a strategic perspective
48
Transcript of Productivity and its measurement, a strategic perspective


UNIVERSITY OF
ILLINOIS LIBRARY
AT URBANA^HAMPAIGNBOOKSTACKS

PRINTED IN US A
GAYLORD


330
B385No. 1233 ««**-*
Cop <=*-
15EBRFACULTY WORKINGPAPER NO. 1233
* ^ajproductivity and Its Measurement,^ A Strategic Perspective
Zenon S. ZannetosMing-Je Tang
College of Commerce and Business Administration
Bureau of Economic and Business ResearchUniversity of Illinois, Urbana-Champaign


BEBRFACULTY WORKING PAPER NO 1233
College o t Commerce ind Business Administration
University of Illinois at Urbana- Champaign
March 1986
Productivity and Its Measurement, A Strategic Perspective
Zenon S Zanne t os
Massachusetts Institute of Technology
Ming-Je Tang, Assistant ProfessorDepartment of 3usiness Administration

Digitized by the Internet Archive
in 2011 with funding from
University of Illinois Urbana-Champaign
http://www.archive.org/details/productivityitsm1233zann

ABSTRACT
PRODUCTIVITY AND ITS MANAGEMENT: A STRATEGIC PERSPECTIVE
A productivity measure, value added over payroll and benefits, is
developed as a strategic signal to managers. Criteria for evaluating
management measures are developed. The productivity measure along
with other performance measures are tested against the criteria. This
measure is applied to the automobile industry and shows that it can
provide early warning signals of an industry's decline. Strategies for
improving productivity are proposed and evaluated.


Strategy is formulated based upon trends in the environment which
indicate the threats and opportunities a firm may face in the future.
The competitive environment is probably one of the most important sub-
environments to a firm's strategy. Consequently, a firm needs to cap-
ture the trend of its relative competitive position through
environmental scanning. Given the abundance of available information,
bounded rationality, and problemistic search (Cyert and March, 1963)
the question is not whether to scan a firm's environment but which
signals the firm should pay attention to and how. Very little
research has been performed in this area. Aguilar (1967), Kefalas and
Schoderbek (1973), and Hambrick (1981a, 1981b, 1982) have described
how environmental scanning is conducted at different management
levels. However, very few normative statements were presented nor
were they supported by empirical evidence. This paper attempts to
develop an empirical measure of productivity which will serve as a
strategic signal to management by indicating the long-term trend of
relative competitiveness of an industry.
A strategic signal should reflect a firm's effectiveness and
efficiency, relative to its competitors'. One particular signal is
the productivity measured as value added over payroll and benefits
(VA/PB). The numerator, value added, reflects how a firm's output is
desired in the market, the effectiveness. The denominator reflects
the amount of homogenized labor input. Thus, the ratio reflects the
efficiency of achieving effectiveness.
Although a great deal of excellent research has been conducted on
productivity, the work has mainly concentrated attention at the macro-

-2-
economic level and as a result, it has not provided meaningful
information to the managers who are in a position to improve productivity
through strategic and policy decisions.
In an attempt to fill the vacuum, this study focuses on productivity
at the level of the industry and firm rather than the economy as a whole.
Our goal is to structure industry and company data in an associative
context that is not only feasible to obtain, but which is also meaningful
as well as useful for decision makers. To this end, the methodology
should, as much as possible, (1) relate symptoms with causes; (2) point
to appropriate remedies for the identified problems; and (3) be feasible
as well as effective.
In this paper, we will address the development of the productivity
measure and demonstrate its application. We will start by reviewing
existing literature concerning approaches to productivity analysis and
develop criteria for evaluating and choosing productivity measures.
Several productivity measures will then be tested against the developed
criteria using data from the U.S. automobile industry. Finally, we will
discuss the relationship between the preferred productivity measure and
other commonly used performance measures such as return on sales,
absolute earnings, and earnings per share.
LITERATURE REVIEW
Productivity describes the efficiency of the process with which
inputs are converted into output(s). Thus, productivity is measured as
the ratio of output to input. If only one of several input factors is

-3-
included in the denominator, the resulting productivity measure is a
"single factor productivity." If, on the other hand, all input factors
are counted in the denominator, the resulting measure is "total factor
productivity." When multiple outputs or inputs are involved in
productivity measures, researchers face the critical issue of how to
aggregate the outputs and inputs. The major differences among the
several approaches to productivity analysis reside in the weighting
schemes used to aggregate outputs or inputs and in the choice of single
factor productivity or total factor productivity as the focus of analysis.
Approaches to Productivity Analysis
Our literature review revealed four basic approaches to productivity
analysis: (1) production function; (2) econometric; (3) growth accounting;
and (4) behavior science. The production function and growth accounting
approaches deal with total factor productivity, while econometric and
behavior science approaches largely deal with single factor productivity.
1. Production Function: Researchers using the production function
approach assume that the growth of output can be attributed to a growth
of input and to technological progress (Solow, 1956; Gallop and
Jorgenson, 1980; Frauraeni and Jorgenson, 1981). To identify the
contribution of input factors, a specific production function or its
dual, a cost function, is assumed. Techniques, such as econometrics,
are used in estimating the parameters of the production function or cost
function. The difference between actual output growth and calculated
output growth is defined as productivity growth or technical change. A
translog production function with constant returns to scale, a flexible
form of production function, is commonly assumed.

-4-
2. Econometric Approach: In contrast, those using the pure econometric
approach do not restrict themselves to the factors used in the production
function approach [Mansfield 1980; Kopcke 1980]. They believe that other
factors such as R & D expenditures and technology may make direct and
significant contributions to productivity growth. In the econometric
models, the dependent variable is productivity and the independent
variables are factors believed to affect it. Hypothesized relationships
are tested by examining the statistical significance of the coefficients
of the independent variables. By means of this approach correlation can
be established but causality cannot necessarily be implied.
3. Growth Accounting: The third approach, growth accounting, is based
upon the assumptions that (a) the production function is dif f erentiable
;
(b) the relevant markets are competitive; and (c) the earnings of each
factor of production, when fully employed, equal the value of its product
[Denison 1974, 1979 (1); Kendrick 1961, 1980]. The contribution of each
individual input is measured by its market return and its share in
specific output value. Specific output growth is then related to input,
by weighting the growth of physical inputs by their respective shares in
specific output value. As in the case of the production function
approach, the output growth which cannot be explained by inputs growth
is attributed to technological progress or productivity growth.
The three approaches reviewed above reveal important aspects of
macro-productivity, are theoretically and intuitively appealing,
especially for the field of public policy formulation, but very
difficult to support empirically. Even for policy decisions, the support

-5-
derived from the models is symptomatic and not causal -diagnostic
.
Furthermore, the averaging process, which permits stability of behavior
through aggregation, conceals valuable information relevant to the
identification of causes as well as the measurement of productivity.
4. The final approach we categorize as behavioral science [Hall and
Dickson 1975, Horwitz and Sherman 1980]. In contrast to the other
approaches, the unit of analysis is at the level of the firm and of the
individual. Instead of focusing on structured or economic factors,
behavioral science focuses on firm-specific and individual-specific
variables such as motivation, organizational structure, and group
dynamics. The methodologies used with this approach vary considerably,
but often include questionnaires, surveys, interviews, and observations.
While much of the data are "soft," this approach often provides pertinent
information or insights, regarding the behavior of those who make
decisions, that are found in other approaches.
As mentioned earlier, in this paper we will deal with productivity
at the level of the industry and with the measurement of such. Our goal
is to provide information useful for managerial decisions. To accomplish
this goal, we will develop criteria for evaluating productivity measures;
contrast various measures against the criteria developed; apply some
measures, including the one we propose, to the U.S. automobile industry;
and present some strategic implications of our research for productivity
growth.

-6-
CRITERIA
To establish pragmatic criteria for evaluating productivity measures,
we identified three main areas of concern: (1) theoretical and
statistical soundness; (2) feasibility; and (3) usefulness. It should
be noted that the criteria we will use to assess the desirability of
measures are not independent of one another. Theoretical purity and
feasibility are often incompatible and, as a result, it is often
necessary to devise tradeoffs, especially at the margin.
Theoretical and Statistical Soundness
Productivity may be defined as the output per given level of input,
where outputs and inputs can be iiaeasuted in terms of physical units,
value, or in the case of output, value-added. Although the choice of
the terms of measurement is to a certain extent arbitrary, the measure
chosen should be consistent, homogeneous, robust, and valid.
(1) By consistent, we mean that the measure should be as free of
interdependencies as possible, should have clearly stated assumptions,
and be free of measurement process. Furthermore, causal relationships
implied in the measure should be explicitly stated. A particular
measure is meaningful when it reflects not only the assumptions but
also the cause-effect relationships. It is the latter which provides
the associative context in which data are used and by means of which
meaning is generated. It is critical that these relationships be clearly
delineated for decision-making purposes, such as the hypotheses
implicitly proposed in the usage of a particular measure.

-7-
(2) Homogeneity is the quality of being uniform or having common
properties deriving from the same genus, both at any moment in time and
over time. Aggregating heterogeneous inputs and outputs by their physical
units is meaningless unless some homogenization mechanism is imposed.
In an efficient market, the price contains all necessary information and
thus price is normally used as the mechanism for homogenization. However,
the use of price is not free from problems. Information impactedness
,
uncertainty, and inflation may all mitigate the effectiveness of price
as a homogenization mechanism.
(3) Another statistical concern is whether or not a measure is
robust in terms of its ability to represent the distribution of variance
in a given population of data. Statistically speaking, a strong argument
can be made for using an estimator that is reasonably efficient for any
kind of population shape. Efficiency is defined in the general case as
the ratio of the mean square error of two estimators. An estimator which
is free of the assumption that the population distribution is normal,
and is therefore reasonably efficient compared to a normally distributed
estimator, is called robust, distribution-free, or nonparametric.
(4) A test is said to be valid if its probability values and
confidence intervals are correct as specified. In our test we employ
mean and variance out of the population of residuals. Since the total
number of residuals will be small (we chose a period of 25 years), the
student distribution is more appropriate than the normal distribution
for the determination of probability Pi, for i = 1, 2,...,k. Therefore,
we decided to use the student distribution for the calculation of Pi's.

-8-
The methodology used to examine the robustness and the validity of
various productivity measures is presented in an early working paper
(Zannetos et_ al., 1981).
Feasibility
The second area of concern is the practicality of the measure, for
what is theoretically attractive may be impractical or impossible to
calculate. Thus, the following criteria are utilized:
(1) The elements of the productivity measure must be measureable.
They must be reasonably quantifiable.
(2) The measure should utilize data that is feasible to collect.
Of course, the best situation is one where data are already available,
but in any case the measure should not call for data which are by nature
unavailable or prohibitively expensive to gather.
Usefulness
The final criterion concerns the usefulness of the measure. The
measure chosen may be theoretically attractive, as well as feasible, yet
it may convey no useful information to interested parties.
(1) The measure should be useful for inter-firm, intertemporal, and
inter-industry analysis. For this reason, national aggregative measures
are not useful for our purposes. Furthermore as we have already stressed,
the averaging and standardization which are inherent in the generation of
macro data hide critical information, useful for intra-firm, inter-firm,
and inter-industry analyses. Disaggregation without loss of
consistency, homogeneity, and robustness is a very desirable attribute
of a measure.

-9-
(2) The measure should provide strategic signals to decision makers.
Too often measures indicate a change taking place but provide no
meaningful information as to exactly what has occurred and what corrective
actions might be appropriate. According to the causal relationships
hypothesized in the measure mentioned above, interested parties should
be able to monitor certain indices in order to identify critical changes
in the internal as well as external environment of the firm or industry,
as well as in the probably causes of these changes. These signals
provide useful feedback and as such should become part of a firm's (or
industry's) control system.
(3) The measure should not only be useful but also must be usable.
In other words, the measure must not only be contextually associated
with the decision-maker's frame of reference, but also must be easy to
use; otherwise, it will never be used.
(4) Finally, the measure must yield information which contains
prognostic powers. Unfortunately this attribute can only be tested
ex post facto , although it can be used in an ex ante basis, in order to
verify the opinion of the experts, once confidence in the measure is
established.
From the previous discussion, we can see that it will be difficult
to find a single measure which will meet all criteria, especially since
some are at cross-purpose with others. Thus, priorities must be set
among the criteria. While the first two criteria are certainly
important, if we have to err, we will do so in favor of usefulness. In
an era of research, innovation, exploding information technology and
specialization, all of which destroy the determinism of normal market

-10-
behavior, the decision makers need more information but fewer data.
What determines meaning and usefulness is the associative context of the
manager, and there upon also rests his/her comparative advantage.
EVALUATION OF PRODUCTIVITY MEASURES
In this section, we will briefly examine the most commonly used
productivity measures in light of the criteria developed in the previous
section.
First, consider the production function and the growth accounting
approaches. Both deal with total factor productivity and productivity
growth is defined as the portion of output growth not explained by input
growth. Productivity growth is simply a residual and is not explained
by the production function specified or the growth accounting equation.
Since the underlying causes of the changes in the productivity growth
are not known, these measures fail to meet our first criterion, that of
consistency. Secondly, it is almost impossible to find a satisfactory
mechanism for homogenization of capital goods because the prices of
used capital goods such as structures and machinery and equipment are
difficult and often impossible to obtain. Another critical issue in
measuring capital input is whether the latter should be adjusted for
utilization and if so how. Different adjustment mechanisms for capital
inputs result in significant variations in the total-factor-
productivity growth calculated from the production function and the
growth accounting equation. Thus, the heterogeneity of capital goods
and the lack of proper homogenization mechanisms make the results
derived from these two approaches unreliable. More importantly, these

-11-
two approaches are more applicable at the national level to facilitate
public policy decisions and are of limited value for managerial decisions
at the firm level. Since total factor productivity measures are
deficient in several aspects of our criteria, we turn our attention to
single factor productivity measures.
The most widely used single factor productivity measure is the
Bureau of Labor Statistics (BLS) measure, value added per man-hour. The
output measure, value added, is homogeneous in the sense that the price
mechanism is used to homogenized outputs. Also, since value added is
sales minus the cost of materials purchased, it eliminates double
accounting for suppliers' contributions to output. However, labor input
is not homogeneous because hours worked by skilled and unskilled
workers are equally weighted without regard for differences in their
contribution. Moreover, data on hours worked cover only production
workers. However, from a managerial point of view, all workers—support
as well as production—as part of the cost function of the firm and the
industry. We suggest that the price mechanism be used to homogenize
labor input and that all labor be included. The resulting productivity
measure is total value added to the goods and services produced by the
total payroll and benefits utilized for the period, per dollar of the
total payroll and benefits. Value added has four components: payroll
and benefits, total depreciation, interest, and profit before taxes in
the total production (see Appendix 1 for derivation). The productivity
measure, VAPB becomes:

-12-
VAPB = VA / P & B
=(P&B+D+I+ PBT) / P & B
= 1 + (D + I + PBT) / P & B
Where: VAPB = Total Value Added to the goods and services, producedduring the period by the total payroll of the period, per dollar of
total payroll and benefits.
VA = Total Value AddedP & B = Total Payroll and Benefits
D = DepreciationI = Interest
PBT = Profit before taxes on total production for the period.
In addition to homogeneity, this measure is also free of inter-
dependencies in several aspects. First, unless productivity increases
the measure it is not affected by the substitution of indirect labor
for direct labor because both the numerator and the denominator include
both labor classes. So a simple accounting shift or reclassification of
direct labor to indirect labor will not affect the measure. If on the
other hand an effective reorganization occurs which changes the direct
to indirect labor ratio, with a resultant increase in productivity, the
latter will be reflected in an increase in the measure because of an
increase in PBT. Second, since both the denominator and the numerator
are in nominal dollars and inflation will increase both of them roughly
by the same percentage, the measure has an advantage of mitigating the
effect of inflation. Third, as vertical integration increases both value
added and payroll and benefits, this measure will be compensated by
vertical integration or vertical de-integration. Fourth, this measure
also reflects the monopoly power of the firm relative to that of the

-13-
union. Since the exit cost of labor is low and the opportunity cost
of labor to the firm is relatively high, there is a great chance that a
union can win a raise even though physical labor productivity does not
increase accordingly. As a result, VAPB decreases. However, if the firm
obtains some monopoly power through technological advancements of its
product, the technological superiority allows the firm to raise its
price to the "functional equivalent value" of the product minus switching
costs. This capability permits the firm to pass along its cost increases
to the consumer and the net result may be an increase in VAPB. In other
words, other things being equal, if the firm's monopoly power is higher
than that of its union, the firm may be able to increase its VAPB and
vice versa.
Despite these desirable features of the proposed productivity
measure, it is not free from certain misleading consequences of labor
—
capital substitution. Tf a firm substitutes capital for labor and wage
rates remain unchanged, total labor costs will be lower and depreciation
will be higher. Profits will increase (or fall) depending on whether
the reduction in labor costs exceeds (or is less than) the increase in
depreciation.
Obviously, profit drop is an undesirable case. Even in this
undesirable case, the ratio VAPB still increases because total labor
costs are lower and value added remains unchanged. This indicates that
a firm may increase labor productivity at the expense of capital
productivity and there are situations where an increase in labor
productivity is not desirable. Similarly, if labor is so productive
that a firm is willing to substitute capital for labor to reduce total

-14-
costs, a decrease in labor productivity measured as VAPB is desirable.
Therefore, one should interpret the changes in labor productivity with
care. Since this deficiency is generic to all single factor
productivity measures and the only way to correct it is to switch to
total factor productivity measures which are even more deficient as
discussed before, we would rather use the VAPB measure with caution than
to use total factor measures.
In summary, the proposed measure combines several desirable
attributes in that it (1) is homogeneous, (2) compensates for relative
inflation, (3) indicates the relative monopoly power of the firm to pass
along the cost increase versus that of labor to extract higher renumeration
and (4) reflects the relative degree of vertical integration. But it is
affected by labor capital substitutes.
The next criterion of concern is the robustness of the measure.
Using the U.S. automobile industry, the proposed productivity measure
and other similar measures are tested for robustness at both the firm
level and industry level. At the firm level, sales and value added are
used as output measures and cost of goods sold, cost of goods sold plus
depreciation and amortization, cost of goods sold plus capital
expenditures, and payroll and benefits are used as input- measures. At
the level of industry (SIC 3717: Motor Vehicle and Parts an SIC 3715:
Truck), wages of production workers hours of production workers, and
payroll are used as input measures and value added used as the output
measure.
The statistical test of the robustness of the productivity measures
is too involved to present here. We instead refer you to an earlier

-15-
working paper [Zannetos 1982]. It is shown that value added over payroll
and benefits is consistently a robust measure while others are not.
Thus, the ratio VAPB satisfies the soundness criteria best. Having
identified a measure that is theoretically and statistically sound,
we will evaluate its usefulness. The concept of usefulness is a relative
one. Thus, we will compare the relative usefulness of the proposed
productivity measure with other commonly used performance measures.
Usefulness of the Productivity Measure as Compared to Performance Measures
We use market share of imported cars as an indicator of the health
of the U.S. auto industry. Exhibit 1 shows that market share of imports
has been increasing since 1964 and reaching 27.9 percent in 1982.
Considering the long-term decline of the U.S. auto industry, we ask:
What measures can provide managers with early warning signals?
INSERT EXHIBIT 1 ABOUT HERE
Many criteria commonly used by management to evaluate company
performance and to provide signals for strategic changes, including
return on sales (ROS), return on stockholders' equity (ROE), return on
total investment (ROI), net income (NI) and earnings per share (EPS).
The term "return" can be based on either net income or as operating
income before taxes, interest and extraordinary items. Since net income
is affected by "financial operations" such as the debt-equity ratio,
extraordinary items and taxes which have nothing to do with the production
efficiency of a firm, operating income is theoretically superior to net
income in measuring efficiency. Therefore, operating income is used to

-16-
calculate return in this paper. We will compare the usefulness of these
performance measures to that of VAPB.
The VAPB of GM is shown in Exhibit 2. Exhibits 3 and 4 present these
performance measures for GM from 1955 to 1979. (Since GM has more than
60 percent of the share of the U.S. -made car market, it is representative
of the U.S. auto industry). Observe that only VAPB and ROS give any
indication of declining health in the industry. Neither ROI nor ROE
indicate the trend of decline in the industry, while both net income and
EPS actually show the industry progressing with positive trends for the
fifteen years after market share of imports begins climbing. Thus, only
VAPB and ROS have predictive power on the decline trend of the U.S. auto
industry. Regressing VAPB and ROS against market share of imports from
1958 to 1979 yields correlation coefficient of -0.861 and -0.804
respectively.*
INSERT EXHIBITS 2, 3, 4 ABOUT HERE
However, ROS is not a consistent measure of production efficiency
due to the effect of vertical integration. Consider two firms with the
same level of efficiency and sales, but different levels of vertical
integration. The firm with a higher degree of vertical integration will
on average have larger operating profits than the less vertically
integrated firm. As a result, the less vertically integrated firm has
a lower return on sales even though both firms are equally efficient.
Thus, the trend of ROS is measuring changes in both efficiency and
vertical integration. Therefore, to reflect the efficiency of a firm,
*Before 1958, market share of imports is not available and after1979, this figure cannot reflect the competitiveness of the U.S. autoindustry because it is distorted by the quota set on Japanese cars andthus we run the regression only up to 1979.

-17-
ROS must be adjusted for vertical integration (see Appendix 2 for the
derivation of the measure of vertical integration). The correlation
between adjusted ROS and the market share of imports is lower than
that of VAPB. Thus, we conclude that VAPB has greater predictive
power than ROS and other commonly used performance measures and those
commonly used measures may provide wrong signals. However, if VAPB is
not readily available, adjusted ROS may be used as its surrogate.
As we observed correlations between ROS, VAPB and imports' market
share, we attempt here to establish the causality of these three
variables. As the productivity of GM started declining, it gradually
lost competitiveness, imports started gaining, and its economic monopoly
power disappeared. As a result, the auto maker cannot pass on all
increases in costs to the consumer. This can be shown by the decline of
the ratio of new car price index over the producer price index of the
motor vehicle industry (Exhibit 5). In the same period, as the
productivity of auto makers declined, it became advantageous to buy
materials rather than to produce them and thus GM lowered its degree of
vertical integration. The effect of the price-cost squeeze and the
decline in vertical integration is reflected in the decline of ROS.
Thus, the root of the decline of the profitability of the U.S. automobile
industry and the inroads of imports is the decline in productivity as
reflected in the measure VAPB. Therefore, the decline in VAPB not only
resulted in intra-firm substitution (a vertical integration), but also
inter-firm substitution (declining in market shares).
INSERT EXHIBIT 5 ABOUT HERE

-18-
In conclusion, the proposed productivity measure is theoretically
sound, technically feasible and most importantly, it is useful to
provide strategic signals. Furthermore, based on the measure VAPB we
may derive implications to the strategy of the firm and to the manage-
ment information systems.
Strategies for Productivity Growth
Recognizing the impact of declining productivity, we ask: What are
the strategies to reverse the trend? Since productivity is a ratio of
output to input, the answer lies in either reducing input (i.e., labor
cost) or increasing output (i.e., value added). Although the cost
reduction strategy is commonly prescribed and is intuitively appealing,
however, for the U.S. auto industry which is facing fierce competition
from Japan, the value creation strategy is more effective in the long
run. First, labor and capital costs in the U.S. are significantly
higher than those in Japan.* Even if the U.S. automakers successfully
imitate Japanese strategies and increase productivity to the same
level as the Japanese automaker, the cost differences due to wage and
interest differentials cannot be eliminated. Since the Japanese have
the cost advantage and it is highly unlikely that this advantage can be
eliminated, it leaves the U.S. with no choice but to focus on the value
creation strategy, e.g., product differentiation. Secondly, as argued
in an early paper [Zannetos 1982], low marginal cost is prohibitive to
adopting product and process innovations. Since investment in the
Hourly wage rate of the auto workers and prime rate in Japan areroughly half of those in the U.S.

-19-
process innovations aiming at cost reduction leads to lower marginal
costs at the present time, it will also impede future adoption of
product and process innovations. Thus, the common prescription of
investment in process innovations to improve productivity may be
dangerous in the long run especially in an era characterized by rapid
technological changes. Therefore, the cost reduction strategy not only
is futile (i.e., cannot solve the problem of cost differences), but
also is vulnerable to future technological changes.
Finally, the value creation strategy fits the strength of the U.S.
industry. This strategy can be implemented through effective product
innovations. If such product innovations are proprietary and not
easily matched, the innovator is insulated from price competition and
can extract monopoly rents and thus increases its value added. This
product innovation strategy requires technology superiority which is
the strength of the U.S. exactly. Therefore, in the long fun, it is
advantageous for the U.S. auto industry to adopt the value creation
strategy rather than the cost reduction strategy.
Conclusion
We have examined various approaches to productivity analysis and
showed that value added per dollar of payroll and benefits is a better
measure in terms of theoretical and statistical soundness. Using the
U.S. automobile industry as an example, it is shown that the
productivity measure proposed is a better predictor of the health of
the industry than traditional performance measures such as ROI and ROS
.
To regain international competitiveness, we suggest that the U.S. auto

-20-
industry adopt a value creation through product innovation strategy
instead of a cost reduction through process innovation strategy. Our
work has been limited to the U.S. auto industry, future research is
needed to analyze industries such as the steel, semiconductors and
computer industries to examine the generalizability of the conclusions
derived from this paper.

-21-
APPENDIX 1
Value Added at Firm Level
Value added at the firm level is calculated by subtracting inventory
changes and material costs from sales, i.e.
VA = NS + (It+1
- It
) - M (1)
where VA = Value Added; NS = Net Sales; (I+ ,
- I ) = cost of the dif-
ference in inventory from one period to another; and M = Material
Costs (all figures expressed in dollars). However, while net sales
can be found in annual reports, the other items are not readily
secured. Nevertheless, we can use our knowledge of accounting to
deduce the necessary information. We do know that the cost of goods
sold including administrative expenses (ACGS) consists of payroll (P)
and material costs (M) less the costs associated with a change in
inventory (I). That is,
ACGS = P + M - (It+1
- It
) (2)
Thus,
M = ACGS - P + (I ,- I ) (3)
t + 1 t
Substituting for M in equation (1) we get
VA = NS + (It+1
- Ifc) - [ACGS - P + (I
t+1- I
t)J (4)
= NS + (It+J
- It
) - (It+1
- It
) - ACGS + P (5)
= NS - ACGS + P (6)
VA = Operating Income + Payroll (7)
Fortunately, operating income and payroll can be gleaned from annual
reports. We have done so and this is what we call the unadjusted
value added for a firm.
-22-
The reason it is unadjusted is that the cost of the difference in
inventory is evaluated on a cost basis as opposed to a market-value
basis. Therefore, when there is an addition to inventory in a par-
ticular period, value added will be underestimated, and similarly,
when inventory is depleted, (i.e. Net Sales exceed goods produced),
value added is overestimated. To correct or adjust for this, it is
necessary that the difference between the market value of inventory
and its cost, which is the profit margin, be added to the numerator of
the productivity measure.
Thus, if all goods produced in a period were sold, adjusted and
unadjusted value added would be the same. If, however, either more
(or Less) goods are sold than produced, value added would change by
the following amount:
A(VA) = A (inventory) * margin (difference between cost and
market value of inventory)
= (current year inventory - previous year inventory)
Net Sales - Cost of Goods Sold - DepreciationX
Net Sales
Therefore, our adjusted VA is the sum of operating income plus payroll
plus the dollar value of the difference in inventory from one period
to the next, i.e.
Adj. VA = Operating Income + payroll + A value added due
to inventory adustment.

-23-
APPENDIX 2
Measurement of Vertical Integration
Vertical integration is defined as the contribution of a firm's
capital and labor to output relative to that of its suppliers. The
degree of vertical integration for a firm can be measured through
either a revenue perspective or a cost perspective. From the revenue
perspective, the degree of vertical integration is the contribution of
capital and labor to revenue. The contribution of capital and labor is
value added. Thus, the revenue measure of the degree of vertical
integration is value added over sales. From the cost perspective, the
contribution of capital and labor to output is measured as their shares
to total costs. Thus, the "cost measure of vertical integration is
capital and labor costs over total costs."
The cost measure is superior to the revenue measure because it is
unaffected by changes in price. Suppose prices drop and costs of labor,
capital and material remain unchanged. Both sales and value added will
drop by the same dollar figure. Since value added is always less than
sales, the percentage decrease of value added is larger than that of
sales. Thus, the revenue measure, value added over sales, will decrease
even though the firm does not change the levels of material , labor and
capital. The same argument can be applied to the case of a price
increase. Thus, the revenue measure of vertical integration is not
robust to price change and we use the cost measure to adjust ROS . The
cost measure of vertical integration is readily available in annual
report. The measure is:

V.I. =
-24-
Labor cost + Capital CostTotal Costs
Material CostTotal Cost
Sales-Value AddedTotal Cost
Total cost is defined as costs of goods sold, general and administrative
expenses, and depreciation and value added is calculated as in Appendix 1
D/379

-25-
Bibliography
1. Aguilar, F. J., Scanning the Business Eqvironment (New York:
Macmillan, 1967).
2. Cyert, Richard, and March, James, A Behavioral Theory of the Firm(Englewood Cliffs, N.J.: Prentice Hall, 1963).
3. Denison, E. , Accounting for U.S. Economic Growth, 1929-1969
(Washington, D.C.: The Brookings Institution, 1974).
4. , "Explanation of Declining U.S. Productivity Growth,Survey of Current Business (August, 1979, Part III), pp. 1-24.
5. Fraumeni, B. , and Jorgenson, D. , "Capital Formation and U.S.Productivity Growth, 1948-1976," in Productivity Analysis: ARange of Perspectives , ed . , Ali Dogramaci (Boston: MartinusNijhoff, 1981).
6. Gallop, F. M. , and Jorgenson, D. , "U.S. Productivity Growth by
Industry, 1947-1973," in New Developments in ProductivityMeasurement and Analysis , ed., J. W. Kendrick and B. N. Vaccara(Chicago: University of Chicago Press, 1980), pp. 17-124.
7. Hall, J. T. and R. A. Dixon, Productivity Measurement in R&D,
(Washington, D.C.: Government Printing Office, 1975).
8. Horowitz, S. A. and A. Sherman, "A Direct Measure of the Rela-tionship Between Capital and Productivity," Journal of HumanResources (Winter, 1980), p. 67-76.
9. Hambrick, D.C., "Environment, Strategy, and Power Within TopManagement Teams," Administrative Science Quarterly , Vol. 26,
1981a, pp. 253-275.
10. , "Strategic Awareness Within Top ManagementTeams," Strategic Management Journal , Vol. 2, 1981b, pp. 263-279.
11. , "Environmental Scanning and OrganizationalStrategy," Strategic Management Journal , Vol. 3, 1982, pp. 159-174.
12. Keflas, A. G. and Schoderbek, P. P., "Scanning the BusinessEnvironment: Some Empirical Results," Decision Sciences , Vol. 4,
1973, pp. 63-74.
13. Kopcke, Richard, "Potential Growth, Productivity, and CapitalAccumulation," New England Economic Review (May/June, 19b0), pp.
22-41.
-26-
14. McGregor, D. , The Human Side of Enterprise (New York: McGraw-Hill, 1960).
15. Mansfield, E. , "Basic Research and Productivity Increase in
Manufacturing," American Economic Review (December, 1980), pp.863-873.
16. Solow, R. M. , "Technical Change and the Aggregate ProductionFunction," Review of Economies and Statistics , Vol. 39, 1957, pp,
312-20.
17. Zannetos, Z. S. , Lindsley, W. B. , Papageogiou, T. A., and Tang,
M. , "Productivity Measurement: Some Theoretical Underpinnings,"Sloan School of Management Working Paper , #1251-81, 1981.
18. , "Productivity Measurement: Applications to theAutomobile Industry," Sloan School of Managment Working Paper
,
#1234-82, 1982.
D/379

EXHIBIT i
24.0
20.0
£; 16.0
O
2.0
ao
4.0
o o
o00 o o o
oo
oo o
J I
1955 I960 1965 1970 1975 1980 1985
Year
Imported Cars Market Share (Number of Imported Cars Sold
in the U.S. as Compared to Total New Cars Sold)
Source: Motor Vehicle Facts and Figures ,Motor Vehicles Manufacturers
Associat ion
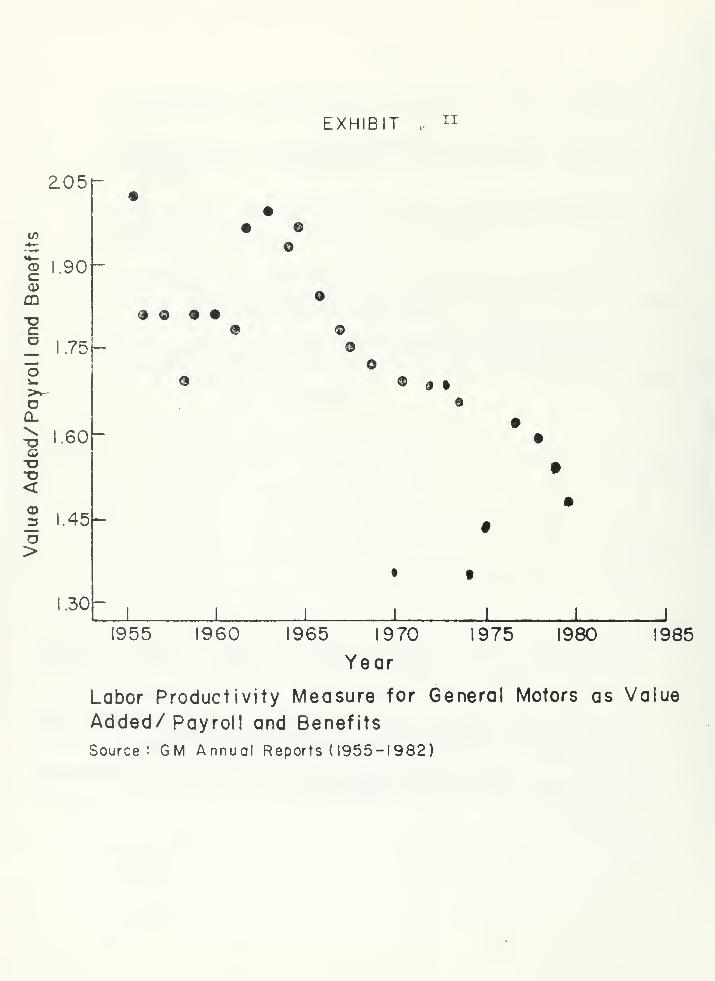
EXHIBIT ii
205r
V)
*—CDcQ)
CD
"Oco
.90-
~ 1-75
©
JO 9 •
©o
oa.
w
o<
O>
e
1.60
45
.301
1980J
9851955 I960 1965 1970 1975
Year
Labor Productivity Measure for General Motors as Value
Added/ Payroll and Benefits
Source: GM Annual Reports ( 1955-1982)

flOS#
» 1) •• t
•
17 9
13
• •
• « •
:2 J
• ••
»
»
'.0
7 J ••
3 »
•
2. 3 I
55 57 5T 61 63 65 »7 6? 71 73
ROI
40 • «
35 i
30
•
23
•
f •
•
20
13
a
10
3
3 37 3« 61 »J 65 67 6# 71 73 7J 77 7">
:ROE
6 6
6 • •
6 • t
55 57 y> 61 63 65 67 6» 71 73 '3 77 77
turn
EXHIBIT HI ROS,ROI,ROE FOR GENERAL M0T01
Source: GM Annual Reports (1955-1979)

»
Nt '
3500 *
300- )
2500 +
2000 +
1500 +
1000 < » »
' * •
i » .
500
b5 57- 5<v 61 63 65 67 69 71 73 7S 77 7 V
year
EPS !
12 +
li
to *
9
8 *
7 +
6 *
5
< •
A
3 • •i
2
55 57 59 61 63 65 67 69 .'1 73 75 77 79
»fHf
EXHIBIT IV NET INCOME AND EPS FOR GENERAI MOTORS(1955-1979)
Source: GM Annual Reports (1955-1979)

EXHIBIT V
00
.050
.000
).950
J.900
D.850
o o oo oo o
o o oo
ooo o
o
oo
o
o oo o o
J I
1955 I960 1965 1970 1975 1980 1985
Year
Price/Cost Ratio for the Automobile Industry
Source : U. S. Department of Labor, Bureau of Labor Statistics


lECKMAN
JUN95