
Productivity and Changes in Ownership of Manufacturing · PDF filein Ownership of...
41
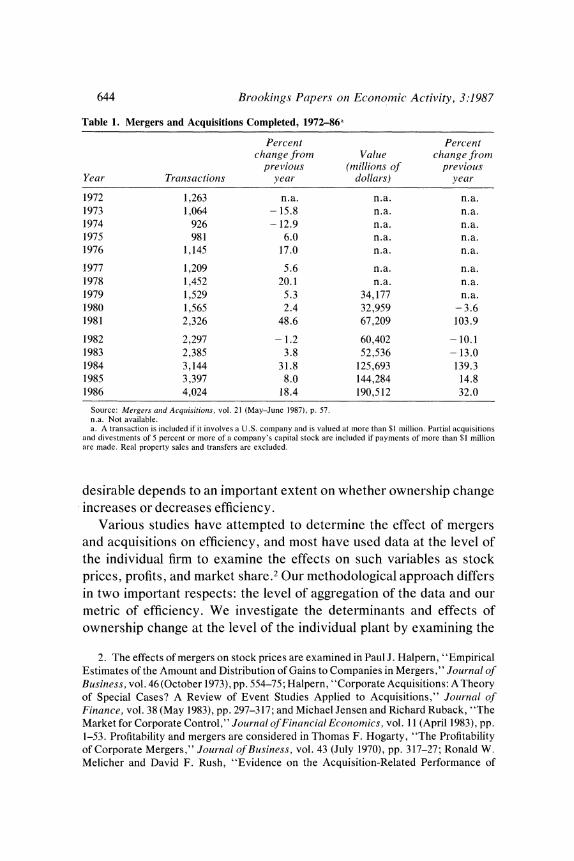
FRANK R. LICHTENBERG Columbia University and National Bureau of Economic Research DONALD SIEGEL Columbia University Productivity and Changes in Ownership of Manufacturing Plants SINCE the early 1970s the number of U. S. companies involvedin mergers, acquisitions, and other types of ownership change has increasedmark- edly:from 926completed transactions in 1974 to 2,326 in 1981, and4,024 in 1986. The number has in effect doubled aboutevery six or seven years (table 1). And the value of the companies involved increased almost sixfold between 1980 and 1986,far outpacing the 33 percentincrease in the consumerprice index and the 17 percent increase in the producer price index. These developments have stimulated intense debateon the consequences of changes in ownership, particularly for economic effi- ciency. The debate has potentially important policy implications,be- cause a considerable amount of federal and state legislation aimed at restrictingmergers and acquisitions, especially those resulting from hostile takeovers, has been proposed.' Whether such legislation is Thispaper is based on worksupported by the National ScienceFoundation under grant SES 84-01460, conducted at the U.S. Bureau of the Census while the authors were participants in the American Statistical Association/National Science Foundation/Census Bureau research program.We are grateful to Martin Baily, Dale Jorgenson, Edwin Mansfield, Clifford Winston, andotherconference participants for helpful comments. 1. Oneproposal, for example, wouldeliminate the tax deductibility of interest onjunk bonds, whichare used to finance takeovers.According to manyobservers,including the Brady Commission, consideration of this legislation by the House Ways and Means Committee was a major factorprecipitating the stock market plunge in October1987. 643
Transcript of Productivity and Changes in Ownership of Manufacturing · PDF filein Ownership of...
FRANK R. LICHTENBERG Columbia University and National Bureau of Economic Research
DONALD SIEGEL Columbia University
Productivity and Changes
in Ownership of
Manufacturing Plants
SINCE the early 1970s the number of U. S. companies involved in mergers, acquisitions, and other types of ownership change has increased mark- edly: from 926 completed transactions in 1974 to 2,326 in 1981, and 4,024 in 1986. The number has in effect doubled about every six or seven years (table 1). And the value of the companies involved increased almost sixfold between 1980 and 1986, far outpacing the 33 percent increase in the consumer price index and the 17 percent increase in the producer price index. These developments have stimulated intense debate on the consequences of changes in ownership, particularly for economic effi- ciency. The debate has potentially important policy implications, be- cause a considerable amount of federal and state legislation aimed at restricting mergers and acquisitions, especially those resulting from hostile takeovers, has been proposed.' Whether such legislation is
This paper is based on work supported by the National Science Foundation under grant SES 84-01460, conducted at the U.S. Bureau of the Census while the authors were participants in the American Statistical Association/National Science Foundation/Census Bureau research program. We are grateful to Martin Baily, Dale Jorgenson, Edwin Mansfield, Clifford Winston, and other conference participants for helpful comments.
1. One proposal, for example, would eliminate the tax deductibility of interest on junk bonds, which are used to finance takeovers. According to many observers, including the Brady Commission, consideration of this legislation by the House Ways and Means Committee was a major factor precipitating the stock market plunge in October 1987.
643
644 Brookings Papers on Economic Activity, 3:1987
Table 1. Mergers and Acquisitions Completed, 1972-86a
Percent Percent change from Value change from
previous (millions of previous Year Transactions year dollars) year
1972 1,263 n.a. n.a. n.a. 1973 1,064 - 15.8 n.a. n.a. 1974 926 - 12.9 n.a. n.a. 1975 981 6.0 n.a. n.a. 1976 1,145 17.0 n.a. n.a.
1977 1,209 5.6 n.a. n.a. 1978 1,452 20.1 n.a. n.a. 1979 1,529 5.3 34,177 n.a. 1980 1,565 2.4 32,959 - 3.6 1981 2,326 48.6 67,209 103.9
1982 2,297 - 1.2 60,402 - 10.1 1983 2,385 3.8 52,536 - 13.0 1984 3,144 31.8 125,693 139.3 1985 3,397 8.0 144,284 14.8 1986 4,024 18.4 190,512 32.0
Source: Mergers anid Acquiisitionis, vol. 21 (May-June 1987), p. 57. n.a. Not available. a. A transaction is included if it involves a U.S. company and is valued at more than $1 million. Partial acquisitions
and divestments of 5 percent or more of a company's capital stock are included if payments of more than $1 million are made. Real property sales and transfers are excluded.
desirable depends to an important extent on whether ownership change increases or decreases efficiency.
Various studies have attempted to determine the effect of mergers and acquisitions on efficiency, and most have used data at the level of the individual firm to examine the effects on such variables as stock prices, profits, and market share.2 Our methodological approach differs in two important respects: the level of aggregation of the data and our metric of efficiency. We investigate the determinants and effects of ownership change at the level of the individual plant by examining the
2. The effects of mergers on stock prices are examined in Paul J. Halpern, "Empirical Estimates of the Amount and Distribution of Gains to Companies in Mergers," Journal of Business, vol. 46 (October 1973), pp. 554-75; Halpern, "Corporate Acquisitions: A Theory of Special Cases? A Review of Event Studies Applied to Acquisitions," Journal of Finance, vol. 38 (May 1983), pp. 297-317; and Michael Jensen and Richard Ruback, "The Market for Corporate Control," Journal of Financial Economics, vol. 11 (April 1983), pp. 1-53. Profitability and mergers are considered in Thomas F. Hogarty, "The Profitability of Corporate Mergers," Journal of Business, vol. 43 (July 1970), pp. 317-27; Ronald W. Melicher and David F. Rush, "Evidence on the Acquisition-Related Performance of
Frank R. Lichtenberg and Donrald Siegel 645
behavior of total factor productivity. This research design offers two significant advantages. First, the data allow us to examine the effects of certain transactions that have not been observed before. Because many ownership changes involve only parts of companies or even parts of divisions of companies, it is very difficult to assess the impact of such partial acqusitions and divestitures using financial data at the level of the company or even of the line of business. Second, there is a consensus that the best way to measure the efficiency of an enterprise (or of an economic system) is to measure its total factor productivity.
This paper analyzes the relationship between total factor productivity and ownership change, using Census Bureau data on more than 18,000 relatively large plants throughout the U.S. manufacturing sector. About 21 percent of the plants changed owners at least once during a ten-year period. The data enable us to compare, both before and after ownership change, the productivity of these plants with that of plants in the same industry that have not changed owners.
This methodology allows us to address an important issue in the current debate: Do the gains that typically accrue to shareholders from changes in ownership benefit society as a whole or are they merely private gains? A large body of empirical evidence on the combined market values of acquiring and acquired companies suggests that take- overs have a positive net effect on stockholder wealth.3 But are these private or social gains? Andrei Shleifer and Lawrence H. Summers argue that takeovers may harm those who have a stake in a company's performance-workers, suppliers, the government, the surrounding community-through layoffs, lower wages, abrogated contracts with suppliers, and lost tax revenues.4 They contend that increases in stock prices associated with mergers merely reflect a transfer of wealth from
Conglomerate Firms," Journal of Finance, vol. 29 (March 1974), pp. 1941-49; and J. Fred Weston and Surendra K. Mansinghka, "Tests of the Efficiency Performance of Conglom- erate Firms," Journal of Finance, vol. 26 (September 1971), pp. 919-36. The impact of mergers on market shares is discussed in Dennis C. Mueller, "Mergers and Market Share," Review ofEconomnics andStatistics, vol. 67 (May 1985), pp. 259-67; and Robert McGuckin, Stephen Andrews, and James Monahan, "The Efficiency of Conglomerate Mergers: New Evidence from Longitudinal Research Data Base," paper presented at the National Bureau of Economics Research Summer Institute on Productivity, 1987.
3. See Jensen and Ruback, "Market for Corporate Control." 4. Andrei Shleifer and Lawrence H. Summers, "Hostile Takeovers as Breaches of
Trust," unpublished paper (1987).
646 Brookinigs Papers on Economic Activity, 3:1987
a firm's stakeholders to its shareholders. An opposing view argues that acquisitions engender social gains because plants are then operated more efficiently. An analysis of the relationship between takeovers and total factor productivity allows the validity of these two views to be considered and compared.
The remainder of this paper is organized as follows. First, we discuss some of the major theories on the efficiency of corporate takeovers. We then advance a "matching" theory of ownership change, which borrows heavily from the theory of labor turnoverformulated by Boyan Jovanovic and others.5 The next section presents the salient characteristics of the Longitudinal Establishment Data Time Series file, which is used to test the validity of the theory. This section also describes how the LED file can be used to measure three key variables in our analysis: ownership change, growth of total factor productivity (the proxy for changes in economic efficiency), and initial productivity. The final sections present empirical results, summarize conclusions, and provide suggestions for research.
Theories of Ownership Change
Many theories of ownership change have been proposed, each with different implications for how mergers and acquisitions affect economic performance. In the neoclassical tradition, J. E. Meade argued that corporate takeovers promote economic natural selection. Efficient firms survive (that is, they remain autonomous) while inefficient companies are taken over. The threat of takeover causes managers to try to maximize profits. Henry Manne contended that the threat of takeover is serious because ownership change provides a way of getting rid of ineffective managers. In a similar vein, Michael Jensen asserted that mergers increase the efficiency of resource allocation and provide a framework for ensuring that management will act to maximize shareholder wealth.6
5. Boyan Jovanovic, "Job Matching and the Theory of Turnover," Jollrnal ofPolitical Economy, vol. 87 (October 1979), pt. 1, pp. 972-90.
6. J. E. Meade, "Is the New Industrial State Inevitable?" Economic Jolurnal, vol. 78 (June 1968), pp. 372-92; Henry G. Manne, "Mergers and the Market for Corporate Control," Joutrnal of Political Economy, vol. 73 (April 1965), pp. 110-20; and Michael C. Jensen, "The Takeover Controversy: Analysis and Evidence," in John C. Coffee, Jr., Louis Lowenstein, and Susan Rose-Ackerman, eds., Knights, Raiders, and Targets: The Impact of the Hostile Takeover (Oxford University Press, 1988).
Frank R. Lichtenberg and Donald Siegel 647
In contrast, Dennis C. Mueller contended that corporate leaders pursue a policy of growth rather than maximization of profit or stock- holder wealth.7 Executive compensation is often based on revenue increases, and because of imperfections in capital markets, large firms are less likely to be taken over. Consistent with this notion of management empire building, Richard Roll argued that the net effect of mergers is to reduce stockholder wealth because acquiring firms systematically ov- erestimate the value of their targets. He attributed this myopic behavior to the hubris of top-level executives.8
Michael Gort's theory of economic disturbance implied that mergers have a neutral effect on efficiency. His model treated assets transferred through ownership change in the same manner as other income-produc- ing assets. Mergers, he argued, are caused mainly by divergent expec- tations: the acquiring and acquired firms have vastly different percep- tions of the present value of the target company's stock, based on different expectations about future levels and sources of income. These discrepancies, he added, are more likely to occur during periods of economic disturbance-bull markets or rapid technological change.9
These theories, of course, do not constitute a complete summary of merger motives. Other reasons for takeovers frequently cited include the drive for monopoly power and the desire to achieve tax savings. '?
A "Matching" Theory of Ownership Change
We believe ownership change is primarily a mechanism for correcting lapses of efficiency. Most acquisitions are precipitated by a deterioration
7. Dennis C. Mueller, "A Theory of Conglomerate Mergers," Qluarterly Journal of Economics, vol. 83 (November 1969), pp. 643-59. Similar ideas are expressed in John Kenneth Galbraith, The New Industrial State (Houghton Mifflin, 1967); and Robin Marris, The Economic Theory of "Managerial" Capitalism (Free Press of Glencoe, 1964).
8. Richard Roll, "The Hubris Hypothesis of Corporate Takeovers," Journal of Business, vol. 59 (April 1986), pp. 197-216.
9. Michael Gort, "An Economic Disturbance Theory of Mergers," Qluarterly Jouirnal of Economics, vol. 83 (November 1969), pp. 624-42. Gort's model is essentially a variation of the theme of maximizing stockholder wealth. The market expects no gain to result from the merger because acquirers have expectations different from those of the market. The premium earned by the acquired firm is therefore exactly offset by a loss to the acquiring firm's shareholders.
10. See Alan Auerbach and David Reishus, "The Effects of Taxation on the Merger Decision," unpublished paper (1987).
648 Br ookings Papers oni Economic Activity, 3:1987
in the target firm's economic peiformance. Deteriorating productivity provides an important signal to a plant's owner that for some reason he is operating in a less efficient manner than an alternative parent could. This may be due to an inherent incompatibility between plant and owner (a comparative disadvantage) or an overall lack of managerial compe- tence (an absolute disadvantage).
To account for the sources of incompatibility between plant and parent company, we note the striking similarity between their relation- ship and the one between workers and employers. In the job separation model advanced by Boyan Jovanovic, the employee's true productivity in a given firm is unknown before he or she is hired. The employer's knowledge of the worker's ability improves as job tenure increases. Heterogeneous groups of workers and employers thus continually en- gage in a matching process, and experience provides important new information concerning the quality of the match. 1I1
We believe that the theory of ownership change or plant turnover is closely related to the matching theory of job turnover. Before acquiring or building a plant, corporations (especially well-diversified ones) have incomplete information about the true levels of efficiency of these heterogeneous plants. The companies are interested only in maintaining control of establishments they can manage effectively. In this sense, firms are constantly evaluating the match or fit between plant and parent. More precise information about the quality of the match develops the longer a firm operates a plant.
The matching theory of plant turnover entails three primary assump- tions.
-Some owners enjoy a comparative advantage with respect to certain plants. The source of a firm's comparative advantage may be a combi- nation of its managerial expertise, technological skill, and ability to exploit opportunities for economies of scale or scope.
-The quality of the match is the major determinant of the corporate-
11. Jovanovic, "Job Matching and the Theory of Turnover." Evidence consistent with the matching model of job separation was provided in Katharine G. Abraham and Henry S. Farber, "Job Duration, Seniority, and Earnings," American Economolic Rev,iew, vol. 77 (June 1987), pp. 278-97; and Joseph G. Altonji and Robert A. Shakotko, "Do Wages Rise with Job Seniority?" Revieii' of Economic Stuidies, vol. 54 (July 1987), pp. 437-59. These authors found that the positive correlation between job tenure and earnings is actually caused by the association between job tenure and an unobservable variable measuring the quality of the match between employee and employer.

Frank R. Lichtenberg and Donald Siegel 649
level decision to maintain or relinquish ownership of an establishment. In this regard, we need not assume that there are good owners and bad owners or plants but only that there are good and bad matches. 12
-The quality of the match is indexed by total factor productivity, our measure of efficiency, which is a good whose quality is determined by experience. Owners cannot determine the efficiency of plants in advance. The nature of their comparative advantage becomes evident only as they operate the facilities.
The following illustration describes the matching process. Plants and their owners are matched initially at time 0. Match quality, and hence productivity, varies randomly. The lower the plant productivity is, relative to the mean level of efficiency in the industry, the higher the probability of ownership change. Because of transactions costs associ- ated with selling a plant, there is a threshold below which the relative efficiency of the plant must fall before a change in ownership is sensible. When an ownership change does occur, even an average match leads to above-average growth in productivity or an increase in efficiency.
The matching theory of plant turnover has two major implications. -A low level of productivity, which indicates a poor match, will
induce a change in ownership. -A change in ownership will result in an increase in productivity.
The quality of each match, which is measured by the level of plant productivity, is assumed to be randomly distributed. 13 Thus the expected value of a new match (from an identical distribution) is higher, given that the first match was low.
Data
Our analysis of the determinants and effects of changes in plant ownership is based on the Longitudinal Establishment Data (LED) file. This file, which brings together data from the Annual Survey and Census of Manufactures collected by the U.S. Bureau of the Census, is used to
12. This implies that firms with an absolute disadvantage are sold because they will have all bad matches.
13. In practice, of course, the quality of the match may be somewhat predictable. We abstract from this by focusing on the unpredictable component of the variation in match quality.
650 Brookings Papers on Economic Activity, 3:1987
mneasure productivity at the plant level. The file is the richest source of annual data collected from manufacturing establishments, containing detailed information on output and inputs.
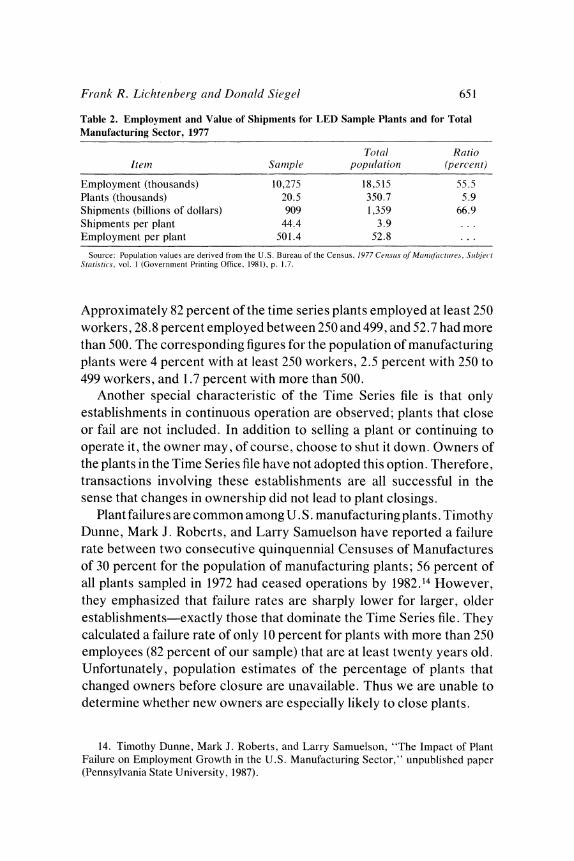
We analyze a balanced extract of the full LED file, called the LED Time Series file. In this data set, 20,493 manufacturing plants owned by more than 5,700 firms were observed annually from 1972 to 1981. A Census Bureau coverage code was provided in all years, allowing changes in corporate ownership to be identified. Each plant was also assigned a four-digit standard industrial classification (SIC) code based on its primary product and a code identifying the ultimate corporate owner. Table 2 shows the LED Time Series sample and the total manufacturing sector population employment, plants, and values of shipments. The plants account for 67 percent of the total value of manufacturing shipments and 55 percent of employment. Among two- digit SICs (not shown), the industries with the highest percentages of plants included in the sample are primary metals, petroleum, tobacco, textiles, paper, and chemicals.
From both cross-sectional and time-series perspectives, the owner- ship changes recorded in the data set constitute a nonrandom sample of all postwar ownership changes. The LED Time Series file contains data only for continuously operating plants that were included in the Annual Survey of Manufacturers (ASM) sample throughout the 1972-81 period. The 1977 Census of Manufactures (basically, the complete population of manufacturing plants) included 350,648 plants. The 1981 ASM sample (hence the full LED file) included 55,054 plants, and the LED Time Series file 20,493. The difference between the LED file and its time series extract is due to plant failures and changes in the ASM sample, which was redrawn in 1974 and again in 1979. The unique cross-section and time-series aspects of these establishments with respect to the population of manufacturing plants will be examined in detail below. Given the nonrandom distribution of the plants we observed, the ownership changes involving them are nonrepresentative. This issue will also be addressed.
The cross-section in the sample consists mainly of large plants, which is not surprising because the LED documentation explains that large plants owned by larger-than-average firms are disproportionately rep- resented in the file. Table 2 shows that LED Time Series plants, although comparatively few, are ten or twelve times as large in terms of employ- ment and output, respectively, as the typical manufacturing plant.
Frank R. Licht enberg and Donald Siegel 651
Table 2. Employment and Value of Shipments for LED Sample Plants and for Total Manufacturing Sector, 1977
Total Ratio Item Sample popiilation (per-cent)
Employment (thousands) 10,275 18,515 55.5 Plants (thousands) 20.5 350.7 5.9 Shipments (billions of dollars) 909 1,359 66.9 Shipments per plant 44.4 3.9 ... Employment per plant 501.4 52.8 ...
Souirce: Population values are derived from the U.S. Bureau of the Census, 1977 Cetnsius of Manqftlcture, Subject Statistics, vol. I (Government Printing Office, 1981), p. 1.7.
Approximately 82 percent of the time series plants employed at least 250 workers, 28.8 percent employed between 250 and 499, and 52.7 had more than 500. The corresponding figures for the population of manufacturing plants were 4 percent with at least 250 workers, 2.5 percent with 250 to 499 workers, and 1.7 percent with more than 500.
Another special characteristic of the Time Series file is that only establishments in continuous operation are observed; plants that close or fail are not included. In addition to selling a plant or continuing to operate it, the owner may, of course, choose to shut it down. Owners of the plants in the Time Series file have not adopted this option. Therefore, transactions involving these establishments are all successful in the sense that changes in ownership did not lead to plant closings.
Plant failures are common among U. S. manufacturing plants. Timothy Dunne, Mark J. Roberts, and Larry Samuelson have reported a failure rate between two consecutive quinquennial Censuses of Manufactures of 30 percent for the population of manufacturing plants; 56 percent of all plants sampled in 1972 had ceased operations by 1982.14 However, they emphasized that failure rates are sharply lower for larger, older establishments-exactly those that dominate the Time Series file. They calculated a failure rate of only 10 percent for plants with more than 250 employees (82 percent of our sample) that are at least twenty years old. Unfortunately, population estimates of the percentage of plants that changed owners before closure are unavailable. Thus we are unable to determine whether new owners are especially likely to close plants.
14. Timothy Dunne, Mark J. Roberts, and Larry Samuelson, "The Impact of Plant Failure on Employment Growth in the U.S. Manufacturing Sector," unpublished paper (Pennsylvania State University, 1987).
652 Br ookings Paper s on Economic Activity, 3:1987
Plant openings are also excluded from the sample. Openings perform an important function in the evolution of many industries. Timothy Dunne and Mark J. Roberts have reported that approximately 150,000 plants were born between 1972 and 1977 and another 137,000 by 1982. 15
Because of the structure of the Time Series file, we did not observe ownership changes of these fledgling plants.
The ownership changes in this sample may also be nonrepresentative from a time series perspective. Merger activity increased substantially in the 1960s, peaking near the end of the decade; conglomerate mergers were especially popular. 16 Based on data from W. T. Grimm, David J. Ravenscraft and F. M. Scherer estimated that 40 percent of corporate acquisitions in the 1970s were spin-offs of previously acquired units.17 Using the Federal Trade Commission's line-of-business data, they found that 70 percent of all lines of business that were completely sold off from 1974 to 1981 had originally been purchased by their parent companies. Given the proximity of the time frame of our sample to the wave of conglomerate mergers in the 1960s, it is likely that the ownership changes we observed reflect an unusually high percentage of spin-offs of units acquired through conglomerate mergers.
OWNERSHIP CHANGE
Plant ownership change is a key variable in our analysis. Each plant is assigned a two-digit coverage code that identifies establishments that have experienced a change in operational status from the previous year. Several values of the coverage code relate specifically to plant acquisi- tions by an ultimate parent. For example, if company A owns a division with several plants and sells it to company B, we assigned each plant in the division an acquisition-related coverage code after the deal was consummated. Sales of individual plants in a division led to acquisition- related coverage codes only for those that were actually sold.
15. Timothy Dunne and Mark J. Roberts, "Measuring Firm Entry, Growth, and Exit with Census of Manufactures Data," unpublished paper (Pennsylvania State University, 1986).
16. Devra Golbe and Lawrence J. White, "Mergers and Acquisitions in the U.S. Economy: An Aggregate and Historical Overview," in Alan J. Auerbach, ed., Mergers and Acqusitions (University of Chicago Press for the National Bureau of Economic Research, 1988), pp. 25-48.
17. David J. Ravenscraft and F. M. Scherer, "Mergers and Managerial Peiformance," in Coffee and others, eds., Knighlts, Raiders, and Tar gets.
Fr ank R. Lichteniber g acnd Donald Siegel 653
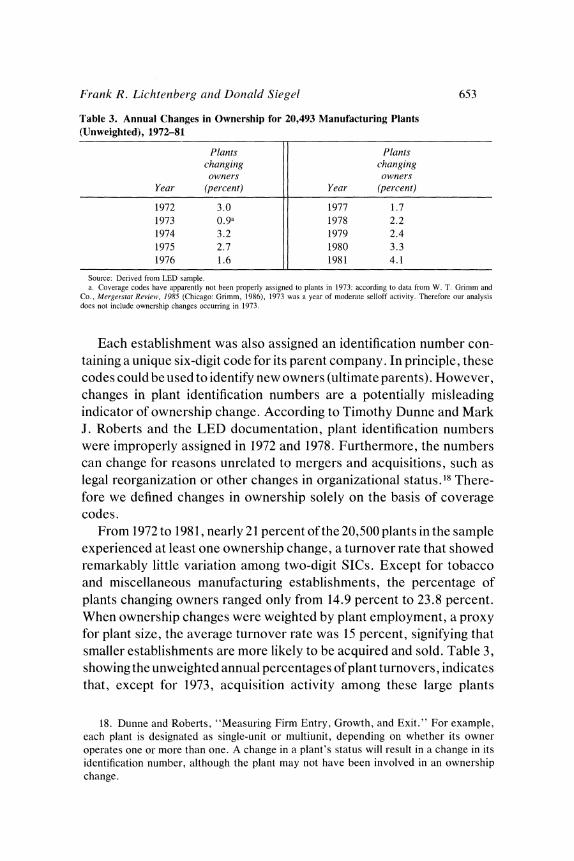
Table 3. Annual Changes in Ownership for 20,493 Manufacturing Plants (Unweighted), 1972-81
Plants Plants changing changing owners owners
Year (percent) Year (percent)
1972 3.0 1977 1.7 1973 0.9a 1978 2.2 1974 3.2 1979 2.4 1975 2.7 1980 3.3 1976 1.6 1981 4.1
Source: Derived from LED sample. a. Coverage codes have apparently not been properly assigned to plants in 1973: according to data from W. T. Grinmm and
Co., Mergerstat Review, 1985 (Chicago: Grimm, 1986), 1973 was a year of moderate selloff activity. Therefore our analysis does not include ownership changes occurring in 1973.
Each establishment was also assigned an identification number con- taining a unique six-digit code for its parent company. In principle, these codes could be used to identify new owners (ultimate parents). However, changes in plant identification numbers are a potentially misleading indicator of ownership change. According to Timothy Dunne and Mark J. Roberts and the LED documentation, plant identification numbers were improperly assigned in 1972 and 1978. Furthermore, the numbers can change for reasons unrelated to mergers and acquisitions, such as legal reorganization or other changes in organizational status.18 There- fore we defined changes in ownership solely on the basis of coverage codes.
From 1972 to 1981, nearly 21 percent of the 20,500 plants in the sample experienced at least one ownership change, a turnover rate that showed remarkably little variation among two-digit SICs. Except for tobacco and miscellaneous manufacturing establishments, the percentage of plants changing owners ranged only from 14.9 percent to 23.8 percent. When ownership changes were weighted by plant employment, a proxy for plant size, the average turnover rate was 15 percent, signifying that smaller establishments are more likely to be acquired and sold. Table 3, showing the unweighted annual percentages of plant turnovers, indicates that, except for 1973, acquisition activity among these large plants
18. Dunne and Roberts, "Measuring Firm Entry, Growth, and Exit." For example, each plant is designated as single-unit or multiunit, depending on whether its owner operates one or more than one. A change in a plant's status will result in a change in its identification number, although the plant may not have been involved in an ownership change.
654 Brookings Papers on Economic Activity, 3:1987
essentially mirrored the patterns of aggregate merger activity shown in table 1. Unfortunately, data on the incidence of ownership change among the total population of manufacturing plants are unavailable.
INITIAL PRODUCTIVITY
Another important variable in the matching model is initial productiv- ity. We measured the initial level of plant productivity by estimating separately by four-digit SIC industry and year cross-sectional Cobb- Douglas production functions of the following form:
In Qi = to + OLK ln Ki + aL In Li + otM ln Mi + ui,
where Q is output, K is stock of physical capital, L is labor input, M is intermediate materials input (including energy), and the subscript i refers to plant i. The construction of the Q, K, L, and M measures is described in the appendix; u is a classical disturbance term. Separate estimation of the equation for individual industries and years allowed the elasticities, cvi, to vary across industries and over time. We did not impose the assumptions of competitive factor markets or constant returns to scale. The residual measures the logarithmic deviation of a plant's total factor productivity from the average productivity of plants in its industry.
TOTAL FACTOR PRODUCTIVITY GROWTH
To investigate the effects of ownership change on efficiency at the plant level, we examined the behavior of total factor productivity growth. Standard growth accounting methods using the full equilibrium index model were used to calculate TFP growth. 19 Production was assumed to be characterized by a three-factor production function:
Q(t) = A(t)F[K(t), L(t), M(t)],
where Q, K, L, and M are as previously defined, and A is a Hicks-neutral measure of technical change.
For simplicity, we assumed a Cobb-Douglas production function:
Q(t) = A(t) * 1-1-3 . X.(t)Pi
19. Michael Hazilla and Raymond J. Kopp, "The Measurement of Sectoral Productiv- ity: A Comparative Evaluation of Alternative Approaches," unpublished paper (1987), used this terminology to describe the calculation of TFP based on the assumption that all factors of production are in equilibrium.
Fr-ank R. Lichtenber-g and Donald Siegel 655
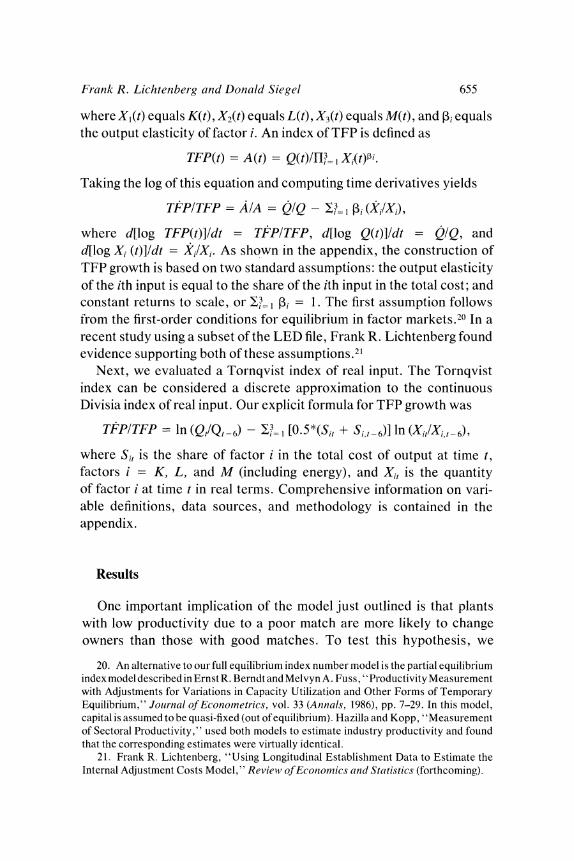
where Xl(t) equals K(t), X2(t) equals L(t), X3(t) equals M(t), and Pi equals the output elasticity of factor i. An index of TFP is defined as
TFP(t) = A(t) = Q(t)/H3 I Xi(t)i.
Taking the log of this equation and computing time derivatives yields
TFP/TFP = A/A = Q/Q - 13= Pi (X,/XW),
where d[log TFP(t)]/dt = TFP/TFP, d[log Q(t)]ldt = Q/Q, and d[log Xi (t)]ldt = Xi/Xi. As shown in the appendix, the construction of TFP growth is based on two standard assumptions: the output elasticity of the ith input is equal to the share of the ith input in the total cost; and constant returns to scale, or =I 1. The first assumption follows from the first-order conditions for equilibrium in factor markets.20 In a recent study using a subset of the LED file, Frank R. Lichtenberg found evidence supporting both of these assumptions.21
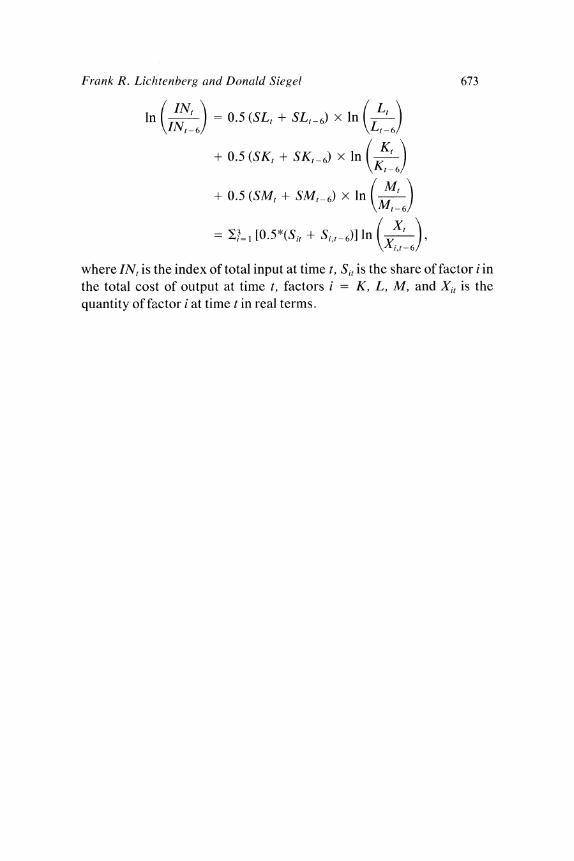
Next, we evaluated a Tornqvist index of real input. The Tornqvist index can be considered a discrete approximation to the continuous Divisia index of real input. Our explicit formula for TFP growth was
TFP/TFP = ln (Qt/Qt - 6) - IL I [0 5*(Sit + Si,t-6)] In (XitlXit,_6),
where Sit is the share of factor i in the total cost of output at time t, factors i = K, L, and M (including energy), and Xit is the quantity of factor i at time t in real terms. Comprehensive information on vari- able definitions, data sources, and methodology is contained in the appendix.
Results
One important implication of the model just outlined is that plants with low productivity due to a poor match are more likely to change owners than those with good matches. To test this hypothesis, we
20. An alternative to our full equilibrium index number model is the partial equilibrium index model described in Ernst R. Berndt and Melvyn A. Fuss, "Productivity Measurement with Adjustments for Variations in Capacity Utilization and Other Forms of Temporary Equilibrium," Jolurnal of Econometrics, vol. 33 (Aninals, 1986), pp. 7-29. In this model, capital is assumed to be quasi-fixed (out of equilibrium). Hazilla and Kopp, "Measurement of Sectoral Productivity," used both models to estimate industry productivity and found that the corresponding estimates were virtually identical.
21. Frank R. Lichtenberg, "Using Longitudinal Establishment Data to Estimate the Internal Adjustment Costs Model," ReWiewi' of Econiomics anid Statistics (forthcoming).
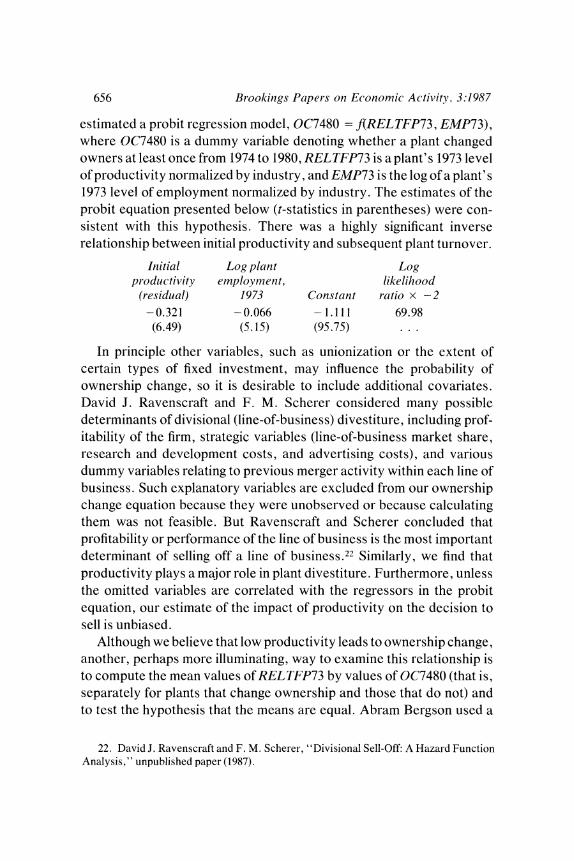
656 Br ookings Paiper s on Economic Activity, 3:1987
estimated a probit regression model, OC7480 = f(RELTFP73, EMP73), where OC7480 is a dummy variable denoting whether a plant changed owners at least once from 1974 to 1980, RELTFP73 is a plant's 1973 level of productivity normalized by industry, and EMP73 is the log of a plant's 1973 level of employment normalized by industry. The estimates of the probit equation presented below (t-statistics in parentheses) were con- sistent with this hypothesis. There was a highly significant inverse relationship between initial productivity and subsequent plant turnover.
Initial Log plant Log productivity employment, likelihood
(residual) 1973 Constant ratio x -2
-0.321 -0.066 - 1.111 69.98 (6.49) (5.15) (95.75)
In principle other variables, such as unionization or the extent of certain types of fixed investment, may influence the probability of ownership change, so it is desirable to include additional covariates. David J. Ravenscraft and F. M. Scherer considered many possible determinants of divisional (line-of-business) divestiture, including prof- itability of the firm, strategic variables (line-of-business market share, research and development costs, and advertising costs), and various dummy variables relating to previous merger activity within each line of business. Such explanatory variables are excluded from our ownership change equation because they were unobserved or because calculating them was not feasible. But Ravenscraft and Scherer concluded that profitability or performance of the line of business is the most important determinant of selling off a line of business.22 Similarly, we find that productivity plays a major role in plant divestiture. Furthermore, unless the omitted variables are correlated with the regressors in the probit equation, our estimate of the impact of productivity on the decision to sell is unbiased.
Although we believe that low productivity leads to ownership change, another, perhaps more illuminating, way to examine this relationship is to compute the mean values of RELTFP73 by values of OC7480 (that is, separately for plants that change ownership and those that do not) and to test the hypothesis that the means are equal. Abram Bergson used a
22. David J. Ravenscraft and F. M. Scherer, "Divisional Sell-Off: A Hazard Function Analysis," unpublished paper (1987).
Frank R. Lichtenberg and Donald Siegel 657
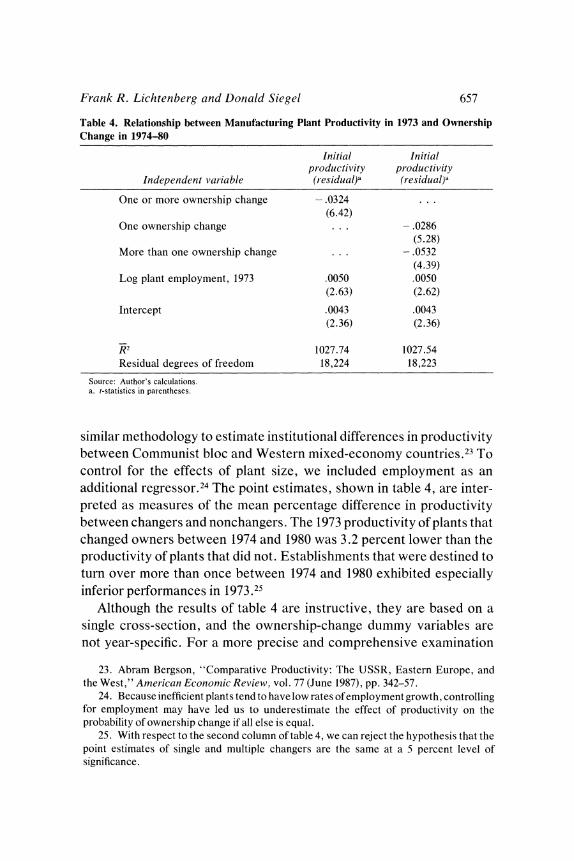
Table 4. Relationship between Manufacturing Plant Productivity in 1973 and Ownership Change in 1974-80
Initial Initial pr-oductivity productivity
Independent var-iable (residual)a (residual)a
One or more ownership change -.0324 (6.42)
One ownership change . .. -.0286 (5.28)
More than one ownership change . . . -.0532 (4.39)
Log plant employment, 1973 .0050 .0050 (2.63) (2.62)
Intercept .0043 .0043 (2.36) (2.36)
K2 1027.74 1027.54 Residual degrees of freedom 18,224 18,223
Source: Author's calculations. a. t-statistics in parentheses.
similar methodology to estimate institutional differences in productivity between Communist bloc and Western mixed-economy countries.23 To control for the effects of plant size, we included employment as an additional regressor.24 The point estimates, shown in table 4, are inter- preted as measures of the mean percentage difference in productivity between changers and nonchangers. The 1973 productivity of plants that changed owners between 1974 and 1980 was 3.2 percent lower than the productivity of plants that did not. Establishments that were destined to turn over more than once between 1974 and 1980 exhibited especially inferior performances in 1973.25
Although the results of table 4 are instructive, they are based on a single cross-section, and the ownership-change dummy variables are not year-specific. For a more precise and comprehensive examination
23. Abram Bergson, "Comparative Productivity: The USSR, Eastern Europe, and the West," American Economic Review, vol. 77 (June 1987), pp. 342-57.
24. Because inefficient plants tend to have low rates of employment growth, controlling for employment may have led us to underestimate the effect of productivity on the probability of ownership change if all else is equal.
25. With respect to the second column of table 4, we can reject the hypothesis that the point estimates of single and multiple changers are the same at a 5 percent level of significance.
658 Brookings Papers on Economic Activity, 3:1987
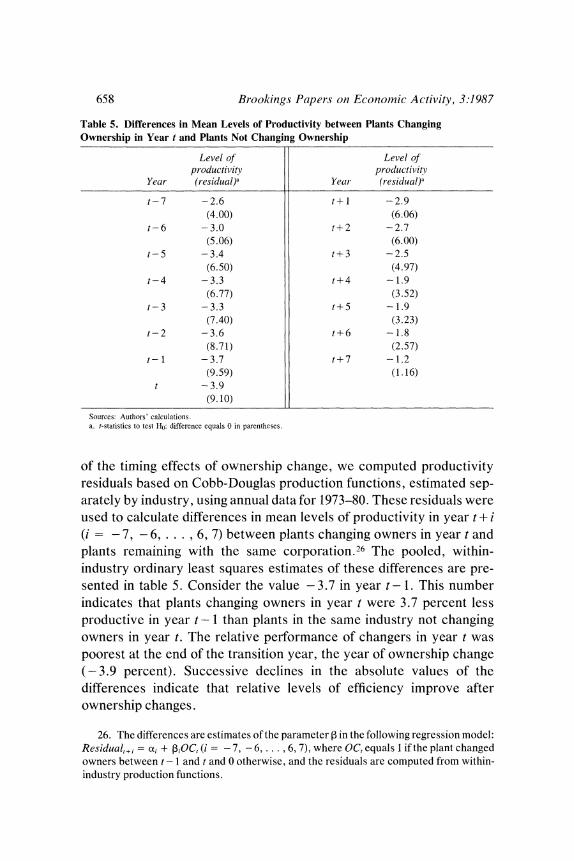
Table 5. Differences in Mean Levels of Productivity between Plants Changing Ownership in Year t and Plants Not Changing Ownership
Level of Level of productivity productivitv
Year (residual)a Year (residuaI)a
t-7 -2.6 t+ 1 -2.9 (4.00) (6.06)
t-6 --3.0 t+2 -2.7 (5.06) (6.00)
t-5 -3.4 t+3 -2.5 (6.50) (4.97)
t-4 -3.3 t+4 - 1.9 (6.77) (3.52)
t-3 -3.3 t+5 - 1.9 (7.40) (3.23)
t-2 -3.6 t+6 - 1.8 (8.71) (2.57)
t-1 -3.7 t+7 -1.2 (9.59) (1.16)
t --3.9 (9. 10)
Sources: Authors' calculations. a. t-statistics to test Ho: difference equals 0 in parentheses.
of the timing effects of ownership change, we computed productivity residuals based on Cobb-Douglas production functions, estimated sep- arately by industry, using annual data for 1973-80. These residuals were used to calculate differences in mean levels of productivity in year t + i (i = 7, - 6,... , 6, 7) between plants changing owners in year t and plants remaining with the same corporation.26 The pooled, within- industry ordinary least squares estimates of these differences are pre- sented in table 5. Consider the value - 3.7 in year t- 1. This number indicates that plants changing owners in year t were 3.7 percent less productive in year t - 1 than plants in the same industry not changing owners in year t. The relative performance of changers in year t was poorest at the end of the transition year, the year of ownership change (-3.9 percent). Successive declines in the absolute values of the differences indicate that relative levels of efficiency improve after ownership changes.
26. The differences are estimates of the parameter 3 in the following regression model: Residual+,i = ai + fiOC, (i = - 7, - 6,...,6, 7), where OC, equals 1 if the plant changed owners between t - 1 and t and 0 otherwise, and the residuals are computed from within- industry production functions.
Frank R. Lichtenberg and Donald Siegel 659
The other major implication of the matching theory is that plant turnover should result in improvements in productivity. The values presented in table 5 suggest that productivity growth is higher after plants have been involved in takeovers. Just four years after ownership has changed, approximately 49 percent of the productivity gap that existed at t - 1 (- 3.7 percent) between year t changers and nonchangers was closed (- 1.9 percent). At t + 7, almost 68 percent of this gap was eliminated (-1.2 percent). Moreover, the difference in t + 7 is not statistically significant. Thus we cannot reject the hypothesis that plants that were sold seven years before are just as productive as plants that were not sold.
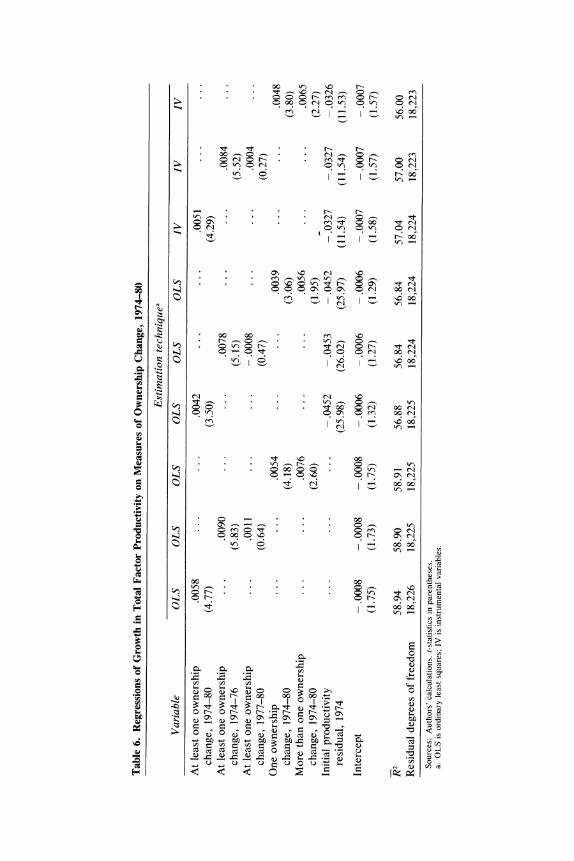
To examine further the effects of plant turnover on economic effi- ciency, we computed regressions of the growth in TFP between 1974 and 1980 on various measures of the incidence of ownership change in those years. These results are reported in table 6, which supports the hypothesis that ownership change improves productivity. Plants in- volved in one or more transactions during this period experienced 0.58 percent higher TFP growth than their industry counterparts who re- mained with the same parent corporation.
If the new owners of plants increase the economic efficiency of these establishments, it seems likely that several years must elapse before this improvement is measurable. To test this assumption, we classified ownership changes according to whether they occurred early (1974-76) or late (1977-80) in the period. Plants changing hands early had significant improvements in efficiency; those changing toward the end of the period did not. Thus it appears that efficiency gains associated with ownership changes do not occur immediately. Productivity increases were slightly greater in plants that experienced more than one ownership change during the period.
Each plant's initial productivity is included in table 6 as an additional regressor to control for the possibility of a regression toward the mean. As discussed previously, the increases in productivity that seem to be associated with a change in ownership may in fact reflect the tendency of below- or above-average values to regress toward mean values.
Plants that changed owners thus had lower initial levels of productivity and greater growth in productivity than plants that did not. Consistent with a matching hypothesis of plant turnover, we interpret the low initial level to be due to inefficient management (perhaps because of random mismatch) and the higher growth to be due on average to more efficient
* * * o o o >~~C I- m m CD r- (=
CD 'ot-ot CD CD CD cq 00 -
Fs * O N O > . . m t O > O N~~~m 0 CI
Fs O o . . O 0
X 1OO 0 t 0t
^~~~~~~~~~~~~~~~~ >
X < * ~ ~ ~~0 00 *0 * m m
X * >~~~~~~~~~~~~ 0 *VD<O
V -C O OIt O-OO- 00
m . ~~~~~N C* *3 *3 * N ?
3 w cn o o: : v X 8 N oo N~~~~~~~~~~~~~~~~~~~~~~~~~c
Frank R. Lichtenberg and Donald Siegel 661
management. There are, however, at least two other potential explana- tions for the finding that plants with low initial productivity have higher subsequent productivity growth.
The first is the regression-to-the-mean hypothesis. Suppose that for behavioral reasons a plant's productivity growth is inversely related to its initial level, so that
TFP - TFP- 3TFPI +E
where E is a random disturbance. The equation may be rewritten as
TFP (1 + r3)TFP-I + E = aTFP-I + ,
where a equals 1 + 3. The hypothesis is that P < 0, or that a < 1. Plants beneath the frontier have opportunities to catch up that are unavailable to "best practice" plants near the frontier; that is, maybe all plants that exhibit substandard levels of performance at the beginning of a period catch up, with or without changing owners.
The second potential explanation makes a weaker assumption about the evolution of TFP, but is based on the fact that plants that close were not included in our sample. Suppose TFP follows a random walk, that is, TFP - TFP_ I + E, so that (in the notation of the previous paragraph) a = 1. Also assume that if a plant's relative productivity declines below a certain threshold, it will close. Consider the plants that experience a given decline in productivity from one year to the next. The higher its initial productivity, the less likely the plant is to cross the threshold and therefore to close. Plants with low initial levels of productivity are more likely to be absent from the sample than plants with high initial levels. Even if productivity follows a random walk, censoring could account for the fact that plants with low initial productivity levels have higher average productivity growth. Regression toward the mean could account for this fact even in the absence of censoring.
Neither of these mechanisms, however, could account for the entire set of coefficients presented in table 5. In particular, they cannot explain why the relative productivity of plants that change owners does not rise-and indeed falls-between t - 7 and t, and rises only after t. Both the explanations sketched above would predict that relative productivity would increase beginning in t - 7. The fact that productivity begins to rise only after the ownership change occurs strongly suggests that it is the change in ownership that is largely responsible for the improvement. When initial productivity is included in the regression model, the
662 Brookings Paper-s on Economic Activity, 3:1987
estimated coefficients decline, but only slightly. Thus even after con- trolling for a possible regression-to-the-mean effect, we still found that ownership change led to improvements in economic efficiency.
Finally, initial productivity may also have been mismeasured, perhaps because of errors in the industry deflators used to calculate constant dollar values of output, capital, materials, and energy. Measurement error is also associated with the calculation of levels of TFP. However, in constructing estimates of TFP growth, we assumed that this measure- ment error was permanent.27 Thus the true model we attempt to estimate in column 4 of table 6 is of the form y = 3IX, + 32X2 + ti, where y is TFP growth, XI is an ownership change dummy variable (subsequent), X2 is "true" initial productivity, and u is a classical disturbance term. We do not observe X2, but rather an imperfect measure of initial productivity, Z2 = X2 + E, where E is a classical disturbance term. In addition, E (measurement error) is assumed to be uncorrelated with u, XI, and y. Zvi Griliches demonstrated that in the case of a regression model with two independent variables where only one is subject to measurement error, the bias in the point estimate of the variable that is measured incorrectly is transmitted to the other coefficient. He derived the following formula for the bias in PI: plim(@P - PI) = - p (bias P2),
where p is the correlation coefficient between XI and Z2.28 We have already presented evidence suggesting that an inverse relationship exists between initial productivity and subsequent ownership change (p < 0). Furthermore, it is well known that the ordinary least squares (OLS) estimate of 12 is biased toward zero.29 Thus the bias in 32 iS transmitted to 1I, and we expect the OLS estimate of PI also to be biased toward zero. An instrumental variables (IV) estimator was used to adjust for the bias inherent in OLS estimation of the models in columns 4, 5, and 6 of table 6. We experimented with many possible instruments for initial productivity, settling on productivity in 1973 (t -7) as the best in- strument. As expected, the point estimates of the ownership-change
27. TFP, = TFP* + i,, and TFP, 6 = TFP* 6 + q,-6, where the asterisk denotes the true unobserved level of TFP and q,, ?-6 are classical disturbance terms: ATFP = TFP, - TFP,t6 = TFP,* - TFP,* 6 + t - mr-6 = ZATFP* + t - '1t-6. If we assume that q, = r,-6 (permanent measurement error), then ATFP = ATFP*.
28. Zvi Griliches, "Economic Data Issues," in Zvi Griliches and Michael D. Intrili- gator, eds., Handbook of Econometrics, vol. 3 (North-Holland, 1986), pp. 1466-1514.
29. This follows from the classical error-in-variables model.
Frank R. Lichtenberg and Donald Siegel 663
dummies increased slightly, and their standard errors declined under two-stage least-squares estimation in columns 7, 8, and 9. Thus the efficiency-gain hypothesis associated with a matching theory of plant turnover was confirmed, even after adjusting for measurement error and a regression-to-the-mean effect.
The data are, then, consistent with the two key implications of the matching theory of ownership change-that the least productive plants are most likely to change owners and that ownership change tends to be associated with above-average increases in productivity. Computing differences in mean growth rates of outputs, inputs, and productivity in year t+ i (i = - 7, - 6, . . ., 6, 7) between plants changing owners in year t and plants not changing owners in year t provides additional insight into this phenomnenon. As before, all data are standardized by four-digit SIC industry, so these differences should be interpreted as pooled, within-industry differences .30 The differences and the associated t-statistics (for testing Ho: difference = 0) are presented in table 7. To clarify the interpretation of these nuumbers, consider the value - 1.1 in the fifth row (i = - 3) under "output." This value signifies that the mean rate of output growth in year t- 3 of firms that changed owners in year t was 1.1 percent lower than the corresponding mean output growth rate of year t nonchangers. In the "output" column the difference in growth rates is negative and generally increasing in magnitude from t - 4 through t, the year of ownership change, and is positive in years t + 1 and t + 3. All these differences are statistically significant. The mean growth rate of output of year t changers was lower in every year before t except t - 5 and t -7 (the average between t -3 and t - 1 was - 1.8 percent), and higher in every year between t + 1 and t + 3 (the average difference during this period was 1.4 percent). These differences show that change in ownership arrests and to some extent reverses the decline of a plant. Because the differences in output growth rates after ownership change are smaller than the differences before acquisition, the year t changers experienced a shrinking market share between years t - 3 and t + 3.
Consider next the differences in labor input growth rates. With one
30. The differences are the parameter estimates of 3 derived from regressions of the following form: In (X?, j/X,,i l) = oxi + iOC, (i = -7, -6, . . ., 6, 7). where OC, equals 1 if the plant changed owners between t - 1 and t and 0 otherwise. X refers to the specific variables considered in table 7. All of these growth rates were standardized by industry.
664 Brookings Papers otn Economic Activity, 3:1987
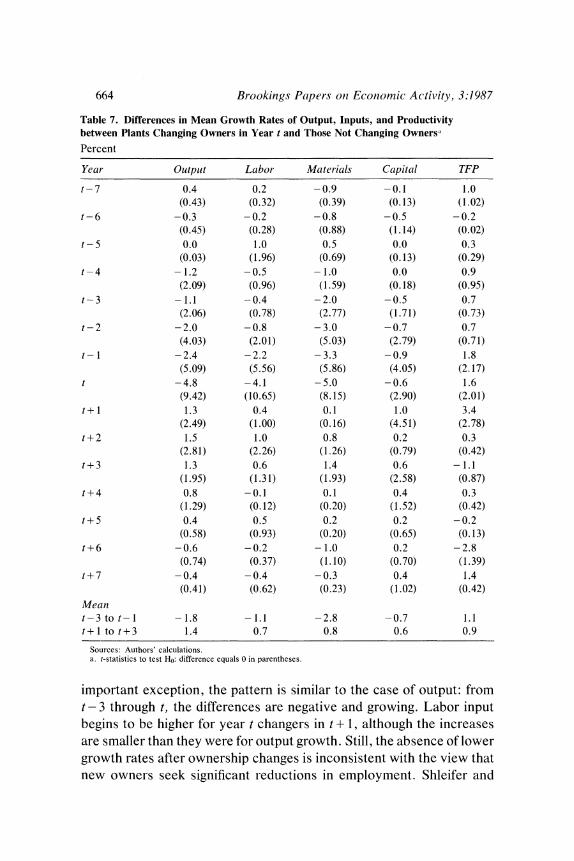
Table 7. Differences in Mean Growth Rates of Output, Inputs, and Productivity between Plants Changing Owners in Year t and Those Not Changing Ownersa
Percent
Year Output Labor Materials Capital TFP
t-7 0.4 0.2 -0.9 -0.1 1.0 (0.43) (0.32) (0.39) (0.13) (1.02)
t-6 -0.3 -0.2 -0.8 -0.5 -0.2 (0.45) (0.28) (0.88) (1.14) (0.02)
t - 5 0.0 1.0 0.5 0.0 0.3 (0.03) (1.96) (0.69) (0.13) (0.29)
t-4 - 1.2 -0.5 - 1.0 0.0 0.9 (2.09) (0.96) (1.59) (0.18) (0.95)
t-3 - 1.1 -0.4 -2.0 -0.5 0.7 (2.06) (0.78) (2.77) (1.71) (0.73)
t - 2 - 2.0 - 0.8 - 3.0 - 0.7 0.7 (4.03) (2.01) (5.03) (2.79) (0.71)
t- 1 -2.4 -2.2 -3.3 -0.9 1.8 (5.09) (5.56) (5.86) (4.05) (2.17)
t -4.8 -4.1 -5.0 -0.6 1.6 (9.42) (10.65) (8.15) (2.90) (2.01)
t+ 1 1.3 0.4 0.1 1.0 3.4 (2.49) (1.00) (0.16) (4.51) (2.78)
t + 2 1.5 1.0 0.8 0.2 0.3 (2.81) (2.26) (1.26) (0.79) (0.42)
t+3 1.3 0.6 1.4 0.6 - 1.1 (1.95) (1.31) (1.93) (2.58) (0.87)
t+4 0.8 -0.1 0.1 0.4 0.3 (1.29) (0.12) (0.20) (1.52) (0.42)
t + 5 0.4 0.5 0.2 0.2 - 0.2 (0.58) (0.93) (0.20) (0.65) (0.13)
t+6 -0.6 -0.2 - 1.0 0.2 -2.8 (0.74) (0.37) (1.10) (0.70) (1.39)
t+7 -0.4 -0.4 -0.3 0.4 1.4 (0.41) (0.62) (0.23) (1.02) (0.42)
Mean t-3 to t- 1 - 1.8 - 1.1 -2.8 -0.7 1.1 t+ I to t+3 1.4 0.7 0.8 0.6 0.9
Sources: Authors' calculations. a. t-statistics to test Ho: difference equals 0 in parentheses.
important exception, the pattern is similar to the case of output: from t- 3 through t, the differences are negative and growing. Labor input begins to be higher for year t changers in t + 1, although the increases are smaller than they were for output growth. Still, the absence of lower growth rates after ownership changes is inconsistent with the view that new owners seek significant reductions in employment. Shleifer and
Frank R. Lichtenberg and Donald Siegel 665
Summers suggest that a firm's long-term implicit contracts with workers and suppliers are breached in the course of a hostile takeover. Our analysis indicates that changes in ownership are more likely to stem employment reductions than trigger mass layoffs.3" The statistics for materials tell a similar story: dramatically slower growth in materials used and in capital before and during the ownership change, slightly higher growth afterward.
The differences in annual total factor productivity growth rates are inconsistent with the results reported earlier and with input and outputs. Plants that were sold had significantly higher TFP growth in years t - 1 through t + 1. We believe these results are implausible, because TFP growth is calculated as output growth minus a Divisia index of input growth, using plant-specific factor shares as weights. Short-term fluc- tuations in plant activities are such that factor shares and thus TFP growth rates are computed imprecisely.
Conclusions
Twenty-one percent of the plants in the sample, which are larger than average manufacturing establishments, experienced at least one change in corporate control between 1972 and 1981. Evidence pertaining to the determinants and effects of these transfers is consistent with the empir- ical implications of a matching theory of plant turnover. That is, a firm lacking a comparative advantage with respect to a given plant will sell it to another corporation, leading on average to an improvement in the plant's economic performance.
Our analysis of the factors influencing divestitures of plants found that low levels of efficiency increase the likelihood of ownership change. A probit regression of subsequent turnover on initial productivity and size revealed that industry laggards in 1973 were more likely to be sold in the following six years than plants that were efficient. The suitability of matches between plants and firms thus seems rationally evaluated by their owners. Low levels of productivity indicate that a plant and its owner are not suited for each other, and a termination of this relationship is imminent.
31. Shleifer and Summers, "Hostile Takeovers as Breaches of Trust." The abrogation of implicit contracts need not involve layoffs; work rules and other nonpecuniary aspects of labor relations may change instead.
666 Brookings Papers on Economic Activity, 3:1987
In the previous section, we presented prima facie evidence of improve- ment in the efficiency of manufacturing plants after changes in corporate ownership. In our framework, efficiency gains were defined as higher rates of TFP growth, or larger shifts in the production frontiers of establishments changing owners. Plants involved in ownership changes experienced, on average, 0.5 percent higher TFP growth between 1974 and 1980, a result driven by the 0.8 percent increase realized by plants changing hands during the first three years in the six-year period. Apparently, it takes several years for a new parent to have a significant influence on performance.
Results concerning differences in levels of productivity between sold and unsold plants (table 5) provide the most powerful evidence support- ing the hypothesis of increased efficiency. Sold plants exhibit both lower initial levels of productivity and a deterioration in relative performance through the year in which these acquisitions occur. But after changing owners, their improvement in performance reduces and eventually (after seven years) almost eliminates the productivity gap that existed between them and the control group before takeover. Truncation or censoring caused by our failure to observe plants that close cannot explain these patterns of relative performance, but it would be desirable to confirm this claim by analyzing uncensored data. This is a task for future research.32
The years covered in our analysis may explain the divergence of the findings from those of Ravenscraft and Scherer, who contended that mergers are bad for the economy.33 Using the Federal Trade Commis- sion's line-of-business data, they concluded that lines of business ac- quired during the 1960s and early 1970s were highly profitable before mergers but experienced declining profitability afterward. Given that the line-of-business sample consists mainly of large, diversified corpo- rations (approximately 470 firms), many of these transactions were
32. Addressing another aspect of sample selection bias, we contend that the over- representation of large plants in this sample may cause us to underestimate the improvement in performance associated with ownership change. While combinations of small plants and large firms are rarely challenged on efficiency grounds, the possibility that combinations of large plants and large firms lead to productivity gains is regarded with greater skepticism. Transactions of this type are prominent in the sample.
33. David J. Ravenscraft and F. M. Scherer, "The Profitability of Mergers," unpub- lished paper (1986); and Ravenscraft and Scherer, "Mergers and Managerial Peifor- mance. "

Frank R. Lichtenberg and Donald Siegel 667
conglomerate mergers and acquisitions. In a subsequent paper they observed that heightened merger activity in the 1960s led to massive divestitures in the 1970s, divestitures that were precipitated by steadily deteriorating profits.34 Observing 282 lines of business before and after divestiture (line-of-business data are available for 1974-77), they con- cluded that these units earned higher profits after joining new corpora- tions but that performance did not improve enough to allow them to earn normal rates of return. The results of that paper are generally consistent with our findings. However, Ravenscraft and Scherer would argue that changes in ownership in the 1970s generally yielded improvements in efficiency because most of the transactions involved spin-offs of previ- ously acquired and unrelated lines of business. According to this view a wave of unwarranted acquisitions in the 1960s led to disappointing performance and large numbers of sell-offs in the 1970s. We hope eventually to extend our sample through 1985; this would allow us to assess the impact of transactions occurring during the next lively phase of mergers and acquisitions activity.
Still, our findings concerning the determinants and effects of plant turnover imply that ownership change plays an important role in redeem- ing inefficient plants. In Exit, Voice, and Loyalty, Albert Hirschman argued that some agents in an economic system may experience lapses from efficient or rational behavior. If the system functions smoothly, forces exist that will rectify this inefficient activity: No matter how well a society's basic institutions are devised, failures of some actors to live up to the behavior which is expected of them are bound to occur, if only for all kinds of accidental reasons. Each society learns to live with a certain amount of such dysfunctional or misbehavior; but lest the misbehavior feed on itself and lead to general decay, society must be able to marshal from within itself forces which will make as many of the faltering actors as possible revert to the behavior required for its proper functioning.35
Our evidence is consistent with the view that ownership change or asset redeployment is an important mechanism for correcting lapses from inefficient producer behavior. The gains realized by both target and acquiring shareholders appear to be social gains, not merely private ones. We found no evidence that ownership change is usually accom- panied by the abrogation of implicit contracts with workers or suppliers.
34. Ravenscraft and Scherer, "Divisional Sell-Off." 35. Albert 0. Hirschman, Exit, Voice, and Loyalty: Responses to Declines in Firms,
Organizations, and States (Harvard University Press, 1970), p. 1.
668 Brookings Papers on Economic Activity, 3:1987
The often-cited productivity slowdown in the 1970s was reflected in our sample. The average TFP growth for all plants in the sample from 1974 to 1980 was -0.3 percent. Our evidence strongly suggested that this deterioration would have been more pronounced if ownership changes had not transpired. These results imply that policymakers should be extremely cautious when considering policies that would make ownership change more difficult or costly.
Our future work on this topic will attempt to study the nature of ownership changes that occur when plants are sold. For each transaction, we can identify the old and new parent companies. The LED file also contains information on each firm's operations in different industries in a given year. This information and the panel structure of the data will be used to identify different types of mergers, acquisitions, and divestitures. Economists and government officials are especially concerned with the effects of specific kinds of ownership change on efficiency. Analysis of distributions of efficiency gains by different methods of classifying such changes should broaden our understanding of mergers. In this regard, we will determine whether our findings are actually masking important differences in the pre- and postmerger performance of plants involved in the following types of transactions:
First and subsequent ownership change. Ownership change can be classified by whether it is the first, second, or so on transaction experi- enced by a given plant. Ravenscraft and Scherer's research suggested that, at least during the early 1970s, second ownership changes may have led to greater improvements in productivity than initial changes. If a firm acquires another entire firm, for example, it often purchases both desired and undesired lines of business. Therefore, spin-offs of previ- ously acquired units may result in efficiency gains while the original acquisition may not.
Full and partial acquisitions. Whether an ownership change was part of a complete or partial corporate acquisition can also be determined. One might expect restructuring to lead to greater improvements in efficiency than acquisitions of entire firms.
Horizontal and nonhorizontal mergers. We can identify whether a firm purchasing a plant is entering a new industry or merely augmenting its industrywide activities. Because of their expertise in given lines of business, firms engaging in horizontal mergers may experience larger gains in productivity.
Frank R. Lichtenberg and Donald Siegel 669
-Friendly and hostile takeovers. It may also be possible to distinguish between friendly and hostile ownership changes. Policymakers are especially concerned about the economic effects of hostile takeovers. Opponents of these battles for corporate control view them as unneces- sary, extravagant struggles that yield no social benefits. Further exami- nation of Shleifer and Summers's hypothesis that hostile takeovers lead to breaches of implicit contracts with workers and suppliers will be pursued.
We have attributed the improvement in economic performance when plants change owners to an improved match between owner and estab- lishment. In general, we believe these productivity gains result from more efficient management. However, we could not isolate the specific characteristics of new management, such as new technology or more effective leadership, that are directly responsible. Certainly a thorough analysis of management's contribution to better matches is vital.
From an analysis of case studies, Ravenscraft and Scherer reported that simplification of ownership structure improved the performance of lines of business.36 When lines were acquired through horizontal merger or were taken private by leveraged buyouts(or spin-offs), they generally experienced improved profitability. The authors attributed these results to reductions in company bureaucracy, renewed focus on more efficient operations, and other positive developments associated with their met- amorphosis into independent entities. We can determine the effects on productivity of simpler ownership structure by using the Census Bureau data. The LED file indicates whether an owner also owns other plants. We can therefore determine when a multiunit establishment becomes a single-unit establishment. Leveraged buyouts of entire divisions can be determined from external data sources, and the effects on individual manufacturing plants within these divisions can be observed.
Finally, in future analyses of the determinants of ownership change, hazard function models with covariates will be devised and estimated to use the richness of our panel data. In our framework a hazard function will measure the probability that divestiture occurs within a predictable interval, given that a plant has remained with the same parent corporation until the beginning of the interval. Although our paramount objective will be to estimate the regression parameters, we are also interested in
36. Ravenscraft and Scherer, "Mergers and Managerial Performance."
670 Brookings Papers on Economic Activity, 3:1987
the properties of the hazard function. That is, we can determine whether the conditional probability of divestiture is strictly increasing, constant, or strictly decreasing as time goes on.
Appendix
To construct estimates of total factor productivity growth at the plant level based on three factors of production, there must be estimates of real values of output, Q; capital, K; labor, L; materials, including energy, M; and factor shares. The LED file provides data on nominal values of output, VQ; capital, VK; labor, VL; materials, VM; and changes in inventories. The construction of real Q, K, L, and M requires deflators. These deflators were imported from three separate files. In this appendix, we document the sources of our data and the methodology used to calculate TFP growth.
SOURCES
Data used to construct TFP growth were imported from four computer files:
-The Longitudinal Establishment Data Time Series file contains current dollar figures on shipments, labor, materials (including energy), plant, equipment, and inventories for 20,493 establishments that were sampled continuously in the Annual Survey of Manufactures for 1972 to 1981. Each plant is assigned to a firm and to a four-digit SIC industry.
-The Bureau of Industrial Economics Output data base contains deflators for raw materials, work in process, finished goods inventories, and shipments at the four-digit SIC level for 1972-80. All deflators are normalized to 1 in 1972.
-The Bureau of Industrial Economics Capital Stocks data base includes data at the three- or four-digit SIC level for 1972-81 on the net stock of capital in constant 1972 dollars; the gross stock of capital in historical dollars; total capital expenditures and the fraction devoted to replacement investment; and investment deflators. These data were used to construct plant-level, time-series estimates of the net stock of capital.
-The National Bureau of Economic Research R&D and Productivity
Frank R. Lichtenberg and Donald Siegel 671
project file provides materials and energy deflators at the four-digit SIC level.
METHODOLOGY
With current dollar values of output and inputs, and deflators for 1972-80 at the three- or four-digit SIC level, we have defined our nominal and real variables in the following manner.
Output in current dollars is defined as the value of shipments, TVS, with adjustments for the net annual change in finished goods, FGI, and work-in-process, WIPI, inventories:
VQ= TVS + (endFGI - begFGI) + (endWIPI - begWIPI),
where a V appearing before Q, K, L, or M refers to a nominal value. Real output is computed by dividing each term on the right-hand side of the equation by its corresponding industry price deflator, D:
Q = DTVS + (DendFGI - DbegFGI) + (DendWIPI - DbegWIPI).
Labor input in current dollars is measured as the sum of salaries and wages, SW, and total supplemental labor costs, TSLC: VL = SW + TSLC. Real labor input is defined as the ratio of total salaries and wages, TSW, to production worker wages, PWW, multiplied by total production worker hours, PWH: L = (TSW/PWW) x PWH. Thus labor deflators are not required, and both nominal and real labor inputs can be con- structed completely from LED file variables.
Nominal capital is constructed assuming constant returns to scale. Current dollar capital is defined as current dollar output minus the current dollar costs of materials including energy, CM, and labor, plus an adjustment for the net change in materials inventories, MATI:
VK= VQ - [CM - (endMATI - begMATJ)] - VL.
We constructed plant-level, time series estimates of the net stock of plant and equipment in constant dollars by combining plant-level data on the book value of capital and on nominal capital expenditures with industry-level data taken from the Bureau of Industrial Economics Capital Stocks data base.
672 Brookings Paper-s on Economlic Activity, 3:1987
Values of Kij,, were generated by the following algorithm. First, we computed a benchmark 1972 estimate of a plant's net stock of capital,
J,72 =GBVi,J,72 X NSTKCNj,721GSTKHISj,72,
where GBViJ72 is the gross book value of the plant's assets in 1972, NSTKCONj,72 is the net stock in constant dollars of industry j's assets in 1972, and GSTKHISj 72 is the gross stock in current dollars of industry j's assets in 1972. GBV is the only measure of assets in the LED file, but this is a gross capital, current dollar measure, and we wished to obtain a net capital, constant dollar measure.
Values of Ki,X ,(t = 1973, . . . , 1981) were generated by the recursive perpetual inventory formula:
Kij,t = Kij,t_ I X (1-DEPRECjt) + (CAPEXPij,t1IDEFj,t),
whereDEPRECj, is an estimate of the average rate of capital depreciation in industryj in year t, computed as the ratio of replacement investment in industryj in year t to the net stock of capital in industryj at the end of year t - 1, both in current dollars; CAPEXPiJ, is capital expenditures of plant i in industry j in year t; and IDEFj,t is the capital expenditure deflator for industry] in year t. Since values of all the necessary variables were available separately for plant and equipment, this procedure was performed separately on each category of assets. The resulting series were then added together.
Current dollar values of materials, including energy, are defined as cost of materials taken from the LED file plus an adjustment for the net change in materials inventories: VM = CM - (endMATI - begMATI). Constant dollar values of materials were evaluated by dividing current dollar values by the NBER four-digit SIC price deflators for materials and energy: m = VMIPM. We also computed factor shares, which were used in constructing TFP:
SM = VM/VQ; SL = VL/VQ; and SK = VK/VA.
Using the methodology employed in Zvi Griliches and Frank R. Lichtenberg37 and in many other studies, we calculated a Tornqvist index of three inputs:
37. Zvi Griliches and Frank R. Lichtenberg, "R&D and Productivity Growth at the Industry Level: Is There Still a Relationship'?" in Zvi Griliches, ed., R&D, Patenlts, anld Productivity (University of Chicago Press for National Bureau of Economic Research, 1984), pp. 465-96.
Frcank R. Lichtenberg and Dontald Siegel 673
In (INt) 0.5 (SLt + SLt_6) X In i L
+ 0.5 (SK, + SKt6) x In (Kt)
+ 0.5 (SMt + SMt_6) x In (MI )
1 [O.5*(Sit + Si,-6)] In
where IN, is the index of total input at time t, Sit is the share of factor i in the total cost of output at time t, factors i = K, L, M, and Xit is the quantity of factor i at time t in real terms.
Comments and Discussion
Dale Jorgenson: I would like to begin by expressing my admiration of the authors. The Longitudinal Establishment Data (LED) set will ulti- mately transform research on productivity, especially at the microeco- nomic level, and not only there. It will take many person-decades of work before these data have been exhaustively explored.
Fortunately, we have the benefit of ten years' experience with somewhat less rich data sets for regulated industries. Not until recently, however, have methods and modeling techniques been developed that can deal with the complexities that arise with a sample of hundreds of firms, like those in such regulated industries as electric generating or transportation or communications. But because the LED are an order of magnitude more complex, it would be inappropriate to have exces- sively sanguine expectations about when there will be any major reve- lations based on them. Still, the authors have made an admirable beginning.
Mergers and acquisitions have a cycle somewhat longer than the business cycle, but nonetheless there is a clear cycle. At the moment it has probably reached a peak. Maybe there will be fewer mergers and acquisitions, but certainly the last four or five years have witnessed a tremendous amount of activity. Table 1 in the paper shows a clear surge that began in 1981 and seems to have reached a frenzy in 1986. I do not know what the near future will bring, but activity will fall somewhat. Unfortunately 1981 is the last year for which the authors have data, so we will have to wait until the additional years have been added to the data set to examine this surge in activity.
Neoclassical economics has always had difficulty coping with mergers and acquisitions. First of all, if one takes the most naive view, they are uninteresting because they occur for reasons that economists do not need to investigate. A more sophisticated view would be that differences
674
Frank R. Lichtenberg and Donald Siegel 675
in information obtain for different participants. Finally, one can analyze the activity in theoretical terms, without looking at it empirically at all. Obviously, people who have the more sanguine view of a particular economic enterprise-a firm, a plant, or whatever-will be able to pay more for it. They will bid it away from the people who have the less sanguine expectations, and they are not always going to be wrong.
By and large, such activities should result in improved economic performance. But in the literature on mergers and acquisitions, that is not the only result. There are in fact two kinds of results. Some studies make it obvious that people will take over or purchase a plant and will benefit from this ownership change. Other studies show something else going on, activities in which stockholders or others lose or people make mistakes. This paper is, obviously, in the former category, analyzing ownership changes that improve economic performance. The theoretical position of the authors might better be represented by a medical analogy than a labor market analogy. Plants, they argue, are like patients who get sick. Their performance deteriorates and they look for a physician. Some physicians (managers) are available within the firm itself, and they can be sent to deal with the problems; but they do not always succeed and may have to refer the patient to another manager. Plants thus keep looking until they find somebody who can make them well. Or they die. But as the authors note, the plants that did not survive are not included in the sample. So we only have those that got well.
The idea that a plant's deteriorating economic performance can be followed by a change of regime and an improvement in economic performance is well substantiated in the paper. It is an inspiring example of what one can get from the Longitudinal Establishment Data set, and the authors are to be complimented in their choice of an appropriate level of econometric sophistication.
The best results in the paper come from the simple exhibition of the data. Table 2, for example, underscores the point that the LED exclude small plants, which are more labor-intensive, and new plants and plant closings. This constitutes an important handicap but one that cannot be dealt with very effectively here.
Table 3 suggests that more ownership changes are associated with small plants, a suggestion that encourages speculation, but nothing more, about what would have happened if the study had been done for some of these small plants. So, obviously, from a methodological point of view
676 Brookings Papers on Economic Activity, 3:1987
the first priority is to find some way of dealing with this sample selection problem. Another conclusion I would draw from table 3 is that the assumption of constant returns to scale, which is made in all the productivity studies, is absolutely critical. The authors explicitly indicate that there is some support for the assumption, but it needs more corroborative testing to give it the backing necessary to substantiate their results.
The authors also show that ownership change has increased from 3 percent of plants in 1974 to 4 percent in 1981. Among the plants that changed ownership, more than half experienced more than one change between 1974 and 1980 (table 4). Here the medical analogy breaks down; many plants do not get well. Of all these sick patients, many first consulted a physician, found him unable to cure them, and went on to a second one.
Table 5 shows that the plants that changed ownership are associated with low initial productivity, small size, or low initial employment. Table 6, which begins to present the authors' results, shows that more than one ownership change is associated with higher initial productivity than is a single ownership change. In other words, the plants that changed hands more than once were, in some sense, healthier to begin with. Now, a footnote indicates that this difference is not significant, but it does deserve fuller exploration.
Table 7 constitutes the heart of the empirical findings. Sick plants, it shows, get well, provided that they change owners. But in fact this is subject to some question: the sample involved here follows these plants from year seven before the year of initial change to year seven after the change. This is a constantly evolving sample. The plants in the sample changed ownership between 1973 and 1974. They thus represent only one year's data. If a different year is chosen-1972, say-one gets a different sample. This suggests that it is worth looking very carefully at the sample associated with each of these different findings. It could be just the evolution of the sample in some way. An observation that I will allude to later suggests something like this might be going on.
The authors note that an ownership change occurring late in the sample period has an insignificant effect in improving performance and that more than one ownership change has less effect than a single ownership change. Why? There does not seem to be very much of an explanation.
The authors test the hypothesis that there is simple regression toward
Fr-ank R. Lichtenberg and Donald Siegel 677
the mean and conclude that cannot explain their results. They also test for errors and variables in the measurement of productivity, finding that bias is present and that it can to some extent be counteracted by using instrumental variables techniques.
As one looks at total factor productivity in table 7 one sees differences in mean growth rates of output, input, and productivity between the changers and the nonchangers. (Keep in mind that the changers represent about 20 percent of the sample.) Interestingly, the so-called sick plants- those that changed ownership-were getting well before the ownership change. In fact, they had about a half a per-centage point higher growth rate than the firms that did not change.
A macroeconomist of the Chicago school would have no problem with this at all. Plant managers could see ownership change approaching and were ready. They began shaping up so that when the new owners arrived, they would be able to retain their amenities and perquisites. After the ownership change, as table 7 shows, there is indeed some increase in annual productivity growth, at least for the first few years, and that does help close the gap. After four years or so, however, a relapse sets in. Then, in the seventh year, total factor productivity grows again. I do not take the numbers from years four through seven seriously. The authors obviously do not either. But the results for the years before the ownership change do seem to throw some cool, if not cold, water on the interpretation of the matching hypothesis.
Early in the paper the authors state that "ownership change is primarily a mechanism for correcting lapses of efficiency. Most acqui- sitions are precipitated by a deterioration in the target firm's economic performance. Deteriorating productivity provides an important signal to a plant's owner that for some reason he is operating in a less efficient manner than an alternative parent could." Well, whatever is going on in the data, it is not that these plants have experienced a deterioration, at least as measured by changes in total factor productivity, in their economic performance. Quite the contrary, they seem to have experi- enced a resurgence, albeit from a low initial level of economic perform- ance. And that resurgence continues until the time the change in ownership occurs.
After the change, productivity accelerates for about three years and then drops. Rather than a signal that should lead to a maddening search for help, something else is going on.

678 Brookings Paper-s on Econonmic Activity, 3:1987
My conclusion is not that there is some basic deficiency in the study. It presents extremely interesting empirical results that will stimulate all of us to look for ways to cope with classic problems of the response of economic performance to change in work rules or ownership or other situations. Exploitation of the LED set is an enterprise that deserves our wholehearted support.
Edwin Mansfield: In this interesting paper, Frank Lichtenberg and Donald Siegel show that, for plants in the Census Bureau's Longitudinal Establishment Data file that survive from 1974 to 1980, the mean annual rate of productivity increase was higher for plants that changed owners than for those that did not. They also show that plants with relatively low initial (1973) productivity levels were more likely to be sold at least once between 1974 and 1980. They conclude that "Evidence pertaining to the determinants and effects of these transfers is consistent with the empirical implications of a matching theory of plant turnover. That is, a firm lacking a comparative advantage with respect to a given plant will sell it to another corporation, leading on average to an improvement in the plant's economic performance."
To begin with, one should note some possible biases in the authors' results because of their omission of plants that close. According to census data, in a five-year period about 30 percent of all plants close. The probability is particularly high among small and young plants. ' Of course, one reason plants close is that their productivity is too low to remain competitive. If this is a very important reason, the authors' finding that the mean annual rate of productivity increase was higher for sold than for unsold plants may be due in part to such a bias. Since, as the authors demonstrate, the level of productivity at the beginning of the period tends to be lower for plants that were sold than for those that were not sold, a plant that was sold would be more likely to go out of business if its productivity fell by a substantial percentage than would a plant that was not sold. Consequently, even if the probability distribution of the rate of productivity change each year were the same for sold and unsold plants (when all plants, not just survivors, are included), the average productivity increase would tend to be higher among sold than
1. Timothy Dunne, Mark J. Roberts, and Larry W. Samuelson, "The Impact of Plant Failure on Employment Growth in the U.S. Manufacturing Sector," unpublished paper (Pennsylvania State University, 1987).
Frank R. Lichtenberg and Donald Siegel 679
unsold surviving plants because, relative to all unsold plants, a larger proportion of all sold plants with significant percentage declines in productivity would close.
In columns 4 through 6 of table 6 the authors show that a plant's rate of productivity increase is inversely related to its initial level of produc- tivity. As I indicated, this relationship may be due to biases resulting from the exclusion of plants that closed. The lower a plant's initial productivity level, the higher the probability that a significant decline in productivity will put it out of business. Thus the likelihood that plants with serious percentage decreases in productivity will be excluded from the analysis tends to be inversely related to their initial productivity level.
Even when the authors hold constant a plant's initial productivity level, as they do in table 6, there is no assurance that the observed difference between sold and unsold plants is not due in part to such biases. Whether the biases exist is impossible to say, based on the authors' paper, and it may be hard to obtain the data necessary to estimate their size because of difficulties in obtaining information on productivity changes among plants that have closed. Obviously, it would be worthwhile for the authors to do what they can to estimate these biases, even very roughly, since they bear directly on their central conclusion that "ownership change plays an important role in redeeming inefficient plants."
Turning to the matching theory of plant turnover, it is hard to square the theory with the authors' statistical results in table 7. According to them, a low level of productivity indicates a poor match and induces ownership change. Yet in table 7 it appears that plants sold in year t enjoyed a higher average rate of productivity increase than the unsold plants in the previous five years.2 Why then were the plants not sold five years before, when their productivity levels were lower relative to unsold plants than in year t? Part of the answer may lie in the lower rates of output growth of the sold plants between time t - 5 and time t, but this suggests that the authors may have to include more variables than
2. While only one of these five figures is statistically significant, the probability that all five would be positive, given that there was no difference between sold and unsold plants in the average rate of productivity increase, would seem to be small. Certainly, there is no evidence that the average rate of productivity increase during this five-year period was lower among sold plants than among those unsold.
680 Br-ookings Papers oni Economnic Activity, 3:1987
productivity alone to explain plant turnover and to estimate the effects of productivity on plant turnover.
Throughout the paper the authors stress the relevance of their results for evaluating mergers and acquisitions. While their results are relevant to this important topic, many of the effects of a merger or acquisition may also show up in the nature and range of a firm's products, in the plants it operates and the ones it closes down, in the allocation of work among plants (domestic and foreign), and in a host of financial, marketing, R&D, and other matters that are reflected incompletely in the authors' data.
There is thus a great opportunity for additional analysis of the reasons for the apparent increase in efficiency due to new management. As an illustration, consider the proposition put forth by some observers that American firms in recent years have tended to down-size plants and locate high-cost manufacturing activities abroad. To what extent is the apparently higher productivity due to a change in the range of manufac- turing activities carried out by the plants that were sold? For example, to what extent is the higher efficiency due simply to their transferring certain activities to areas with lower wages rather than increasing the efficiency of the activities currently or previously being carried out? It would be useful to know the extent to which the apparently higher productivity was due not to improved methods but to a change in product and process mix resulting from the transfer of operations overseas.3
To explore these and other questions, the authors might carry out their analysis at a more disaggregated level. Given that their sample consists of more than 20,000 plants, they have the opportunity to analyze perhaps twenty major industries separately. One would expect the results to differ from industry to industry, and these differences should provide valuable clues concerning the reasons for the apparent increase in efficiency from new management. It would also be interesting to stratify the sample by firm size and to carry out the statistical analysis separately for large and small plants. This might allow rough judgments on the nature and size of the biases resulting from the fact that the plants in this sample are ten to twelve times as large (in terms of employment and output) as the typical manufacturing plant. Given this disparity in plant
3. Such changes in activities and product and process mix can readily occur without changing a plant's four-digit SIC code.
Frank R. Lichtenberg and Donald Siegel 681
size, the reader may not wish to generalize from the authors' results. However, if it can be shown that there is little difference between results based on only the larger firms in the sample and those based on only the smaller ones, the reader may feel less uneasy.
Further, it would be interesting to relate the size of the apparent increase in productivity due to new management to the nationality of the buyer and the seller. There are, of course, many stories concerning the success of Japanese firms in turning around foreign plants.4 For example, Mitsubishi Corporation acquired an auto assembly plant in Adelaide, Australia, in the late 1970s from Chrysler Corporation, which had been operating it at a loss. Mitsubishi promoted greater interaction of man- agers and workers, eliminated several layers of the organization, installed ajust-in-time production system, and adopted a variety of other organi- zational changes. By 1981, according to a McKinsey study, productivity increased 115 percent, the number of assembly hours per car fell by almost 60 percent, and market share increased from 9 to 13 percent.5 If the authors can identify the nationality of the buyers and sellers, they may be able to shed new light on whether and to what extent Japanese and other foreign firms have been more successful than Americans in raising the productivity of the U.S. plants they buy.
Lichtenberg and Siegel have produced an interesting paper. There is, as always, room for a more detailed and disaggregated analysis of the data they use, and it would be helpful if data could be obtained for plants that closed, but the paper as it stands is a significant contribution to an important area of research.
4. For some discussion of foreign direct investment and technology transfer, see Edwin Mansfield and others, Technology Transfer, Productivity, and Economic Policy (Norton, 1982). For some recent studies comparing the innovation and diffusion processes in Japan and the United States, see Mansfield, "Industrial R&D in Japan and the United States: A Comparative Study," Amesrican Economnic Review (May 1988); Mansfield, "The Speed and Cost of Industrial Innovation in Japan and the United States: External vs. Internal Technology," Management Science (forthcoming); Mansfield, "The Diffusion of Industrial Robots in Japan and the United States," unpublished paper (Center for Economics and Technology, University of Pennsylvania, 1987); Mansfield, "Technolog- ical Change in Robotics: Japan and the United States," Manager-ial and Decision Economics (forthcoming); and "Firm Growth, Innovation, and R&D in Robotics: Japan and the United States," Symposium on Research and Development, Industrial Change, and Public Policy (University of Karlstad, Sweden, 1987).
5. Steven C. Wheelwright, "Restoring the Competitive Edge in U.S. Manufacturing," in David J. Teece, ed., The Competitive Challenge: Strategies for Industrial Innovation and Renew,al (Ballinger, 1987).
682 Brookiings Papers on Economic Activity, 3:1987
General Discussion
A number of participants expressed concerned that the authors' findings might be a result of a sampling bias, in that the sample did not include plants that were closed before the end of the sample period. Joseph Stiglitz suggested, for example, that an alternative explanation of the authors' results might be that productivity changes are a random walk. When productivity was falling or low, the frequency of changes in ownership increased. If productivity continued to fall after a change, the plant dropped from the sample because it shut down, whereas if produc- tivity stayed the same or rose, the plant stayed in the sample. The results, which are conditional on the plant's staying in the sample, would then show an average improvement in productivity for firms that experienced a change of ownership, but management would not be causing this improvement.
The authors did not know what proportion of plants closed down during the sampling interval, though they noted that, in general, the failure rate for large plants was very low, and that their sample was dominated by large plants.
Participants were also very interested in the significance of multiple changes in ownership. F. M. Scherer noted that his own work with David Ravenscraft indicated that it is important to distinguish among three types of ownership changes-original voluntary mergers, sell-offs of parts of firms, and involuntary mergers or takeovers. Voluntary mergers, he said, tended to be preceded by rising profit performance and, perhaps, peak performance at the time of ownership change, and then declining performance. Sell-offs tended to be preceded by declining performance before the change and rising performance afterward. He proposed that those plants in the sample that experienced multiple ownership changes might have experienced mergers that went bad quickly.
The authors pointed out that in 95 percent of cases of two ownership changes both changes took place within a single year. They conceded that this could have been an artifact of the way ownership changes were coded in the data. Or, as Paul Joskow suggested, it could indicate that such multiple ownership changes were part of a corporate restructuring
Frank R. Lichtenberg and Don ald Siegel 683
process in which the parent firm was acquired as a package and the parts that did not fit the new parent company's business strategy were profnptly sold off. The authors' matching model would be inappropriate in these cases.
Joskow also pointed out that the Longitudinal Establishment Data are not always clear as to what is meant by a change in ownership. If one firm acquired another but treated it as an independent, wholly owned subsidiary, that might not be counted as a change of ownership. How- ever, if a firm spun off a line of business and capitalized it separately, turning it into a wholly owned subsidiary, that would probably count as a change of ownership.
A number of participants were puzzled by the results reported in tables 5 and 7. Table 5 shows that the level of total factor productivity for plants that change owners falls relative to industry averages in the years before the change, then rises afterward. Table 7 shows that the growth rates of total factor productivity tend to be above average for their industry before the change, and then possibly to decline afterward. Ariel Pakes noted that the two measures were computed differently, and that these differences might lead to disparate results.
Frank Lichtenberg asked if anyone could offer an explanation for why market shares of plants would decline before a change in ownership. Richard Schmalensee argued that the other results of table 7 might shed some light on this problem. The table shows that new investment slows down just before an ownership change, suggesting that the plants may have been reasonably efficient technically but were producing the wrong products or products that the owner did not know how to design, sell, or distribute well. Then the matching process would have to do with new owners coming in who could put the assets to slightly different uses or handle the output better.
Peter Reiss also expressed interest in what it is that new owners do. He suggested that there may be information in the evidence on the changing composition of inputs that could shed light on this question. Moreover, the authors have data on wages and salaries that could provide evidence on the question of whether ownership changes lead to the abrogation of certain contracts. Reiss also suggested that it would be informative for the authors to compare the performance of plants that change owners and other plants whose productivity is low but that do not change owners.