Production4/Annual Report/19010082-Zall-AR(e)/00 Cover...
205
Transcript of Production4/Annual Report/19010082-Zall-AR(e)/00 Cover...
Production4/Annual Report/19010082-Zall-AR(e)/00 Cover/Zall AR18 Full Cover-23mm.ai

AboutZall Smart Commerce
Group Ltd.The Group is the leading developer and operator o f l a rge-sca le , consumer product focused wholesale shopping malls, as well as commercial space provider, in the PRC. The Group also constructs and operates B2B trading platforms for consumer goods, agricultural products, chemicals, plastic raw materials, black and non-ferrous metals, etc., and provides services such as finance, property, logistics, cross-border trading, and supply chain management based on the trading scenario and transaction data.
2 Corporate Information
4 Financial Highlights
5 Chairman’s Statement
10 Management Discussion and Analysis
22 Biographical Details of Directors and Senior Management
26 Report of the Directors
42 Corporate Governance Report
54 Independent Auditor’s Report
63 Consolidated Statement of Profit or Loss
64 Consolidated Statement of Profit or Loss and Other Comprehensive Income
65 Consolidated Statement of Financial Position
67 Consolidated Statement of Changes in Equity
69 Consolidated Cash Flow Statement
71 Notes to the Financial Statements
201 Major Properties Information
204 Financial Summary
Contents

Zall Smart Commerce Group Ltd. Annual Report 20182
Corporate Information
DIRECTORS
Executive Directors Mr. Yan Zhi (Co-Chairman and Co-Chief Executive Officer) (re-designated as Co-Chief Executive Officer on 6 July 2018) Dr. Gang Yu (Co-Chairman) Mr. Wei Zhe, David Mr. Qi Zhiping (Co-Chief Executive Officer) (appointed on 6 July 2018) Mr. Cui Jinfeng Mr. Peng Chi (resigned on 6 July 2018)
Independent Non-Executive Directors Mr. Cheung Ka Fai Mr. Wu Ying Mr. Zhu Zhengfu
Registered Office Cricket Square Hutchins Drive P. O. Box 2681 Grand Cayman KY1-1111 Cayman Islands
Head Office in the PRC Zall Plaza No. 1 Enterprise Community 1 Chutian Avenue Panlongcheng Economics and Technology Development Zone Wuhan, Hubei Province China 430000
Principal Place of Business in Hong Kong Suite 2101, 21/F Two Exchange Square Central Hong Kong
Audit Committee Mr. Cheung Ka Fai (Chairman) Mr. Wu Ying Mr. Zhu Zhengfu
Nomination Committee Mr. Wu Ying (Chairman) Mr. Yan Zhi Mr. Cheung Ka Fai

3Annual Report 2018 Zall Smart Commerce Group Ltd.
Corporate Information
Remuneration Committee Mr. Zhu Zhengfu (Chairman) Mr. Qi Zhiping (appointed on 6 July 2018) Mr. Peng Chi (resigned on 6 July 2018) Mr. Wu Ying
Risk Management Committee Mr. Zhu Zhengfu (Chairman) Mr. Cui Jinfeng Mr. Cheung Ka Fai
Company Secretary Ms. Foo Man Yee, Carina (appointed on 31 July 2018) Mr. Lung Shei Kei (resigned on 31 July 2018)
Company Website http://www.zallcn.com/
Authorized Representatives Mr. Cui Jinfeng Ms. Foo Man Yee, Carina (appointed on 31 July 2018) Mr. Lung Shei Kei (resigned on 31 July 2018)
Hong Kong Share Registrar Tricor Investor Services Limited Level 22 Hopewell Centre 183 Queen’s Road East Hong Kong
Principal Share Registrar and Transfer Office SMP Partners (Cayman) Limited 3rd Floor, Royal Bank House 24 Shedden Road P.O. Box 1586 Grand Cayman KY1-1110 Cayman Islands
Legal Advisor P.C. Woo & Co. Sidley Austin
Auditors KPMG Certified Public Accountants
Principal Bankers China Construction Bank China Mingsheng Banking Corp., Ltd. Industrial and Commercial Bank of China China CITIC Bank

Zall Smart Commerce Group Ltd. Annual Report 20184
Financial Highlights
2018 2017 RMB’000 RMB’000
Revenue 56,116,072 22,249,176Gross profit 1,559,600 1,012,255Gross profit margin 2.8% 4.5%Profit for the year 1,273,907 2,356,482
Earnings per share – Basic (RMB cents) 11.76 21.23– Diluted (RMB cents) 11.75 21.23
Total non-current assets 28,820,778 23,939,482Total current assets 24,260,340 23,404,146
Total assets 53,081,118 47,343,628
Total non-current liabilities 9,817,742 9,275,286Total current liabilities 23,654,563 19,407,455
Total liabilities 33,472,305 28,682,741
Net assets 19,608,813 18,660,887

5Annual Report 2018 Zall Smart Commerce Group Ltd.
Chairman’s Statement
Dear Shareholders,
On behalf of the board (the “Board”) of directors (the “Directors”) of Zall Smart Commerce Group Ltd. (“Zall”, “Zall Smart Commerce” or “the Company”), I am pleased to present the annual report of the Company and its subsidiaries (together, the “Group”) for the year ended 31 December 2018.
EMPOWERING SMES THROUGH TECHNOLOGY AND LEADING THE DEVELOPMENT OF INDUSTRIAL INTERNET
There are over 110 million business entities in China, creating a huge consumption market for the means of production. Unlike the fully developed Internet-based consumer market, there are still many longstanding problems in the circulation of the means of production in China, such as information asymmetry, high circulation cost, low trade efficiency and lacking an environment for the use of credit, which lead to allocation mismatch and waste of resources and internetization of transaction of the means of production is still in its initial stage. The development of Internet technology has gradually promoted the evolution and upgrading of modern supply chain, especially with the emergence of a new round of technology trends, such as big data, Internet of Things, digital currency, block chain, etc., enterprises are empowered through technology and the industrial Internet for achieving “quality improvement and efficiency enhancement” and “burden alleviation and cost reduction” is now opened to significant development opportunities.
Through the practical exploration of Zall’s intelligent trading ecosphere, we believe that a large number of new technologies such as Internet of Things, block chain, artificial intelligence, big data, etc., will drive B2B into a higher stage of development, and bring forth transformative characteristics for the industrial Internet: the complete integration of logistics, information flow and capital flow, and automation aided decision-making gives birth to epoch-making trade efficiency; the application of technology will establish a consensus mechanism with high reliability and the new credit system established through application of technologies will ensure the authenticity, safety and efficiency of trade. Intelligent and data-based trade will facilitate the globalization and convenience of trade. At the same time, with the development of B2B, an intelligent supply chain ecosystem will be built to promote the establishment of clear and effective data support for the intelligentization of industries.
The new trading pattern will comprehensively improve supply efficiency, promote the huge consumption market of the means of production in China to initiate and connect to Internet Plus and Intelligence Plus, and contribute to the transformation and upgrading of the industrial chain.
Zall Smart Commerce closely follows the development trend of the Internet, and has established a unique intelligent trading ecosphere that integrates online and offline channels, trading and services. At the same time, it has grasped the opportunity of a new generation of technological changes to promote the application of advanced technology in different transaction scenarios, create the modern supply chain with intelligent technology, innovate service modes, expand service scopes, and strive to reduce transaction costs for SMEs and improve the transaction efficiency for various industries.

Zall Smart Commerce Group Ltd. Annual Report 20186
Chairman’s Statement
In 2018, Zall Smart Commerce continued to enrich its platform and achieved steady growth in performance through mutual empowerment and coordinated development. The Group made breakthroughs in its globalization process, with rapid development of its international business such as commodity trade. Continuous efforts made in research and development and application of new technologies and the solid technology foundation strengthened the core competitiveness of the Group for the exploration of new development opportunities. Zall Smart Commerce led the development of industrial Internet and strode forward to become a leading open and intelligent B2B trading and service institution in the world.
I. DEEPLY INTEGRATING VARIOUS PLATFORMS TO ACHIEVE COORDINATED DEVELOPMENT OF THE TRADING ECOSPHERE
Through the development of online and offline integration and advancement of internetization in the past three years, the Group has successfully transformed and upgraded into an operator of industrial Internet trading ecosphere. Following the integration of LightInTheBox Holding Co., Ltd. (“LightInTheBox”) (a leading cross-border e-commerce platform), Shenzhen Sinoagri E-commence Co., Ltd.* (深圳市中農網有限公司) (“Shenzhen Sinoagri”) (an agricultural products e-commerce platform) and HSH International Inc. (“HSH”) (a chemical and plastic raw materials e-commerce platform) into Zall’s trading ecosphere, the Group established Shanghai Zall Steel E-commerce Co., Ltd. (上海卓鋼鏈電子商務有限公司) (“Zall Steel”) with Xiben New Line in March 2018 and together with its subsidiaries acquired 22% of equity interest of Ningbo Haishangxian Information Technology Co., Ltd. (寧波海上鮮信息技術有限公司) (“Haishangxian”) in April 2018, forming a B2B trading platform matrix covering daily consumer goods, agricultural products, chemicals, iron and steel, fresh food, etc.. Committed to the idea of “Connecting global business intelligently”, we have officially changed the company name to “Zall Smart Commerce” in May 2018 as a demonstration of our decision to change and strengthen our positioning.
In 2018, following the deep integration and mutual empowerment of various platforms within the ecosphere of the Group, the business scale and the number of customers increased significantly benefited from the synergy effect. Shenzhen Sinoagri actively expanded its new business and has made significant breakthroughs in the entire service process of supply chain of new types of dried fruits and vegetables. With the gradual development of overseas export business, its brand value has gained market recognition, further consolidating its leading position in the vertical e-commerce field. HSH, with focus on its main varieties and developed high-quality suppliers, had its market share gradually increased. The Group started strategic cooperation with Z-bank to expand various B2B platforms’ business scale. And relying on the Group’s ecosphere resources to expand its business scope, Zall Steel gradually enhanced its position in the black commodity industry.
With physical entities as the cornerstone and support and trading platform as the core, the comprehensive cross-category supply chain service platforms of Zall Financial Services Group Limited (“Zall Jinfu”) (卓爾金服), Zall Cloud Warehouse (卓爾雲倉) and Zallsoon (卓集送) established by the Group develop in a coordinated manner and operate smoothly, which will continuously provide convenient, safe, efficient and intelligent financial, warehousing and logistics services for various platforms within the ecosphere and get connected to the entire B2B trading ecosphere system of Zall. At the same time, it further strengthens the loyalty of customers for its platform services and obtains indepth service opportunities through transaction scenarios, thus realizing the commercial value of the ecosphere.
In 2018, the supply chain financial platform “Zall Jinfu” initially established a complete risk control system of “credit factory” for enterprises within the ecosphere, improved the risk control system of the Group, optimized the comprehensive connection to the process of loan approval, lending and post-lending processes, and ensured the stable operation of the Group. During the year, Zall Jinfu has completed financial loan transactions of approximately RMB1.733 billion for upstream and downstream enterprises in the supply chain. The intelligent warehouse platform “Zall Cloud Warehouse” gradually completed connection with various platforms and with warehouses in over 40 cities in China, covering a total warehousing area of over 12 million square meters and weight of goods of approximately 1.06 million tonnes. The logistics delivery platform “Zallsoon” which focuses on platform customers and increased its foothold in various fields with accumulated total orders exceeding 67 million in 2018.

7Annual Report 2018 Zall Smart Commerce Group Ltd.
Chairman’s Statement
II. STEADILY ExPANDING BUSINESS AND GRADUALLY PROMOTING GLOBALIzATION PROCESS
In 2018, leveraging on the dynamic B2B trading ecosphere, good Internet service ability and its penetration and influence in the Chinese commodity sector, both online and offline businesses of Zall’s trading ecosphere gradually connected to the international market.
In respect of the offline market, in 2018, North Hankou International Trade Center comprehensively developed its new foreign trade business and reached cooperation agreements with well-known enterprises in Nordic countries. The completion of North Hankou Zall MOMA and Nordic Pavilion, and the opening of Nordic Commodity Cross-border E-commerce O2O Trading and Exhibition Center started a new journey to build a global distribution center for commodity import and export. The “GSP Global Supplier Platform” issued by North Hankou at the China International Import Expo in 2018 served as a bridge connecting the world trade. With the introduction of implementation plans of China (Wuhan) Cross-Border E-Commerce Comprehensive Pilot Zone, North Hankou was listed as a priority area for the development of cross-border e-commerce.
In May 2018, the Group jointly invested with Asian Gateway Investment Pte Ltd., a wholly-owned subsidiary of Singapore Exchange Limited, and Global eTrade Services Company Limited (“GeTS”) for the incorporation of a joint venture, Commodities Intelligence Centre Pte. Ltd., (“CIC”) in Singapore. Six major categories of goods, including chemical plastics, non-ferrous metals, black metals, agricultural products, palm oil and fuel oil, were launched on the platform, providing commodity trade matching, one-stop logistics, customs clearance, finance and big data services for traders around the world. Leveraging on the advantages of Singapore commodity trading resources, convenient customs clearance, geographical and financial connectivity, CIC fully released the potential to serve world trade and closely connected China commodity transactions with the world market. Since the launch of the trading platform in October, matchmaking business amounted to US$1.75 billion and self-operated business amounted to US$124 million as at 31 December 2018. The Group has achieved remarkable results through application of data from the international market, significantly increased the platform activity, improved service functions and facilitated business development through business channelling and GeTS data application.
III. EMPOWERING THROUGH TECHNOLOGY TO BUILD CORE COMPETITIVENESS AND ExPLORE NEW DEVELOPMENT OPPORTUNITIES
With the advent of a new round of scientific and technological revolution and industrial innovation, new technologies such as block chain, Internet of Things, artificial intelligence, big data, etc., will gradually overturn the traditional pattern and landscape of commodity trade. Block chain technology can be used to solve the problems of trust mechanism, commodity traceability, trade security, payment credit in commercial trade; the Internet of Things technology will create traceable intelligent supply chain logistics with digital perception and visualization of commodities during the whole process; and artificial intelligence technology will be used to detect the demand, sales prediction, financial support, intelligent credit investigation, logistics distribution, service crowdsourcing, etc, in commercial trade. The Group is integrating resources to vigorously realize the transformation from business-driven to dual-wheel driving by business and technology, and build a new intelligent trading platform based on the application of block chain technology, with the support of Internet of Things, artificial intelligence, digital currency and big data.
Over the years, we have made continuous investment in technology research and development. At present, Zall Smart Commerce has built up a technical team with more than 600 people. In 2018, the Group established Zall Smart Commerce Research Institute specializing in the research and development of block chains, Internet of Things, artificial intelligence, big data, etc. It provides WMS (warehousing management system), TMS (transportation management system), OMS (order management system), credit factory (risk control and management), factoring platform, payment settlement and clearing platform,
Zall Smart Commerce Group Ltd. Annual Report 20188
Chairman’s Statement
data bus, Internet of Things/Internet of Vehicles system, supervisory warehouse system, master data system and other system software for platforms in the ecosphere, and constantly improves and optimizes such systems based on various trading scenarios.
As a technology applied to new trading tools and platforms, block chain has the characteristics of non-tampering, decentralization or weakening centralization, multi-consensus and smart contract, and serves as the infrastructure technology application for Zall Smart Commerce in building a new generation of intelligent trading platform. In 2018, the Group actively explored the technological solutions of block chain in B2B, and made significant breakthroughs by constantly adjusting and building scenarios for its application.
In January 2019, Shenzhen Sinoagri officially launched the first “bulk agricultural products circulation block chain” in China, aiming to address the difficulties in the circulation of agricultural products, realize data authenticity, trustworthiness and traceability, improve the overall efficiency of agricultural supply chain, and help customers to better save costs and allocate resources, and empower the upgrading of industrial chain through technology. With these efforts, Zall Smart Commerce has taken a firm step of empowering the traditional industries through its super supply chain management portal.
In the future, Zall Smart Commerce will continue to make further investments in technology research and development, explore more application scenarios for integration of block chain with big data, artificial intelligence and enterprise applications, and help upgrade the supply chain within the ecosphere.
IV. BUILDING AN OPEN AND INTELLIGENT TRADING ECOSPHERE AND LEADING THE DEVELOPMENT OF INDUSTRIAL INTERNET
With the mission of “Connecting global business intelligently, and creating value for clients”, Zall Smart Commerce is now pooling resources to achieve the unrestrained flow of data, customers, logistics, warehousing, finance and supply chain management with all efforts, so that enterprises and customers can have the real experience of a huge market, less inventory, higher turnover, lower cost, a lightened supply chain, and more profitability. In addition, it can also help enterprises and SMEs in China and the world at large to reduce transaction costs, so as to provide the best solution for their procurement, distribution, payment, and logistics with our services.
With the deep integration of supply chain and new technologies such as block chain, Internet of Things, artificial intelligence, digital currency and big data as its path, and support of informatization, standardization, credit system construction and talent cultivation, Zall Smart Commerce will innovate and develop new ideas, new technologies and new modes of supply chain, integrate all kinds of resources and elements efficiently, enhance the level of industrial integration and collaboration, and create an intelligent supply chain system with big data support, network-based sharing and intelligent collaboration, empower SMEs through science and technology, and lead the development of industrial Internet.
Linkage and sharing are both important attributes of the Internet, while openness and cooperation are the inevitable logical trend of scientific and technological progress and productivity development. In the future, Zall’s trading ecosphere will expand from the interconnected internal ecology to the open and shared social ecology, providing traffic entry and technical support for various B2B trading platforms and service institutions, and improving the degree of market openness.
The infrastructure platform of Zall Smart Commerce’s open B2B block chain is open to all transaction service institutions and financial institutions. The entire B2B supply chain can be connected swiftly by multi-terminal information synergy and smart contract mechanism to achieve information transparency and sharing, for the building of an efficient, low-cost, open and win-win B2B ecological system.
9Annual Report 2018 Zall Smart Commerce Group Ltd.
Chairman’s Statement
We hope that more partners will join us in the construction, use and operation of the Zall ecological system, realize our goal of sharing of prime resources and upgrading of services through gathering efforts, and improve the degree of market openness. We look forward to working hand in hand with more Chinese and international enterprises enjoy growing together, redefine B2B and even the mode of world trade, and welcome the advent of the new trade era.
Yan zhiCo-chairman
Hong Kong, 29 March 2019

Zall Smart Commerce Group Ltd. Annual Report 201810
Management Discussion and Analysis
BUSINESS REVIEW AND PROSPECTS
Consumer product-focused wholesale
The Group’s heavily invested core project, the North Hankou International Trade Center has now formed 30 large specialized market clusters covering footwear and leatherware, branded clothing, hotel supplies, small merchandises, bedding, automobile and second-handed vehicles, hardware and electrical products, etc., with merchants reaching 32,000 operating stably. The total developed and developing area of market clusters exceeded 6.8 million square meters. The annual transaction amount achieved in 2018 was RMB87.3 billion.
In 2018, various new markets and businesses including Central Business New City, Hotel Supplies City, Brand Street, Puyuan Fashion City, Books E-commerce City, Food World, Hotel Supplies International Pavilion, Flower World, Electronic and Electrical City etc. were opened in the North Hankou International Trade Center which further enhanced the scale of specialized markets in North Hankou. The Group has organized various large-scale marketing activities such as order fairs, internal purchase fairs, procurement days, exhibition fairs, exchange salons, etc. for a total of 56 times in 2018. Such events included the 9th China Hankoubei Commodity Fair that highlighted the theme of internationalization, the first Central China Import Commodity Expo, the Nordic Goods Cross-border O2O Exhibition Fair, North Hankou Luxury Trade Fair, Food and Trend Carnival, International Food Exhibition etc attracting over 100,000 citizens to visit. The Group actively organized the “2018 Wuhan Online Shopping Festival” to gain access to the online marketing resources, and cooperated with Taobao to create the “Taobao Live Broadcast Industry with Live Broadcast Base” and held the “Taobao Industry with Live Broadcast Wuhan Event”. Through various exhibition activities, popularity and prosperity of the markets were greatly promoted and a large number of merchants have been attracted.
In 2018, the Group strengthened the pilot construction of the national market procurement and trading mode and comprehensively deepened the development of new foreign trading business and achieved an annual export amount of USD1.277 billion with a year-on-year increase of 66.28%. In November 2018, North Hankou officially launched the “GSP Global Suppliers Platform” at the China International Import Expo, which has shared more than 100,000 entries of information for international suppliers and more than 600,000 entries of information for Chinese suppliers and built a bridge for worldwide trading. In December 2018, China (Wuhan) cross-border E-commerce comprehensive pilot zone implementation plan was introduced in which North Hankou was listed as a priority area for cross-border E-commerce development. In addition, the Zall Wanguo City and the Nordic Pavilion were completed in North Hankou and the Nordic Goods Cross-border O2O Trading Exhibition Center was established by the Group. A new development journey for the global import commodity distribution center has begun.

11Annual Report 2018 Zall Smart Commerce Group Ltd.
Management Discussion and Analysis
Tianjin E-commerce Mall is the Group’s flagship project in Northern China. Portions of the commercial, trade and e-commerce zones of Phase I have commenced operation gradually. Against a background of cooperative development in the Beijing-Tianjin-Hebei region and the easing of Beijing’s non-capital core function, Tianjin E-commerce Mall has been absorbing an increasing number of Beijing’s large wholesale markets. As of 31 December 2018, over 6,000 merchants were stationed at Tianjin E-commerce Mall. Dongpi Clothing Wholesale New Market (動批服裝新城), Jinwen Clothing Mall (津溫服裝商城), Zall Fashion City (卓爾精品服裝城), Zall Tianle Mall (卓爾天樂商城), Zall Red Gate Morning Market (卓爾紅門早市) of Tianjin E-commerce Mall Phase I has commenced operation in April 2018. Tianjin E-commerce Mall grasped the opportunities following the trend of Beijing easing and established procurement routes to Tianjin Old DaHutong (天津老大胡同), different areas of Tianjin and Beijing as well as the long-distance procurement bus routes to Inner Mongolia, Northeastern China, Shanxi, Shandong, Hebei etc. The passengers transportation system of Tianjin Old wholesale markets was completely undertaken by the Group and has formed a logistics network that covering Eastern China, Southern China, Central China, Northern China, Northeastern China, Northwestern China regions respectively. The Group’s position of the largest clothing wholesale and procurement central market in Northern China was gradually strengthened.
Supply chain management and trading
As the Group continues to strengthen and expand its e-commerce, internet and intelligent trading businesses, the Group has acquired and established various companies in the industrial internet sector focusing on the construction and operation of intelligence transactions and services platforms. The Group has established B2B trading platform matrix for agricultural products, chemicals and plastic raw material, black metal and non-ferrous metal, etc.
Shenzhen Sinoagri has devoted in the agricultural products B2B vertical e-commerce sector for years and is mature in B2B trading platform and supply chain management. In 2018, prices of bulk commodities including white sugar continued to decrease. Despite such unfavourable market environment, Shenzhen Sinoagri has maintained a stable growth in transaction amount. In 2018, Shenzhen Sinoagri has provided whole supply chain service solutions in the fields of trading, information, settlement, finance and logistics to over 70,000 manufacturers, processing enterprises, suppliers and terminal suppliers in both upstream and downstream. In 2018, the new product variety of Shenzhen Sinoagri, the dried fruit and vegetable business operated smoothly and 11 warehouses were set up in different places such as Shandong, Jiangsu, Inner Mongolia and Gansu with transaction scale exceeded RMB100 million. Meanwhile, Shenzhen Sinoagri has completed the preparation for the launch of soybean variety and has provided whole supply chain services for both upstream and downstream clients of the soybean industry. A breakthrough was made in overseas export business with a cross-border trading scale of USD12.36 million which was achieved in the exports to countries such as Thailand, Vietnam and India etc. As of 31 December 2018, the registered members of Shenzhen Sinoagri reached 78,901. The brand value of Shenzhen Sinoagri was further recognized by the government and the industry. Shenzhen Sinoagri was honoured as Top 500 Chinese Enterprises (ranked the 486th), and it has successively entered Top 100 Chinese B2B Industry List (ranked the 7th) and listed in the Top 500 Shenzhen Enterprises (ranked the 37th). As of 31 December 2018, the annual revenue of Shenzhen Sinoagri amounted to approximately RMB35 billion, representing an increase of approximately 7.31% as compared to the corresponding period of 2017.
In March 2018, the Group completed the acquisition of 52.48% equity interest in HSH and became the controlling shareholder of HSH. As a chemical e-commerce operator that leads the future, HSH is committed to promoting the infrastructure construction of the “Internet + chemical and plastics raw materials”, opening up the closed loop of transaction of information flow, logistics and capital flow in the whole industrial chain for chemical and plastics raw materials and constructing a new ecosystem for entire chemical and plastics raw materials industry industrial chain. In 2018, HSH adjusted the operating structure and focused on developing large and medium-sized quality suppliers. With further focusing on the main products, HSH gradually optimized some non-main SKU commodities and devoted to strengthen the main products which increased market share. In 2018, the number of self-operated orders amounted to 15,464, representing a year-on-year increase of approximately 10.03%; the number of clients reached 39,295, representing a year-on-year increase of approximately 14.61%; and the annual revenue amounted to RMB13.5 billion, representing a year-on-year increase of approximately 93.13%.
Zall Smart Commerce Group Ltd. Annual Report 201812
Management Discussion and Analysis
In March 2018, the Group established Zall Steel with Xiben New Line. Zall Steel mainly provides overall integrated supply chain services and solutions for trading, warehousing and processing, supply chain finance and other services to upstream and downstream supply chain partners. Since its establishment on 23 March 2018, Zall Steel has formed business partnerships with approximately 1,500 upstream and downstream customers. As of 31 December 2018, Zall Steel has realized operating revenue of RMB5.7 billion.
In April 2018, the Group acquired 22% of equity interest of Haishangxian. Haishangxian provides an integrated one-stop platform for seafood buyers and sellers with maritime communications, trading platform, supply chain finance and related value-added services. By investing in Haishangxian, the Group will also expand its business to the fishery industry and fresh seafood supply chain field and further expand the coverage of Zall intelligent trading ecosystem.
In May 2018, the Group jointly invested with Asian Gateway Investment Pte Ltd., a wholly-owned subsidiary of Singapore Exchange Limited, and GeTS for the incorporation of a new corporation, CIC in Singapore. CIC mainly engages in construction and operation of online global commodities trading platform, provision of transaction matching, transaction financing, supply chain and logistics services and provision of trade data to enhance trade facilitation so as to help enterprises to reduce transaction costs. Since the launch of the platform in October and up to 31 December 2018, the matched transaction amounted to USD1.75 billion and the proprietary transaction amount reached USD124 million. CIC discussed with Marubeni Corporation in Japan, one of the Global 500 enterprises, for cooperation in the late 2018 and officially entered into a strategic cooperation agreement in the early 2019. The parties will carry out in-depth cooperation in sectors such as agricultural industrial internet, international supply chain finance, food deep processing. Relying on each other’s advantages in globalized business and resource and technology accumulation, the parties will jointly expand the Chinese and the world market.
Through the integration online and offline of development in recent years, the Group has set up and operated B2B trading platforms which have significant impacts on agricultural products, chemicals, plastics raw materials, black metal and non-ferrous metals, with notable growth in supply chain management and trade performance. When suitable opportunities arise, the Group will further develop into other sectors through organic growth or mergers and acquisitions, continue to enrich and enhance Zall’s intelligent trading ecosphere and to further improve operating efficiency.
Finance, warehousing and logistics services
Zall Jinfu focuses on the strategic objectives of the Group’s, relies on the blockchain to provide the underlying technology of the Group’s intelligent commercial trading ecosphere to create products and solutions that are differentiated from traditional financial institutions, connects completely with the commerce, logistics, and e-commerce platform systems of the Group to provide all-rounded diversified financial services. For the year ended 31 December 2018, Zall Jinfu has accumulated handling approximately RMB1.733 billion of financial loans for upstream and downstream enterprises of the supply chain based on the transactions and supply chain trading management platforms such as North Hankou market (漢口北市場), Zall Cloud Market (卓爾雲市) and Zall Commerce (卓爾雲商) etc.
In respect of warehousing services, Zall Cloud Warehouse (卓爾雲倉), a subsidiary of the Group, focuses on the provision of offline warehouse goods custody services, warehouse leasing and financial products regulatory services for enterprises and their downstream distributors, wholesale markets through the integration of physical delivery, logistics network construction and transportation, supply chain financial risk regulation and other logistics industry chain resources within the trading sections of the ecosystem. As of 31 December 2018, Zall Cloud Warehouse has successfully linked with multiple enterprises within the Group with businesses distributed in 40 cities such as Shanghai, Shenzhen, Qingdao, Ningbo, etc. The number of regulatory inventory warehouses reached 260 with an area of over 12 million square meters and a total inventory of approximately 1.06 million tons. Moreover, Zall Cloud Warehouse has strategically cooperated with industries such as maternal and child, electrical appliances, clothing, fast-moving consumer goods and reached cooperation intentions with over 20 merchants.

13Annual Report 2018 Zall Smart Commerce Group Ltd.
Management Discussion and Analysis
In respect of logistics services, Zallsoon (卓集送), a subsidiary of the Group, mainly focuses on city distribution freight, intercity long-distance freight and cold chain specialized vehicles. It provides customized logistics solutions to customers by using big data technology to reduce logistics costs and enhance transportation efficiency. Zallsoon also cooperates with motor car and new energy vehicle manufacturers through finance leases and provides value-added services for vehicle sales, recruitment of drivers and the automobile aftermarket (e.g. vehicle insurance, maintenance, fueling, etc), all of which ensures a stable and controllable core transport capacity for the platform and solves the problem of traffic restrictions in some cities. As of 31 December 2018, Zallsoon has accomplished the layout in 37 core logistics cities including Wuhan, Shanghai, Nanjing, Guangzhou, Shenzhen, Tianjin, Xuzhou, Dongguan, Zhengzhou, Beijing, etc. Zallsoon focused on the industry customers and expanded business scopes to e-commerce, express delivery, O2O, new retail, fresh food, etc. and reached national transportation cooperation with many globally well-known enterprises. As of 31 December 2018, Zallsoon provides services to approximately 200,000 cargo owners with over 100,000 active drivers on its platform. Accumulated number of orders in aggregate amounted to nearly 67 million, with over 120,000 orders in the busiest day during the year.
FUTURE PROSPECTS
Through the online and offline integration development and advancement of internetization in the past three years, “Zall Smart Commerce” has been committed to the construction of the B2B trading platform matrix. We construct and operate B2B trading platforms for consumer goods, agricultural products, chemicals, plastics, non-ferrous metals, etc. and provide services such as finance, property, logistics, cross-border trading, and supply chain management based on the trading environment and transaction data. Moreover, we are riding on the technological development trend. By the application of technologies such as the Internet of Things and blockchain, enriching trading varieties continuously and expanding the trading area through the “Commodities Intelligence Centre” managed in cooperation with the Singapore Exchange, the Group is building a global commodity intelligent trading platform and service system.
After the early-stage planning and exploration, we have accumulated sufficient trading volume, valuable talent reserves, big data processing capabilities, intelligent technology. Therefore, the Zall intelligent trading ecosphere has now reached a critical point of development. In the meantime, we have to concentrate resources and realize the smooth connection and operation of all major platforms in terms of data, clients, logistics, warehousing, finance, supply chain management, etc., so that enterprises and clients can truly enjoy the benefits of a bigger market and lower inventory level with higher turnover, reduced cost, streamlined supply chain and more profitability. Our clients can therefore experience the concrete changes, thus establishing the outstanding reputation of Zall Smart Commerce in China and the world commodity trading market.
Zall Smart Commerce Group Ltd. Annual Report 201814
Management Discussion and Analysis
INVESTMENT PORTFOLIO
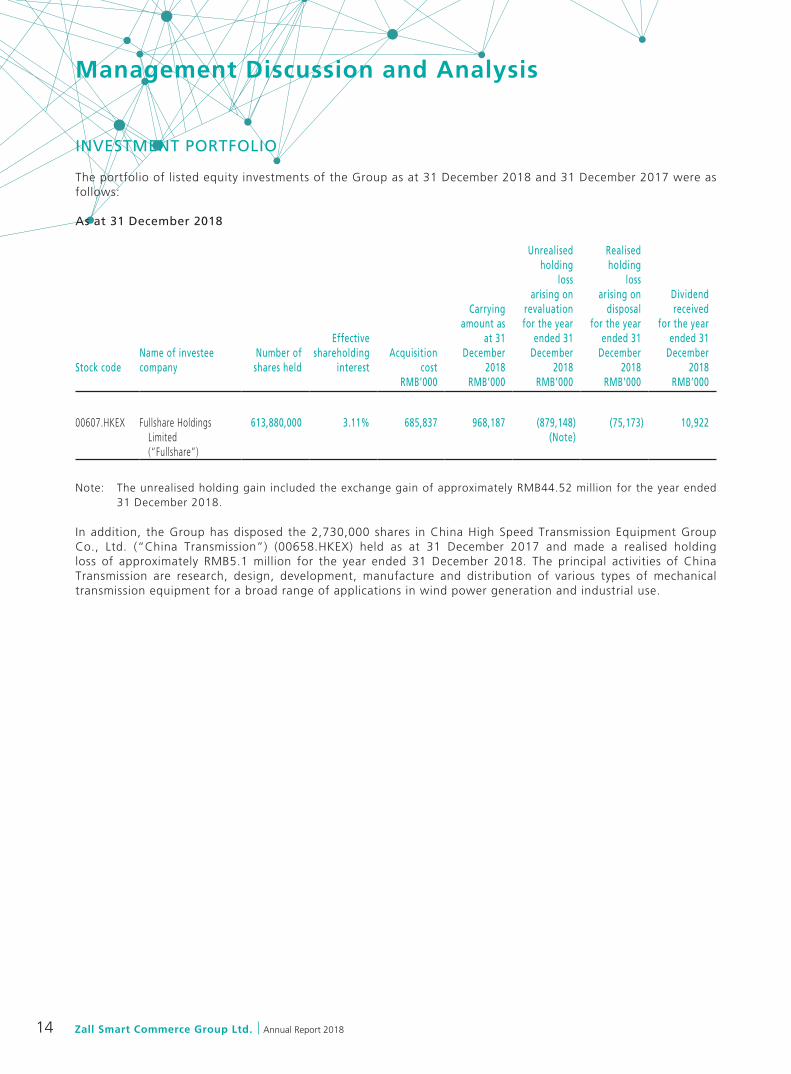
The portfolio of listed equity investments of the Group as at 31 December 2018 and 31 December 2017 were as follows:
As at 31 December 2018
Stock codeName of investeecompany
Number ofshares held
Effectiveshareholding
interestAcquisition
cost
Carryingamount as
at 31December
2018
Unrealisedholding
lossarising on
revaluationfor the year
ended 31December
2018
Realisedholding
lossarising on
disposalfor the year
ended 31December
2018
Dividendreceived
for the yearended 31
December2018
RMB’000 RMB’000 RMB’000 RMB’000 RMB’000
00607.HKEX Fullshare Holdings Limited (“Fullshare”)
613,880,000 3.11% 685,837 968,187 (879,148) (Note)
(75,173) 10,922
Note: The unrealised holding gain included the exchange gain of approximately RMB44.52 million for the year ended 31 December 2018.
In addition, the Group has disposed the 2,730,000 shares in China High Speed Transmission Equipment Group Co., Ltd. (“China Transmission”) (00658.HKEX) held as at 31 December 2017 and made a realised holding loss of approximately RMB5.1 million for the year ended 31 December 2018. The principal activities of China Transmission are research, design, development, manufacture and distribution of various types of mechanical transmission equipment for a broad range of applications in wind power generation and industrial use.

15Annual Report 2018 Zall Smart Commerce Group Ltd.
Management Discussion and Analysis
As at 31 December 2017
Stock codeName of investeecompany
Number ofshares held
Effectiveshareholding
interestAcquisition
cost
Carryingamount as
at 31December
2017
Unrealisedholding
(loss)/gainarising on
revaluationfor the year
ended 31December
2017
Realisedholding
gainarising on
disposalfor the year
ended 31December
2017
Dividendreceived
for the yearended 31December
2017RMB’000 RMB’000 RMB’000 RMB’000 RMB’000
00607.HKEX Fullshare 695,497,500 3.53% 773,985 2,092,944 (149,601) (Note)
– 10,207
00658.HKEX China Transmission 2,730,000 0.17% 16,739 30,807 14,068 3,050 –
2,123,751 (135,533) 3,050 10,207
Note: The unrealised holding loss included the exchange loss of approximately RMB146.5 million for the year ended 31 December 2017.
The performance and prospects of the listed equity investments during the year are as follows:
As at 31 December 2018, the Group held approximately 613,880,000 (31 December 2017: 695,497,500) shares in Fullshare, representing approximately 3.11% of its entire issued share capital (31 December 2017: 3.53%). Fullshare is listed on the main board of the Stock Exchange. Its principle activities are property development, tourism, investment, provision of healthcare products and services business and new energy business. The Group recognised an unrealised holding loss of approximately RMB879.1 million, including exchange gain of approximately RMB44.52 million for the year ended 31 December 2018 (31 December 2017: unrealised holding loss of RMB149.6 million including exchange loss of approximately RMB146.5 million). The carrying amount of investment in Fullshare accounts for approximately 1.82% of the Group’s total assets as at 31 December 2018 (31 December 2017: 4.42%). The Group is of the view that the unrealised holding loss: (i) did not cover other items of the Group’s results for the year ended 31 December 2018 and (ii) is non-cash in nature and relates to the change in fair value of the Group’s investment in Fullshare that are volatile in nature, the unrealised holding loss will not adversely affect the Group’s operating financial positions. The Group will closely monitor the performance of its investment and adjust its investment plan and portfolio when necessary.

Zall Smart Commerce Group Ltd. Annual Report 201816
Management Discussion and Analysis
RESULTS OF OPERATION
Revenue
Revenue of the Group increased significantly by approximately 152.2% from RMB22,249.2 million for the year ended 31 December 2017 to approximately RMB56,116.1 million for the year ended 31 December 2018. The increase was primarily due to the offsetting effect of (i) the significant increase in revenue from supply chain management and trading business; (ii) the increase in rental income; (iii) the decrease in revenue from E-commerce and financial service business; (iv) the decrease in revenue from construction contracts; and (v) the decrease in the revenue from sales of properties and related services.
Revenue from supply chain management and trading business
The Group’s revenue from supply chain management and trading business has contributed approximately 96.4% of the Group’s total revenue for the year ended 31 December 2018. The significant increase in revenue from supply chain management and trading business was primarily attributable to (i) completion of the acquisition of 50.6% equity interest in Shenzhen Sinoagri in June 2017, resulting the consolidation of the financial results of Shenzhen Sinoagri for the full year impact in the year ended 31 December 2018 as compared to the consolidation of the financial results of six month upon completion of such acquisition in June 2017 during the year ended 31 December 2017; and (ii) completion of the acquisition of 52.48% equity interest in HSH in March 2018, resulting the consolidation of the financial results of HSH since then.
Rental income
The Group’s rental income increased significantly by approximately 81.8% from RMB486.3 million for the year ended 31 December 2017 to RMB884.2 million for the year ended 31 December 2018. The increase was primarily due to an increase in rental areas in the North Hankou Project.
Financing income
The Group’s financing income increased by 62.5% from RMB195.2 million for the year ended 31 December 2017 to RMB317.2million for the year ended 31 December 2018. The increase was mainly due to full year impact of Shenzhen Sinoagri consolidation.
Revenue from E-commerce and financial services business
The Group’s revenue from e-commerce and financial services business decreased by approximately 10.6% from RMB118.6 million for the year ended 31 December 2017 to RMB106.1 million for the year ended 31 December 2018. The decrease was mainly due to the slightly reduction in volume of E-commerce transactions in 2018.
Revenue from construction contracts
The Group’s revenue from construction contract to build certain properties on behalf of a third party decreased significantly by approximately 83.8% from RMB30.9 million for the year ended 31 December 2017 to RMB5.0 million for the year ended 31 December 2018. The revenue was recognised according to the actual cost incurred for the year ended 31 December 2018. The decrease for the year 2018 was primarily due to projects being at their completion stage in the year under review.
Revenue from sales of properties and related services
Revenue from sales of properties decreased by approximately 10.1% from RMB759.5 million for the year ended 31 December 2017 to RMB682.8 million for the year ended 31 December 2018.
The Group’s revenue from sales of properties was generated from the sales of auxiliary facilities units, office and retails units and residences. The decrease in revenue from sales of properties was mainly attributed to the decrease in the gross floor area delivered in 2018.

17Annual Report 2018 Zall Smart Commerce Group Ltd.
Management Discussion and Analysis
Cost of sales
Cost of sales of the Group increased significantly by approximately 156.9% from approximately RMB21,237.0 million for the year ended 31 December 2017 to approximately RMB54,556.5 million for the year ended 31 December 2018. The increase is primarily due to full year impact of Shenzhen Sinoagri and completion of acquisition of HSH, cost of inventories of which was approximately RMB45,531.4 million for the year ended 31 December 2018.
Gross profit
Gross profit of the Group increased by approximately 54.1% from approximately RMB1,012.3 million for the year ended 31 December 2017 to approximately RMB1,559.6 million for the year ended 31 December 2018. The Group’s gross profit margin decreased from 4.5% for the year ended 31 December 2017 to 2.8% for the year ended 31 December 2018 which is mainly due to the changes of the revenue portfolio of the Group since the completion of acquisition of a majority equity interest in Shenzhen Sinoagri and HSH in June 2017 and March 2018 respectively. Given the characteristics of initial development of the supply chain management and trading business, it has contributed higher revenue but lower gross profit margin.
Other net loss
Other net loss of the Group increased by approximately 1,229.6% from approximately RMB39.9 million for the year ended 31 December 2017 to approximately RMB530.5 million for year ended 31 December 2018. The increase was mainly due to the increase in the loss arising from net fair value change on listed equity securities of approximately RMB743.6 million.
Selling and distribution expenses
Selling and distribution expenses of the Group increased by approximately 8.8% from RMB196.4 million for the year ended 31 December 2017 to approximately RMB213.7 million for the year ended 31 December 2018. The increase was primarily due to the increase in staff costs of approximately RMB17.6 million.
Administrative and other expenses
Administrative and other expenses of the Group increased by approximately 54.5% from RMB492.5 million for the year ended 31 December 2017 to approximately RMB760.8 million for the year ended 31 December 2018. The increase was primarily due to (i) the increase in staff cost of approximately RMB86.9 million; (ii) increase in amortisation and depreciation of approximately RMB29.4 million; (iii) increase in other tax expenses (e.g. stamp duty, property tax, etc.) of approximately RMB42.1 million; (iv) increase in equity-settled share-based payment expenses of approximately RMB47.1 million; and (v) increase in donation of approximately RMB15.0 million.
Net valuation gain on investment properties
The Group holds a portion of properties developed for rental income and/or capital appreciation purposes. The Group’s investment properties are revaluated at the end of the respective review period on an open market value or existing use basis by an independent property valuer. The net valuation gain on investment properties increased by approximately 27.9% from RMB3,021.3 million for the year ended 31 December 2017 to approximately RMB3,865.2 million for the year ended 31 December 2018. The increase was primarily due to the increased number of shopping mall units retained for rental purposes. The return of investment properties remains stable and the Group will closely monitors the performance of its investment and adjust investment property profolio when necessary.
Zall Smart Commerce Group Ltd. Annual Report 201818
Management Discussion and Analysis
Share of net (losses)/profits of joint ventures
Share of net losses of joint ventures of the Group was approximately RMB2,343.0 thousand for the year ended 31 December 2018 (2017: share of net profits of joint ventures: RMB727 thousand). This is primarily due to the Group’s share of net loss of AP V-Best Supply Chain (Shanghai) Ltd. which is a joint venture of a majority equity interest since the acquisition of Shenzhen Sinoagri.
Share of net losses of associates
Share of net losses of associates increased by 379.5% from approximately RMB36.1 million for the year ended 31 December 2017 to approximately RMB172.9 million for the year ended 31 December 2018. The increase is mainly due to the increase in share of losses from material associate of LightInTheBox comparing to the year ended 31 December 2017.
Finance income and costs
Finance income of the Group increased by approximately 131.5% from RMB89.0 million for the year ended 31 December 2017 to approximately RMB206.0 million for the year ended 31 December 2018. The increase was mainly attributable to interest income from the pledged bank deposits due to the full year impact of Shenzhen Sinoagri.
Finance cost of the Group increased by approximately 30.5% from RMB534.4 million for the year ended 31 December 2017 to approximately RMB697.2 million for the year ended 31 December 2018. The increase was mainly attributable to the increase in interest expenses incurred on bank loans and loans from other financial institutions and other borrowing costs due to the full year impact of Shenzhen Sinoagri consolidation.
Income tax
Income tax increased by approximately 140.2% from RMB447.1 million for the year ended 31 December 2017 to RMB1,074.2 million for the year ended 31 December 2018. The increase was mainly due to the increase in deferred tax of RMB542.9 million as result of the increase of fair value gain from investment properties in 2018. The Group’s effective tax rate increased from approximately 15.9% for the year ended 31 December 2017 to approximately 45.7% for the year ended 31 December 2018.
Profit for the year
For the year ended 31 December 2018, the Group recorded a net profit of RMB1,273.9 million, representing a decrease of approximately 45.9% over the amount of RMB2,356.5 million for the year ended 31 December 2017. For the year ended 31 December 2018, profit attributable to equity shareholders of the Company was RMB1,371.3 million (31 December 2017: 2,379.1 million).
19Annual Report 2018 Zall Smart Commerce Group Ltd.
Management Discussion and Analysis
Liquidity and capital resources
As at 31 December 2018, the Group had net current assets of approximately RMB605.8 million (31 December 2017: approximately RMB3,996.7 million) and net assets of approximately RMB19,608.8 million (31 December 2017: approximately RMB18,660.9 million). As at 31 December 2018, the total equity attributable to equity shareholders of the Company amounted to approximately RMB18,779.6 million (31 December 2017: approximately RMB17,781.2 million), comprising issued capital of approximately RMB32.4 million (31 December 2017: approximately RMB32.3 million) and reserves of approximately RMB18,747.2 million (31 December 2017: approximately RMB17,748.9 million). The Group’s financial position is healthy with a stable well-managed working capital.
Cash position
The Group’s cash and cash equivalents consist primarily of cash on hand and bank balances which are primarily held in RMB denominated accounts with banks in the PRC. The Group’s cash and cash equivalents decreased by approximately 12.9% from approximately RMB1,283.6 million as at 31 December 2017 to approximately RMB1,118.6 million as at 31 December 2018. The Group’s cash and cash equivalents remain stable. The Group regularly and closely monitors its funding and treasury position to meet the funding requirements of the Group.
Interest-bearing borrowings
The Group’s total long-term and short-term interest-bearing borrowings increased by approximately 29.4% from approximately RMB10,994.4 million as at 31 December 2017 to approximately RMB14,225.9 million as at 31 December 2018. The increase was mainly attributable to (i) the completion of acquisition of HSH as mentioned, resulting the financial results of HSH being consolidated into the financial results of the Group; (ii) the increase of short-term loans. Majority of the loans were denominated in RMB, being the functional currency of the Group. Details of the interest rates during the year ended 31 December 2018 are set out in note 25(a) of the consolidated financial statements in this report.
Net gearing ratio
The Group’s net gearing ratio increased from 39.5% as at 31 December 2017 to 52.4% as at 31 December 2018. The increase in net gearing ratio was mainly due to the increase of total short-term and long-term interest-bearing borrowings as at 31 December 2018. The net gearing ratio is calculated by dividing interest-bearing borrowings, net of cash and cash equivalents, pledged bank deposits and fixed deposits with banks with original maturity over three months, by total equity attributable to equity shareholders of the Company.
Foreign exchange risk
The Group’s sales were primarily denominated in RMB, being the functional currency of the Group’s major operating subsidiaries. Accordingly, the Board expects any future exchange rate fluctuation will not have any material effect on the Group’s business. As at 31 December 2018, the Group did not use any financial instruments for hedging purpose. The Group will continue to monitor foreign exchange changes to best preserve the Group’s cash value.
Charge on assets
As at 31 December 2018, the Group had pledged certain of its assets with a total book value of RMB22,832.9 million (31 December 2017: RMB17,390.1 million) and a total book value of RMB6,238.6 million (31 December 2017: RMB5,048.6 million) for the purpose of securing certain of the Group’s bank loans and loans from other financial institutions and bills payables respectively.

Zall Smart Commerce Group Ltd. Annual Report 201820
Management Discussion and Analysis
Material acquisitions and disposals of subsidiaries
In October 2017, the Group entered into an agreement with HSH and five independent third parties in relation to subscription of 19.72% interest of HSH at an aggregate consideration of USD14.3 million and acquisition of 32.76% interest in at an aggregate consideration of USD15.2 million. HSH, a company incorporated in the Cayman Islands with limited liability, together with its subsidiaries, is principally engaged in the trading of chemical and plastic raw materials and operating the information services business. The transaction was approved by the shareholders of the Company on 5 March 2018. The aforementioned acquisition has been completed on 28 March 2018.
In April 2018, Wuhan Zall Interconnection Tech Co., Ltd. (“Zall Interconnection”), a wholly-owned subsidiary of the Company, Shenzhen Sinoagri, a subsidiary of the Company, and other investors entered into an equity transfer and capital increase agreement with Haishangxian, the existing shareholders of Haishangxian and the subsidiaries of Haishangxian in relation to the acquisition and subscription of the equity interest of Haishangxian. Pursuant to the Equity Transfer and Capital Increase Agreement, Zall Interconnection agreed to (i) subscribe for 15% Haishangxian Equity Interest from Haishangxian at a consideration of RMB90 million; and (ii) acquire 6% Haishangxian Equity Interest from the existing shareholders of Haishangxian at an aggregate consideration of RMB27 million, and Shenzhen Sinoagri agreed to acquire 1% Haishangxian Equity Interest from one of the Vendors at a consideration of RMB4.5 million. In addition, the other investors also agreed to subscribe for an aggregate of 25% Haishangxian Equity Interest at a total consideration of RMB150 million. The Subscription and the Acquisition have been completed and Haishangxian is indirectly owned as to 22% by the Company.
In August 2018, Zall Development (Wuhan) Co., Ltd., a wholly-owned subsidiary of the Company, has disposed 65% of equity interest in Zall Heng Supply Chain Management (Wuhan) Co., Ltd. (“Wuhan Zall Heng”), a company principally engaged in supply chain business of standardized non-ferrous metals, at the consideration of RMB16,250,000. Wuhan Zall Heng ceased to be a subsidiary of the Company.
Save as disclosed above, the Group did not have any material acquisitions or disposals of subsidiaries and associates during the year ended 31 December 2018 and up to the date of this annual report.
Segment reporting
Details of the segment reporting of the Group for the year ended 31 December 2018 are set out in note 3(b) of the consolidated financial statements in this report.
Contingent liabilities
In accordance with industrial practice, the Group has made arrangements with various PRC banks to provide mortgage facilities to the purchasers of its pre-sold properties. Pursuant to the terms of the guarantees, if there is a default of the mortgage payments by these purchasers, the Group will be responsible to repay the outstanding mortgage loans together with any accrued interests and penalties owed by the defaulted purchasers to the banks. The Group’s guarantee period commences from the dates of grant of the relevant mortgage loans and ends upon the earlier of the buyers obtained the individual property ownership certificate and the full settlement of mortgage loans by the buyers.

21Annual Report 2018 Zall Smart Commerce Group Ltd.
Management Discussion and Analysis
Wuhan North Hankou Guarantee Investment Co., Ltd. (“Wuhan Guarantee Investment”), the Group’s wholly-owned subsidiary, is principally engaged in provision of business start-up loan guarantee and personal loan guarantee for entrepreneurs in the PRC. In accordance with the terms stipulated in the relevant agreements, Wuhan Guarantee Investment is required to make payments to reimburse the beneficiary of the guarantee for the loss incurs if a specified borrower fails to make payment when due.
As at 31 December 2018, the guarantees provided to lenders in relation to personal loans and banks in relation to mortgage facilities granted to purchasers of the Group’s properties amounted to RMB268.1 million (2017: RMB141.7 million) and RMB688.8 million (2017: RMB845.2 million), respectively.
CHANGES IN ACCOUNTING POLICIES
The International Accounting Standards Board has issued a number of new International Financial Reporting Standards that are first effective for the year ended 31 December 2018, certain of which are related to the Group’s financial statements for the year ended 31 December 2018. For details, please refer to Note 2 to the consolidated results of the Company in this report.
EMPLOYEES AND REMUNERATION POLICY
As at 31 December 2018, the Group employed a total of 1,919 full time employees (2017: 1,714). Compensation for the employees includes basic wages, variable wages, bonuses and other staff benefits. For the year ended 31 December 2018, the employees benefit expenses were RMB355.5 million (2017: RMB244.2 million). The increase is mainly due to the first completion of acquisition of Shenzhen Sinoagri in June 2017 and completion of HSH in March 2018. The remuneration policy of the Group is to provide remuneration packages, in terms of basic salary, short term bonuses and long term rewards such as shares and options, so as to attract and retain top quality staff. The remuneration committee of the Company reviews such packages annually, or when the occasion requires.
The Group has also adopted a share option scheme (the “Share Option Scheme”) for the purpose of providing incentives and rewards to eligible participants, including the Directors, and full-time or part-time employees, executives or officers of the Group who had contributed to the success of the Group’s operations. In relation to the Share Option Scheme, 94,367,950 share options were outstanding as at 31 December 2018.

Zall Smart Commerce Group Ltd. Annual Report 201822
Biographical Details of Directors andSenior Management
ExECUTIVE DIRECTORSMr. Yan zhi (閻志), aged 46, is the co-chairman of the Board and co-chief executive officer of the Company, and is primarily responsible for the Group’s overall business and investment strategies, as well as supervising its project planning, business and operation management. He is also a member of the nomination committee of the Company. Mr. Yan Zhi is the founder of the Group and has extensive industry experience in commercial property and wholesale market and other investment and enterprise management experience in various industries including finance, real estate, logistics, commerce and aviation. Mr. Yan Zhi is a non-executive director and chairman of China Infrastructure & Logistics Group Ltd., which is listed on the Main Board of the Hong Kong Stock Exchange (formerly known as CIG Yangtze Ports PLC, a company transfer its listing to the Main Board on 29 January 2018, stock code: 1719). Mr. Yan Zhi is a non-independent director and chairman of Wuhan Hanshang Group Co., Ltd. (武漢市漢商集團股份有限公司), a company listed on the Shanghai Stock Exchange (stock code: 600774). Mr. Yan Zhi has been appointed as a director of LightInTheBox, a company listed on the New York Stock Exchange since 30 March 2016, and has been appointed as chairman of the board since 28 June 2018. Mr. Yan Zhi is the representative of the 13th National People’s Congress of China. In August 2017, he was elected as the chairman of the Wuhan Federation of Industry and Commerce and the president of the Wuhan Chamber of Commerce. Mr. Yan Zhi received a master’s degree in business administration for senior executives from Wuhan University (武漢大學) in February 2008 and his executive master of business administration degree at Cheung Kong Graduate School of Management (長江商學院) in September 2013, and awarded a doctoral degree in Chinese History by Wuhan University in June 2018.
Dr. Gang Yu (于剛), aged 59, Dr. Yu was appointed as an executive Director and co-chairman of the Board on 17 August 2015. Dr. Yu is currently a co-founder and executive chairman of the 111 Inc., a well-known pharmaceutical e-commerce platform listed on NASDAQ, and was a co-founder and chairman emeritus of Yihaodian, a leading e-commerce company in China. Dr. Yu has extensive experience in E-commerce and operation and logistics management. Prior to founding Yihaodian, he was Vice President, Worldwide Procurement at Dell Inc. Dr. Yu also served as Vice President, Worldwide Supply Chain Operations at Amazon.com. Prior to joining Amazon, Dr. Yu served as the Jack G. Taylor Chair Professor in Business in the Department of Management Science and Information Systems at the McCombs School of Business, the University of Texas at Austin, Director of the Center for Management of Operations and Logistics, and co-Director of the Center for Decision Making under Uncertainty. Dr. Yu is also the founder, former chairman and chief executive officer of CALEB Technologies Corporation. Dr. Yu obtained his bachelor degree in science from Wuhan University in 1982 and his master degree in science from Cornell University in 1985. Dr. Yu received his PhD from the Wharton School of Business, University of Pennsylvania in 1990. Dr. Yu has been appointed as a director of LightInTheBox, a company listed on the New York Stock Exchange since 30 March 2016. Also, Dr. Yu was appointed as independent director of Baozun Inc., which is listed on Nasdaq Stock Market since April 2018 and was appointed as director of Midea Group Co., Ltd (美的集團股份有限公司), which is listed on the Shenzhen Stock Exchange.
Mr. Wei zhe, David (衞哲), aged 48, was appointed as an independent non-executive Director on 11 April 2016 and re-designated as executive Director and appointed as chief strategy officer of the Company since 28 June 2017. Mr. Wei has over 18 years of experience in both investment and operational management in the People’s Republic of China. Prior to launching Vision Knight Capital (China) Fund I, L.P., a private equity investment fund in 2011, Mr. Wei was an executive director and chief executive officer of Alibaba.com Limited, a leading worldwide B2B e-commerce company, for about five years, where he successfully led the company through its initial public offering and listing on the Hong Kong Stock Exchange in 2007. Alibaba.com Limited was delisted in June 2012. Prior to Alibaba.com Limited, Mr. Wei was the president, from 2002 to 2006, and chief financial officer, from 2000 to 2002, of B&Q China, the then subsidiary of Kingfisher plc, a leading home improvement retailer in Europe and Asia. Under Mr. Wei’s leadership, B&Q China grew to become China’s largest home improvement retailer. From 2003 to 2006, Mr. Wei was also the chief representative for Kingfisher’s China sourcing office, Kingfisher Asia Limited. Prior to that, Mr. Wei served as the head of investment banking at Orient Securities Company Limited from 1998 to 2000, and as corporate finance manager at Coopers & Lybrand (now part of PricewaterhouseCoopers) from 1995 to 1998. Mr Wei was a non-executive director of HSBC Bank (China) Company Limited and The Hongkong and Shanghai Banking Corporation Limited and an independent director of 500.com Limited, and was also the vice chairman of China Chain Store & Franchise Association. He was voted as one of “China’s Best CEOs” by magazine in 2010. Mr. Wei is also a non-executive director of PCCW Limited, Zhong Ao Home Group Limited and JNBY Design Limited, which are listed on the Hong Kong Stock Exchange, an independent director of Leju Holdings Limited and OneSmart International Education Group Limited, which are listed on the New York Stock Exchange and non-executive director of Informa PLC, which is
23Annual Report 2018 Zall Smart Commerce Group Ltd.
Biographical Details of Directors andSenior Management
listed on the London Stock Exchange. Mr. Wei served as an independent director of Shanghai M&G Stationery Inc., which is listed on the Shanghai Stock Exchange from June 2014 to May 2017. He holds a bachelor’s degree in international business management from Shanghai International Studies University and has completed a corporate finance program at London Business School.
Mr. Qi zhiping (齊志平), aged 46, joined the Group at the acquisition of 50.6% equity interest in Shenzhen Sinoagri by the Group in June 2017 and was appointed as an executive Director in July 2018. Mr. Qi was then the vice chairman of Shenzhen Sinoagri and holds the position after the above acquisition. Mr. Qi is also the co-president of the Group and a member of the remuneration committee of the Company. Mr. Qi is primarily responsible for the integrated management of the online platform of the Group and the collaboration of various platforms, and the overall strategic planning and management capacity enhancement of Shenzhen Sinoagri, the planning for investment and development strategy of the Group, designing commercial models, engaging in investment projects decision and management of the Group. Mr. Qi was one of the founding members of Shenzhen Sinoagri. He has extensive experience on operation and management of retail chain, securities investment and E-commerce and experienced in corporate governance, strategic planning and global deployment. Mr. Qi obtained his bachelor degree in corporate management from Shenzhen University in 1994. He is currently studying the Executive Master of Business Administration (EMBA) programme of China Europe International Business School. Mr. Qi has been appointed as a director of LightInTheBox, a company listed on the New York Stock Exchange since 17 August 2018 and has been appointed as the vice chairman of the board since 16 November 2018.
Mr. Cui Jinfeng (崔錦鋒), aged 40, currently is the chairman of the Group’s Tianjian Zall E-commerce Mall. He was appointed as an executive Director on 20 June 2011. Mr. Cui is also a member of the risk management committee of the Company. Mr. Cui joined the Group in July 2005 and is primarily responsible for the overall day-to-day management of our projects outside Hubei Province. Mr. Cui has over 14 years of experience in the wholesale market and commercial property industries. Mr. Cui received a diploma in motor vehicle manufacturing and maintenance from Jianghan University (江漢大學) in June 2000 and obtained his master’s degree in business administration from The Chinese University of Hong Kong in July 2014. Mr. Cui is the vice president of Zall Holdings Ltd., a company which is owned as to 99.95% by Mr. Yan Zhi.
INDEPENDENT NON-ExECUTIVE DIRECTORS
Mr. Cheung Ka Fai (張家輝), aged 44, was appointed as an independent non-executive Director on 20 June 2011. He is also the chairman of the audit committee and a member of the nomination committee and risk management committee. Mr. Cheung has over 20 years of experience in auditing, accounting and finance. Prior to joining the Group, Mr. Cheung worked as an auditor at Deloitte Touche Tohmatsu and served as the financial controller and company secretary of two companies listed on the GEM of the Hong Kong Stock Exchange. Mr. Cheung was the chief financial officer and company secretary of Huscoke Resources Holdings Limited, a company listed on the Main Board of the Hong Kong Stock Exchange from June 2008 to July 2012 and an executive director of Huscoke Resources Holdings Limited from October 2009 to July 2012. He has been serving as the chief financial officer of Bonjour Holdings Limited, a company listed on the Main Board of the Hong Kong Stock Exchange from August 2012 to present. Mr. Cheung is an associate member of the Hong Kong Institute of Certified Public Accountants and a fellow of the Association of Chartered Certified Accountants. He obtained a bachelor’s degree in accountancy from the Hong Kong Polytechnic University in November 1997 and a master’s degree in business administration from the University of Bradford in January 2008.
Mr. Wu Ying (吳鷹), aged 59, was appointed as an independent non-executive Director on 29 February 2016. He is also the chairman of the nomination committee and a member of the audit committee and remuneration committee of the Company. Mr. Wu is currently the chairman of China Capital Group since October 2008. Prior to joining China Capital Group, Mr. Wu served as chairman and chief executive officer of UTStarcom (China) Co. Ltd for 13 years. Mr. Wu has extensive experience in telecommunication industry and venture capital investment. Mr. Wu obtained his bachelor degree in electronic engineering from the Beijing University of Technology in 1982 and obtained his master degree in electronic engineering from the New Jersey Institute of Technology in 1988 and obtained doctor honoris causa from New Jersey Institute of Technology. Mr. Wu is currently an independent non-executive Director of Zhong An Online P & C Insurance Co., Ltd. (眾安在綫財產保險股份有限公司) which is listed on the Hong Kong Stock Exchange. In addition, Mr. Wu is chairman of the board of supervisors of Huayi Brothers Media Corporation Ltd. (華誼兄弟傳媒股份有限公司) which is listed on the Shenzhen Stock Exchange, chairman of ZJBC Information Technology Co., Ltd. (中嘉博創信息技術股份有限
Zall Smart Commerce Group Ltd. Annual Report 201824
Biographical Details of Directors andSenior Management
公司) which is listed on the Shenzhen Stock Exchange and a director of HyUnion Holding Co., Ltd. (海聯金匯科技股份有限公司) which is listed on the Shenzhen Stock Exchange. Mr. Wu was an independent director of TCL Corporation Ltd. (TCL集團股份有限公司), which is listed on the Shenzhen Stock Exchange, for the period from September 2014 to August 2017.
Mr. zhu zhengfu (朱征夫), aged 55, was appointed as an independent non-executive Director on 10 March 2017. He is also the chairman of the remuneration committee and risk management committee and a member of the audit committee of the Company. Mr. Zhu is currently a professional lawyer of Kunlun Law Firm (廣東東方崑崙律師事務所) and prior to that, Mr. Zhu was the deputy head of the Land Law Consultation Service Center of the Guangdong Province Land Resources Bureau (廣東省國土廳廣東地產法律諮詢服務中心) from 1995 to 1998, a partner at Guangdong Dalu Law Firm (廣東大陸律師事務所) from 1995 to 1998, the head of finance and real estate of Guangdong Economic Development Law Firm (廣州市經濟貿易律師事務所) from 1993 to 1995, and deputy department head of the economic development department of Wanbao Electronics Import and Export Co., Ltd. (萬寶電器進出口公司) from 1987 to 1993. Mr. Zhu is also an independent non-executive director of E Fund Management Co., Ltd. (易方達基金管理有限公司), an independent non-executive director of Dongjiang Environmental Co., Ltd. (東江環保股份有限公司), which is listed on the Hong Kong Stock Exchange, an independent non-executive director of Guangzhou Guangdong Daily Media Co., Ltd. (廣東廣州日報傳媒股份有限公司) and Wuhan Sante Cableways Group Co. Ltd. (武漢三特索道集團股份有限公司) ,which are listed on the Shenzhen Stock Exchange, an independent non-executive director of Poly Real Estate Group Co., Ltd. (保利房地產集團股份有限公司), which is listed on the Shanghai Stock Exchange. He is a member of the supervisory committee of CSSC Offshore & Marine Engineering (Group) Company Limited (中船海洋與防務裝備股份有限公司), which is listed on the Shanghai Stock Exchange and an independent non-executive director of O Luxe Holdings Limited, which is listed on the Hong Kong Stock Exchange for the period from May 2015 to November 2017. Mr. Zhu is also an independent non-executive director of Chong Kin Group Holdings Limited (創建集團(控股)有限公司), which is listed on the Hong Kong Stock Exchange, since 5 January 2018. He previously acted as an independent non-exeuctive director of Beijing Honggao Creative Construction Design Co., Ltd, (北京弘高創意建築設計股份有限公司), which is listed on the Shenzhen Stock Exchange, for the period from November 2014 to April 2018. Mr. Zhu is also a member of the National Committee of the Chinese People’s Political Consultative Conference and the vice president of the All China Lawyers Association. He graduated from Wuhan University with a PhD in International Economics Law in 1999 and holds a professional lawyer’s certificate issued by the Ministry of Justice of the People’s Republic of China.
SENIOR MANAGEMENT
Mr. Yan Zhi (閻志), Mr. Qi Zhiping (齊志平), Mr. Cui Jinfeng (崔錦鋒) also serve as senior management of our group, please refer to their biographical details as set out under the section of Executive Directors.
Mr. zhu Guo Hui (朱國輝), aged 42, is the chief financial officer of the Company. Mr. Zhu joined the Group in August 2014 and is primarily responsible for the financial management and capital market of the Company. Mr. Zhu possesses over 18 years of experience in the capital markets of Hong Kong and Mainland China. Prior to joining of the Company, Mr. Zhu has worked in various financial institutions including Credit Suisse, Value Partners Group, a company listed on the Main Board of the Hong Kong Stock Exchange (Stock Code: 806) and BNP Paribas in connection with transactions on initial public offering, merger and acquisition, direct investment and corporate financing. Mr. Zhu holds a bachelor’s degree in economics from The Central University of Finance and Economics and a master’s degree in international business administration from The University of Hong Kong.
Mr. Li Bin (李斌 ), aged 48, is the vice president of the Group and the president of North Hankou Group Co., Ltd.. Mr. Li is overall in charge of marketing, day-to-day operational management, property management and brand enhancement of North Hankou International Trade Centre. Mr. Li has over 19 years of experience in property management and market management. Mr. Li joined the Group in July 2007 as the general manager of Wuhan North Hankou Market Management Co., Ltd. and has held various positions within the Group. From May 1999 to June 2007, Mr. Li was manager of the property management department of Meijia Property Management (Wuhan) Co., Ltd. (美佳物業管理(深圳)有限公司武漢分公司 ). Mr. Li received a diploma in Chinese language and literature education from Hubei University (湖北大學 ) in 1995.

25Annual Report 2018 Zall Smart Commerce Group Ltd.
Biographical Details of Directors andSenior Management
Ms. Min xueqin (閔雪琴), aged 35, has over nine years of experience in the commercial property and wholesale shopping mall industries. She is the deputy general manager of North Hankou Group Co., Ltd. and the vice president of the Group. She is responsible for the Group’s administrative and finance issues. Ms. Min joined the Group in 2008 and is primarily responsible for the service management and financing of North Hankou International Trade Center. Since 2018, Ms. Min has served as the vice president of Zall Holdings Limited, being a company in which Mr. Yan Zhi, an executive Director, the co-chief executive officer of the Company and co-chairman of the Board, holds 99.95% shareholding, and as a director of Wuhan Z-Bank Ltd.* (武漢眾邦銀行有限公司), being a company which is held as to 30% by Zall Holdings Limited. Ms. Min was appointed as the vice president of the 7th Hubei Young Entrepreneurs Association* (湖北省青年企業家協會) in 2017. Ms. Min obtained a diploma in electronic commerce from Zhongnan University of Economics and Law (中南財經政法大學) in 2006. She enrolled in a course for obtaining an executive master of business administration degree at Wuhan University (武漢大學) since 2013.
Mr. Yu Wei (余偉 ), aged 36, is the vice president of the Group and the general manager of Zallsoon Information Technology (Wuhan) Co., Ltd. (卓集送資訊科技(武漢)有限公司 ). Mr. Yu joined the Group in October 2015 and is primarily responsible for the Zallsoon urban delivery and long-distance trunk logistics, and the operation and day-to-day management of Commodities Intelligence Centre Pte. Ltd., CIC. He joined the Group in 2015 and a founding member of Zall Cloud Market. He is primarily responsible for the internet logistics platform team building and daily operation management. Prior to joining the Group, he has founded the first generation of local car travelling brand in 2012. Mr. Yu has engaged in sectors such as automobile, financing, travelling, internet logistics and international commodities trading for over 14 years. Mr. Yu obtained his bachelor degree in business administration from Wuhan Polytechnic University in 2006 and obtained master degree in Executive Master of Business Administration (EMBA) from China Europe International Business School in 2013.
Mr. Sun Wei (孫煒), aged 41, is a senior economist and the CEO of Shenzhen Sinoagri, a subsidiary of the Group. Mr. Sun joined the Group in June 2017 upon the acquisition of 50.6% equity interest in Shenzhen Sinoagri by the Group and is primarily responsible for the coordination of Shenzhen Sinoagri’s comprehensive management, research and development of software technology and decision-making and management of investment projects. Mr. Sun Wei established Shenzhen Sinoagri in 2010 and obtained rich practical experience and innovative achievements in the fields of capital operation, e-commerce and research and development of technology. Mr. Sun obtained a bachelor’s degree in material forming and control engineering from Xi’an Jiaotong University in 2000, a master’s degree in management science and engineering from Xi’an Jiaotong University in 2004 and a master degree in management in Executive Master of Business Administration (EMBA) from China Europe International Business School in 2015.
Mr. zhi Jianpeng (智建鵬), aged 47, is the founder and chairman of HSH, a subsidiary of the Group. Mr. Zhi joined the Group in March 2018 upon the acquisition of 52.48% equity interest in HSH by the Group. Mr. Zhi is primarily responsible for HSH’s overall strategic planning, business model and business execution. Mr. Zhi founded the HSH in 2014 and HSH was successively invested by China Renaissance K2 Venture (險峰華興), Northern Light Venture Capital (北極光), SIG Venture Capital Investment and was acquired by Zall Smart Commerce in 2018. Mr. Zhi has worked in HC360.com and has thorough understanding and extensive experience in corporate services and B2B. Mr. Zhi obtained a degree in chemical engineering from Taiyuan University of Technology in 1996 and a master degree in Executive Master of Business Administration (EMBA) from China Europe International Business School in 2018.
Mr. Pan Fujie (潘富傑), aged 41, is the CEO of Shanghai Zall Steel E-commerce Co., Ltd., a black bulk commodities industry online platform and a subsidiary of the Group. Mr. Pan joined the Group in March 2018 upon the establishment of Zall Steel in joint ventures by the Group and Xiben New Line and is primarily responsible for setting strategic objectives of the Company, business model innovation and daily operation management. Mr. Pan has nearly 20 years of experience in operations, management and investment in the domestic and foreign trading sector of black commodities such as steel, coal and mineral products, as well as years of experience in industrial internet innovation and practice. He has strategic planning, management and organizational leadership capabilities for large enterprises. Mr. Pan obtained a bachelor’s degree in material management and engineering from Northern Jiaotong University (北方交通大學) in 1998, a MBA degree from Tsinghua University School of Economics and Management in 2009, and a master’s degree in finance from Peking University School of Economics in 2017.
Zall Smart Commerce Group Ltd. Annual Report 201826
Report of the Directors
The Board is pleased to present its report together with the audited consolidated financial statements of the Group for the year ended 31 December 2018.
GENERAL INFORMATION
The Company was incorporated in the Cayman Islands on 22 September 2010 as an exempted company with limited liability under the Companies Law, Cap. 22 (Law 3 of 1961, as consolidated and revised) of the Cayman Islands.
PRINCIPAL ACTIVITIES
The principal activity of the Company is investment holding. Details of the principal activities of its subsidiaries are set out in note 14 to the consolidated financial statements. Save for the business transformation provided in the section headed “Management Discussion and Analysis” of this annual report, there were no significant changes in the nature of the Group’s principal activities during the year under review.
CHANGE OF COMPANY NAME
The change of English name of the Company from “Zall Group Ltd.” to “Zall Smart Commerce Group Ltd. ”, and adoption of “卓爾智聯集團有限公司” to replace “卓爾集團股份有限公司” as Chinese name of the Company (the “Change of Company Name”) was approved by the shareholders of the Company at the annual general meeting held on 30 May 2018. The Certificate of Incorporation on Change of Name of the Company was issued by the Registrar of Companies in Cayman Islands on 30 May, 2018 and the Certificate of Registration of Alternation of Name of Registered Non-Hong Kong Company was issued by the Registrar of Companies in Hong Kong on 20 June 2018. The stock short names of the Company for trading in the shares of the Company on The Stock Exchange of Hong Kong Limited (the “Stock Exchange”) were changed from “Zall Group” to “Zall Smartcom” in English and from “卓爾集團” to “卓爾智聯” in Chinese on 3 July 2018. The stock code of the Company remains unchanged as “2098”.
BUSINESS REVIEW AND PERFORMANCE
A review of the business of the Group and a discussion and analysis of the Group’s performance during the year under review and a discussion on the Group’s future business development and outlook of the Company’s business, possible risks and uncertainties that the Group may be facing and important events affecting the Company occurred during the year ended 31 December 2018 are provided in the section headed “Chairman’s Statement” on pages 5 to 9 and the section headed “Management Discussion and Analysis” on pages 10 to 21 of this annual report. An account of the Company’s relationships with its key stakeholders is included in the paragraph headed “Relationships with Employees, Suppliers and Customers” of the report of the Directors on page 32 of this annual report.
An analysis of the Group’s performance during the year ended 31 December 2018 using financial performance indicators is provided in the section headed “Management Discussion and Analysis” on pages 10 to 21 of this annual report.
In addition, details regarding the Group’s performance by reference to environmental and social-related key performance indicators and policies, as well as compliance with relevant laws and regulations which have a significant impact on the Company will be provided in the Environmental, Social and Governance Report which will be published on the websites of the Company and the Stock Exchange within three months after the publication of this annual report.
RESULTS AND DISTRIBUTION
The profit of the Group for the year ended 31 December 2018 are set out in the consolidated statement of profit or loss on page 63.
The Board does not recommend the payment of a final dividend for the year ended 31 December 2018 (corresponding period in 2017: HK2.58 cents per share).

27Annual Report 2018 Zall Smart Commerce Group Ltd.
Report of the Directors
FINANCIAL STATEMENTS
The profit of the Group for the year ended 31 December 2018 and the state of the Company’s and the Group’s affairs as at that date are set out on pages 63 to 200.
RESERVES
Movements in the reserves of the Group during the year ended 31 December 2018 is set out on pages 67 to 68.
DISTRIBUTABLE RESERVES
As at 31 December 2018, the Company’s reserves available for distribution, calculated in accordance with the Companies Law, Chapter 22 (Law 3 of 1961, as consolidated and revised) of the Cayman Islands, amounted to approximately RMB3,882 million (2017: RMB4,037million). The Board does not propose the payment of dividend for the year ended 31 December 2018. (2017: HK$300 million).
GROUP FINANCIAL SUMMARY
The results, assets and liabilities of the Group for the last five financial years are summarized on page 204 of this annual report.
SHARE CAPITAL
Changes in share capital of the Company for the year ended 31 December 2018 and as at that date are set out in note 29 to the consolidated financial statements.
PRE-EMPTIVE RIGHTS
There is no provision for pre-emptive rights under the articles of association of the Company (the “Articles”) or the laws of Cayman Islands, which would oblige the Company to offer new shares to existing shareholders on a pro-rata basis.
TAx RELIEF AND ExEMPTION
The Directors are not aware of any tax relief and exemption available to shareholders by reason of their holding of the Company’s securities.
SHARE OPTION SCHEME
Pursuant to the sole shareholder’s resolutions of the Company on 20 June 2011, the Company has adopted a Share Option Scheme for the purpose of providing incentives and rewards to eligible participants who contribute to the success of the Group’s operations.
Zall Smart Commerce Group Ltd. Annual Report 201828
Report of the Directors
The following is a summary of the principal terms of the Share Option Scheme:
1. Purpose of the Share Option Scheme
The Share Option Scheme is established to recognize and acknowledge the contributions of the Eligible Participants (as defined in paragraph 2 below) had or may have made to the Group. The Share Option Scheme will provide the Eligible Participants (as defined below) an opportunity to have a personal stake in the Company with the view to achieving the following objectives:
(i) motivate the Eligible Participants to optimize their performance efficiency for the benefit of the Group; and
(ii) attract and retain or otherwise maintain on-going business relationship with the Eligible Participants whose contributions are or will be beneficial to the long-term growth of the Group.
2. Participants of the Share Option Scheme
The Board may, at its discretion, offer to grant an option to the following persons (collectively, the “Eligible Participants”) to subscribe for such number of new shares as the Board may determine:
(i) any full-time or part-time employees, executives or officers of the Company or any of its subsidiaries;
(ii) any Directors (including non-executive Directors and independent non-executive Directors) of the Company or any of its subsidiaries; and
(iii) any advisors, consultants, suppliers, customers, agents and such other persons who in the sole opinion of the Board will contribute or have contributed to the Company or any of its subsidiaries.
3. Total number of shares available for issue under the Share Option Scheme
The maximum number of shares which may be issued upon exercise of options which may be granted under the Share Option Scheme shall not in aggregate exceed 1,050,000,000 shares, after the Share Subdivision effective from 19 October 2015, representing approximately 8.99% of the issued shares of the Company as at the date of this report. As at the date of this report, the number of shares available for issue under the Share Option Scheme (excluding those under share options granted but not exercised) amounted to 954,332,050 shares, representing approximately 8.2% of the issued shares of the Company.
4. Maximum entitlement of each participant under the Share Option Scheme
The total number of shares issued and which may fall to be issued upon exercise of the options granted under the Share Option Scheme and any other share option schemes of the Company (including both exercised and outstanding options) to each Eligible Participant in any 12-month period up to the date of grant shall not exceed 1% of the shares in issue as at the date of grant. Any further grant of options in excess of this 1% limit shall be subject to:
(i) the issue of a circular by the Company containing the identity of the Eligible Participant, the numbers of and terms of the options to be granted (and options previously granted to such participant) the information as required under Rules 17.02(2)(d) and the disclaimer required under 17.02(4) of the Rules Governing the Listing of Securities on the Stock Exchange (the “Listing Rules”); and
(ii) the approval of the shareholders in general meeting and/or other requirements prescribed under the Listing Rules from time to time with such Eligible Participant and his associates (as defined in the Listing Rules) abstaining from voting.
29Annual Report 2018 Zall Smart Commerce Group Ltd.
Report of the Directors
5. The period within which the shares must be exercised under the Share Option Scheme
An option may be exercised at any time during a period to be determined and notified by the Directors to each grantee, but shall not be more than 10 years from the date of grant of options subject to the provisions for early termination set out in the Share Option Scheme.
6. The minimum period for which an option must be held before it can be exercised
There is no minimum period for which an option granted must be held before it can be exercised except otherwise imposed by the Directors.
7. The amount payable on application or acceptance of the option and the period within which payments or calls must or may be made, or loans for such purposes must be paid
Options granted must be taken up within 21 days of the date of offer, upon payment of HK$1 per grant.
8. The basis of determining the exercise price
The exercise price shall be determined by the Board but shall not be less than the highest of (i) the closing price of the ordinary shares as stated in the Stock Exchange’s daily quotation sheets on the date of grant of options, which must be a trading day, (ii) the average closing price of the ordinary shares as stated in the Stock Exchange’s daily quotation sheets for the five business days immediately preceding the date of grant of options; and (iii) the nominal value of an ordinary share.
9. The remaining life of the Share Option Scheme
The Share Option Scheme will remain in force for a period of 10 years, commencing on 20 June 2011.

Zall Smart Commerce Group Ltd. Annual Report 201830
Report of the Directors
10. Movement of Share Options during the year under review
Particulars of share options under the Share Option Scheme (the “Share Option”) outstanding at the beginning and at the end of the financial year ended 31 December 2018 and Share Options granted, exercised, cancelled or lapsed during the financial year ended 31 December 2018 are as follows:
Category of participant
Date ofGrant
Exercise priceper share
Vesting date andexercise period
Balance as at1 January
2018
Grantedduring
the year
Exercisedduring
the year
Cancelled during
the year
Lapsed during
the year
Balance as at 31 December
2018
Price per Share
immediately before the
date of grant
Price perShare on
exercise date Directors:Mr. Qi Zhiping 22 December
2017HK$8.48 From the date when the
exercise conditions are met to 21 December 2027
(Note 1)
2,283,398 -Nil- -Nil- -Nil- -Nil- 2,283,398 HK$8.46 N/A(Note 4)
4 September2018
HK$6.66 (Note 2) -Nil- 3,000,000(Note 3)
-Nil- -Nil- -Nil- 3,000,000 HK$6.52 N/A(Note 4)
Spouse ofMr. Qi Ziping
22 December2017
HK$8.48 From the date when the exercise conditions are met
to 21 December 2027 (Note 1)
41,101,154 -Nil- -Nil- -Nil- -Nil- 41,101,154 HK$8.46 N/A(Note 4)
Mr. Cui Jinfeng 4 September
2018HK$6.66 (Note 2) -Nil- 2,000,000
(Note 3)-Nil- -Nil- -Nil- 2,000,000 HK$6.52 N/A
(Note 4) Employees of the Group
22 December2017
HK$8.48 From the date when the exercise conditions are met
to 21 December 2027 (Note 1)
2,283,398 -Nil- -Nil- -Nil- -Nil- 2,283,398 HK$8.46 N/A(Note 4)
4 September2018
HK$6.66 (Note 2) -Nil- 45,000,000(Note 3)
-Nil- -Nil- (1,300,000) 43,700,000 HK$6.52 N/A(Note 4)
Total 45,667,950 50,000,000 (1,300,000) 94,367,950
Notes:
1. Such Share Options shall be exercisable upon fulfillment of certain financial performance targets set out in the respective letters of grant. For further details of the financial performance targets, please refer to the paragraph headed “Management Shares and Management Option” in the circular of the Company dated 15 February 2017.
2. Subject to fulfillment of certain financial performance targets set out in the respective letters of grant, these Share Options shall be exercisable in the following manner:
(i) the first 30% of the Share Options shall be exercisable by the grantee commencing from the first trading date after the 12-month period from the date of grant and ending on the last trading date of the 24-month period from the date of grant;

31Annual Report 2018 Zall Smart Commerce Group Ltd.
Report of the Directors
(ii) the second 30% of the Share Options shall be exercisable by the grantee commencing from the first trading date after the 24-month period from the date of grant and ending on the last trading date of the 36-month period from the date of grant; and
(iii) the remaining 40% of the Share Options shall be exercisable by the Grantee commencing from the first trading date after the 36-month period from the date of grant and ending on the last trading date of 48-month period from the date of grant.
3. The value of the Share Options granted during the financial year ended 31 December 2018 and the accounting policy adopted for the Share Options are set out in note 27 to the consolidated financial statements of the Company in this annual report.
4. No Share Options had been exercised during the financial year ended 31 December 2018.
Save as disclosed above, there were no outstanding Share Options at the beginning and/or at the end of the year ended 31 December 2018 and there were no other Share Options granted during the financial year ended 31 December 2018.
PERFORMANCE GUARANTEE IN RESPECT OF THE ACQUISITION OF SHENzHEN SINOAGRI
Reference is made to the circular of the Company dated 15 February 2017 (the “Shenzhen Sinoagri Acquisition Circular”) in relation to the acquisition of Shenzhen Sinoagri. Unless otherwise specified, capitalised terms used herein shall have the same meanings as those defined in the Shenzhen Sinoagri Acquisition Circular.
Pursuant to the Acquisition Agreement, the Performance Guarantee, together with the Lock-Up Undertaking as disclosed in the Shenzhen Sinoagri Acquisition Circular, provide the Company with a mechanism to adjust the Consideration following the completion of the Acquisition by reference to the actual performance of the Shenzhen Sinoagri for the next three or five (as the case may be) financial years from 2017 to 2021.
For the year ended 31 December 2018, the actual revenue and the actual net profit of Shenzhen Sinoagri amounted to approximately RMB35.0 billion and approximately RMB53.4 million respectively, which have not reached the Target Revenue and Target Net Profit for the financial year ended 31 December 2018 of RMB37.5 billion and RMB132 million as stated in the Acquisition Agreement respectively, and therefore the Performance Guarantee for the financial year 2018 has not been fulfilled and the Consideration will be adjusted according to the Acquisition Agreement and the Performance Guarantee set out in the Shenzhen Sinoagri Acquisition Circular.
MAJOR SUPPLIERS AND CUSTOMERS
During the year under review, the aggregate sales attributable to the Group’s five largest customers comprised approximately 23.9% (2017: 25.9%) of the Group’s total sales and the sales attributable to the Group’s largest customer were approximately 8.9% (2017: 9.8%) of the Group’s total sales.
The aggregate purchases during the year under review attributable to the Group’s five largest suppliers were approximately 24.2% (2017: 28.7%) of the Group’s total purchases; and the purchases attributable to the Group’s largest supplier were approximately 9.1% (2017: 9.0%) of the Group’s total purchases. Purchases of the Group include purchases which are required on a regular basis to enable the Group to continue to supply its customers. Accordingly, purchases include, but not limited to, land purchased from the government and the cost of construction materials, and goods purchased from suppliers.
To the best of the knowledge of the Directors, none of the Directors, their close associates or any shareholder which owns more than 5% of the Company’s issued share capital, had any interest in the share capital of any of the five largest customers and suppliers of the Group.
Zall Smart Commerce Group Ltd. Annual Report 201832
Report of the Directors
RELATIONSHIPS WITH EMPLOYEES, SUPPLIERS AND CUSTOMERS
The Group understands that employees are valuable assets. The Group provides competitive remuneration package to attract and motivate the employees. The Group regularly reviews the remuneration package of employees and makes necessary adjustments to conform to the market standard.
The Group’s business is built on a customer-oriented culture. The Group also understands that it is important to maintain good relationship with its suppliers and customers to fulfil its immediate and long-term goals. To maintain its market competitiveness within the industry, the Group aims at delivering constantly high standards and high quality products to its customers. During the year under review, there was no material and significant dispute between the Group and its suppliers and/or customers.
INTEREST-BEARING BORROWINGS
Particulars of interest-bearing borrowings of the Group as at 31 December 2018 are set out in note 25 to the consolidated financial statements.
DONATIONS
Charitable and other donations made by the Group during the year under review amounted to approximately RMB15 million (2017: NIL).
PROPERTY, PLANT AND EQUIPMENT
Details of the movements in property, plant and equipment of the Group during the year are set out in note 11 to the consolidated financial statements.
INVESTMENT PROPERTIES, PROPERTIES UNDER DEVELOPMENT AND COMPLETED PROPERTIES HELD FOR SALE
Details of the movements in the investment properties of the Group during the year are set out in note 10 to the consolidated financial statements. Particulars of investment properties, properties under development and completed properties held for sale are shown under the section of “Major Properties Information” on pages 201 to 203.
PURCHASE, SALE OR REDEMPTION OF LISTED SECURITIES OF THE COMPANY
During the year ended 31 December 2018, save as disclosed below, neither the Company nor any of its subsidiaries had purchased, sold or redeemed any of the Company’s listed securities.
ISSUE OF SHARES
As disclosed in the Shenzhen Sinoagri Acquisition Circular, the Company shall issue (i) 10,746,000 shares (being the Incentive Shares) to Mr. Wei Zhe, David (“Mr Wei”), an executive Director and the chief strategy officer of the Company pursuant to the service agreement dated 14 November 2016 between Mr. Wei and the Company; and (ii) 42,981,000 shares (being the VKC Consultancy Service Consideration Shares) to Vision Knight Capital Management Company Limited (“VKC”) pursuant to the consultancy agreement dated 14 November 2016 between VKC and the Company, upon satisfaction by Shenzhen Sinoagri and its subsidiaries (“Project Group”) of certain target performance for any of three financial years from 2017 to 2019.
On 8 May 2018, the Company has allotted and issued 10,746,000 shares and 42,981,000 shares of the Company to Mr. Wei and VKC respectively following satisfaction of the target performance of the Project Group for the financial year ended 31 December 2017.

33Annual Report 2018 Zall Smart Commerce Group Ltd.
Report of the Directors
DIRECTORS
The Directors who held office in the Company during the year and up to the date of this report are:
Executive Directors:Mr. Yan Zhi (Co-Chairman and Co-Chief Executive Officer) (re-designated as Co-Chief Executive Officer on 6 July 2018)Dr. Gang Yu (Co-Chairman)Mr. Wei Zhe, DavidMr. Qi Zhiping (Co-Chief Executive Officer) (appointed on 6 July 2018)Mr. Cui JinfengMr. Peng Chi (resigned on 6 July 2018)
Independent Non-Executive Directors:Mr. Cheung Ka FaiMr. Wu YingMr. Zhu Zhengfu
In accordance with article 84(1) of the Articles, at each annual general meeting, one-third of the Directors shall retire from office by rotation, accordingly each of Mr. Cui Jinfeng, Mr. Cheung Ka Fai and Mr. Zhu Zhengfu, will retire from the office of Director by rotation and, being eligible, offer themselves for re-election at the forthcoming annual general meeting of the Company to be held on 30 May 2019 (the “AGM”).
In accordance with article 83(3) of the Articles, Mr. Qi Zhiping, who was appointed by the Board during the year, shall retire from office at the AGM and, being eligible, offer himself for re-election.
DIRECTORS’ AND SENIOR MANAGEMENT’S BIOGRAPHIES
Biographical details of the Directors of the Company and the senior management of the Group are set out on pages 22 to 25 of this annual report.
CONFIRMATION OF INDEPENDENCE
The Company has received from each of its independent non-executive Directors an annual confirmation of his independence pursuant to Rule 3.13 of the Listing Rules and considers all the independent non-executive Directors to be independent.
CHANGE OF DIRECTORS’ INFORMATION
Upon specify enquiry by the Company and following confirmations from the Directors, save as otherwise set out in this report, there is no change in the information of the Directors required to be disclosed pursuant to Rule 13.51B(1) of the Listing Rules since 1 January 2018. The Directors’ updated information is set out below:
1. Mr. Yan Zhi was appointed as a member of National People’s Congress of the PRC in January 2018 and awarded a doctoral degree in Chinese History by Wuhan University in June 2018. Mr. Yan Zhi was appointed as the chairman of the board of LightInTheBox, a company listed on the New York Stock Exchange, with effect from 28 June 2018. Mr. Yan Zhi was appointed as a non-independent director and chairman of Wuhan Hanshang Group Co., Ltd. (武漢市漢商集團股份有限公司), a company listed on the Shanghai Stock Exchange in March 2019.
2. Dr. Gang Yu was appointed as an independent director of Baozun Inc., which is listed on Nasdaq Stock Market in April 2018. Dr. Gang Yu was appointed as a director of Midea Group Co., Ltd (美的集團股份有限公司), which is listed on Shenzhen Stock Exchange.
3. Mr. Wei Zhe, David was appointed as an independent director of OneSmart International Education Group Limited, which is listed on New York Stock Exchange, in March 2018. Mr. Wei Zhe, David was appointed as a non-executive director of Informa PLC, which is listed on the London Stock Exchange, in June 2018. In May 2018, Mr. Wei Zhe, David and a company controlled by Mr. Wei were granted 10,746,000 shares and 42,981,000 shares, respectively, by the Company upon satisfaction by Shenzhen Sinoagri, a subsidiary of the Company, of the target performance for the financial year ended 31 December 2017.
For details, please refer to the announcement of the Company dated 8 May 2018.
Zall Smart Commerce Group Ltd. Annual Report 201834
Report of the Directors
4. Mr. Qi Zhiping was appointed as an executive Director, the co-chief executive officer of the Company and a member of the remuneration committee of the Board with effect on 6 July 2018. Mr. Qi Zhiping was appointed as the chief executive officer and a director of LightInTheBox, a company listed on the New York Stock Exchange, with effect from 26 July 2018 and 17 August 2018, respectively. He ceased to act as the chief executive officer and was appointed as the vice chairman of the board of LightInTheBox, with effect from 16 November 2018.
5. Mr. Zhu Zhengfu resigned as an independent non-executive director of Beijing Honggao Creative. Construction Design Co., Ltd (北京弘高創意建築設計股份有限公司), a company listed on the Shenzhen Stock Exchange, with effect from 25 April 2018.
DIRECTORS’ SERVICE CONTRACTS
None of the Directors proposed for re-election at the forthcoming AGM has a service contract with any member of the Group which is not determinable by the Group within one year without payment of compensation (other than statutory compensation).
PERMITTED INDEMNITY PROVISION
Each Director or other officer of the Company shall be entitled to be indemnified and secured harmless out of the assets and profits of the Company from and against all actions, costs, charges, losses, damages and expenses which he or she may incur or sustain in or about the execution of the duties of his or her office or otherwise in relation thereto in accordance with the Articles. In addition, the Company has arranged appropriate directors’ and officers’ liability insurance cover for the Directors and officers of the Group.
DIRECTORS’ REMUNERATION
The remuneration committee of the Company (the “Remuneration Committee”) considers and recommends to the Board the remuneration and other benefits paid by the Company to the Directors, taking into consideration of the recent trend of labor market, the overall remuneration policy and structure of the Directors and senior management. The remuneration of all Directors is subject to regular monitoring by the Remuneration Committee to ensure that the levels of their remuneration and compensation are appropriate. Details of Directors’ remuneration are set out in note 7 to the consolidated financial statements.
INTERESTS IN TRANSACTIONS, ARRANGEMENTS AND CONTRACTS OF SIGNIFICANCE
Details of the continuing connected transactions and material related party transactions are disclosed in this report and in note 33 to the consolidated financial statements.
Save for the above, no transaction, arrangement or contract of significance in relation to the Group’s business to which the Company or any of its subsidiaries was a party to and in which a Director or an entity connected with a Director has a material interest in, whether directly or indirectly, or in relation to the provision of service to the Company or any of its subsidiaries by a controlling shareholder or any of its subsidiaries between the Company, or one of its subsidiary companies, and a controlling Shareholder or any of its subsidiaries, subsisted during or at the end of the financial year under review.
DIRECTORS’ INTERESTS IN COMPETING BUSINESS
None of the Directors held any interests in any competing business against the Company or any of its jointly controlled entities and subsidiaries during the year ended 31 December 2018.
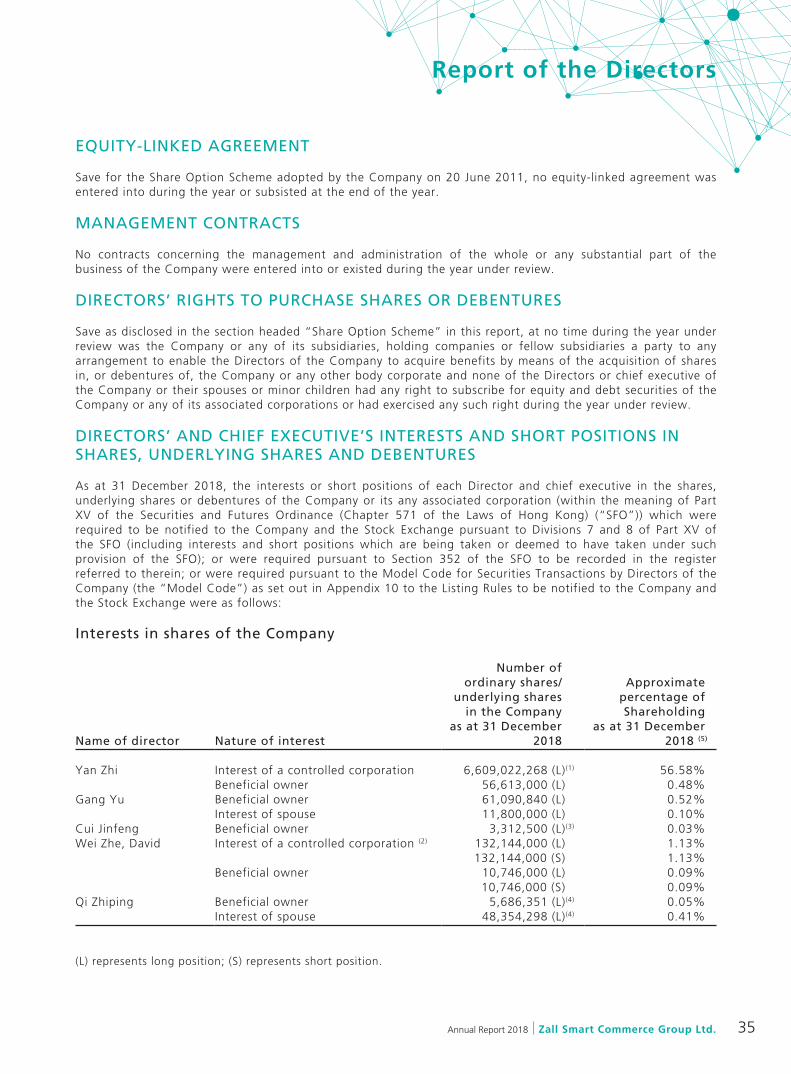
35Annual Report 2018 Zall Smart Commerce Group Ltd.
Report of the Directors
EQUITY-LINKED AGREEMENT
Save for the Share Option Scheme adopted by the Company on 20 June 2011, no equity-linked agreement was entered into during the year or subsisted at the end of the year.
MANAGEMENT CONTRACTS
No contracts concerning the management and administration of the whole or any substantial part of the business of the Company were entered into or existed during the year under review.
DIRECTORS’ RIGHTS TO PURCHASE SHARES OR DEBENTURES
Save as disclosed in the section headed “Share Option Scheme” in this report, at no time during the year under review was the Company or any of its subsidiaries, holding companies or fellow subsidiaries a party to any arrangement to enable the Directors of the Company to acquire benefits by means of the acquisition of shares in, or debentures of, the Company or any other body corporate and none of the Directors or chief executive of the Company or their spouses or minor children had any right to subscribe for equity and debt securities of the Company or any of its associated corporations or had exercised any such right during the year under review.
DIRECTORS’ AND CHIEF ExECUTIVE’S INTERESTS AND SHORT POSITIONS IN SHARES, UNDERLYING SHARES AND DEBENTURES
As at 31 December 2018, the interests or short positions of each Director and chief executive in the shares, underlying shares or debentures of the Company or its any associated corporation (within the meaning of Part XV of the Securities and Futures Ordinance (Chapter 571 of the Laws of Hong Kong) (“SFO”)) which were required to be notified to the Company and the Stock Exchange pursuant to Divisions 7 and 8 of Part XV of the SFO (including interests and short positions which are being taken or deemed to have taken under such provision of the SFO); or were required pursuant to Section 352 of the SFO to be recorded in the register referred to therein; or were required pursuant to the Model Code for Securities Transactions by Directors of the Company (the “Model Code”) as set out in Appendix 10 to the Listing Rules to be notified to the Company and the Stock Exchange were as follows:
Interests in shares of the Company
Name of director Nature of interest
Number of ordinary shares/
underlying shares in the Company
as at 31 December 2018
Approximate percentage ofShareholding
as at 31 December 2018 (5)
Yan Zhi Interest of a controlled corporation 6,609,022,268 (L)(1) 56.58%
Beneficial owner 56,613,000 (L) 0.48%Gang Yu Beneficial owner 61,090,840 (L) 0.52%
Interest of spouse 11,800,000 (L) 0.10%Cui Jinfeng Beneficial owner 3,312,500 (L)(3) 0.03%Wei Zhe, David Interest of a controlled corporation (2) 132,144,000 (L) 1.13%
132,144,000 (S) 1.13%Beneficial owner 10,746,000 (L) 0.09%
10,746,000 (S) 0.09%Qi Zhiping Beneficial owner 5,686,351 (L)(4) 0.05%
Interest of spouse 48,354,298 (L)(4) 0.41%
(L) represents long position; (S) represents short position.

Zall Smart Commerce Group Ltd. Annual Report 201836
Report of the Directors
Notes:
(1) The 6,609,022,268 shares are held by Zall Development Investment Company Limited (“Zall Development Investment”), a company which is wholly owned by Mr. Yan Zhi.
(2) The long and short positions in 89,163,000 shares are held by EJC Group Limited, a company which is indirectly owned as to 60% by Vision Knight Capital (China) Fund I, L.P., which is in turn indirectly owned as to 43.6% by Mr. Wei, and the long and short positions in 42,981,000 shares are held by Vision Knight Capital Management Limited, a company which is directly owned as to 99% by Mr. Wei.
(3) Out of these shares, there were 2,000,000 underlying shares held by Mr. Cui Jinfeng under unlisted physically settled derivative.
(4) Out of these shares, there were 5,283,398 underlying shares and 41,101,154 underlying shares held by Mr. Qi Zhiping and his spouse respectively under unlisted physically settled derivatives.
(5) The percentage represents the number of ordinary shares interested divided by the number of the Company’s issued shares as at 31 December 2018 (11,681,731,800 ordinary shares).
Save as disclosed above, as at 31 December 2018, none of the Directors or chief executive of the Company and their respective associates had or was deemed to have any interests or short positions in the shares, underlying shares or debentures of the Company or its associated corporations (within the meaning of Part XV of the SFO) as recorded in the register required to be maintained under section 352 of Part XV of the SFO or as otherwise notified to the Company and the Stock Exchange pursuant to the Model Code.
SUBSTANTIAL SHAREHOLDER(S)’ AND OTHER INTERESTS
So far as is known to any Director, as at 31 December 2018, the following persons (other than a Director or chief executive of the Company) had or deemed or taken to have an interest or short position in the shares or underlying shares of the Company that would fall to be disclosed to the Company under the provisions of Divisions 2 and 3 of Part XV of the SFO, or which were recorded in the register required to be kept by the Company under Section 336 of the SFO:
Name Nature of interest
Number of ordinary
shares/underlying shares held
as at 31 December 2018
Percentage of shareholding
as at 31 December 2018(3)
Substantial shareholderZall Development Investment Beneficial owner 6,609,022,268 (1) 56.58%
Other personsJi Changqun Interest in a controlled
corporation949,224,000 (2) 8.13%
Magnolia Wealth International Limited Interest in a controlled corporation
949,224,000 (2) 8.13%
Fullshare Holdings Limited Interest in a controlled corporation
949,224,000 (2) 8.13%
Rich Unicon Holdings Limited Beneficial owner 949,224,000 (2) 8.13%

37Annual Report 2018 Zall Smart Commerce Group Ltd.
Report of the Directors
Notes:
(1) Zall Development Investment is a company wholly-owned by Mr. Yan Zhi.
(2) The 949,244,000 shares are held by Rich Unicorn Holdings Limited, a company which is wholly owned by Fullshare Holdings Limited, which in turn is owned as to approximately 46.58% by Magnolia Wealth International Limited, which in turn is wholly owned by Mr.Ji Changqun.
(3) The percentage represents the number of ordinary shares interested divided by the number of the Company’s issued shares as at 31 December 2018 (11,681,731,800 ordinary shares).
All the interests disclosed above represent long positions in the shares of the Company.
Save as disclosed above, as at 31 December 2018, the Company had not been notified by any person, other than a Director or chief executive of the Company, who had interests or short positions in the shares or underlying shares of the Company which would fall to be disclosed to the Company under the provisions of Divisions 2 and 3 of Part XV of the SFO, or which were recorded in the register required to be kept by the Company under section 336 of the SFO.
SUFFICIENCY OF PUBLIC FLOAT
The Stock Exchange has exercised its discretion under Rule 8.08(1)(d) of the Listing Rules to accept a lower public float percentage of the Company of 15% and the Company, based on the information that is publicly available to the Company and within the knowledge of the Directors, has maintained sufficient public float of the Company’s securities as at the date of this report.
RETIREMENT BENEFIT PLANS
The Group participates in a Mandatory Provident Fund Scheme (“the MPF scheme”) under the Hong Kong Mandatory Provident Fund Schemes Ordinance for employees employed under the jurisdiction of the Hong Kong Employment Ordinance. The MPF scheme is a defined contribution retirement plan administered by independent trustees. Under the MPF scheme, the employer and its employees are each required to make contributions to the plan at 5% of the employees’ relevant income, subject to a cap of monthly relevant income of HK$30,000. Contributions to the plan vest immediately.
As stipulated by the regulations of the PRC, the Group participates in various defined contribution retirement plans organised by municipal and provincial governments for its employees. The Group is required to make contributions to the retirement plans at 19%-21% of the salaries, bonuses and certain allowances of the employees. A member of the plan is entitled to a pension equal to a fixed proportion of the salary prevailing at the member’s retirement date. The Group has no other material obligation for the payment of pension benefits associated with these plans beyond the annual contributions described above.
For the year ended 31 December 2018, the Group’s total contributions to the retirement schemes charged in the consolidated statement of profit or loss amounted to approximately RMB24.7 million (2017: approximately RMB15.6 million).
Zall Smart Commerce Group Ltd. Annual Report 201838
Report of the Directors
CONTINUING CONNECTED TRANSACTIONS
During the year ended 31 December 2018, the Group conducted the following continuing connected transactions:
(a) Lease agreement with Wuhan zall Yuexi Hotel Management Co., Ltd.* (武漢卓爾悅璽酒店管理有限公司(“Wuhan zall Yuexi”) dated 23 December 2016
On 23 December 2016, Zall Investment Group Co., Ltd.* (卓爾投資集團有限公司) (“Zall Investment Group”), a wholly-owned subsidiary of the Company, entered into a lease agreement (the “First Lease Agreement”) with Wuhan Zall Yuexi, pursuant to which Zall Investment Group agreed to lease certain premises located at No. 1 Enterprise Park, 1 Julong Boulevard, Panlong Economic Development District, Huangpi District, Wuhan, PRC* (武漢市黃陂區盤龍城經濟開發區巨龍大道特一號 No. 1 企業社區) with an area of 9,182.02 square meters to Wuhan Zall Yuexi at a monthly rent of RMB275,461 for a term of three years commencing from 1 January 2017 to 31 December 2019.
The rental fee received from Wuhan Zall Yuexi under the First Lease Agreement was determined on an arm’s length basis and with reference to the prevailing market rent at the time of the First Lease Agreement. The terms of the First Lease Agreement, including the rents received from Wuhan Zall Yuexi under the First Lease Agreement, were entered into on an arm’s length negotiations with reference to the prevailing market rent for comparable premises in the vicinity.
Wuhan Zall Yuexi is wholly owned by Wuhan Zall Culture & Tourism Group Ltd.*(武漢卓爾文旅集團有限公司) (“Wuhan Zall Culture & Tourism”), which is held as to 99.95% by Mr. Yan Zhi, the controlling Shareholder, the Co-Chairman and an executive Director of the Company. Accordingly, Wuhan Zall Yuexi is an associate of Mr. Yan Zhi and is therefore a connected person of the Company under the Listing Rules, and the entering into of the First Lease Agreement constitutes continuing connected transaction of the Company, in respect of which an announcement dated 23 December 2016 was published by the Company in compliance with Chapter 14A of the Listing Rules.
For the year ended 31 December 2018, the aggregate amount of the transactions under the First Lease Agreement amounted to approximately RMB3.3 million (2017: RMB3.3 million), which is within the annual cap of RMB3.3million.
(b) Lease agreement with Wuhan z-Bank Ltd.* (武漢眾邦銀行股份有限公司) (“Wuhan z-Bank”) dated 18 May 2017
On 18 May 2017, Wuhan North Hankou Trade Market Investment Co., Ltd.* (武漢漢口北商貿市場投資有限公司) (“North Hankou”), a wholly-owned subsidiary of the Company, entered into a lease agreement (the “Second Lease Agreement”) with Wuhan Z-Bank, pursuant to which North Hankou agreed to lease certain properties located at D2 North Hankou International Trade Centre, No. 88 North Hankou Road, Panlongcheng Economics and Technology Development Zone, Huangpi District, Wuhan, Hubei Province, PRC*(湖北省武漢市黃陂區盤龍城經濟開發區漢口北大道88號漢口北國際商品交易中心D2區 ) w i th an aggregate area of 4,897.5 square meters to Wuhan Z-Bank for a term of three years commencing from 18 May 2017 to 17 May 2020 at a monthly rent of RMB1,469,250 and monthly property management fee of RMB24,487.50. In 2018, North Hankou revised the lease agreement with Wuhan Z-Bank, of which the leased properties decreased to 3,360 square meters and the total rental fee for the year ended 31 December 2018 revised to RMB3,478,000.
The rental fee received from Wuhan Z-Bank under the Second Lease Agreement was determined on an arm’s length basis and with reference to the prevailing market rent at the time of the Second Lease Agreement. The terms of the Second Lease Agreement, including the rents received from Wuhan Z-Bank under the Second Lease Agreement, were entered into on an arm’s length negotiations with reference to the prevailing market rent for comparable premises in the vicinity.

39Annual Report 2018 Zall Smart Commerce Group Ltd.
Report of the Directors
Wuhan Z-Bank is directly owned as to 30% by Zall Holdings Ltd.* (卓爾控股有限公司), a company which is owned as to 99.95% by Mr. Yan Zhi. Accordingly, Wuhan Z-Bank is an associate of Mr. Yan Zhi and is therefore a connected person of the Company under the Listing Rules, and the entering into of the Second Lease Agreement constitutes continuing connected transaction of the Company, in respect of which an announcement dated 18 May 2017 was published by the Company in compliance with Chapter 14A of the Listing Rules.
For the year ended 31 December 2018, the aggregate amount received by the Group under the Second Lease Agreement amounted to approximately RMB3.5 million (2017: approximately RMB11.2 million), which is within the annual Cap of RMB17.9 million.
(c) Lease Agreement with Wuhan zall Yueting Hotel Co., Ltd.* (武漢卓爾悅廷酒店有限公司) (“Wuhan zall Yueting”) dated 3 November 2017
On 3 November 2017, North Hankou entered into a lease agreement (the “Third Lease Agreement”) with Wuhan Zall Yueting, pursuant to which North Hankou agreed to lease certain properties located at B-1 to 17th Floor, D2 of Foreign Trading Building, No.88 North Hankou Road, Panlongcheng, Huangpi District, Wuhan, Hubei Province, PRC* (中國湖北省武漢市黃坡區盤龍城漢口北大道88號外貿大廈D2棟負一層至十七層) with an aggregate area of 23,347.2 square meters to Wuhan Zall Yueting for a term of three years commencing from 3 November 2017 to 2 November 2020 at the following monthly rents and monthly property management fees:
• monthly rental of RMB2,334,720 andmonthly propertymanagement fee of RMB116,736 from 3November 2017 to 2 November 2018;
• monthly rental of RMB2,568,192 andmonthly propertymanagement fee of RMB116,736 from 3November 2018 to 2 November 2019; and
• monthly rental of RMB2,801,664 andmonthly propertymanagement fee of RMB116,736 from 3November 2019 to 2 November 2020.
The rental fee received from Wuhan Zall Yueting under the Third Lease Agreement was determined on an arm’s length basis and with reference to the prevailing market rent at the time of the Third Lease Agreement. The terms of the Third Lease Agreement, including the rents received from Wuhan Zall Yueting under the Third Lease Agreement, were entered into on an arm’s length negotiations with reference to the prevailing market rent for comparable premises in the vicinity.
Wuhan Zall Yueting is wholly owned by Wuhan Zall Culture & Tourism, which is held as to 99.95% by Mr. Yan Zhi. Accordingly, Wuhan Zall Yueting is an associate of Mr. Yan Zhi and is therefore a connected person of the Company under the Listing Rules, and the entering into of the Third Lease Agreement constitutes continuing connected transaction of the Company, in respect of which an announcement dated 3 November 2017 was published by the Company in compliance with Chapter 14A of the Listing Rules.
For the year ended 31 December 2018, the aggregate amount received by the Group under the Third Lease Agreement, amounted to approximately RMB29.9 million (2017: approximately RMB4.7 million), which is within the annual cap of approximately RMB29.9 million.
(d) Strategic Framework Agreement with Wuhan z-Bank dated 9 July 2018
On 9 July 2018, the Company entered into a strategic framework agreement (the “Framework Agreement”) with Wuhan Z-Bank in relation to (a) provision of bank deposits services by Wuhan Z-Bank to the Group; (b) provision of fund settlement, payment and other financial services by Wuhan Z-Bank to the Group; and (c) the Group referring customers to Wuhan Z-Bank for loan and credit facilities services.
Zall Smart Commerce Group Ltd. Annual Report 201840
Report of the Directors
The Framework Agreement was entered into for a term from 9 July 2018 to 31 December 2020 and the pricing arrangements for the above financial services are as follows:
(1) the interest rate for deposits placed by the Group with Z-Bank shall not be lower than the rate prescribed by The People’s Bank of China (“PBOC”) for the same type of deposit with similar terms and not lower than the interest rate for deposits of a similar nature provided to the Group by other independent commercial banks in the PRC;
(2) the services fees charged by Z-Bank for the provision of the fund settlement, payment and other financial services are determined according to the fee rates fixed by the PBOC or the China Banking Regulatory Commission and if such fixed fee rates are not available, the services fees are negotiated on arm’s length basis taking into account the market conditions and by reference to the fee rates charged by normal commercial banks in the PRC for comparable services; and
(3) the Group will not receive any fee from Z-Bank resulting from or in relation to members of the Group referring customers to Z-Bank.
Wuhan Z-Bank is directly owned as to 30% by Zall Holdings Ltd.* (卓爾控股有限公司), a company which is owned as to 99.95% by Mr. Yan Zhi. Accordingly, Wuhan Z-Bank is a connected person of the Company under the Listing Rules, and the entering into of the Strategic Framework Agreement constitutes continuing connected transaction of the Company, in respect of which an announcement dated 9 July 2018 was published by the Company in compliance with Chapter 14A of the Listing Rules.
For the year ended 31 December 2018, the maximum daily balance (including interests accrued thereon) of deposits placed by the Group with Z-Bank amounted to RMB407 million which is within the daily deposit cap of RMB1,000 million and there is no service fees payable by the Group to Z-Bank under the Framework Agreement which is within the annual cap of HK$3,000,000.
* The English translation of the Chinese names of the companies established in PRC is for illustration purpose only.
Confirmation by the independent non-executive Directors
The independent non-executive Directors have reviewed and confirmed that for the year ended 31 December 2018, the continuing connected transactions as set out above have been entered into by the Group:
(a) in the ordinary and usual course of business of the Group;
(b) on normal commercial terms or better; and
(c) according to the agreements governing them on terms that are fair and reasonable and in the interests of the Shareholders as a whole.
Confirmation by the auditor of the Company
Pursuant to Rule 14A.56 of the Listing Rules, the Company has engaged the Auditor of the Company to report on the continuing connected transactions of the Group in accordance with Hong Kong Standard on Assurance Engagements 3000 (Revised) “Assurance Engagements Other Than Audits or Reviews of Historical Financial Information” and with reference to Practice Note 740 “Auditor’s Letter on Continuing Connected Transactions under the Hong Kong Listing Rules” issued by the Hong Kong Institute of Certified Public Accountants. The Auditor have issued their unqualified letter containing their findings and conclusions in respect of the continuing connected transactions disclosed above by the Group in accordance with Rule 14A.56 of the Listing Rules. A copy of the auditors’ letter has been provided by the Company to the Stock Exchange.

41Annual Report 2018 Zall Smart Commerce Group Ltd.
Report of the Directors
RELATED PARTY TRANSACTIONS
Details of the material related party transactions undertaken during the year are set out in note 33 to the consolidated financial statements. For those related party transactions that constituted connected transactions or continuing connection transactions (as the case may be) (other than those described in the section above headed “Continuing Connected Transactions”), these transactions are exempt from the reporting, annual review, announcement and independent shareholders’ approval requirements under Chapter 14A of the Listing Rules.
CLOSURE OF REGISTER OF MEMBERS TO ASCERTAIN SHAREHOLDERS’ ENTITLEMENT TO ATTEND AND VOTE AT THE AGM
In order to determine who are eligible to attend and vote at the AGM, the Company’s register of members will be closed from Friday, 24 May 2019 to Thursday, 30 May 2019 (both days inclusive), during which no transfer of shares of the Company will be effected. In order to be qualified to attend and vote at the AGM, all completed transfer documents accompanied by the relevant share certificates must be lodged with the Company’s branch share registrar and transfer office in Hong Kong, Tricor Investor Services Limited, at Level 22, Hopewell Centre, 183 Queen’s Road East, Hong Kong for registration not later than 4:30 p.m. on Thursday, 23 May 2019.
AUDIT COMMITTEE
The Group’s annual report for the year ended 31 December 2018 has been reviewed by the audit committee of the Company (“Audit Committee”). Information on the work of Audit Committee and its composition are set out the Corporate Governance Report.
AUDITORS
The consolidated financial statements for the year ended 31 December 2018 were audited by KPMG.
KPMG will retire and, being eligible, offer themselves for re-appointment. A resolution for the re-appointment of KPMG as auditors of the Company is to be proposed at the forthcoming AGM.
By order of the BoardYan zhiCo-chairman
Hong Kong, 29 March 2019
Zall Smart Commerce Group Ltd. Annual Report 201842
Corporate Governance Report
The Board is pleased to present this Corporate Governance Report in the Group’s annual report for the year ended 31 December 2018.
COMPLIANCE WITH CODE ON CORPORATE GOVERNANCE PRACTICE
The Company is committed to the establishment of good corporate governance practices and procedures with a view to being a transparent and responsible organization which is open and accountable to the Company’s shareholders. The Board strives to adhere to the principles of corporate governance and has adopted sound corporate governance practices to meet the legal and commercial standards, focusing on areas such as internal control, fair disclosure and accountability to all shareholders to ensure the transparency and accountability of all operations of the Company. The Company believes that effective corporate governance is an essential factor to create more value for its shareholders. The Board will continue to review and improve the corporate governance practices of the Group from time to time to ensure that the Group is led by an effective Board in order to optimize return for shareholders of the Company.
The Company has adopted the Corporate Governance Code (the “CG Code”) as set out in Appendix 14 to the Listing Rules as its corporate governance code of practices upon the listing of its shares on the Stock Exchange. In the opinion of the Board, save for the deviation to code provision A.2.1 below, the Company had complied with the code provisions as set out in the CG Code throughout the year ended 31 December 2018.
Code Provision A.2.1
Under code provision A.2.1 of the CG Code, the roles of the chairman and chief executive officer should be separated and should not be performed by the same individual.
Before July 2018, Mr. Yan Zhi acted as the co-chairman of the Board and the chief executive officer of the Company. The Board believes that vesting the two roles in Mr. Yan Zhi provides the Company with strong and consistent leadership and facilitates the implementation and execution of the Group’s business strategies currently and in the foreseeable future. In July 2018, the Board has appointed Mr. Qi Zhiping as co-chief executive officer of the Company to share the responsibilities and obligations of the chief executive officer with Mr. Yan Zhi. Accordingly, Mr. Yan Zhi has been redesignated as the co-chief executive officer of the Company. The Company has therefore complied with the code provision A.2.1 since 6 July 2018. The Group will continue to review the structure from time to time and make necessary arrangement if appropriate.
THE BOARD
As at the date of this report, the Board consists of eight Directors, five of whom are executive Directors and three of whom are independent non-executive Directors. The composition of the Board is set out in the section headed “Corporate Information” on pages 2 and 3 of this annual report.
The functions and duties conferred on the Board include convening shareholders’ meetings and reporting on the work of the Board to the shareholders at shareholders’ meetings as may be required by applicable laws, implementing resolutions passed at shareholders’ meetings, determining the Company’s business plans and investment plans, formulating the Company’s annual budget and final accounts, formulating the Company’s proposals for dividend and bonus distributions, setting management targets and supervising the performance of management as well as exercising other powers, functions and duties as conferred on it by the Articles and applicable laws.
The senior management is delegated with the authority and responsibilities by the Board for the day-to-day management and operations of the Group.
43Annual Report 2018 Zall Smart Commerce Group Ltd.
Corporate Governance Report
The Board meets regularly to review the financial and operating performance of the Company, and considers and approves the overall strategies and policies of the Company. The composition of the Board is well balanced with the Directors having sound industry knowledge, extensive corporate and strategic planning experience and/or expertise relevant to the business of the Group. The executive Directors and independent non-executive Directors bring a variety of experience and expertise to the Company.
All Directors have separate and independent access to the Company’s senior management to fulfill their duties and, upon reasonable request, to seek independent professional advice in appropriate circumstances, at the Company’s expense. All Directors also have access to the company secretary who is responsible for ensuring that the Board procedures, and all applicable rules and regulations, are followed. An agenda and accompanying Board/committee papers are distributed to the Directors/Board committee members with reasonable notice in advance of the meetings. Minutes of Board meetings and meetings of Board committees, which record in sufficient detail the matters considered by the Board and decisions reached, including any concerns raised by Directors or dissenting views expressed, are kept by the company secretary and are open for inspection by Directors.
The Company has arranged appropriate and sufficient insurance coverage on Directors’ liabilities in respect of potential legal actions taken against Directors arising out of corporate activities.
According to the Articles, any Director appointed by the Board either to fill a casual vacancy or as an addition to the Board shall hold office only until the next following general meeting or the next following annual general meeting of the Company (as the case may be) and shall be eligible for re-election at that meeting. In addition, at each annual general meeting of the Company one-third of the Directors for the time being (or, if their number is not a multiple of three (3), the number nearest to but not less than one-third) shall retire from office by rotation provided that every Director shall be subject to retirement at least once every three years.
The biographical details of the current Board members are set out under the section headed “Biographical Details of Directors and Senior Management” on pages 22 to 25 of this annual report. Save as otherwise disclosed, there is no relationship (including financial, business, family or other material/relevant relationship) between any members of the Board.
The list of Directors (by category) is also disclosed in all corporate communications issued by the Company pursuant to the Listing Rules from time to time. The independent non-executive Directors are expressly identified in all corporate communications pursuant to the Listing Rules.
Independent non-executive Directors
Each of the independent non-executive Directors has entered into an appointment letter with the Company for a term of three years, subject to retirement by rotation in accordance with the Articles.
The Company has received an annual confirmation of independence from each of its independent non-executive Directors pursuant to Rule 3.13 of the Listing Rules. Based on the contents of such confirmation, the Company considers that the three independent non-executive Directors are independent and that they have met the specific independence guidelines as set out in Rule 3.13 of the Listing Rules.
During the year ended 31 December 2018, the Board at all times met the requirements of the Listing Rules relating to the appointment of at least three independent non-executive Directors with one of whom possessing appropriate professional qualifications or accounting or related financial management expertise.
BOARD COMMITTEES
As an integral part of sound corporate governance practices, the Board has established the following committees to oversee the particular aspects of the Group’s affairs. Each of these committees comprises Directors who are being invited to join as members. The terms of reference of all the committees as stated below are posted on the Company’s website and the Stock Exchange’s website.
Zall Smart Commerce Group Ltd. Annual Report 201844
Corporate Governance Report
AUDIT COMMITTEE
The Audit Committee has been established in compliance with Rule 3.21 and Rule 3.22 of the Listing Rules and with written terms of reference in compliance with the CG Code. The primary responsibilities of the Audit Committee are to review and monitor the financial reporting and internal control principles of the Company, and to assist the Board to fulfill its responsibilities over audit and to monitor and perform the corporate governance duties as set out in the CG Code.
The Audit Committee consists of three independent non-executive Directors: Mr. Cheung Ka Fai, Mr. Wu Ying and Mr. Zhu Zhengfu. Mr. Cheung Ka Fai serves as the chairman of the Audit Committee.
During the year ended 31 December 2018, the Audit Committee met two times and it has reviewed the Group’s consolidated financial statements for the six months ended 30 June 2018 and for the year ended 31 December 2017 and has also reviewed and confirmed the accounting principles and practices adopted by the Group and discussed the auditing, internal control and financial reporting matters.
CORPORATE GOVERNANCE FUNCTIONS
During the year under review, the Audit Committee is also responsible for determining the policy for the corporate governance of the Company performing the corporate governance duties as below:
• to develop and review the Group’s policies and practices on corporate governance and makerecommendations
• to reviewandmonitor the trainingandcontinuousprofessionaldevelopmentof thedirectorsand seniormanagement
• to review and monitor the Group’s policies and practices on compliance with all legal and regulatoryrequirements (where applicable)
• to develop, review and monitor the code of conduct and compliance manual (if any) applicable toemployees and directors of the Group
• to review the Group’s compliance with the CG Code and disclosure requirements in the CorporateGovernance
REMUNERATION COMMITTEE
The Remuneration Committee was established on 20 June 2011 with written terms of reference in compliance with the CG Code. The principal responsibilities of the Remuneration Committee are to formulate and recommend remuneration policy to the Board, to determine, with delegated responsibility, the remuneration of executive Directors and members of senior management, to review and approve performance-based remuneration by reference to corporate goals and objectives resolved by the Board from time to time and to make recommendations to the Board on the remuneration of non-executive Directors and other remuneration related issues. The Board expects the Remuneration Committee to exercise independent judgment and ensures that other Directors do not participate in the determination of their own remuneration.
The Remuneration Committee consists of two independent non-executive Directors, Mr. Zhu Zhengfu and Mr. Wu Ying, and one executive Director, Mr. Qi Zhiping (appointed as a member of the Remuneration Committee on 6 July 2018). Mr. Zhu Zhengfu serves as the chairman of the Remuneration Committee. Mr. Peng Chi resigned as a member of the Remuneration Committee with effect from on 6 July 2018.
The remuneration policy of the Group is to provide remuneration packages, in terms of basic salary, short-term bonuses and long-term rewards such as options, so as to attract and retain top quality staff. The Remuneration Committee reviews such packages annually, or when the occasion requires.

45Annual Report 2018 Zall Smart Commerce Group Ltd.
Corporate Governance Report
During the year, the Remuneration Committee met once to review the remuneration policy of the Company, including the structure and level of remuneration payable to the Directors and senior management of the Company.
In addition, the Remuneration Committee has resolved by written resolutions in lieu of meeting to recommend to the Board for approval the service contract and the terms of remuneration for the appointment of Mr. Qi Zhiping as executive Director and Co-chief Executive Officer of the Company, and the grant of share options to two executive Directors and other employees or eligible participants under the Company’s Share Option Scheme.
NOMINATION COMMITTEE
The nomination committee of the Company (the “Nomination Committee”) was established on 20 June 2011 with its written terms of reference in compliance with the CG code. The Nomination Committee is responsible for reviewing the structure, size and composition of the Board, making recommendation to the Board on selection of candidates for directorships, appointment, reappointment of Directors and Board succession and assessing the independence of independent non-executive Directors. When considering the suitability of a candidate for directorship, the Nomination Committee also considered the “Board Diversity Policy” adopted by the Board on 30 August 2013 and the requirements under the Listing Rules. In considering the diversity of the Board, aspects including, but not limited to, gender, age, cultural and educational background, professional experience, skills and knowledge were considered. Based on the above criteria, the Nomination Committee has reviewed the composition of the Board and confirmed that the existing Board was appropriately structured and no change was required.
The Nomination Committee consists of two independent non-executive Directors: Mr. Wu Ying, and Mr. Cheung Ka Fai and one executive Director, Mr. Yan Zhi. Mr. Wu Ying serves as the chairman of the Nomination Committee.
During the year, the Nomination Committee met once to review the structure, size and composition of the Board and considered that the current Board consists of a diverse mix of members appropriate to the requirements of the businesses of the Company. It has also considered and recommended to the Board for approval the list of retiring Directors for re-election at the 2018 annual general meeting of the Company.
In addition, the Nomination Committee has resolved by written resolutions in lieu of meeting to recommend to the Board for approval the appointment of Mr. Qi Zhiping as executive Director, co-chief executive and member of the Remuneration Committee of the Company after consideration of a range of diversity perspectives.
Board Diversity
The Company adopted a board diversity policy (“Board Diversity Policy”) which sets out the approach to achieve and maintain diversity of the Board. Pursuant to the Board Diversity Policy, the Company seeks to achieve Board diversity through the consideration of a number of factors including but not limited to, gender, age, culture, educational background, professional experience, skills, knowledge, length of service and other qualities. The ultimate selection decision will be based on merit and contribution that the selected candidates shall bring to the Board. The Nomination Committee monitors, from time to time, the implementation of the policy, and reviews, as appropriate, the policy to ensure the effectiveness of the policy.
Nomination Policy
The Company adopted a nomination policy (“Nomination Policy”) which sets out, inter alia, the criteria, process and procedures in nominating and selecting candidates to be appointed or re-appointed as Directors. In the nomination and selection of new Directors, the Nomination Committee assesses the key attributes that an incoming Director should have, based on attributes of the existing Board and the requirements of the Group. After endorsement by the Board of the key attributes, the Nomination Committee and/or the Board will nominate potential candidates for appointment as new Directors. In the nomination process, each Director candidate shall be considered upon evaluation against the selection criteria. External agencies and/or advisors may also be appointed to assist in the search process where necessary. New Directors are appointed by the Board, after the Nomination Committee has evaluated and approved their nominations.

Zall Smart Commerce Group Ltd. Annual Report 201846
Corporate Governance Report
The Nomination Policy shall also be governed by other additional and relevant requirements under the Articles and the Listing Rules applicable to the nomination, appointment, election and re-election of Directors.
RISK MANAGEMENT COMMITTEE
The risk management committee of the Company (“Risk Management Committee”) was established on 31 March 2017 with written terms of reference in compliance with the CG Code. The purpose of establishment of the Risk Management Committee is to identify, discuss, address and review any risk or potential risk of the Company and advise the Board of the overall risk management strategies of the Company. Mr. Zhu Zhengfu, an independent non-executive Director, has been appointed as the chairman of the Risk Management Committee and Mr. Cui Jinfeng, an executive Director and Mr. Cheung Ka Fai, an independent non-executive Director, have been appointed as members of the Risk Management Committee, all with effect from 31 March 2017. The committee is responsible for advising the Board on the overall risk appetite/tolerance, risk management strategies and internal control of the Company and its subsidiaries and overseeing senior management’s implementation of those strategies established and approved by the Board and providing an independent review of the effectiveness of the strategies adopted to ensure that it aligned with the Company’s overall business objectives.
During the year, the Risk Management Committee met once to review and assess the adequacy and effectiveness of the risk management and internal control systems of the Group, and recommend to the Board for the approval of the risk management report for the year ended 31 December 2017.
NUMBER OF MEETINGS AND DIRECTORS’ ATTENDANCE
The individual attendance record of each Director at the meetings of the Board, general meeting of the Company, Audit Committee, Remuneration Committee, Nomination Committee and Risk Management Committee for the year is set out below:
BoardMeeting
AuditCommittee
NominationCommittee
RemunerationCommittee
RiskManagement
Committee
AnnualGeneralMeeting
Extraordinary General Meeting
Executive DirectorsMr. Yan Zhi (Co-chairman and Co-chief executive officer) 4/4 N/A 1/1 N/A N/A 1/1 2/2Dr. Gang Yu (Co-chairman) 4/4 N/A N/A N/A N/A 1/1 2/2Mr. Wei Zhe, David 4/4 N/A N/A N/A N/A 1/1 2/2Mr. Cui Jinfeng 4/4 N/A N/A N/A 1/1 1/1 2/2Mr. Peng Chi (Note 1) 2/2 N/A N/A 1/1 N/A 1/1 2/2Mr. Qi Zhiping (Note 2) (Co-chief executive officer) 2/2 N/A N/A N/A N/A N/A N/A
Independent non-executive DirectorsMr. Cheung Kai Fai 4/4 2/2 1/1 N/A 1/1 1/1 2/2Mr. Wu Ying 4/4 2/2 1/1 1/1 N/A 1/1 2/2Mr. Zhu Zhengfu 4/4 2/2 N/A 1/1 1/1 1/1 2/2
Notes:
1. Mr. Peng Chi resigned as an executive Director with effect from 6 July 2018.
2. Mr. Qi Zhiping was appointed as an executive Director with effect from 6 July 2018.

47Annual Report 2018 Zall Smart Commerce Group Ltd.
Corporate Governance Report
DIRECTORS’ TRAINING
Directors must keep abreast of their collective responsibilities and are encouraged to participate in continuous professional development to develop and refresh their knowledge and skills. The Company would provide to each newly appointed Director or alternative Director an induction package covering the summary of the responsibilities and liabilities of a director of a Hong Kong listed company, the Group’s businesses and the statutory regulatory obligations of a director of a listed company as well as the Company’s constitutional documents to ensure that he/she is sufficiently aware of his/her responsibilities and obligations under the Listing Rules and other regulatory requirements. The Group also provided briefings and other trainings to develop and refresh the Directors’ knowledge and skills from time to time. Further, the Company continuously updates Directors on the latest developments regarding the Listing Rules and other applicable regulatory requirements, to ensure compliance and enhance their awareness of good corporate governance practices.
During the year ended 31 December 2018, the Company has provided the Directors with written training materials and/or updates covering topics of amendments to the Listing Rules, duties and responsibilities of Directors as well as corporate governance related matters relevant to their duties. All the Directors, namely Mr. Yan Zhi, Dr. Gang Yu, Mr. Wei Zhe, David, Mr. Cui Jinfeng, Mr. Peng Chi (resigned on 6 July 2018), Mr. Qi Zhiping, Mr. Cheung Ka Fai, Mr. Wu Ying, and Mr. Zhu Zhengfu have received the requisite training.
According to the training records maintained by the Company, the training programmes received by each of theDirectors during the financial year is summarised as follows:
Attendance/Number of
seminars Executive Directors:Mr. Yan Zhi 3/3Dr. Gang Yu 3/3Mr. Wei Zhe, David 3/3Mr. Qi Zhiping (appointed on 6 July 2018) 1/3Mr. Cui Jinfeng 3/3Mr. Peng Chi (resigned on 6 July 2018) 2/3
Independent Non-Executive Directors:Mr. Cheung Ka Fai 3/3Mr. Wu Ying 3/3Mr. Zhu Zhengfu 3/3
COMPLIANCE WITH MODEL CODE FOR SECURITIES TRANSACTIONS BY DIRECTORS
The Company has adopted the Model Code as the code for dealing in securities of the Company by the Directors. Having made specific enquiries with all Directors, all Directors have confirmed compliance with the required standards set out in the Model Code during the year ended 31 December 2018. Employees of the Group, who are likely to be in possession of unpublished inside information, have been requested to comply with provisions similar to those terms in the Model Code.
DIRECTORS’ RESPONSIBILITY FOR THE FINANCIAL STATEMENTS
The Directors acknowledge their responsibility for preparing the financial statements for the financial year ended 31 December 2018 which give a true and fair view of the state of affairs of the Company and of the Group at that date and of the Group’s results and cash flows for the year then ended and are properly prepared on the going concern basis in accordance with the applicable statutory requirements and accounting standards. The statement of the external auditors of the Company about their reporting responsibilities on the financial statements of the Company is set out in the “Independent Auditor’s Report” on pages 54 to 62 of this annual report.

Zall Smart Commerce Group Ltd. Annual Report 201848
Corporate Governance Report
AUDITORS’ REMUNERATION
For the year ended 31 December 2018, the remuneration paid or payable to the Group’s auditors, KPMG, Certified Public Accountants, in respect of their audit and non-audit services are as follows:
Items amount(RMB’000)
Audit services for 2018 4,900Non-audit services: – Other services –
RISK MANAGEMENT AND INTERNAL CONTROL
The Board has developed the Group’s internal control, risk assessment and management system and has overall responsibility for reviewing and maintaining an adequate and effective risk management and internal control system to safeguard the interests of the shareholders and the assets of the Group. It evaluates the effectiveness of the systems at least annually to ensure the adequacy of resources, staff qualifications and experience, training programmes and budget of the Group’s accounting internal audit and financial reporting functions. The Company engaged external consultant every year since 2016 to facilitate the review of the Group’s risk management and internal control system. The relevant person in charge followed up the consultant’s advices or recommendations so as to enhance the Group’s capability in risk management and internal control. The Company has reported the work status of risk assessment to the Audit Committee. In addition, to further enhance internal auditing monitor and improve internal auditing independence, the Group set up the auditing department in December 2017 which reports directly to the Audit Committee and is independent from the day-by-day operation of the Group. The Group also formulated the relevant system and procedures for internal auditing. The primary functions of auditing department include forming a complete internal auditing system, drafting the annual internal auditing plan for the Group and organizing auditing duties, performing regular auditing in respect of the Group’s principal operating business and reporting the results to the Board directly.
RISK MANAGEMENT AND INTERNAL CONTROL SYSTEMS
The Company’s risk management and internal control systems are designed to manage and mitigate risks, rather than eliminate risks, and can only provide reasonable and not absolute assurance against material misstatement or loss. We have employed a bottom-up approach for identification, assessment and mitigation of risk at all business unit levels and across functional areas.
MAIN FEATURES OF RISK MANAGEMENT AND INTERNAL CONTROL SYSTEMS
The key elements of the Company’s risk management and internal control systems include the establishment of a risk register to keep track of and document identified risks, the assessment and evaluation of risks, the development and continuous updating of responsive procedures, and the ongoing testing of internal control procedures to ensure their effectiveness. An ongoing risk management approach is adopted by the Company for identifying and assessing the key inherent risks that affect the achievements of its objectives. A risk matrix is adopted to determine risk rating (L = low risk, M = medium risk, H = high risk) after evaluation of the risk by the likelihood and the impact of the risk event. The risk ratings reflect the level of management attention and effort of risk treatment required.
PROCEDURES AND INTERNAL CONTROLS FOR THE HANDLING AND DISSEMINATION OF INSIDE INFORMATION
The Board has already established a policy on the procedures and internal controls for the handling and dissemination of inside information. The policy stipulated the duty and responsibility of inside information announcement, restriction on sharing non-public information, handling of rumours, unintentional selective disclosure, exemption and wavier to the disclosure of inside information, and also compliance and reporting procedures.

49Annual Report 2018 Zall Smart Commerce Group Ltd.
Corporate Governance Report
REVIEW OF RISK MANAGEMENT AND INTERNAL CONTROL SYSTEM
The Company has conducted an annual review of the effectiveness of the risk management and internal control systems of the Group for the year ended 31 December 2018, and considered the internal control of the Group is effective and adequate.
MANAGEMENT OF KEY RISKS
Through the process of risk identification and evaluation, certain key risks can be identified. The extent and importance of the impact of these risks vary according to changes in the external environment.
(1) Information system risk
As the Company continues to increase its efforts to develop online businesses and accelerate the evolution of online and offline integrated supply chain industries, informatization is a necessary means to help the Company achieve this goal and improve business operations efficiency. The business information stored in the information system is an important asset of the Company. Failure to establish system and information technology security strategies and corresponding control measures may lead to major information leakage incidents which in turn affect the reputation of the Company and customers’ confidence and result in compliance risks.
In response to information security risks, the Company has established adequate and appropriate internal management system to regulate information security related operations, including approval of information transfer and release; permission settings of information extraction, access and modification. Moreover, in addition to setting up a unified and professional information technology team to control information security, the Company also cooperates with leading enterprises in the network and information security management field to enhance the Group’s information systems and security strategies.
(2) Corporate culture
The Company has developed rapidly in recent years. The e-commerce strategies were achieved through including various online product platforms by way of mergers and acquisitions. In 2018, the Company acquired companies such as HSH, Haishangxian which gradually diversified its business. However, newly acquired subsidiaries from different backgrounds, regions and businesses possessed different cultures and values with the Company. Failure to shape the common values, codes of conduct and ethics from top to bottom in addition to system control may increase operational risk in each business process, which is unfavourable to the Company’s employees cohesiveness and would in turn adversely affect operational efficiency and unlikely to achieve strategic development.
Although corporate culture is invisible, it is an important factor of corporate management. In view of this, the management of the Company will gradually integrate with the acquired companies in the course of business and reach a conceptual consensus, thus forming a common recognized value and establishing a new common culture and corporate operation strategies to maximize profits and achieve long-term corporate development.
Zall Smart Commerce Group Ltd. Annual Report 201850
Corporate Governance Report
(3) Resource allocation risk
In recent years, the Company has accelerated its business layout in the e-commerce and financial sectors, acquired the largest online agricultural products trading platform in China, Shenzhen Sinoagri. HSH was also acquired and Zall Steel was established. Various supply chain management and trading companies were established to provide wholesale distribution, import and export and other supply chain management services for merchants. Combining with the large-scale offline real business and trade logistics market, the support of all relevant business ecosystems was promoted which formed a business relationship of mutual synergy, mutual support and common development. The reasonable layout in various industry sector resources of Zall Smart Commerce is particularly important for the balanced and rapid development of Zall Smart Commerce. If there is a lack of planning for the allocation of resources in each business segment, it may result in unbalanced resource input, unsynchronized capacity development and cask effects may surfaced which would affect the overall output effect of the resources invested and hinder business development.
The Company manages resource allocation risks mainly from three areas: human resources, internal funds and external financing. In terms of human resources, the Company builds the human resources team of different business segments based on its own development strategy and puts more targeted resources for talent training, thus promoting the rapid development of the Company. In terms of internal funds, the Company provides different levels of support and allocates resource based on the resources needs of its various subsidiaries, thus optimize the resource usage cycle. In terms of external financing, the Company will enhance its adoption of a more strategic capital and bond financing platform to optimize the capital usage cycle, thus to organize new capital structures to reduce overall risks.
(4) PR management risk
With the advent of the intelligent trading and industrial Internet era, the Company has gradually transformed into an intelligent trading ecosystem. Under the diversified development of the Company, macroeconomic and market changes, capital market volatility and pressure, the business management and PR crisis handling capabilities of the Company are facing new challenges. In the prospect of increased business and management complexity, the Company needs to further establish a PR crisis management and control mechanism to effectively communicate and coordinate with the Company’s internal, media and audiences when encountering problems, thereby mitigating the crisis and reducing PR risks that bring crises to reputation and brand image, thus minimizing the damage of interests.
In response to the relevant risks, the Company has established various targeted control measures, including establishing close and constant communication channels with customers to identify and deal with potential crises as early as possible, rectifying and optimizing crisis response mechanisms and processes based on past experience, establishing the internal crisis response team which is responsible for handling crisis events promptly and effectively, and establishing a unified PR crisis notification management mechanism at Group level to enhance the crisis response capability of the Company.
(5) Supply chain financial credit risk
Zall Jinfu, a subsidiary of the Company provides one-stop financial solutions including financial leasing, factoring and guarantee for trading platform users, and customize comprehensive financial services for customers based on their different financial needs. However, since the supply chain financial services is mainly targeting the SMEs customer base in the upstream and downstream of the industrial chain, the enterprise scale and risk defense capabilities of the customer are mixed which certain degree of credit risks exist. Therefore, the Company’s good and effective credit risk management and control mechanism is critical to the safety and stability of working capital.

51Annual Report 2018 Zall Smart Commerce Group Ltd.
Corporate Governance Report
In order to ensure the sustainable and healthy development of the supply chain financial business, the Company implements strict control over credit. The Company has established a suitable auditing mechanism covering customers’ credit and transaction structure to analyze and control transaction risks systematically and scientifically. In terms of financing projects, the Company approves financing projects based on strict customer evaluation standards to ensure that only customers with good business performance and financial stability can use financing services. In addition, the Company will only approve a financing project when the project’s revenue can fully cover the risk. The Company will continue to monitor the effectiveness of the above control mechanism and control credit risk to an acceptable level.
DEED OF NON-COMPETITION
The Company has received, from each of the controlling shareholders of the Company, an annual declaration on his/her/its compliance with the undertakings contained in the deed of non-competition (the “Deed of Non-Competition”) entered into by each of them in favour of the Company and the revised deed of non-competition (the “Revised Deed”) entered into by each of them in favour of the Company after restructuring pursuant to which each of the controlling shareholders of the Company has undertaken to the Company that he/she/it will not and will procure that his/her/its associates (other than members of the Group) not to, engage in any of our business including (without limitation), developing and operating large-scale, consumer product focused wholesale shopping malls in China.
The independent non-executive Directors have reviewed and were satisfied that each of the controlling shareholders of the Company has complied with the Deed of Non-Competition for the year ended 31 December 2018.
As further set out in the circular of the Company dated 31 December 2014 (the ”Restructuring Circular”), the Group previously carried out certain restructuring of its businesses (the “Restructuring”) to, among others, dispose of certain of its non-core businesses to its controlling shareholders. After the Restructuring and until the Group has disposed of or realised all its remaining non-core property projects, the business owned/controlled by the controlling shareholders may overlap with the business of the Group in terms of business nature (but not necessarily in direct competition). As such, a revised deed of non-competition dated 30 June 2015 (superseding the original deed of non-competition dated 20 June 2011) was entered into by the Company’s controlling shareholders in favour of the Company (as superseded, the “Deed of Non-Competition”), pursuant to which each of the controlling shareholders of the Company has undertaken to the Company that he/she/it will not and will procure that his/her/its associates (other than members of the Group) not to, engage in any of the Group’s businesses including (without limitation), developing and operating large-scale, consumer product focused wholesale shopping malls in China. As at 31 December 2018, except North Hankou Zall Life City – Phase II, all of the Remaining Non-core Projects (as defined in the Restructuring Circular) have been disposed. North Hankou Zall Life City – Phase II is a residential project with gross floor area of approximately 207,000 square meters in North Hankou region. As satisfiable profit and cash flow could be generated from this project, the Group has hold back the project and sold part of it based on the market circumstances. As at 31 December 2018, approximately 116,000 square meters was pre-sale and the construction is expected to be completed in 2019.
Further details of the Restructuring and the Deed of Non-Competition were disclosed in the Restructuring Circular.
DIVIDEND POLICY
The Company’s dividend policy aims to allow shareholders to participate in the Company’s profit and for the Company to retain adequate reserves for future growth. In proposing any dividend payout, the Company would consider various factors including (i) the Group’s actual and expected financial performance; (ii) general economic and financial conditions and other internal or external factors that may have an impact on the business or financial performance and position of the Group; (iii) the Group’s business and operating strategies including future cash commitments and investment needs in order to maintain long-term business growth; (iv) current and future business, liquidity position and capital requirements; and (v) any other factors that the Board deems appropriate.
Zall Smart Commerce Group Ltd. Annual Report 201852
Corporate Governance Report
COMPANY SECRETARY
The company secretary of the Company (the “Company Secretary”) is responsible for facilitating the Board’s processes and communications among Board members, and with the shareholders and advising the Board on all corporate governance matters.
Ms. Foo Man Yee of CS Legend Corporate Services Limited, an external services provider, has been appointed as the Company Secretary since from July 2018. Her primary contact persons at the Company are Mr. Zhu Guo Hui, the chief financial officer of the Company and Ms. Zhai Yangyang, the senior manager of legal and compliance.
During the year ended 31 December 2018, the Company Secretary has undertaken no less than 15 hours of relevant professional training in compliance with Rule 3.29 of the Listing Rules.
COMMUNICATION WITH SHAREHOLDERS
The Board recognizes the importance of maintaining a clear, timely and effective communication with the shareholders of the Company and investors. The Board also recognizes that effective communication with its investors is critical in establishing investor confidence and to attract new investors. Therefore, the Group is committed to maintaining a high degree of transparency to ensure the investors and the shareholders of the Company will receive accurate, clear, comprehensive and timely information of the Group through the publication of annual reports, interim reports, announcements and circulars. The Company also publishes all corporate communications on the Company’s website at www.zallcn.com. The Board maintains regular dialogues with institutional investors and analysts from time to time to keep them informed of the Group’s strategy, operations, management and plans. The Directors and members of various Board committees will attend the annual general meeting of the Company and answer any questions raised. The resolution of every important proposal will be proposed at general meetings separately. The chairman of general meetings of the Company would explain the procedures for conducting a poll before proposing a resolution for voting. The poll results will be announced at general meetings and published on the websites of the Stock Exchange and the Company, respectively. In addition, the Company regularly meets with institutional investors, financial analysts and financial media, and promptly releases information related to any significant progress of the Company, so as to promote the development of the Company through mutual and efficient communications.
SHAREHOLDER RIGHTS
Convening an extraordinary general meeting by shareholders
Procedures for shareholders to convene an extraordinary general meeting (including making proposals/moving a resolution at the extraordinary general meeting)
• Any one or more shareholders holding at the date of deposit of the requisition not less than one-tenthof the paid up capital of the Company carrying the right of voting at general meetings of the Company (the “Eligible Shareholder(s)”) shall at all times have the right, by written requisition to the Board or the Company Secretary, to require an extraordinary general meeting to be called by the Board for the transaction of any business specified in such requisition, including making proposals or moving a resolution at an extraordinary general meeting.
• Eligible Shareholders who wish to convene an extraordinary general meeting for the purpose of makingproposals or moving a resolution at an extraordinary general meeting must deposit a written requisition (the “Requisition”) signed by the Eligible Shareholder(s) concerned to the principal place of business of the Company in Hong Kong.
53Annual Report 2018 Zall Smart Commerce Group Ltd.
Corporate Governance Report
• The Requisition must state clearly the name of the Eligible Shareholder(s) concerned, his/her/theirshareholding in the Company, the reason(s) to convene an extraordinary general meeting, the agenda proposed to be included the details of the business(es) proposed to be transacted in the extraordinary general meeting, signed by the Eligible Shareholder(s) concerned.
• Ifwithin21daysof thedepositof theRequisition, theBoardhasnotadvised theEligibleShareholdersofany outcome to the contrary and fails to proceed to convene an extraordinary general meeting, the Eligible Shareholder(s) himself/herself/themselves may do so in accordance with the memorandum and articles of associations, and all reasonable expenses incurred by the Eligible Shareholder(s) concerned as a result of the failure of the Board shall be reimbursed to the Eligible Shareholder(s) concerned by the Company.
Making enquiry to the Board
Shareholders of the Company may send their enquiries and concerns to the Board by addressing them to the principal place of business of the Company in Hong Kong by post or email to [email protected].
INVESTOR RELATIONS
Investors Communication Policy
The Company regards the communication with institutional investors as important means to enhance the transparency of the Company and collect views and feedbacks from institutional investors. To promote effective communication, the Company maintains a website at http://www.zallcn.com, where up-to-date information and updates on the Company’s business operations and developments, financial information, corporate governance practices and other information are posted.
Shareholders, investors and the media can make enquiries to the Company through the following means:
Telephone number: 852-3153 5810
By post: Suite 2101, 21/F., Two Exchange Square, Central, Hong Kong
By email: [email protected]

Zall Smart Commerce Group Ltd. Annual Report 201854
Independent Auditor’s Report
Independent auditor’s report to the shareholders of zall Smart Commerce Group Ltd.(Formerly known as “zall Group Ltd.”)(Incorporated in the Cayman Islands with limited liability)
OPINION
We have audited the consolidated financial statements of Zall Smart Commerce Group Ltd. (“the Company”) (formerly known as Zall Group Ltd.) and its subsidiaries (“the Group”) set out on pages 63 to 200, which comprise the consolidated statement of financial position as at 31 December 2018, the consolidated statement of profit or loss, the consolidated statement of profit or loss and other comprehensive income, the consolidated statement of changes in equity and the consolidated cash flow statement for the year then ended and notes to the consolidated financial statements, including a summary of significant accounting policies.
In our opinion, the consolidated financial statements give a true and fair view of the consolidated financial position of the Group as at 31 December 2018 and of its consolidated financial performance and its consolidated cash flows for the year then ended in accordance with International Financial Reporting Standards (“IFRSs”) issued by the International Accounting Standards Board (“IASB”) and have been properly prepared in compliance with the disclosure requirements of Hong Kong Companies Ordinance.
BASIS OF OPINION
We conducted our audit in accordance with Hong Kong Standards on Auditing (“HKSAs”) issued by the Hong Kong Institute of Certified Public Accountants (“HKICPA”). Our responsibilities under those standards are further described in the Auditor’s responsibilities for the audit of the consolidated financial statements section of our report. We are independent of the Group in accordance with the HKICPA’s Code of Ethics for Professional Accountants (“the Code”) together with any ethical requirements that are relevant to our audit of the consolidated financial statements in the Cayman Islands, and we have fulfilled our other ethical responsibilities in accordance with these requirements and the Code. We believe that the audit evidence we have obtained is sufficient and appropriate to provide a basis for our opinion.
KEY AUDIT MATTERS
Key audit matters are those matters that, in our professional judgement, were of most significance in our audit of the consolidated financial statements of the current period. These matters were addressed in the context of our audit of the consolidated financial statements as a whole, and in forming our opinion thereon, and we do not provide a separate opinion on these matters.
55Annual Report 2018 Zall Smart Commerce Group Ltd.
Independent Auditor’s Report
Assessing potential impairment of goodwillRefer to note 13 to the consolidated financial statements and the accounting policies on page 84 and page 94.
The Key Audit Matter How the matter was addressed in our audit
As of 31 December 2018, the carrying amount of goodwill, which mainly arose from the acquisition of Shenzhen Sinoagri E-commerce Co., Ltd. in 2017 and HSH International Inc. in 2018, were RMB1,252 million, representing 6% of the Group’s net assets at that date.
Management assesses potential impairment of goodwill on an annual basis. The impairment a s se s sment o f goodwi l l i s c a r r i ed ou t by management based on independent valuations of the respective cash generating units (“CGUs”) prepared by a firm of qualified external valuers.
The values of CGUs are estimated based on the respective discounted cash flow forecasts prepared by the management.
The preparation of discounted cash flow forecasts involves the exercise of significant management judgement in particular in determining the key assumptions adopted, which include sales volumes, sales prices and the gross profit ratio and in calculating the discount rate applied.
We identif ied assessing potential impairment of goodwill as a key audit matter because of its significance to the consolidated financial statements and because the assessment of potential impairment of goodwill are inherently subjective and require s ign i f icant judgement and est imat ion which increases the risk of error or potential management bias.
Our audit procedures to assess potential impairment of goodwill included the following:
• understanding and assessing the design,implementation and operating effectiveness of key internal controls over preparation of the discounted cash flow forecasts on which the estimation of the recoverable amount of goodwill are based;
• obtaining and inspecting the valuation reportprepared by the external valuers engaged by the Group on which the management’s assessments of impairment of goodwill were based;
• assessing the external valuers’ qualifications,experience and expertise and considering their objectivity and independence;
• assess ing and cha l l eng ing the Group’ sidentification of CGUs and the allocation of goodwill and other assets to those CGUs with reference to the requirements of the prevailing accounting standards;
• with the assistance of our internal valuationspecialists, evaluating the methodology used in the valuations of CGUs, challenging the key assumptions and critical judgements made in the preparation of the discounted cash flow forecasts prepared by management by comparing key inputs, which included sales volumes, sales prices and the gross profit ratio, with historical performance, management’s budgets and forecasts and other external available information, and evaluating the discount rate applied in the discounted cash flow forecasts by assessing if the parameters adopted in calculating the discount rate was within the range of those adopted by other companies in the same industry and with similar risk profile;
• obtainingmanagement’ssensitivityanalysesforthe key assumptions, including sales volumes, sales prices, the gross profit ratio and the discount rate, adopted in the preparation of the discounted cash flow forecasts and assessing the impact of changes in the key assumptions on the conclusions reached by management in its impairment assessment and whether there were any indicators of management bias;
• pe r f o rm ing a r e t r o spe c t i v e r e v i ew b ycomparing the prior year’s forecasts with the current year’s results to assess the historical accuracy of management’s forecasting process and if any management bias; and
• assessing the disclosures in the consolidatedf inanc ia l s ta tements in respect o f the assessment of potential impairment of goodwill with reference to the requirements of the prevailing accounting standards.

Zall Smart Commerce Group Ltd. Annual Report 201856
Independent Auditor’s Report
Assessing the net realisable value of properties under development for sale and completed properties held for saleRefer to note 19 to the consolidated financial statements and the accounting policies on page 96.
The Key Audit Matter How the matter was addressed in our audit
As at 31 December 2018, the Group owned propert ies under deve lopment for sa le and completed properties held for sale located in the People’s Republic of China (“PRC”) with an aggregate carrying amount of RMB5,813 million, which represented 11% of the Group’s total assets at that date. These properties comprise retails units and residential apartments located in the cities of Wuhan, Tianjin, Changsha and Jingzhou.
These properties are stated at the lower of cost and net realisable value. The determination of the net realisable value of these properties requires judgement and estimations, which include expected future selling prices and the costs necessary to complete the sale of these properties, and is assessed by Group management.
Recent changes in local government policies in certain cities in PRC, which affect interest rates, the required reserve ratio for banks and/or mortgage requirements for second-home buyers, could lead to volatility in property prices which could mean that provisions are necessary at the reporting date.
We identified the assessment of the net realisable value of properties under development for sale and completed properties held for sale as a key audit matter because of the significance of these properties to the Group’s total assets and because the assessment of net realisable value is inherently subjective and requires significant management judgement and estimation in relation to estimating future selling prices and future construction costs which increases the risk of error or potential management bias.
Our audit procedures to assess the net realisable value of properties under development for sale and completed properties held for sale included the following:
• challenging the Group’s forecast sales pricesby comparing the forecast sales prices for a sample of properties to sales prices achieved before and after the reporting date and the list prices of comparable properties;
• c h a l l e n g i n g t h e G r o u p ’ s f o r e c a s t o fconst ruct ion cost per square metre by comparison with construction costs for similar units in other areas and where there were differences, obtaining explanat ions from senior operational, commercial and financial management and comparing their explanations with correspondence with suppl iers and comparable properties in nearby locations;
• discussing significant property developmentprojects with the relevant project managers to identify the key drivers behind the appraisal forecasts and net realisable values, such as forecast yields and cost plans;
• conduct ing s i te v i s i t s to propert ies underdevelopment for sale, on a sample basis, to observe the development progress and challenging management’s development budgets reflected in the latest forecasts with reference to market statistics about estimated construction costs, s igned const ruct ion cont rac t s and/or un i t construction costs of recently completed projects developed by the Group.

57Annual Report 2018 Zall Smart Commerce Group Ltd.
Independent Auditor’s Report
Valuation of investment propertiesRefer to note 10 to the consolidated financial statements and the accounting policies on page 86.
The Key Audit Matter How the matter was addressed in our audit
The Group holds a portfo l io of investment p rope r t i e s , i nc lud ing comp le ted inves tment proper t ies and investment proper t ies under development located in PRC with a carrying value of RMB25,456 million which accounted for 48% of the Group’s total assets as at 31 December 2018. These properties comprise logistic units, e-commerce malls and wholesale shopping malls.
The fair values of investment properties as at 31 December 2018 were assessed by the directors based on independent valuations prepared by a firm of qualified external property valuers. The net changes in fair value of investment properties recorded in the consolidated statement of profit or loss represented 165% of the Group’s profit before taxation for the year ended 31 December 2018.
We identified valuation of the Group’s investment properties as a key audit matter because of the significance of investment properties to the Group’s total assets and the significance of changes in fair value of investment properties to the Group’s profit before taxation and because the valuation of investment properties can be inherently subjective and requires significant management judgement and estimation which increases the risk of error or potential management bias, particularly given the number and the diverse nature and location of the investment properties held by the Group.
Our audit procedures to address the valuation of investment properties included the following:
• obtaining and inspecting the valuation reportsprepared by the external property valuers engaged by the Group and on which the directors’ assessment of the fair values of investment properties was based;
• assess ing the external property va luers ’qualifications, experience and expertise in the properties being valued and considering their objectivity and independence;
• with the assistance of our internal propertyvaluation special ists, discussing with the ex te rna l p roper ty va lue r s , w i thout the presence of management, their valuation methodo logy and cha l l eng ing the key estimates and assumptions adopted in the valuations by comparing capitalisation rates, prevailing market rents and comparable market transactions with available market data;
• conducting site visits to investment propertiesunder development, on a sample basis, to observe the development progress and cha l l eng ing management ’ s deve lopment budgets reflected in the valuations with reference to market statistics about estimated cons t ruc t ion cos t s , s igned cons t ruc t ion contracts and/or unit construction costs of recently completed projects developed by the Group.
Zall Smart Commerce Group Ltd. Annual Report 201858
Independent Auditor’s Report
Transition adjustments and disclosures in relation to the adoption of IFRS 9 Financial InstrumentsRefer to note 1(c)(i) to the consolidated financial statements and the accounting policies on page 72.
The Key Audit Matter How the matter was addressed in our audit
The Group has applied International Financial Reporting Standard 9 – Financial Instruments (“IFRS 9”) since 1 January 2018.
IFRS 9 has amended the previous classification and measurement framework of financial instruments and introduced a more complex expected credit loss model to assess impairment. The Group is required to retrospectively apply the classification and measurement (including impairment) requirements and recognise any difference between the original carrying amount and new carrying amount at the date of initial application (i.e. 1 January 2018) in the opening retained earnings or other component of equity.
We identif ied the transit ion adjustments and disclosures in relation to the application of IFRS 9 as a key audit matter, because of the complexity of the transition process which involved changes in internal controls of the financial reporting process, accounting treatment, application of new data and management judgment.
Our audit procedures to assess the transition adjustments and disclosures in relation to the adoption of IFRS 9 included the following:
• understanding and assessing the key internalcontrols of the financial reporting process related to the adoption of IFRS 9;
• evaluating the accuracy of the classification offinancial instruments. We obtained information on how management applied the classification requirements of IFRS 9 and the classification results. On a sample basis we assessed the contractual cash flow characteristics of the financial assets and relevant documents in relation to the business model;
• with the assistance of our internal specialists,assessing the reliability of the expected credit loss model used by management in determining loss allowances on transition and assessing the completeness and accuracy of data used for the key parameters in the expected credit loss model;
• ob t a i n i n g j o u r n a l e n t r i e s r e l a t i n g t oadjustments made on transition to IFRS 9 and compared the list of classification of financial instruments, the original carrying amounts, the list of journal entries and new carrying amounts of the financial instruments to assess if the journal entries have been entirely put through the system accurately. We selected samples to assess if the accounting treatment is in accordance with the requirements of IFRS 9;
• selecting samples to recalculate the newcarrying amount of the financial instruments and assessing the accuracy of the opening balance at the date of initial application (i.e. 1 January 2018); and
• assessing whether the relevant disclosuresin relation to the adoption of IFRS 9 are in compliance with the prevailing accounting standards.
59Annual Report 2018 Zall Smart Commerce Group Ltd.
Independent Auditor’s Report
Loss allowance for loans and factoring receivablesRefer to note 21(b) to the consolidated financial statements and the accounting policies on page 89.
The Key Audit Matter How the matter was addressed in our audit
The Group has applied IFRS 9 since 1 January 2018 and developed a new impairment model for financial assets.
The determination of loss allowances using the expected credit loss model (“ECL model”) is subject to a number of key parameters and assumptions, including the identif ication of credit-impaired stage, estimates of probability of default, loss given default, exposures at default, adjustments for forward-looking information and other adjustment factors. Management judgment is involved in the selection of those parameters and the application of the assumptions.
We identified loss allowance for loans and factoring receivables as a key audit matter because of the inherent uncertainty and management judgement involved and because of its significance to the financial results and capital of the Group.
Our audit procedures to assess the loss allowance for loans and factoring receivables included the following:
• understanding and assessing the design,implementation and operating effectiveness of key internal controls of financial reporting over the approval, recording and monitoring of loans and factor ing receivables, the identification of the three stages of the ECL model and the measurement of provisions for impairment;
• with the assistance of our internal specialists,assessing the reliability of the expected credit loss model used by management in determining allowances for impairment losses, and the appropriateness of the key parameters and assumptions in the expected credit loss model, which includes the identification of credit-impaired stage, probability of default, loss given default, exposure at default, adjustments for forward-looking information and other management adjustments;
• assessing the completeness and accuracyof data used for the key parameters in the expected credit loss model:
• for key parameters derived from internaldata relating to loans and factoring agreements, we selected samples and compared individual loans and factoring r e c e i v a b l e s i n f o r m a t i o n w i t h t h e underlying agreements and other related documentation to assess the accuracy of compilation of the loans and factoring receivables list;
• for key parameters involving judgement,cr i t ical ly assess ing input parameters by seek ing ev idence f rom externa l sources and comparing to the Group’s internal records including historical loss experience and type of collateral. As part of these procedures, we challenged management’s revisions to estimates and input parameters compared with prior period and on transition to IFRS 9 and considered the consistency of judgement. We compared the economic factors used in the models with market information to assess whether they were aligned with market and economic development;

Zall Smart Commerce Group Ltd. Annual Report 201860
Independent Auditor’s Report
The Key Audit Matter How the matter was addressed in our audit
• for selected samples of loans and factoringreceivables that are credit-impaired, evaluating management’s assessment of the value of any collateral held by comparison with market prices obtained from secondary markets. We also evaluated the timing and means of realisation of collateral, evaluated the forecast cash flows, challenged the viability of the Group’s recovery plans and evaluated other credit enhancements that are integral to the contract terms;
• recalculat ing the amount of credit lossal lowance for 12 months and l i fe t ime credit losses using the expected credit loss model based on the above parameters and assumptions for a sample of loans and factoring receivables where the credit risk of the loans and factoring receivables have not, or have, increased significantly since initial recognition, respectively; and
• eva lua t ing whethe r the d i s c lo su res onimpairment of loans and factoring receivables m e e t t h e d i s c l o s u r e r e q u i r e m e n t s i n International Financial Reporting Standard 7 – Financial Instruments: Disclosures.
INFORMATION OTHER THAN THE CONSOLIDATED FINANCIAL STATEMENTS AND OUR AUDITOR’S REPORT THEREON
The directors are responsible for the other information. The other information comprises all the information included in the annual reports, other than the consolidated financial statements and our auditor’s report thereon.
Our opinion on the consolidated financial statements does not cover the other information and we do not express any form of assurance conclusion thereon.
In connection with our audit of the consolidated financial statements, our responsibility is to read the other information and, in doing so, consider whether the other information is materially inconsistent with the consolidated financial statements or our knowledge obtained in the audit or otherwise appears to be materially misstated.
If, based on the work we have performed, we conclude that there is a material misstatement of this other information, we are required to report that fact. We have nothing to report in this regard.

61Annual Report 2018 Zall Smart Commerce Group Ltd.
Independent Auditor’s Report
RESPONSIBILITIES OF THE DIRECTORS FOR THE CONSOLIDATED FINANCIAL STATEMENTS
The directors are responsible for the preparation of the consolidated financial statements that give a true and fair view in accordance with IFRSs issued by the IASB and the disclosure requirement of the Hong Kong Companies Ordinance and for such internal control as the directors determine is necessary to enable the preparation of consolidated financial statements that are free from material misstatement, whether due to fraud or error.
In preparing the consolidated financial statements, the directors are responsible for assessing the Group’s ability to continue as a going concern, disclosing, as applicable, matters related to going concern and using the going concern basis of accounting unless the directors either intend to liquidate the Group or to cease operations, or have no realistic alternative but to do so.
The directors are assisted by the Audit Committee in discharging their responsibilities for overseeing the Group’s financial reporting process.
AUDITOR’S RESPONSIBILITIES FOR THE AUDIT OF THE CONSOLIDATED FINANCIAL STATEMENTS
Our objectives are to obtain reasonable assurance about whether the consolidated financial statements as a whole are free from material misstatement, whether due to fraud or error, and to issue an auditor’s report that includes our opinion. This report is made solely to you, as a body, and for no other purpose. We do not assume responsibility towards or accept liability to any other person for the contents of this report.
Reasonable assurance is a high level of assurance, but is not a guarantee that an audit conducted in accordance with HKSAs will always detect a material misstatement when it exists. Misstatements can arise from fraud or error and are considered material if, individually or in the aggregate, they could reasonably be expected to influence the economic decisions of users taken on the basis of these consolidated financial statements.
As part of an audit in accordance with HKSAs, we exercise professional judgement and maintain professional scepticism throughout the audit. We also:
• Identify and assess the risks ofmaterialmisstatement of the consolidated financial statements,whetherdue to fraud or error, design and perform audit procedures responsive to those risks, and obtain audit evidence that is sufficient and appropriate to provide a basis for our opinion. The risk of not detecting a material misstatement resulting from fraud is higher than for one resulting from error, as fraud may involve collusion, forgery, intentional omissions, misrepresentations, or the override of internal control.
• Obtain an understanding of internal control relevant to the audit in order to design audit proceduresthat are appropriate in the circumstances, but not for the purpose of expressing an opinion on the effectiveness of the Group’s internal control.
• Evaluatetheappropriatenessofaccountingpoliciesusedandthereasonablenessofaccountingestimatesand related disclosures made by the directors.
• Conclude on the appropriateness of the directors’ use of the going concern basis of accounting and,based on the audit evidence obtained, whether a material uncertainty exists related to events or conditions that may cast significant doubt on the Group’s ability to continue as a going concern. If we conclude that a material uncertainty exists, we are required to draw attention in our auditor’s report to the related disclosures in the consolidated financial statements or, if such disclosures are inadequate, to modify our opinion. Our conclusions are based on the audit evidence obtained up to the date of our auditor’s report. However, future events or conditions may cause the Group to cease to continue as a going concern.

Zall Smart Commerce Group Ltd. Annual Report 201862
Independent Auditor’s Report
• Evaluate the overall presentation, structure and content of the consolidated financial statements,including the disclosures, and whether the consolidated financial statements represent the underlying transactions and events in a manner that achieves fair presentation.
• Obtain sufficient appropriate audit evidence regarding the financial information of the entities orbusiness activities within the Group to express an opinion on the consolidated financial statements. We are responsible for the direction, supervision and performance of the Group audit. We remain solely responsible for our audit opinion.
We communicate with the Audit Committee regarding, among other matters, the planned scope and timing of the audit and significant audit findings, including any significant deficiencies in internal control that we identify during our audit.
We also provide the Audit Committee with a statement that we have complied with relevant ethical requirements regarding independence and communicate with them all relationships and other matters that may reasonably be thought to bear on our independence and, where applicable, related safeguards.
From the matters communicated with the Audit Committee, we determine those matters that were of most significance in the audit of the consolidated financial statements of the current period and are therefore the key audit matters. We describe these matters in our auditor’s report unless law or regulation precludes public disclosure about the matter or when, in extremely rare circumstances, we determine that a matter should not be communicated in our report because the adverse consequences of doing so would reasonably be expected to outweigh the public interest benefits of such communication.
The engagement partner on the audit resulting in this independent auditor’s report is Liu Hin Pan.
KPMGCertified Public Accountants8th Floor, Prince’s Building10 Chater RoadCentral, Hong Kong
29 March 2019

63Annual Report 2018 Zall Smart Commerce Group Ltd.
Consolidated Statement of Profit or Lossfor the year ended 31 December 2018
(Expressed in Renminbi)
Note
2018
RMB’000
2017(Note)
RMB’000
Revenue 3(a) 56,116,072 22,249,176Cost of sales (54,556,472) (21,236,921)
Gross profit 1,559,600 1,012,255Other net loss 4 (530,495) (39,900)Selling and distribution expenses (213,657) (196,368)Administrative and other expenses (760,769) (492,453)Impairment loss on trade and other receivables 5(c) (265,422) (20,557)Impairment loss on intangible assets 12 (152,824) –Impairment loss on goodwill 13 (461,028) –
(Loss)/profit from operations before changes in fair value of investment properties (824,595) 262,977Net valuation gain on investment properties 10 3,865,192 3,021,326
Profit from operations 3,040,597 3,284,303Finance income 5(a) 206,000 89,001Finance costs 5(a) (697,151) (534,360)Share of net losses of associates 15 (172,873) (36,050)Share of net (losses)/profits of joint ventures 16 (2,343) 727Impairment loss on investment in an associate 15 (26,155) –
Profit before taxation 5 2,348,075 2,803,621Income tax 6(a) (1,074,168) (447,139)
Profit for the year 1,273,907 2,356,482
Attributable to: Equity shareholders of the Company 1,371,304 2,379,077 Non-controlling interests (97,397) (22,595)
Profit for the year 1,273,907 2,356,482
Earnings per share (RMB cents) Basic 9 11.76 21.23
Diluted 9 11.75 21.23
Note: The Group has initially applied IFRS 15 and IFRS 9 at 1 January 2018. Under the transition methods chosen, comparative information is not restated. See note 1(c).
The notes on pages 71 to 200 form part of these financial statements. Details of dividends payable to equity shareholders of the Company attributable to the profit for the year are set out in note 29(e).
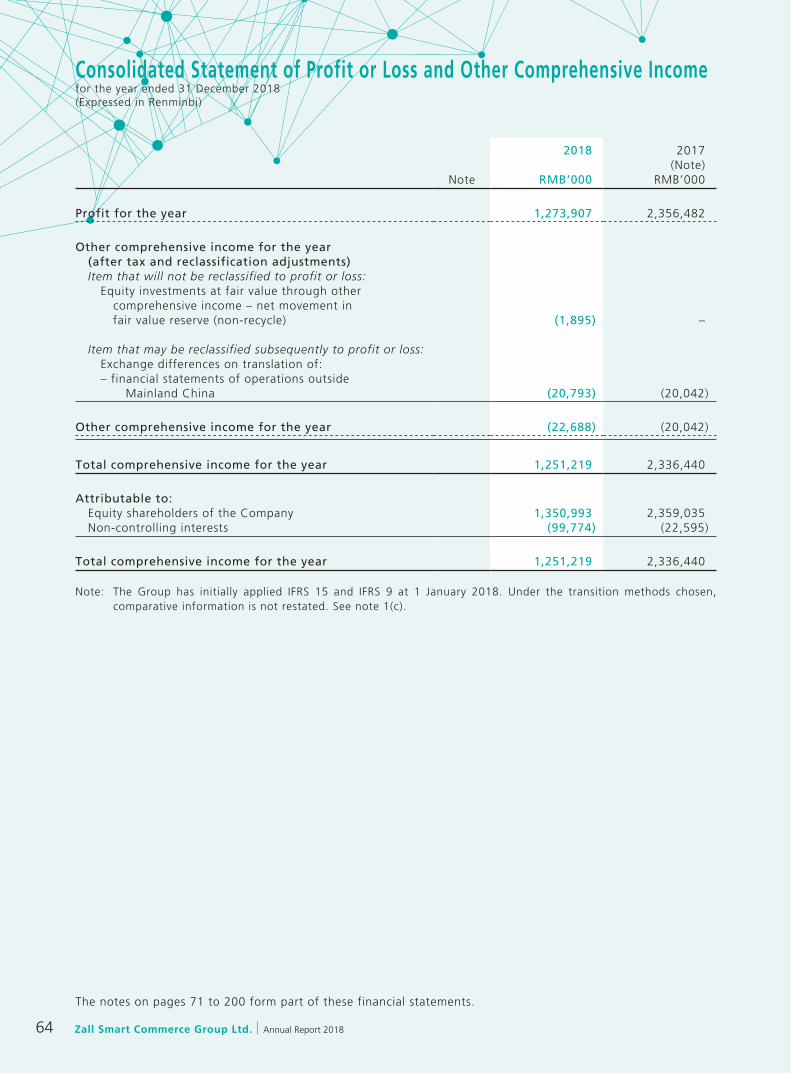
Zall Smart Commerce Group Ltd. Annual Report 201864
Consolidated Statement of Profit or Loss and Other Comprehensive Incomefor the year ended 31 December 2018(Expressed in Renminbi)
Note
2018
RMB’000
2017(Note)
RMB’000
Profit for the year 1,273,907 2,356,482
Other comprehensive income for the year (after tax and reclassification adjustments) Item that will not be reclassified to profit or loss: Equity investments at fair value through other comprehensive income – net movement in fair value reserve (non-recycle) (1,895) –
Item that may be reclassified subsequently to profit or loss: Exchange differences on translation of: – financial statements of operations outside Mainland China (20,793) (20,042)
Other comprehensive income for the year (22,688) (20,042)
Total comprehensive income for the year 1,251,219 2,336,440
Attributable to: Equity shareholders of the Company 1,350,993 2,359,035 Non-controlling interests (99,774) (22,595)
Total comprehensive income for the year 1,251,219 2,336,440
Note: The Group has initially applied IFRS 15 and IFRS 9 at 1 January 2018. Under the transition methods chosen, comparative information is not restated. See note 1(c).
The notes on pages 71 to 200 form part of these financial statements.
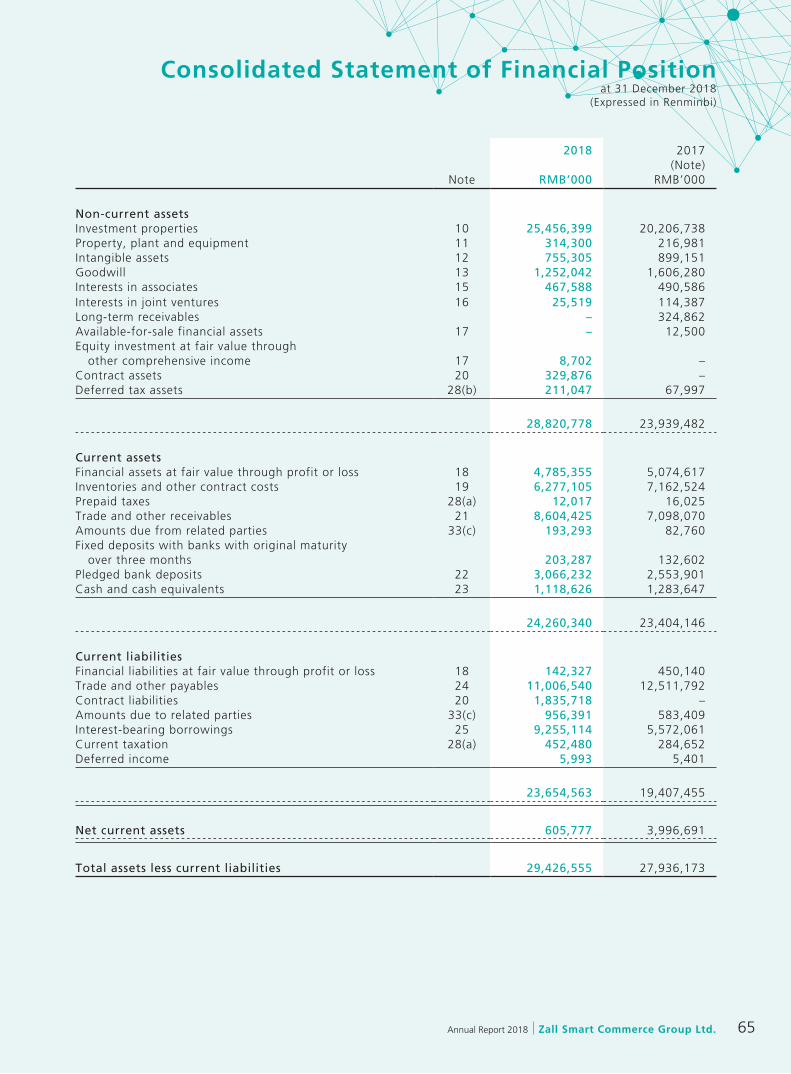
65Annual Report 2018 Zall Smart Commerce Group Ltd.
Consolidated Statement of Financial Positionat 31 December 2018
(Expressed in Renminbi)
Note
2018
RMB’000
2017(Note)
RMB’000
Non-current assetsInvestment properties 10 25,456,399 20,206,738Property, plant and equipment 11 314,300 216,981Intangible assets 12 755,305 899,151Goodwill 13 1,252,042 1,606,280Interests in associates 15 467,588 490,586Interests in joint ventures 16 25,519 114,387Long-term receivables – 324,862Available-for-sale financial assets 17 – 12,500Equity investment at fair value through other comprehensive income 17 8,702 –Contract assets 20 329,876 –Deferred tax assets 28(b) 211,047 67,997
28,820,778 23,939,482
Current assetsFinancial assets at fair value through profit or loss 18 4,785,355 5,074,617Inventories and other contract costs 19 6,277,105 7,162,524Prepaid taxes 28(a) 12,017 16,025Trade and other receivables 21 8,604,425 7,098,070Amounts due from related parties 33(c) 193,293 82,760Fixed deposits with banks with original maturity over three months 203,287 132,602Pledged bank deposits 22 3,066,232 2,553,901Cash and cash equivalents 23 1,118,626 1,283,647
24,260,340 23,404,146
Current liabilitiesFinancial liabilities at fair value through profit or loss 18 142,327 450,140Trade and other payables 24 11,006,540 12,511,792Contract liabilities 20 1,835,718 –Amounts due to related parties 33(c) 956,391 583,409Interest-bearing borrowings 25 9,255,114 5,572,061Current taxation 28(a) 452,480 284,652Deferred income 5,993 5,401
23,654,563 19,407,455
Net current assets 605,777 3,996,691
Total assets less current liabilities 29,426,555 27,936,173
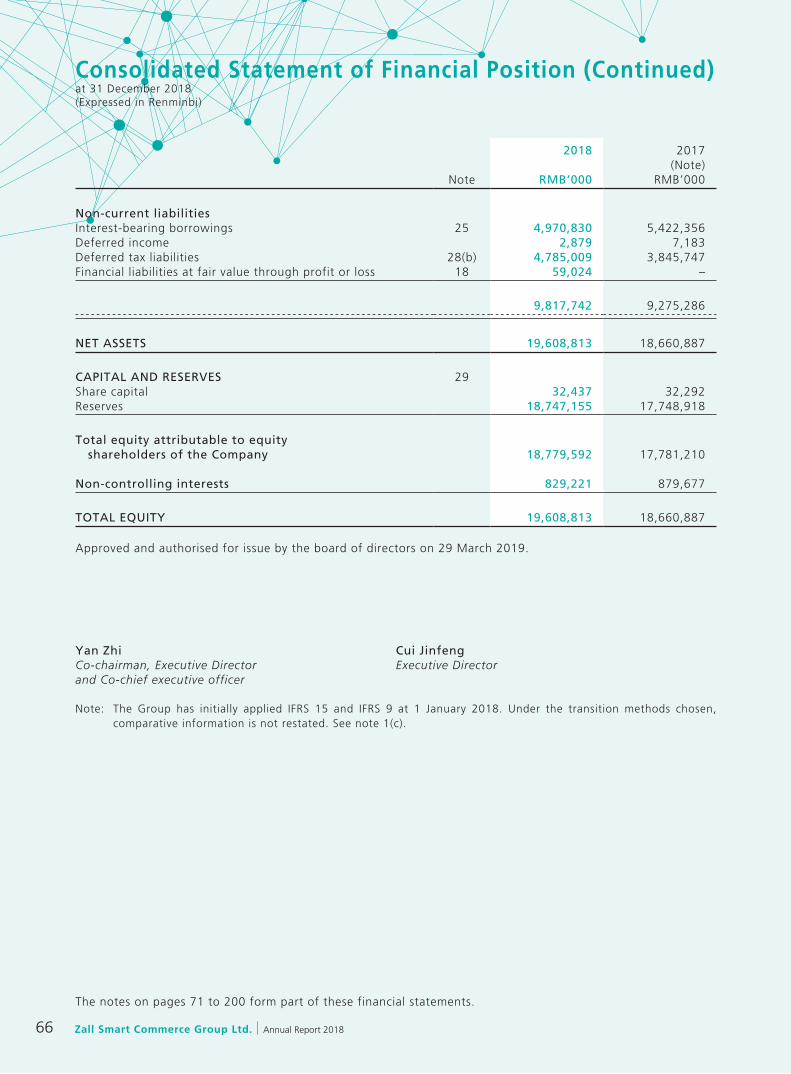
Zall Smart Commerce Group Ltd. Annual Report 201866
Consolidated Statement of Financial Position (Continued)at 31 December 2018(Expressed in Renminbi)
Note
2018
RMB’000
2017(Note)
RMB’000
Non-current liabilitiesInterest-bearing borrowings 25 4,970,830 5,422,356Deferred income 2,879 7,183Deferred tax liabilities 28(b) 4,785,009 3,845,747Financial liabilities at fair value through profit or loss 18 59,024 –
9,817,742 9,275,286
NET ASSETS 19,608,813 18,660,887
CAPITAL AND RESERVES 29Share capital 32,437 32,292Reserves 18,747,155 17,748,918
Total equity attributable to equity shareholders of the Company 18,779,592 17,781,210
Non-controlling interests 829,221 879,677
TOTAL EQUITY 19,608,813 18,660,887
Approved and authorised for issue by the board of directors on 29 March 2019.
Yan zhi Cui JinfengCo-chairman, Executive Director Executive Directorand Co-chief executive officer
Note: The Group has initially applied IFRS 15 and IFRS 9 at 1 January 2018. Under the transition methods chosen, comparative information is not restated. See note 1(c).
The notes on pages 71 to 200 form part of these financial statements.

67Annual Report 2018 Zall Smart Commerce Group Ltd.
Consolidated Statement of Changes in Equityfor the year ended 31 December 2018
(Expressed in Renminbi)
Attributable to equity shareholders of the Company
Share capital
Share premium
Shares held for various
incentive plans
PRC statutory
reserveOther
reserveExchange
reserveRevaluation
reserve
Equity- settled
share-based payment
reserve
Fair value reserve
(non-recycling)
Retained profits Total
Non-controlling
interests Total equityRMB’000 RMB’000 RMB’000 RMB’000 RMB’000 RMB’000 RMB’000 RMB’000 RMB’000 RMB’000 RMB’000 RMB’000 RMB’000
Note 29(b) 29(c)(i) 29(b)(i)(ii) 29(c)(ii) 29(c)(v) 29(c)(iii) 29(c)(vi) 29(c)(iv) 29(c)(vii)
Balance at 1 January 2017 29,727 779,593 – 414,552 525,962 (107,462) 36,946 – – 10,425,229 12,104,547 34,685 12,139,232
Changes in equity for 2017:
Profit for the year – – – – – – – – – 2,379,077 2,379,077 (22,595) 2,356,482Other comprehensive income – – – – – (20,042) – – – – (20,042) – (20,042)
Total comprehensive income – – – – – (20,042) – – – 2,379,077 2,359,035 (22,595) 2,336,440
Issuance of new shares 1,038 1,305,453 – – – – – – – – 1,306,491 – 1,306,491Issuance of shares for Management Shares Award Scheme 23 59,152 (59,175) – – – – – – – – – –Appropriation to statutory reserve 29(c)(ii) – – – 22,861 – – – – – (22,861) – – –Equity-settled share-based payment for employee 27 – – – – (25,842) – – 65,259 – – 39,417 25,842 65,259Equity-settled share-based payment for non-employee 27 – – – – – – – 57,225 – – 57,225 – 57,225Acquisition of subsidiaries 1,504 2,218,644 – – – – – – – – 2,220,148 853,428 3,073,576Acquisition of additional interest in subsidiaries – – – – (307,000) – – – – – (307,000) – (307,000)Dividends to non-controlling interests of subsidiaries – – – – – – – – – – – (4,242) (4,242)Capital injection from non-controlling interests of a subsidiary – – – – – – – – – – – 244 244Withdraw of capital investment by a non-controlling equity holder – – – – – – – – – – – (9,000) (9,000)Capital injection of an associate – – – – 1,347 – – – – – 1,347 1,315 2,662
Balance at 31 December 2017 (Note) 32,292 4,362,842 (59,175) 437,413 194,467 (127,504) 36,946 122,484 – 12,781,445 17,781,210 879,677 18,660,887
Impact on initial application of IFRS 15 1(c)(ii) – – – – – – – – – (14,888) (14,888) (46) (14,934)Impact on initial application of IFRS 9 1(c)(i) – – – – – – – – (953) (219,653) (220,606) (8,105) (228,711)
Adjusted balance at 1 January 2018 32,292 4,362,842 (59,175) 437,413 194,467 (127,504) 36,946 122,484 (953) 12,546,904 17,545,716 871,526 18,417,242
Note: The Group has initially applied IFRS 15 and IFRS 9 at 1 January 2018. Under the transition methods chosen, comparative information is not restated. See note 1(c).

Zall Smart Commerce Group Ltd. Annual Report 201868
Consolidated Statement of Changes in Equity (Continued)for the year ended 31 December 2018(Expressed in Renminbi)
Attributable to equity shareholders of the Company
Share capital
Share premium
Shares held for various
incentive plans
PRC statutory
reserveOther
reserveExchange
reserveRevaluation
reserve
Equity- settled
share-based payment
reserve
Fair value reserve
(non-recycling)
Retained profits Total
Non-controlling
interests Total equityRMB’000 RMB’000 RMB’000 RMB’000 RMB’000 RMB’000 RMB’000 RMB’000 RMB’000 RMB’000 RMB’000 RMB’000 RMB’000
Note 29(b) 29(c)(i) 29(b)(i)(ii) 29(c)(ii) 29(c)(v) 29(c)(iii) 29(c)(vi) 29(c)(iv) 29(c)(vii)
Adjusted balance at 1 January 2018 32,292 4,362,842 (59,175) 437,413 194,467 (127,504) 36,946 122,484 (953) 12,546,904 17,545,716 871,526 18,417,242
Changes in equity for 2018:
Profit for the year – – – – – – – – – 1,371,304 1,371,304 (97,397) 1,273,907Other comprehensive income – – – – – (18,416) – – (1,895) – (20,311) (2,377) (22,688)
Total comprehensive income – – – – – (18,416) – – (1,895) 1,371,304 1,350,993 (99,774) 1,251,219
Issue of shares for Incentive Shares 29(b)(i) 23 69,850 (69,873) – – – – – – – – – –Issue of shares for VKC Consultancy Service Consideration Shares 29(b)(ii) 93 279,381 (279,474) – – – – – – – – – –Capital injection from non-controlling interest of subsidiaries – – – – – – – – – – – 38,740 38,740Acquisition of non-controlling interest of subsidiaries – – – – (14,504) – – – – – (14,504) (142) (14,646)Appropriation to statutory reserve 29(c)(ii) – – – 13,026 – – – – – (13,026) – – –Dividends approved in respect of the previous year 29(e) – (246,653) – – – – – – – – (246,653) – (246,653)Dividends to non-controlling interests of subsidiaries – – – – – – – – – – – (13,302) (13,302)Equity-settled share-based payment for employee 27/29(b)(i) 6 9,055 11,835 – (26,471) – – 50,962 – – 45,387 26,795 72,182Equity-settled share-based payment for non-employee 27/29(b)(ii) 23 49,827 – – – – – 47,631 – – 97,481 – 97,481Acquisition of subsidiaries – – – – 1,172 – – – – – 1,172 12,138 13,310Disposal of subsidiaries – – – – – – – – – – – (6,760) (6,760)
Balance at 31 December 2018 32,437 4,524,302 (396,687) 450,439 154,664 (145,920) 36,946 221,077 (2,848) 13,905,182 18,779,592 829,221 19,608,813
The notes on pages 71 to 200 form part of these financial statements.

69Annual Report 2018 Zall Smart Commerce Group Ltd.
Consolidated Cash Flow Statementfor the year ended 31 December 2018
(Expressed in Renminbi)
2018 2017(Note)
Note RMB’000 RMB’000
Operating activitiesCash used in operations 23(b) (367,497) (2,072,986)Income tax paid (48,441) (44,164)
Net cash used in operating activities (415,938) (2,117,150)
Investing activitiesPayment for the purchase of property, plant and equipment (151,971) (30,674)Proceeds from disposal of property, plant and equipment 1,308 1,193Proceeds from disposal of intangible assets – 98Placement of fixed deposits at banks with original maturity over three months (193,287) (122,602)Maturity of fixed deposits at banks with original maturity over three months 122,602 –Payment for the purchase of intangible assets (28,846) (12,043)Interest received 152,071 89,001Cash (paid)/receipt from acquisition of subsidiaries 34 (118,744) 1,237,163Payment for investment in associates (156,198) (26,897)Dividends received from financial assets at fair value through profit or loss 4 10,922 10,207Proceeds from refunding investment – 1,000,000Purchase of financial assets at fair value through profit or loss – Listed equity securities – (133,345) – Wealth management products and trust products (4,220,358) (1,909,395)Disposal of listed equity securities 196,142 77,541Cash receipt from maturity of wealth management products and trust products 3,637,286 1,952,948Payment for available-for-sale financial assets – (12,500)Loans to a third party – (167,585)Advance to related parties 33(b)(iii) (1,185,960) (389,022)Repayment from related parties 33(b)(iv) 1,056,770 326,742
Net cash (used in)/generated from investing activities (878,263) 1,890,830
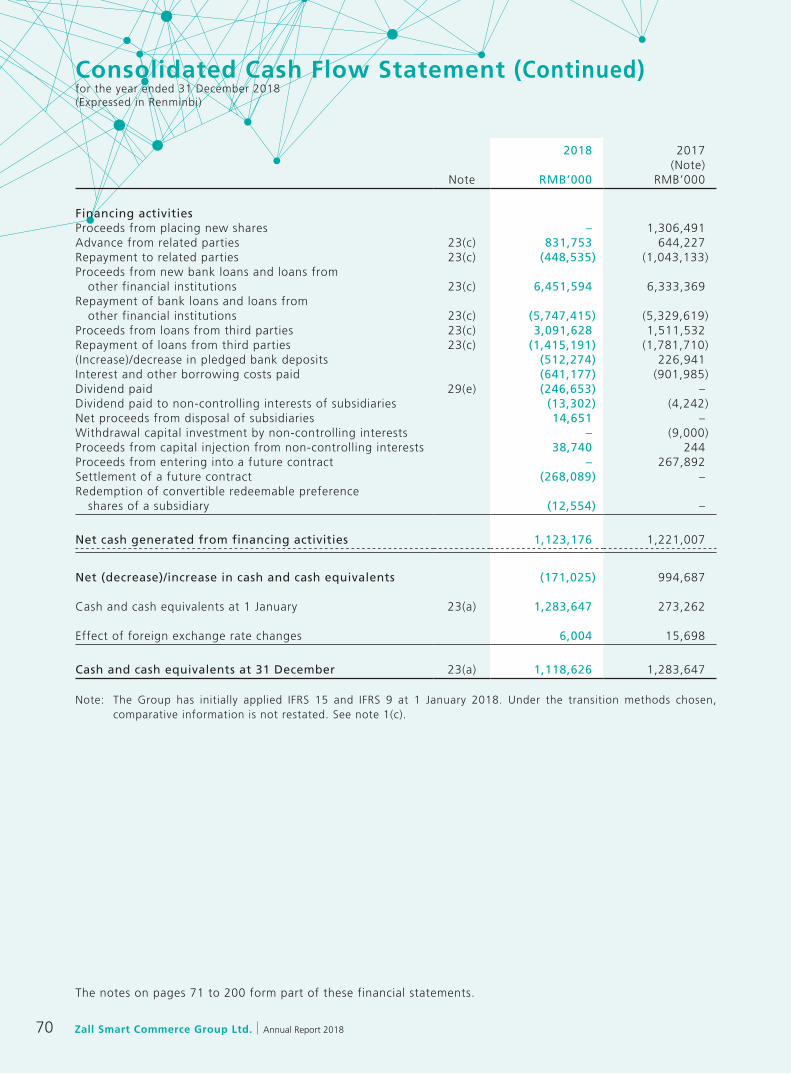
Zall Smart Commerce Group Ltd. Annual Report 201870
Consolidated Cash Flow Statement (Continued)for the year ended 31 December 2018(Expressed in Renminbi)
2018 2017(Note)
Note RMB’000 RMB’000
Financing activitiesProceeds from placing new shares – 1,306,491Advance from related parties 23(c) 831,753 644,227Repayment to related parties 23(c) (448,535) (1,043,133)Proceeds from new bank loans and loans from other financial institutions 23(c) 6,451,594 6,333,369Repayment of bank loans and loans from other financial institutions 23(c) (5,747,415) (5,329,619)Proceeds from loans from third parties 23(c) 3,091,628 1,511,532Repayment of loans from third parties 23(c) (1,415,191) (1,781,710)(Increase)/decrease in pledged bank deposits (512,274) 226,941Interest and other borrowing costs paid (641,177) (901,985)Dividend paid 29(e) (246,653) –Dividend paid to non-controlling interests of subsidiaries (13,302) (4,242)Net proceeds from disposal of subsidiaries 14,651 –Withdrawal capital investment by non-controlling interests – (9,000)Proceeds from capital injection from non-controlling interests 38,740 244Proceeds from entering into a future contract – 267,892Settlement of a future contract (268,089) –Redemption of convertible redeemable preference shares of a subsidiary (12,554) –
Net cash generated from financing activities 1,123,176 1,221,007
Net (decrease)/increase in cash and cash equivalents (171,025) 994,687
Cash and cash equivalents at 1 January 23(a) 1,283,647 273,262
Effect of foreign exchange rate changes 6,004 15,698
Cash and cash equivalents at 31 December 23(a) 1,118,626 1,283,647
Note: The Group has initially applied IFRS 15 and IFRS 9 at 1 January 2018. Under the transition methods chosen, comparative information is not restated. See note 1(c).
The notes on pages 71 to 200 form part of these financial statements.

71Annual Report 2018 Zall Smart Commerce Group Ltd.
Notes to the Consolidated Financial Statements(Expressed in Renminbi unless otherwise indicated)
1 SIGNIFICANT ACCOUNTING POLICIES
(a) Statement of compliance
These financial statements have been prepared in accordance with all applicable International Financial Reporting Standards (“IFRSs”), which collective term includes all applicable individual International Financial Reporting Standards, International Accounting Standards (“IASs”) and Interpretations issued by the International Accounting Standards Board (“IASB”) and the disclosure requirements of the Hong Kong Companies Ordinance. These financial statements also comply with the applicable disclosure provisions of the Rules Governing the Listing of Securities on The Stock Exchange of Hong Kong Limited. Significant accounting policies adopted by the Group are disclosed below.
The IASB has issued certain new and revised IFRSs that are first effective or available for early adoption for the current accounting period of the Group. Note 1(c) provides information on any changes in accounting policies resulting from initial application of these developments to the extent that they are relevant to the Group for the current and prior accounting periods reflected in these financial statements.
(b) Basis of preparation of the financial statements
The consolidated financial statements for the year ended 31 December 2018 comprise Zall Smart Commerce Group Ltd. (the “Company”, formerly known as Zall Group Ltd.) and its subsidiaries (together referred to as the “Group”) and the Group’s interest in associates and joint ventures.
The measurement basis used in the preparation of the financial statements is the historical cost basis except that the following assets and liabilities are stated at their fair value as explained in the accounting policies set out below:
– equity investments at fair value through other comprehensive income and financial assets at fair value through profit or loss (see note 1(g));
– investment properties (see note 1(i));
– derivative financial instruments (see note 1(h));
– contingent consideration recognised in a business combination (see note 1(d)); and
– convertible redeemable preference share (see note 1(s)).
The consolidated financial statements are presented in Renminbi (“RMB”), rounded to the nearest thousand. Items included in the financial statements of each entity in the Group are measured using currency that best reflects the economic substance of the underlying events and circumstances relevant to that entity (“functional currency”). Most of the companies comprising the Group are operating in the People’s Republic of China (“PRC”) and their functional currency is RMB, hence, RMB is used as the presentation currency of the Group.
The preparation of financial statements in conformity with IFRSs requires management to make judgements, estimates and assumptions that affect the application of policies and reported amounts of assets, liabilities, income and expenses. The estimates and associated assumptions are based on historical experience and various other factors that are believed to be reasonable under the circumstances, the results of which form the basis of making the judgements about carrying values of assets and liabilities that are not readily apparent from other sources. Actual results may differ from these estimates.

Zall Smart Commerce Group Ltd. Annual Report 201872
Notes to the Consolidated Financial Statements(Expressed in Renminbi unless otherwise indicated)
1 SIGNIFICANT ACCOUNTING POLICIES (Continued)
(b) Basis of preparation of the financial statements (Continued)
The estimates and underlying assumptions are reviewed on an ongoing basis. Revisions to accounting estimates are recognised in the period in which the estimate is revised if the revision affects only that period, or in the period of the revision and future periods if the revision affects both current and future periods.
Judgements made by management in the application of IFRSs that have significant effect on the financial statements and major sources of estimation uncertainty are discussed in note 2.
(c) Changes in accounting policies
The IASB has issued a number of new IFRSs and amendments to IFRSs that are first effective for the current accounting period of the Group. Of these, the following developments are relevant to the Group’s financial statements:
(i) IFRS 9, Financial instruments
(ii) IFRS 15, Revenue from contracts with customers
(iii) IFRIC 22, Foreign currency transactions and advance consideration
The Group has not applied any new standard or interpretation that is not yet effective for the current accounting period.
(i) IFRS 9, Financial instruments
IFRS 9 replaces IAS 39, Financial instruments: recognition and measurement. It sets out the requirements for recognising and measuring financial assets, financial liabilities and some contracts to buy or sell non-financial items.
The Group has applied IFRS 9 retrospectively to items that existed at 1 January 2018 in accordance with the transition requirements. The Group has recognised the cumulative effect of initial application as an adjustment to the opening equity at 1 January 2018. Therefore, comparative information continues to be reported under IAS 39.
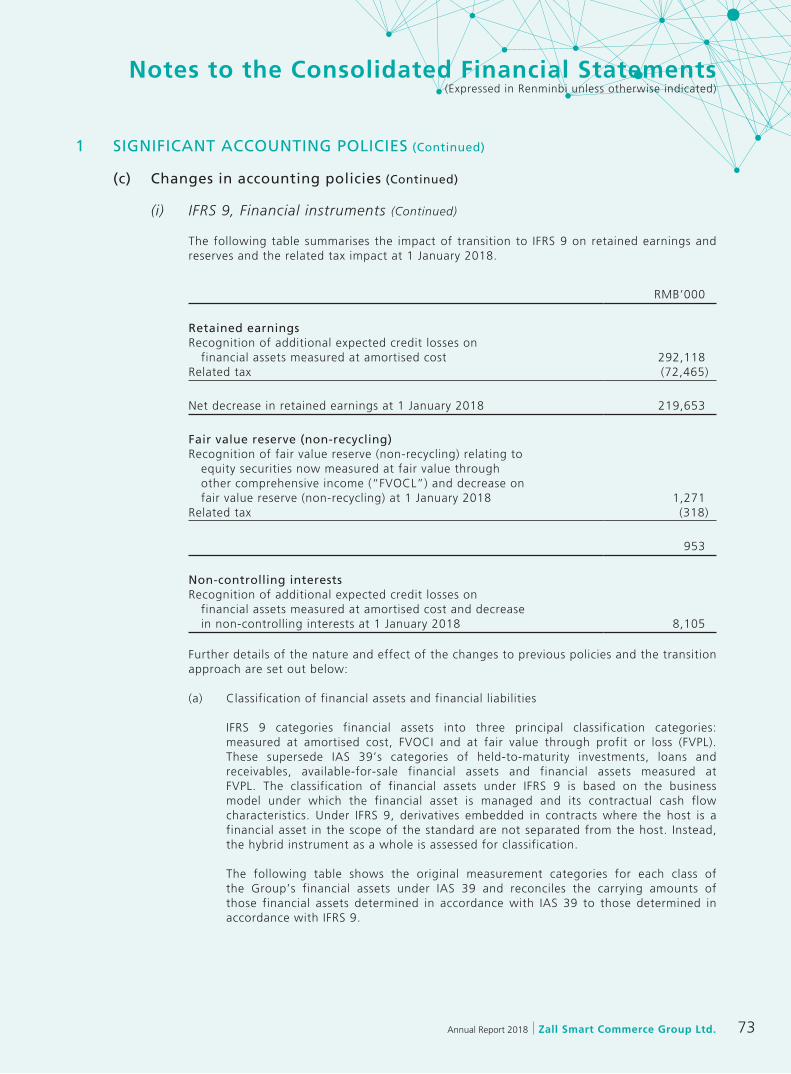
73Annual Report 2018 Zall Smart Commerce Group Ltd.
Notes to the Consolidated Financial Statements(Expressed in Renminbi unless otherwise indicated)
1 SIGNIFICANT ACCOUNTING POLICIES (Continued)
(c) Changes in accounting policies (Continued)
(i) IFRS 9, Financial instruments (Continued)
The following table summarises the impact of transition to IFRS 9 on retained earnings and reserves and the related tax impact at 1 January 2018.
RMB’000
Retained earningsRecognition of additional expected credit losses on financial assets measured at amortised cost 292,118Related tax (72,465)
Net decrease in retained earnings at 1 January 2018 219,653
Fair value reserve (non-recycling)Recognition of fair value reserve (non-recycling) relating to equity securities now measured at fair value through other comprehensive income (“FVOCL”) and decrease on fair value reserve (non-recycling) at 1 January 2018 1,271Related tax (318)
953
Non-controlling interestsRecognition of additional expected credit losses on financial assets measured at amortised cost and decrease in non-controlling interests at 1 January 2018 8,105
Further details of the nature and effect of the changes to previous policies and the transition approach are set out below:
(a) Classification of financial assets and financial liabilities
IFRS 9 categories financial assets into three principal classification categories: measured at amortised cost, FVOCI and at fair value through profit or loss (FVPL). These supersede IAS 39’s categories of held-to-maturity investments, loans and receivables, available-for-sale financial assets and financial assets measured at FVPL. The classification of financial assets under IFRS 9 is based on the business model under which the financial asset is managed and its contractual cash flow characteristics. Under IFRS 9, derivatives embedded in contracts where the host is a financial asset in the scope of the standard are not separated from the host. Instead, the hybrid instrument as a whole is assessed for classification.
The following table shows the original measurement categories for each class of the Group’s financial assets under IAS 39 and reconciles the carrying amounts of those financial assets determined in accordance with IAS 39 to those determined in accordance with IFRS 9.
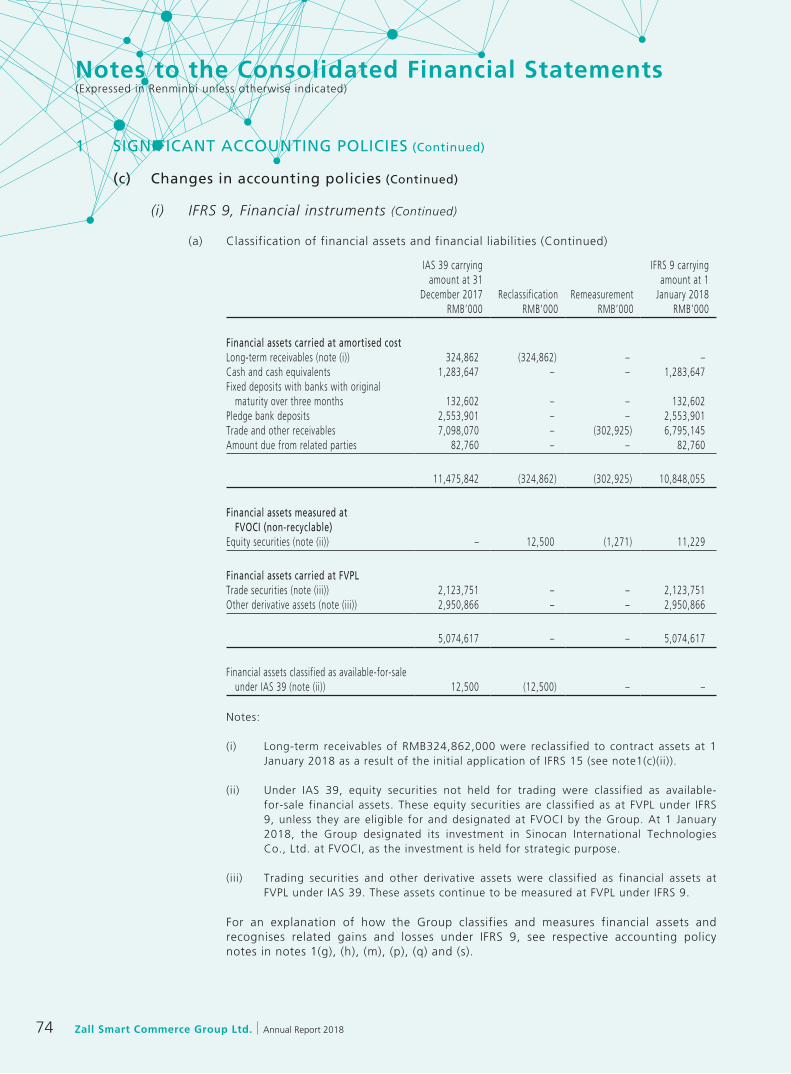
Zall Smart Commerce Group Ltd. Annual Report 201874
Notes to the Consolidated Financial Statements(Expressed in Renminbi unless otherwise indicated)
1 SIGNIFICANT ACCOUNTING POLICIES (Continued)
(c) Changes in accounting policies (Continued)
(i) IFRS 9, Financial instruments (Continued)
(a) Classification of financial assets and financial liabilities (Continued)
IAS 39 carrying amount at 31
December 2017 Reclassification Remeasurement
IFRS 9 carrying amount at 1
January 2018RMB’000 RMB’000 RMB’000 RMB’000
Financial assets carried at amortised costLong-term receivables (note (i)) 324,862 (324,862) – –Cash and cash equivalents 1,283,647 – – 1,283,647Fixed deposits with banks with original maturity over three months 132,602 – – 132,602Pledge bank deposits 2,553,901 – – 2,553,901Trade and other receivables 7,098,070 – (302,925) 6,795,145Amount due from related parties 82,760 – – 82,760
11,475,842 (324,862) (302,925) 10,848,055
Financial assets measured at FVOCI (non-recyclable)Equity securities (note (ii)) – 12,500 (1,271) 11,229
Financial assets carried at FVPLTrade securities (note (iii)) 2,123,751 – – 2,123,751Other derivative assets (note (iii)) 2,950,866 – – 2,950,866
5,074,617 – – 5,074,617
Financial assets classified as available-for-sale under IAS 39 (note (ii)) 12,500 (12,500) – –
Notes:
(i) Long-term receivables of RMB324,862,000 were reclassified to contract assets at 1 January 2018 as a result of the initial application of IFRS 15 (see note1(c)(ii)).
(ii) Under IAS 39, equity securities not held for trading were classified as available-for-sale financial assets. These equity securities are classified as at FVPL under IFRS 9, unless they are eligible for and designated at FVOCI by the Group. At 1 January 2018, the Group designated its investment in Sinocan International Technologies Co., Ltd. at FVOCI, as the investment is held for strategic purpose.
(iii) Trading securities and other derivative assets were classified as financial assets at FVPL under IAS 39. These assets continue to be measured at FVPL under IFRS 9.
For an explanation of how the Group classifies and measures financial assets and recognises related gains and losses under IFRS 9, see respective accounting policy notes in notes 1(g), (h), (m), (p), (q) and (s).

75Annual Report 2018 Zall Smart Commerce Group Ltd.
Notes to the Consolidated Financial Statements(Expressed in Renminbi unless otherwise indicated)
1 SIGNIFICANT ACCOUNTING POLICIES (Continued)
(c) Changes in accounting policies (Continued)
(i) IFRS 9, Financial instruments (Continued)
(a) Classification of financial assets and financial liabilities (Continued)
The measurement categories for all financial liabilities remain the same, except for financial guarantee contracts (see note 1(m)(ii)). The carrying amounts for all financial liabilities (including financial guarantee contracts) at 1 January 2018 have not been impacted by the initial application of IFRS 9.
The Group did not designate or de-designate any financial asset or financial liability at FVPL at 1 January 2018.
(b) Credit losses
IFRS 9 replaces the “incurred loss” model in IAS 39 with the “expected credit loss” (“ECL”) model. The ECL model requires an ongoing measurement of credit risk associated with a financial asset and therefore recognises ECLs earlier than under the “incurred loss” accounting model in IAS 39.
The Group applies the new ECL model to the following items:
– financial assets measured at amortised cost (including cash and cash equivalents, fixed deposits with banks with original maturity over three months, pledged bank deposits, trade and other receivables and amounts due from related parties);
– Contract asset as defined in IFRS 15 (see note 1(o));
– lease receivables; and
– financial guarantee contracts issued (see note1(m)(ii))
For further details on the Group’s accounting policy for accounting for credit losses, see notes 1(m)(i) and (ii)
The following table reconciles the closing loss allowance determined in accordance with IAS 39 as at 31 December 2017 with the opening loss allowance determined in accordance with IFRS 9 as at 1 January 2018:
RMB’000
Loss allowance at 31 December 2017 under IAS 39 68,875
Additional credit loss recognised at 1 January 2018 on: – Trade debtors and bill receivables 279,178 – Loans and factoring receivables 23,747
Loss allowance at 1 January 2018 under IFRS 9 371,800
Zall Smart Commerce Group Ltd. Annual Report 201876
Notes to the Consolidated Financial Statements(Expressed in Renminbi unless otherwise indicated)
1 SIGNIFICANT ACCOUNTING POLICIES (Continued)
(c) Changes in accounting policies (Continued)
(i) IFRS 9, Financial instruments (Continued)
(c) Transition
Changes in accounting policies resulting from the adoption of IFRS 9 have been applied retrospectively, except as described below:
– Information relating to comparative periods has not been restated. Differences in the carrying amounts of financial assets resulting from the adoption of IFRS 9 are recognised in retained earnings and reserves as at 1 January 2018. Accordingly, the information presented for 2017 continues to be reported under IAS 39 and thus may not be comparable with the current period.
– The following assessments have been made on the basis of the facts and circumstances that existed at 1 January 2018 (the date of initial application of IFRS 9 by the Group):
– the determination of the business model within which a financial asset is held; and
– the designation of certain investments in equity instruments not held for trading to be classified as at FVOCI (non-recycling).
– If, at the date of initial application, the assessment of whether there has been a significant increase in credit risk since initial recognition would have involved undue cost or effort, a lifetime ECL has been recognised for that financial instrument.
(ii) IFRS 15, Revenue from contracts with customers
IFRS 15 establishes a comprehensive framework for recognising revenue and some costs from contracts with customers. IFRS 15 replaces IAS 18, Revenue, which covered revenue arising from sale of goods and rendering of services, and IAS 11, Construction contracts, which specified the accounting for construction contracts.
IFRS 15 also introduces additional qualitative and quantitative disclosure requirements which aim to enable users of the financial statements to understand the nature, amount, timing and uncertainty of revenue and cash flows arising from contracts with customers.
The Group has elected to use the cumulative effect transition method and has recognised the cumulative effect of initial application as an adjustment to the opening balance of equity at 1 January 2018. Therefore, comparative information has not been restated and continues to be reported under IAS 11 and IAS 18. As allowed by IFRS 15, the Group has applied the new requirements only to contracts that were not completed before 1 January 2018.

77Annual Report 2018 Zall Smart Commerce Group Ltd.
Notes to the Consolidated Financial Statements(Expressed in Renminbi unless otherwise indicated)
1 SIGNIFICANT ACCOUNTING POLICIES (Continued)
(c) Changes in accounting policies (Continued)
(ii) IFRS 15, Revenue from contracts with customers (Continued)
The following table summarises the impact of transition to IFRS 15 on retained earnings, reserves and the related tax impact at 1 January 2018:
RMB’000
Retained earningsFinance costs 19,851Related tax (4,963)
Net decrease in retained earnings at 1 January 2018 14,888
Non-controlling interestsRecognition of finance costs and net decrease in non-controlling interests 46
Further details of the nature and effect of the changes on previous accounting policies are set out below:
(a) Timing of revenue recognition
Previously, revenue arising from construction contracts and provision of services was recognised over time, whereas revenue from sale of goods was generally recognised at a point in time when the risks and rewards of ownership of the goods had passed to the customers.
Under IFRS 15, revenue is recognised when the customer obtains control of the promised good or service in the contract. This may be at a single point in time or over time. IFRS 15 identifies the following three situations in which control of the promised good or service is regarded as being transferred over time:
A. When the customer simultaneously receives and consumes the benefits provided by the entity’s performance, as the entity performs;
B. When the entity’s performance creates or enhances an asset (for example work in progress) that the customer controls as the asset is created or enhanced;
C. When the entity’s performance does not create an asset with an alternative use to the entity and the entity has an enforceable right to payment for performance completed to date.
If the contract terms and the entity’s activities do not fall into any of these 3 situations, then under IFRS 15 the entity recognises revenue for the sale of that good or service at a single point in time, being when control has passed. Transfer of risks and rewards of ownership is only one of the indicators that is considered in determining when the transfer of control occurs.
The adoption of IFRS 15 does not have a significant impact on when the Group recognises revenue from construction contracts (see note 1(y)(iii)) and revenue recognition for sales of commodities (see note 1(y)(i)). However, the timing of revenue recognition for sales of properties is affected as follows:

Zall Smart Commerce Group Ltd. Annual Report 201878
Notes to the Consolidated Financial Statements(Expressed in Renminbi unless otherwise indicated)
1 SIGNIFICANT ACCOUNTING POLICIES (Continued)
(c) Changes in accounting policies (Continued)
(ii) IFRS 15, Revenue from contracts with customers (Continued)
(a) Timing of revenue recognition (Continued)
The Group’s property development activities are carried out in Mainland China only. Taking into account the contract terms, the Group’s business practice and the legal and regulatory environment of Mainland China, the property sales contracts do not meet the criteria for recognising revenue over time and therefore revenue from property sales continues to be recognised at a point in time. Previously the Group recognised revenue from property sales when the construction of relevant properties has been completed and the properties have been delivered to the buyers, which was taken to be the point in time when the risks and rewards of ownership of the property were transferred to the customer. Under the transfer of-control approach in IFRS 15, revenue from property sales is generally recognised when the property is accepted by the customer, or deemed as accepted according to the contract, whichever is earlier, which is the point in time when the customer has the ability to direct the use of the property and obtain substantially all of the remaining benefits of the property.
This change in accounting policy had no material impact on opening balances as at 1 January 2018. However, in future periods it may have a material impact, depending on the timing of completion of the Group’s property development projects.
(b) Significant financing component
IFRS 15 requires an entity to adjust the transaction price for the time value of money when a contract contains a significant financing component, regardless of whether the payments from customers are received significantly in advance of revenue recognition or significantly deferred.
Previously, the Group only applied such a policy when payments were significantly deferred, which was not common in the Group’s arrangements with its customers. The Group did not apply such a policy when payments were received in advance.
It is common for the Group to receive payments significantly in advance of revenue recognition in the Group’s sales of properties when properties are marketed by the Group while the property is still under construction. Depending on market conditions, the Group requires the customers to pay off the full consideration within an agreed time frame while developments are still ongoing, rather than on the completion of the relevant properties. Such advance payment schemes result in contract liabilities being recognised throughout the remaining property development period for the full amount of the contract price. In addition, the contract liabilities will be increased by the amount of interest expense being accrued by the Group to reflect the effect of any significant financing benefit obtained from the customers during the period between the payment date and the completion date of delivery. As this accrual increases the amount of the contract liabilities during the period of development, it therefore increases the amount of revenue recognised when control of the completed property is transferred to the customer.

79Annual Report 2018 Zall Smart Commerce Group Ltd.
Notes to the Consolidated Financial Statements(Expressed in Renminbi unless otherwise indicated)
1 SIGNIFICANT ACCOUNTING POLICIES (Continued)
(c) Changes in accounting policies (Continued)
(ii) IFRS 15, Revenue from contracts with customers (Continued)
(b) Significant financing component (Continued)
Where payment schemes include a significant financing component, the transaction price is adjusted to separately account for this component. In the case of payments in advance, such adjustment results in interest expense being accrued by the Group to reflect the effect of the financing benefit obtained by the Group from the customers during the period between the payment date and the revenue recognition date. This accrual increases the amount of the contract liability during the period of construction, and therefore increases the amount of revenue recognised when control of the completed property is transferred to the customer. The interest is expensed as accrued unless it is eligible to be capitalised under IAS 23, Borrowing costs, in accordance with the polities set out in note 1(aa).
As a result of this change in policy, the Group has made adjustments which increased inventories and contract liabilities by RMB18,857,000 and RMB38,768,000 at 1 January 2018 respectively. As not all of the accrued interest was eligible to be capitalised into projects still under construction, this change in policy has decreased on retained earnings as at 1 January 2018 by RMB14,934,000.
(c) Sales commissions payable related to property sales contracts
The Group previously recognised sales commissions payable related to property sales contracts as distribution costs when they were incurred. Under IFRS 15, the Group is required to capitalise these sales commissions as costs of obtaining contracts when they are incremental and are expected to be recovered, unless the expected amortisation period is one year or less from the date of initial recognition of the asset, in which case the sales commissions can be expensed when incurred. Capitalised commissions are charged to profit or loss when the revenue from the related property sale is recognised and are included as distribution costs at that time.
This change in accounting policy had no material impact on opening balance as at 1 January 2018.

Zall Smart Commerce Group Ltd. Annual Report 201880
Notes to the Consolidated Financial Statements(Expressed in Renminbi unless otherwise indicated)
1 SIGNIFICANT ACCOUNTING POLICIES (Continued)
(c) Changes in accounting policies (Continued)
(ii) IFRS 15, Revenue from contracts with customers (Continued)
(d) Presentation of contract assets and liabilities
Under IFRS 15, a receivable is recognised only if the Group has an unconditional right to consideration. If the Group recognises the related revenue before being unconditionally entitled to the consideration for the promised goods and services in the contract, then the entitlement to consideration is classified as a contract asset. Similarly, a contract liability, rather than a payable, is recognised when a customer pays consideration, or is contractually required to pay consideration and the amount is already due, before the Group recognises the related revenue. For a single contract with the customer, either a net contract asset or a net contract liability is presented. For multiple contracts, contract assets and contract liabilities of unrelated contracts are not presented on a net basis (see note 1(o)).
Previously, contract balances relating to construction contracts in progress were presented in the statement of financial position under “long-term receivables” or “trade and other payables” respectively.
To reflect these changes in presentation, the Group has made the following adjustments at 1 January 2018, as a result of the adoption of IFRS 15:
(i) Gross amounts due from a customer for contract work amounting to RMB324,862,000 which was previously included in long-term receivables is now included under contract assets; and
(ii) “Receipts in advance” amounting to RMB1,008,532,000, which was previously included in trade and other payables is now included under contract liabilities.
(e) Disclosure of the estimated impact on the amounts reported in respect of the year ended 31 December 2018 as a result of the adoption of IFRS 15 on 1 January 2018
The following tables summarise the estimated impact of adoption of IFRS 15 on the Group’s consolidated financial statements for the year ended 31 December 2018, by comparing the amounts reported under IFRS 15 in these consolidated financial statements with estimates of the hypothetical amounts that would have been recognised under IAS 18 and IAS 11 if those superseded standards had continued to apply to 2018 instead of IFRS 15. These tables show only those line items impacted by the adoption of IFRS 15:
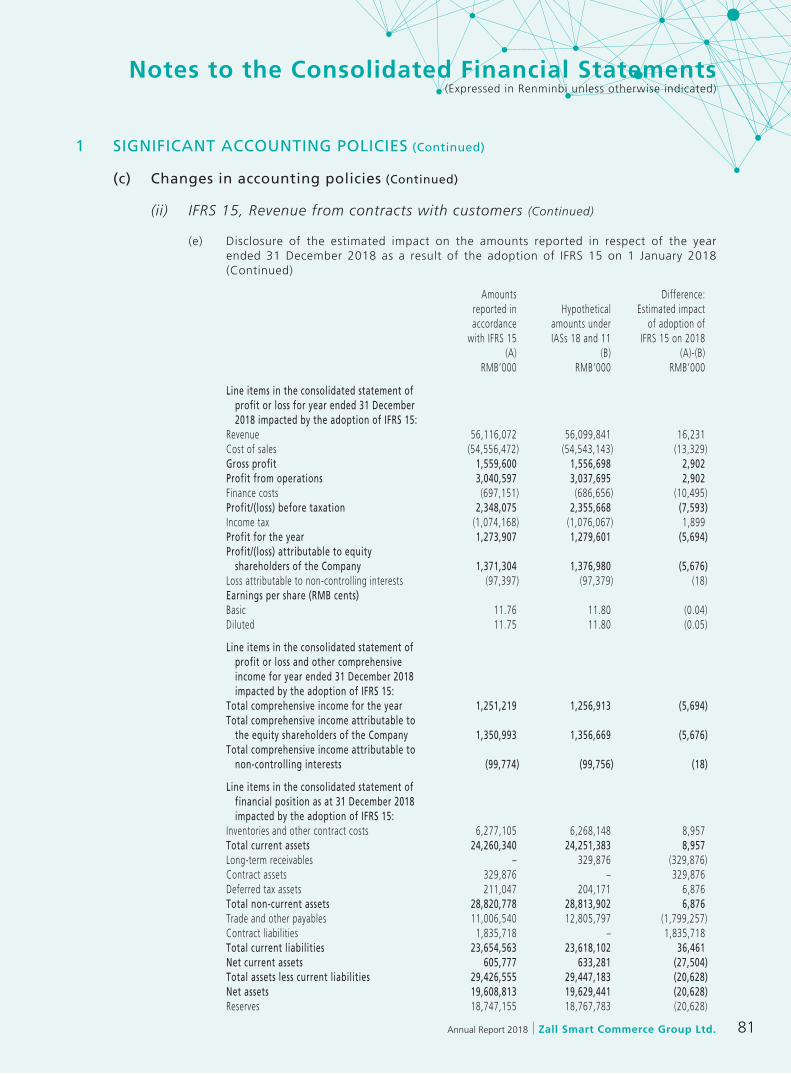
81Annual Report 2018 Zall Smart Commerce Group Ltd.
Notes to the Consolidated Financial Statements(Expressed in Renminbi unless otherwise indicated)
1 SIGNIFICANT ACCOUNTING POLICIES (Continued)
(c) Changes in accounting policies (Continued)
(ii) IFRS 15, Revenue from contracts with customers (Continued)
(e) Disclosure of the estimated impact on the amounts reported in respect of the year ended 31 December 2018 as a result of the adoption of IFRS 15 on 1 January 2018 (Continued)
Amounts reported in accordance
with IFRS 15
Hypothetical amounts under IASs 18 and 11
Difference: Estimated impact
of adoption of IFRS 15 on 2018
(A) (B) (A)-(B)RMB’000 RMB’000 RMB’000
Line items in the consolidated statement of profit or loss for year ended 31 December 2018 impacted by the adoption of IFRS 15:Revenue 56,116,072 56,099,841 16,231Cost of sales (54,556,472) (54,543,143) (13,329)Gross profit 1,559,600 1,556,698 2,902Profit from operations 3,040,597 3,037,695 2,902Finance costs (697,151) (686,656) (10,495)Profit/(loss) before taxation 2,348,075 2,355,668 (7,593)Income tax (1,074,168) (1,076,067) 1,899Profit for the year 1,273,907 1,279,601 (5,694)Profit/(loss) attributable to equity shareholders of the Company 1,371,304 1,376,980 (5,676)Loss attributable to non-controlling interests (97,397) (97,379) (18)Earnings per share (RMB cents)Basic 11.76 11.80 (0.04)Diluted 11.75 11.80 (0.05)
Line items in the consolidated statement of profit or loss and other comprehensive income for year ended 31 December 2018 impacted by the adoption of IFRS 15:Total comprehensive income for the year 1,251,219 1,256,913 (5,694)Total comprehensive income attributable to the equity shareholders of the Company 1,350,993 1,356,669 (5,676)Total comprehensive income attributable to non-controlling interests (99,774) (99,756) (18)
Line items in the consolidated statement of financial position as at 31 December 2018 impacted by the adoption of IFRS 15:Inventories and other contract costs 6,277,105 6,268,148 8,957Total current assets 24,260,340 24,251,383 8,957Long-term receivables – 329,876 (329,876)Contract assets 329,876 – 329,876Deferred tax assets 211,047 204,171 6,876Total non-current assets 28,820,778 28,813,902 6,876Trade and other payables 11,006,540 12,805,797 (1,799,257)Contract liabilities 1,835,718 – 1,835,718Total current liabilities 23,654,563 23,618,102 36,461Net current assets 605,777 633,281 (27,504)Total assets less current liabilities 29,426,555 29,447,183 (20,628)Net assets 19,608,813 19,629,441 (20,628)Reserves 18,747,155 18,767,783 (20,628)
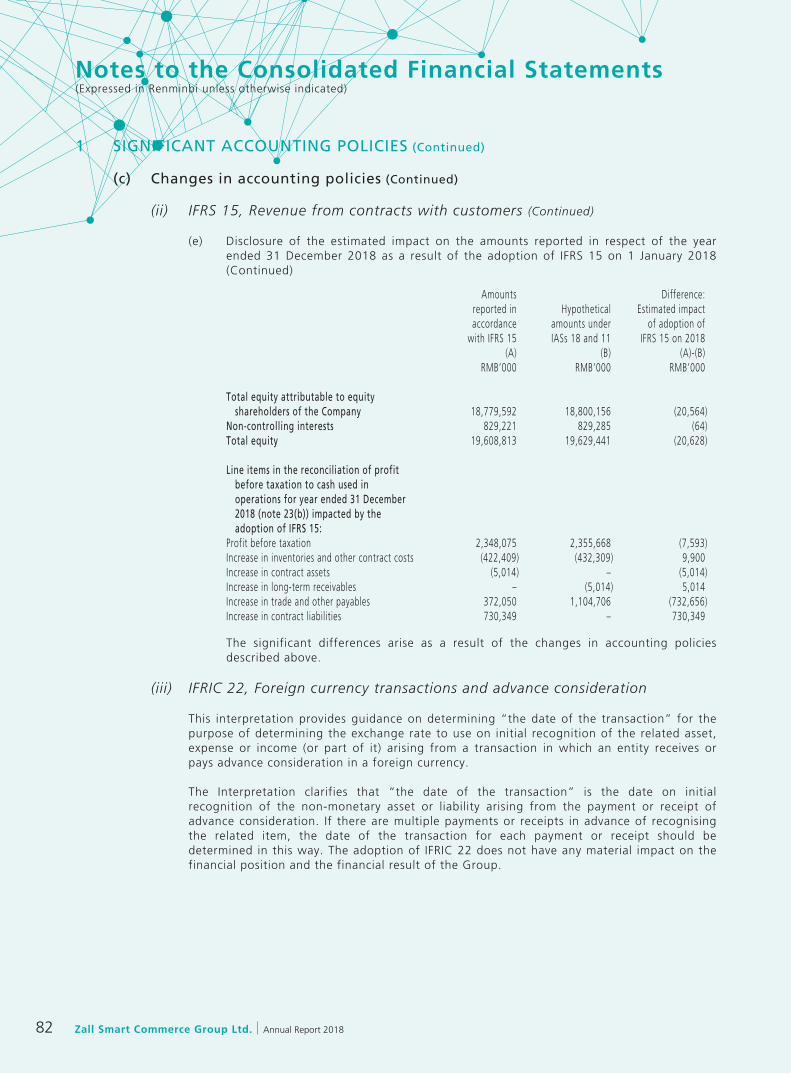
Zall Smart Commerce Group Ltd. Annual Report 201882
Notes to the Consolidated Financial Statements(Expressed in Renminbi unless otherwise indicated)
1 SIGNIFICANT ACCOUNTING POLICIES (Continued)
(c) Changes in accounting policies (Continued)
(ii) IFRS 15, Revenue from contracts with customers (Continued)
(e) Disclosure of the estimated impact on the amounts reported in respect of the year ended 31 December 2018 as a result of the adoption of IFRS 15 on 1 January 2018 (Continued)
Amounts reported in accordance
with IFRS 15
Hypothetical amounts under IASs 18 and 11
Difference: Estimated impact
of adoption of IFRS 15 on 2018
(A) (B) (A)-(B)RMB’000 RMB’000 RMB’000
Total equity attributable to equity shareholders of the Company 18,779,592 18,800,156 (20,564)Non-controlling interests 829,221 829,285 (64)Total equity 19,608,813 19,629,441 (20,628)
Line items in the reconciliation of profit before taxation to cash used in operations for year ended 31 December 2018 (note 23(b)) impacted by the adoption of IFRS 15:Profit before taxation 2,348,075 2,355,668 (7,593)Increase in inventories and other contract costs (422,409) (432,309) 9,900Increase in contract assets (5,014) – (5,014)Increase in long-term receivables – (5,014) 5,014Increase in trade and other payables 372,050 1,104,706 (732,656)Increase in contract liabilities 730,349 – 730,349
The significant differences arise as a result of the changes in accounting policies described above.
(iii) IFRIC 22, Foreign currency transactions and advance consideration
This interpretation provides guidance on determining “the date of the transaction” for the purpose of determining the exchange rate to use on initial recognition of the related asset, expense or income (or part of it) arising from a transaction in which an entity receives or pays advance consideration in a foreign currency.
The Interpretation clarifies that “the date of the transaction” is the date on initial recognition of the non-monetary asset or liability arising from the payment or receipt of advance consideration. If there are multiple payments or receipts in advance of recognising the related item, the date of the transaction for each payment or receipt should be determined in this way. The adoption of IFRIC 22 does not have any material impact on the financial position and the financial result of the Group.

83Annual Report 2018 Zall Smart Commerce Group Ltd.
Notes to the Consolidated Financial Statements(Expressed in Renminbi unless otherwise indicated)
1 SIGNIFICANT ACCOUNTING POLICIES (Continued)
(d) Subsidiaries and non-controlling interests
Subsidiaries are entities controlled by the Group. The Group controls an entity when it is exposed, or has rights, to variable returns from its involvement with the entity and has the ability to affect those returns through its power over the entity. When assessing whether the Group has power, only substantive rights (held by the Group and other parties) are considered.
An investment in a subsidiary is consolidated into the consolidated financial statements from the date that control commences until the date that control ceases. The consideration transferred in the acquisition is generally measured at fair value. Any contingent consideration is measured at fair value at the date of acquisition. If an obligation to pay contingent consideration that meets the definition of a financial instrument is classified as equity, then it is not remeasured and settlement is accounted for within equity. Otherwise, other contingent consideration is remeasured at fair value at each reporting date and subsequent changes in the fair value of the contingent consideration are recognised in profit or loss. Intra-group balances, transactions and cash flows and any unrealised profits arising from intra-group transactions are eliminated in full in preparing the consolidated financial statements. Unrealised losses resulting from intra-group transactions are eliminated in the same way as unrealised gains but only to the extent that there is no evidence of impairment.
Non-controlling interests represent the equity in a subsidiary not attributable directly or indirectly to the Company, and in respect of which the Group has not agreed any additional terms with the holders of those interests which would result in the Group as a whole having a contractual obligation in respect of those interests that meets the definition of a financial liability. For each business combination, the Group can elect to measure any non-controlling interests either at fair value or at the non-controlling interests’ proportionate share of the subsidiary’s net identifiable assets.
Non-controlling interests are presented in the consolidated statement of financial position within equity, separately from equity attributable to the equity shareholders of the Company. Non-controlling interests in the results of the Group are presented on the face of the consolidated statement of profit or loss and the consolidated statement of profit or loss and other comprehensive income as an allocation of the total profit or loss and total comprehensive income for the year between non-controlling interests and the equity shareholders of the Company. Loans from holders of non-controlling interests and other contractual obligations towards these holders are presented as financial liabilities in the consolidated statement of financial position in accordance with notes 1(r) or 1(s), depending on the nature of the liability.
Changes in the Group’s interests in a subsidiary that do not result in a loss of control are accounted for as equity transactions, whereby adjustments are made to the amounts of controlling and non-controlling interests within consolidated equity to reflect the change in relative interests, but no adjustments are made to goodwill and no gain or loss is recognised.
When the Group loses control of a subsidiary, it is accounted for as a disposal of the entire interest in that subsidiary, with a resulting gain or loss being recognised in profit or loss.
In the Company’s statement of financial position, an investment in a subsidiary is stated at cost less impairment losses (see note 1(m)(iii)).

Zall Smart Commerce Group Ltd. Annual Report 201884
Notes to the Consolidated Financial Statements(Expressed in Renminbi unless otherwise indicated)
1 SIGNIFICANT ACCOUNTING POLICIES (Continued)
(e) Associates and joint ventures
An associate is an entity in which the Group or Company has significant influence, but not control or joint control, over its management, including participation in the financial and operating policy decisions.
A joint venture is an arrangement whereby the Group or Company and other parties contractually agree to share control of the arrangement, and have rights to the net assets of the arrangement.
An investment in an associate or a joint venture is accounted for in the consolidated financial statements under the equity method. Under the equity method, the investment is initially recorded at cost, adjusted for any excess of the Group’s share of the acquisition-date fair values of the investee’s identifiable net assets over the cost of the investment (if any). The cost of the investment includes purchase price, other costs directly attributable to the acquisition of the investment, and any direct investment into the associate or joint venture that forms part of the Group’s equity investment. Thereafter, the investment is adjusted for the post acquisition change in the Group’s share of the investee’s net assets and any impairment loss relating to the investment (see notes 1(f) and (m)(iii)). Any acquisition-date excess over cost, the Group’s share of the post-acquisition, post-tax results of the investees and any impairment losses for the year are recognised in the consolidated statement of profit or loss, whereas the Group’s share of the post-acquisition post-tax items of the investees’ other comprehensive income is recognised in the consolidated statement of profit or loss and other comprehensive income.
When the Group’s share of losses exceeds its interest in the associate or the joint venture, the Group’s interest is reduced to nil and recognition of further losses is discontinued except to the extent that the Group has incurred legal or constructive obligations or made payments on behalf of the investee. For this purpose, the Group’s interest is the carrying amount of the investment under the equity method together with any other long-term interests that in substance form part of the Group’s net investment in the associate or the joint venture.
In the Company’s statement of financial position, investments in associates and joint ventures are stated at cost less impairment losses (see note 1(m)(iii)).
(f) Goodwill
Goodwill represents the excess of
(i) the aggregate of the fair value of the consideration transferred, the amount of any non-controlling interest in the acquiree and the fair value of the Group’s previously held equity interest in the acquire; over
(ii) the net fair value of the acquiree’s identifiable assets and liabilities measured as at the acquisition date.
When (ii) is greater than (i), then this excess is recognised immediately in profit or loss as a gain on a bargain purchase.
Goodwill is stated at cost less accumulated impairment losses. Goodwill arising on a business combination is allocated to each cash-generating unit, or groups of cash generating units, that is expected to benefit from the synergies of the combination and is tested annually for impairment (see note 1(m)(iii)).
On disposal of a cash generating unit during the year, any attributable amount of purchased goodwill is included in the calculation of the profit or loss on disposal.
85Annual Report 2018 Zall Smart Commerce Group Ltd.
Notes to the Consolidated Financial Statements(Expressed in Renminbi unless otherwise indicated)
1 SIGNIFICANT ACCOUNTING POLICIES (Continued)
(g) Other investments in debt and equity securities
The Group’s policies for investments in equity securities and investment in wealth management products and trust products, other than investments in subsidiaries, associates and joint ventures, are set out below.
Investments in debt and equity securities are recognised/derecognised on the date the Group commits to purchase/sell the investment. The investments are initially stated at fair value plus directly attributable transaction costs, except for those investments measured at fair value through profit or loss (FVPL) for which transaction costs are recognised directly in profit or loss. For an explanation of how the Group determines fair value of financial instruments, see note 30(f). These investments are subsequently accounted for as follows, depending on their classification.
(A) Policy applicable from 1 January 2018
Investments other than equity investments
Non-equity investments held by the Group are classified into one of the following measurement categories:
– amortised cost, if the investment is held for the collection of contractual cash flows which represent solely payments of principal and interest. Interest income from the investment is calculated using the effective interest method (see note 1(y)(vi)).
– fair value through other comprehensive income (FVOCI) – recycling, if the contractual cash flows of the investment comprise solely payments of principal and interest and the investment is held within a business model whose objective is achieved by both the collection of contractual cash flows and sale. Changes in fair value are recognised in other comprehensive income, except for the recognition in profit or loss of expected credit losses, interest income (calculated using the effective interest method) and foreign exchange gains and losses. When the investment is derecognised, the amount accumulated in other comprehensive income is recycled from equity to profit or loss.
– fair value at profit or loss (FVPL) if the investment does not meet the criteria for being measured at amortised cost or FVOCI (recycling). Changes in the fair value of the investment (including interest) are recognised in profit or loss.
Equity investments
An investment in equity securities is classified as FVPL unless the equity investment is not held for trading purposes and on initial recognition of the investment the Group makes an irrevocable election to designate the investment at FVOCI (non-recycling) such that subsequent changes in fair value are recognised in other comprehensive income. Such elections are made on an instrument-by-instrument basis, but may only be made if the investment meets the definition of equity from the issuer’s perspective. Where such an election is made, the amount accumulated in other comprehensive income remains in the fair value reserve (non-recycling) until the investment is disposed of. At the time of disposal, the amount accumulated in the fair value reserve (non-recycling) is transferred to retained earnings. It is not recycled through profit or loss. Dividends from an investment in equity securities, irrespective of whether classified as at FVPL or FVOCI, are recognised in profit or loss as other income in accordance with the policy set out in note 1(y)(v).
Zall Smart Commerce Group Ltd. Annual Report 201886
Notes to the Consolidated Financial Statements(Expressed in Renminbi unless otherwise indicated)
1 SIGNIFICANT ACCOUNTING POLICIES (Continued)
(g) Other investments in debt and equity securities (Continued)
(B) Policy applicable prior to 1 January 2018
Investments in securities held for trading were classified as financial assets measured at FVPL. Any attributable transaction costs were recognised in profit or loss as incurred. At the end of each reporting period the fair value was remeasured, with any resultant gain or loss being recognised in profit or loss.
Dated debt securities that the Group had the positive ability and intention to hold to maturity were classified as held-to-maturity securities. Held-to-maturity securities were stated at amortised cost (for impairment see note 1(m)(i) – policy applicable prior to 1 January 2018).
Investments which did not fall into any of the above categories were classified as available- for-sale financial assets. At the end of each reporting period the fair value was remeasured, with any resultant gain or loss being recognised in other comprehensive income and accumulated separately in equity in the fair value reserve (recycling). Dividend income from equity investments and interest income from debt securities calculated using the effective interest method were recognised in profit or loss in accordance with the policies set out in notes 1(y)(v) and 1(y)(vi), respectively. When the investments were derecognised or impaired (see note 1(m)(i) – policy applicable prior to 1 January 2018), the cumulative gain or loss recognised in equity was reclassified to profit or loss. As an exception to this, investments in equity securities that do not have a quoted price in an active market for an identical instrument and whose fair value cannot otherwise be reliably measured are recognised in the statement of financial position at cost less impairment losses.
(h) Derivative financial instruments
Derivative financial instruments are recognised at fair value. At the end of each reporting period the fair value is remeasured. The gain or loss on remeasurement to fair value is recognised immediately in profit or loss.
(i) Investment properties
Investment properties are land and/or buildings which are owned or held under a leasehold interest (see note 1(l)) to earn rental income and/or for capital appreciation. These include land held for a currently undetermined future use and property that is being constructed or developed for future use as investment property.
Investment properties are stated at fair value, unless they are still in the course of construction or development at the end of the reporting period and their fair value cannot be reliably measured at that time. Any gain or loss arising from a change in fair value or from the retirement or disposal of an investment property is recognised in profit or loss. Rental income from investment properties is accounted for as described in note 1(y)(iv).
When the Group holds a property interest under an operating lease to earn rental income and/or for capital appreciation, the interest is classified and accounted for as an investment property on a property-by-property basis. Any such property interest which has been classified as an investment property is accounted for as if it were held under a finance lease (see note 1(l)), and the same accounting policies are applied to that interest as are applied to other investment properties leased under finance leases. Lease payments are accounted for as described in note 1(l).
87Annual Report 2018 Zall Smart Commerce Group Ltd.
Notes to the Consolidated Financial Statements(Expressed in Renminbi unless otherwise indicated)
1 SIGNIFICANT ACCOUNTING POLICIES (Continued)
(j) Property, plant and equipment
Items of property, plant and equipment are stated at cost less accumulated depreciation and impairment losses (see note 1(m)(iii)).
The cost of self-constructed items of property, plant and equipment includes the cost of materials, direct labour, the initial estimate, where relevant, of the costs of dismantling and removing the items and restoring the site on which they are located, and an appropriate proportion of production overheads and borrowing costs (see note 1(aa)).
Gains or losses arising from the retirement or disposal of an item of property, plant and equipment are determined as the difference between the net disposal proceeds and the carrying amount of the item and are recognised in profit or loss on the date of retirement or disposal.
Depreciation is calculated to write-off the cost of items of property, plant and equipment, less their estimated residual value, if any, using the straight-line method over their estimated useful lives as follows:
Buildings situated on leasehold land are depreciated over the shorter of the unexpired terms of lease and their estimated useful lives, being no more than 50 years after the date of completion
Motor vehicles 3-10 yearsFurniture, office equipment and others 3-8 years
Where parts of an item of property, plant and equipment have different useful lives, the cost of the item is allocated on a reasonable basis between the parts and each part is depreciated separately. Both the useful life of an asset and its residual value, if any, are reviewed annually.
Transfers from property, plant and equipment to investment properties shall be made when, and only when, there is a change in use, evidenced by end of owner-occupation. If an owner-occupied property becomes an investment property that will be carried at fair value, any difference at the date of the change in use between the carrying amount of the property and its fair value is recognised as a revaluation of property, plant and equipment, even if the property was previously measured using the cost model. Any existing or arising revaluation surplus previously recognised in other comprehensive income (“OCI”) is not transferred to profit or loss at the date of transfer or on subsequent disposal of the investment property.
(k) Intangible asset (other than goodwill)
Intangible assets that are acquired by the Group are stated at cost less accumulated amortisation (where the estimated useful life is finite) and impairment losses (see note 1(m)(iii)).
Amortisation of intangible assets with finite useful lives is charged to profit or loss on a straight-line basis over the assets’ estimated useful lives. The following intangible assets with finite useful lives are amortised from the date they are available for use and their estimated useful lives are as follows:
– unfinished contracts 2 years– software 3-10 years– favorable contracts 2.5 years– customer relationship 20 years– trademark 8 years
Both the period and method of amortisation are reviewed annually.

Zall Smart Commerce Group Ltd. Annual Report 201888
Notes to the Consolidated Financial Statements(Expressed in Renminbi unless otherwise indicated)
1 SIGNIFICANT ACCOUNTING POLICIES (Continued)
(k) Intangible asset (other than goodwill) (Continued)
Trademark with indefinite useful lives is not amortised. Any conclusion that the useful life of an intangible asset is indefinite is reviewed annually to determine whether events and circumstances continue to support the indefinite useful life assessment for that asset. If they do not, the change in the useful life assessment from indefinite to finite is accounted for prospectively from the date of change and in accordance with the policy for amortisation of intangible assets with finite lives as set out above.
(l) Leased assets
An arrangement, comprising a transaction or a series of transactions, is or contains a lease if the Group determines that the arrangement conveys a right to use a specific asset or assets for an agreed period of time in return for a payment or a series of payments. Such a determination is made based on an evaluation of the substance of the arrangement and is regardless of whether the arrangement takes the legal form of a lease.
(i) Classification of assets leased to the Group
Assets that are held by Group under leases which transfer to the Group substantially all the risks and rewards of ownership are classified as being held under finance leases. Leases which do not transfer substantially all the risks and rewards of ownership to the Group are classified as operating leases, with the following exceptions:
– property held under operating leases that would otherwise meet the definition of a investment property is classified as investment property on a property-by-property basis and, if classified as investment property, is accounted for as if held under a finance lease (see note 1(i)); and
– land held for own use under an operating lease, the fair value of which cannot be measured separately from the fair value of a building situated thereon at the inception of the lease, is accounted for as being held under a finance lease, unless the building is also clearly held under an operating lease. For these purposes, the inception of the lease is the time that the lease was first entered into by the Group, or taken over from the previous lessee.
(ii) Operating lease charges
Where the Group has the use of assets held under operating leases, payments made under the leases are charged to profit or loss in equal instalments over the accounting periods covered by the lease term, except where an alternative basis is more representative of the pattern of benefits to be derived from the leased asset. Lease incentives received are recognised in profit or loss as an integral part of the aggregate net lease payments made. Contingent rentals are charged to profit or loss in the accounting period in which they are incurred.
The cost of acquiring land held under an operating lease is amortised on a straight-line basis over the period of the lease term except where the property is classified as an investment property (see note 1(i)), or property under development for sales or completed property held for sale (see note 1(n)).

89Annual Report 2018 Zall Smart Commerce Group Ltd.
Notes to the Consolidated Financial Statements(Expressed in Renminbi unless otherwise indicated)
1 SIGNIFICANT ACCOUNTING POLICIES (Continued)
(m) Credit losses and impairment of assets
(i) Credit losses from financial instruments, contract assets and lease receivables
A. Policy applicable from 1 January 2018
The Group recognises a loss allowance for expected credit losses (ECLs) on the following items:
– financial assets measured at amortised cost (including cash and cash equivalents, fixed deposits with banks with original maturity over three months, pledged bank deposits, trade and other receivables and amounts due from related parties);
– contract assets as defined in IFRS 15 (see note 1(o));
– lease receivables; and
– financial guarantee contracts issued.
Financial assets measured at fair value, including equity securities measured at FVPL, equity securities designated at FVOCI (non-recycling) and derivative financial assets, are not subject to the ECL assessment.
Measurement of ECLs
ECLs are a probability-weighted estimate of credit losses. Credit losses are measured as the present value of all expected cash shortfalls (i.e. the difference between the cash flows due to the Group in accordance with the contract and the cash flows that the Group expects to receive).
The expected cash shortfalls are discounted using the following discount rates where the effect of discounting is material:
– fixed-rate financial assets, trade and other receivables and contract assets: effective interest rate determined at initial recognition or an approximation thereof;
– variable-rate financial assets: current effective interest rate;
– lease receivables: discount rate used in the measurement of the lease receivables.
The maximum period considered when estimating ECLs is the maximum contractual period over which the Group is exposed to credit risk.
In measuring ECLs, the Group takes into account reasonable and supportable information that is available without undue cost or effort. This includes information about past events, current conditions and forecasts of future economic conditions.
Zall Smart Commerce Group Ltd. Annual Report 201890
Notes to the Consolidated Financial Statements(Expressed in Renminbi unless otherwise indicated)
1 SIGNIFICANT ACCOUNTING POLICIES (Continued)
(m) Credit losses and impairment of assets (Continued)
(i) Credit losses from financial instruments, contract assets and lease receivables (Continued)
A. Policy applicable from 1 January 2018 (Continued)
ECLs are measured on either of the following bases:
– 12-month ECLs: these are losses that are expected to result from possible default events within the 12 months after the reporting date; and
– Lifetime ECLs: these are losses that are expected to result from all possible default events over the expected lives of the items to which the ECL model applies.
Loss allowances for trade debtors, lease receivables (included in “trade debtors and bills receivables”) and contract assets are always measured at an amount equal to lifetime ECLs. ECLs on these financial assets are estimated using a provision matrix based on the Group’s historical credit loss experience, adjusted for factors that are specific to the debtors and an assessment of both the current and forecast general economic conditions at the reporting date.
For loans and factoring receivables and all other financial instruments, the Group recognises a loss allowance equal to 12-month ECLs unless there has been a significant increase in credit risk of the financial instrument since initial recognition, in which case the loss allowance is measured at an amount equal to lifetime ECLs.
Significant increases in credit risk
In assessing whether the credit risk of a financial instrument has increased significantly since initial recognition, the Group compares the risk of default occurring on the financial instrument assessed at the reporting date with that assessed at the date of initial recognition. In making this reassessment, the Group considers that a default event occurs when (i) the borrower is unlikely to pay its credit obligations to the Group in full, without recourse by the Group to actions such as realising security (if any is held); or (ii) the financial asset is 90 days past due. The Group considers both quantitative and qualitative information that is reasonable and supportable, including historical experience and forward-looking information that is available without undue cost or effort.
In particular, the following information is taken into account when assessing whether credit risk has increased significantly since initial recognition:
– failure to make payments of principal or interest on their contractually due dates;
– an actual or expected significant deterioration in a financial instrument’s external or internal credit rating (if available);
– an actual or expected significant deterioration in the operating results of the debtor; and
– existing or forecast changes in the technological, market, economic or legal environment that have a significant adverse effect on the debtor’s ability to meet its obligation to the Group.

91Annual Report 2018 Zall Smart Commerce Group Ltd.
Notes to the Consolidated Financial Statements(Expressed in Renminbi unless otherwise indicated)
1 SIGNIFICANT ACCOUNTING POLICIES (Continued)
(m) Credit losses and impairment of assets (Continued)
(i) Credit losses from financial instruments, contract assets and lease receivables (Continued)
A. Policy applicable from 1 January 2018 (Continued)
Depending on the nature of the financial instruments, the assessment of a significant increase in credit risk is performed on either an individual basis or a collective basis. When the assessment is performed on a collective basis, the financial instruments are grouped based on shared credit risk characteristics, such as past due status and credit risk ratings.
ECLs are remeasured at each reporting date to reflect changes in the financial instrument’s credit risk since initial recognition. Any change in the ECL amount is recognised as an impairment gain or loss in profit or loss. The Group recognises an impairment gain or loss for all financial instruments with a corresponding adjustment to their carrying amount through a loss allowance account.
Basis of calculation of interest income
Interest income recognised in accordance with note 1(y)(vi) is calculated based on the gross carrying amount of the financial asset unless the financial asset is credit-impaired, in which case interest income is calculated based on the amortised cost (i.e. the gross carrying amount less loss allowance) of the financial asset.
At each reporting date, the Group assesses whether a financial asset is credit-impaired. A financial asset is credit-impaired when one or more events that have a detrimental impact on the estimated future cash flows of the financial asset have occurred.
Evidence that a financial asset is credit-impaired includes the following observable events:
– significant financial difficulties of the debtor;
– a breach of contract, such as a default or delinquency in interest or principal payments;
– it becoming probable that the borrower will enter into bankruptcy or other financial reorganisation;
– significant changes in the technological, market, economic or legal environment that have an adverse effect on the debtor; or
– the disappearance of an active market for a security because of financial difficulties of the issuer.
Write-off policy
The gross carrying amount of a financial asset, lease receivable or contract asset is written off (either partially or in full) to the extent that there is no realistic prospect of recovery. This is generally the case when the Group determines that the debtor does not have assets or sources of income that could generate sufficient cash flows to repay the amounts subject to the write-off.
Subsequent recoveries of an asset that was previously written off are recognised as a reversal of impairment in profit or loss in the period in which the recovery occurs.
Zall Smart Commerce Group Ltd. Annual Report 201892
Notes to the Consolidated Financial Statements(Expressed in Renminbi unless otherwise indicated)
1 SIGNIFICANT ACCOUNTING POLICIES (Continued)
(m) Credit losses and impairment of assets (Continued)
(i) Credit losses from financial instruments, contract assets and lease receivables (Continued)
B. Policy applicable prior to 1 January 2018
Prior to 1 January 2018, an “incurred loss” model was used to measure impairment losses on financial assets not classified as at FVPL (e.g. trade and other receivables and available-for-sale investments). Under the “incurred loss” model, an impairment loss was recognised only when there was objective evidence of impairment. Objective evidence of impairment included:
– significant financial difficulties of the debtor;
– a breach of contract, such as a default or delinquency in interest or principal payments;
– it becoming probable that the debtor will enter bankruptcy or other financial reorganisation;
– significant changes in the technological, market, economic or legal environment that have an adverse effect on the debtor; and
– a significant or prolonged decline in the fair value of an investment in an equity instrument below its cost.
If any such evidence existed, an impairment loss was determined and recognised as follows:
– For trade and other receivables and other financial assets carried at amortised cost, impairment loss was measured as the difference between the asset’s carrying amount and the present value of estimated future cash flows, discounted at the financial asset’s original effective interest rate, where the effect of discounting was material. This assessment was made collectively where these financial assets shared similar risk characteristics, such as similar past due status, and had not been individually assessed as impaired. Future cash flows for financial assets which were assessed for impairment collectively were based on historical loss experience for assets with credit risk characteristics similar to the collective Group.
If in a subsequent period the amount of an impairment loss decreased and the decrease could be linked objectively to an event occurring after the impairment loss was recognised, the impairment loss was reversed through profit or loss. A reversal of an impairment loss was only recognised to the extent that it did not result in the asset’s carrying amount exceeding that which would have been determined had no impairment loss been recognised in prior years.
When the recovery of a trade debtor or other financial assets carried at amortised cost was considered doubtful but not remote, associated impairment losses were recorded using an allowance account. When the Group was satisfied that recovery was remote, the amount considered irrecoverable was written off against the gross carrying amount of those assets directly. Subsequent recoveries of amounts previously charged to the allowance account were reversed against the allowance account. Other changes in the allowance account and subsequent recoveries of amounts previously written off directly were recognised in profit or loss.

93Annual Report 2018 Zall Smart Commerce Group Ltd.
Notes to the Consolidated Financial Statements(Expressed in Renminbi unless otherwise indicated)
1 SIGNIFICANT ACCOUNTING POLICIES (Continued)
(m) Credit losses and impairment of assets (Continued)
(i) Credit losses from financial instruments, contract assets and lease receivables (Continued)
B. Policy applicable prior to 1 January 2018 (Continued)
– For unquoted equity securities carried at cost, the impairment loss is measured as the difference between the carrying amount of the financial asset and the estimated future cash flows, discounted at the current market rate of return for a similar financial asset where the effect of discounting is material. Impairment losses for equity securities carried at cost are not reversed.
– For available-for-sale investments, the cumulative loss that had been recognised in the fair value reserve (recycling) was reclassified to profit or loss. The amount of the cumulative loss that was recognised in profit or loss was the difference between the acquisition cost (net of any principal repayment and amortisation) and current fair value, less any impairment loss on that asset previously recognised in profit or loss.
Impairment losses recognised in profit or loss in respect of available-for-sale equity securities were not reversed through profit or loss. Any subsequent increase in the fair value of such assets was recognised in other comprehensive income.
(ii) Credit losses from financial guarantees issued
Financial guarantees are contracts that require the issuer (i.e. the guarantor) to make specified payments to reimburse the beneficiary of the guarantee (the “holder”) for a loss the holder incurs because a specified debtor fails to make payment when due in accordance with the terms of a debt instrument.
Financial guarantees issued are initially recognised within “trade and other payables” at fair value, which is determined by reference to fees charged in an arm’s length transaction for similar services, when such information is obtainable, or to interest rate differentials, by comparing the actual rates charged by lenders when the guarantee is made available with the estimated rates that lenders would have charged, had the guarantees not been available, where reliable estimates of such information can be made. Where consideration is received or receivable for the issuance of the guarantee, the consideration is recognised in accordance with the Group’s policies applicable to that category of asset. Where no such consideration is received or receivable, an immediate expense is recognised in profit or loss.
Subsequent to initial recognition, the amount initially recognised as deferred income is amortised in profit or loss over the term of the guarantee as income from financial guarantees issued (see note 1(y)(viii)).

Zall Smart Commerce Group Ltd. Annual Report 201894
Notes to the Consolidated Financial Statements(Expressed in Renminbi unless otherwise indicated)
1 SIGNIFICANT ACCOUNTING POLICIES (Continued)
(m) Credit losses and impairment of assets (Continued)
(ii) Credit losses from financial guarantees issued (Continued)
(A) Policy applicable from 1 January 2018
The Group monitors the risk that the specified debtor will default on the contract and recognises a provision when ECLs on the financial guarantees are determined to be higher than the amount carried in “trade and other payables” in respect of the guarantees (i.e. the amount initially recognised, less accumulated amortisation).
To determine ECLs, the Group considers changes in the risk of default of the specified debtor since the issuance of the guarantee. A 12-month ECL is measured unless the risk that the specified debtor will default has increased significantly since the guarantee is issued, in which case a lifetime ECL is measured. The same definition of default and the same assessment of significant increase in credit risk as described in note 1(m)(i) apply.
As the Group is required to make payments only in the event of a default by the specified debtor in accordance with the terms of the instrument that is guaranteed, an ECL is estimated based on the expected payments to reimburse the holder for a credit loss that it incurs less any amount that the Group expects to receive from the holder of the guarantee, the specified debtor or any other party. The amount is then discounted using the current risk-free rate adjusted for risks specific to the cash flows.
(B) Policy applicable prior to 1 January 2018
Prior to 1 January 2018, a provision would be recognised if and when it became probable that (i) the holder of the guarantee would call upon the Group under the guarantee and (ii) the amount of the claim on the Group was expected to exceed the amount carried in “trade and other payables” in respect of the guarantee.
(iii) Impairment of other non-current assets
Internal and external sources of information are reviewed at the end of each reporting period to identify indications that the following assets may be impaired or, except in the case of goodwill, an impairment loss previously recognised no longer exists or may have decreased:
– property, plant and equipment;
– intangible assets;
– goodwill; and
– investment in subsidiaries, associates and joint ventures.
If any such indication exists, the asset’s recoverable amount is estimated. In addition, for goodwill and intangible assets that have indefinite useful lives, the recoverable amount is estimated annually whether or not there is any indication of impairment.

95Annual Report 2018 Zall Smart Commerce Group Ltd.
Notes to the Consolidated Financial Statements(Expressed in Renminbi unless otherwise indicated)
1 SIGNIFICANT ACCOUNTING POLICIES (Continued)
(m) Credit losses and impairment of assets (Continued)
(iii) Impairment of other non-current assets (Continued)
– Calculation of recoverable amount
The recoverable amount of an asset is the greater of its fair value less costs of disposal and value in use. In assessing value in use, the estimated future cash flows are discounted to their present value using a pre-tax discount rate that reflects current market assessments of the time value of money and the risks specific to the asset. Where an asset does not generate cash inflows largely independent of those from other assets, the recoverable amount is determined for the smallest group of assets that generates cash inflows independently (i.e. a cash-generating unit).
– Recognition of impairment losses
An impairment loss is recognised in profit or loss if the carrying amount of an asset, or the cash-generating unit to which it belongs, exceeds its recoverable amount. Impairment losses recognised in respect of cash-generating units are allocated first to reduce the carrying amount of any goodwill allocated to the cash-generating unit (or group of units) and then, to reduce the carrying amount of the other assets in the unit (or group of units) on a pro rata basis, except that the carrying value of an asset will not be reduced below its individual fair value less costs of disposal (if measurable) or value in use (if determinable).
– Reversals of impairment losses
In respect of assets other than goodwill, an impairment loss is reversed if there has been a favourable change in the estimates used to determine the recoverable amount. An impairment loss in respect of goodwill is not reversed.
A reversal of an impairment loss is limited to the asset’s carrying amount that would have been determined had no impairment loss been recognised in prior years. Reversals of impairment losses are credited to profit or loss in the year in which the reversals are recognised.
(iv) Interim financial reporting and impairment
Under the Rules Governing the Listing of Securities on the Stock Exchange of Hong Kong Limited, the Group is required to prepare an interim financial report in compliance with IAS 34, Interim financial reporting, in respect of the first six months of the financial year. At the end of the interim period, the Group applies the same impairment testing, recognition, and reversal criteria as it would at the end of the financial year (see notes 1(m)(i) and (ii)).
Impairment losses recognised in an interim period in respect of goodwill are not reversed in a subsequent period. This is the case even if no loss, or a smaller loss, would have been recognised had the impairment been assessed only at the end of the financial year to which the interim period relates.

Zall Smart Commerce Group Ltd. Annual Report 201896
Notes to the Consolidated Financial Statements(Expressed in Renminbi unless otherwise indicated)
1 SIGNIFICANT ACCOUNTING POLICIES (Continued)
(n) Inventories and other contract cost
Inventories are assets which are held for sale in the ordinary course of business and are carried at the lower of cost and net realisable value as follows:
– Supply chain management and trading
Cost is calculated using the weighted average cost formula and comprises all costs of purchase, costs of conversion and other costs incurred in bringing the inventories to their present location and condition.
Net realisable value is the estimated selling price in the ordinary course of business less the estimated costs of completion and the estimated costs necessary to make the sale.
– Property development
Cost and net realisable values are determined as follows:
– Property under development for sale
The cost of properties under development for sale comprises specifically identified cost, including the acquisition cost of land, aggregate cost of development, materials and supplies, wages and other direct expenses, an appropriate proportion of overheads and borrowing costs capitalised (see note 1(aa)). Net realisable value represents the estimated selling price less estimated costs of completion and costs to be incurred in selling the property.
– Completed property held for sale
The cost of completed properties held for sale comprises all costs of purchase, costs of conversion and other costs incurred in bringing the inventories to their present location and condition.
In the case of completed properties developed by the Group which comprise of multiple units which are sold individually, the cost of each unit is determined by apportionment of the total development costs for that development project to each unit on a per square foot basis, unless another basis is more representative of the cost of the specific unit. Net realisable value represents the estimated selling price less costs to be incurred in selling the property.
When inventories are sold, the carrying amount of those inventories is recognised as an expense in the period in which the related revenue is recognised.
The amount of any write-down of inventories to net realisable value and all losses of inventories are recognised as an expense in the period the write-down or loss occurs. The amount of any reversal of any write-down of inventories is recognised as a reduction in the amount of inventories recognised as an expense in the period in which the reversal occurs.

97Annual Report 2018 Zall Smart Commerce Group Ltd.
Notes to the Consolidated Financial Statements(Expressed in Renminbi unless otherwise indicated)
1 SIGNIFICANT ACCOUNTING POLICIES (Continued)
(o) Contract assets and contract liabilities
A contract asset is recognised when the Group recognises revenue (see note 1(y)) before being unconditionally entitled to the consideration under the payment terms set out in the contract. Contract assets are assessed for expected credit losses (ECL) in accordance with the policy set out in note 1(m)(i) and are reclassified to receivables when the right to the consideration has become unconditional (see note 1(p)).
A contract liability is recognised when the customer pays non-refundable consideration before the Group recognises the related revenue (see note 1(y)). A contract liability would also be recognised if the Group has an unconditional right to receive non-refundable consideration before the Group recognises the related revenue. In such cases, a corresponding receivable would also be recognised (see note 1(p)).
When the contract includes a significant financing component, the contract balance includes interest accrued under the effective interest method (see note 1(y)).
Policy prior to 1 January 2018
In the comparative period, contract balances were recorded for construction contracts at the net amount of costs incurred plus recognised profit less recognised losses and progress billings. These net balances were presented as the “long-term receivables” or “trade and other payables” respectively on a contract-by-contract basis. These balances have been reclassified on 1 January 2018 as shown in note 20 (see note 1(c)(ii)).
(p) Trade and other receivables
A receivable is recognised when the Group has an unconditional right to receive consideration. A right to receive consideration is unconditional if only the passage of time is required before payment of that consideration is due. If revenue has been recognised before the Group has an unconditional right to receive consideration, the amount is presented as a contract asset (see note 1(o)).
Receivables are stated at amortised cost using the effective interest method less allowance for credit losses (see note 1(m)(i)).
(q) Cash and cash equivalents
Cash and cash equivalents comprise cash at bank and on hand, demand deposits with banks and other financial institutions, and short-term, highly liquid investments that are readily convertible into known amounts of cash and which are subject to an insignificant risk of changes in value, having been within three months of maturity at acquisition. Cash and cash equivalents are assessed for expected credit losses (ECL) in accordance with the policy set out in note 1(m)(i).
(r) Trade and other payables
Trade and other payables are initially recognised at fair value. Except for financial guarantee liabilities measured in accordance with note 1(m)(ii), trade and other payables are subsequently stated at amortised cost unless the effect of discounting would be immaterial, in which case they are stated at cost.

Zall Smart Commerce Group Ltd. Annual Report 201898
Notes to the Consolidated Financial Statements(Expressed in Renminbi unless otherwise indicated)
1 SIGNIFICANT ACCOUNTING POLICIES (Continued)
(s) Convertible redeemable preference share
Convertible redeemable preference shares issued by a subsidiary of the Group are redeemable upon occurrence of certain future events and at the option of the holders. This instrument can be converted into ordinary shares of the subsidiary at any time at the option of the holders or automatically converted into ordinary shares upon occurrence of an initial public offering of the subsidiary or agreed by majority of the holders.
The Group designated the convertible redeemable preference shares as financial liabilities at fair value through profit or loss. They are initially recognised at fair value. Any directly attributable transaction costs are recognised as finance costs in the consolidated statement of profit or loss.
Subsequent to initial recognition, the convertible redeemable preference shares are carried at fair value with changes in fair value recognised in the consolidated statement of profit or loss.
The convertible redeemable preference shares are classified as non-current liabilities because the Group has unconditional right to defer settlement of the liability for at least 12 months after the end of the reporting period.
(t) Interest-bearing borrowings
Interest-bearing borrowings are measured initially at fair value less transaction costs. Subsequent to initial recognition, interest-bearing borrowings are stated at amortised cost using the effective interest method. Interest expense is recognised in accordance with the Group’s accounting policy for borrowing cost (see note 1(aa)).
(u) Employee benefits
Short-term employee benefits and contributions to defined contribution retirement plans
Salaries, annual bonuses, paid annual leave, contributions to defined contribution retirement plans and the cost of non-monetary benefits are accrued in the year in which the associated services are rendered by employees. Where payment or settlement is deferred and the effect would be material, these amounts are stated at their present values.
(v) Share-based payments
Equity-settled share-based payment transaction with employee
The fair value of share options or shares granted to eligible persons is recognised as an expense with a corresponding increase in share-based payment reserve within equity. The fair value is measured at grant date using the binomial lattice model, Asian put option Pricing model or market price taking into account the terms and conditions (including lock up period) upon which the options and shares were granted. Where the employees have to meet vesting conditions before becoming unconditionally entitled to the options or shares, the total estimated fair value of the options or shares is spread over the vesting period, taking into account the probability that the options or the shares will vest.
99Annual Report 2018 Zall Smart Commerce Group Ltd.
Notes to the Consolidated Financial Statements(Expressed in Renminbi unless otherwise indicated)
1 SIGNIFICANT ACCOUNTING POLICIES (Continued)
(v) Share-based payments (Continued)
During the vesting period, the number of share options or shares that is expected to vest is reviewed. Any resulting adjustment to the cumulative fair value recognised in prior years is charged/credited to the profit or loss for the year of the review, unless the original expenses qualify for recognition as an asset, with a corresponding adjustment to the share-based payment reserve. On vesting date, the amount recognised as an expense is adjusted to reflect the actual number of options or shares that vest (with a corresponding adjustment to the share-based payment reserve) except where forfeiture is only due to not achieving vesting conditions that relate to the market price of the Company’s shares. The equity amount is recognised in the share-based payment reserve until either the option is exercised (when it is included in the amount recognised in share capital for the shares issued) or the option expires (when it is released directly to retained profits).
Equity-settled share-based payment transaction with non-employee
For equity-settled share-based payment transaction with parties other than employees, the fair value of shares granted for services received is recognised as an expense with a corresponding increase in share-based payment reserve within equity when service are received. The fair value of the equity-settled share-based payment transaction with non-employee is measured with reference to the fair value of the equity instruments granted.
(w) Income tax
Income tax for the year comprises current tax and movements in deferred tax assets and liabilities. Current tax and movements in deferred tax assets and liabilities are recognised in profit or loss except to the extent that they relate to items recognised in other comprehensive income or directly in equity, in which case the relevant amounts of tax are recognised in other comprehensive income or directly in equity, respectively.
Current tax is the expected tax payable on the taxable income for the year, using tax rates enacted or substantively enacted at the end of the reporting period, and any adjustment to tax payable in respect of previous years.
Deferred tax assets and liabilities arise from deductible and taxable temporary differences respectively, being the differences between the carrying amounts of assets and liabilities for financial reporting purposes and their tax bases. Deferred tax assets also arise from unused tax losses and unused tax credits.
Apart from certain limited exceptions, all deferred tax liabilities, and all deferred tax assets to the extent that it is probable that future taxable profits will be available against which the asset can be utilised, are recognised. Future taxable profits that may support the recognition of deferred tax assets arising from deductible temporary differences include those that will arise from the reversal of existing taxable temporary differences, provided those differences relate to the same taxation authority and the same taxable entity, and are expected to reverse either in the same period as the expected reversal of the deductible temporary difference or in periods into which a tax loss arising from the deferred tax asset can be carried back or forward. The same criteria are adopted when determining whether existing taxable temporary differences support the recognition of deferred tax assets arising from unused tax losses and credits, that is, those differences are taken into account if they relate to the same taxation authority and the same taxable entity, and are expected to reverse in a period, or periods, in which the tax loss or credit can be utilised.
Zall Smart Commerce Group Ltd. Annual Report 2018100
Notes to the Consolidated Financial Statements(Expressed in Renminbi unless otherwise indicated)
1 SIGNIFICANT ACCOUNTING POLICIES (Continued)
(w) Income tax (Continued)
The limited exceptions to recognition of deferred tax assets and liabilities are those temporary differences arising from goodwill not deductible for tax purposes, the initial recognition of assets or liabilities that affect neither accounting nor taxable profit (provided they are not part of a business combination), and temporary differences relating to investments in subsidiaries to the extent that, in the case of taxable differences, the Group controls the timing of the reversal and it is probable that the differences will not reverse in the foreseeable future, or in the case of deductible differences, unless it is probable that they will reverse in the future.
Where investment properties are carried at their fair value in accordance with the accounting policy set out in note 1(i), the amount of deferred tax recognised is measured using the tax rates that would apply on sale of those assets at their carrying value at the reporting date unless the property is depreciable and is held within a business model whose objective is to consume substantially all of the economic benefits embodied in the property over time, rather than through sale. In all other cases, the amount of deferred tax recognised is measured based on the expected manner of realisation or settlement of the carrying amount of the assets and liabilities, using tax rates enacted or substantively enacted at the end of the reporting period. Deferred tax assets and liabilities are not discounted.
The carrying amount of a deferred tax asset is reviewed at the end of each reporting period and is reduced to the extent that it is no longer probable that sufficient taxable profits will be available to allow the related tax benefit to be utilised. Any such reduction is reversed to the extent that it becomes probable that sufficient taxable profits will be available.
Additional income taxes that arise from the distribution of dividends are recognised when the liability to pay the related dividends is recognised.
Current tax balances and deferred tax balances, and movements therein, are presented separately from each other and are not offset. Current tax assets are offset against current tax liabilities, and deferred tax assets against deferred tax liabilities, if the Company or the Group has the legally enforceable right to set off current tax assets against current tax liabilities and the following additional conditions are met:
– in the case of current tax assets and liabilities, the Company or the Group intends either to settle on a net basis, or to realise the asset and settle the liability simultaneously; or
– in the case of deferred tax assets and liabilities, if they relate to income taxes levied by the same taxation authority on either:
– the same taxable entity; or
– different taxable entities, which, in each future period in which significant amounts of deferred tax liabilities or assets are expected to be settled or recovered, intend to realise the current tax assets and settle the current tax liabilities on a net basis or realise and settle simultaneously.

101Annual Report 2018 Zall Smart Commerce Group Ltd.
Notes to the Consolidated Financial Statements(Expressed in Renminbi unless otherwise indicated)
1 SIGNIFICANT ACCOUNTING POLICIES (Continued)
(x) Provisions and contingent liabilities
Provisions are recognised when the Group has a legal or constructive obligation arising as a result of a past event, it is probable that an outflow of economic benefits will be required to settle the obligation and a reliable estimate can be made. Where the time value of money is material, provisions are stated at the present value of the expenditure expected to settle the obligation.
Where it is not probable that an outflow of economic benefits will be required, or the amount cannot be estimated reliably, the obligation is disclosed as a contingent liability, unless the probability of outflow of economic benefits is remote. Possible obligations, whose existence will only be confirmed by the occurrence or non-occurrence of one or more future events are also disclosed as contingent liabilities unless the probability of outflow of economic benefits is remote.
(y) Revenue and other income
Income is classified by the Group as revenue when it arises from the sale of goods, the provision of services or the use by others of the Group’s assets under leases in the ordinary course of the Group’s business.
Revenue is recognised when control over a product or service is transferred to the customer, or the lessee has the right to use the asset, at the amount of promised consideration to which the Group is expected to be entitled, excluding those amounts collected on behalf of third parties. Revenue excludes value added tax or other sales taxes and is after deduction of any trade discounts.
Where the contract contains a financing component which provides a significant financing benefit to the customer for more than 12 months, revenue is measured at the present value of the amount receivable, discounted using the discount rate that would be reflected in a separate financing transaction with the customer, and interest income is accrued separately under the effective interest method. Where the contract contains a financing component which provides a significant financing benefit to the Group, revenue recognised under that contract includes the interest expense accreted on the contract liability under the effective interest method. The Group takes advantage of the practical expedient in paragraph 63 of IFRS 15 and does not adjust the consideration for any effects of a significant financing component if the period of financing is 12 months or less.
Further details of the Group’s revenue and other income recognition policies are as follows:
(i) Sale of goods
Revenue is recognised when the customer takes possession of and accepts the products, that is when the goods ownership transfer certificate is issued to customers, goods are picked up at the third parties’ premises or goods are delivered at the customers’ premises.
Revenue for sales of goods was recognised on a similar basis in the comparative period under IAS 18.
Zall Smart Commerce Group Ltd. Annual Report 2018102
Notes to the Consolidated Financial Statements(Expressed in Renminbi unless otherwise indicated)
1 SIGNIFICANT ACCOUNTING POLICIES (Continued)
(y) Revenue and other income (Continued)
(ii) Sale of properties
Revenue arising from the sale of properties developed for sale in the ordinary course of business is recognised when the property is accepted by the customer, or deemed as accepted according to the contract, whichever is earlier, which is the point in time when the customer has the ability to direct the use of the property and obtain substantially all of the remaining benefits of the property. Deposits and instalments received on properties sold prior to the date of revenue recognition are included in the statement of financial position under contract liabilities (see note 1(o)).
It is common for the Group to receive payments in advance of revenue recognition in the Group’s sales of properties when properties are marketed by the Group while the property is still under construction. In such cases, if the advance payments are regarded as providing a significant financing benefit to the Group, interest expense arising from the adjustment of time value of money will be accrued by the Group during the period between the payment date and the revenue recognition date. This accrual increases the balance of the contract liability during the period of construction, and therefore increases the amount of revenue recognised when control of the completed property is transferred to the customer. The interest is expensed as accrued unless it is eligible to be capitalised under IAS 23, Borrowing costs, in accordance with the policies set out in note 1(aa).
In the comparative period, revenue from sales of properties was recognised when the construction of relevant properties has been completed and the properties have been delivered to the buyers, which was taken to be the point in time when the risks and rewards of ownership of the property had passed to the buyer. Deposits and instalments received on properties sold prior to the date of revenue recognition were included in the statement of financial position under trade and other payables and no interest expense was accrued on payments received in advance. As a result of the change in accounting policy for accruing interest on payments in advance, adjustments have been made to opening balances as at 1 January 2018 (see note 1(c)(ii)).
(iii) Construction contracts
A contract with a customer is classified by the Group as a construction contract when the contract relates to work on real estate assets under the control of the customer and therefore the Group’s construction activities create or enhance an asset under the customer’s control.
When the outcome of a construction contract can be reasonably measured, revenue from the contract is recognised progressively over time using the cost-to-cost method, i.e. based on the proportion of the actual costs incurred relative to the estimated total costs.
The likelihood of the Group earning contractual bonuses for early completion or suffering contractual penalties for late completion are taken into account in making these estimates, such that revenue is only recognised to the extent that it is highly probable that a significant reversal in the amount of cumulative revenue recognised will not occur.
When the outcome of the contract cannot be reasonably measured, revenue is recognised only to the extent of contract costs incurred that are expected to be recovered.
If at any time the costs to complete the contract are estimated to exceed the remaining amount of the consideration under the contract, then a provision is recognised.
Revenue for construction contracts was recognised on a similar basis in the comparative period under IAS 11.

103Annual Report 2018 Zall Smart Commerce Group Ltd.
Notes to the Consolidated Financial Statements(Expressed in Renminbi unless otherwise indicated)
1 SIGNIFICANT ACCOUNTING POLICIES (Continued)
(y) Revenue and other income (Continued)
(iv) Rental income from operating leases
Rental income receivable under operating leases is recognised in profit or loss in equal instalments over the periods covered by the lease term, except where an alternative basis is more representative of the pattern of benefits to be derived from the use of the leased asset. Lease incentives granted are recognised in profit or loss as an integral part of the aggregate net lease payments receivable. Contingent rentals are recognised as income in the accounting period in which they are earned.
(v) Dividends
– Dividend income from unlisted investments is recognised when the shareholder’s right to receive payment is established.
– Dividend income from listed investments is recognised when the share price of the investment goes ex-dividend.
(vi) Interest income
Interest income is recognised as it accrues under the effective interest method using the rate that exactly discounts estimated future cash receipts through the expected life of the financial asset to the gross carrying amount of the financial asset. For financial assets measured at amortised cost that are not credit-impaired, the effective interest rate is applied to the gross carrying amount of the asset. For credit-impaired financial assets, the effective interest rate is applied to the amortised cost (i.e. gross carrying amount net of loss allowance) of the asset (see note 1(m)(i)).
(vii) Government grants
Government grants are recognised in the statement of financial position initially when there is reasonable assurance that they will be received and that the Group will comply with the conditions attaching to them. Grants that compensate the Group for expenses incurred are recognised as income in profit or loss on a systematic basis in the same periods in which the expenses are incurred. Grants that compensate the Group for the cost of an asset are initially recognised as deferred income and subsequently recognised in profit or loss on a systematic basis over the useful life of the asset.
(viii) Income from financial guarantees issued
Income from financial guarantees issued is recognised over the term of the guarantees (see note 1(m)(ii)).

Zall Smart Commerce Group Ltd. Annual Report 2018104
Notes to the Consolidated Financial Statements(Expressed in Renminbi unless otherwise indicated)
1 SIGNIFICANT ACCOUNTING POLICIES (Continued)
(z) Translation of foreign currencies
Foreign currency transactions during the year are translated at the foreign exchange rates ruling at the transaction dates. Monetary assets and liabilities denominated in foreign currencies are translated at the foreign exchange rates ruling at the end of the reporting period. Exchange gains and losses are recognised in profit or loss.
Non-monetary assets and liabilities that are measured in terms of historical cost in a foreign currency are translated using the foreign exchange rates ruling at the transaction dates. The transaction date is the date on which the Group initially recognises such non-monetary assets or liabilities. Non-monetary assets and liabilities denominated in foreign currencies that are stated at fair value are translated using the foreign exchange rates ruling at the dates the fair value was measured.
The results of foreign operations are translated into RMB at the exchange rates approximating the foreign exchange rates ruling at the dates of the transactions. Statement of financial position items are translated into RMB at the closing foreign exchange rates at the end of the reporting period. The resulting exchange differences are recognised in other comprehensive income and accumulated separately in equity in the exchange reserve.
(aa) Borrowing costs
Borrowing costs that are directly attributable to the acquisition, construction or production of an asset which necessarily takes a substantial period of time to get ready for its intended use or sale are capitalised as part of the cost of that asset. Other borrowing costs are expensed in the period in which they are incurred.
The capitalisation of borrowing costs as part of the cost of a qualifying asset commences when expenditure for the asset is being incurred, borrowing costs are being incurred and activities that are necessary to prepare the asset for its intended use or sale are in progress. Capitalisation of borrowing costs is suspended or ceases when substantially all the activities necessary to prepare the qualifying asset for its intended use or sale are interrupted or complete.
(bb) Related parties
(a) A person, or a close member of that person’s family is related to the Group if that person:
(i) has control or joint control over the Group;
(ii) has significant influence over the Group; or
(iii) is a member of the key management personnel of the Group or the Group’s parent.

105Annual Report 2018 Zall Smart Commerce Group Ltd.
Notes to the Consolidated Financial Statements(Expressed in Renminbi unless otherwise indicated)
1 SIGNIFICANT ACCOUNTING POLICIES (Continued)
(bb) Related parties (Continued)
(b) An entity is related to the Group if any of the following conditions applies:
(i) The entity and the Group are members of the same Group (which means that each parent, subsidiary and fellow subsidiary is related to the others).
(ii) One entity is an associate or joint venture of the other entity (or an associate or joint venture of a member of a Group of which the other entity is a member).
(iii) Both entities are joint venture of the same third party.
(iv) One entity is a joint venture of a third entity and the other entity is an associate of the third entity.
(v) The entity is a post-employment benefit plan for the benefit of employees of either the Group or an entity related to the Group.
(vi) The entity is controlled or jointly controlled by a person identified in (a).
(vii) A person identified in (a)(i) has significant influence over the entity or is a member of the key management personnel of the entity (or of a parent of the entity).
(viii) The entity, or any member of a Group of which it is a part, provides key management personnel services to the Group or to the Group’s parent.
Close members of the family of a person are those family members who may be expected to influence, or be influenced by, that person in their dealings with the entity.
(cc) Segment reporting
Operating segments, and the amounts of each segment item reported in the financial statements, are identified from the financial information provided regularly to the Group’s most senior executive management for the purposes of allocating resources to, and assessing the performance of, the Group’s various lines of business and geographical locations.
Individually material operating segments are not aggregated for financial reporting purposes unless the segments have similar economic characteristics and are similar in respect of the nature of products and services, the nature of production processes, the type or class of customers, the methods used to distribute the products or provide the services, and the nature of the regulatory environment. Operating segments which are not individually material may be aggregated if they share a majority of these criteria.

Zall Smart Commerce Group Ltd. Annual Report 2018106
Notes to the Consolidated Financial Statements(Expressed in Renminbi unless otherwise indicated)
2 ACCOUNTING JUDGEMENTS AND ESTIMATES
Estimates and judgements are continually evaluated and are based on historical experience and other factors, including expectations of future events that are believed to be reasonable under the circumstances.
The selection of critical accounting policies, the judgements and other uncertainties affecting application of those policies and the sensitivity of reported results to changes in condition and assumptions are factors to be considered when reviewing the financial statements. The principal accounting policies are set forth in note 1. The Group believes the following critical accounting policies involve the most significant judgements and estimates used in the preparation of the financial statements.
Notes 10, 13, 27 and 30 contain information about the assumptions and their risk factors relating to the valuation of investment properties, goodwill impairment, fair value of share options granted and financial instruments. Other key sources of estimation uncertainty are as follows:
(a) Net realisable value of properties under development for sale and completed properties held for sale
As explained in note 1(n), the Group’s properties held for sale are stated at the lower of cost and net realisable value. Based on the Group’s recent experience and the nature of the subject properties, the Group makes estimates of the selling price, the costs of completion in cases for properties under development, and the costs to be incurred in selling the properties based on prevailing market conditions.
If there is an increase in costs to completion or a decrease in net sales value, the net realisable value will decrease and this may result in provision for properties held for sale. Such provision requires the use of judgement and estimates. Where the expectation is different from the original estimate, the carrying value and provision for properties in the periods in which such estimate is changed will be adjusted accordingly.
In addition, given the volatility of the property market in PRC and the unique nature of individual properties, the actual outcomes in terms of costs and revenue may be higher or lower than estimated at the end of the reporting period. Any increase or decrease in the provision would affect profit or loss in future years.
(b) Provision for PRC Land Appreciation Tax (“LAT”)
As explained in note 6(a)(iv), LAT is levied on properties developed by the Group for sale, at progressive rates ranging from 30% to 60% on the appreciation of land value, which under the applicable regulations is calculated based on the proceeds of sales of properties less deductible expenditures including lease charges of land use rights, borrowing cost and relevant property development expenditures. Given the uncertainties of the calculation basis of land appreciation tax to be interpreted by the local tax bureau and the actual appreciation of land value may be different from the original estimates, the actual outcomes may be higher or lower than that estimated at the end of the reporting period. Any increase or decrease in estimates would affect profit or loss in future years.

107Annual Report 2018 Zall Smart Commerce Group Ltd.
Notes to the Consolidated Financial Statements(Expressed in Renminbi unless otherwise indicated)
2 ACCOUNTING JUDGEMENTS AND ESTIMATES (Continued)
(c) Impairment of trade and other receivables
The Group estimates the impairment allowances for trade and other receivables by assessing the ECLs. This requires the use of estimates and judgements. Where the expectation is different from the original estimate, such difference will affect the carrying amounts of trade and other receivables and thus the impairment loss in the period in which such estimate is changed. The Group reassesses the impairment allowances at the end of each reporting period.
Trade debtors and bills receivables
ECLs on trade debtors and bills receivables are estimated using a provision matrix based on the Group’s historical credit loss experience, adjusted for factors that are specific to the debtors and an assessment of both the current and forecast general economic conditions at the reporting date.
Loans and factoring receivables
For loans and factoring receivables, the Group recognises a loss allowance equal to 12-month ECLs unless there has been a significant increase in credit risk of the financial instrument since initial recognition, in which case the loss allowance is measured at an amount equal to lifetime ECLs.
(d) Recognition of deferred tax assets
Deferred tax assets in respect of tax losses and other deductible temporary differences carried forward are recognised and measured based on the expected manner of realisation or settlement of the carrying amount of the assets, using tax rates enacted or substantively enacted at the end of the reporting period. In determining the carrying amounts of deferred tax assets, expected taxable profits are estimated which involves a number of assumptions relating to the operating environment of the Group and require a significant level of judgement exercised by the directors. Any change in such assumptions and judgement would affect the carrying amounts of deferred tax assets to be recognised and hence the net profit in future years.
(e) Recognition and allocation of construction costs on properties under development
Development costs of properties are recorded as properties under development during construction stage and will be transferred to profit or loss upon the recognition of the sale of the properties. Before the final settlement of the development costs and other costs relating to the sale of the properties, these costs are accrued by the Group based on management’s best estimates. Any variations on the development costs upon final settlement would impact costs of sales included in profit or loss in future years.
(f) Classification between investment properties and properties held for sale
The Group develops properties held for sale and properties held to earn rentals and/or for capital appreciation. Judgement is made by management on determining whether a property is designated as an investment property or a property held for sale. The Group considers its intention for holding the properties at the early development stage of the related properties. During the course of construction, the related properties under construction are accounted for as properties under development included in current assets if the properties are intended for sale after their completion, whereas, the properties are accounted for as investment properties under construction if the properties are intended to be held to earn rentals and/or for capital appreciation.

Zall Smart Commerce Group Ltd. Annual Report 2018108
Notes to the Consolidated Financial Statements(Expressed in Renminbi unless otherwise indicated)
2 ACCOUNTING JUDGEMENTS AND ESTIMATES (Continued)
(g) Valuation of investment properties
As described in note 1(i), investment properties are stated at fair value based on the valuation performed by an independent firm of professional valuers.
In determining the fair value of investment properties, the valuers have based on a method of valuation which involves, inter alia, certain estimates including current market rents and market price for similar properties in the same location, and condition, appropriate discount rates and expected future market rents.
In relying on the valuation report, management has exercised their judgement and is satisfied that the method of valuation is reflective of the current market conditions.
(h) Determining the deferred taxation on investment properties
The Group has leased out certain of the completed properties to third parties whereby the directors consider that such arrangement is not temporary. In the circumstance, the Group has decided to treat those properties as investment properties (and reclassifying them from completed properties held for sale to investment properties) because it is the Group’s intention to hold these properties in long-term for rental income and/or capital appreciation.
Under IAS 12, deferred tax is required to be measured with reference to the tax consequences that would follow the manner in which the entity expects to recover the carrying amount of the assets in question. In this regard, IAS 12 has a rebuttable presumption that the carrying amount of investment property carried at fair value under IAS 40, Investment property, will be recovered through sale. This presumption is rebutted on a property-by-property basis if the investment property in question is depreciable and is held within a business model whose objective is to consume substantially all of the economic benefits embodied in the investment property over time, rather than through sale.
In this connection, the Group has reviewed its investment property portfolio on a regular basis and has concluded that as at 31 December 2018, the Group has determined that each of these properties are held within a business model whose objective is to consume substantially all of the economic benefits embodied in the investment property over time and consequently the presumption in IAS 12 is rebutted for these properties. As a result, the Group has continued to measure the deferred tax relating to these other properties using the tax rate that would apply as a result of recovering their value through use.
(i) Impairment of non-current assets
Internal and external sources of information are reviewed by the Group at the end of each reporting period to assess whether there is any indication that an asset may be impaired. If any such indication exists, the recoverable amount of the asset or the cash-generating unit to which it belongs is estimated to determine impairment losses on the asset by reference to value in use and fair value less costs of disposal. Value in use is determined using the discounted cash flow method. Due to inherent risk associated with estimations in the timing and magnitude of the future cash flows, the estimated recoverable amount of the assets may be different from its actual recoverable amount and the Group’s profit or loss could be affected by the accuracy of the estimations. Changes in facts and circumstances may result in revisions to the conclusion of whether an indication of impairment exists and revised estimates of recoverable amount, which would affect profit or loss in future years.
Goodwill and intangible assets with indefinite useful lives are tested for impairment at least annually even if there is no indication of impairment.
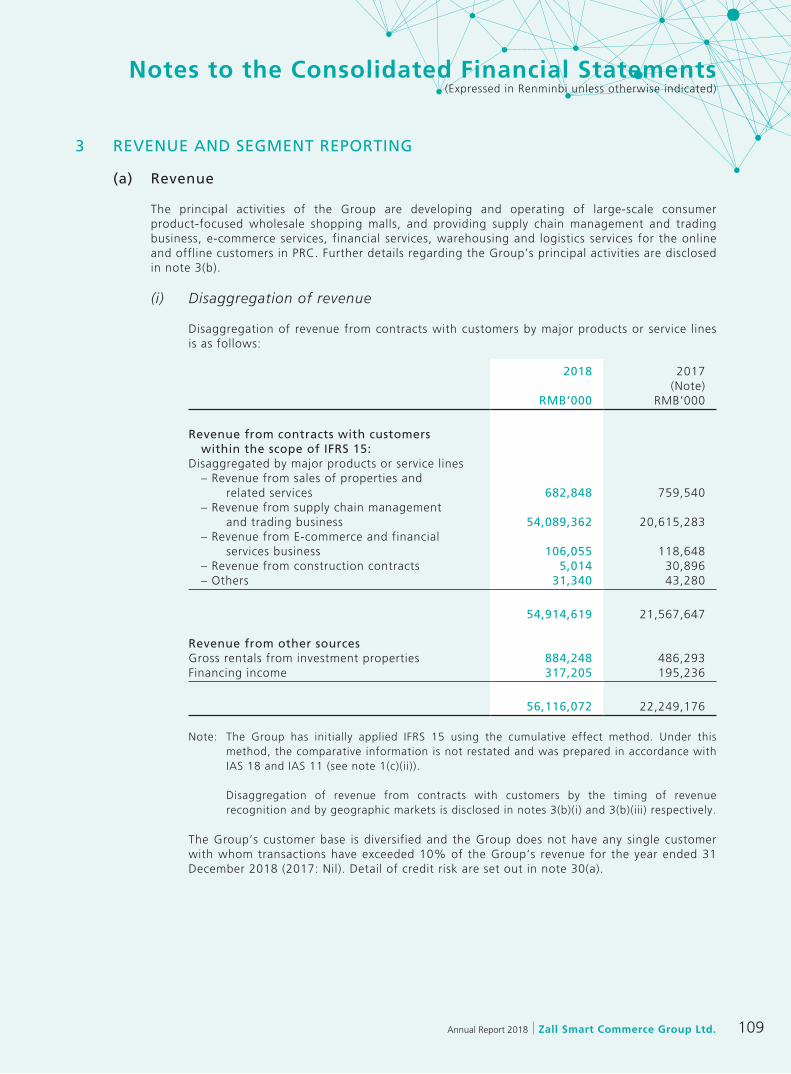
109Annual Report 2018 Zall Smart Commerce Group Ltd.
Notes to the Consolidated Financial Statements(Expressed in Renminbi unless otherwise indicated)
3 REVENUE AND SEGMENT REPORTING
(a) Revenue
The principal activities of the Group are developing and operating of large-scale consumer product-focused wholesale shopping malls, and providing supply chain management and trading business, e-commerce services, financial services, warehousing and logistics services for the online and offline customers in PRC. Further details regarding the Group’s principal activities are disclosed in note 3(b).
(i) Disaggregation of revenue
Disaggregation of revenue from contracts with customers by major products or service lines is as follows:
2018 2017(Note)
RMB’000 RMB’000
Revenue from contracts with customers within the scope of IFRS 15:Disaggregated by major products or service lines – Revenue from sales of properties and related services 682,848 759,540 – Revenue from supply chain management and trading business 54,089,362 20,615,283 – Revenue from E-commerce and financial services business 106,055 118,648 – Revenue from construction contracts 5,014 30,896 – Others 31,340 43,280
54,914,619 21,567,647
Revenue from other sourcesGross rentals from investment properties 884,248 486,293Financing income 317,205 195,236
56,116,072 22,249,176
Note: The Group has initially applied IFRS 15 using the cumulative effect method. Under this method, the comparative information is not restated and was prepared in accordance with IAS 18 and IAS 11 (see note 1(c)(ii)).
Disaggregation of revenue from contracts with customers by the timing of revenue recognition and by geographic markets is disclosed in notes 3(b)(i) and 3(b)(iii) respectively.
The Group’s customer base is diversified and the Group does not have any single customer with whom transactions have exceeded 10% of the Group’s revenue for the year ended 31 December 2018 (2017: Nil). Detail of credit risk are set out in note 30(a).

Zall Smart Commerce Group Ltd. Annual Report 2018110
Notes to the Consolidated Financial Statements(Expressed in Renminbi unless otherwise indicated)
3 REVENUE AND SEGMENT REPORTING (Continued)
(a) Revenue (Continued)
(ii) Revenue expected to be recognised in the future arising from contracts with customers in existence at the reporting date
As at 31 December 2018, the aggregated amount of the transaction price allocated to the remaining performance obligations under the Group’s existing contracts is RMB857,754,000. This amount represents revenue expected to be recognised in the future from precompletion sales contracts for properties under development and construction contracts entered into by the customers with the Group. This amount includes the interest component of pre-completion properties sales contracts under which the Group obtains significant financing benefits from the customers (see note 1(y)(ii)). The Group will recognise the expected revenue in future when or as the work is completed or, in the case of the properties under development for sale, when the property is accepted by the customer or deemed as accepted according to the contract (whichever is earlier), which is expected to occur over the next 1 to 24 months.
The Group has applied the practical expedient in paragraph 121 of IFRS 15 to its sales contracts for goods, such that the above information does not include information about revenue that the Group will be entitled to when it satisfies the remaining performance obligations under the contracts for sales of goods that had an original expected duration of one year or less.
(iii) Total future minimum lease payments receivable by the Group
The future minimum lease payments under non-cancellable operating leases in place at the reporting date will be receivable by the Group in future periods as follows:
2018 2017RMB’000 RMB’000
Within 1 year 958,498 994,404After 1 year but within 5 years 2,579,784 2,676,866After 5 years 2,372,055 2,241,031
5,910,337 5,912,301
111Annual Report 2018 Zall Smart Commerce Group Ltd.
Notes to the Consolidated Financial Statements(Expressed in Renminbi unless otherwise indicated)
3 REVENUE AND SEGMENT REPORTING (Continued)
(b) Segment reporting
The Group manages its businesses by divisions, which are organised by mixture of both business lines (product and services). In a manner consistent with the way in which information is reported internally to the Group’s most senior executive management for the purposes of resource allocation and performance assessment, the Group has presented the following three reportable segments. No operating segments have been aggregated to form the following reportable segments.
– Property development and related services: this segment develops, sells and operates large-scale consumer product-focus wholesale shopping malls and provides related value-added business, such as warehousing and logistics.
– E-commerce and financial services: this segment provides financial services including supply chain finance, guarantees, financial leasing, factoring and assets management.
– Supply chain management and trading: this segment operates trading of agricultural products, chemical materials, plastic raw materials, consumer goods, black and non-ferrous metals, etc., also provides trading related supply chain finance services.
(i) Segment results, assets and liabilities
For the purposes of assessing segment performance and allocating resources between segments, the Group’s senior executive management monitors the results, assets and liabilities attributable to each reportable segment on the following bases:
Segment assets include all tangible, intangible assets and current assets with the exception of interests in associates and joint ventures, investments in financial assets, deferred tax assets and other corporate assets. Segment liabilities include trade creditors, accruals and bills payable attributable to the sales activities of the individual segments and bank borrowings managed directly by the segments.
Revenue and expenses are allocated to the reportable segments with reference to sales generated by those segments and the expenses incurred by those segments or which otherwise arise from the depreciation or amortisation of assets attributable to those segments.
The measure used for reporting segment profit is the profit before finance costs, income tax, and are further adjusted for items not specifically attributed to individual segments, such as share of profits or losses of joint ventures and associates, directors’ and auditors’ remuneration and other head office or corporate administration costs.
In addition, management is provided with segment information concerning revenue (including inter-segment sales), interest income and expense from cash balances, borrowings and derivative managed directly by the segments and depreciation to non-current segment assets used by the segments in their operations.

Zall Smart Commerce Group Ltd. Annual Report 2018112
Notes to the Consolidated Financial Statements(Expressed in Renminbi unless otherwise indicated)
3 REVENUE AND SEGMENT REPORTING (Continued)
(b) Segment reporting (Continued)
(i) Segment results, assets and liabilities (Continued)
Disaggregation of revenue from contracts with customers by the timing of revenue recognition, as well as information regarding the Group’s reportable segments as provided to the Group’s most senior executive management for the purposes of resource allocation and assessment of segment performance for the years ended 31 December 2018 and 2017 is set out below.
Property development and related services
E-commerce and financial services
Supply chain management and trading Total
2018 2017 2018 2017 2018 2017 2018 2017(Note) (Note) (Note) (Note)
RMB’000 RMB’000 RMB’000 RMB’000 RMB’000 RMB’000 RMB’000 RMB’000
Disaggregation by timing of revenue recognitionPoint in time 613,637 675,541 106,055 118,648 54,089,362 20,615,283 54,809,054 21,409,472Over time 958,473 601,188 58,285 80,330 258,920 114,906 1,275,678 796,424
Revenue from external customers 1,572,110 1,276,729 164,340 198,978 54,348,282 20,730,189 56,084,732 22,205,896Inter-segment revenue – – – – – – – –
Reportable segment revenue 1,572,110 1,276,729 164,340 198,978 54,348,282 20,730,189 56,084,732 22,205,896
Reportable segment profit/(loss) 626,544 458,218 (98,032) (2,370) (67,680) (47,299) 460,832 408,549Impairment loss on intangible assets – – – – (152,824) – (152,824) –Impairment loss on goodwill – – – – (461,028) – (461,028) –Net valuation gain on investment properties 3,865,192 3,021,326 – – – – 3,865,192 3,021,326Finance income 61,620 38,502 393 154 140,143 49,922 202,156 88,578Finance costs (300,825) (329,479) (3,846) (17,676) (305,883) (153,350) (610,554) (500,505)Depreciation and amortisation (12,190) (10,912) (1,671) (1,205) (57,798) (18,925) (71,659) (31,042)Share of net losses of associates (169) (2,367) (164,108) (29,818) (8,596) (3,865) (172,873) (36,050)Share of net (losses)/profits of joint ventures (2,694) (64) – – 351 791 (2,343) 727Impairment loss on investment in an associate – – (26,155) – – – (26,155) –Reportable segment assets 32,240,057 29,919,335 630,189 1,504,126 10,549,379 10,126,116 43,419,625 41,549,577Additions to non-current segment assets during the year 13,203 19,224 157,423 20,032 231,919 2,655,475 402,545 2,694,731Reportable segment liabilities 11,872,360 13,365,516 2,177,283 2,903,038 14,050,893 10,094,269 28,100,536 26,362,823
Note: The Group has initially applied IFRS 15 using the cumulative effect method. Under this method, the comparative information is not restated and was prepared in accordance with IAS 18 and IAS 11 (see note 1(c)(ii)).
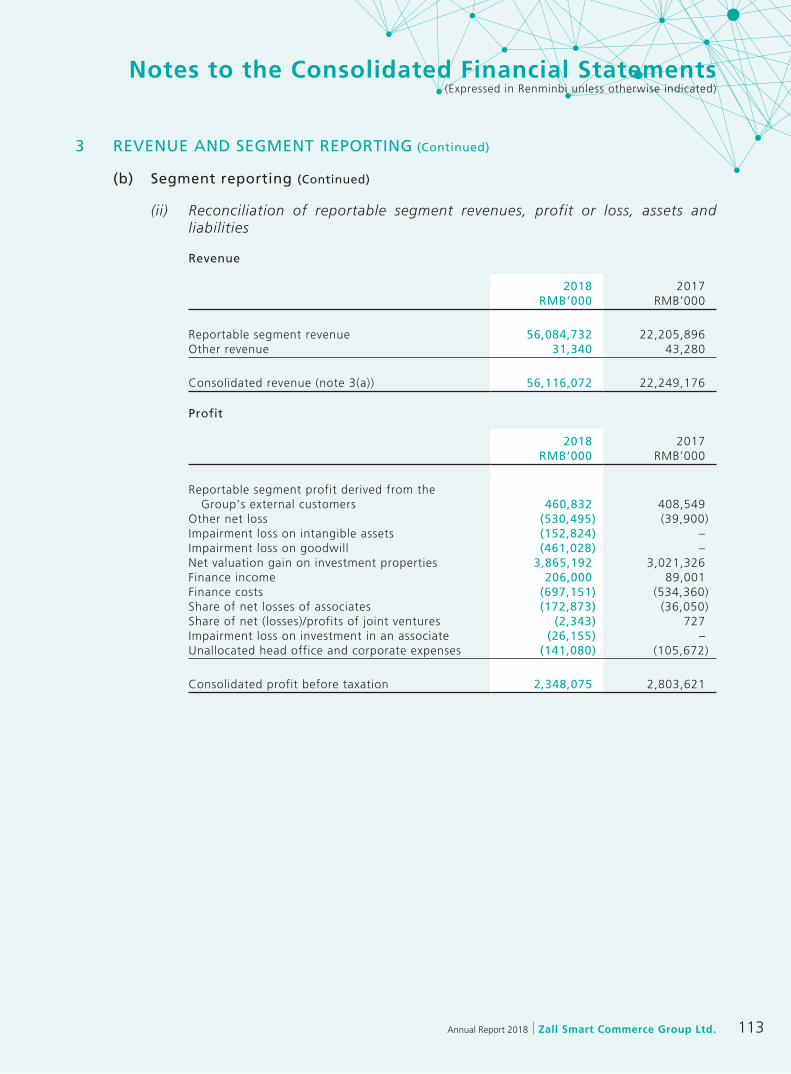
113Annual Report 2018 Zall Smart Commerce Group Ltd.
Notes to the Consolidated Financial Statements(Expressed in Renminbi unless otherwise indicated)
3 REVENUE AND SEGMENT REPORTING (Continued)
(b) Segment reporting (Continued)
(ii) Reconciliation of reportable segment revenues, profit or loss, assets and liabilities
Revenue
2018 2017RMB’000 RMB’000
Reportable segment revenue 56,084,732 22,205,896Other revenue 31,340 43,280
Consolidated revenue (note 3(a)) 56,116,072 22,249,176
Profit
2018 2017RMB’000 RMB’000
Reportable segment profit derived from the Group’s external customers 460,832 408,549Other net loss (530,495) (39,900)Impairment loss on intangible assets (152,824) –Impairment loss on goodwill (461,028) –Net valuation gain on investment properties 3,865,192 3,021,326Finance income 206,000 89,001Finance costs (697,151) (534,360)Share of net losses of associates (172,873) (36,050)Share of net (losses)/profits of joint ventures (2,343) 727Impairment loss on investment in an associate (26,155) –Unallocated head office and corporate expenses (141,080) (105,672)
Consolidated profit before taxation 2,348,075 2,803,621
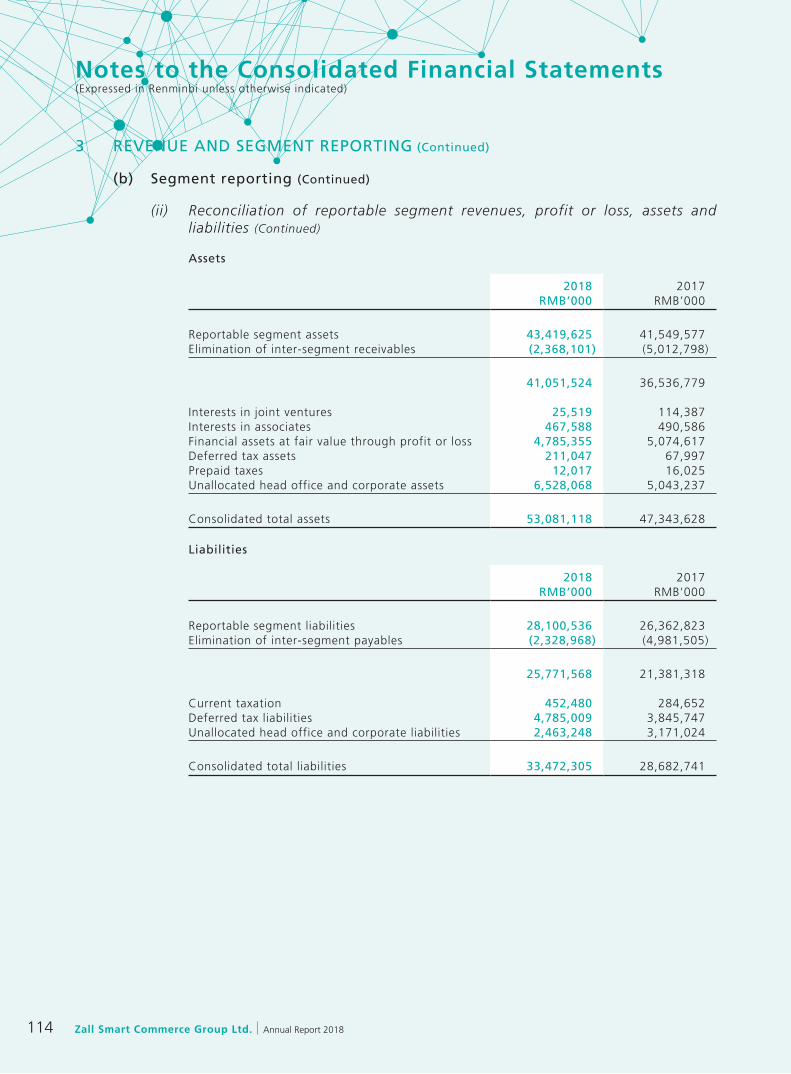
Zall Smart Commerce Group Ltd. Annual Report 2018114
Notes to the Consolidated Financial Statements(Expressed in Renminbi unless otherwise indicated)
3 REVENUE AND SEGMENT REPORTING (Continued)
(b) Segment reporting (Continued)
(ii) Reconciliation of reportable segment revenues, profit or loss, assets and liabilities (Continued)
Assets
2018 2017RMB’000 RMB’000
Reportable segment assets 43,419,625 41,549,577Elimination of inter-segment receivables (2,368,101) (5,012,798)
41,051,524 36,536,779
Interests in joint ventures 25,519 114,387Interests in associates 467,588 490,586Financial assets at fair value through profit or loss 4,785,355 5,074,617Deferred tax assets 211,047 67,997Prepaid taxes 12,017 16,025Unallocated head office and corporate assets 6,528,068 5,043,237
Consolidated total assets 53,081,118 47,343,628
Liabilities
2018 2017RMB’000 RMB’000
Reportable segment liabilities 28,100,536 26,362,823Elimination of inter-segment payables (2,328,968) (4,981,505)
25,771,568 21,381,318
Current taxation 452,480 284,652Deferred tax liabilities 4,785,009 3,845,747Unallocated head office and corporate liabilities 2,463,248 3,171,024
Consolidated total liabilities 33,472,305 28,682,741
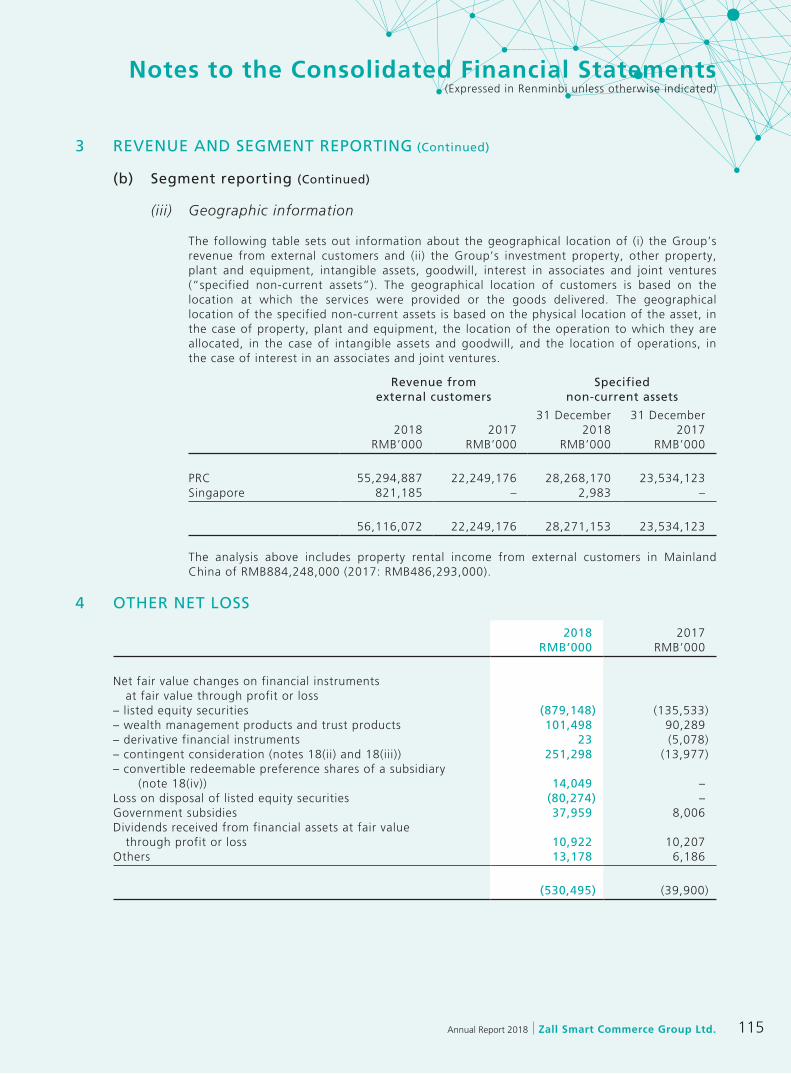
115Annual Report 2018 Zall Smart Commerce Group Ltd.
Notes to the Consolidated Financial Statements(Expressed in Renminbi unless otherwise indicated)
3 REVENUE AND SEGMENT REPORTING (Continued)
(b) Segment reporting (Continued)
(iii) Geographic information
The following table sets out information about the geographical location of (i) the Group’s revenue from external customers and (ii) the Group’s investment property, other property, plant and equipment, intangible assets, goodwill, interest in associates and joint ventures (“specified non-current assets”). The geographical location of customers is based on the location at which the services were provided or the goods delivered. The geographical location of the specified non-current assets is based on the physical location of the asset, in the case of property, plant and equipment, the location of the operation to which they are allocated, in the case of intangible assets and goodwill, and the location of operations, in the case of interest in an associates and joint ventures.
Revenue from external customers
Specified non-current assets
2018 201731 December
201831 December
2017RMB’000 RMB’000 RMB’000 RMB’000
PRC 55,294,887 22,249,176 28,268,170 23,534,123Singapore 821,185 – 2,983 –
56,116,072 22,249,176 28,271,153 23,534,123
The analysis above includes property rental income from external customers in Mainland China of RMB884,248,000 (2017: RMB486,293,000).
4 OTHER NET LOSS
2018 2017RMB’000 RMB’000
Net fair value changes on financial instruments at fair value through profit or loss– listed equity securities (879,148) (135,533)– wealth management products and trust products 101,498 90,289– derivative financial instruments 23 (5,078)– contingent consideration (notes 18(ii) and 18(iii)) 251,298 (13,977)– convertible redeemable preference shares of a subsidiary (note 18(iv)) 14,049 –Loss on disposal of listed equity securities (80,274) –Government subsidies 37,959 8,006Dividends received from financial assets at fair value through profit or loss 10,922 10,207Others 13,178 6,186
(530,495) (39,900)

Zall Smart Commerce Group Ltd. Annual Report 2018116
Notes to the Consolidated Financial Statements(Expressed in Renminbi unless otherwise indicated)
5 PROFIT BEFORE TAxATION
Profit before taxation is arrived at after (crediting)/charging:
(a) Finance (income)/costs
2018 2017RMB’000 RMB’000
Finance incomeInterest income (206,000) (89,001)
Finance costsInterest on interest-bearing borrowings 793,701 704,326Other borrowing costs 12,177 88,872Less: Amounts capitalised into properties under development and investment properties under development (Note) (261,010) (363,805)
544,868 429,393
Bank charges and others 153,428 107,043Net foreign exchange gain (1,145) (2,076)
697,151 534,360
Note: The borrowing costs have been capitalised at rates ranging from 4.75%-13.00% per annum for the year ended 31 December 2018 (2017: 2.50%-13.00%).
(b) Staff costs
2018 2017RMB’000 RMB’000
Salaries, wages and other benefits 258,695 163,370Contributions to defined contribution retirement plan 24,728 15,600Equity-settled share-based payment expenses (note 27) 72,056 65,259
355,479 244,229

117Annual Report 2018 Zall Smart Commerce Group Ltd.
Notes to the Consolidated Financial Statements(Expressed in Renminbi unless otherwise indicated)
5 PROFIT BEFORE TAxATION (Continued)
(c) Other items
2018 2017(Note)
RMB’000 RMB’000
Amortisation– intangible assets (note 12) 60,557 28,437Depreciation (note 11) 38,959 22,873Impairment losses– trade debtors and bill receivables 187,878 5,401– loans and factoring receivables 77,544 15,156Auditors’ remuneration– audit services 4,900 3,400– other services – 4,020Operating lease charges 44,934 40,341Rentals receivable from investment properties less direct outgoings of RMB2,639,000 (2017: RMB3,846,000) 738,249 248,630Cost of construction contracts 5,014 30,896Cost of commodities sold (note 19(c)) 53,779,019 20,467,478Cost of properties sold (note 19(b)) 382,542 465,418
Note: The Group has initially applied IFRS 15 and IFRS 9 at 1 January 2018. Under the transition methods chosen, comparative information is not restated. See note 1(c).
6 INCOME TAx IN THE CONSOLIDATED STATEMENT OF PROFIT OR LOSS
(a) Taxation in the consolidated statement of profit or loss represents:
2018 2017RMB’000 RMB’000
Current taxPRC Corporate Income Tax (“PRC CIT”) 145,166 50,570PRC Land Appreciate Tax (“PRC LAT”) 60,795 41,417
205,961 91,987Deferred taxOrigination and reversal of temporary differences (note 28(b)) 868,207 355,152
1,074,168 447,139
(i) Pursuant to the rules and regulations of Cayman Islands, the Company is not subject to any income tax in Cayman Islands. Also, certain subsidiaries located in British Virgin Islands (“BVI”) are not subject to any income tax in their local jurisdictions.
(ii) No provision for Hong Kong Profits Tax or Singapore Corporate Income Tax as the Group did not earn any assessable income subject to Hong Kong Profits Tax or Singapore Corporate Income Tax during the years ended 31 December 2018 and 2017.
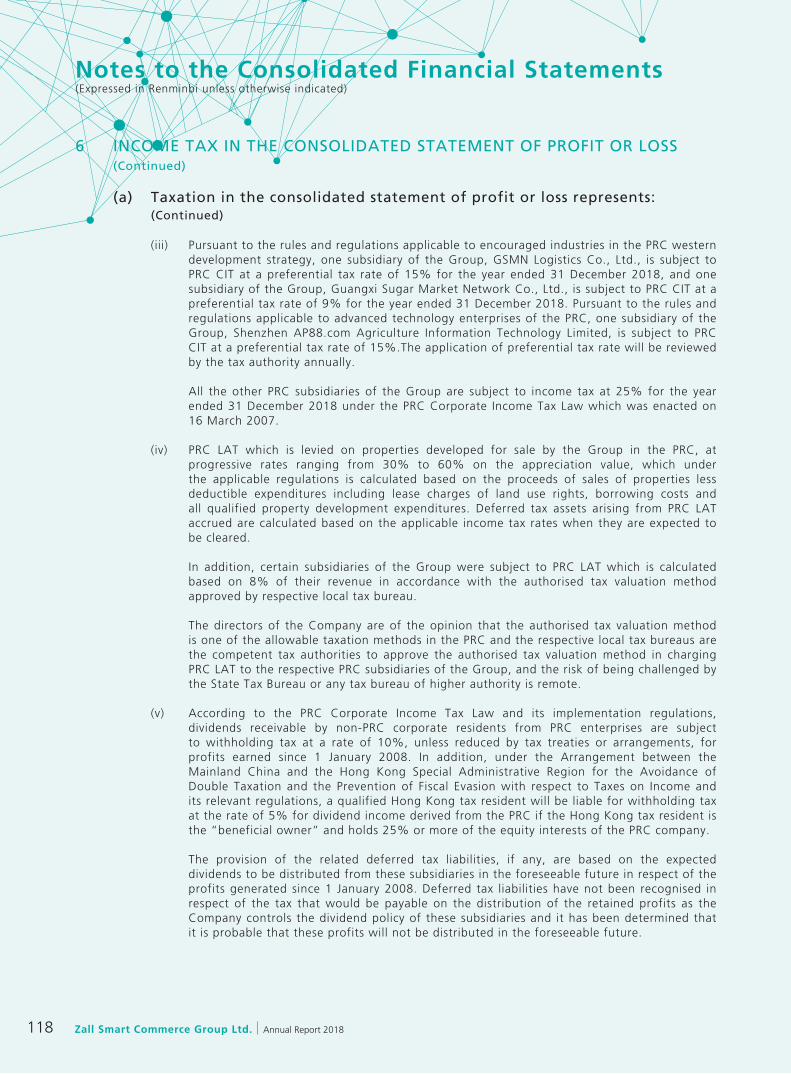
Zall Smart Commerce Group Ltd. Annual Report 2018118
Notes to the Consolidated Financial Statements(Expressed in Renminbi unless otherwise indicated)
6 INCOME TAx IN THE CONSOLIDATED STATEMENT OF PROFIT OR LOSS (Continued)
(a) Taxation in the consolidated statement of profit or loss represents: (Continued)
(iii) Pursuant to the rules and regulations applicable to encouraged industries in the PRC western development strategy, one subsidiary of the Group, GSMN Logistics Co., Ltd., is subject to PRC CIT at a preferential tax rate of 15% for the year ended 31 December 2018, and one subsidiary of the Group, Guangxi Sugar Market Network Co., Ltd., is subject to PRC CIT at a preferential tax rate of 9% for the year ended 31 December 2018. Pursuant to the rules and regulations applicable to advanced technology enterprises of the PRC, one subsidiary of the Group, Shenzhen AP88.com Agriculture Information Technology Limited, is subject to PRC CIT at a preferential tax rate of 15%.The application of preferential tax rate will be reviewed by the tax authority annually.
All the other PRC subsidiaries of the Group are subject to income tax at 25% for the year ended 31 December 2018 under the PRC Corporate Income Tax Law which was enacted on 16 March 2007.
(iv) PRC LAT which is levied on properties developed for sale by the Group in the PRC, at progressive rates ranging from 30% to 60% on the appreciation value, which under the applicable regulations is calculated based on the proceeds of sales of properties less deductible expenditures including lease charges of land use rights, borrowing costs and all qualified property development expenditures. Deferred tax assets arising from PRC LAT accrued are calculated based on the applicable income tax rates when they are expected to be cleared.
In addition, certain subsidiaries of the Group were subject to PRC LAT which is calculated based on 8% of their revenue in accordance with the authorised tax valuation method approved by respective local tax bureau.
The directors of the Company are of the opinion that the authorised tax valuation method is one of the allowable taxation methods in the PRC and the respective local tax bureaus are the competent tax authorities to approve the authorised tax valuation method in charging PRC LAT to the respective PRC subsidiaries of the Group, and the risk of being challenged by the State Tax Bureau or any tax bureau of higher authority is remote.
(v) According to the PRC Corporate Income Tax Law and its implementation regulations, dividends receivable by non-PRC corporate residents from PRC enterprises are subject to withholding tax at a rate of 10%, unless reduced by tax treaties or arrangements, for profits earned since 1 January 2008. In addition, under the Arrangement between the Mainland China and the Hong Kong Special Administrative Region for the Avoidance of Double Taxation and the Prevention of Fiscal Evasion with respect to Taxes on Income and its relevant regulations, a qualified Hong Kong tax resident will be liable for withholding tax at the rate of 5% for dividend income derived from the PRC if the Hong Kong tax resident is the “beneficial owner” and holds 25% or more of the equity interests of the PRC company.
The provision of the related deferred tax liabilities, if any, are based on the expected dividends to be distributed from these subsidiaries in the foreseeable future in respect of the profits generated since 1 January 2008. Deferred tax liabilities have not been recognised in respect of the tax that would be payable on the distribution of the retained profits as the Company controls the dividend policy of these subsidiaries and it has been determined that it is probable that these profits will not be distributed in the foreseeable future.

119Annual Report 2018 Zall Smart Commerce Group Ltd.
Notes to the Consolidated Financial Statements(Expressed in Renminbi unless otherwise indicated)
6 INCOME TAx IN THE CONSOLIDATED STATEMENT OF PROFIT OR LOSS (Continued)
(b) Reconciliation between tax expense and accounting profit at applicable tax rates
2018 2017RMB’000 RMB’000
Profit before taxation 2,348,075 2,803,621
Notional tax on profit before taxation, calculated at the rates applicable to profits in the tax jurisdiction concerned 942,816 779,668Tax effect of non-deductible expenses 19,348 18,462Tax effect of non-taxable share of net losses of joint ventures and associates 5,350 1,700Tax effect of non-taxable net income (1,744) (368)Tax effect of unused tax losses not recognised 78,409 35,535Tax effect of recognition of previously unused tax losses (1,068) –Utilisation of previously unrecognised tax losses (14,335) (23,781)PRC LAT in relation to properties sold 60,522 41,417PRC LAT in relation to investment properties – (526,853)Tax effect on PRC LAT (15,130) 121,359
Actual tax expense 1,074,168 447,139
7 DIRECTORS’ EMOLUMENTS
Directors’ emoluments are as follows:
For the year ended 31 December 2018
Directors’ fee
Salaries, allowances
and benefits in kind
Retirement scheme
contributions Sub-total
Equity-settled share-based
payment (Note) Total
RMB’000 RMB’000 RMB’000 RMB’000 RMB’000 RMB’000
Co-Chairman and executive directors:Mr. Yan Zhi 1,122 366 21 1,509 – 1,509Dr. Gang Yu 1,200 – – 1,200 – 1,200
Executive directors:Mr. Wei Zhe 1,200 – – 1,200 18,360 19,560Mr. Qi Zhiping (appointed on 6 July 2018) 293 485 – 778 387 1,165Mr. Cui Jinfeng 421 251 28 700 – 700Mr. Peng Chi (resigned on 6 July 2018) 135 – – 135 – 135
Independent non-executive directors:Mr. Cheung Kai Fai 263 – – 263 – 263Mr. Wu Ying 420 – – 420 – 420Mr. Zhu Zhengfu 420 – – 420 – 420
5,474 1,102 49 6,625 18,747 25,372

Zall Smart Commerce Group Ltd. Annual Report 2018120
Notes to the Consolidated Financial Statements(Expressed in Renminbi unless otherwise indicated)
7 DIRECTORS’ EMOLUMENTS (Continued)
For the year ended 31 December 2017
Directors’ fee
Salaries, allowances
and benefits in kind
Retirement scheme
contributions Sub-total
Equity-settled share-based
payment (Note) Total
RMB’000 RMB’000 RMB’000 RMB’000 RMB’000 RMB’000
Co-Chairman and executive directors:Mr. Yan Zhi 1,070 – 16 1,086 – 1,086Dr. Gang Yu 1,200 – – 1,200 – 1,200
Executive directors:Mr. Wei Zhe (re-designated on 28 June 2017) 807 – – 807 12,947 13,754Mr. Cui Jinfeng 401 – 16 417 – 417Mr. Wang Chuang (resigned on 11 April 2017) 112 – – 112 – 112Mr. Peng Chi 251 – – 251 – 251
Independent non-executive directors:Mr. Cheung Kai Fai 251 – – 251 – 251Mr. Wu Ying 401 – – 401 – 401Mr. Zhu Zhengfu (appointed on 10 March 2017) 325 – – 325 – 325
4,818 – 32 4,850 12,947 17,797
Note: These represent the estimated value of share options and share award granted to the directors under the Company’s Share Option and Management Shares Award Scheme. The value of these share options is measured according to the Group’s accounting policies for share-based payment transactions as set out in note 1(v).
The details of these benefits in kind, including the principal terms and number of options granted, are disclosed under the paragraph “Share option scheme” in the report of the directors and note 27.
During the year, no amount was paid or payable by the Group to the directors or any of the 5 highest paid individuals set out in note 8 as an inducement to join or upon joining the Group or as compensation for loss of office. There was no arrangement under which a director waived or agreed to waive any remuneration during the year.

121Annual Report 2018 Zall Smart Commerce Group Ltd.
Notes to the Consolidated Financial Statements(Expressed in Renminbi unless otherwise indicated)
8 INDIVIDUALS WITH HIGHEST EMOLUMENTS
Of the five individuals with the highest emoluments, three (2017: three) are directors whose emoluments are disclosed in note 7. The aggregate of the emoluments in respect of the other two (2017: two) individuals are as follows:
2018 2017RMB’000 RMB’000
Salaries and other emoluments 3,512 2,521Retirement scheme contributions 97 30
3,609 2,551
The emoluments of two (2017: two) individuals with the highest emoluments are within the following bands:
2018 2017Number of individuals
Number of individuals
HKD2,000,001-2,500,000 1 1HKD1,000,001-2,000,000 1 –HKD500,001-1,000,000 – 1
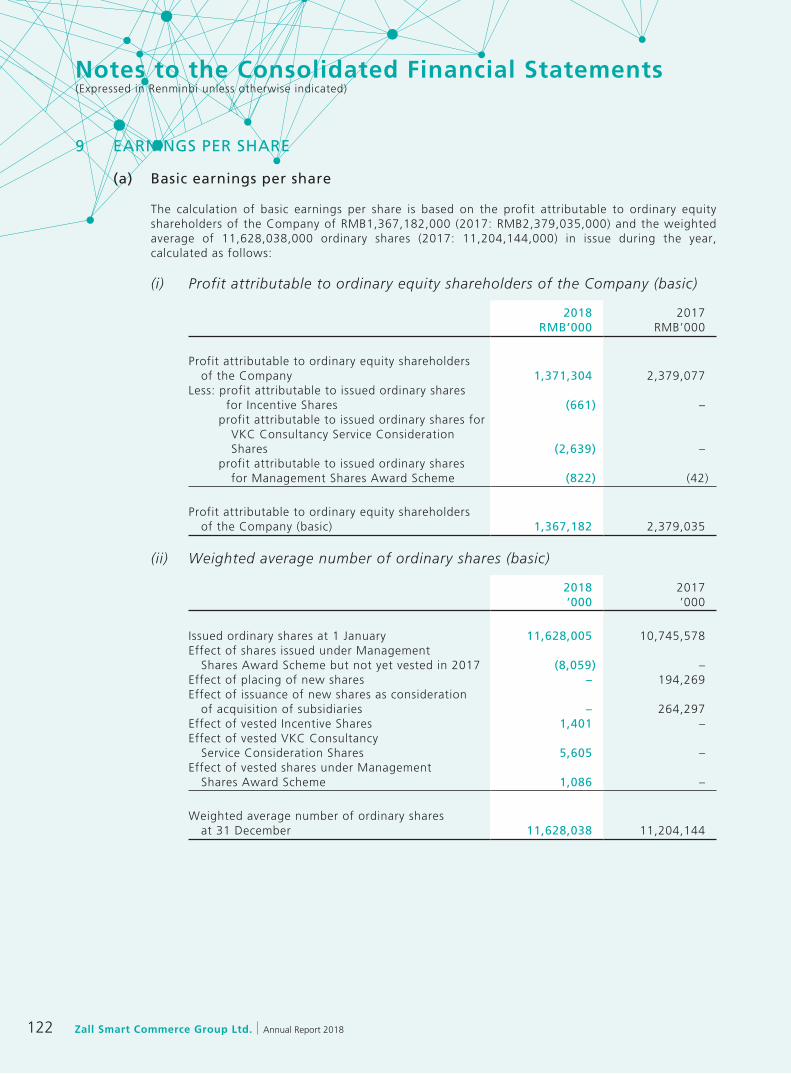
Zall Smart Commerce Group Ltd. Annual Report 2018122
Notes to the Consolidated Financial Statements(Expressed in Renminbi unless otherwise indicated)
9 EARNINGS PER SHARE
(a) Basic earnings per share
The calculation of basic earnings per share is based on the profit attributable to ordinary equity shareholders of the Company of RMB1,367,182,000 (2017: RMB2,379,035,000) and the weighted average of 11,628,038,000 ordinary shares (2017: 11,204,144,000) in issue during the year, calculated as follows:
(i) Profit attributable to ordinary equity shareholders of the Company (basic)
2018 2017RMB’000 RMB’000
Profit attributable to ordinary equity shareholders of the Company 1,371,304 2,379,077Less: profit attributable to issued ordinary shares for Incentive Shares (661) –
profit attributable to issued ordinary shares for VKC Consultancy Service Consideration Shares (2,639) –profit attributable to issued ordinary shares for Management Shares Award Scheme (822) (42)
Profit attributable to ordinary equity shareholders of the Company (basic) 1,367,182 2,379,035
(ii) Weighted average number of ordinary shares (basic)
2018 2017’000 ’000
Issued ordinary shares at 1 January 11,628,005 10,745,578Effect of shares issued under Management Shares Award Scheme but not yet vested in 2017 (8,059) –Effect of placing of new shares – 194,269Effect of issuance of new shares as consideration of acquisition of subsidiaries – 264,297Effect of vested Incentive Shares 1,401 –Effect of vested VKC Consultancy Service Consideration Shares 5,605 –Effect of vested shares under Management Shares Award Scheme 1,086 –
Weighted average number of ordinary shares at 31 December 11,628,038 11,204,144

123Annual Report 2018 Zall Smart Commerce Group Ltd.
Notes to the Consolidated Financial Statements(Expressed in Renminbi unless otherwise indicated)
9 EARNINGS PER SHARE (Continued)
(b) Diluted earnings per share
The calculation of diluted earnings per share is based on the profit attributable to ordinary equity shareholders of the Company of RMB1,370,482,000 (2017: RMB2,379,035,000) and the weighted average number of ordinary shares of 11,665,335,000 shares (2017: 11,206,627,000) in issue during the year, calculated as follows:
(i) Profit attributable to ordinary equity shareholders of the Company (diluted)
2018 2017RMB’000 RMB’000
Profit attributable to ordinary equity shareholders of the Company (basic) 1,367,182 2,379,035Add: profit attributable to issued ordinary shares for Incentive Shares 661 –
profit attributable to issued ordinary shares for VKC Consultancy Service Consideration Shares 2,639 –
Profit attributable to ordinary equity shareholders of the Company (diluted) 1,370,482 2,379,035
(ii) Weighted average number of ordinary shares (diluted)
2018 2017’000 ’000
Weighted average number of ordinary shares at 31 December (basic) 11,628,038 11,204,144Effect of deemed issue of Incentive Shares 7,667 2,483Effect of deemed issue of VKC Consultancy Service Consideration Shares 29,630 –
Weighted average number of ordinary shares at 31 December (diluted) 11,665,335 11,206,627

Zall Smart Commerce Group Ltd. Annual Report 2018124
Notes to the Consolidated Financial Statements(Expressed in Renminbi unless otherwise indicated)
10 INVESTMENT PROPERTIES
(a) Reconciliation of carrying amount
Completed investment properties
Investment properties
under development Total
RMB’000 RMB’000 RMB’000
At 1 January 2017 11,382,310 3,241,745 14,624,055Additions 34,361 216,029 250,390Transfer from completed properties held for sale (Note) 2,158,262 – 2,158,262Transfer from non-current assets classified as held for sale 152,705 – 152,705Fair value adjustments 3,009,659 11,667 3,021,326
At 31 December 2017 16,737,297 3,469,441 20,206,738
Representing:Cost 6,826,943 1,560,464 8,387,407Fair value adjustments 9,910,354 1,908,977 11,819,331
16,737,297 3,469,441 20,206,738
At 1 January 2018 16,737,297 3,469,441 20,206,738Additions 37,574 205,447 243,021Transfer from completed properties held for sale (Note) 1,141,448 – 1,141,448Fair value adjustments 3,697,611 167,581 3,865,192
At 31 December 2018 21,613,930 3,842,469 25,456,399
Representing:Cost 8,005,965 1,765,911 9,771,876Fair value adjustments 13,607,965 2,076,558 15,684,523
21,613,930 3,842,469 25,456,399
Book value:At 31 December 2018 21,613,930 3,842,469 25,456,399
At 31 December 2017 16,737,297 3,469,441 20,206,738
Note: During the year ended 31 December 2018, the Group transferred certain completed properties held for sale to investment properties when there was an actual change in use from sale to earning rental income purpose, which were evidenced by commencement of operating lease as stipulated in the lease agreements entered into by the Group. Correspondingly, a fair value gain in profit or loss of RMB3,971,127,000 (2017: RMB3,020,140,000) upon transfer was recognised.
As at 31 December 2018, the Group’s investment properties and investment properties under development with an aggregated carrying value of RMB18,991,425,000 (2017: RMB13,887,495,000) were pledged as collateral for the Group’s bank loans (note 25(a)).
The Group’s investment properties are held under medium-term lease in the PRC.
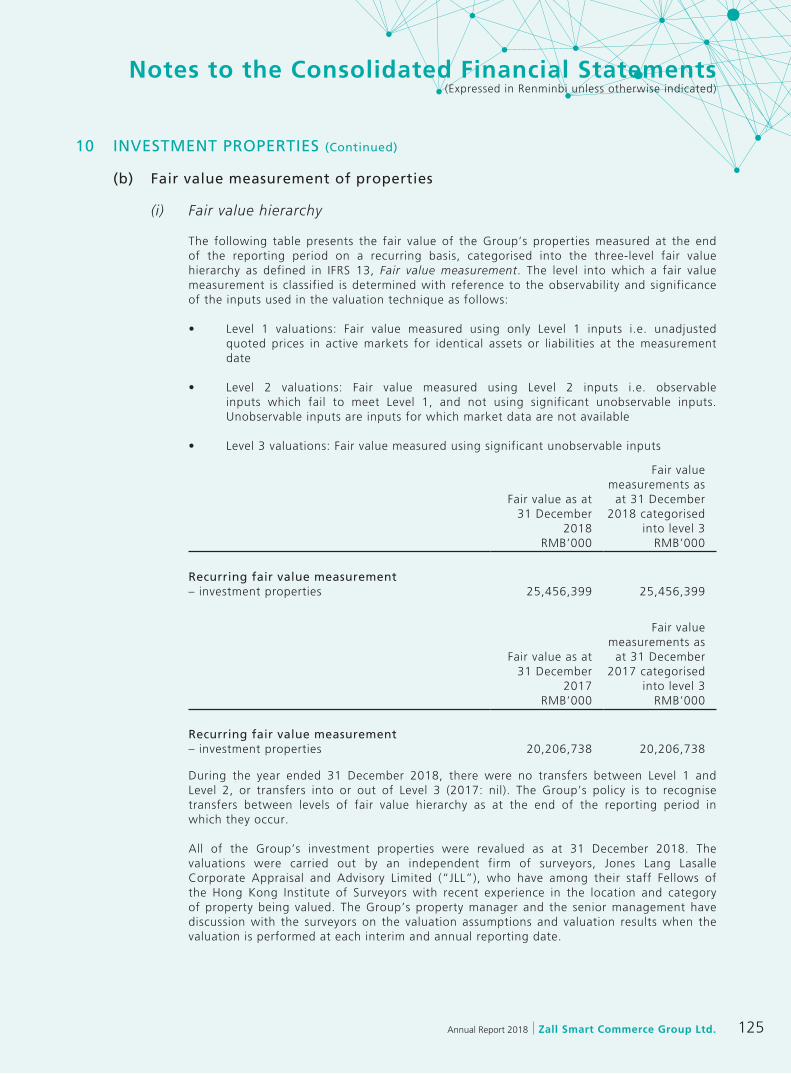
125Annual Report 2018 Zall Smart Commerce Group Ltd.
Notes to the Consolidated Financial Statements(Expressed in Renminbi unless otherwise indicated)
10 INVESTMENT PROPERTIES (Continued)
(b) Fair value measurement of properties
(i) Fair value hierarchy
The following table presents the fair value of the Group’s properties measured at the end of the reporting period on a recurring basis, categorised into the three-level fair value hierarchy as defined in IFRS 13, Fair value measurement. The level into which a fair value measurement is classified is determined with reference to the observability and significance of the inputs used in the valuation technique as follows:
• Level 1 valuations: Fair value measured using only Level 1 inputs i.e. unadjustedquoted prices in active markets for identical assets or liabilities at the measurement date
• Level 2 valuations: Fair value measured using Level 2 inputs i.e. observableinputs which fail to meet Level 1, and not using significant unobservable inputs. Unobservable inputs are inputs for which market data are not available
• Level3valuations:Fairvaluemeasuredusingsignificantunobservableinputs
Fair value as at 31 December
2018
Fair value measurements as
at 31 December 2018 categorised
into level 3RMB’000 RMB’000
Recurring fair value measurement– investment properties 25,456,399 25,456,399
Fair value as at 31 December
2017
Fair value measurements as
at 31 December 2017 categorised
into level 3RMB’000 RMB’000
Recurring fair value measurement– investment properties 20,206,738 20,206,738
During the year ended 31 December 2018, there were no transfers between Level 1 and Level 2, or transfers into or out of Level 3 (2017: nil). The Group’s policy is to recognise transfers between levels of fair value hierarchy as at the end of the reporting period in which they occur.
All of the Group’s investment properties were revalued as at 31 December 2018. The valuations were carried out by an independent firm of surveyors, Jones Lang Lasalle Corporate Appraisal and Advisory Limited (“JLL”), who have among their staff Fellows of the Hong Kong Institute of Surveyors with recent experience in the location and category of property being valued. The Group’s property manager and the senior management have discussion with the surveyors on the valuation assumptions and valuation results when the valuation is performed at each interim and annual reporting date.
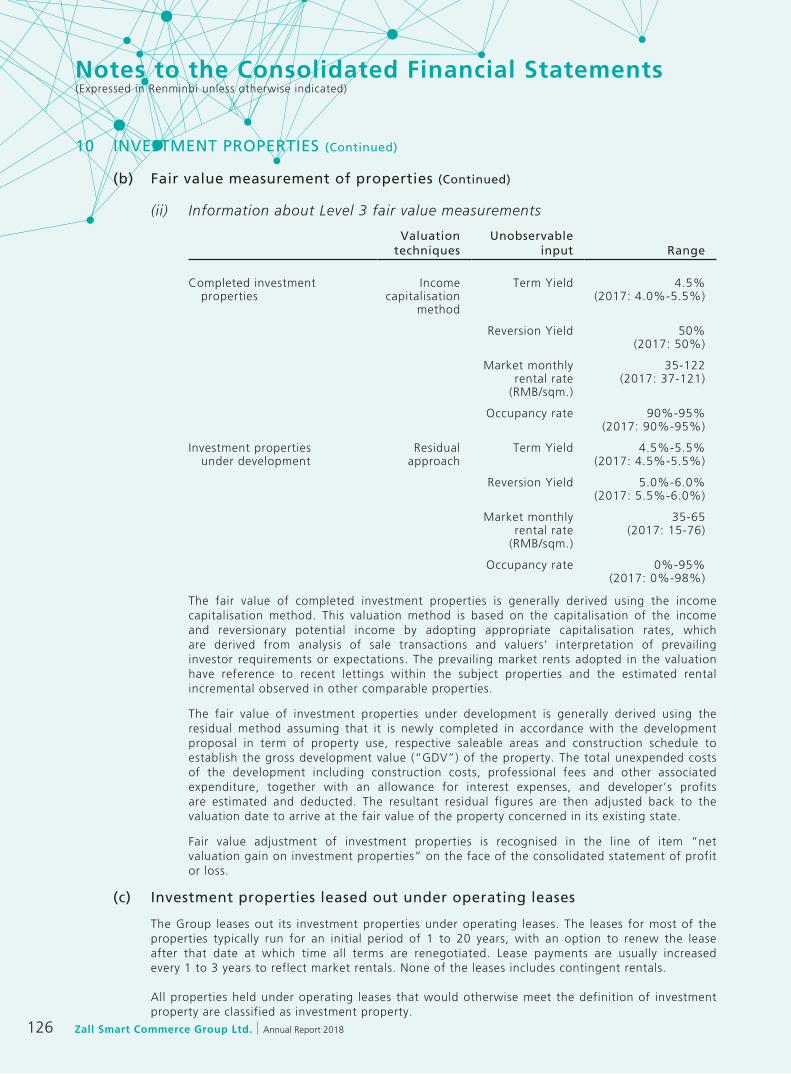
Zall Smart Commerce Group Ltd. Annual Report 2018126
Notes to the Consolidated Financial Statements(Expressed in Renminbi unless otherwise indicated)
10 INVESTMENT PROPERTIES (Continued)
(b) Fair value measurement of properties (Continued)
(ii) Information about Level 3 fair value measurements
Valuation techniques
Unobservable input Range
Completed investment properties
Income capitalisation
method
Term Yield 4.5%(2017: 4.0%-5.5%)
Reversion Yield 50%(2017: 50%)
Market monthly rental rate
(RMB/sqm.)
35-122(2017: 37-121)
Occupancy rate 90%-95%(2017: 90%-95%)
Investment properties under development
Residual approach
Term Yield 4.5%-5.5%(2017: 4.5%-5.5%)
Reversion Yield 5.0%-6.0%(2017: 5.5%-6.0%)
Market monthly rental rate
(RMB/sqm.)
35-65(2017: 15-76)
Occupancy rate 0%-95%(2017: 0%-98%)
The fair value of completed investment properties is generally derived using the income capitalisation method. This valuation method is based on the capitalisation of the income and reversionary potential income by adopting appropriate capitalisation rates, which are derived from analysis of sale transactions and valuers’ interpretation of prevailing investor requirements or expectations. The prevailing market rents adopted in the valuation have reference to recent lettings within the subject properties and the estimated rental incremental observed in other comparable properties.
The fair value of investment properties under development is generally derived using the residual method assuming that it is newly completed in accordance with the development proposal in term of property use, respective saleable areas and construction schedule to establish the gross development value (“GDV”) of the property. The total unexpended costs of the development including construction costs, professional fees and other associated expenditure, together with an allowance for interest expenses, and developer’s profits are estimated and deducted. The resultant residual figures are then adjusted back to the valuation date to arrive at the fair value of the property concerned in its existing state.
Fair value adjustment of investment properties is recognised in the line of item “net valuation gain on investment properties” on the face of the consolidated statement of profit or loss.
(c) Investment properties leased out under operating leases
The Group leases out its investment properties under operating leases. The leases for most of the properties typically run for an initial period of 1 to 20 years, with an option to renew the lease after that date at which time all terms are renegotiated. Lease payments are usually increased every 1 to 3 years to reflect market rentals. None of the leases includes contingent rentals.
All properties held under operating leases that would otherwise meet the definition of investment property are classified as investment property.

127Annual Report 2018 Zall Smart Commerce Group Ltd.
Notes to the Consolidated Financial Statements(Expressed in Renminbi unless otherwise indicated)
11 PROPERTY, PLANT AND EQUIPMENT
Land & Buildings
Motor vehicles
Furniture, office
equipment and others Total
RMB’000 RMB’000 RMB’000 RMB’000
Cost:At 1 January 2017 139,931 17,774 19,596 177,301Additions 14,612 325 7,380 22,317Addition through acquisition of subsidiaries 93,269 6,676 79,178 179,123Disposals – (705) (4,628) (5,333)
At 31 December 2017/1 January 2018 247,812 24,070 101,526 373,408Additions 135,211 5,268 11,492 151,971Addition through acquisition of subsidiaries (note 34) – 673 1,407 2,080Disposals (17,238) (349) (757) (18,344)
At 31 December 2018 365,785 29,662 113,668 509,115
Accumulated depreciation:At 1 January 2017 33,221 16,611 13,654 63,486Charge for the year 11,985 1,541 9,329 22,855Addition through acquisition of subsidiaries 25,612 4,967 43,647 74,226Written back on disposals – (664) (3,476) (4,140)
At 31 December 2017/1 January 2018 70,818 22,455 63,154 156,427Charge for the year 24,204 3,617 11,138 38,959Addition through acquisition of subsidiaries (note 34) – 521 1,151 1,672Written back on disposals (1,332) (333) (578) (2,243)
At 31 December 2018 93,690 26,260 74,865 194,815
Net book value:At 31 December 2018 272,095 3,402 38,803 314,300
At 31 December 2017 176,994 1,615 38,372 216,981
All the buildings owned by the Group are located in the PRC on land under medium term leases.
The ownership certificates for certain buildings with net book value of RMB15,145,000 (2017: RMB17,723,000) have not been obtained. The directors are of the opinion that the Group are entitled to lawfully and validly occupy and use of the above mentioned buildings.
As at 31 December 2018, the Group’s buildings with carrying value of RMB248,394,000 (2017: RMB15,960,000) were pledged as collateral for the Group’s bank loans (note 25(a)).
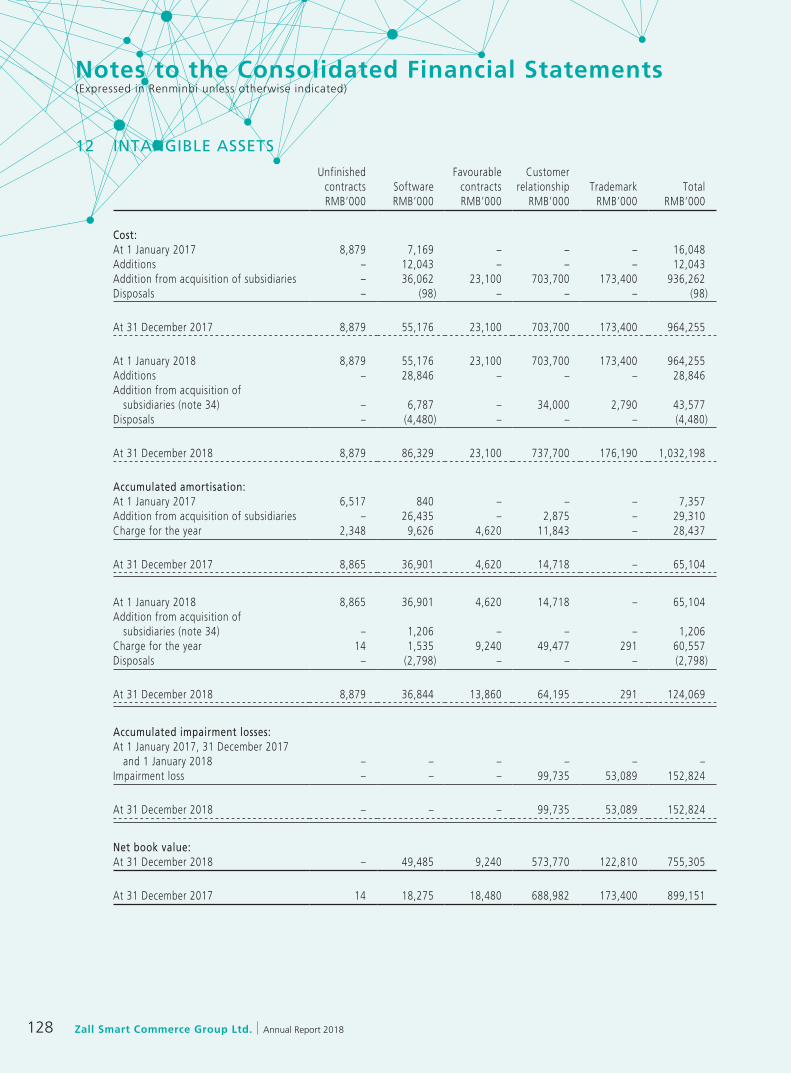
Zall Smart Commerce Group Ltd. Annual Report 2018128
Notes to the Consolidated Financial Statements(Expressed in Renminbi unless otherwise indicated)
12 INTANGIBLE ASSETS
Unfinished contracts Software
Favourable contracts
Customer relationship Trademark Total
RMB’000 RMB’000 RMB’000 RMB’000 RMB’000 RMB’000
Cost:At 1 January 2017 8,879 7,169 – – – 16,048Additions – 12,043 – – – 12,043Addition from acquisition of subsidiaries – 36,062 23,100 703,700 173,400 936,262Disposals – (98) – – – (98)
At 31 December 2017 8,879 55,176 23,100 703,700 173,400 964,255
At 1 January 2018 8,879 55,176 23,100 703,700 173,400 964,255Additions – 28,846 – – – 28,846Addition from acquisition of subsidiaries (note 34) – 6,787 – 34,000 2,790 43,577Disposals – (4,480) – – – (4,480)
At 31 December 2018 8,879 86,329 23,100 737,700 176,190 1,032,198
Accumulated amortisation:At 1 January 2017 6,517 840 – – – 7,357Addition from acquisition of subsidiaries – 26,435 – 2,875 – 29,310Charge for the year 2,348 9,626 4,620 11,843 – 28,437
At 31 December 2017 8,865 36,901 4,620 14,718 – 65,104
At 1 January 2018 8,865 36,901 4,620 14,718 – 65,104Addition from acquisition of subsidiaries (note 34) – 1,206 – – – 1,206Charge for the year 14 1,535 9,240 49,477 291 60,557Disposals – (2,798) – – – (2,798)
At 31 December 2018 8,879 36,844 13,860 64,195 291 124,069
Accumulated impairment losses:At 1 January 2017, 31 December 2017 and 1 January 2018 – – – – – –Impairment loss – – – 99,735 53,089 152,824
At 31 December 2018 – – – 99,735 53,089 152,824
Net book value:At 31 December 2018 – 49,485 9,240 573,770 122,810 755,305
At 31 December 2017 14 18,275 18,480 688,982 173,400 899,151
129Annual Report 2018 Zall Smart Commerce Group Ltd.
Notes to the Consolidated Financial Statements(Expressed in Renminbi unless otherwise indicated)
12 INTANGIBLE ASSETS (Continued)
The amortisation charge for the year is included in “administrative and other expenses” in the consolidated statement of profit or loss.
Included in the carrying amount of customer relationship and trademark as at 31 December 2018 is an amount of RMB703,700,000 and RMB173,400,000, respectively, allocated to CGU – Shenzhen Sinoagri a business operation engaged in business of supply chain management and trading of agriculture products.
An impairment test has been carried out for the Shenzhen Sinoagri’s trademark which has indefinite useful life. The recoverable amount of trademark was estimated through the application of an income approach technique known as relief from royalty method. Under the relief from royalty method, the value of the trademarks depends on the present worth of future economic benefits to be derived from the projected royalty income, using a discount rate of 22.79% (2017: 19.51%). The growth of royalty income was projected taking into account the average growth rate of Shenzhen Sinoagri’s gross profit of 16.62% (2017: 32.09%) of next 5 years and a fixed royalty rate of 4% based on the historical industry information. The growth of gross profit was projected taking into account the average growth levels experienced over the past years and the estimated sales volume and price growth for the next five years. Royalty income beyond the five-year period are extrapolated using an estimated weighted average growth rate of 3% (2017: 2.6%). The growth rates used do not exceed the long-term average growth rates for the business in which the trademark related to. The discount rates used are pre-tax and reflect specific risks relating to the relevant segments. The fair value measurement was categorised as a Level 3 fair value based on the inputs in the valuation technique used.
The recoverable amount of trademark was estimated to be less than its carrying amount and impairment amounting RMB51,700,000 was recognised. As the trademark has been reduced to its recoverable amount of RMB121,700,000, any adverse change in the assumptions used in the calculation of recoverable amount would result in further impairment losses.
As a result of the recognition of the impairment loss for the Shenzhen Sinoagri’s trademark, management considered that there was an indication of impairment for Shenzhen Sinoagri’s customer relationship and carried out an impairment test. The recoverable amount of customer relationship was estimated based on the application of an income approach technique known as the multi-period excess earning method. In the application of this method, the forecast cash flow are discounted and adjusted into present worth to reflect all risks including intrinsic and extrinsic uncertainties in relation to the customer relationship. The growth of forecast cash flow in relation to the customer relationship was projected taking into account the average growth rate of Shenzhen Sinoagri’s gross profit of 16.62% (2017: 32.09%) of next 5 years and an annual customer attrition rate of 17% based on historical data from internal sources. The growth of gross profit was projected taking into account the average growth levels experienced over the past years and the estimated sales volume and price growth for the next five years. The gross profit projected beyond the five-year period to 18 years are using an estimated growth rate of 3% (2017: 2.6%). The growth rates used do not exceed the long-term average growth rates for the business in which the customer relationship related to. The cash flows are discounted using a pre-tax discount rate of 29.96%. The fair value measurement was categorised as a Level 3 fair value based on the inputs in the valuation technique used.
The recoverable amount of customer relationship was estimated to be less than its carrying amount and impairment amounting to RMB99,735,000 was recognised.
Zall Smart Commerce Group Ltd. Annual Report 2018130
Notes to the Consolidated Financial Statements(Expressed in Renminbi unless otherwise indicated)
13 GOODWILL
RMB’000
Cost:At 1 January 2017 15,783Additions through business combination 1,590,497
At 31 December 2017/1 January 2018 1,606,280Additions through business combination (note 34) 106,797Disposal of subsidiaries (7)
At 31 December 2018 1,713,070
Accumulated impairment losses:At 1 January 2017, 31 December 2017 and 1 January 2018 –Impairment loss (461,028)
At 31 December 2018 (461,028)
Carrying amount:At 31 December 2017 1,606,280
At 31 December 2018 1,252,042
Impairment tests for cash-generating units containing goodwill
Goodwill is allocated to the Group’s cash-generating units (CGU) identified according to operating segment as follows.
2018 2017RMB’000 RMB’000
Shenzhen Sinoagri – business of supply chain management and trading of agriculture products 1,129,462 1,590,497HSH – business of supply chain management and trading of chemical and plastic raw materials 106,797 –E-commerce and financial services business 15,783 15,783
1,252,042 1,606,280
The recoverable amount of the CGU – Shenzhen Sinoagri is determined based on value-in-use calculations. These calculations use cash flow projections based on financial budgets approved by management covering a five-year period. The average budgeted EBITDA growth rate for the five year period is 26.78% (2017: 57.90%). Budgeted EBITDA was based on expectations of future outcomes taking into account past experience, adjusted for anticipated revenue growth. Revenue growth was projected taking into account the average growth levels experienced over the past years and the estimated sales volume and price growth for the next five years. Cash flows beyond the five-year period are extrapolated using an estimated weighted average growth rate of 3% (2017: 2.6%). The growth rates used do not exceed the long-term average growth rates for the business in which the CGU operates. The cash flows are discounted using a discount rate of 19.90% (2017: 18.25%). The discount rates used are pre-tax and reflect specific risks relating to the relevant segments.
The impairment loss recognised during the year solely relates to the CGU – Shenzhen Sinoagri. As the CGU has been reduced to its recoverable amount of RMB3,500,000,000, any adverse change in the assumptions used in the calculation of recoverable amount would result in further impairment losses.

131Annual Report 2018 Zall Smart Commerce Group Ltd.
Notes to the Consolidated Financial Statements(Expressed in Renminbi unless otherwise indicated)
14 INTERESTS IN SUBSIDIARIES
The following list contains only the particulars of principal subsidiaries which principally affected the results, assets or liabilities of the Group. The class of shares held is ordinary unless otherwise stated.
Proportion of ownership interest
Name of subsidiaries
Place of incorporation and business
Particulars of issued and paid-up capital
Group’s effective interest
Held by the Company
Held by a subsidiary Principal activities
Wuhan North Hankou Trade Market The PRC RMB55,000,000 100% – 100% Property development Investment Co., Ltd. (notes (i) and (ii))武漢漢口北商貿市場投資有限公司
Wuhan Big World Investment and Development Co., Ltd. (notes (i) and (ii))
The PRC RMB100,000,000 100% – 100% Property development
武漢大世界投資發展有限公司
Zall Development (Tianjin) Co., Ltd. (notes (i) and (ii))
The PRC RMB1,001,000,000/RMB442,000,000
100% – 100% Property development
卓爾發展(天津)有限公司
Shenzhen Sinoagri E-commerce Co., Ltd. The PRC RMB509,000,000 50.6% – 50.6% Supply chain (“Shenzhen Sinoagri”).(notes (i) and (iii)) management and 深圳市中農網有限公司 trading business
Shenzhen Kunshang E-Sugar Supply Chain Co., Ltd. (notes (i) and (ii))
The PRC RMB80,000,000 33.63% – 66.47% Supply chain management and
深圳市昆商易糖供應鏈有限公司 trading business
Yunnan Kunpeng Electronic Commerce & Wholesale Markets of Agricultural Products Co.,Ltd. (notes (i) and (ii))
The PRC RMB40,000,000 33.63% – 66.47% Supply chain management and
trading business雲南鯤鵬農產品電子商務批發市場有限公司
Guangxi Kangchen Shitang Trading Co., Ltd. (notes (i) and (ii))
The PRC RMB10,000,000 33.63% – 66.47% Supply chain management and
廣西康宸世糖貿易有限公司 trading business
Guangxi Pintang Trading Co., Ltd. (notes (i) and (ii))
The PRC RMB36,000,000 33.63% – 66.47% Supply chain management and
廣西品糖貿易有限公司 trading business
Shanghai Zall Steel E-commerce Co., Ltd. (notes (i) and (ii))
The PRC RMB100,000,000/RMB50,000,000
51% – 51% Supply chain management and
上海卓鋼鏈電子商務有限公司 trading business
Zhejiang Jiasusheng Trade Co., Ltd. (notes (i) and (ii))
The PRC RMB20,000,000 75.71% – 100% Supply chain management and
浙江嘉塑盛貿易有限公司 trading business
Notes:
(i) The English translation of the companies names is for reference only. The official names of these companies are in Chinese.
(ii) These entities are domestic enterprises established in the PRC.
(iii) This entity is sino-foreign equity joint venture established in the PRC.

Zall Smart Commerce Group Ltd. Annual Report 2018132
Notes to the Consolidated Financial Statements(Expressed in Renminbi unless otherwise indicated)
14 INTERESTS IN SUBSIDIARIES (Continued)
The following table lists out the information relating to Shenzhen Sinoagri and its subsidiaries, which has a material non-controlling interest (NCI). The summarised financial information presented below represents the amounts before any inter-company elimination.
2018 2017RMB’000 RMB’000
NCI percentage 49.4% 49.4%
Current assets 11,933,790 9,586,680Non-current assets 553,710 1,120,496Current liabilities 11,214,497 8,892,560Non-current liabilities 124,234 263,160Net assets 1,148,769 1,551,456
Carrying amount of NCI 790,581 852,069
Revenue 34,976,345 17,165,471Profit for the year before amortisation of intangible assets, impairment loss on intangible assets and equity-settled share-based payment expense 53,389 24,315Less: Expenses arisen from acquisition: – Amortisation of intangible assets 24,694 12,347 – Equity-settled share-based payment expense 53,586 52,312 – Impairment loss on intangible assets 151,435 –Loss contributed to the Group’s result 176,326 40,344Total comprehensive income (176,326) (40,344)Loss allocated to NCI 66,401 16,049Dividend paid to NCI 13,302 4,242
Net cash generated from/(used in) operating activities 222,786 (563,748)Net cash (used in)/generated from investing activities (24,064) 155,058Net cash generate from/(used in) financing activities 46,616 (19,017)
15 INTERESTS IN ASSOCIATES
The following list contains only the particulars of material associates:
Proportion of ownership interest
Name of associateForm of business
structure
Place of incorporation and business
Particulars of issued and paid-up capital
Group’s effective interest
Held by the Company
Held by a subsidiary Principal activity
LightInTheBox Holding Co., Ltd. (“LightInTheBox”)
Incorporated Cayman/Overseas 134,456,369ordinary shares of USD0.000067each
41.04% – 41.04% E-commerce (Note)
Note: LightInTheBox is a company incorporated under the laws of the Cayman Islands with limited liability, whose American Depositary Shares are listed on the New York Stock Exchange. LightInTheBox is a strategic partner for the Group in developing E-commence business where LightInTheBox has extensive experience.
133Annual Report 2018 Zall Smart Commerce Group Ltd.
Notes to the Consolidated Financial Statements(Expressed in Renminbi unless otherwise indicated)
15 INTERESTS IN ASSOCIATES (Continued)
The associate is accounted for using the equity method in the consolidated financial statements.
Summarised financial information of the material associate, adjusted for any differences in accounting policies, and reconciled to the carrying amounts in the consolidated financial statements, are disclosed below:
2018 2017RMB’000 RMB’000
Gross amounts of the associate’s
Revenue 1,524,215 2,154,590Loss for the year 403,880 86,588Other comprehensive (loss)/income (4,910) 2,546Total comprehensive income 408,790 84,042Dividend received from the associate – –
Current assets 381,292 659,850Non-current assets 604,406 316,765Current liabilities 756,572 348,057Non-current liabilities 7,934 –
Equity 221,192 628,558
Reconciled to the Group’s interests in the associateGross amount of net assets of the associate 221,192 628,558Group’s effective interest 41.04% 34.44%Group’s share of net assets of the associate 90,777 216,451
GoodwillCost 264,090 280,370Exchange adjustment 12,816 (16,280)Impairment (26,155) –
Carrying amount of goodwill 250,751 264,090
Carrying amount in the consolidated financial statements 341,528 480,541

Zall Smart Commerce Group Ltd. Annual Report 2018134
Notes to the Consolidated Financial Statements(Expressed in Renminbi unless otherwise indicated)
15 INTERESTS IN ASSOCIATES (Continued)
Aggregate information of the associates that are not individually material:
2018 2017RMB’000 RMB’000
Aggregate carrying amount of individually immaterial associates in the consolidated financial statements 126,060 10,045Aggregate amount of the Group’s share of those associates’ – Loss for the year 5,850 6,233 – Other comprehensive income – – – Total comprehensive income 5,850 6,233
As the closing share price of LightInTheBox on 31 December 2018 was substantially lower than the carrying amount per share of shares held by the Group and LightInTheBox sustained losses for several years, the directors considered that there was an indication of impairment for interests in LightInTheBox and carried out an impairment test. The recoverable amount of the interests in LightInTheBox was based on fair value less costs of disposal, estimated with reference to the share prices on transactions in open market and the share price of over the counter transaction near the end of the reporting period. The fair value measurement was categorised as a Level 2 fair value based on the inputs in the valuation technique used. As a result, impairment loss of approximately RMB26,155,000 was provided for interests in LightInTheBox for the year ended 31 December 2018 and the recoverable amount was RMB341,528,000 as at 31 December 2018.
16 INTERESTS IN JOINT VENTURES
The directors are of the view that the Group had no individually material joint venture as at 31 December 2018 and 2017. Aggregate information of the joint ventures that are not individually material:
2018 2017RMB’000 RMB’000
Aggregate carrying amount of individually immaterial joint venture in the consolidated financial statements 25,519 114,387Aggregate amount of the Group’s share of the joint ventures’ – (Losses)/profit for the year (2,343) 727 – Other comprehensive income – – – Total comprehensive income (2,343) 727
17 OTHER NON-CURRENT FINANCIAL ASSETS
31 December 2018
1 January 2018
31 December 2017
RMB’000 RMB’000 RMB’000
Equity securities designated at FVOCI (non-recycling) – Unlisted equity securities 8,702 11,229 –
Available-for-sale financial assets – Unlisted equity securities – – 12,500
The unlisted equity securities are shares in Sinocan International Technologies Co., Ltd., a company incorporated in PRC and engaged in research and development of advanced touch and display technologies and providing touch product solution. The Group designated its investment in Sinocan International Technologies Co., Ltd. at FVOCI (non-recycling), as the investment is held for strategic purposes. No dividends were received on this investment during the year (2017: nil).
Available-for-sale financial assets were reclassified to equity securities designated at FVOCI (non-recycling) upon the initial application of IFRS 9 at 1 January 2018 (see note 1(c)(i)).
135Annual Report 2018 Zall Smart Commerce Group Ltd.
Notes to the Financial Statements(Expressed in Renminbi unless otherwise indicated)
18 FINANCIAL ASSETS/LIABILITIES AT FAIR VALUE THROUGH PROFIT OR LOSS
2018 2017RMB’000 RMB’000
Financial assets at fair value through profit or lossListed equity securities in Hong Kong– Fullshare Holdings Limited 968,187 2,092,944– China High Speed Transmission Equipment Group Co., Ltd – 30,807Derivative financial instrument– Warrant – 3– Wealth management products and trust products (i) 3,388,360 2,761,540Forward contracts 141,051 182,408Contingent consideration (note 30(f) and 34)– acquisition of Shenzhen Sinoagri (ii) 278,052 6,915– acquisition of HSH (iii) 9,705 –
4,785,355 5,074,617
Financial liabilities at fair value through profit or loss – currentForward contracts 141,051 450,140Contingent consideration (iii) – acquisition of HSH 1,276 –
142,327 450,140
Financial liabilities at fair value through profit or loss – non-currentConvertible redeemable preference shares (iv) 59,024 –
(i) The amount represents investments in wealth management products and trust products issued by reputable financial institutions in the PRC. There are no fixed or determinable returns of these wealth management products and trust products. Wealth management products and trust products with an aggregate carrying amount of RMB3,240,749,000 (2017: RMB2,761,540,000) were pledged for bills payable of the Group (note 24).
(ii) The amount represents the contingent consideration of acquisition of Shenzhen Sinoagri amounting to RMB278,052,000 as at 31 December 2018 (31 December 2017: RMB6,915,000). The amount is generated as a result of part of the consideration of the acquisition which depends on the post-acquisition financial performance of Shenzhen Sinoagri.
(iii) The amount represents the contingent consideration of acquisition of HSH (see note 34). The amount is generated as a result of part of the consideration of the acquisition which depends on the post-acquisition financial performance of HSH.
(iv) Convertible redeemable preference shares were issued by HSH (note 34). At the option of the holder, the convertible redeemable preference shares can be converted at any time into ordinary shares of HSH based on pre-determined conversion price, subject to certain anti-dilution adjustments. The holders of preference shares are entitled to redemption rights with various maturity periods.

Zall Smart Commerce Group Ltd. Annual Report 2018136
Notes to the Financial Statements(Expressed in Renminbi unless otherwise indicated)
19 INVENTORIES AND OTHER CONTRACT COSTS
31 December 2018
1 January 2018
31 December 2017
Note RMB’000 RMB’000 RMB’000
InventoriesProperties under development for sale (ii) 4,113,217 4,924,243 4,905,386Completed properties held for sale 1,700,152 1,968,727 1,968,727Commodities 463,736 288,411 288,411
6,277,105 7,181,381 7,162,524
(i) The Group has initially applied IFRS 15 using the cumulative effect method and adjusted the opening balances at 1 January 2018. Comparative information has not been restated.
(ii) Upon the adoption of IFRS 15, opening adjustments were made as at 1 January 2018 to accrue interest on certain advance payments received from customers. This interest was eligible for capitalisation into the carrying value of the Group’s properties under development for sale, which has resulted in an increase in that balance as at that date (see note 1(c)(ii)).
(a) Properties under development for sale
(i) Properties under development in the consolidated statement of financial position comprise:
2018 2017RMB’000 RMB’000
Expected to be recovered within one yearProperties under development for sale 1,087,635 926,821
Expected to be recovered after more than one yearProperties held for future development for sale 1,659,909 3,363,149Properties under development for sale 1,365,673 615,416
3,025,582 3,978,565
4,113,217 4,905,386
As at 31 December 2018, certain properties under development with an aggregate carrying value of RMB1,204,985,000 (2017: RMB1,704,082,000) was pledged as collateral for the Group’s bank loans (note 25).

137Annual Report 2018 Zall Smart Commerce Group Ltd.
Notes to the Financial Statements(Expressed in Renminbi unless otherwise indicated)
19 INVENTORIES AND OTHER CONTRACT COSTS (Continued)
(a) Properties under development for sale (Continued)
(ii) The analysis of carrying value of leasehold land included in properties under development is as follows:
2018 2017RMB’000 RMB’000
In the PRC– long-term leases (over 50 years) 18,833 28,258– medium-term leases (40-50 years) 1,302,493 1,226,257
1,321,326 1,254,515
(b) Completed properties held for sale
2018 2017RMB’000 RMB’000
Completed properties held for sale in the PRC 1,700,152 1,968,727
The analysis of carrying value of leasehold land included in completed properties held for sale is as follows:
2018 2017RMB’000 RMB’000
In the PRC– long-term leases (over 50 years) 5,922 5,374– medium-term leases (40-50 years) 333,662 267,293
339,584 272,667
Carrying amount of completed properties held for sale recognised as an expenses and included in profit or loss for the year ended 31 December 2018 is RMB382,542,000 (2017: RMB465,418,000).
The amount of completed properties held for sale expected to be recovered after more than one year is RMB1,383,728,000 (2017: RMB1,586,185,000).
As at 31 December 2018, completed properties held for sale with an aggregate carrying value of RMB1,426,811,000 (2017: RMB1,517,956,000) was pledged as collateral for the Group’s bank loans (note 25).

Zall Smart Commerce Group Ltd. Annual Report 2018138
Notes to the Financial Statements(Expressed in Renminbi unless otherwise indicated)
19 INVENTORIES AND OTHER CONTRACT COSTS (Continued)
(c) Commodities
(i) Commodities in the consolidated statement of financial position comprise:
2018 2017RMB’000 RMB’000
Supply chain management and trading business– Sugar 89,882 282,920– Steel 232,587 – – Chemical materials 40,456 – – Plastic 34,364 – – Others 66,447 5,491
463,736 288,411
(ii) The analysis of the amount of commodities recognised as an expenses and included in profit or loss is as follows:
2018 2017RMB’000 RMB’000
Carrying amount of commodities sold 53,779,019 20,467,478
20 CONTRACT ASSETS AND CONTRACT LIABILITIES
(a) Contract assets
31 December 2018
1 January 2018(i)
31 December 2017(i)
Note RMB’000 RMB’000 RMB’000
Contract assetsArising from performance under construction contracts (ii) 329,876 324,862 –
Receivables from contracts with customers within the scope of IFRS 15, which are included in “Trade and other receivables” (note 21) 2,068,252 1,596,803
Notes:
(i) The Group has initially applied IFRS 9 and IFRS 15 using the cumulative effect method and adjusted the opening balances as at 1 January 2018.
(ii) Upon the adoption of IFRS 15, amounts previously included as “Long-term receivables” were reclassified to contract assets (see note 1(c)(ii)). The payment schedule of the Group’s construction contract requires final settlement when the project is completed. This payment schedule results in the build up of significant contract assets.

139Annual Report 2018 Zall Smart Commerce Group Ltd.
Notes to the Financial Statements(Expressed in Renminbi unless otherwise indicated)
20 CONTRACT ASSETS AND CONTRACT LIABILITIES (Continued)
(a) Contract assets (Continued)
The amount of contract assets that is expected to be recovered after more than one year is RMB329,876,000 (2017: RMB324,862,000).
(b) Contract liabilities
31 December 2018
1 January 2018(i)
31 December 2017(i)
Notes RMB’000 RMB’000 RMB’000
Contract liabilitiesProperty development and
related services– Forward sales deposits and
instalments received (ii)(iii) 443,709 787,173 –
Supply chain management and trading
– Deposits received from third parties (ii) 1,358,564 252,727 –
– Deposits received from related parties (ii) 27,439 – –
Others– Deposits received (ii) 6,006 7,400 –
1,835,718 1,047,300 –
Notes:
(i) The Group has initially applied IFRS 15 using the cumulative effect method and adjusted the opening balances at 1 January 2018.
(ii) Upon the adoption of IFRS 15, these amounts were reclassified from “trade and other payables” (note 24) to contract liabilities (see note 1(c)(ii)).
(iii) Upon the adoption of IFRS 15, an opening adjustment as at 1 January 2018 was made to accrue interest on the advance payments received from customers (see note 1(c)(ii)).

Zall Smart Commerce Group Ltd. Annual Report 2018140
Notes to the Financial Statements(Expressed in Renminbi unless otherwise indicated)
20 CONTRACT ASSETS AND CONTRACT LIABILITIES (Continued)
(b) Contract liabilities (Continued)
Typical payment terms which impact on the amount of contract liabilities recognised are as follows:
– Property development and related services
Depending on market conditions, the Group requires the customers to pay off the full consideration within an agreed time frame while developments are still ongoing, rather than on the completion of the relevant properties. Such advance payment schemes result in contract liabilities being recognised throughout the remaining property construction period for the full amount of the contract price. In addition, the contract liability will be increased by the amount of interest expense being accrued by the Group to reflect the effect of any financing benefit obtained from the customers during the period between the payment date and the revenue recognition date. As this accrual increases the amount of the contract liability during the period of construction, it therefore increases the amount of revenue recognised when control of the completed property is transferred to the customer.
– Supply chain management and trading
The Group receives 10% to 100% of the contract value as a deposit from customers at the payment date as stipulated in the sale and purchase agreement. This deposit is recognised as a contract liability until the customer takes possession of and accepts the products.
Movements in contract liabilities
2018RMB’000
Balance at 1 January 1,047,300Decrease in contract liabilities as a result of recognising revenue during the year that was included in the contract liabilities at the beginning of the period (674,422)Increase in contract liabilities as a result of receiving forward sales deposits and instalments during the year in respect of sale of properties as at 31 December 2018 75,254Increase in contract liabilities as a result of accruing interest expense on advances 13,924Net increase in contract liabilities as a result of receiving deposits in respect of sale of commodities as at 31 December 2018 1,373,662
Balance at 31 December 1,835,718
The amount of forward sales deposits and instalments received in respect of properties expected to be recognised as income after more than one year is RMB282,454,000 (2017: RMB424,112,000, which were included under “trade and other payables”).
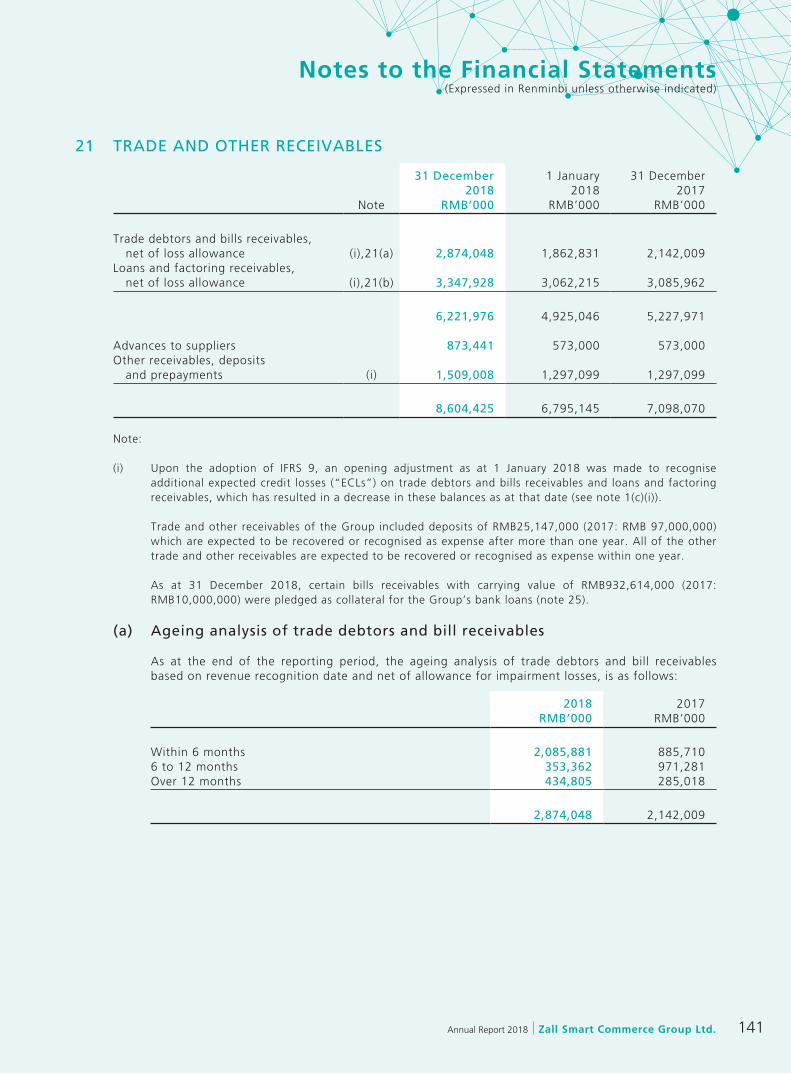
141Annual Report 2018 Zall Smart Commerce Group Ltd.
Notes to the Financial Statements(Expressed in Renminbi unless otherwise indicated)
21 TRADE AND OTHER RECEIVABLES
31 December 2018
1 January 2018
31 December 2017
Note RMB’000 RMB’000 RMB’000
Trade debtors and bills receivables, net of loss allowance (i),21(a) 2,874,048 1,862,831 2,142,009Loans and factoring receivables, net of loss allowance (i),21(b) 3,347,928 3,062,215 3,085,962
6,221,976 4,925,046 5,227,971
Advances to suppliers 873,441 573,000 573,000Other receivables, deposits and prepayments (i) 1,509,008 1,297,099 1,297,099
8,604,425 6,795,145 7,098,070
Note:
(i) Upon the adoption of IFRS 9, an opening adjustment as at 1 January 2018 was made to recognise additional expected credit losses (“ECLs”) on trade debtors and bills receivables and loans and factoring receivables, which has resulted in a decrease in these balances as at that date (see note 1(c)(i)).
Trade and other receivables of the Group included deposits of RMB25,147,000 (2017: RMB 97,000,000) which are expected to be recovered or recognised as expense after more than one year. All of the other trade and other receivables are expected to be recovered or recognised as expense within one year.
As at 31 December 2018, certain bills receivables with carrying value of RMB932,614,000 (2017: RMB10,000,000) were pledged as collateral for the Group’s bank loans (note 25).
(a) Ageing analysis of trade debtors and bill receivables
As at the end of the reporting period, the ageing analysis of trade debtors and bill receivables based on revenue recognition date and net of allowance for impairment losses, is as follows:
2018 2017RMB’000 RMB’000
Within 6 months 2,085,881 885,7106 to 12 months 353,362 971,281Over 12 months 434,805 285,018
2,874,048 2,142,009

Zall Smart Commerce Group Ltd. Annual Report 2018142
Notes to the Financial Statements(Expressed in Renminbi unless otherwise indicated)
21 TRADE AND OTHER RECEIVABLES (Continued)
(a) Ageing analysis of trade debtors and bill receivables (Continued)
Customers are normally granted credit terms of 0 to 360 days, depending on the credit worthiness of individual customers. Further details on the Group’s credit policy and credit risk arising from trade debtors and bill receivables are set out in note 30(a).
(b) Loans and factoring receivables, net of loss allowance
31 December 2018
1 January 2018
31 December 2017
RMB’000 RMB’000 RMB’000
Guaranteed loans receivable, net of loss allowance 39,424 165,326 167,585Secured loans receivable, net of loss allowance (i) 2,162,005 2,161,479 2,174,477Unsecured loans receivable, net of loss allowance 740,474 – –Factoring receivables, net of loss allowance 406,025 735,410 743,900
3,347,928 3,062,215 3,085,962
(i) Secured loans receivables represent secured loans advanced to third-party borrowers secured by the borrowers’ inventories, properties or unlisted shares.
Ageing analysis
As at the end of the reporting period, the ageing analysis of loans and factoring receivables based on recognition date of loans and factoring receivables and net of allowance for doubtful debts, is as follows:
2018 2017RMB’000 RMB’000
Within 6 months 3,026,116 2,159,0646 to 12 months 51,347 705,675Over 12 months 270,465 221,223
3,347,928 3,085,962
Borrowers are normally granted credit terms of 180 to 360 days, depending on the credit worthiness of individual customers. Further details on the Group’s credit policy and credit risk arising from loans and factoring receivables are set out in note 30(a).

143Annual Report 2018 Zall Smart Commerce Group Ltd.
Notes to the Financial Statements(Expressed in Renminbi unless otherwise indicated)
22 PLEDGED BANK DEPOSITS
2018 2017RMB’000 RMB’000
Secured for bank loans (note 25) 20,699 254,650Secured for letter of credit and bills payable (note 24) 2,997,853 2,187,042Others 47,680 112,209
3,066,232 2,553,901
23 CASH AND CASH EQUIVALENTS AND OTHER CASH FLOW INFORMATION
(a) Cash and cash equivalent comprise:
2018 2017RMB’000 RMB’000
Cash at bank and on hand 1,118,626 1,283,647
At 31 December 2018, cash and cash equivalents and pledged bank deposits with aggregate amount of RMB4,087,685,000 (2017: RMB3,720,168,000) were placed with banks in Mainland China. Remittance of funds out of mainland China is subject to the relevant rules and regulations of foreign exchange control promulgated by the PRC government.

Zall Smart Commerce Group Ltd. Annual Report 2018144
Notes to the Financial Statements(Expressed in Renminbi unless otherwise indicated)
23 CASH AND CASH EQUIVALENTS AND OTHER CASH FLOW INFORMATION (Continued)
(b) Recociliation of profit before taxation to cash used in operations
2018 2017 (Note)
Note RMB’000 RMB’000
Profit before taxation 2,348,075 2,803,621Adjustments for:
Amortisation 5(c) 60,557 28,437Depreciation 5(c)– property, plant and equipment 38,959 22,873Loss on disposal of listed equity securities 4 80,274 –Finance income 5(a) (206,000) (89,001)Finance costs 697,151 534,360Net valuation gain on investment properties 10 (3,865,192) (3,021,326)Fair value changes on financial instruments at
fair value through profit or loss 4 512,280 64,299Share of net losses/(profits) of joint ventures 16 2,343 (727)Share of net losses of associates 15 172,873 36,050Equity-settled share-based payment expenses 169,663 122,484Amortisation of deferred income (10,823) (21,598)Dividend received from financial assets at fair
value through profit or loss 4 (10,922) (10,207)Gain on disposal of subsidiaries (3,692) –Impairment loss on intangible assets 12 152,824 –Impairment loss on investment in an associate 15 26,155 –Impairment loss on goodwill 13 461,028 –Impairment loss on trade and other receivables 5(c) 265,422 20,557Others 648 (20,734)
Changes in working capital(Increase)/decrease in inventories and other
contract costs (422,409) 173,629Increase in trade and other receivables (1,960,628) (1,335,184)Increase in long-term receivables – (30,892)Increase in contract assets (5,014) –Increase/(decrease) in trade and other payables 372,050 (1,339,034)Increase in contract liabilities 730,349 –Increase in deferred income 7,111 3,186Decrease/(increase) in amounts due from related
parties 18,657 (13,015)Increase/(decrease) in amounts due to related
parties 764 (764)
Cash used in operations (367,497) (2,072,986)
Note: The Group has initially applied IFRS 15 and IFRS 9 at 1 January 2018. Under the transition methods chosen, comparative information is not restated. See note 1(c).
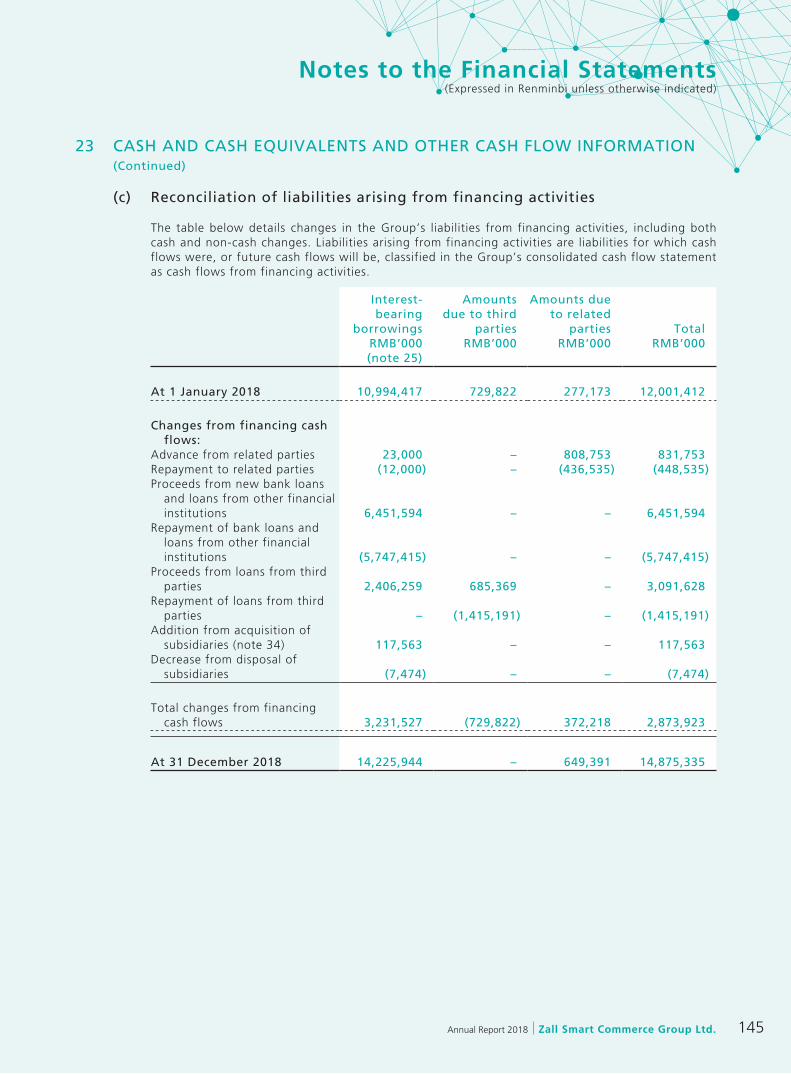
145Annual Report 2018 Zall Smart Commerce Group Ltd.
Notes to the Financial Statements(Expressed in Renminbi unless otherwise indicated)
23 CASH AND CASH EQUIVALENTS AND OTHER CASH FLOW INFORMATION (Continued)
(c) Reconciliation of liabilities arising from financing activities
The table below details changes in the Group’s liabilities from financing activities, including both cash and non-cash changes. Liabilities arising from financing activities are liabilities for which cash flows were, or future cash flows will be, classified in the Group’s consolidated cash flow statement as cash flows from financing activities.
Interest-bearing
borrowings
Amounts due to third
parties
Amounts due to related
parties TotalRMB’000 RMB’000 RMB’000 RMB’000(note 25)
At 1 January 2018 10,994,417 729,822 277,173 12,001,412
Changes from financing cash flows:
Advance from related parties 23,000 – 808,753 831,753Repayment to related parties (12,000) – (436,535) (448,535)Proceeds from new bank loans
and loans from other financial institutions 6,451,594 – – 6,451,594
Repayment of bank loans and loans from other financial institutions (5,747,415) – – (5,747,415)
Proceeds from loans from third parties 2,406,259 685,369 – 3,091,628
Repayment of loans from third parties – (1,415,191) – (1,415,191)
Addition from acquisition of subsidiaries (note 34) 117,563 – – 117,563
Decrease from disposal of subsidiaries (7,474) – – (7,474)
Total changes from financing cash flows 3,231,527 (729,822) 372,218 2,873,923
At 31 December 2018 14,225,944 – 649,391 14,875,335

Zall Smart Commerce Group Ltd. Annual Report 2018146
Notes to the Financial Statements(Expressed in Renminbi unless otherwise indicated)
23 CASH AND CASH EQUIVALENTS AND OTHER CASH FLOW INFORMATION (Continued)
(c) Reconciliation of liabilities arising from financing activities (Continued)
Interest-bearing
borrowings
Amounts due to third
parties
Amounts due to related
parties TotalRMB’000 RMB’000 RMB’000 RMB’000(note 25)
At 1 January 2017 8,393,922 1,000,000 631,881 10,025,803
Changes from financing cash flows:
Advance from related parties – – 644,227 644,227Repayment to related parties – – (1,043,133) (1,043,133)Proceeds from new bank loans
and loans from other financial institutions 6,333,369 – – 6,333,369
Repayment of bank loans and loans from other financial institutions (5,329,619) – – (5,329,619)
Proceeds from loans from third parties – 1,511,532 – 1,511,532
Repayment of loans from third parties – (1,781,710) – (1,781,710)
Addition from acquisition of subsidiaries 1,596,745 – 44,198 1,640,943
Total changes from financing cash flows 2,600,495 (270,178) (354,708) 1,975,609
At 31 December 2017 10,994,417 729,822 277,173 12,001,412
24 TRADE AND OTHER PAYABLES
31 December 2018
1 January 2018
31 December 2017
RMB’000 RMB’000 RMB’000
Trade and bills payables (i) 8,143,449 7,638,996 7,638,996Receipts in advance 294,356 248,656 1,257,188Other payables and accruals 2,433,625 3,021,541 3,021,541Other borrowings (i)(ii) 135,110 594,067 594,067
11,006,540 11,503,260 12,511,792
Note: As a result of the adoption of IFRS 15, advances received and forward sales deposits and instalments received are included in contract liabilities and disclosed in note 20(b) (see note 1(c)(ii)). Receipts in advance as at 31 December 2018 mainly represents rental receipts in advance for investment properties.
All the trade and other payables are expected to be settled within one year or repayable on demand.
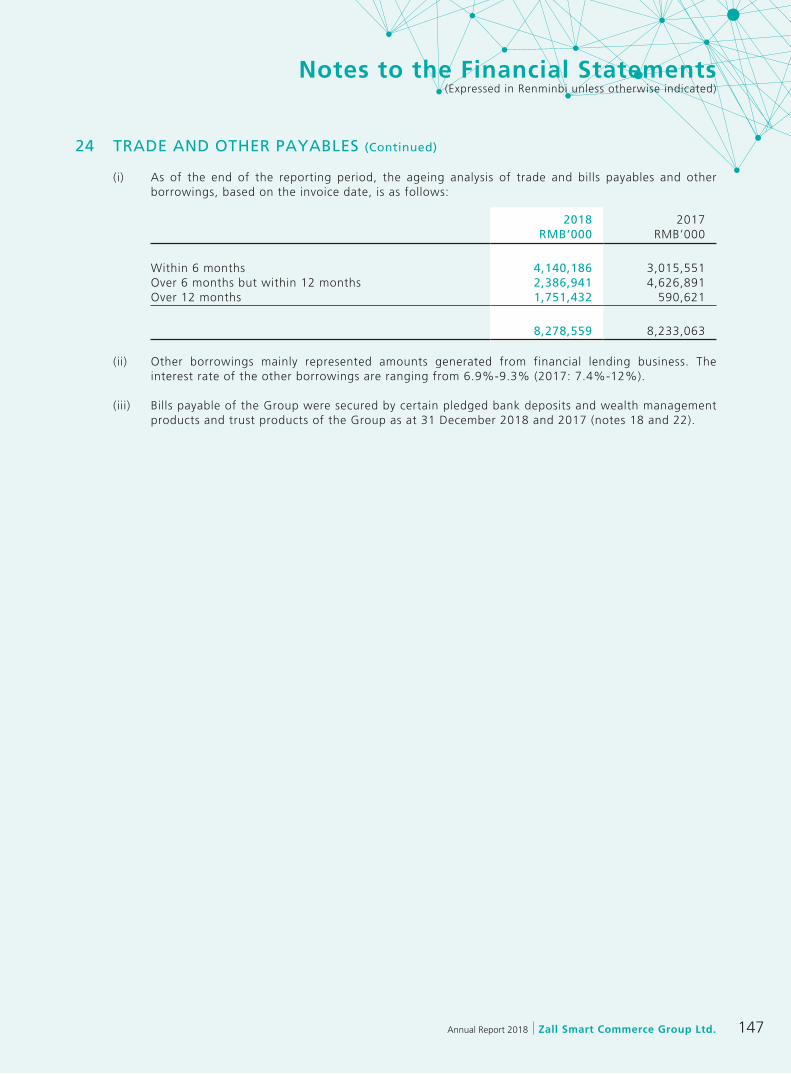
147Annual Report 2018 Zall Smart Commerce Group Ltd.
Notes to the Financial Statements(Expressed in Renminbi unless otherwise indicated)
24 TRADE AND OTHER PAYABLES (Continued)
(i) As of the end of the reporting period, the ageing analysis of trade and bills payables and other borrowings, based on the invoice date, is as follows:
2018 2017RMB’000 RMB’000
Within 6 months 4,140,186 3,015,551Over 6 months but within 12 months 2,386,941 4,626,891Over 12 months 1,751,432 590,621
8,278,559 8,233,063
(ii) Other borrowings mainly represented amounts generated from financial lending business. The interest rate of the other borrowings are ranging from 6.9%-9.3% (2017: 7.4%-12%).
(iii) Bills payable of the Group were secured by certain pledged bank deposits and wealth management products and trust products of the Group as at 31 December 2018 and 2017 (notes 18 and 22).
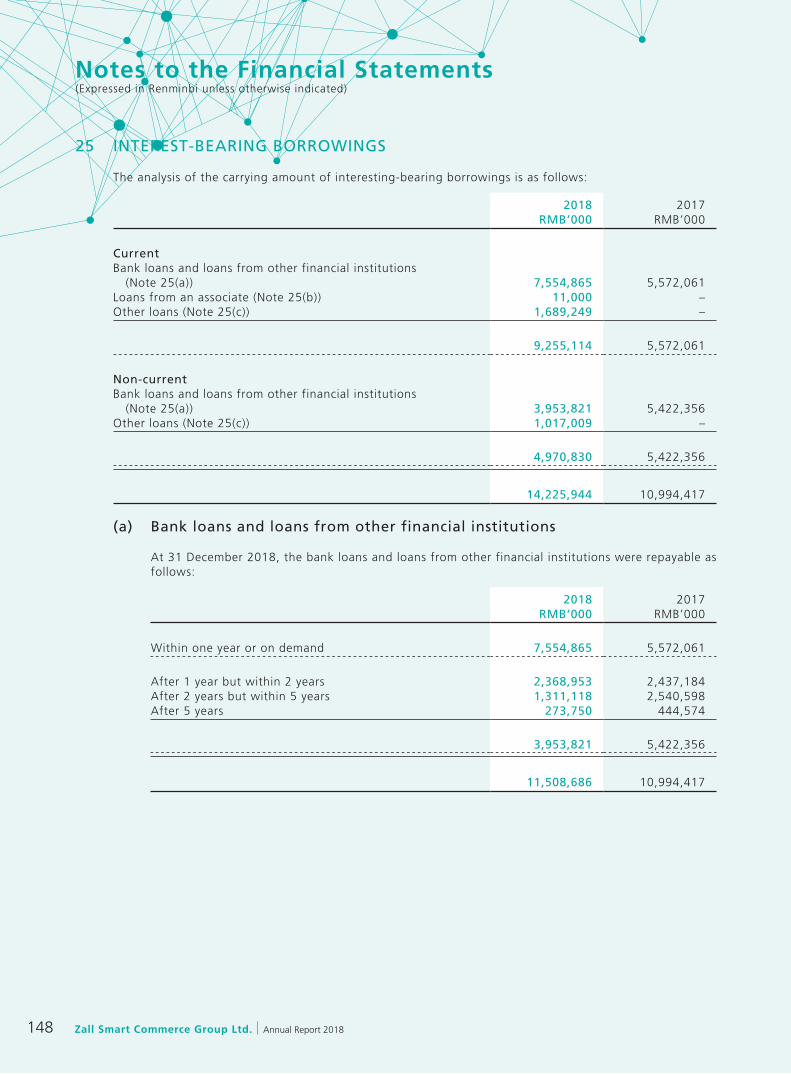
Zall Smart Commerce Group Ltd. Annual Report 2018148
Notes to the Financial Statements(Expressed in Renminbi unless otherwise indicated)
25 INTEREST-BEARING BORROWINGS
The analysis of the carrying amount of interesting-bearing borrowings is as follows:
2018 2017RMB’000 RMB’000
CurrentBank loans and loans from other financial institutions (Note 25(a)) 7,554,865 5,572,061Loans from an associate (Note 25(b)) 11,000 –Other loans (Note 25(c)) 1,689,249 –
9,255,114 5,572,061
Non-currentBank loans and loans from other financial institutions (Note 25(a)) 3,953,821 5,422,356Other loans (Note 25(c)) 1,017,009 –
4,970,830 5,422,356
14,225,944 10,994,417
(a) Bank loans and loans from other financial institutions
At 31 December 2018, the bank loans and loans from other financial institutions were repayable as follows:
2018 2017RMB’000 RMB’000
Within one year or on demand 7,554,865 5,572,061
After 1 year but within 2 years 2,368,953 2,437,184After 2 years but within 5 years 1,311,118 2,540,598After 5 years 273,750 444,574
3,953,821 5,422,356
11,508,686 10,994,417

149Annual Report 2018 Zall Smart Commerce Group Ltd.
Notes to the Financial Statements(Expressed in Renminbi unless otherwise indicated)
25 INTEREST-BEARING BORROWINGS (Continued)
(a) Bank loans and loans from other financial institutions (Continued)
(i) As at 31 December 2018, the bank loans and loans from other financial institutions were secured as follows:
2018 2017RMB’000 RMB’000
Secured 11,351,686 10,634,426Unsecured 157,000 359,991
11,508,686 10,994,417
(ii) Assets of the Group pledged to secure the bank loans and loans from other financial institutions comprise:
2018 2017RMB’000 RMB’000
Pledged bank deposits (note 22) 20,699 254,650Bill receivables (note 21) 932,614 10,000Other receivables 8,000 –Investment properties (note 10) 16,246,645 11,643,869Investment properties under development (note 10) 2,744,780 2,243,626Properties under development (note 19) 1,204,985 1,704,082Completed properties held for sale (note 19) 1,426,811 1,517,956Property, plant and equipment (note 11) 248,394 15,960
22,832,928 17,390,143
(iii) Bank loans and loans from other financial institutions bear interest ranging from 4.35% to 13.00% per annum for the year ended 31 December 2018 (2017: 2.50% to 13.00% per annum).
(iv) Certain banking facilities and borrowings of the Group are subject to the fulfilment of covenants relating to: (1) certain of the Group’s subsidiaries’ statement of financial position ratio; (2) restriction of profit distribution by certain of its subsidiaries; (3) early repayment of principal to be triggered when 70% of the gross sellable area for the underlying property project are sold; or (4) restriction of providing financial guarantees. These requirements are commonly found in lending arrangements with banks and financial institutions. If the Group was to breach such covenants, the drawn down facilities would become repayable on demand. The Group regularly monitors its compliance with these covenants and communicates with its lenders. Further details of the Group’s management of liquidity risk are set out in note 30(b).
At 31 December 2018, bank loans of the Group of RMB5,632,854,000 (2017: RMB2,767,372,000) were not in compliance with the imposed covenants. The Group has obtained notices from the corresponding banks, which confirmed that the respective subsidiaries of the Group would not be regarded as having breached the covenants and the banks would not demand early repayment from the respective subsidiaries of the Group.
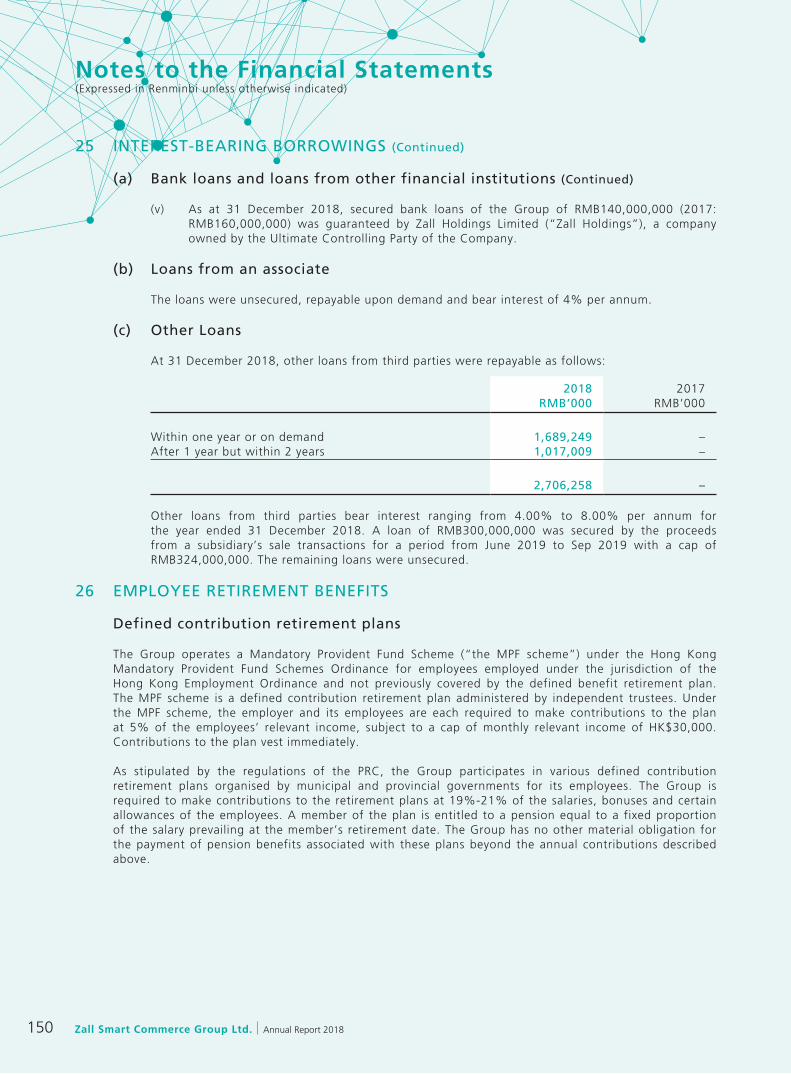
Zall Smart Commerce Group Ltd. Annual Report 2018150
Notes to the Financial Statements(Expressed in Renminbi unless otherwise indicated)
25 INTEREST-BEARING BORROWINGS (Continued)
(a) Bank loans and loans from other financial institutions (Continued)
(v) As at 31 December 2018, secured bank loans of the Group of RMB140,000,000 (2017: RMB160,000,000) was guaranteed by Zall Holdings Limited (“Zall Holdings”), a company owned by the Ultimate Controlling Party of the Company.
(b) Loans from an associate
The loans were unsecured, repayable upon demand and bear interest of 4% per annum.
(c) Other Loans
At 31 December 2018, other loans from third parties were repayable as follows:
2018 2017RMB’000 RMB’000
Within one year or on demand 1,689,249 –After 1 year but within 2 years 1,017,009 –
2,706,258 –
Other loans from third parties bear interest ranging from 4.00% to 8.00% per annum for the year ended 31 December 2018. A loan of RMB300,000,000 was secured by the proceeds from a subsidiary’s sale transactions for a period from June 2019 to Sep 2019 with a cap of RMB324,000,000. The remaining loans were unsecured.
26 EMPLOYEE RETIREMENT BENEFITS
Defined contribution retirement plans
The Group operates a Mandatory Provident Fund Scheme (“the MPF scheme”) under the Hong Kong Mandatory Provident Fund Schemes Ordinance for employees employed under the jurisdiction of the Hong Kong Employment Ordinance and not previously covered by the defined benefit retirement plan. The MPF scheme is a defined contribution retirement plan administered by independent trustees. Under the MPF scheme, the employer and its employees are each required to make contributions to the plan at 5% of the employees’ relevant income, subject to a cap of monthly relevant income of HK$30,000. Contributions to the plan vest immediately.
As stipulated by the regulations of the PRC, the Group participates in various defined contribution retirement plans organised by municipal and provincial governments for its employees. The Group is required to make contributions to the retirement plans at 19%-21% of the salaries, bonuses and certain allowances of the employees. A member of the plan is entitled to a pension equal to a fixed proportion of the salary prevailing at the member’s retirement date. The Group has no other material obligation for the payment of pension benefits associated with these plans beyond the annual contributions described above.
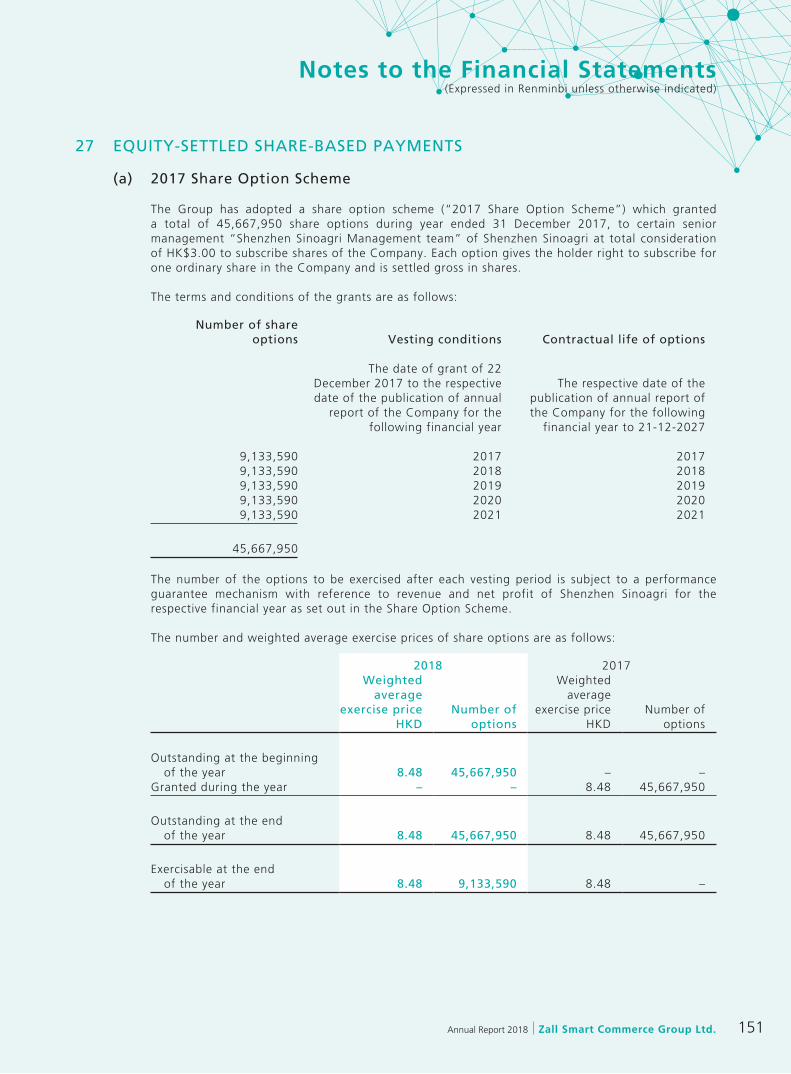
151Annual Report 2018 Zall Smart Commerce Group Ltd.
Notes to the Financial Statements(Expressed in Renminbi unless otherwise indicated)
27 EQUITY-SETTLED SHARE-BASED PAYMENTS
(a) 2017 Share Option Scheme
The Group has adopted a share option scheme (“2017 Share Option Scheme”) which granted a total of 45,667,950 share options during year ended 31 December 2017, to certain senior management “Shenzhen Sinoagri Management team” of Shenzhen Sinoagri at total consideration of HK$3.00 to subscribe shares of the Company. Each option gives the holder right to subscribe for one ordinary share in the Company and is settled gross in shares.
The terms and conditions of the grants are as follows:
Number of share options Vesting conditions Contractual life of options
The date of grant of 22 December 2017 to the respective date of the publication of annual
report of the Company for the following financial year
The respective date of the publication of annual report of the Company for the following
financial year to 21-12-2027
9,133,590 2017 20179,133,590 2018 20189,133,590 2019 20199,133,590 2020 20209,133,590 2021 2021
45,667,950
The number of the options to be exercised after each vesting period is subject to a performance guarantee mechanism with reference to revenue and net profit of Shenzhen Sinoagri for the respective financial year as set out in the Share Option Scheme.
The number and weighted average exercise prices of share options are as follows:
2018 2017Weighted
average exercise price
HKDNumber of
options
Weighted average
exercise price HKD
Number of options
Outstanding at the beginning of the year 8.48 45,667,950 – –
Granted during the year – – 8.48 45,667,950
Outstanding at the end of the year 8.48 45,667,950 8.48 45,667,950
Exercisable at the end of the year 8.48 9,133,590 8.48 –
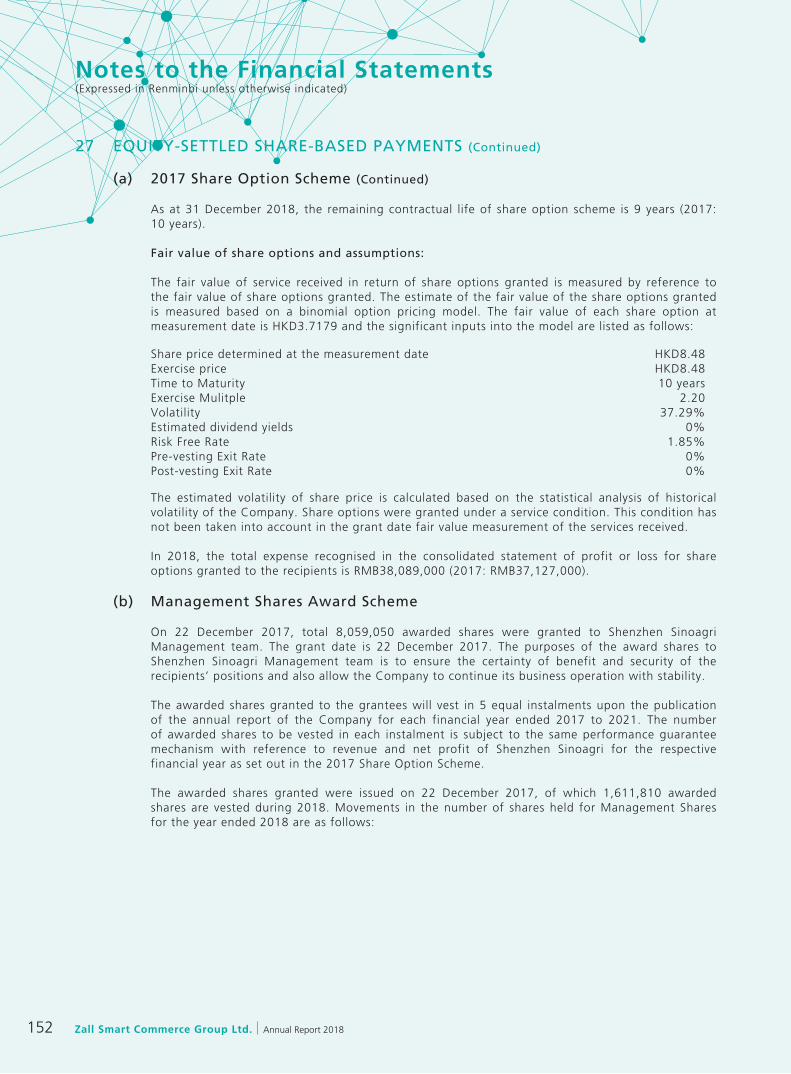
Zall Smart Commerce Group Ltd. Annual Report 2018152
Notes to the Financial Statements(Expressed in Renminbi unless otherwise indicated)
27 EQUITY-SETTLED SHARE-BASED PAYMENTS (Continued)
(a) 2017 Share Option Scheme (Continued)
As at 31 December 2018, the remaining contractual life of share option scheme is 9 years (2017: 10 years).
Fair value of share options and assumptions:
The fair value of service received in return of share options granted is measured by reference to the fair value of share options granted. The estimate of the fair value of the share options granted is measured based on a binomial option pricing model. The fair value of each share option at measurement date is HKD3.7179 and the significant inputs into the model are listed as follows:
Share price determined at the measurement date HKD8.48Exercise price HKD8.48Time to Maturity 10 yearsExercise Mulitple 2.20Volatility 37.29%Estimated dividend yields 0%Risk Free Rate 1.85%Pre-vesting Exit Rate 0%Post-vesting Exit Rate 0%
The estimated volatility of share price is calculated based on the statistical analysis of historical volatility of the Company. Share options were granted under a service condition. This condition has not been taken into account in the grant date fair value measurement of the services received.
In 2018, the total expense recognised in the consolidated statement of profit or loss for share options granted to the recipients is RMB38,089,000 (2017: RMB37,127,000).
(b) Management Shares Award Scheme
On 22 December 2017, total 8,059,050 awarded shares were granted to Shenzhen Sinoagri Management team. The grant date is 22 December 2017. The purposes of the award shares to Shenzhen Sinoagri Management team is to ensure the certainty of benefit and security of the recipients’ positions and also allow the Company to continue its business operation with stability.
The awarded shares granted to the grantees will vest in 5 equal instalments upon the publication of the annual report of the Company for each financial year ended 2017 to 2021. The number of awarded shares to be vested in each instalment is subject to the same performance guarantee mechanism with reference to revenue and net profit of Shenzhen Sinoagri for the respective financial year as set out in the 2017 Share Option Scheme.
The awarded shares granted were issued on 22 December 2017, of which 1,611,810 awarded shares are vested during 2018. Movements in the number of shares held for Management Shares for the year ended 2018 are as follows:
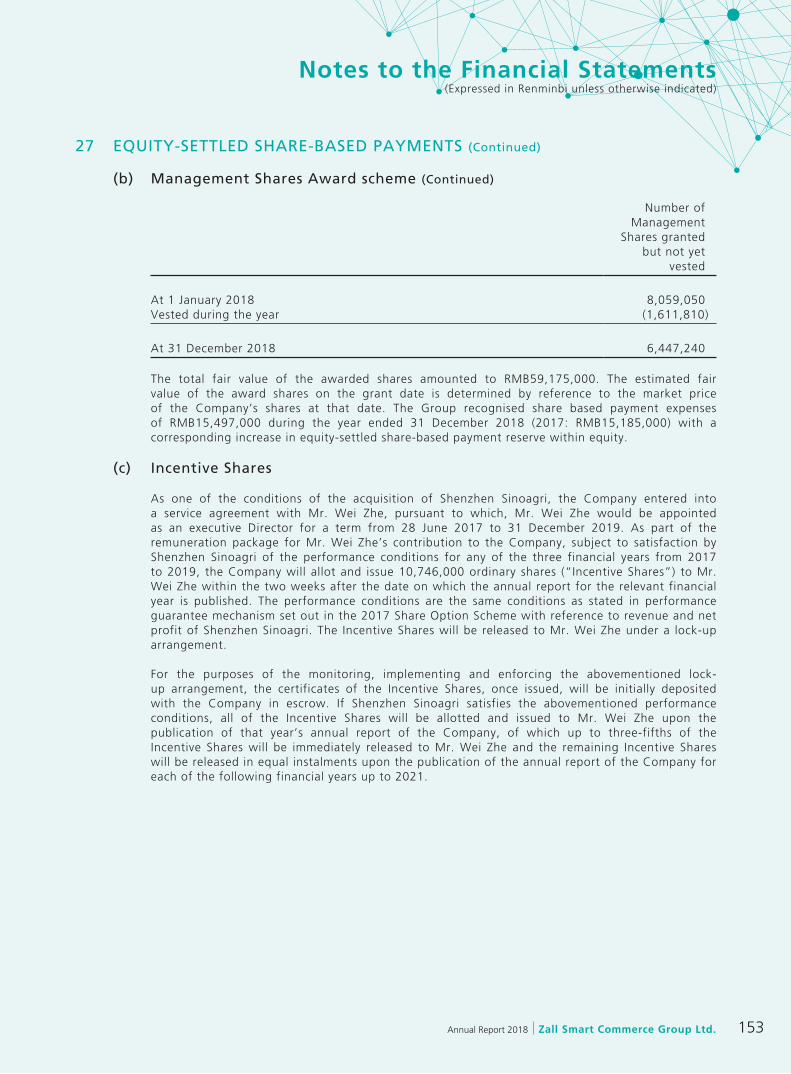
153Annual Report 2018 Zall Smart Commerce Group Ltd.
Notes to the Financial Statements(Expressed in Renminbi unless otherwise indicated)
27 EQUITY-SETTLED SHARE-BASED PAYMENTS (Continued)
(b) Management Shares Award scheme (Continued)
Number of Management
Shares granted but not yet
vested
At 1 January 2018 8,059,050Vested during the year (1,611,810)
At 31 December 2018 6,447,240
The total fair value of the awarded shares amounted to RMB59,175,000. The estimated fair value of the award shares on the grant date is determined by reference to the market price of the Company’s shares at that date. The Group recognised share based payment expenses of RMB15,497,000 during the year ended 31 December 2018 (2017: RMB15,185,000) with a corresponding increase in equity-settled share-based payment reserve within equity.
(c) Incentive Shares
As one of the conditions of the acquisition of Shenzhen Sinoagri, the Company entered into a service agreement with Mr. Wei Zhe, pursuant to which, Mr. Wei Zhe would be appointed as an executive Director for a term from 28 June 2017 to 31 December 2019. As part of the remuneration package for Mr. Wei Zhe’s contribution to the Company, subject to satisfaction by Shenzhen Sinoagri of the performance conditions for any of the three financial years from 2017 to 2019, the Company will allot and issue 10,746,000 ordinary shares (“Incentive Shares”) to Mr. Wei Zhe within the two weeks after the date on which the annual report for the relevant financial year is published. The performance conditions are the same conditions as stated in performance guarantee mechanism set out in the 2017 Share Option Scheme with reference to revenue and net profit of Shenzhen Sinoagri. The Incentive Shares will be released to Mr. Wei Zhe under a lock-up arrangement.
For the purposes of the monitoring, implementing and enforcing the abovementioned lock-up arrangement, the certificates of the Incentive Shares, once issued, will be initially deposited with the Company in escrow. If Shenzhen Sinoagri satisfies the abovementioned performance conditions, all of the Incentive Shares will be allotted and issued to Mr. Wei Zhe upon the publication of that year’s annual report of the Company, of which up to three-fifths of the Incentive Shares will be immediately released to Mr. Wei Zhe and the remaining Incentive Shares will be released in equal instalments upon the publication of the annual report of the Company for each of the following financial years up to 2021.

Zall Smart Commerce Group Ltd. Annual Report 2018154
Notes to the Financial Statements(Expressed in Renminbi unless otherwise indicated)
27 EQUITY-SETTLED SHARE-BASED PAYMENTS (Continued)
(c) Incentive Shares (Continued)
As at 31 December 2018, the Incentive shares granted are issued and 2,149,200 shares are vested to Mr Wei Zhe. Movements in the number of shares granted for the Incentive Shares for the year ended 31 December 2018 are as follows:
Number of shares granted but not
yet vested
At 1 January 2018 10,746,000Vested during the year (2,149,200)
At 31 December 2018 8,596,800
The estimated fair value of the Incentive Shares on the grant date is determined based on the market price of the Company’s shares at that date and discount for lack of marketability, which is determined based on Asian put option pricing model. The fair value of the Incentive Shares on the grant date was RMB43,095,000 and the significant inputs into the model are listed as follows:
Share price determined at the measurement date HKD4.92Expiry date 30 April 2018, 2019, 2020,
2021 and 2022Volatility 28.266% to 46.642%Risk Free Rate 0.179% to 0.737%
The Group recognised share based payment expenses of RMB18,360,000 during the year ended 31 December 2018 (2017: RMB12,947,000) with a corresponding increase in equity-settled share-based payment reserve within equity.
(d) VKC Consultancy Service Consideration Shares
As one of the conditions of the acquisition of Shenzhen Sinoagri, the Company entered into a consultancy agreement with Vision Knight Capital Management Company Limited (“VKC”, a company incorporated in Cayman Islands with limited liability and a company controlled by Mr. Wei Zhe), pursuant to which VKC as the consultant will provide E-commerce development related services in PRC to the Company for a term of three years from 28 June 2017 at a consultancy fee which will be satisfied by the allotment and issue of 42,981,000 ordinary shares (“VKC Consultancy Service Consideration Shares”) of the Company to VKC. The vesting of VKC Consultancy Service Consideration Shares is subject to the same vesting conditions of the Incentive Shares.
As at 31 December 2018, the Consultancy Service Consideration Shares are issued and 8,596,200 shares are vested to VKC. Movements in the number of shares granted for VKC Consultancy Service Consideration Shares for the year ended 31 December 2018 are as follows:
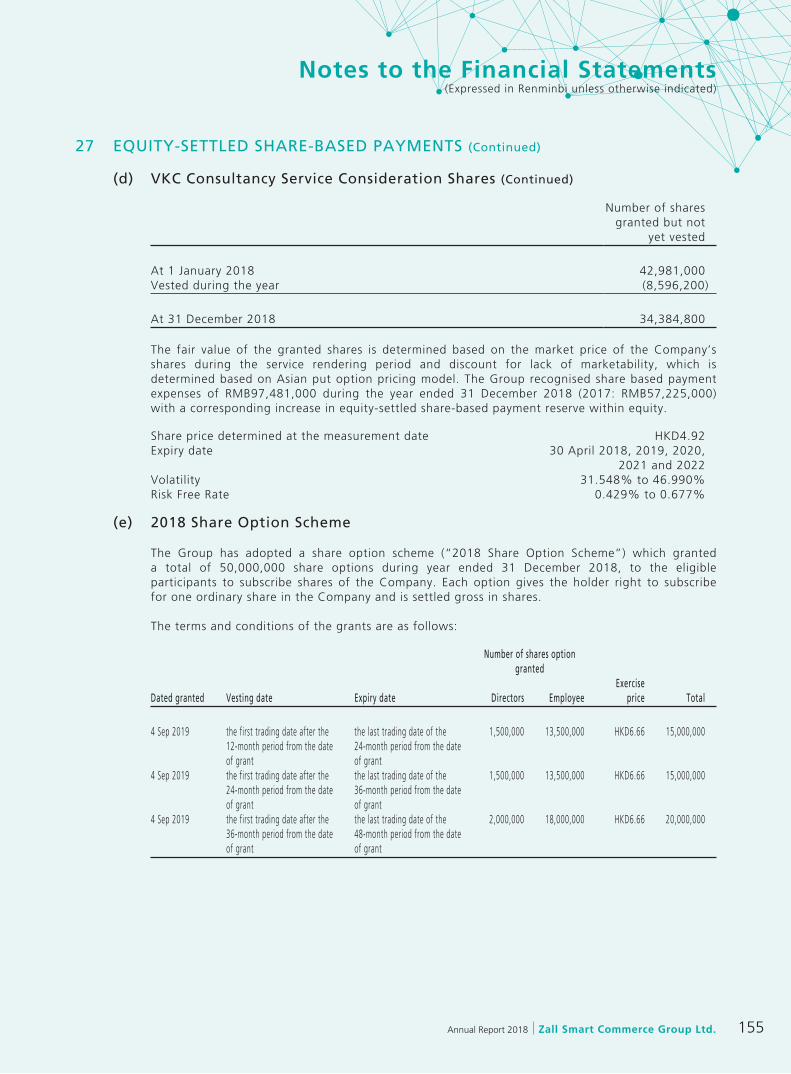
155Annual Report 2018 Zall Smart Commerce Group Ltd.
Notes to the Financial Statements(Expressed in Renminbi unless otherwise indicated)
27 EQUITY-SETTLED SHARE-BASED PAYMENTS (Continued)
(d) VKC Consultancy Service Consideration Shares (Continued)
Number of shares granted but not
yet vested
At 1 January 2018 42,981,000Vested during the year (8,596,200)
At 31 December 2018 34,384,800
The fair value of the granted shares is determined based on the market price of the Company’s shares during the service rendering period and discount for lack of marketability, which is determined based on Asian put option pricing model. The Group recognised share based payment expenses of RMB97,481,000 during the year ended 31 December 2018 (2017: RMB57,225,000) with a corresponding increase in equity-settled share-based payment reserve within equity.
Share price determined at the measurement date HKD4.92Expiry date 30 April 2018, 2019, 2020,
2021 and 2022Volatility 31.548% to 46.990%Risk Free Rate 0.429% to 0.677%
(e) 2018 Share Option Scheme
The Group has adopted a share option scheme (“2018 Share Option Scheme”) which granted a total of 50,000,000 share options during year ended 31 December 2018, to the eligible participants to subscribe shares of the Company. Each option gives the holder right to subscribe for one ordinary share in the Company and is settled gross in shares.
The terms and conditions of the grants are as follows:
Number of shares option granted
Dated granted Vesting date Expiry date Directors EmployeeExercise
price Total
4 Sep 2019 the first trading date after the 12-month period from the date of grant
the last trading date of the 24-month period from the date of grant
1,500,000 13,500,000 HKD6.66 15,000,000
4 Sep 2019 the first trading date after the 24-month period from the date of grant
the last trading date of the 36-month period from the date of grant
1,500,000 13,500,000 HKD6.66 15,000,000
4 Sep 2019 the first trading date after the 36-month period from the date of grant
the last trading date of the 48-month period from the date of grant
2,000,000 18,000,000 HKD6.66 20,000,000
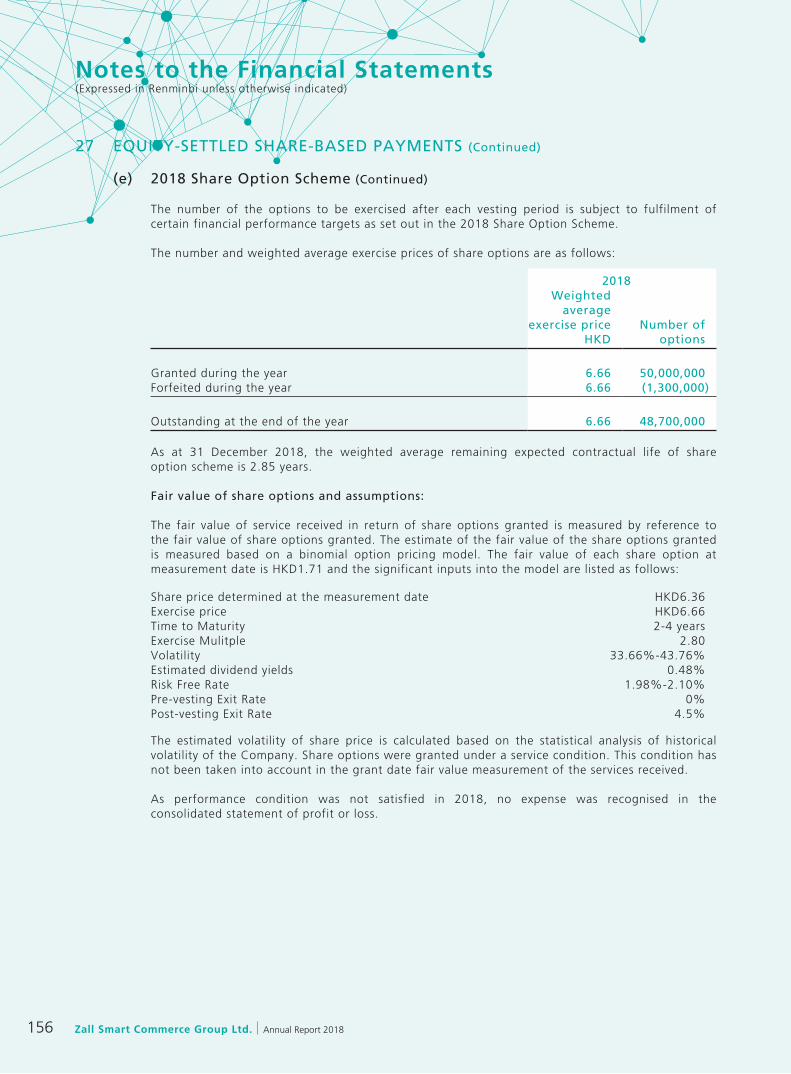
Zall Smart Commerce Group Ltd. Annual Report 2018156
Notes to the Financial Statements(Expressed in Renminbi unless otherwise indicated)
27 EQUITY-SETTLED SHARE-BASED PAYMENTS (Continued)
(e) 2018 Share Option Scheme (Continued)
The number of the options to be exercised after each vesting period is subject to fulfilment of certain financial performance targets as set out in the 2018 Share Option Scheme.
The number and weighted average exercise prices of share options are as follows:
2018Weighted
average exercise price
HKDNumber of
options
Granted during the year 6.66 50,000,000Forfeited during the year 6.66 (1,300,000)
Outstanding at the end of the year 6.66 48,700,000
As at 31 December 2018, the weighted average remaining expected contractual life of share option scheme is 2.85 years.
Fair value of share options and assumptions:
The fair value of service received in return of share options granted is measured by reference to the fair value of share options granted. The estimate of the fair value of the share options granted is measured based on a binomial option pricing model. The fair value of each share option at measurement date is HKD1.71 and the significant inputs into the model are listed as follows:
Share price determined at the measurement date HKD6.36Exercise price HKD6.66Time to Maturity 2-4 yearsExercise Mulitple 2.80Volatility 33.66%-43.76%Estimated dividend yields 0.48%Risk Free Rate 1.98%-2.10%Pre-vesting Exit Rate 0%Post-vesting Exit Rate 4.5%
The estimated volatility of share price is calculated based on the statistical analysis of historical volatility of the Company. Share options were granted under a service condition. This condition has not been taken into account in the grant date fair value measurement of the services received.
As performance condition was not satisfied in 2018, no expense was recognised in the consolidated statement of profit or loss.
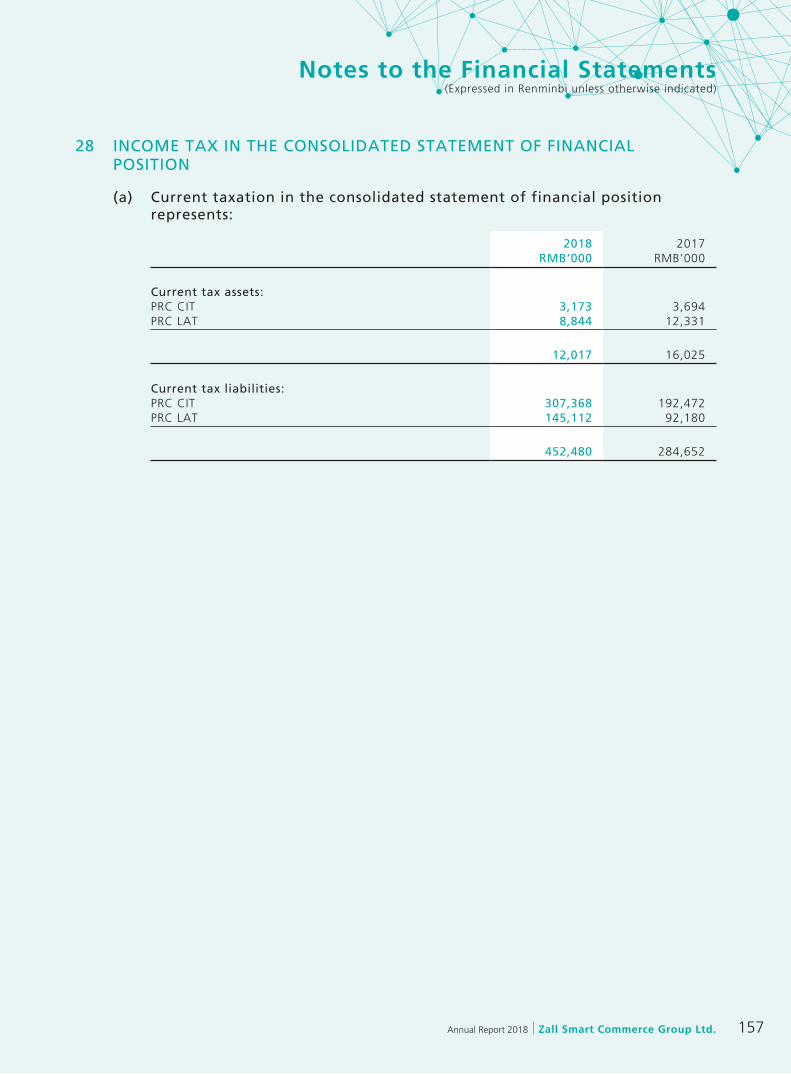
157Annual Report 2018 Zall Smart Commerce Group Ltd.
Notes to the Financial Statements(Expressed in Renminbi unless otherwise indicated)
28 INCOME TAx IN THE CONSOLIDATED STATEMENT OF FINANCIAL POSITION
(a) Current taxation in the consolidated statement of financial position represents:
2018 2017RMB’000 RMB’000
Current tax assets:PRC CIT 3,173 3,694PRC LAT 8,844 12,331
12,017 16,025
Current tax liabilities:PRC CIT 307,368 192,472PRC LAT 145,112 92,180
452,480 284,652

Zall Smart Commerce Group Ltd. Annual Report 2018158
Notes to the Financial Statements(Expressed in Renminbi unless otherwise indicated)
28 INCOME TAx IN THE CONSOLIDATED STATEMENT OF FINANCIAL POSITION (Continued)
(b) Deferred tax assets and liabilities recognised:
(i) Movement of each component of deferred tax assets and liabilities
The components of deferred tax assets/(liabilities) recognised in the consolidated statement of financial position and the movements during the year are as follows:
Provision for PRC LAT
Fair value adjustments
for invest-ment
properties Tax loss
Fair value adjustment
of intangible assets
through business
combination
Accrual of interest expense (Note 1)
Credit loss allowance
(Note 2) Others TotalRMB’000 RMB’000 RMB’000 RMB’000 RMB’000 RMB’000 RMB’000 RMB’000
Deferred tax arising from:At 1 January 2017 11,238 (2,915,257) 16,742 – – – (256,085) (3,143,362)Credited/(charged) to profit or
loss 8,166 (361,820) (17,733) 4,115 – 3,813 8,307 (355,152)Acquisition of subsidiaries – – 14,989 (224,933) – 7,676 (38,930) (241,198)Transfer from liabilities directly
associated with non-current assets classified as held for sale – (38,038) – – – – – (38,038)
At 31 December 2017 19,404 (3,315,115) 13,998 (220,818) – 11,489 (286,708) (3,777,750)
Impact on initial application of IFRS 15 – – – – 4,977 – – 4,977
Impact on initial application of IFRS 9 – – – – – 75,167 318 75,485
At 1 January 2018 19,404 (3,315,115) 13,998 (220,818) 4,977 86,655 (286,390) (3,697,288)
Credited/(charged) to profit or loss 14,259 (1,202,100) 8,302 52,842 1,898 25,354 231,238 (868,207)
Credited to other comprehensive income – – – – – – 632 632
Acquisition of subsidiaries (note 34) – – – (9,198) – – – (9,198)
Disposal of subsidiaries – – – – – – 99 99
At 31 December 2018 33,663 (4,517,215) 22,300 (177,174) 6,875 112,009 (54,421) (4,573,962)
Note 1: Upon the initial application of IFRS 15, the Group has recognised deferred tax assets arising from the accrual of interest expense arising from contracts contains a significant financing component (see note 1(c)(ii)).
Note 2: Upon the initial application of IFRS 9, the Group has recognised deferred tax assets on the additional credit losses recognised under the ECL model (see note 1(c)(i)).

159Annual Report 2018 Zall Smart Commerce Group Ltd.
Notes to the Financial Statements(Expressed in Renminbi unless otherwise indicated)
28 INCOME TAx IN THE CONSOLIDATED STATEMENT OF FINANCIAL POSITION (Continued)
(b) Deferred tax assets and liabilities recognised: (Continued)
(ii) Reconciliation to the consolidated statement of financial position
2018 2017RMB’000 RMB’000
Net deferred tax assets recognised in the consolidated statement of financial position 211,047 67,997Net deferred tax liabilities recognised in the consolidated statement of financial position (4,785,009) (3,845,747)
(4,573,962) (3,777,750)
(c) Deferred tax assets not recognised
In accordance with the accounting policy set out in note 1(w), the Group has not recognised deferred tax assets in respect of unused tax losses of RMB776,339,000 as at 31 December 2018. The directors consider it is not probable that future taxable profits against which the losses can be utilised will be available from these subsidiaries. Cumulative tax losses of RMB698,073,000 will expire within 5 years under current tax legislation.
(d) Deferred tax liabilities not recognised
As at 31 December 2018, temporary differences relating to the undistributed profits of certain subsidiaries of the Group in the PRC amounted to RMB16,882,718,000. Deferred tax liabilities of RMB1,688,272,000 have not been recognised in respect of the tax that would be payable on the distribution of the retained profits as the Company controls the dividend policy of these subsidiaries and it has been determined that it is probable that these profits will not be distributed in the foreseeable future.
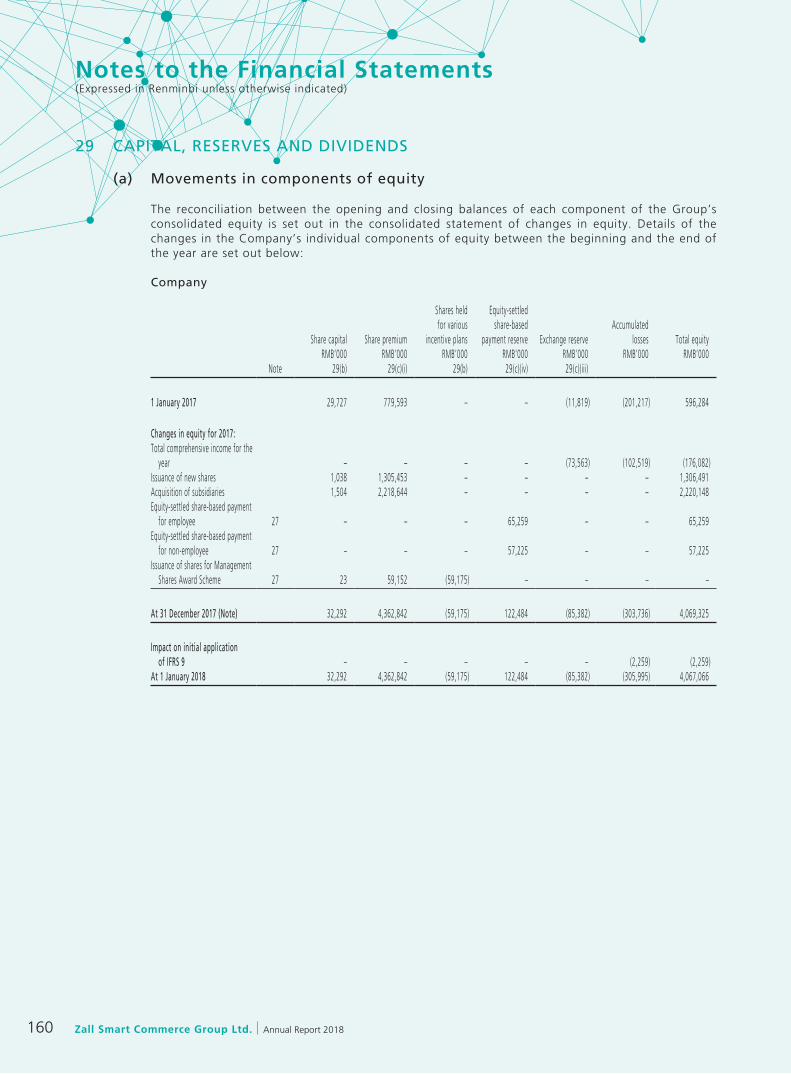
Zall Smart Commerce Group Ltd. Annual Report 2018160
Notes to the Financial Statements(Expressed in Renminbi unless otherwise indicated)
29 CAPITAL, RESERVES AND DIVIDENDS
(a) Movements in components of equity
The reconciliation between the opening and closing balances of each component of the Group’s consolidated equity is set out in the consolidated statement of changes in equity. Details of the changes in the Company’s individual components of equity between the beginning and the end of the year are set out below:
Company
Share capital Share premium
Shares held for various
incentive plans
Equity-settled share-based
payment reserve Exchange reserveAccumulated
losses Total equityRMB’000 RMB’000 RMB’000 RMB’000 RMB’000 RMB’000 RMB’000
Note 29(b) 29(c)(i) 29(b) 29(c)(iv) 29(c)(iii)
1 January 2017 29,727 779,593 – – (11,819) (201,217) 596,284
Changes in equity for 2017:Total comprehensive income for the
year – – – – (73,563) (102,519) (176,082)Issuance of new shares 1,038 1,305,453 – – – – 1,306,491Acquisition of subsidiaries 1,504 2,218,644 – – – – 2,220,148Equity-settled share-based payment
for employee 27 – – – 65,259 – – 65,259Equity-settled share-based payment
for non-employee 27 – – – 57,225 – – 57,225Issuance of shares for Management
Shares Award Scheme 27 23 59,152 (59,175) – – – –
At 31 December 2017 (Note) 32,292 4,362,842 (59,175) 122,484 (85,382) (303,736) 4,069,325
Impact on initial application of IFRS 9 – – – – – (2,259) (2,259)
At 1 January 2018 32,292 4,362,842 (59,175) 122,484 (85,382) (305,995) 4,067,066

161Annual Report 2018 Zall Smart Commerce Group Ltd.
Notes to the Financial Statements(Expressed in Renminbi unless otherwise indicated)
29 CAPITAL, RESERVES AND DIVIDENDS (Continued)
(a) Movements in components of equity (Continued)
Share capital Share premium
Shares held for various
incentive plans
Equity-settled share-based
payment reserve Exchange reserveAccumulated
losses Total equityRMB’000 RMB’000 RMB’000 RMB’000 RMB’000 RMB’000 RMB’000
Note 29(b) 29(c)(i) 29(b) 29(c)(iv) 29(c)(iii)
1 January 2018 32,292 4,362,842 (59,175) 122,484 (85,382) (305,995) 4,067,066
Changes in equity for 2018:Total comprehensive income for the
year – – – – 53,856 (128,811) (74,955)Issue of shares for Incentive Shares 29(b)(i) 23 69,850 (69,873) – – – –Issue of shares for VKC
Consultancy Service Consideration Shares 29(b)(ii) 93 279,381 (279,474) – – – –
Equity-settled share-based payment for employee 27/29(b)(i) 6 9,055 11,835 51,049 – – 71,945
Equity-settled share-based payment for non-employee 27/29(b)(ii) 23 49,827 – 47,631 – – 97,481
Dividend approved in respect of the previous year 29(e) – (246,653) – – – – (246,653)
At 31 December 2018 32,437 4,524,302 (396,687) 221,164 (31,526) (434,806) 3,914,884
Note: The Group, including the Company, has initially applied IFRS 15 and IFRS 9 at 1 January 2018. Under the transition methods chosen, comparative information is not restated. See note 1(c).

Zall Smart Commerce Group Ltd. Annual Report 2018162
Notes to the Financial Statements(Expressed in Renminbi unless otherwise indicated)
29 CAPITAL, RESERVES AND DIVIDENDS (Continued)
(b) Share capital
2018 2017Number of
shares AmountNumber of
shares AmountNote (’000) HKD’000 (’000) HKD’000
Authorised:
Ordinary shares of HKD0.00333 each 24,000,000 80,000 24,000,000 80,000
Ordinary shares, issued and fully paid:
At 1 January 11,628,005 38,759 10,745,578 35,818Placing of new shares – – 357,141 1,190Issuance of new shares
as consideration of acquisition of subsidiaries – – 517,227 1,724
Issue of Incentive Shares (i) 10,746 36 – –Issue of VKC
Consultancy Service Consideration Shares (ii) 42,981 143 – –
Issuance of Management Shares – – 8,059 27
At 31 December 11,681,732 38,938 11,628,005 38,759
The holders of ordinary shares are entitled to receive dividends as declared from time to time and are entitled to one vote per share at meetings of the Company. All ordinary shares rank equally with regard to the Company’s residual assets.
(i) On 8 May 2018, 10,746,000 ordinary shares were issued for the Incentive Shares as set out in note 27(c). According to the Incentive Shares scheme, 2,149,200 shares issued are vested directly as performance conditions were satisfied. According to the accounting policy as set out in note 1(v), RMB6,000 (equivalent to HKD7,000) was credited to share capital and RMB9,109,000 has been transferred from equity-settled share-based payment reserve to share premium account.
The remaining 8,596,800 shares are issued but have not vested yet. The fair value of the unvested shares issued was RMB69,873,000, of which RMB23,000 (equal to HKD29,000) was credited to share capital and the excess of the fair value over the nominal value of the total number of ordinary shares issued of RMB69,850,000 were credited to the share premium account of the Company.
(ii) On 8 May 2018, 42,981,000 ordinary shares were issued for VKC Consultancy Service Consideration Shares as set out in note 27(d). According to the VKC Consultancy Service Consideration Shares scheme, 8,596,200 shares issued are vested directly as performance conditions satisfied. According to the accounting policy as set out in note 1(v), RMB23,000 (equally to HKD29,000) was credited to share capital and RMB49,827,000 has been transferred from equity-settled share-based payment reserve to share premium.

163Annual Report 2018 Zall Smart Commerce Group Ltd.
Notes to the Financial Statements(Expressed in Renminbi unless otherwise indicated)
29 CAPITAL, RESERVES AND DIVIDENDS (Continued)
(b) Share capital (Continued)
The remaining 34,384,800 shares are issued but have not vested yet. The fair value of the unvested shares issued was RMB279,474,000, of which RMB93,000 (equal to HKD114,000) was credited to share capital and the excess of the fair value over the nominal value of the total number of ordinary shares issued of RMB279,381,000 were credited to the share premium account of the Company.
(c) Reserves
(i) Share premium
Under the Companies Law of the Cayman Islands, the share premium account of the Company may be applied for payment of distributions or dividends to shareholders provided that immediately following the date on which the distribution or dividend is proposed to be paid, the Company is able to pay its debts as they fall due in the ordinary course of business.
(ii) PRC statutory reserve
Pursuant to the Articles of Association of the Group’s PRC subsidiaries and relevant statutory regulations, appropriations to the statutory reserve fund were made at 10% of profit after tax determined in accordance with accounting rules and regulations of the PRC until the reserve balance reaches 50% of the registered capital. This reserve fund can be utilised in setting off accumulated losses or increasing capital of the PRC subsidiaries provided that the balance after such conversion is not less than 25% of their registered capital, and is non-distributable other than in liquidation.
(iii) Exchange reserve
The exchange reserve comprises all relevant exchange differences arising from the translation of the financial statements of operations with functional currency other than Renminbi. The reserve is dealt with in accordance with the accounting policy set out in note 1(z).
(iv) Equity-settled share-based payment reserve
Share-based payment reserve comprises the following:
• The fair value of services provided by parties other than employees to the Group inconnection with the listing of the Company and the services were settled by equity instrument of the Company. The relevant services are recognised in accordance with IFRS 2, Share-based payment;
• The portion of the grant date fair value of unexercised share options granted toemployees of the Group that has been recognised in accordance with the accounting policy adopted for the share-based payments in note 1(v); and
• The portion of the grant date fair value of unreleased Incentive Shares andManagement Shares granted to employees of the Group that has been recognised in accordance with the accounting policy adopted for the share-based payments in note 1(v).

Zall Smart Commerce Group Ltd. Annual Report 2018164
Notes to the Financial Statements(Expressed in Renminbi unless otherwise indicated)
29 CAPITAL, RESERVES AND DIVIDENDS (Continued)
(c) Reserves (Continued)
(v) Other reserves
Other reserves are resulted from:
(a) transactions with owners in their capacity as the equity owners. The balance comprises capital reserve surplus/deficit arising from the difference between the deemed consideration and the corresponding net assets value at the respective date of the transactions; and
(b) the obligation to the payment of consideration for the acquisition of 8.36% equity interest of Shenzhen Sinoagri.
(vi) Revaluation reserve
The revaluation reserve relates to the revaluation of property, plant and equipment immediately before its reclassification as investment property.
(vii) Fair value reserve (non-recycling)
The fair value reserve (non-recycling) comprises the cumulative net change in the fair value of equity investments designated at FVOCI under IFRS 9 that are held at the end of the reporting period (see note 1(g)).
(d) Capital management
The Group’s primary objectives when managing capital are to safeguard the Group’s ability to continue as a going concerns so it can continue to provide returns for shareholders and benefits for other stakeholders by pricing products and services commensurately with the level of risk and by securing access to finance at a reasonable cost.
The Group actively and regularly reviews and manages its capital structure to maintain a balance between the higher shareholders returns that might be possible with higher levels of borrowings and the advantages and securities afforded by a sound capital position, and makes adjustments to the capital structure in light of changes in economic conditions.
The Group monitors its capital structure on the basis of an adjusted net debt-to-capital ratio. For this purpose, adjusted net debt is defined as interest-bearing loans and borrowings less fixed deposits with banks with original maturity over three months, pledged bank deposits and cash and cash equivalents. Adjusted capital comprises all components of equity.
The Group’s strategy is to maintain the adjusted net debt-to-capital ratio not exceed 75%. In order to maintain or adjust the ratio, the Group may adjust the amount of dividends paid to shareholders, issue new shares, return capital to shareholders, raise new debt financing or sell assets to reduce debt.

165Annual Report 2018 Zall Smart Commerce Group Ltd.
Notes to the Financial Statements(Expressed in Renminbi unless otherwise indicated)
29 CAPITAL, RESERVES AND DIVIDENDS (Continued)
(d) Capital management (Continued)
The Group’s adjusted net debt-to-capital ratio at 31 December 2018 and 2017 was as follows:
2018 2017Note RMB’000 RMB’000
Current liabilities:Interest-bearing borrowings 25 9,255,114 5,572,061
Non-current liabilities:Interest-bearing borrowings 25 4,970,830 5,422,356
Total debt 14,225,944 10,994,417
Less: Fixed deposits with banks with original maturity over three months 203,287 132,602 Pledged bank deposits 22 3,066,232 2,553,901 Cash and cash equivalents 23 1,118,626 1,283,647
Adjusted net debt 9,837,799 7,024,267
Total equity attributable to equity shareholders of the Company 18,779,592 17,781,210
Adjusted net debt-to-capital ratio 52.39% 39.51%

Zall Smart Commerce Group Ltd. Annual Report 2018166
Notes to the Financial Statements(Expressed in Renminbi unless otherwise indicated)
29 CAPITAL, RESERVES AND DIVIDENDS (Continued)
(d) Capital management (Continued)
Particularly for guarantee operation, the Group monitors regularly the residual balance of outstanding guarantees or/and credit loans for single customers and multiples of the total outstanding guarantees or/and credit loans in relation to paid-in/share capital of companies in the Group engaging guarantee or/and credit loan business respectively, so as to keep the capital risk within an acceptable limit. The decision to manage the share capital of companies in the Group to meet the needs of developing guarantee or/and credit loans business rests with the directors.
Except guarantee operation, neither the Company nor any of its other subsidiaries are subject to externally imposed capital requirements.
(e) Dividends
(i) Dividends payable to equity shareholders of the Company attributable to the year
The directors of the Company did not recommend the payment of any dividend for the year ended 31 December 2018 (2017: HKD2.58 cents per ordinary share).
(ii) Dividends payable to equity shareholders of the Company attributable to the previous financial year, approved and paid during the year.
2018 2017RMB’000 RMB’000
Final dividend in respect of the previous financial year, approved and paid during the year, of HKD 2.58 cents per share (2017: nil) 246,653 –
30 FINANCIAL RISK MANAGEMENT AND FAIR VALUES OF FINANCIAL INSTRUMENTS
Exposure to credit, liquidity, interest rate and currency risks arises in the normal course of the Group’s business. The Group is also exposed to equity price risk arising from its equity investment in other entities and movement in its own equity share price.
The Group’s exposure to these risks and the financial risk management policies and practices used by the Group to manage these risks are described below.
(a) Credit risk
Credit risk refers to the risk that a counterparty will default on its contractual obligations resulting in a financial loss to the Group. The Group’s credit risk is primarily attributable to trade debtors and other receivables and loans and factoring receivables. The Group’s exposure to credit risk arising from cash and cash equivalents, fixed deposits with banks with original maturity over three months, pledged bank deposits and bills receivable is limited because the counterparties are banks and financial institutions for which the Group considers to have low credit risk.
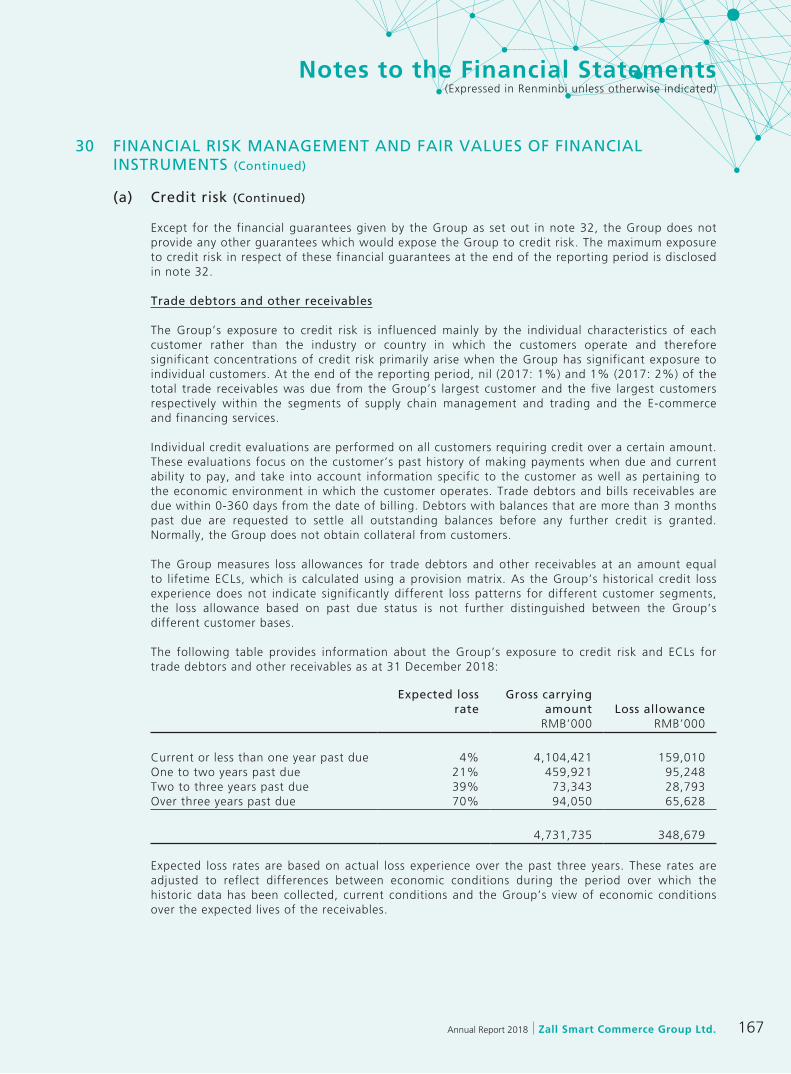
167Annual Report 2018 Zall Smart Commerce Group Ltd.
Notes to the Financial Statements(Expressed in Renminbi unless otherwise indicated)
30 FINANCIAL RISK MANAGEMENT AND FAIR VALUES OF FINANCIAL INSTRUMENTS (Continued)
(a) Credit risk (Continued)
Except for the financial guarantees given by the Group as set out in note 32, the Group does not provide any other guarantees which would expose the Group to credit risk. The maximum exposure to credit risk in respect of these financial guarantees at the end of the reporting period is disclosed in note 32.
Trade debtors and other receivables
The Group’s exposure to credit risk is influenced mainly by the individual characteristics of each customer rather than the industry or country in which the customers operate and therefore significant concentrations of credit risk primarily arise when the Group has significant exposure to individual customers. At the end of the reporting period, nil (2017: 1%) and 1% (2017: 2%) of the total trade receivables was due from the Group’s largest customer and the five largest customers respectively within the segments of supply chain management and trading and the E-commerce and financing services.
Individual credit evaluations are performed on all customers requiring credit over a certain amount. These evaluations focus on the customer’s past history of making payments when due and current ability to pay, and take into account information specific to the customer as well as pertaining to the economic environment in which the customer operates. Trade debtors and bills receivables are due within 0-360 days from the date of billing. Debtors with balances that are more than 3 months past due are requested to settle all outstanding balances before any further credit is granted. Normally, the Group does not obtain collateral from customers.
The Group measures loss allowances for trade debtors and other receivables at an amount equal to lifetime ECLs, which is calculated using a provision matrix. As the Group’s historical credit loss experience does not indicate significantly different loss patterns for different customer segments, the loss allowance based on past due status is not further distinguished between the Group’s different customer bases.
The following table provides information about the Group’s exposure to credit risk and ECLs for trade debtors and other receivables as at 31 December 2018:
Expected loss rate
Gross carrying amount Loss allowance
RMB’000 RMB’000
Current or less than one year past due 4% 4,104,421 159,010One to two years past due 21% 459,921 95,248Two to three years past due 39% 73,343 28,793Over three years past due 70% 94,050 65,628
4,731,735 348,679
Expected loss rates are based on actual loss experience over the past three years. These rates are adjusted to reflect differences between economic conditions during the period over which the historic data has been collected, current conditions and the Group’s view of economic conditions over the expected lives of the receivables.
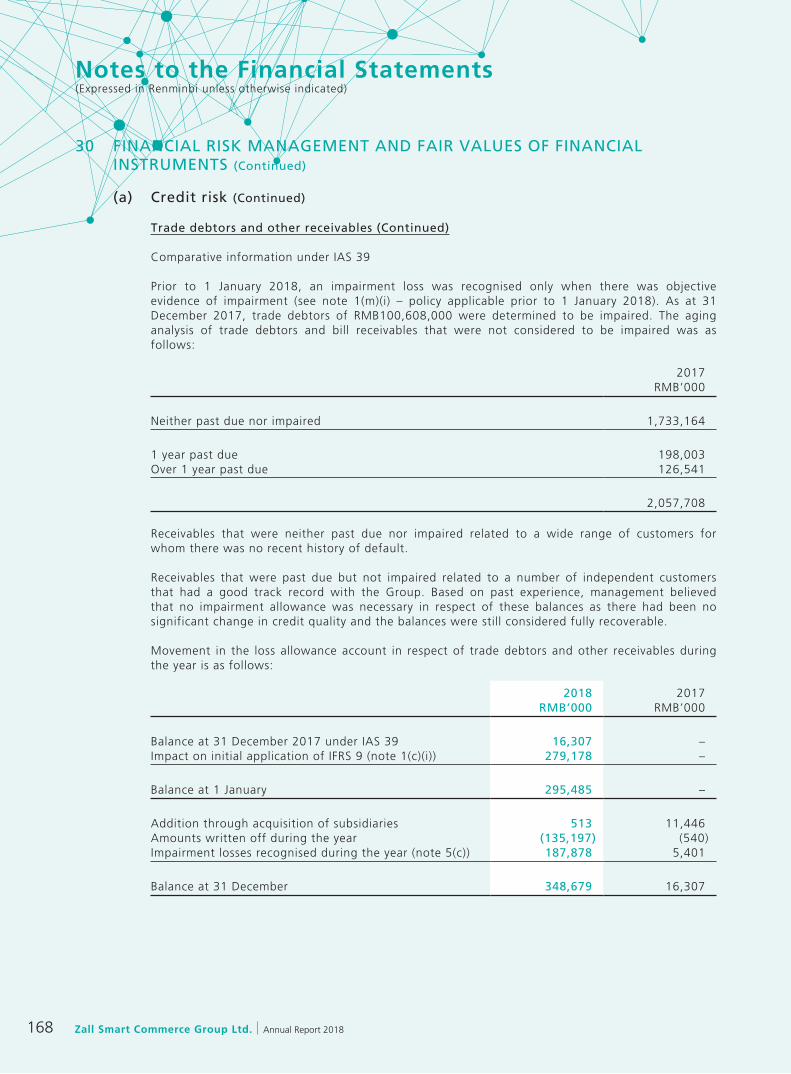
Zall Smart Commerce Group Ltd. Annual Report 2018168
Notes to the Financial Statements(Expressed in Renminbi unless otherwise indicated)
30 FINANCIAL RISK MANAGEMENT AND FAIR VALUES OF FINANCIAL INSTRUMENTS (Continued)
(a) Credit risk (Continued)
Trade debtors and other receivables (Continued)
Comparative information under IAS 39
Prior to 1 January 2018, an impairment loss was recognised only when there was objective evidence of impairment (see note 1(m)(i) – policy applicable prior to 1 January 2018). As at 31 December 2017, trade debtors of RMB100,608,000 were determined to be impaired. The aging analysis of trade debtors and bill receivables that were not considered to be impaired was as follows:
2017RMB’000
Neither past due nor impaired 1,733,164
1 year past due 198,003Over 1 year past due 126,541
2,057,708
Receivables that were neither past due nor impaired related to a wide range of customers for whom there was no recent history of default.
Receivables that were past due but not impaired related to a number of independent customers that had a good track record with the Group. Based on past experience, management believed that no impairment allowance was necessary in respect of these balances as there had been no significant change in credit quality and the balances were still considered fully recoverable.
Movement in the loss allowance account in respect of trade debtors and other receivables during the year is as follows:
2018 2017RMB’000 RMB’000
Balance at 31 December 2017 under IAS 39 16,307 –Impact on initial application of IFRS 9 (note 1(c)(i)) 279,178 –
Balance at 1 January 295,485 –
Addition through acquisition of subsidiaries 513 11,446Amounts written off during the year (135,197) (540)Impairment losses recognised during the year (note 5(c)) 187,878 5,401
Balance at 31 December 348,679 16,307
169Annual Report 2018 Zall Smart Commerce Group Ltd.
Notes to the Financial Statements(Expressed in Renminbi unless otherwise indicated)
30 FINANCIAL RISK MANAGEMENT AND FAIR VALUES OF FINANCIAL INSTRUMENTS (Continued)
(a) Credit risk (Continued)
Loans and factoring receivables
The Group has put in place continuous monitoring mechanism, with regular reporting of credit exposures to internal management of credit risk. The Group’s credit risk management covers key operational phases, including pre-lending evaluations, credit approval, and post-lending monitoring. With respect to pre-lending evaluations, the Group assesses customer credit ratings and performs integrated analysis on the risk and return of the loan. Any adverse events that may significantly affect a borrower’s repayment ability are reported immediately, and actions are taken to mitigate the risks.
Measurement of ECL
Based on whether there is a significant increase in credit risk and whether the asset has incurred credit impairment, the Group measures allowances for loss of different assets with 12-month ECL or lifetime ECL respectively.
The Group measures loss provision of the financial instruments that meet the following conditions according to the amount of expected credit losses within the next 12 months, and measures loss allowances for other financial instruments in accordance with the amount of lifetime expected credit losses.
– The financial instruments that are determined to have low credit risk at the reporting date; or
– The financial instruments for which credit risk has not increased significantly since initial recognition.
(i) Significant increase in credit risk
When one or more quantitative, qualitative standards or upper limits are triggered, the Group assumes that credit risk on financial instruments has increased significantly.
If one or more of the following criteria are met:
– The credit spread increases significantly;
– Significant changes with an adverse effect that have taken place in the counterparty’s business, financial and economic status;
– Application of a grace period or debt-restructuring;
– Significant changes with an adverse effect in the counterparty’s operating conditions;
– Less value of the collaterals (for the collateralised loans and pledged loans only);
– Early indicators of problems of cash flow/liquidity, such as late payment of accounts payable/repayment of loans;
– The payment is more than 30 days past due.

Zall Smart Commerce Group Ltd. Annual Report 2018170
Notes to the Financial Statements(Expressed in Renminbi unless otherwise indicated)
30 FINANCIAL RISK MANAGEMENT AND FAIR VALUES OF FINANCIAL INSTRUMENTS (Continued)
(a) Credit risk (Continued)
Loans and factoring receivables (Continued)
As at December 31, 2018, the Group has not considered that any of its financial instruments has lower credit risk and no longer compared the credit risk at the balance sheet date with that at the initial recognition to identify whether there was a significant increase in credit risk.
(ii) Definition of “default” and “credit-impaired assets”
When a financial instrument meets one or more of the following conditions, the Group considers the financial asset to be in default, and the criteria are consistent with the definition of credit-impaired assets.
(a) Quantitative criterion
The financial asset is more than 90 days past due.
(b) Qualitative criterion
The counterparty meets the criterion of “having difficulty in repayment”, which indicates that the counterparty has significant financial difficulty, including:
– the counterparty has been in the grace period for a long time;
– the death of the counterparty;
– the counterparty enters bankruptcy;
– the counterparty breaches (one or more) terms of the contract that the debtor shall be subject to;
– the disappearance of an active market for the related financial asset because of financial difficulties faced by the counterparty;
– the creditor make concessions due to the financial difficulties faced by the counterparty;
– it becomes probable that the counterparty will enter bankruptcy;
– a higher discount was obtained during the acquisition of assets, and the assets has incurred credit loss when they are acquired.
The above criteria apply to all financial instruments of the Group and they are consistent with the definition of “default” adopted by the internal management of credit risk.

171Annual Report 2018 Zall Smart Commerce Group Ltd.
Notes to the Financial Statements(Expressed in Renminbi unless otherwise indicated)
30 FINANCIAL RISK MANAGEMENT AND FAIR VALUES OF FINANCIAL INSTRUMENTS (Continued)
(a) Credit risk (Continued)
Loans and factoring receivables (Continued)
(iii) Notes to the parameters, assumptions and valuation techniques
The ECL is the result of the discounted product of probability of default (PD), exposure at default (EAD) and loss given default (LGD). The definitions of these terms are as follows:
– PD refers to the likelihood that a counterparty will be unable to meet his repayment obligations over the next 12 months or the remaining lifetime of the loan;
– EAD is the amount that the Group should be reimbursed upon default of an obligor over the next 12 months or the remaining lifetime of the loan;
– LGD refers to the expected degree of loss arising from the exposure at default which is predicted by the Group. LGD varies according to different types of counterparties, methods and priority of recovering debts, and the availability of collaterals or other credit support.
The Group determines the expected credit losses by estimating the PD, LGD and EAD of individual exposure or asset portfolios in the future months. The Group multiplies these three parameters and makes adjustments according to the probability of their continuance (i.e. there is no prepayment or default at an earlier period). By adopting this approach, the Group can calculate the expected credit losses for the future months. The results of calculation for each month are then discounted to the balance sheet date and added up. The discount rate used in the calculation of ECL is the initial effective interest rate or its approximate value.
The lifetime PD is deduced from using the maturity model or 12-month probability of default. The maturity model describes the development rule of the defaults of the asset portfolio over its lifetime. The model is developed based on historical observational data and applicable to all assets in the same portfolio with the same credit rating. The above method is supported by empirical analysis.
The 12-month EAD and lifetime EAD are determined based on expected repayment arrangements, which are different according to different types of products.
– In respect of the loans and factoring receivables, the Group determines 12-month or lifetime EAD according to the repayment schedule agreed in the contract, and makes adjustment based on prediction of over-limit repayment and prepayments/refinancing made by the counterparty.
Zall Smart Commerce Group Ltd. Annual Report 2018172
Notes to the Financial Statements(Expressed in Renminbi unless otherwise indicated)
30 FINANCIAL RISK MANAGEMENT AND FAIR VALUES OF FINANCIAL INSTRUMENTS (Continued)
(a) Credit risk (Continued)
Loans and factoring receivables (Continued)
(iii) Notes to the parameters, assumptions and valuation techniques (Continued)
– The Group determines the 12-month LGD and lifetime LGD based on the factors that affects post-default recovery. LGD for different product types are different.
– Forward-looking economic information should be considered when determining the 12-month and lifetime PD, EAD and LGD.
The Group regularly monitors and reviews assumptions related to the calculation of expected credit losses, including the changes in PD and the value of collaterals under the different time limits.
Both the assessment of the significant increase in credit risk and the measurement of expected credit losses involve forward-looking information. Based on the analysis on historical data, the Group identified critical economic indicators that affect the credit risk and expected credit losses of all asset portfolios,including GDP, increase in RMB loans, PPI, etc..
There has been no significant changes in the valuation techniques and key assumptions during the reporting period.
(iv) Maximum credit risk exposure
The maximum exposure to credit risk is represented by the net carrying amount of each type of financial assets as at the end of each of the reporting period. The maximum exposure to credit risk in respect of those off-balance sheet items as at December 31 is disclosed in Note 32.
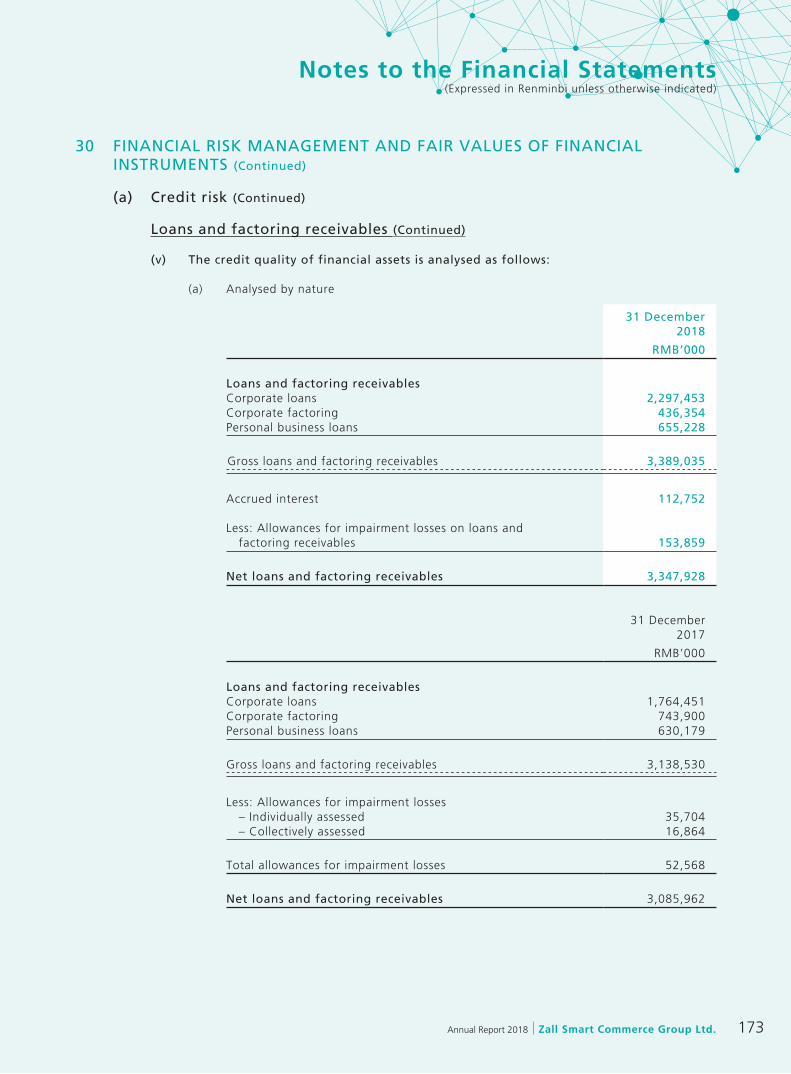
173Annual Report 2018 Zall Smart Commerce Group Ltd.
Notes to the Financial Statements(Expressed in Renminbi unless otherwise indicated)
30 FINANCIAL RISK MANAGEMENT AND FAIR VALUES OF FINANCIAL INSTRUMENTS (Continued)
(a) Credit risk (Continued)
Loans and factoring receivables (Continued)
(v) The credit quality of financial assets is analysed as follows:
(a) Analysed by nature
31 December 2018
RMB’000
Loans and factoring receivables Corporate loans 2,297,453Corporate factoring 436,354Personal business loans 655,228
Gross loans and factoring receivables 3,389,035
Accrued interest 112,752
Less: Allowances for impairment losses on loans and factoring receivables 153,859
Net loans and factoring receivables 3,347,928
31 December 2017
RMB’000
Loans and factoring receivables Corporate loans 1,764,451Corporate factoring 743,900Personal business loans 630,179
Gross loans and factoring receivables 3,138,530
Less: Allowances for impairment losses – Individually assessed 35,704 – Collectively assessed 16,864
Total allowances for impairment losses 52,568
Net loans and factoring receivables 3,085,962

Zall Smart Commerce Group Ltd. Annual Report 2018174
Notes to the Financial Statements(Expressed in Renminbi unless otherwise indicated)
30 FINANCIAL RISK MANAGEMENT AND FAIR VALUES OF FINANCIAL INSTRUMENTS (Continued)
(a) Credit risk (Continued)
Loans and factoring receivables (Continued)
(v) The credit quality of financial assets is analysed as follows: (Continued)
(b) Analysed by industry sector
31 December 2018
Amount Percentage
Loans and factoring
receivables secured by collaterals
RMB’000 RMB’000
Commodities trading 2,224,845 66% 1,515,156Leasing and commercial services 142,608 4% 7,608Wholesale and retail 55,724 2% –Manufacturing 280,622 8% –Transportation, storage and postal service 30,009 1% –
Sub-total of corporate loans and factoring 2,733,808 81% 1,522,764 Personal business loans 655,227 19% 655,228
Gross loans and factoring receivables 3,389,035 100% 2,177,992
31 December 2017
Amount Percentage
Loans and factoring
receivables secured by collaterals
RMB’000 RMB’000
Commodities trading 1,596,866 51% 1,596,866Leasing and commercial services 356,339 11% –Wholesale and retail 381,807 12% –Manufacturing 90,570 3% –Transportation, storage and postal service 82,769 3% –
Sub-total of corporate loans and factoring 2,508,351 80% 1,596,866
Personal business loans 630,179 20% 630,179
Gross loans and factoring receivables 3,138,530 100% 2,227,045
All of the loans and factoring receivables as at 31 December 2018 and 2017 were within the PRC.

175Annual Report 2018 Zall Smart Commerce Group Ltd.
Notes to the Financial Statements(Expressed in Renminbi unless otherwise indicated)
30 FINANCIAL RISK MANAGEMENT AND FAIR VALUES OF FINANCIAL INSTRUMENTS (Continued)
(a) Credit risk (Continued)
Loans and factoring receivables (Continued)
(v) The credit quality of financial assets is analysed as follows: (Continued)
(c) Analysed by type of collateral
31 December 2018
RMB’000
Unsecured 1,171,543Guaranteed 39,500Collateralised 2,177,992
Gross loans and factoring receivables 3,389,035
Accrued interest 112,752
Less: Allowances for impairment losses on loans and factoring receivables 153,859
Net loans and factoring receivables 3,347,928
31 December 2017
RMB’000
Unsecured 743,900Guaranteed 167,585Collateralised 2,227,045
Gross loans and factoring receivables 3,138,530
Less: Allowances for impairment losses– Individually assessed 35,704– Collectively assessed 16,864
Total allowances for impairment losses 52,568
Net loans and factoring receivables 3,085,962

Zall Smart Commerce Group Ltd. Annual Report 2018176
Notes to the Financial Statements(Expressed in Renminbi unless otherwise indicated)
30 FINANCIAL RISK MANAGEMENT AND FAIR VALUES OF FINANCIAL INSTRUMENTS (Continued)
(a) Credit risk (Continued)
Loans and factoring receivables (Continued)
(v) The credit quality of financial assets is analysed as follows: (Continued)
(d) Overdue loans and factoring receivables analysed by overdue period
31 December 2018Overdue
more than three
months to one year
(inclusive)
Overdue more than
one to three years
(inclusive)
Overdue more than
three years TotalRMB’000 RMB’000 RMB’000 RMB’000
Collateralised 1,973 7,673 225,778 235,424
As a percentage of gross loans and factoring receivables 0.06% 0.23% 6.66% 6.95%
31 December 2017Overdue
more than three months
to one year (inclusive)
Overdue more than
one year to three years (inclusive)
Overdue more than
three years TotalRMB’000 RMB’000 RMB’000 RMB’000
Collateralised – 10,644 175,371 186,015
As a percentage of gross loans and factoring receivables – 0.34% 5.59% 5.93%
Overdue loans and factoring receivables represent loans or factoring, of which the whole or part of the principal or interest are overdue for one day or more.

177Annual Report 2018 Zall Smart Commerce Group Ltd.
Notes to the Financial Statements(Expressed in Renminbi unless otherwise indicated)
30 FINANCIAL RISK MANAGEMENT AND FAIR VALUES OF FINANCIAL INSTRUMENTS (Continued)
(a) Credit risk (Continued)
Loans and factoring receivables (Continued)
(v) The credit quality of financial assets is analysed as follows: (Continued)
(e) Allowances for impairment losses
31 December 2018
12-month ECL
Lifetime ECL not credit-
impaired
Lifetime ECL credit-
impaired TotalRMB’000 RMB’000 RMB’000 RMB’000
Gross loans and factoring receivables 1,911,833 981,156 496,046 3,389,035
Accrued interest receivable 54,385 44,300 14,067 112,752
Less: Allowances for impairment losses 6,554 4,004 143,301 153,859
Carrying amount of loans and factoring receivables 1,959,664 1,021,452 366,812 3,347,928
31 December 2017Allowances for impaired
loans and factoring receivables
Allowances for loans and
factoring receivables which are
collectively assessed
Which are collectively
assessed
Which are individually
assessed TotalRMB’000 RMB’000 RMB’000 RMB’000
Gross loans and factoring receivables 2,952,515 112,427 73,588 3,138,530
Less: Allowances for impairment losses – 16,864 35,704 52,568
Carrying amount of loans and factoring receivables 2,952,515 95,563 37,884 3,085,962
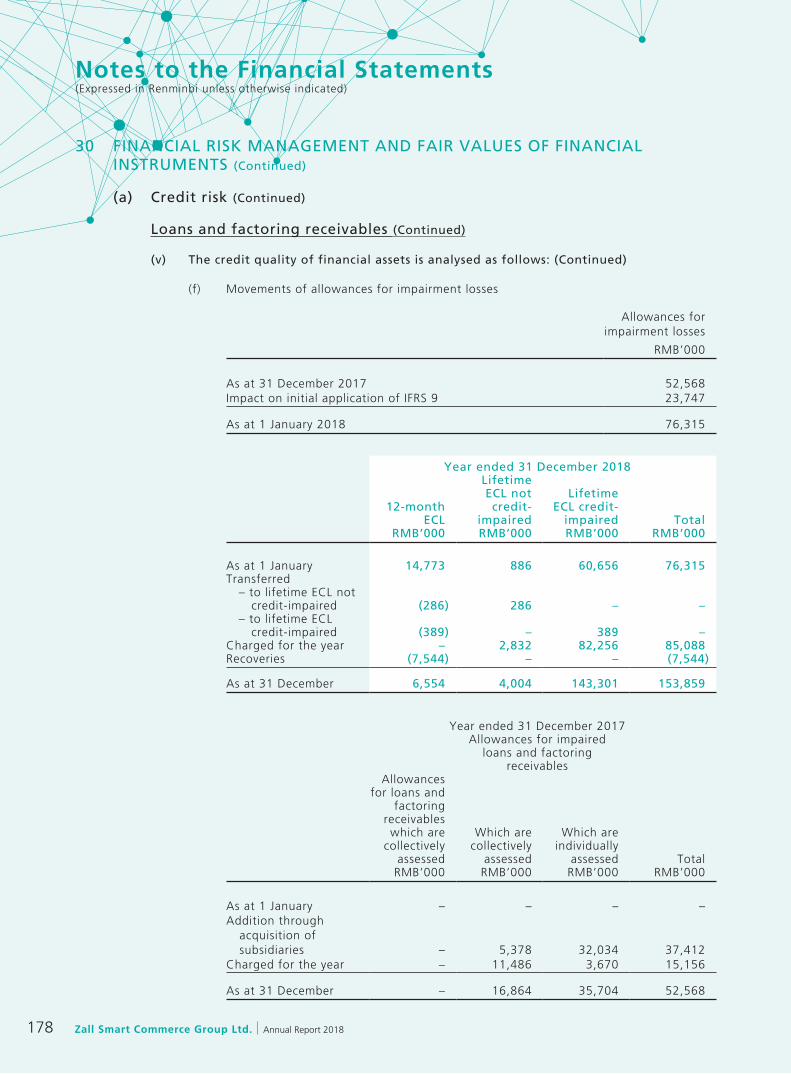
Zall Smart Commerce Group Ltd. Annual Report 2018178
Notes to the Financial Statements(Expressed in Renminbi unless otherwise indicated)
30 FINANCIAL RISK MANAGEMENT AND FAIR VALUES OF FINANCIAL INSTRUMENTS (Continued)
(a) Credit risk (Continued)
Loans and factoring receivables (Continued)
(v) The credit quality of financial assets is analysed as follows: (Continued)
(f) Movements of allowances for impairment losses
Allowances for impairment losses
RMB’000
As at 31 December 2017 52,568Impact on initial application of IFRS 9 23,747
As at 1 January 2018 76,315
Year ended 31 December 2018
12-month ECL
Lifetime ECL not credit-
impaired
Lifetime ECL credit-
impaired TotalRMB’000 RMB’000 RMB’000 RMB’000
As at 1 January 14,773 886 60,656 76,315Transferred – to lifetime ECL not credit-impaired (286) 286 – – – to lifetime ECL credit-impaired (389) – 389 –Charged for the year – 2,832 82,256 85,088Recoveries (7,544) – – (7,544)
As at 31 December 6,554 4,004 143,301 153,859
Year ended 31 December 2017Allowances for impaired
loans and factoring receivables
Allowances for loans and
factoring receivables which are
collectively assessed
Which are collectively
assessed
Which are individually
assessed TotalRMB’000 RMB’000 RMB’000 RMB’000
As at 1 January – – – –Addition through
acquisition of subsidiaries – 5,378 32,034 37,412
Charged for the year – 11,486 3,670 15,156
As at 31 December – 16,864 35,704 52,568
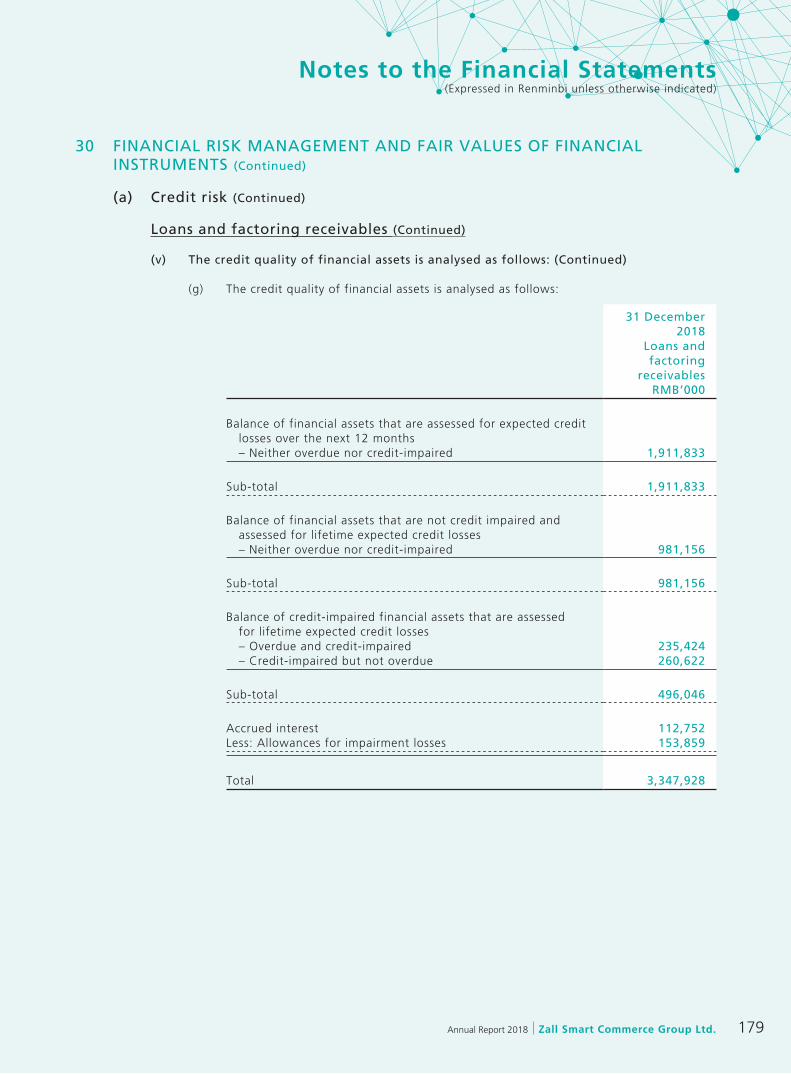
179Annual Report 2018 Zall Smart Commerce Group Ltd.
Notes to the Financial Statements(Expressed in Renminbi unless otherwise indicated)
30 FINANCIAL RISK MANAGEMENT AND FAIR VALUES OF FINANCIAL INSTRUMENTS (Continued)
(a) Credit risk (Continued)
Loans and factoring receivables (Continued)
(v) The credit quality of financial assets is analysed as follows: (Continued)
(g) The credit quality of financial assets is analysed as follows:
31 December 2018
Loans and factoring
receivablesRMB’000
Balance of financial assets that are assessed for expected credit losses over the next 12 months – Neither overdue nor credit-impaired 1,911,833
Sub-total 1,911,833
Balance of financial assets that are not credit impaired and assessed for lifetime expected credit losses – Neither overdue nor credit-impaired 981,156
Sub-total 981,156
Balance of credit-impaired financial assets that are assessed for lifetime expected credit losses – Overdue and credit-impaired 235,424 – Credit-impaired but not overdue 260,622
Sub-total 496,046
Accrued interest 112,752Less: Allowances for impairment losses 153,859
Total 3,347,928
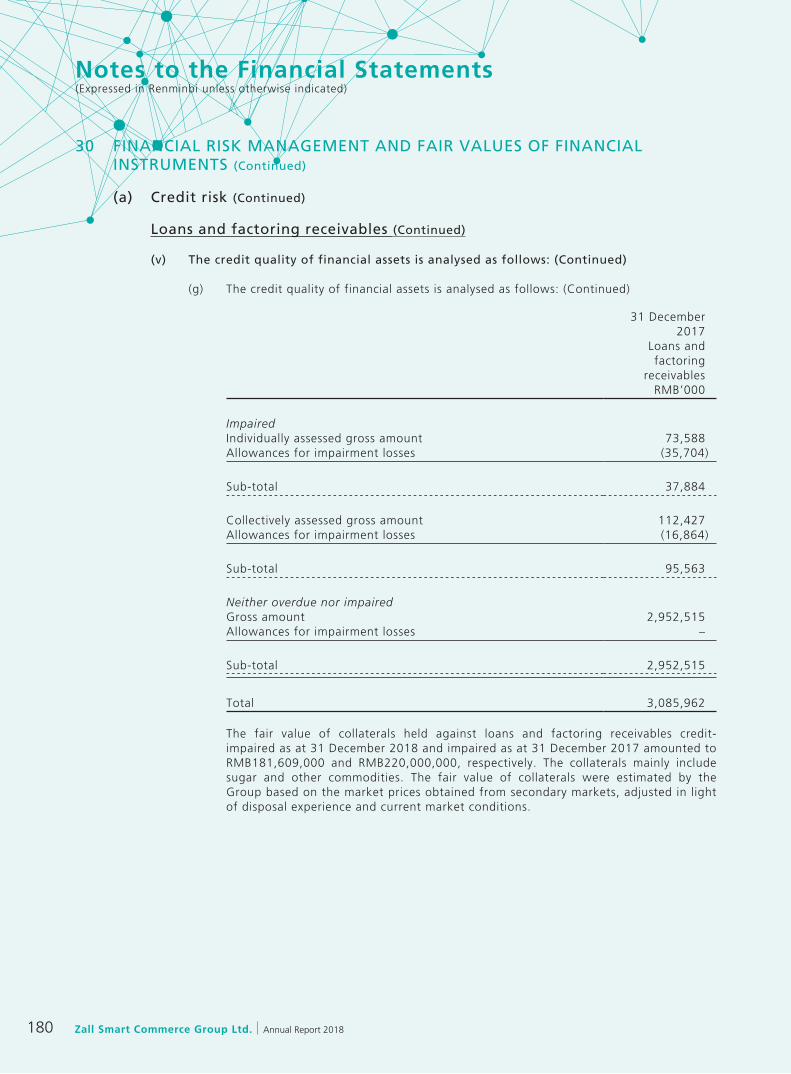
Zall Smart Commerce Group Ltd. Annual Report 2018180
Notes to the Financial Statements(Expressed in Renminbi unless otherwise indicated)
30 FINANCIAL RISK MANAGEMENT AND FAIR VALUES OF FINANCIAL INSTRUMENTS (Continued)
(a) Credit risk (Continued)
Loans and factoring receivables (Continued)
(v) The credit quality of financial assets is analysed as follows: (Continued)
(g) The credit quality of financial assets is analysed as follows: (Continued)
31 December 2017
Loans and factoring
receivablesRMB’000
ImpairedIndividually assessed gross amount 73,588Allowances for impairment losses (35,704)
Sub-total 37,884
Collectively assessed gross amount 112,427Allowances for impairment losses (16,864)
Sub-total 95,563
Neither overdue nor impairedGross amount 2,952,515Allowances for impairment losses –
Sub-total 2,952,515
Total 3,085,962
The fair value of collaterals held against loans and factoring receivables credit-impaired as at 31 December 2018 and impaired as at 31 December 2017 amounted to RMB181,609,000 and RMB220,000,000, respectively. The collaterals mainly include sugar and other commodities. The fair value of collaterals were estimated by the Group based on the market prices obtained from secondary markets, adjusted in light of disposal experience and current market conditions.

181Annual Report 2018 Zall Smart Commerce Group Ltd.
Notes to the Financial Statements(Expressed in Renminbi unless otherwise indicated)
30 FINANCIAL RISK MANAGEMENT AND FAIR VALUES OF FINANCIAL INSTRUMENTS (Continued)
(b) Liquidity risk
Cash management of the Company and its subsidiaries are substantially centralised at the Group level. The Group’s policy is to regularly monitor current and expected liquidity requirements and its compliance with lending covenants, to ensure that it maintains sufficient reserves of cash and adequate committed lines of funding from major financial institutions to meet its liquidity requirements in the short and longer term.
The following tables show the remaining contractual maturities at the end of the reporting period of the Group’s financial liabilities, which are based on contractual undiscounted cash flows (including interest payments computed using contractual rates or, if floating, based on rates current at the end of the reporting period) and the earliest date the Group can be required to pay:
2018Contractual undiscounted cash outflow
Within 1 year or on
demand
More than 1 year but less than 2 years
More than 2 years but less
than 5 yearsMore than 5
years TotalCarrying amount
RMB’000 RMB’000 RMB’000 RMB’000 RMB’000 RMB’000
Interest-bearing borrowings 9,824,553 3,629,371 1,515,481 300,949 15,270,354 14,225,944Trade and other payables (excluding receipts in advance) 10,690,923 21,261 – – 10,712,184 10,712,184Amounts due to related parties 956,391 – – – 956,391 956,391
21,471,867 3,650,632 1,515,481 300,949 26,938,929 25,894,519
2017Contractual undiscounted cash outflow
Within 1 year or on
demand
More than 1 year but less than 2
years
More than 2 years but less than 5 years
More than 5 years Total Carrying amount
RMB’000 RMB’000 RMB’000 RMB’000 RMB’000 RMB’000
Interest-bearing borrowings 6,844,356 3,110,669 3,516,939 751,617 14,223,581 10,994,417Trade and other payables (excluding receipts in advance) 11,231,235 23,369 – – 11,254,604 11,254,604Amounts due to related parties 583,409 – – – 583,409 583,409
18,659,000 3,134,038 3,516,939 751,617 26,061,594 22,832,430
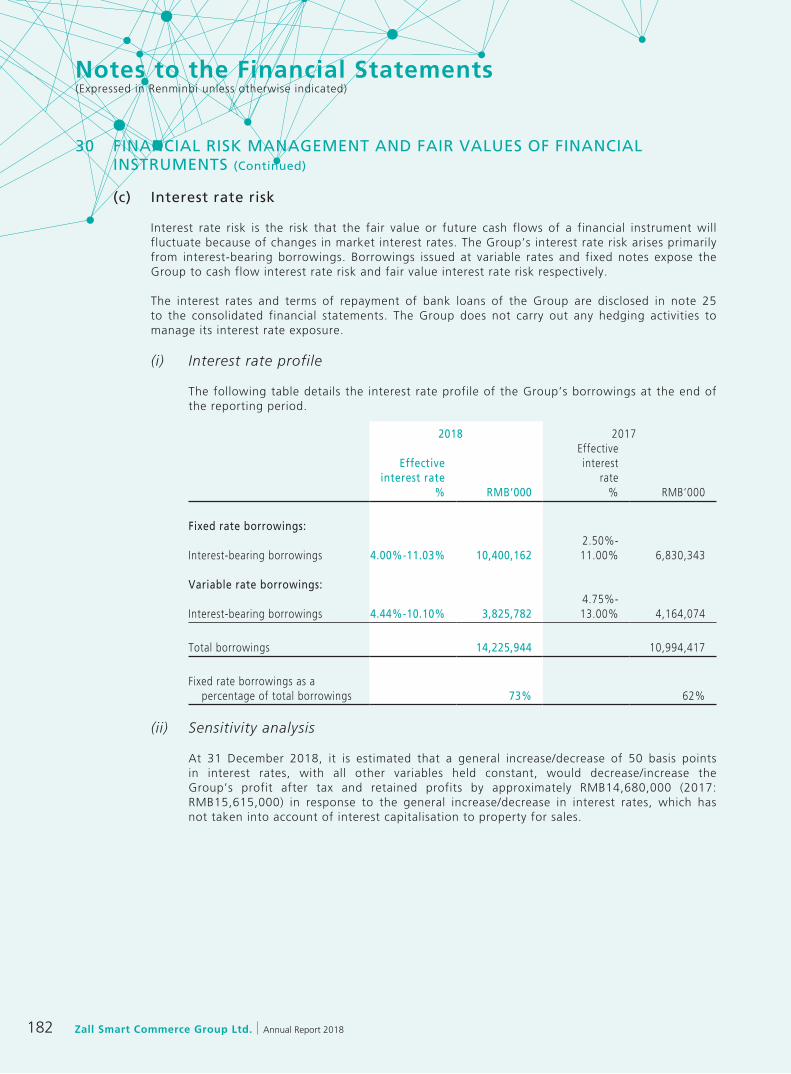
Zall Smart Commerce Group Ltd. Annual Report 2018182
Notes to the Financial Statements(Expressed in Renminbi unless otherwise indicated)
30 FINANCIAL RISK MANAGEMENT AND FAIR VALUES OF FINANCIAL INSTRUMENTS (Continued)
(c) Interest rate risk
Interest rate risk is the risk that the fair value or future cash flows of a financial instrument will fluctuate because of changes in market interest rates. The Group’s interest rate risk arises primarily from interest-bearing borrowings. Borrowings issued at variable rates and fixed notes expose the Group to cash flow interest rate risk and fair value interest rate risk respectively.
The interest rates and terms of repayment of bank loans of the Group are disclosed in note 25 to the consolidated financial statements. The Group does not carry out any hedging activities to manage its interest rate exposure.
(i) Interest rate profile
The following table details the interest rate profile of the Group’s borrowings at the end of the reporting period.
2018 2017
Effective interest rate
Effective interest
rate% RMB’000 % RMB’000
Fixed rate borrowings:
Interest-bearing borrowings 4.00%-11.03% 10,400,1622.50%-11.00% 6,830,343
Variable rate borrowings:
Interest-bearing borrowings 4.44%-10.10% 3,825,7824.75%-13.00% 4,164,074
Total borrowings 14,225,944 10,994,417
Fixed rate borrowings as a percentage of total borrowings 73% 62%
(ii) Sensitivity analysis
At 31 December 2018, it is estimated that a general increase/decrease of 50 basis points in interest rates, with all other variables held constant, would decrease/increase the Group’s profit after tax and retained profits by approximately RMB14,680,000 (2017: RMB15,615,000) in response to the general increase/decrease in interest rates, which has not taken into account of interest capitalisation to property for sales.

183Annual Report 2018 Zall Smart Commerce Group Ltd.
Notes to the Financial Statements(Expressed in Renminbi unless otherwise indicated)
30 FINANCIAL RISK MANAGEMENT AND FAIR VALUES OF FINANCIAL INSTRUMENTS (Continued)
(c) Interest rate risk (Continued)
(ii) Sensitivity analysis (Continued)
For the exposure to cash flow interest rate risk arising from floating rate non-derivative instruments held by the Group at the end of the reporting period, the impact on the Group’s profit after tax (and retained profits) and other components of consolidated equity is estimated as an annualised impact on interest expense or income of such a change in interest rates. The analysis is performed on the same basis as 2017.
(d) Currency risk
As the Group’s principal activities are carried out in the PRC, the Group’s transactions are mainly denominated in RMB, which is not freely convertible into foreign currencies. All foreign exchange transactions involving RMB must take place through the People’s Bank of China or other institutions authorised to buy and sell foreign exchange. The exchange rates adopted for the foreign exchange transactions are the rates of exchange quoted by the People’s Bank of China that are determined largely by supply and demand.
The management does not expect that there will be any significant currency risk for the Group for both years ended 31 December 2018 and 2017.
(e) Equity price risk
The Group is exposed to equity price changes arising from listed equity investments classified as financial assets at fair value through profit or loss (see note 18).
The Group’s listed investments are listed on the Stock Exchange of Hong Kong. Decisions to buy or sell trading securities are based on daily monitoring of the performance of individual securities compared to that of the stock market index as well as the Group’s liquidity needs.
The Group is also exposed to equity price risk arising from changes in the Company’s own share price to the extent that the Company’s own equity instruments underlie the contingent consideration of the Group for the acquisition of Shenzhen Sinoagri.

Zall Smart Commerce Group Ltd. Annual Report 2018184
Notes to the Financial Statements(Expressed in Renminbi unless otherwise indicated)
30 FINANCIAL RISK MANAGEMENT AND FAIR VALUES OF FINANCIAL INSTRUMENTS (Continued)
(e) Equity price risk (Continued)
At 31 December 2018, it is estimated that an increase/(decrease) of 10% in the relevant stock market index (for listed investments) and the Company’s own share price (for the contingent consideration) as applicable, with all other variables held constant, would have increased/(decreased) the Group’s profit after tax (and retained profits) as follows:
2018 2017Effect on
profit after tax and
retained profits
Effect on profit after
tax and retained
profitsRMB’000 RMB’000
Change in the relevant equity price risk variable:
Increase 10% 124,032 10% 211,167 Decrease (10%) (124,032) (10%) (211,167)
The sensitivity analysis indicates the instantaneous change in the Group’s profit after tax (and retained profits) that would arise assuming that the changes in the stock market index or other relevant risk variables had occurred at the end of the reporting period and had been applied to re-measure those financial instruments held by the Group which expose the Group to equity price risk at the end of the reporting period. It is also assumed that the fair values of the Group’s equity investments would change in accordance with the historical correlation with the relevant stock market index or the relevant risk variables, and that all other variables remain constant. The analysis is performed on the same basis for 2017.
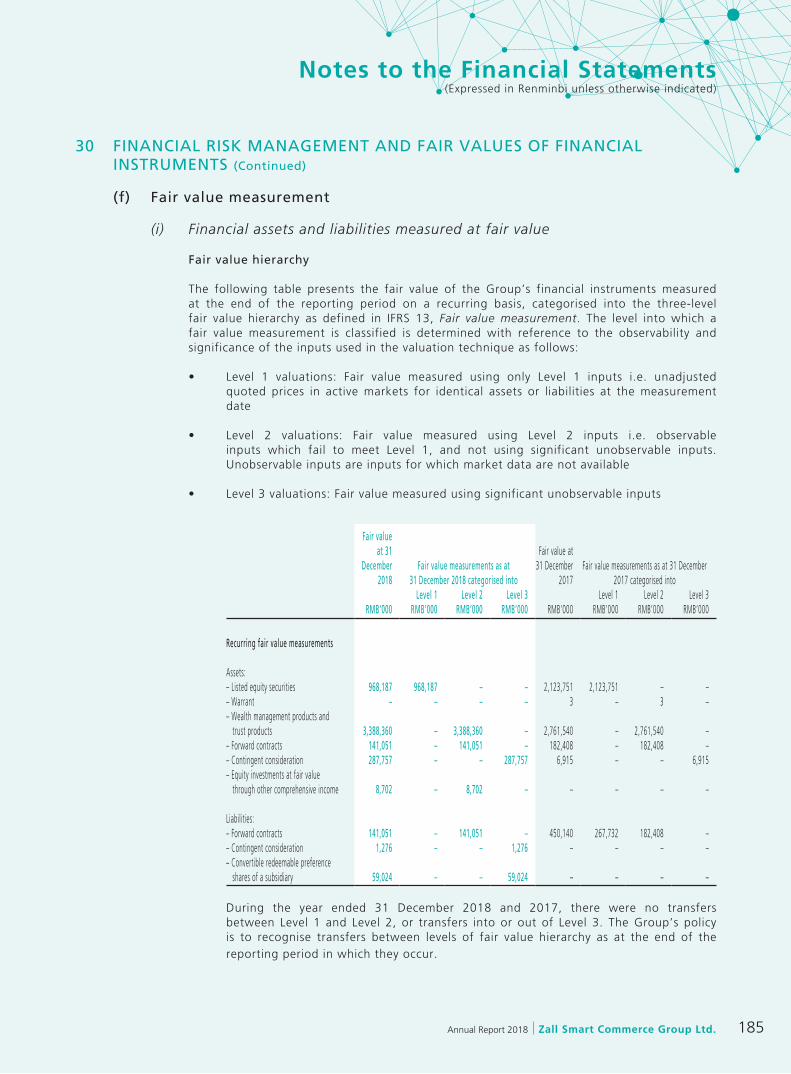
185Annual Report 2018 Zall Smart Commerce Group Ltd.
Notes to the Financial Statements(Expressed in Renminbi unless otherwise indicated)
30 FINANCIAL RISK MANAGEMENT AND FAIR VALUES OF FINANCIAL INSTRUMENTS (Continued)
(f) Fair value measurement
(i) Financial assets and liabilities measured at fair value
Fair value hierarchy
The following table presents the fair value of the Group’s financial instruments measured at the end of the reporting period on a recurring basis, categorised into the three-level fair value hierarchy as defined in IFRS 13, Fair value measurement. The level into which a fair value measurement is classified is determined with reference to the observability and significance of the inputs used in the valuation technique as follows:
• Level 1 valuations: Fair value measured using only Level 1 inputs i.e. unadjustedquoted prices in active markets for identical assets or liabilities at the measurement date
• Level 2 valuations: Fair value measured using Level 2 inputs i.e. observableinputs which fail to meet Level 1, and not using significant unobservable inputs. Unobservable inputs are inputs for which market data are not available
• Level3valuations:Fairvaluemeasuredusingsignificantunobservableinputs
Fair value at 31
December 2018
Fair value measurements as at 31 December 2018 categorised into
Fair value at 31 December
2017Fair value measurements as at 31 December
2017 categorised intoLevel 1 Level 2 Level 3 Level 1 Level 2 Level 3
RMB’000 RMB’000 RMB’000 RMB’000 RMB’000 RMB’000 RMB’000 RMB’000
Recurring fair value measurements
Assets:– Listed equity securities 968,187 968,187 – – 2,123,751 2,123,751 – –– Warrant – – – – 3 – 3 –– Wealth management products and trust products 3,388,360 – 3,388,360 – 2,761,540 – 2,761,540 –– Forward contracts 141,051 – 141,051 – 182,408 – 182,408 –– Contingent consideration 287,757 – – 287,757 6,915 – – 6,915– Equity investments at fair value through other comprehensive income 8,702 – 8,702 – – – – –
Liabilities:– Forward contracts 141,051 – 141,051 – 450,140 267,732 182,408 –– Contingent consideration 1,276 – – 1,276 – – – –– Convertible redeemable preference shares of a subsidiary 59,024 – – 59,024 – – – –
During the year ended 31 December 2018 and 2017, there were no transfers between Level 1 and Level 2, or transfers into or out of Level 3. The Group’s policy is to recognise transfers between levels of fair value hierarchy as at the end of the reporting period in which they occur.
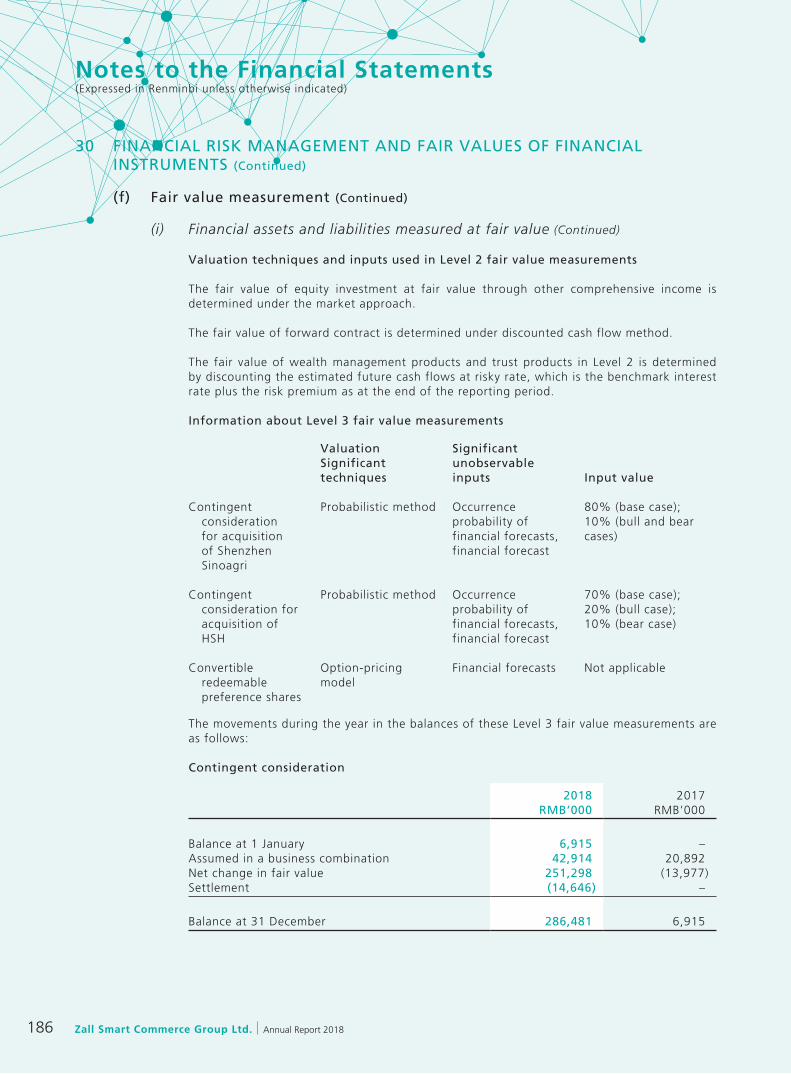
Zall Smart Commerce Group Ltd. Annual Report 2018186
Notes to the Financial Statements(Expressed in Renminbi unless otherwise indicated)
30 FINANCIAL RISK MANAGEMENT AND FAIR VALUES OF FINANCIAL INSTRUMENTS (Continued)
(f) Fair value measurement (Continued)
(i) Financial assets and liabilities measured at fair value (Continued)
Valuation techniques and inputs used in Level 2 fair value measurements
The fair value of equity investment at fair value through other comprehensive income is determined under the market approach.
The fair value of forward contract is determined under discounted cash flow method.
The fair value of wealth management products and trust products in Level 2 is determined by discounting the estimated future cash flows at risky rate, which is the benchmark interest rate plus the risk premium as at the end of the reporting period.
Information about Level 3 fair value measurements
Valuation Significant techniques
Significant unobservable inputs Input value
Contingent consideration for acquisition of Shenzhen Sinoagri
Probabilistic method Occurrence probability of financial forecasts, financial forecast
80% (base case); 10% (bull and bear cases)
Contingent consideration for acquisition of HSH
Probabilistic method Occurrence probability of financial forecasts, financial forecast
70% (base case); 20% (bull case); 10% (bear case)
Convertible redeemable preference shares
Option-pricing model
Financial forecasts Not applicable
The movements during the year in the balances of these Level 3 fair value measurements are as follows:
Contingent consideration
2018 2017RMB’000 RMB’000
Balance at 1 January 6,915 –Assumed in a business combination 42,914 20,892Net change in fair value 251,298 (13,977)Settlement (14,646) –
Balance at 31 December 286,481 6,915
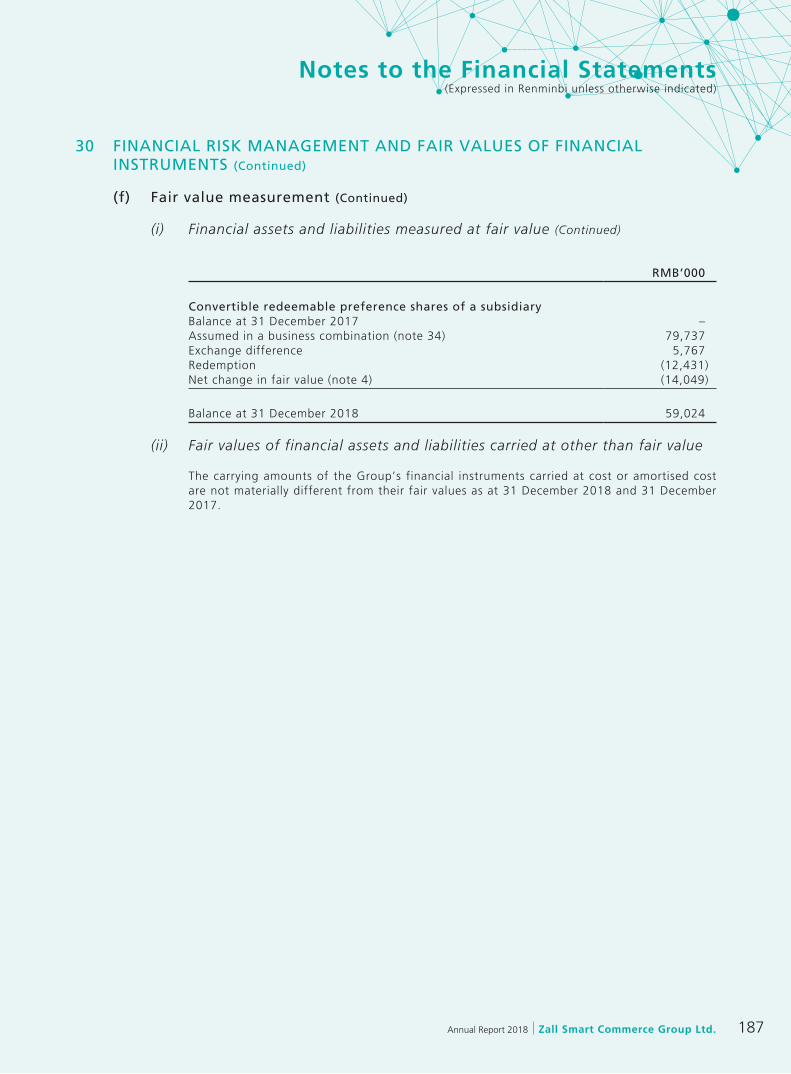
187Annual Report 2018 Zall Smart Commerce Group Ltd.
Notes to the Financial Statements(Expressed in Renminbi unless otherwise indicated)
30 FINANCIAL RISK MANAGEMENT AND FAIR VALUES OF FINANCIAL INSTRUMENTS (Continued)
(f) Fair value measurement (Continued)
(i) Financial assets and liabilities measured at fair value (Continued)
RMB’000
Convertible redeemable preference shares of a subsidiaryBalance at 31 December 2017 –Assumed in a business combination (note 34) 79,737Exchange difference 5,767Redemption (12,431)Net change in fair value (note 4) (14,049)
Balance at 31 December 2018 59,024
(ii) Fair values of financial assets and liabilities carried at other than fair value
The carrying amounts of the Group’s financial instruments carried at cost or amortised cost are not materially different from their fair values as at 31 December 2018 and 31 December 2017.

Zall Smart Commerce Group Ltd. Annual Report 2018188
Notes to the Financial Statements(Expressed in Renminbi unless otherwise indicated)
31 COMMITMENTS
(a) Operating lease commitment
At 31 December 2018, the total future minimum lease payments under non-cancellable operating leases are payable as follows:
2018 2017RMB’000 RMB’000
Within 1 year 15,106 59,746After 1 year but within 5 years 20,639 16,052
35,745 75,798
The Group leases a number of building facilities under operating leases. The leases typically run for an initial period of 5 years, with an option to renew the lease after that date at which time all terms are renegotiated. None of the leases includes contingent rentals.
(b) Capital commitments on development costs
As at 31 December 2018, the Group’s capital commitments in respect of investment properties under development and properties under development are as follows:
2018 2017RMB’000 RMB’000
Contracted but not provided for – Investment properties under development 137,887 112,354 – Properties under development 1,590,514 1,133,544
1,728,401 1,245,898
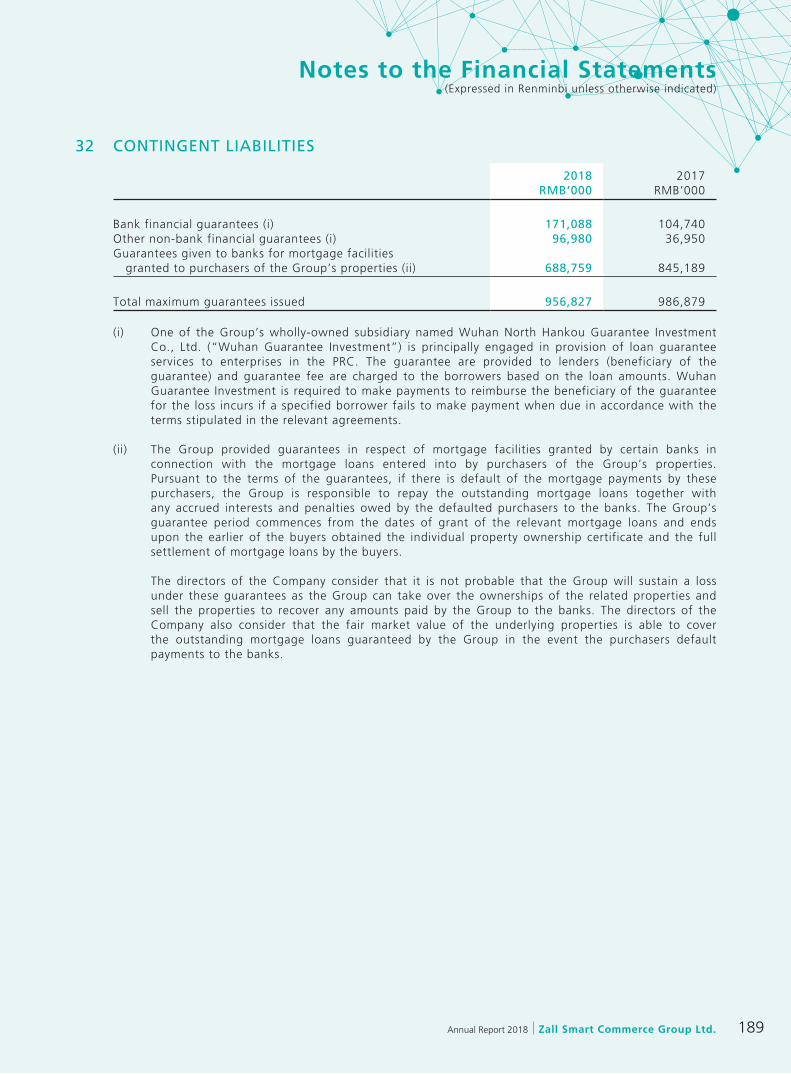
189Annual Report 2018 Zall Smart Commerce Group Ltd.
Notes to the Financial Statements(Expressed in Renminbi unless otherwise indicated)
32 CONTINGENT LIABILITIES
2018 2017RMB’000 RMB’000
Bank financial guarantees (i) 171,088 104,740Other non-bank financial guarantees (i) 96,980 36,950Guarantees given to banks for mortgage facilities granted to purchasers of the Group’s properties (ii) 688,759 845,189
Total maximum guarantees issued 956,827 986,879
(i) One of the Group’s wholly-owned subsidiary named Wuhan North Hankou Guarantee Investment Co., Ltd. (“Wuhan Guarantee Investment”) is principally engaged in provision of loan guarantee services to enterprises in the PRC. The guarantee are provided to lenders (beneficiary of the guarantee) and guarantee fee are charged to the borrowers based on the loan amounts. Wuhan Guarantee Investment is required to make payments to reimburse the beneficiary of the guarantee for the loss incurs if a specified borrower fails to make payment when due in accordance with the terms stipulated in the relevant agreements.
(ii) The Group provided guarantees in respect of mortgage facilities granted by certain banks in connection with the mortgage loans entered into by purchasers of the Group’s properties. Pursuant to the terms of the guarantees, if there is default of the mortgage payments by these purchasers, the Group is responsible to repay the outstanding mortgage loans together with any accrued interests and penalties owed by the defaulted purchasers to the banks. The Group’s guarantee period commences from the dates of grant of the relevant mortgage loans and ends upon the earlier of the buyers obtained the individual property ownership certificate and the full settlement of mortgage loans by the buyers.
The directors of the Company consider that it is not probable that the Group will sustain a loss under these guarantees as the Group can take over the ownerships of the related properties and sell the properties to recover any amounts paid by the Group to the banks. The directors of the Company also consider that the fair market value of the underlying properties is able to cover the outstanding mortgage loans guaranteed by the Group in the event the purchasers default payments to the banks.
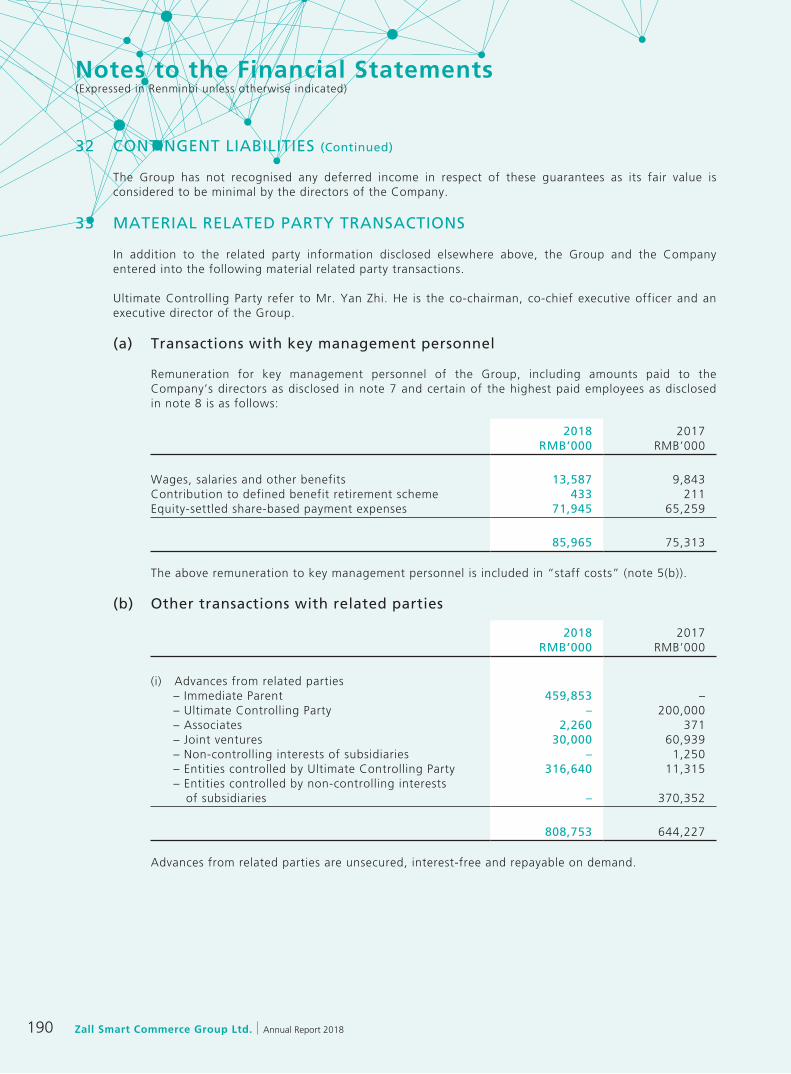
Zall Smart Commerce Group Ltd. Annual Report 2018190
Notes to the Financial Statements(Expressed in Renminbi unless otherwise indicated)
32 CONTINGENT LIABILITIES (Continued)
The Group has not recognised any deferred income in respect of these guarantees as its fair value is considered to be minimal by the directors of the Company.
33 MATERIAL RELATED PARTY TRANSACTIONS
In addition to the related party information disclosed elsewhere above, the Group and the Company entered into the following material related party transactions.
Ultimate Controlling Party refer to Mr. Yan Zhi. He is the co-chairman, co-chief executive officer and an executive director of the Group.
(a) Transactions with key management personnel
Remuneration for key management personnel of the Group, including amounts paid to the Company’s directors as disclosed in note 7 and certain of the highest paid employees as disclosed in note 8 is as follows:
2018 2017RMB’000 RMB’000
Wages, salaries and other benefits 13,587 9,843Contribution to defined benefit retirement scheme 433 211Equity-settled share-based payment expenses 71,945 65,259
85,965 75,313
The above remuneration to key management personnel is included in “staff costs” (note 5(b)).
(b) Other transactions with related parties
2018 2017RMB’000 RMB’000
(i) Advances from related parties– Immediate Parent 459,853 –– Ultimate Controlling Party – 200,000– Associates 2,260 371– Joint ventures 30,000 60,939– Non-controlling interests of subsidiaries – 1,250– Entities controlled by Ultimate Controlling Party 316,640 11,315– Entities controlled by non-controlling interests of subsidiaries – 370,352
808,753 644,227
Advances from related parties are unsecured, interest-free and repayable on demand.

191Annual Report 2018 Zall Smart Commerce Group Ltd.
Notes to the Financial Statements(Expressed in Renminbi unless otherwise indicated)
33 MATERIAL RELATED PARTY TRANSACTIONS (Continued)
(b) Other transactions with related parties (Continued)
2018 2017RMB’000 RMB’000
(ii) Payments to related parties– Immediate Parent 93,753 469,512– Key management personnel 10,000 –– Ultimate Controlling Party – 200,000– Associates – 20,277– Joint ventures 177,634 85,969– Non-controlling interests of subsidiaries 1,253 –– Entities controlled by Ultimate Controlling Party 39,695 11,223– Entities controlled by non-controlling interests of subsidiaries 114,200 256,152
436,535 1,043,133
2018 2017RMB’000 RMB’000
(iii) Advances to related parties– Associates 76,731 47,807– Joint ventures 1,098,732 309,479– Non-controlling interests of subsidiaries 98 30,228– Entities controlled by Ultimate Controlling Party 4,478 1,508– Key management personnel 5,921 –
1,185,960 389,022
Advances to related parties are unsecured, interest free and repayable on demand.
2018 2017RMB’000 RMB’000
(iv) Repayment from related parties– Associates 10,872 27,512– Joint ventures 1,038,467 298,670– Non-controlling interests of subsidiaries – 229– Entities controlled by Ultimate Controlling Party 2,648 331– Key management personnel 4,783 –
1,056,770 326,742
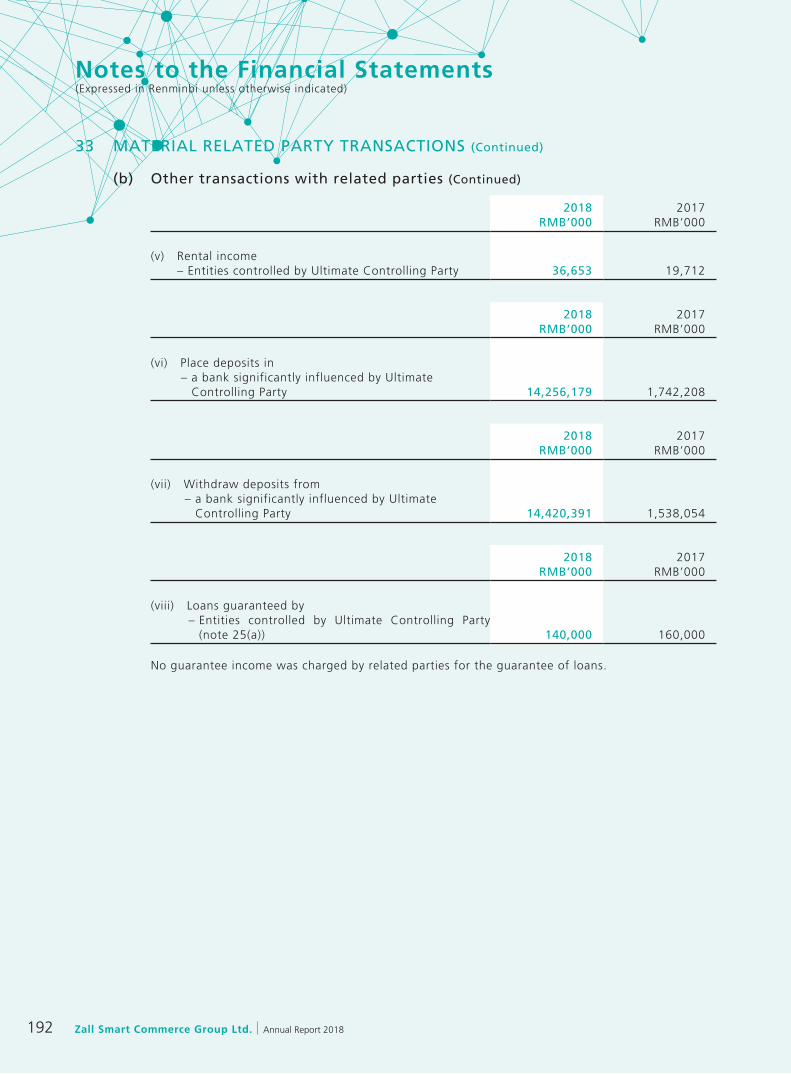
Zall Smart Commerce Group Ltd. Annual Report 2018192
Notes to the Financial Statements(Expressed in Renminbi unless otherwise indicated)
33 MATERIAL RELATED PARTY TRANSACTIONS (Continued)
(b) Other transactions with related parties (Continued)
2018 2017RMB’000 RMB’000
(v) Rental income– Entities controlled by Ultimate Controlling Party 36,653 19,712
2018 2017RMB’000 RMB’000
(vi) Place deposits in– a bank significantly influenced by Ultimate
Controlling Party 14,256,179 1,742,208
2018 2017RMB’000 RMB’000
(vii) Withdraw deposits from– a bank significantly influenced by Ultimate
Controlling Party 14,420,391 1,538,054
2018 2017RMB’000 RMB’000
(viii) Loans guaranteed by– Entities controlled by Ultimate Controlling Party
(note 25(a)) 140,000 160,000
No guarantee income was charged by related parties for the guarantee of loans.
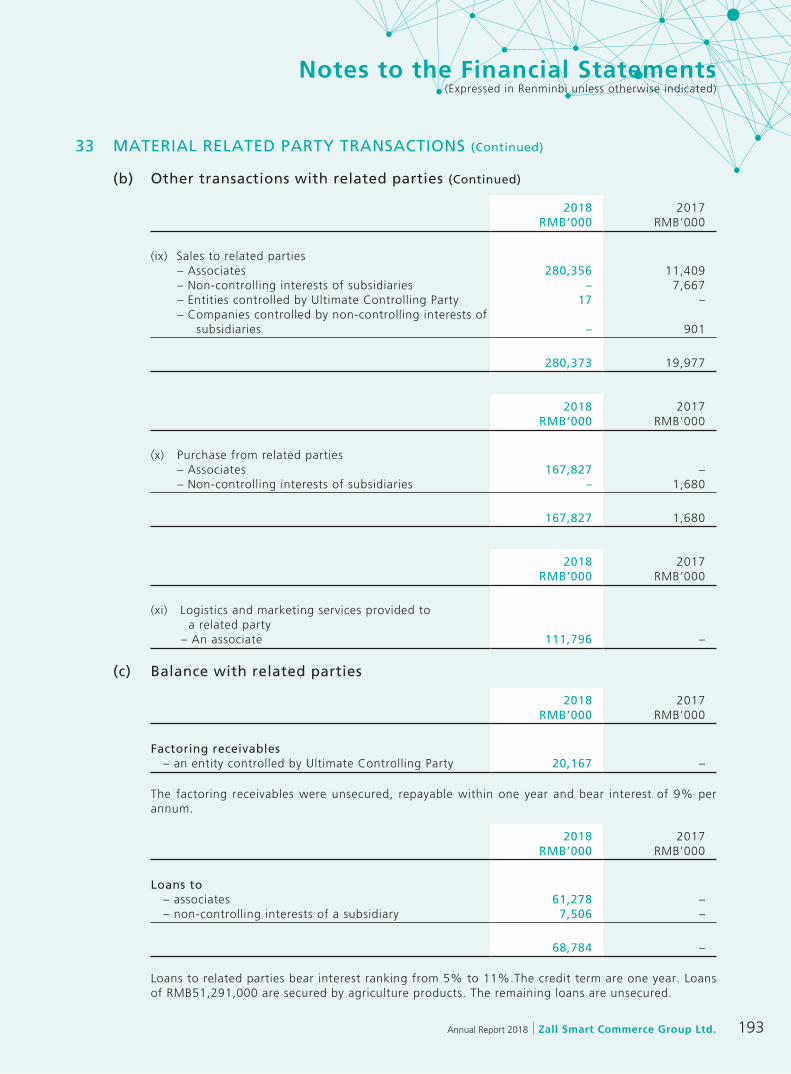
193Annual Report 2018 Zall Smart Commerce Group Ltd.
Notes to the Financial Statements(Expressed in Renminbi unless otherwise indicated)
33 MATERIAL RELATED PARTY TRANSACTIONS (Continued)
(b) Other transactions with related parties (Continued)
2018 2017RMB’000 RMB’000
(ix) Sales to related parties– Associates 280,356 11,409– Non-controlling interests of subsidiaries – 7,667– Entities controlled by Ultimate Controlling Party 17 –– Companies controlled by non-controlling interests of subsidiaries – 901
280,373 19,977
2018 2017RMB’000 RMB’000
(x) Purchase from related parties– Associates 167,827 –– Non-controlling interests of subsidiaries – 1,680
167,827 1,680
2018 2017RMB’000 RMB’000
(xi) Logistics and marketing services provided to a related party
– An associate 111,796 –
(c) Balance with related parties
2018 2017RMB’000 RMB’000
Factoring receivables – an entity controlled by Ultimate Controlling Party 20,167 –
The factoring receivables were unsecured, repayable within one year and bear interest of 9% per annum.
2018 2017RMB’000 RMB’000
Loans to – associates 61,278 – – non-controlling interests of a subsidiary 7,506 –
68,784 –
Loans to related parties bear interest ranking from 5% to 11%.The credit term are one year. Loans of RMB51,291,000 are secured by agriculture products. The remaining loans are unsecured.

Zall Smart Commerce Group Ltd. Annual Report 2018194
Notes to the Financial Statements(Expressed in Renminbi unless otherwise indicated)
33 MATERIAL RELATED PARTY TRANSACTIONS (Continued)
(c) Balance with related parties (Continued)
2018 2017RMB’000 RMB’000
Trade prepayment to – associates 23,963 – – an entity controlled by Ultimate Controlling Party 17 –
23,980 –
2018 2017RMB’000 RMB’000
Amounts due from related parties – associates 86,154 30,855 – joint ventures 71,139 10,874 – non-controlling interests of subsidiaries 30,603 34,360 – entities controlled by Ultimate Controlling Party 4,259 2,427 – entities controlled by non-controlling interests of subsidiaries – 4,244 – key management personnel 1,138 –
193,293 82,760
The amounts due from related parties are unsecured, interest free and repayable on demand.
2018 2017RMB’000 RMB’000
Deposits in – a bank significantly influenced by Ultimate Controlling Party 39,942 204,154
2018 2017RMB’000 RMB’000
Contract liabilities – Trade of agriculture products – an associate 27,439 –
2018 2017RMB’000 RMB’000
Interest-bearing borrowings – an associate (note 25(b)) 11,000 –

195Annual Report 2018 Zall Smart Commerce Group Ltd.
Notes to the Financial Statements(Expressed in Renminbi unless otherwise indicated)
33 MATERIAL RELATED PARTY TRANSACTIONS (Continued)
(c) Balance with related parties (Continued)
2018 2017RMB’000 RMB’000
Amounts due to related parties – associates 2,260 – – Joint ventures – 146,870 – non-controlling interests of subsidiaries 307,026 308,279 – entities controlled by Ultimate Controlling Party 277,105 160 – entities controlled by non-controlling interests of subsidiaries – 114,200 – Ultimate controlling party 3,900 3,900 – Immediate Parent 366,100 – – Key management personnel – 10,000
956,391 583,409
The amounts due to related parties are unsecured, interest-free and repayable on demand.
(d) Applicability of the Listing Rules relating to connected transactions
Save for the related party transactions in respect of transactions 33(b)(v), 33(b)(vi) and 33(b)(vii) above, none of the related party transactions set out above constitutes connected transactions or continuing connected transactions of the Company under Chapter 14A of the Listing Rules. For details of the related party transactions 33(b)(v), 33(b)(vi) and 33(b)(vii) above, please refer to the section “Connected Transaction” of the Directors’ Report. The Company has complied with the disclosure requirements in accordance with Chapter 14A of the Listing Rules with respect to the connected transactions and continuing connected transactions of the Group.
34 ACQUISITION OF SUBSIDIARIES
Acquisition of HSH
On 11 October 2017, the Group entered into an agreement in relation to acquisition of 209,581,251 ordinary shares in HSH (equivalent to 66.21% of total equity interest of HSH) at an aggregate consideration of US$29,500,000 (equivalent to approximately RMB192,759,000). HSH, a company incorporated in the Cayman Islands with limited liability, together with its subsidiaries, is principally engaged in the trading of chemical and plastic raw materials and operating the information services business. The transaction was approved by the shareholder of the Company on 5 March 2018 and was completed on 28 March 2018.
The acquisition of HSH involve post-acquisition performance-based contingent considerations. IFRS3 (Revised) “Business Combinations” requires the recognition of the fair value of those contingent considerations as of their respective dates of business combination as part of the consideration transferred in exchange for the acquired subsidiaries/businesses. These fair value measurements require, among other things, significant estimation of post-acquisition performance of the acquired subsidiaries/businesses and significant judgment on time value of money. Contingent considerations shall be re-measured at their fair value resulting from events or factors which emerge after the date of business combination, with any resulting gain or loss recognised in the consolidated statement of profit or loss in accordance with IFRS 3 (Revised).
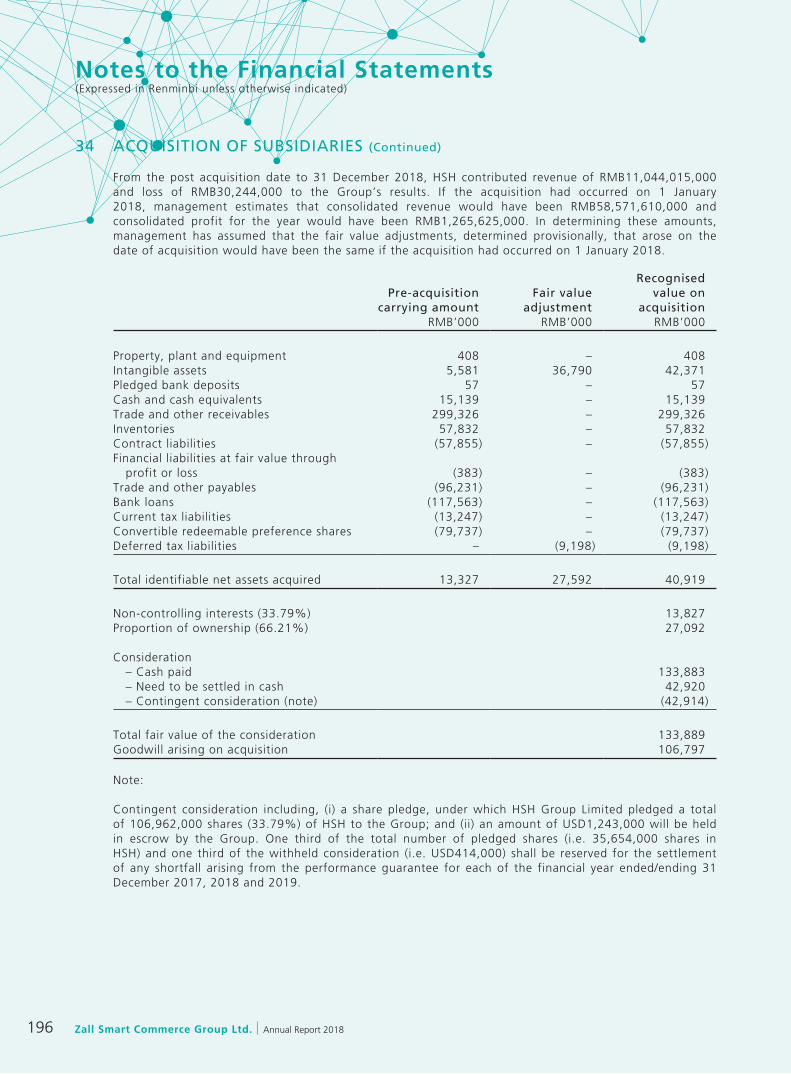
Zall Smart Commerce Group Ltd. Annual Report 2018196
Notes to the Financial Statements(Expressed in Renminbi unless otherwise indicated)
34 ACQUISITION OF SUBSIDIARIES (Continued)
From the post acquisition date to 31 December 2018, HSH contributed revenue of RMB11,044,015,000 and loss of RMB30,244,000 to the Group’s results. If the acquisition had occurred on 1 January 2018, management estimates that consolidated revenue would have been RMB58,571,610,000 and consolidated profit for the year would have been RMB1,265,625,000. In determining these amounts, management has assumed that the fair value adjustments, determined provisionally, that arose on the date of acquisition would have been the same if the acquisition had occurred on 1 January 2018.
Pre-acquisition carrying amount
Fair value adjustment
Recognised value on
acquisitionRMB’000 RMB’000 RMB’000
Property, plant and equipment 408 – 408Intangible assets 5,581 36,790 42,371Pledged bank deposits 57 – 57Cash and cash equivalents 15,139 – 15,139Trade and other receivables 299,326 – 299,326Inventories 57,832 – 57,832Contract liabilities (57,855) – (57,855)Financial liabilities at fair value through profit or loss (383) – (383)Trade and other payables (96,231) – (96,231)Bank loans (117,563) – (117,563)Current tax liabilities (13,247) – (13,247)Convertible redeemable preference shares (79,737) – (79,737)Deferred tax liabilities – (9,198) (9,198)
Total identifiable net assets acquired 13,327 27,592 40,919
Non-controlling interests (33.79%) 13,827Proportion of ownership (66.21%) 27,092
Consideration – Cash paid 133,883 – Need to be settled in cash 42,920 – Contingent consideration (note) (42,914)
Total fair value of the consideration 133,889Goodwill arising on acquisition 106,797
Note:
Contingent consideration including, (i) a share pledge, under which HSH Group Limited pledged a total of 106,962,000 shares (33.79%) of HSH to the Group; and (ii) an amount of USD1,243,000 will be held in escrow by the Group. One third of the total number of pledged shares (i.e. 35,654,000 shares in HSH) and one third of the withheld consideration (i.e. USD414,000) shall be reserved for the settlement of any shortfall arising from the performance guarantee for each of the financial year ended/ending 31 December 2017, 2018 and 2019.

197Annual Report 2018 Zall Smart Commerce Group Ltd.
Notes to the Financial Statements(Expressed in Renminbi unless otherwise indicated)
34 ACQUISITION OF SUBSIDIARIES (Continued)
Goodwill is mainly attributable to the skills and technical talent of HSH’s work force and the synergies expected to be achieved from integrating HSH into the Group’s existing supply chain management and trading business. None of the goodwill recognised is expected to be deductible for tax purposes. Non-controlling interests recognised at the acquisition date were measured by reference to the non-controlling interests’ proportionate share of the acquiree’s identifiable net assets.
The valuation techniques used for measuring the fair value of material asset acquired and contingent consideration were as follows:
Assets Acquired Valuation Approach and Methodology
Intangible assets-customer relationship Estimated using excess earning approach, under which associated contributory assets returns are deduced from projected income stream to measure cash flow attributable to subject assets, and discounted projected excess earning by risk-adjusted discount rate.
Intangible assets-trademarks Estimated using relief from royalty approach, under which projected royalty income is estimated based on comparable royalty rates, and discounted projected after-tax royalty income by risk-adjusted discount rate.
Contingent consideration The fair value of contingent consideration is determined using probabilistic method based on different scenarios of financial forecasts of HSH and respective occurrence probability.
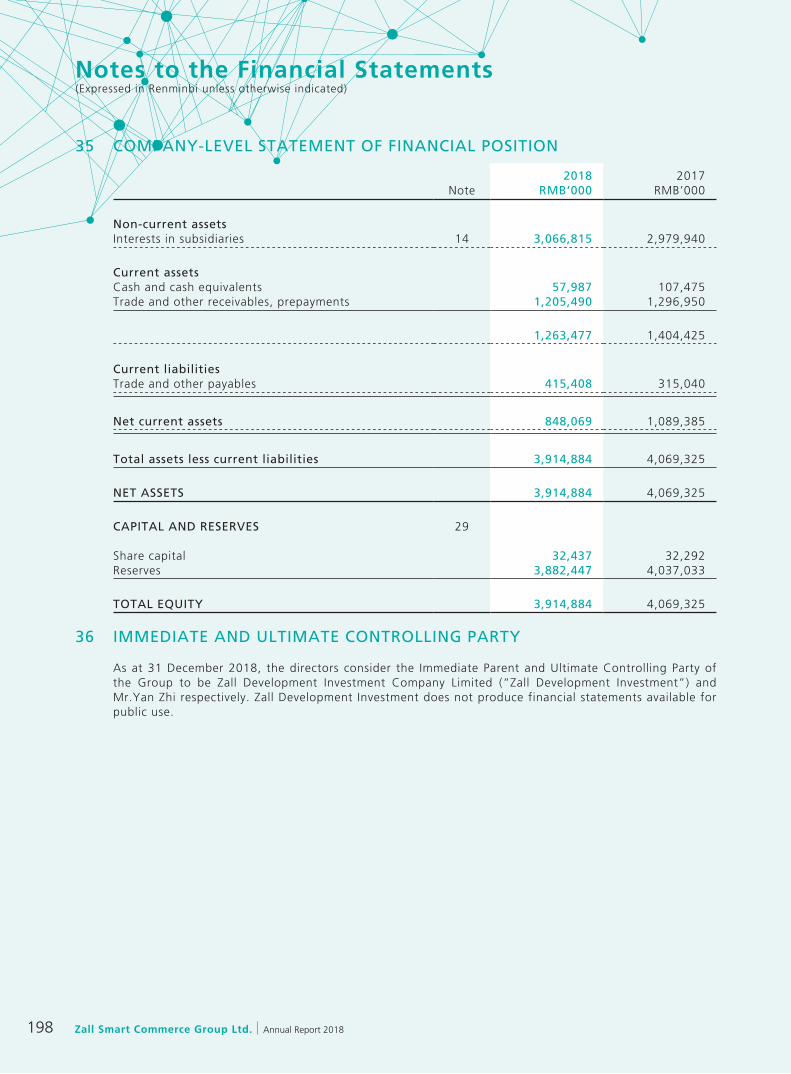
Zall Smart Commerce Group Ltd. Annual Report 2018198
Notes to the Financial Statements(Expressed in Renminbi unless otherwise indicated)
35 COMPANY-LEVEL STATEMENT OF FINANCIAL POSITION
2018 2017Note RMB’000 RMB’000
Non-current assetsInterests in subsidiaries 14 3,066,815 2,979,940
Current assetsCash and cash equivalents 57,987 107,475Trade and other receivables, prepayments 1,205,490 1,296,950
1,263,477 1,404,425
Current liabilitiesTrade and other payables 415,408 315,040
Net current assets 848,069 1,089,385
Total assets less current liabilities 3,914,884 4,069,325
NET ASSETS 3,914,884 4,069,325
CAPITAL AND RESERVES 29
Share capital 32,437 32,292Reserves 3,882,447 4,037,033
TOTAL EQUITY 3,914,884 4,069,325
36 IMMEDIATE AND ULTIMATE CONTROLLING PARTY
As at 31 December 2018, the directors consider the Immediate Parent and Ultimate Controlling Party of the Group to be Zall Development Investment Company Limited (“Zall Development Investment”) and Mr.Yan Zhi respectively. Zall Development Investment does not produce financial statements available for public use.

199Annual Report 2018 Zall Smart Commerce Group Ltd.
Notes to the Financial Statements(Expressed in Renminbi unless otherwise indicated)
37 COMPARATIVE FIGURES
The Group has initially applied IFRS 15 and IFRS 9 at 1 January 2018. Under the transition methods chosen, comparative information is not restated. Further details of the changes in accounting policies are disclosed in note 1(c).
38 POSSIBLE IMPACT OF AMENDMENTS, NEW STANDARDS AND INTERPRETATIONS ISSUED BUT NOT YET EFFECTIVE FOR THE YEAR ENDED 31 DECEMBER 2018
Up to the date of issue of these financial statements, the IASB has issued a number of amendments, new standards and interpretations which are not yet effective for the year ended 31 December 2018 and which have not been adopted in these financial statements. These include the following which may be relevant to the Group.
Effective for accounting
periods beginning on or
after
IFRS 16, Leases 1 January 2019IFRIC 23, Uncertainty over income tax treatments 1 January 2019Annual Improvement to IFRSs 2015-2017 Cycle 1 January 2019Amendments to IAS 28, Long-term interest in associates and joint ventures 1 January 2019
The Group is in the process of making an assessment of what the impact of these amendments, new standards and interpretations is expected to be in the period of initial application. So far the Group has identified some aspects of the new standards which may have a significant impact on the consolidated financial statements. Further details of the expected impacts are discussed below. While the assessment has been substantially completed for IFRS 16, the actual impacts upon the initial adoption of this standard may differ as the assessment completed to date is based on the information currently available to the Group, and further impacts may be identified before the standard is initially applied in the Group’s interim financial report for the six months ended 30 June 2019. The Group may also change its accounting policy elections, including the transition options, until the standard is initially applied in that financial report.
IFRS 16, Leases
As disclosed in note 1(l), currently the Group classifies leases into finance leases and operating leases and accounts for the lease arrangements differently, depending on the classification of the lease. The Group enters into some leases as the lessor and others as the lessee.

Zall Smart Commerce Group Ltd. Annual Report 2018200
Notes to the Financial Statements(Expressed in Renminbi unless otherwise indicated)
38 POSSIBLE IMPACT OF AMENDMENTS, NEW STANDARDS AND INTERPRETATIONS ISSUED BUT NOT YET EFFECTIVE FOR THE YEAR ENDED 31 DECEMBER 2018 (Continued)
IFRS 16 is not expected to impact significantly on the way that lessors account for their rights and obligations under a lease. However, once IFRS 16 is adopted, lessees will no longer distinguish between finance leases and operating leases. Instead, subject to practical expedients, lessees will account for all leases in a similar way to current finance lease accounting, i.e. at the commencement date of the lease the lessee will recognise and measure a lease liability at the present value of the minimum future lease payments and will recognise a corresponding “right-of-use” asset. After initial recognition of this asset and liability, the lessee will recognise interest expense accrued on the outstanding balance of the lease liability, and the depreciation of the right-of-use asset, instead of the current policy of recognising rental expenses incurred under operating leases on a systematic basis over the lease term. As a practical expedient, the lessee can elect not to apply this accounting model to short-term leases (i.e. where the lease term is 12 months or less) and to leases of low-value assets, in which case the rental expenses would continue to be recognised on a systematic basis over the lease term.
IFRS 16 will primarily affect the Group’s accounting as a lessee of leases for properties, plant and equipment which are currently classified as operating leases. The application of the new accounting model is expected to lead to an increase in both assets and liabilities and to impact on the timing of the expense recognition in the statement of profit or loss over the period of the lease.
IFRS 16 is effective for annual periods beginning on or after 1 January 2019. As allowed by IFRS 16, the Group plans to use the practical expedient to grandfather the previous assessment of which existing arrangements are, or contain, leases. The Group will therefore apply the new definition of a lease in IFRS 16 only to contracts that are entered into on or after the date of initial application. In addition, the Group plans to elect the practical expedient for not applying the new accounting model to short-term leases and leases of low-value assets.
The Group plans to elect to use the modified retrospective approach for the adoption of IFRS 16 and will recognise the cumulative effect of initial application as an adjustment to the opening balance of equity at 1 January 2019 and will not restate the comparative information. As disclosed in note 31(a), at 31 December 2018 the Group’s future minimum lease payments under non-cancellable operating leases amount to RMB35,745,000 for properties, the majority of which is payable between 1 and 5 years after the reporting date. Upon the initial adoption of IFRS 16, the opening balances of lease liabilities and the corresponding right-of-use assets will be adjusted to RMB33,430,000, after taking account the effects of discounting, as at 1 January 2019.
Other than the recognition of lease liabilities and right-of-use assets, the Group expects that the transition adjustments to be made upon the initial adoption of IFRS 16 will not be material. However, the expected changes in accounting policies as described above could have a material impact on the Group’s financial statement from 2019 onwards.

201Annual Report 2018 Zall Smart Commerce Group Ltd.
Major Properties InformationAs at 31 December 2018
THE GROUP’S PROPERTY PORTFOLIO SUMMARY — MAJOR PROPERTIES UNDER DEVELOPMENT
Expected Gross Floor Group’s Compleiton date of Intended Site area Area interest percentage Project Location completion use (sq.m.) (sq.m.) (%)
1 Portion of North Hankou Liudian and Shekou Villages, Dec-2020 Commercial 256,720 318,366 100% 10%-80% International Trade Panlongcheng Economics and Center Technology Development Zone, Technology Development Zone, Province, PRC
2 No. 1 Enterprise Te No. 1 Chutian Road, Dec-2020 Residential 394,882 618,883 100% 10% Community (Phase IV) Panlongcheng Economics and Technology Development Zone, Huangpi District, Wuhan, Hubei Province, PRC
3 Zall Life City – Hupan Panlongcheng Economics and Jun-2020 Residential 59,793 117,102 100% 76% Haoting Residences Technology Development Zone, (Phase II) Huangpi District, Wuhan, Hubei
4 No.1 Enterprise Zhiji Village, Xingangzhen Kaifu Jun-2024 Commercial 120,652 278,352 80% 11% Community – Changsha District, Changsha, Hunan (Phase II) Province, PRC
5 Portion of Jingzhou Zall Jinan Zhen, Sanhong Village, Jun-2020 Commercial 137,802 229,006 100% 94% City Jingzhou District, Jingzhou City, Hubei Province, PRC
6 Tianjin E-commerce Mall Xijing District, Qingwu Xuefu Dec-2019 Commercial and 24,505 39,244 100% 90% (Area C) Industrial Park, Tianjin City, PRC residential
7 Wuhan Inland Port Centre Shigang Village, Yangluo Street, Aug-2019 Logistic Center 364,358 126,857 100% 75% (Phase I) Xinzhou District, Wuhan, Hubei Province, PRC
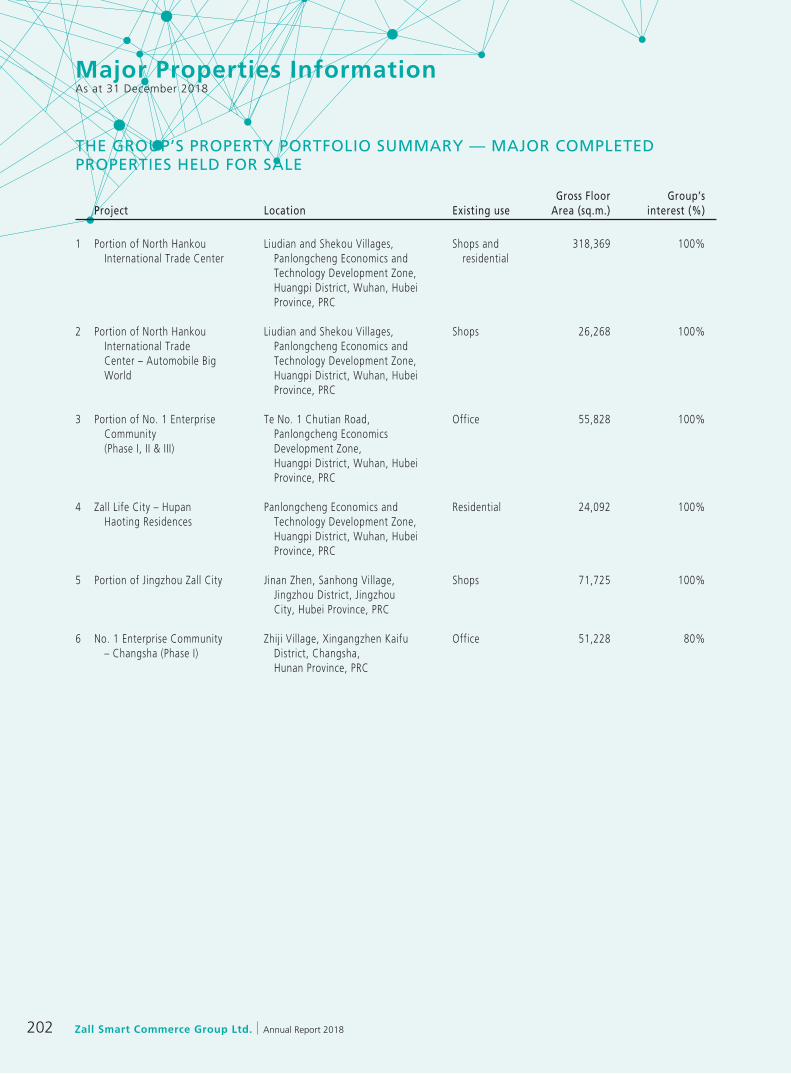
Zall Smart Commerce Group Ltd. Annual Report 2018202
Major Properties InformationAs at 31 December 2018
THE GROUP’S PROPERTY PORTFOLIO SUMMARY — MAJOR COMPLETED PROPERTIES HELD FOR SALE
Gross Floor Group’s Project Location Existing use Area (sq.m.) interest (%)
1 Portion of North Hankou Liudian and Shekou Villages, Shops and 318,369 100% International Trade Center Panlongcheng Economics and residential Technology Development Zone, Huangpi District, Wuhan, Hubei Province, PRC
2 Portion of North Hankou Liudian and Shekou Villages, Shops 26,268 100% International Trade Panlongcheng Economics and Center – Automobile Big Technology Development Zone, World Huangpi District, Wuhan, Hubei Province, PRC
3 Portion of No. 1 Enterprise Te No. 1 Chutian Road, Office 55,828 100% Community Panlongcheng Economics (Phase I, II & III) Development Zone, Huangpi District, Wuhan, Hubei Province, PRC
4 Zall Life City – Hupan Panlongcheng Economics and Residential 24,092 100% Haoting Residences Technology Development Zone, Huangpi District, Wuhan, Hubei Province, PRC
5 Portion of Jingzhou Zall City Jinan Zhen, Sanhong Village, Shops 71,725 100% Jingzhou District, Jingzhou City, Hubei Province, PRC
6 No. 1 Enterprise Community Zhiji Village, Xingangzhen Kaifu Office 51,228 80% – Changsha (Phase I) District, Changsha, Hunan Province, PRC

203Annual Report 2018 Zall Smart Commerce Group Ltd.
Major Properties InformationAs at 31 December 2018
THE GROUP’S PROPERTY PORTFOLIO SUMMARY — MAJOR PROPERTIES HELD FOR INVESTMENT
Lease Approximate Stage of Term of gross floor Group’s Project Location completion land area (sq.m.) interest (%)
1 Portion of North Hankou Liudian and Shekou Villages, Completed Medium 1,318,659 100% International Trade Panlongcheng Economic and Center Technology Development Zone, Huangpi District, Wuhan, Hubei Province, PRC
2 Portion of North Hankou Te No. 1 Chutian Road, Under Medium 3,898 100% International Trade Panlongcheng Economic and development Center Technology Development Zone, Huangpi District, Wuhan, Hubei Province, PRC
3 Portion of North Hankou Liudian and Shekou Villages, Completed Medium 201,702 100% International Trade Panlongcheng Economic and Center Technology Development Zone, Huangpi District, Wuhan, Hubei Province, PRC
4 North Hankou Logistics Panlongcheng Economic and Completed Medium 25,550 100% Center Technology Development Zone, Huangpi District, Wuhan, Hubei Province, PRC
5 North Hankou Logistics Jiangjunlu street, Dongxihu Under Medium 18,354 100% Center District, Wuhan, Hubei development Province, PRC
6 Portion of No. 1 Building Te No. 1 Chutian Road, Completed Medium 45,672 100% Portion of No. 1 Building Panlongcheng Economic and Community Technology Development Zone, Huangpi District, Wuhan, Hubei Province, PRC
7 Portion of Commercial No. 18 Julong Road, Completed Medium 9,315 100% Street of No. 1 Enterprise Panlongcheng Economics Community and Technology Development Zone, Huangpi District, Wuhan, Hubei Province, PRC
8 Portion of Tianjin Phase I, International Trade Under Medium 519,458 100% E-commerce Mall Centre, Tianjin E-commerce development (Area A & B) City, 32 Chuangxin Road, Xijing District, Tianjin City, PRC

Zall Smart Commerce Group Ltd. Annual Report 2018204
Financial Summary
2018 2017 2016 2015 2014 RMB’000 RMB’000 RMB’000 RMB’000 RMB’000
ResultRevenue 56,116,072 22,249,176 1,213,375 1,029,482 1,986,129Gross Profit 1,559,600 1,012,255 361,307 271,210 976,104Net valuation gain on investment properties 3,865,192 3,021,326 1,275,697 1,237,742 2,157,336
Profit for the year attributable to:Equity shareholders of the Company 1,371,304 2,379,077 2,048,951 2,037,727 1,572,819Non-controlling interests (97,397) (22,595) 7,620 8,261 37,905
Profit for the year 1,273,907 2,356,482 2,056,571 2,045,988 1,610,724
Financial positionTotal assets 53,081,118 47,343,628 29,747,649 23,769,619 22,176,014Total liabilities 33,472,305 28,682,741 17,608,417 13,459,088 13,613,874
Non-controlling interests 829,221 879,677 34,685 842,063 644,239Total equity attributable to equity shareholders of the Company 18,779,592 17,781,210 12,104,547 9,468,468 7,917,901
Total Equity 19,608,813 18,660,887 12,139,232 10,310,531 8,562,140