PRODUCTION OF x+, K+, p, Ko md A“ IN HADRONIC 2 ... OF x+, K+, p, Ko md A “ IN HADRONIC 2...
23
SLAC-PUB-6920 July 1995 PRODUCTION OF x+, K+, p, Ko md A“ IN HADRONIC 2° DECAYS* The SLD CoUaboration”* Stanford Linear Accderator Center Stanford University, Stanford, CA 94309 ABSTUCT We have measured production rates and spectra of T*, K*, p/~, Ko and AO/~O in fight- and heavy-flavor hadronic 2° decays and for particles and antiparticles sepa- ratdy in quark jets. The SLD Cherenkov fig baging Detector was used to identify charged hadrons. Samples enriched in fight (uds) and b events were tagged using im- - pact parameters of charged tracks, and a sample enriched in quark (over antiquark) jets was tagged using the electron beam poltiation. We observe a de= flavor dependence in production rates and spectrum shapes, but ody a smd effect in f =b(l/zP) peak positions. Dfierences between baryon and mtibaryon spectra in quark jets offer tiect cobation that faster particles are more Uely to contain the titid quark. Contributed to the Intern3tion31 Europhysics Conference on High Energ) Physics (HEP 95), Brussels, Belgiwm, July 27 - August 2, 1995 ‘This work w= supported by Department of Energy contracts: D& FG02-91ER40676 (BL), DEFG03-92ER40701 (CIT), D& FG03-91ER40618 (UCSB), DBFG03-92ER40689 (UCSC)) DE- FG03-93ER40788 (CSU), DBFG02-91ER40672 (Colorado), DGFG02-91ER40677 (Illinois), DB AC03-76SFOO098 (LBL), DLFG02-92ER40715 (M~sachusetts), DB.4C02-76ER03069 (lfIT) DEFGO&85ER40224 (Oregon), D& AC03-76SFO0515 (SLAC), DGFG05-91ER40627 (Tenn=ee), D~AC02-76ERO0881 (Wisconsin), D& FG02-92ER40704 (Yale); National Science Foundation grants: PHY-91-13428 (UCSC), PHY-89-21320 (Columbia), P~-92-04239 (Cincinnati), PHY-8&17930 (Rutgers), PHY-8&19316 (Vanderbilt), PHY-92-03212 (W=hington); the UK Science and Enginwrbg &arch Council (Brunei and WL); the Istituto N=ionale di Fisica Nucleare of Italy (Bologna, Ferrara, Fr=cati, Pisa, Padova, Perugia); and the Japan-US Cooperative -arch Project on High Energy Physi~ (Nagoya, Tohoku).
Transcript of PRODUCTION OF x+, K+, p, Ko md A“ IN HADRONIC 2 ... OF x+, K+, p, Ko md A “ IN HADRONIC 2...

SLAC-PUB-6920
July 1995
PRODUCTION OF x+, K+, p, Ko md A“ IN
HADRONIC 2° DECAYS*
The SLD CoUaboration”*
Stanford Linear Accderator Center
Stanford University, Stanford, CA 94309
ABSTUCT
We have measured production rates and spectra of T*, K*, p/~, Ko and AO/~O
in fight- and heavy-flavor hadronic 2° decays and for particles and antiparticles sepa-
ratdy in quark jets. The SLD Cherenkov fig baging Detector was used to identify
charged hadrons. Samples enriched in fight (uds) and b events were tagged using im- -
pact parameters of charged tracks, and a sample enriched in quark (over antiquark) jets
was tagged using the electron beam poltiation. We observe a de= flavor dependence
in production rates and spectrum shapes, but ody a smd effect in f =b(l/zP) peak
positions. Dfierences between baryon and mtibaryon spectra in quark jets offer tiect
cobation that faster particles are more Uely to contain the titid quark.
Contributed to the Intern3tion31 Europhysics Conference on High Energ) Physics(HEP 95), Brussels, Belgiwm, July 27 - August 2, 1995
‘This work w= supported by Department of Energy contracts: D& FG02-91ER40676 (BL),
DEFG03-92ER40701 (CIT), D& FG03-91ER40618 (UCSB), DBFG03-92ER40689 (UCSC)) DE-
FG03-93ER40788 (CSU), DBFG02-91ER40672 (Colorado), DGFG02-91ER40677 (Illinois), DB
AC03-76SFOO098 (LBL), DLFG02-92ER40715 (M~sachusetts), DB.4C02-76ER03069 (lfIT)
DEFGO&85ER40224 (Oregon), D& AC03-76SFO0515 (SLAC), DGFG05-91ER40627 (Tenn=ee),
D~AC02-76ERO0881 (Wisconsin), D& FG02-92ER40704 (Yale); National Science Foundation grants:
PHY-91-13428 (UCSC), PHY-89-21320 (Columbia), P~-92-04239 (Cincinnati), PHY-8&17930
(Rutgers), PHY-8&19316 (Vanderbilt), PHY-92-03212 (W=hington); the UK Science and Enginwrbg
&arch Council (Brunei and WL); the Istituto N=ionale di Fisica Nucleare of Italy (Bologna,
Ferrara, Fr=cati, Pisa, Padova, Perugia); and the Japan-US Cooperative -arch Project on High
Energy Physi~ (Nagoya, Tohoku).

,
1 Introduction
The production of find state hadrons from ititid hard partons, e.g. the quark and
antiquark in e+e– - 2° + q~, is currently bdeved to proceed in three stages. The
fist stage hvolves the radiation of ~uons from the primary quark and antiquark, which
in turn radiate ~uons or spbt into q~ pairs untfl their titudty approaches the hadron
mass scale. Such a ‘parton showerm is cdcdable in perturbative QCD, for example in
the Modified Leading Logarithm Approximation [1]. The next stage, in wfich these soft
partons turn into ‘primary” hadrons, is not understood quantitatively, although several
hadronization modek exist. The ansatz of Local Parton-Hadron Dufity (LPHD) [1],
namely that the distribution for a given hadron species is directly proportional to the
parton distribution at some appropriate virtu~ty, dews the prediction of the shapes
of primary hadron momentum spectra, and of the energy- and mass-dependences of
their peaks.
The third stage, in which unstable primary hadrons decay into bd state hadrons,
complicates the interpretation of inclusive measurements. It is desirable to remove the
effects of these decays when comparing with the predictions of QCD+ LPHD. Addi-
tiond comp~cations arise in jets initiated by heavy quarks in which the leading heavy
hadrons carry a large fraction of the beam energy, restricting that avdable
primary particles, and then decay into a number of secondary particles.
Measurements of the production rates and spectra of identified particles
to other
are use-
M for constraining models and testing the predictions of QCD+ LPHD. Several such
measurements have been reported in e+e- anfiation and QCD+LPHD has been
successfd in describing the shape and energy dependence of inclusive momentum spec-
tra as we~ as those of identfied charged and neutral hadrons [2]. At a given CM
energy W, the spectrum for identified pions peaks at a higher due of f = k(W/2p),
where p is particle momentum, than the spectra of tigher mass particle types; however
tittle
SET
mass dependence is observed between these other species. The
hadronization model to correct for the effect of primary hadron
2
use of the JET-
decays h= been

.
shown [3] to introduce a mass dependence; direct observation of this effect is desirable.
Previous measurements have used samples of jets initiated by equal numbers of pr-
imary quarks and antiquarks. Comparison of the spectrum of a given particle with that
of its antiparticle in a pure sample of quark jets wodd provide additiond information
on the hadronization process. Baryons are particdarly usefd for this as a baryon can
contain a primary quark but an antibaryon cannot.
h this paper we present an analysis of% *, K*, p/F, Ko, and AO/~o production in
hadronic 2° decays co~ected by the SLC Large Detector (SLD). The analysis is based
upon the approximatdy 150,000 hadronic events obtained in ms of the SLAC Linear
CoMder (SLC) between 1993 and 1995. We measure production rates and momentum
spectra in a ‘~obd~ sample of d hadronic events and &o in high-purity samples of
‘fight” (Z” ~ uti, d~, SZ) and ‘b)’ (Z” + b~) events. The tight sample is largely free
from effects of heavy quark production and decay, but contains decay products of other
unstable primary hadrons. In addition we compare the baryon (p and A) spectra with
those of their antiparticles in a high-purity sample of quark jets, selected using the large
production =ymmetry in polar an~e induced by the SLC dectron beam polarization.
2 The SLD and Hadronic Event Selection
This analysis of data from the SLD mdti-purpose detector [4] used charged tracks mea-
sured in the Central Drift Chamber (CDC) [5] and sficon Vertex Detector (VXD) [6].
The CDC consists of 80 layers of tid or stereo sense wires in a uniform axial mag-
netic field of 0.6 T. The VXD is composed of CCDS contacting a total of 120 fion
22x 22 pm pix& arranged in four concentric layers of rdus between 2.9 and 4.2 cm.
kduding the mcertainty on the primary interaction point (IP), the CDC and VXD
give a combined hpact parameter resolution of ll@76/(pl m) pm, where pl is
the track momentm transverse to the beam tis in GeV/c.
IdentMcation of charged tracks is accomplished with the Cherenkov fig kaging

Detector (C~D) [7]. Through the combined use of fiquid C6Flq and gaseous CSF12
radiators, it is designed to perform efficient charged r/K/p separation over most of
the momentum range up to 46 GeV. Charged particles above Cherenkov threshold
passtig through the radiators etit photons, which are imaged through quartz windows
into time projection chmbers (TPCs) contting a photosensitive gas. The resdting
photoelectrons drift to tie chambers where the conversion point of each is measured
in three&ensions using drift time, wire address and charge &vision. These positions
are used to reconstruct a Cherenkov an~e with respect to each ~rapolated charged
track.
The barrel CMD was fdy operational for most of the 1993-5 runs and was used in
this analysis. The barrel fiquid (gas) radiators cover the polar angle ruge ] cos 61<0.75
(0.67). The Lquid (gas) ind= of refraction was measured to be 1.282 (1.00165), cor-
responding to T/K/p thresholds of 0.17/0.62/1.17 (2.4/8.6/16.3) GeV/c. The average
detected photon yield was 12.5 (9) per ffi ring for tracks with high velocity. The
average Cherenkov angle resolution was 16 (5.5) mrad including the effects of residud
misfignments and track =trapolation resolution. The Iocd or intrinsic resolution was
13 (4) mrad, consistent with the design value. The identification performance of the
barrel CWD is described in the nat section.
The trigger and initial selection of hadronic events is described in [8]. The analysis
presented here is based on charged tracks measured in the CDC and VXD. A set of
cuts w= appfied in order to select events we~-contained within the detector acceptance.
Tracks were required to have (i) a closest approach to the beam As within 5 cm, and
witkn 10 cm along the bem &s of the measured interaction point (IP), (ii) a polar
angle O with respect to the beam tis with [cos 81 <0.80, (iii) a *U momentum
transverse to ttis tis of pl >150 MeV/c, and (iv) a mfimum momentm of p <50
GeV/c. Events were required to contain a -urn of seven such tracks, a thrust [9]
fis polar angle with respect to the beam fis #T within [cos 8T[ <0.71, and a *urn
charged visible energy E“is > 18 GeV, where d tracks were assigned the charged pion

.
m~s. A sample comprising 100,720 events passed these cuts. Of these, 76,445 events
were recorded with a ftiy operational C~D with a good drift velocity cfibration.
Samples enriched in fight ad b primary flavors were selected based on impact
parameters of charged tracks me~ured in the VXD. We define n,:~ as the number of
tracks in an event with normtized transverse hpact parameter with respect to the
IP >3. Events with n,ig = O were ~signed to the fight flavor sample and those with
n,ig ~ 3 were assigned to the b sample. The fight and b samples comprised 60,654 and
14,660 events, respectively, and purities of 86% and 90% were estimated born Monte
Carlo simdations. A more detded discussion of flavor tagging can be found in [10].
CoWsions at SLC are produced by hig~y polarized dectron beams. For the 1993
and 1994/5 -s the average beam polarizations were 6370 and 7770, respectively, and
the beam heficity was selected randody between cofisions. The beam polarization
induces a large asymmetry in the polar an~e distributions of quark jets, which prefer
to fo~ow the dectron (positron) beam direction for left- (right-) handed beam. Each
event was divided into two hemispheres by the plane perpendicdar to the thrust As
~ and tracks with Z. ~ > 0 were assumed to have come from a jet with polar angle
6~ = Cos-l (tz/]tl), where t. is the component of the thrust tis along the electron beam -
&rection. The remaiting tracks were assigned Oh = Cos-l (–iz/ ItI). Hemispheres with
cos d~ > 0.2 produced with left-handed beam and those with cos 6h < —0.2 produced
with right-handed beam were tagged as quark jets. Hemispheres opposite quark-tagged
jets were tagged M antiquark jets. A loose fight event tag, requiring n~ig <1, was dso
appfied. The Standard Modd at tree levd predicts the purities of the quark- and
antiquark-tagged samples to be 7070.
3 Charged Hadron fractions
The charged m, K and p analysis was performed separatdy for the fiquid and gas
ra~ators. b order to ensure that the C~D performance was we~-modded by the

.
simdation, tracks were required to traverse m active region of the radiator in question
and to have their expected ring ftiy contained within a five region of the TPCs. The
Lquid analysis was restricted to the 1993 data sample (22,840 events) and tracks were
reqtired to have u associated tium-iotiing hit in a C~D TPC. For the gas
analysis either the rninimurn-iotiing tit or the presence of at least four hits consistent
tith a fiquid ring was required. For momenta bdow 2 GeV/c, ordy negatively charged
tracks were used since tracks arising from interactions in the detector material are
predominantly positive. b each momentum bin we measured the fractions of the
sdected tracks of the types x, K and p. Electrons and muons were not &stin@shed
from pions in this analysis; this sm~ background was estimated from the Monte Carlo
Simdation (MC) and a correction was apptied. The fractions were then mdtipfied by
the total charged hadron spectrum to obtain production cross sections.
Tracks were identified using a Mkefihood technique. For each of the charged particle
hypotheses a EkeMood w= cdcdated based upon the number of detected photo-
dectrons and their measured an~es, the expected number of photons, the expected .
Cherenkov mgle and a loc~y-measured background that included the effects of over-
lapping rings. Particle separation was based upon differences between logarithms of
these three hkefihoods, Lx, LK and LP. For the Equid (gas) analysis, we define a par-
ticle to be identified as type i if Li exceeds both of the other log-hkehhoods by at least
5 (3), corresponding to 3.2(2.4)u separation.
The efficiencies for identifying selected particles of type i as type j, where i, j =
T, K, p, are shown in fig. 1. The correct identification rates peak near 90% ad the pion
coverage is continuous from 0.5 GeV/c up to approximately 25 GeV/c. MisidentMca-
tion rates in the fiquid (gas) are t~icdy less than 3 (5)% with peak dues of up to 5
(9)%. These efficiencies were detertied through detded detector simdation and were
then cdbrated using data. Figure 2 shows the leftmost column of the previous figure
measured using a high-purity sample of pions from K: decays in the data and com-
pared with the same analysis of the MC sample. The MC reproduces the data within

.
statistical errors. Simdated efficiencies were parametrized as a function of momentum
in order to smooth the effect of &ted MC statistics. The form of the parametrization
of the simdated m ~ T efficiency provides a good fit to the efficiencies extracted using
K: decays, and fitted parameter values for MC and data K: are consistent. For the
fiqtid analysis the parametrized MC was therefore used to define the central values
of the efficiencies. For correct identification the statistical errors on parameter values
from the fit to the K: data were used to define the emors on the effitienties, wtich
are shown in fig. 1 and are corrdated point to point. For misidentification a common
rdative error of 0.16 was assumed, corresponding to one-hti of a typical statistical
error on the K: data points. For misidentification in the gas the MC was &o used for
the central values and a common relative error of 0.25 was assigned. The Htited size
of the Kg data sample does not provide a strong constraint on efficiencies in the gas
analysis, so the total rates of identification u my hadron type in the data ~d MC
were” compared. This resdted in a correction of -1.3% to the T ~ r efficiencies in the
threshold region, 3 < p < 10.5 GeV/c, and -370 to d identification efficiencies above
10.5 GeV/c. The larger of the correction itse~ or the statistical error on the total rate ~
in the data was tden as the error on each point and these errors are stron~y positively
correlated.
For each momentum bin the number of observed particles of a given type can be
related to the true production fraction by an efidency matrix, composed of the entries
in fig. 1 for that bin. This matrix was inverted and used to unfold our observed
identified particle rates. This analysis procedure does not reqtire that the sum of the
charged particle fractions be tity; ~stead the s~ W= used ~ a COnSiStenCy che~
and was found to be in good agreement with unity for d momenta.
The measured charged p~tide fractions for hadronic 2° decays are shown in fig. 3.
k some momentum regions we cannot distkguish two of the three species, so the
procedure was reduced to a 2x 2 analysis and we present ody the fraction of the iden-
tified speeies, i.e. protons in the hquid (gas) analysis above 3 (27) GeV/c and pions

in the gas analysis below 10.5 GeV/c. The errors on the fiquid points are dominated
by systematic which are strongly positively correlated point to ‘point and increase in
magnitude with momentum. The errors on the gas points have rougtiy equal statistical
and systematic contributions, with stiar systematic correlation. Pions are seen to
dominate the particle production at low momentum, to dedne steatiy untfl about 10
GeV/c, and to level off at about tw~thirds. The bn fraction rises steamy to about
one-third at high momentum. The proton fraction rises at low momentum, leveb off
ne= one-tenth at about 10 GeV/c, then de&es above 25 GeV/c. were the momen-
tum coverage overlaps, these measued fractions were found to be in agreement with
previous measurements at the 2° [3, 11, 12]. Measurements b=ed on ring imaging and
those based on ionization energy loss rates [11, 12] cover complementary momentum
ranges and can be combined to provide continuous coverage from 200 MeV/c to 35
GeV/c.
4 Neutral V“ Production
To measure the production of A“/~O and Ko, d pairs of oppositely-charged tracks
were considered as ‘V”” candidates if both tracks had (i) at le~t 40 fits in the CDC,
(ii) Icos 61<0.80 and (iii) pl >150 MeV/c. A verta was fitted to each pair and
the probabtity of the resdting X2 was reqtired to be greater than 2%. The vert=
was required to be displaced from the IP by at least 5 standard deviations, which
accepted V“ candidates with fight lengths as low as 0.2 mm. The angle a=v between
the V“ momentum and the vector from the IP to the vert= in the transverse plane was
required to satisfy la.V \< 5 + 50/pl + 12.5/p~ mrad, where pl is the momentum of
the V“ candidate transverse to the beam tis. Candidates were rejected if their verta
was located outside of the VXD but included a track with more than one VXD hit.
Photon conversions were suppressed by reqfig the e+e- kvarimt mass of the
charged track pair to be greater than 70 MeV/&. WnematicWy-overlapped K: were

rejected from the A“ sample by rejecting W pairs whose ZT invariant m~s was within
3U of the K: mass, wfich removed approximately 30% of the A“ sample. A“ were
removed from the K: sample by requiring [ cos 6“ I < 0.8, where 4“ is the angle between
the positively charged track and the V“ fight direction in the m+~– rest frame, resdting
in a 2070 loss of the K: signal.
The remaining V“ candidates were &tided into bins in both scaled momentum
ZP = 2p/W and ~ = b(W/2p). b each bin the numbers of obsened K: and A“ were
derived from the m~ and ~ invariant mass distributions, respectively, where the faster
track was assigned the proton mass. These numbers were divided by reconstruction
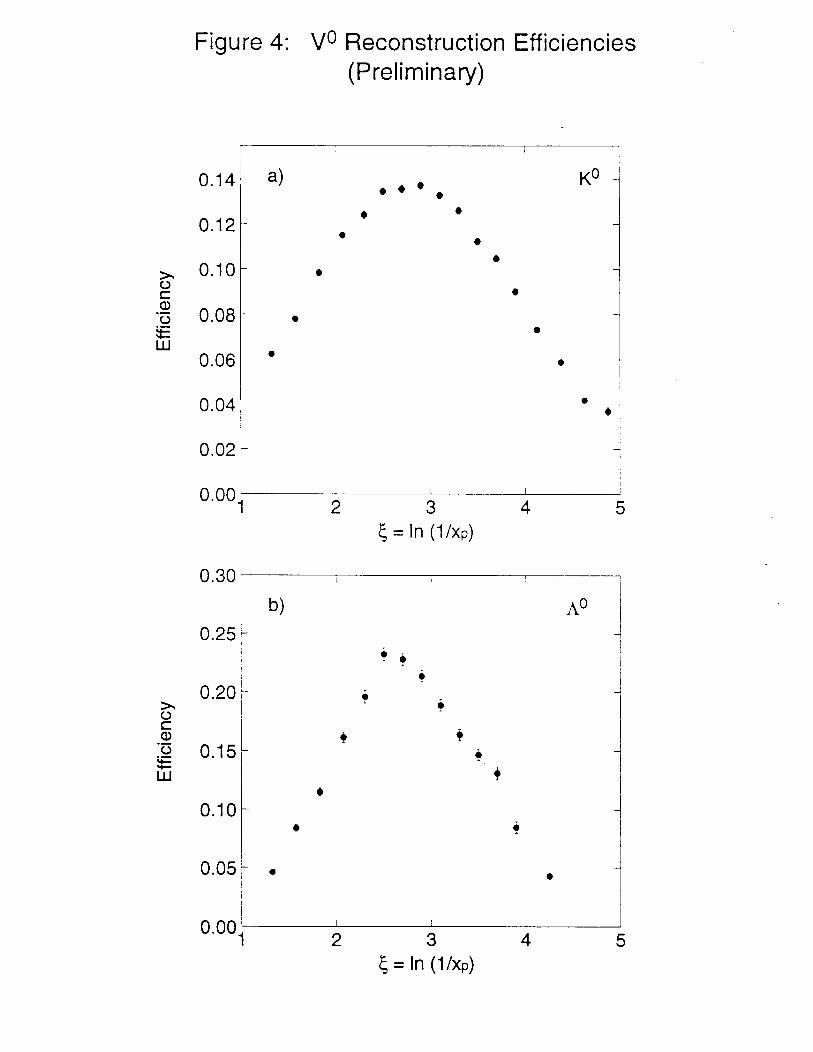
efficiencies estimated from MC to yield production spectra. The reconstruction effi-
ciencies are shown as a function of ~ in fig. 4. As a check the K: and A“ hfetimes were
measured to be ~K: = 2.59 + 0.07 and ~AO = 7.25 + 0.38( stat,) cm in agreement with
world average values [13].
5 Results
Figure 5 shows the production cross sections as a function of scaled momentum ZP =
2p/W for the five me~ured species. For the charged species, cross-sections were ob-
tained by mdtiplying the measured fractions by the total hadrotic cross-section gen-
erated by the JETSET 7.4 sirntiation progr~, which protides a good description of
data at the 2° [14]. The cross sections for charged and neutral kaon production are
consistent. Table 1 shows the tot d production rate per event of each species over the
momentum ruge wtich we measure. The errors are dominated by overd norrn&za-
tion uncertainties.
For comparison with QCD+LPHD predictions the analysis was repeated as a func-
tion of f = h(l/zP). The resdting spectra are shown in fig. 6 and were fitted using
Gaussian approtiations to the prediction [1]. This shape describes the data ade-
quatdy within our point-t~point errors. For the neutr~ and the charged pions the
9

>
data cover the peak we~ and Table 2 fists the peak positions <* obtained horn these fits.
The systematic error is due to variation of the fit range and, in the cme of the charged
pions, the &fference between a fit to the Hquid points ody and a fit in wtich the fiquid
points were deweighted by a factor of 5. We note that fits to the charged kn and
proton spectra give resdts sidar to the neutral kaons and larnbd~, respectivdy.
The pions peak at &gher f (lower momentum) than the other particles, as predicted
by QCD+ LPHD; however, we do not see a substantial peak stit between the kaons
and the baryons. These resdts are in agreement with pretious measurements [3].
Momentum Production Rates per
Particle Range (GeV/c) Hadronic Event
T* 0.7-27 11.12&0.35K+ 0.753 o.74&o.09
K& 10.5-27 o.19ko.02
PIP 1.25-5.5 0.48&0.05
P/F 10.5-36 o.07&o.olKo 0.5-13.7 1.75&o.07
AO/fio 0.5-13.7 0.34&0.02
Table 1: Prefirninary production rates of identified particles in hadrotic 2° decays.
The errors are dominated by overd systematic errors.
Particle f-Peak Position
Table 2: Prtiary spectrum peak positions ({”) for charged pions and neutral kaons
and lambdas.
The analysis was repeated on the bgh-purity fight- and &quark samples described
in section 2. The measured cross sections for these two samples ue shown in fig. 7.
10

There is higher production of both charged and neutrrd kaons and charged pions in the
&tagged sample than in the tight-tagged sample, and lower production of baryons. The
spectra of d species are found to fd more rapidy at low f in the &tagged sample, and
those of the mesons bo fd more rapidy at high f. For the charged pions there is a
difference in fitted peak position of 0.15+0.05 between the fight and &tagged samples.
We do not observe significant differences in peak position for the other species. The
charged hadron fractions for these two samples (not shown) are quite stiar, with the
b sample showing a few percent lower pion fraction in the range 3< p <10 GeV/c, a
tigher pion fraction above 15 GeV/c and a lower proton fraction above 15 GeV/c.
The charged fractions analysis was repeated separatdy on the positively- and
negativdy-charged tracks in the quark-tagged sample described in section 2. The
V“ analysis was repeated separately on canddates with the positively- and negatively-
charged track assigned the proton mass. Tracks and V“s in the antiquark-tagged
sample were included but with their charges reversed. Figure 8 shows the differences
between the baryon and antibaryon production spectra normdzed by their averages,
dx = 2(nx – n~)/(nx + ny), x = p, A“, as a function of scaled momentum. At
low momentum they are consistent with zero, corresponding to equal production of
baryons and antibaryons. The differences me predominantly positive above about 12
GeV/c, corresponhg to an wcess of baryon production, and suggest an upward trend
with momentum. MC studies and the above me~urements in the &sample indicate
that contributions to the baryon and antibaryon samples from heavy hadron decays
are much sm~er than the observed Merences at high momentum. These differences
therefore provide direct evidence that faster patides are more fikely to contain the
initial quark.
6 Summmy and Conclusions
Using the SLD CWD we have made preliminary measurements of charged pion, kaon
and proton production over a large momentum range in hadrotic 2° decays, comple-
menting pretious measurements based on ionization energy loss. The production of Ko
and A“/~o was *O studied. Spectrum shapes were found to be adequately described
by the Gaussian approtiation to the QCD+LPHD prediction. Our resdts for the
~obd sample are in agreement with previous measurements. By isolating high-ptity
fight- and &quark s=ples it was shown that spectrum shapes are tiected by heavy

I
quark fragmentation and decay, but that the effect on the (-peak positions is smd. We
observed a difference in spectra at high momentum between baryons and antibaryons in
a high-purity sample of quark jets, providing direct evidence that particles containing
a primary quark have a harder fiagrnentation spectrum than those that do not.
Acknowledgements
We thank the personnel of the SLAC accderator department and the tecticd staffs
of our co~aborating instutions for their outstanding efforts on our behfi.
References
[1]
[2]
[3]
[4]
[5]
[6]
[7]
[8]
[9]
[10]
[11]
[12]
[13]
[14]
T.I. Azimov, Y.L. Dokshitzer, V.A, Khoze and S.1. Troyan, Z. Phys. C27 (1985)65.
See e.g. A. DeAngefis, CERN-PPE/90-129.
DELPHI CoHab., P. Abreu et al., CERN-PPE95/28, subtitted to Nucl. Phys. B.
SLD Design Report, SLAC-REPORT 273, (1984).
M.D. Hfldreth et al., SLAC-PUB-6656 (1994), submitted to IEEE Trans. Nucl.Sci.
C. J. S. DamereU et al., Nucl. Inst. Meth. A288 (1990) 288.
K. Abe, et al., Nucl. kst. Meth. A343 (1994) 74.
SLD Co~ab., K. Abe et al., Phys. Rev. Lett. 73 (1994) 25.
S. Brandt et al., Phys. Lett. 12 (1964) 57.E. Farhi, Phys. Rev. Lett. 39 (1977) 1587.
SLD CoUab., K. Abe et al., SLAC-PUB-95-6921, ‘Measurement of the ChargedMtitipticities of b, c and Light Quark Events from 2° Decays”, contributed to thisconference; SLAC-PUB-6589 submitted to Phys. Rev. D.
OPAL CoUab., P.D. Acton et al., Z. Phy9. C63 (1994) 181.
ALEPH CoUab., D. Decarnp et al., CERN-PPB94/201, submitted to Z. Phys. C.
Particle Data Group, Phys. Rev. D50 (1994) 1173.
ALEPH CoUab., D. Decmp et d., Z. Phys. C55 (1992) 209.
12

List of Authors
● *K. Abe,(2g) I. Abt,(14) C.J. Ahn,(26) T. Akagi,(27) N.J. AUen)(4) W.W. Ash,(27)tD. Aston,(27) K.G. Baird,(24) C. Bdtay,(33) H.R. Band,(32) M,B, Barakat,(n)
G. Baranko,(l”) O. Baron, T. Barrow, A.O. Bazarko,(ll) R. Ben-David,(33)A.C. Benvenuti,(2) T. Bienz,(27) G.M. Bflei,(22) D. Bisdo,(2:) G. Blaylock,(7)
J.R. Bog=t,(27) T. Boston, G.R. Bower,(27) J.E. Brau,(20) M. Breidenbach,(27)W.M. Bugg,(28) D. Burke,(27) T.H. Burnett, P.N. Burrows, W. Busza,(16)
A. Cdcaterra,(13) D.O. Cddwd,(6) D. Cdoway,(27) B. Camanzi,(12) M. CarpineU,(23)R. Cassefl,(27) R. Castddi,(23)(”) A. Castro, M. Cavti-Sforza,(7) E. Church,
H.O. Cohn,(28) J.A. Co~er,(3) V. Cook,(31) R, Cotton,(4) R.F. Cowan,(16)D.G. Cope,(7) A. D’0hveira,(8) C.J.S. Damere~,(25) M. Daoudi,(27) R. De Sangro,(13)
P. De Simon, R. De~’0rso,(23) M. Dims,(g) P.Y.C. DU,(28) R. Dubois,(27)B.I. Eisenstein,(14) R. Efia,(27) D. Fdciai,(22) M.J. Fero,(16) R. Frey,(20) K. Furuno,(20)
T. GWan,(25) G. Gadding, S. Gonzdez,(16) G.D. Hdewe~,(27) E.L. Hart,(2s)Y. Hasegawa,(H) S. Hedges,(4) S.S. Hertzbach,(17) M.D. Hfidreth,(27) J. Huber,(20)M.E. Htier,(27) E.W. Hughes, H. Hwang,(20) Y. Iwasaki,(2g) D.J. Jackson,P. Jacques,( 24) J. Jaros,(27) A.S. Johnson,(3) J.R. Johnson, R.A. Johnson,(8)
T. Junk,(27) R. Kajikawa,(lg) M. Kdek,(24) H. J. Kang,(26) I. Karfiner,(14)H. Kawahara,(27) H.W. Kendd,(16) Y. Kirn,(26) M.E. King,(27) R, King,(27)
R.R. Kofler,(17) N.M. Krishna, R.S. Krueger, J.F, Labs,(27) M. Langston,(20)A. Lath,(16) J.A. Lauder, D.W,G. Leith,(27) M.X. Liu,(m) X, Liu,(7) M. Loreti,(21)A. LU,(6) H.L. Lynch,(27) J. Ma,(31) G. MancineU,(22) S. M~y,(m) G. Mantovani,(22)
T.W. Marhewicz,(27) T. Maruyama,(27) R. M~setti,(22) H. Masuda,(27)T.S. Mattson, E. Mazzucato,(12~ A.K. McKemey,(4) B.T. Meadows,(8)
R. Messier, P.M. Mockett,(31) K.C. Moffeit,(27) B. Mours,(27) G. MWer,(27)D. Mtier,(27) T. Nagarnine,(2T) U. Nauenberg,(l”) H. Ned,(27) M. Nussbaum,(8)
Y. Ohtishi,(lg) L.S. Osborne, R.S. Panvifi,(30) H. Pink,(m) T.J. Pavel,(27)I. Peruzzi,(13)(b) M. Piccolo, L. Piemontese,(12) E. Pieroni, K.T. Pitts,(20)
R.J. Plano,(24) R. Prepost,(32) C.Y. Prescott, G.D. Punkar,(27) J. Qtigley,(16)B.N. Ratdff,(27) T.W. Reeves,(w) J. Reidy,(lg) P.E. Rending, L.S. Rochester,
J.E. Rothberg,(31) P.C. Rowson,(ll) J.J. Russet, O.H. S~ton,(27)S.F. Schtiner,(27) T. Schti,(7) R.H. Schinder,(27) U. SchneeMoth,(16)
B.A. Schumm,(15) A. Seiden,(7) S. Sen,(m) V.V. Serbo,(32) M.H. sh~titz,(ll)J.T. Shank,(3) G. Shapiro, S.L. Shapiro, D.J. Sherden,(27) K.D. Shmakov,(n)
C. SkOpOdOS,(27) N.B. Sinev,(20) S.R. Smith,(27) J.A. snyder,(~) P. Stmer,(Z4)H. Steiner, R. St~er,(l) M.G. Strauss, D. SU,(27) F. Suekane,(2g)
A. Sugiyama,( 19) s. SUW,(19) M. Swutz,(2T) A. Sz~o,(31) T. T~M~,(27)
F.E. Taylor, E. Tomence,(16) J.D. Turk,(a) T. Usher,(27) J. Va’vra,(27)ti,(23) E. VeUa,(27) J.P. Venuti,(m) R. Vernier, P.G. Verti,(23)c. v
S.R. Wagner, A.P. Waite,(27) S.J. Watts,(4) A.W. Weidemann,(28) E.R. Weiss,(31)J.S. Whitaker,(3) S.L. Wte,(2a) F.J. Wickets, D.A. Wfiams,(7)D.C. WWams,(16) S.H. Warns, S. Wtiocq,(m) R.J. Wfion,(g)
W.J. Wisniewski,(s) M. Woods,(27) G.B. Word,(24) J. WySS,(21) R.K. Yamamoto,(16)J.M. Yamartino,(16) X. Yang,(20) S.J. Yeh,(6) C.C. Young,(27) H. Yuta,(2g)
13
I.
G. Zapdac,(32) R.W. Zd=ko,(27) C. Zeitfin,(20) Z. Zhmg,(16) and J. Zhou,(zo)
(l)Adelpht University, Garden City, New York l1530(2)INFN Setione da Bologna, I-J0126 Bologna, Italy(3)Boston University, Bo9ton, Massachusetts 02215
(4)Brunei University, Uzbridge, Middlesez UB8 9PH, United Kingdom(s) Cdifomia Institute of Technology, Paadena, California 91125
(6) University of Cdifomia at Santa Barbam, Santa Barbam, C&ifomia 93106(7)univeT~atYOf Cdifomia at Santa Cm, Santa C-, C~ifo~ia g5064
(8) University of Cincinnati, Cincinnati, Ohio 45221(9)Colorado State University, Fort Collins, Colorado 80529
(lo) University of Colorado, Boulder, Colorado 80909(Ii) Columbia University, New York, New York 10027
(12)INFN Sem.one di Ferraro and Univer9it h di Ferraro, I-~~ 100 Ferraro, Italy(13)INFN Lab. Nu.onali di &ucati, I-000~~ ticati, Italy
(1*)University of fllinois, Urbana, fllinois 61801(lS)Lawrence Berkeley Labomtory, University of California, Berkeley, California
9A720(16)Mmsachwetts Institute of Techn~logy, Cambridge, Mas9achmetts 02139
(17)University of Massachusetts, Amherst, Massachusetts 01009~~a~University of Mis9is9ippi, University, Mis9is9ippi 98677
(lg)Nagoya University, Chikus~ku, Nagoya ~64Japan(2°) University of Oregon, Eugene, Oregon 97403
(21)INFN Sezzone di Padova and University di Padova, I-351OO Padova, Italy(22)INFN Sezaone di Pen9ia and Univer9ith di Perugia, I-06100 Pemgla, Italy
(23)INFN Sezaone da p~a and University di Pisa, I-561OO Pisa, Italy
(24)Rutgers University, Piscataway, New Jersey 08855(25)Rutherfoti Appleton Laboratory, Chilton, Didcot, Ozon OX1l OQX United
Kingdom(2G)Sogang University, Seoul, Korea
(27)Stanford Linear Accelerator Center, Stanford University, Stanford, California94309
~28~University of Tennes9ee, Knomlle, Tenne9see 37996~2g~Tohoku University, Sendai 980 Japan
~mlVanderbilt University, Nashdle, Tenne99ee 3723513~~University of Washington, Seattle, Wahington 98195(321University of Wigconsin, Madison, Wisconsin 53706
~m~Yale University, New Haven, Connecticut 06511
tDeceased(“)Ako at the Univer9ith di Genova~b~Ako at the University di Pemgia
14

Figure captions
1. Identification efficiencies for charged m*, K*, and p/P in the SLD barrel C~D,with systematic errors. The open symbols are for the analysis using fiquid radi-ator information; the sofid symboh are for the g~eous radiator.
2. Identification efficiencies for charged 7* measured with pions from K: decays(sofid symboh). The open tides are for the same analysis of a Monte Carlosample.
3. Prtiary charged hadron fractions measured by SLD. Circles are T*, squaresare K*, and triangles are p/~. Open symbob are for the Lqtid radiator; sobdsymbob are for the gas.
4. The efficiency for reconstructing and selecting a) Ko and b) A“ decays in sdectedhadrotic 2° decays recorded by SLD. The efficiencies include the branching ratiosand effects of detector acceptance.
5. Preliminary production spectra per event vs. scaled moment& ZP = 2p/W forZ* (dots), K* (squares), Ko (open squares), p/~ (trian~es), and A“/~o (open
tnan~es) in inclusive hadronic 2° decays. The p/p and A“/~o spectra have beenscaled by 0.2 and 0.1, respectively. The errors are statistical and systematic inquadrature. The systematic errors on the charged species are dominant and arecorrelated point to point. An over~ norm& ation uncertainty of 4% on theneutral species is not included.
6. Prehmin=y production spectra per event vs. ~ = – b(zP) for a) m+, b) K*,
2c) Ko, d p/fi, and e) A“/~o in inclusive hadronic 2° decays. The errors aredescribe in the caption for fig. 5. The curves are resdts of Gaussian fits.
7. Preliminary production spectra per event vs. ~ = – b(z,) for a) r+, b) K+, c)Ko, d) p/~, and e) A“/~o in samples enriched in 2° ~ ufi, d~, S3 decays (sohdsymbols) and 2° + b~ decays (open symboh), Ody statistical errors are shown.
8. The difference between p and F (circles) and A“ and lo (squares) productionspectra in quark-tagged jets, norm&ed by their average in each bin. Ordystatistical errors are shown.
15

. Figure 1: SLD CRID Identification Efficiencies(Preliminary)
K + “n”0,12[ I I 0.12
p + “n”I I I I
0.10-
0.06-
]Iii0.06–
&v
-1+{] ~11~~
1
0.04
Py \10.02- & ,
11
I I I ‘k]02 10 20 50
n + “K“ K + “K” p * “K“‘“’2~ “o~ “21 I I I
0.12r in + “p”
I I I
1
[
0.10’
0.08
[O.m– i
4-
]
wI
O.w-Ml
0.02- ~~
I AI bI I I
02 0.5 1 2 5 10 20 50
K + “P”0.12 I I
0.10
0.08 1
O.m-
,*1 i: :‘‘‘‘:jl-
0.04-
0.02-+
4A+0.2 0.5 1 2 5 10 20 50
0.08
0.06
O.w
I0.02–
i
1 1! i-
0.2 0.5 1 2 5 10 20 w
1.0.p + “p”
I 1 I I
0.8 - & 4
4 ‘i-4 “~
0.6 -i
A ?
0.4–4
\
;_
0.2- A
iA
I I I I I I0.2 0.5 1 2 5 10 20 50
p (GeV/c)

Figure 2: Determination of Liquid ID Efficiencies
using K~” + zn
0.06
0.04
0.02
0.08
0.06
0.04
0.02
0123456
I 1 I I I I
n + “K“
01
I I
012345~
I I 1 I I I
z + “p”
I,1 I
p (GeV/c)

●
1.0
0.9
0.8
0.7
0.6
0.5
0.4
0.3
0.2
0.1
0.0
Figure 3: SLD Preliminary Fractions
I,
} IT
1 I I !
—1
T
T
-— I
_I
—
1 10
p (GeV/c)
w
Figure 4: VO Reconstruction Efficiencies
(Preliminary)
0.14
0.12
0.10
0.08
0.06
0.04
0.02
0.30
0.25
0.20
0.15
0.10
0.05
a)
●●
I
Ko -
●
●
●
●
0“
O.OO12 3 4
< = In (1/xp)
b) A“
●
O.OO1 I I I
2 3 4
5
5~ = In (1/xp)

●
✼✎
.
Figure 5: SLD Preliminary Spectra
103L
102
110’
10°
AI
T—10-’
10-2I
TI I I 1
10-2 10-’ 10°
‘P
I10-3

Figure 6: SLD Prelimina~ Production Spectra
0 1- 2 :
\
~ I , I I
)4 5 6
1.4 i I I I
12L b) P.1
1.0;
, (
0 1 23456
1.4 i,i I
1.2- c) Ko I1
1.0- 4
$~1o 1 23456
~ = In (1/xp)
0.5 I I I I
d)0.4 -
0.3 -
0.2 -
01 2 345
0.25, i
~ e)
I I
A“’~(0.20 f
o.15i
O.lot
till>0.05 ~1
“), J
1
01 23456
~ = In (1/xP)

.
uds- and b-Tagged SpectraFigure 7: SLD Prelimina~
0.5
0.4
0.3
0.2
0.1
I
a)
I I
7
6
5
4
3
2
1
d)
I
Lo ‘1 2 345 6 1 234 .
1.4[ I I I I 0.25
0.20
0.15
0.10
0.05
b) e)1.2L
1.0 “,
-0.8 r0.61
r
0.4 rB v
0.2 ~
‘n❑
01 2345I
11I I i I
1 23456
~ = In (1/xP)1.4
1.2
1.0
0.8
0.6
0.4
0.2
1
c) Ko
< = In (1/xP)

2.0
1.5
1.0
0.5
0.0
-0.5
Figure 8: Comparison of bayon and antibayonproduction in quark jets
I I I
SLD Preliminary
.
-1.0 —o
1
. ...- ~.. .
c1 j
I
10 20 30
● X=pO X=A
---- . . . . . . . . . . . . .
I
40
p (GeV/c)