Production of High Concentration Hydrogen Gas from ... · from Sugarcane Bagasse and Sugarcane Leaf...
13
Chiang Mai J. Sci. 2015; 42(2) : 443-455 http://epg.science.cmu.ac.th/ejournal/ Contributed Paper Production of High Concentration Hydrogen Gas from Sugarcane Bagasse and Sugarcane Leaf by Mechanochemical Treatment Followed with Gasification Method Kanatip Kumproa [a] and Apinon Nuntiya*[b] [a] Department of Physics and Materials Science, Faculty of Science, Chiang Mai University, Chiang Mai, 50200, Thailand. [b] Department of Industrial Chemistry, Faculty of Science, Chiang Mai University, Chiang Mai, 50200, Thailand. *Author for correspondence; e-mail: [email protected] Received: 5 May 2014 Accepted: 5 November 2014 ABSTRACT The objectives of this work, including, produced high concentration hydrogen gas from sugarcane wastes by three-step process, studied the effect of ammonium hydroxide concentration on chemical treatment and studied the effects of milling time in mechanochemical treatment on hydrogen gas concentration in gaseous product and average particle size of milled mixture. The samples were characterized by UV-spectrophotometry, scanning electron microscopy (SEM) with energy dispersive spectrometry (EDS), X-ray diffraction (XRD), Fourier transform infrared spectroscopy (FT-IR), thermogravimetry-mass spectroscopy (TG/MS) and particle size analysis. The gaseous products were analyzed by gas chromatography (GC). The results indicated that the highest lignin content from sugarcane bagasse and sugarcane leaves were 8.1 and 10.4 %w/w when applying of 10 %v/v of ammonium hydroxide. Scanning electron micrograph showed the sugarcane wastes consisted of cell wall and cellulose fibers. The cell wall and cellulose fibers were separated by removing lignin. Furthermore, the EDS analysis showed that the only cell wall of sugarcane wastes consisted of silicon. Hydrogen gas was emitted from the milled sample by heating at about 450-600°C with the low concentrations of methane, carbon monoxide and carbon dioxide. The highest concentration of hydrogen gas was 97 %mol, which was obtained from the milled mixture of sugarcane bagasse/Ni(OH) 2 /Ca(OH) 2 with 120 min of milling time and the lowest concentrations of carbon dioxide below 0.3 %mol. According to, TG/MS and GC results showed that concentration of hydrogen gas increased with an increase in milling time in mechanochemical treatment. Due to the silicon in sugarcane wastes produced calcium silicate (CaSiO 3 ) and carbon dioxide, therefore; the concentration of carbon dioxide collected from sugarcane wastes are higher than from pure cellulose. Keywords: hydrogen, mechanochemical, planetary ball mill, gasification, sugarcane bagasse, sugarcane leaf
Transcript of Production of High Concentration Hydrogen Gas from ... · from Sugarcane Bagasse and Sugarcane Leaf...

Chiang Mai J. Sci. 2015; 42(2) 443
Chiang Mai J. Sci. 2015; 42(2) : 443-455http://epg.science.cmu.ac.th/ejournal/Contributed Paper
Production of High Concentration Hydrogen Gasfrom Sugarcane Bagasse and Sugarcane Leaf byMechanochemical Treatment Followed withGasification MethodKanatip Kumproa [a] and Apinon Nuntiya*[b][a] Department of Physics and Materials Science, Faculty of Science, Chiang Mai University,
Chiang Mai, 50200, Thailand.[b] Department of Industrial Chemistry, Faculty of Science, Chiang Mai University,
Chiang Mai, 50200, Thailand.*Author for correspondence; e-mail: [email protected]
Received: 5 May 2014Accepted: 5 November 2014
ABSTRACTThe objectives of this work, including, produced high concentration hydrogen gas
from sugarcane wastes by three-step process, studied the effect of ammonium hydroxideconcentration on chemical treatment and studied the effects of milling time in mechanochemicaltreatment on hydrogen gas concentration in gaseous product and average particle size ofmilled mixture. The samples were characterized by UV-spectrophotometry, scanning electronmicroscopy (SEM) with energy dispersive spectrometry (EDS), X-ray diffraction (XRD),Fourier transform infrared spectroscopy (FT-IR), thermogravimetry-mass spectroscopy(TG/MS) and particle size analysis. The gaseous products were analyzed by gas chromatography(GC). The results indicated that the highest lignin content from sugarcane bagasse and sugarcaneleaves were 8.1 and 10.4 %w/w when applying of 10 %v/v of ammonium hydroxide.Scanning electron micrograph showed the sugarcane wastes consisted of cell wall and cellulosefibers. The cell wall and cellulose fibers were separated by removing lignin. Furthermore, theEDS analysis showed that the only cell wall of sugarcane wastes consisted of silicon. Hydrogengas was emitted from the milled sample by heating at about 450-600°C with the lowconcentrations of methane, carbon monoxide and carbon dioxide. The highest concentrationof hydrogen gas was 97 %mol, which was obtained from the milled mixture of sugarcanebagasse/Ni(OH)2/Ca(OH)2 with 120 min of milling time and the lowest concentrations ofcarbon dioxide below 0.3 %mol. According to, TG/MS and GC results showed thatconcentration of hydrogen gas increased with an increase in milling time in mechanochemicaltreatment. Due to the silicon in sugarcane wastes produced calcium silicate (CaSiO3) andcarbon dioxide, therefore; the concentration of carbon dioxide collected from sugarcanewastes are higher than from pure cellulose.
Keywords: hydrogen, mechanochemical, planetary ball mill, gasification, sugarcanebagasse, sugarcane leaf

444 Chiang Mai J. Sci. 2015; 42(2)
1. INTRODUCTIONRecently, hydrogen which is a source
power of fuel cell, has been considered as anovel fuel, due to an environmental problemof using fossil fuel. Due to the fact thatbiomass is a renewable and carbon neutralresource; therefore, hydrogen productionfrom biomass has now become attractiveresearch [1].
The intensive researches have beenreported [1, 2] to produce hydrogen frombiomass by using various methods, such as,gasification with pressure swing adsorption,supercritical, subcritical and hydrothermalmethod. However, these methods need hightemperature, high pressure and severaloperation-step to obtain a high concentrationhydrogen (90-99.9 %mol) [3]. William T. andQiwu Z., et al [4-9] did the researches abouthydrogen production by the method ofgasification from polymer pellet and cellulose(analytical reagent grade) using preliminarymechanochemical treatment. They discoveredthat a solid state operation, which based onmechanochemical treatment particularly withcatalyst and carbon dioxide capture agentfollowed with gasification method which offerthe high-purity hydrogen.
Although cellulose is a major componentin biomass, but biomass has variability ofchemical composition, such as, silicon, calcium,magnesium, sodium, potassium nitrogen andsulfur. These elements are caused to reducethe purity of hydrogen gas; moreover, theunwanted by-products are occurred, whichare extremely problem in gasifier andenvironment [10]. Previous researchesreported [11-13] about chemical treatment ofremoving silicon and alkaline elements, whichis on the cell wall of biomass, by using acidor base solution.
In this work, we propose a new pathwayfor hydrogen production with highconcentration hydrogen from sugarcane
bagasse and sugarcane leaves, which are themajor agricultural biomass in Thailand andcause of environmental problem, in onlythree-step process. In the first step sugarcanewastes are treated for remove lignin and siliconby chemical treatment with ammoniumhydroxide solution. The second step samplesof sugarcane wastes/treated sugarcanewastes, nickel hydroxide (as a catalyst) andcalcium hydroxide (as a carbon dioxidecapture agent) are milled for trigger themixtures and to obtain homogeneousmixtures by mechanochemical treatment andin the final step the milled samples areheated to produce hydrogen by gasificationmethod. Furthermore, the effect ofammonium hydroxide concentration onchemical treatment, the effect of milling timeon hydrogen production and the comparisonbetween the concentration of gases fromsugarcane wastes, treated sugarcane wastesand cellulose (analytical reagent grade) onhydrogen production are evaluated.
2. MATERIALS AND METHODS2.1 Materials
Sugarcane bagasse and sugarcane leavesthat are agricultural biomass from sugarextraction industry in Chiang Mai, Thailandwere dried at 60 °C for 1 h. Sugarcane wasteswere milled by a grinder and sieve (45 mesh)to obtain the find particles. These samples werekept in the desiccator until it was used.
Ammonium hydroxide (NH4OH) fromJ.T. Baker was used as an extracted agent inchemical treatment and lignin (analytical reagentgrade) from Aldrich chemistry was used as astandard reagent. Furthermore, nickelhydroxide (Ni(OH)2) from Kanto chemicalco., Inc. was used as a catalyst and calciumhydroxide (Ca(OH)2) from Wako chemicalswas used as a CO2 capture agent in gasificationmethod.

Chiang Mai J. Sci. 2015; 42(2) 445
2.2 Methods2.2.1 Chemical treatment
Milled sugarcane wastes were mixed withNH4OH solution (8 %, 10 % and 12 %v/v)and shaken in a dual-action shakers (NB-101MT, N-Biotex. Inc, Korea) at 200 rpm, roomtemperature for 24 h [11, 13]. The mixturewas filtered out in order to separate solidfraction from the soluble fraction. The solidfractions were washed with deionized waterto remove residual NH4OH until pH was 7and then dried in an oven (Binder, Edu System,Austria) at 70 °C for 24 h and kept it indesiccator until it used as starting material inmechanochemical treatment
2.2.2 Mechanochemical treatmentSugarcane wastes/treated sugarcane
wastes, Ni(OH)2 and Ca(OH)2 were usedas starting materials. The outstandingcharacteristics of cellulose (C6H10O5) is torepresent sugarcane wastes and chemical-treated sugarcane wastes for the use ofchemical formula and reaction mechanism.According to the ideal reactions pathwaythat summarized in reaction (1), the sampleswere mixed at molar ratios of (1:0.5:6) for(C6H10O5:Ni(OH)2:Ca(OH)2) and the 4.0 gmixture was milled by planetary ball mill(Pulverisette-7, Fritsch, Germany), which hastwo mill pots (45 cm3 inner volume each) madeof ZrO2 with 7×15 mm diameter of ZrO2
balls. Milling speed in this work was 700 rpm[4-9] and milling time was 0, 15, 30, 60 and120 min.
C6H10O5 + 0.5Ni(OH)2 + 6Ca(OH)2 →11.5H2 + 0.5Ni + 6CaCO3 (1)
2.2.3 Gasification methodThe sample of 2.0 g mixture, which was
prepared by mechanochemical treatment,was put on a sample holder and placed in aglass tube. The glass tube connected to the
source of argon gas and inserted in a furnacewith discharge line for the product of gascollection [5-10]. The sample was heated inthe furnace from room temperature to600 °C for 60 min at heating rate of20 °C/min. The products of gas werecollected through the discharge line in analuminum pack.
2.2.4 Characterization method2.2.4.1 Ultimate analysis
The percentage of carbon, hydrogen,oxygen, sulfur and nitrogen in sugarcanewastes were determined by CHNS/Oanalyzer (PE 2400 series II, Perkin-Elmer,U.S.A.) for the ultimate analysis. Moreover, theheating value of sugarcane wastes werecharacterized by bomb calorimeter.
2.2.4.2 Lignin contents analysisThe lignin content in the soluble fraction
was determined by UV spectrophotometer(HP 8453 UV-Vis, Hewlett Packard,Germany) at an absorbance of 260 nm [13].
2.2.4.3 Morphology analysisThe morphology of samples (before and
after treated by chemical treatment) wasobserved by scanning electron microscope(SEM) (S4100, Hitachi and JSM-5910, JEOLLtd., Japan). Furthermore, the percentage ofelement in the samples were characterizedby Energy dispersive spectrometer (EDX)(JSM-5910, JEOL Ltd., Japan).
2.2.4.4 Thermogravimetric massspectroscopy (TG/MS)
The optimum condition to obtainhydrogen was evaluated by TG/MS analysisusing a thermobalance connected to aquadrupole mass spectrometer (RigakuThermo-Mass: Thermo plus TG-8120 withM-201QA). The measurements were carriedout with helium gas at a flow rate of 300 ml/

446 Chiang Mai J. Sci. 2015; 42(2)
min. About 2 mg of the milled sampleswere heated from 20 to 1000 °C at a heatingrate of 20 °C/min.
2.2.4.5 Gas concentration analysisThe product gases were analyzed for
component gas concentrations by GasChromatography (GC) using a Micro GC/QC system (Aglient Micro GC 3000A) withhelium gas as carrier gas.
2.2.4.6 Mineralogical and functionalanalysis
The samples after milling and the milledsamples after heating were characterized byX-ray diffractometer (XRD) (Rigaku, RINT-2200/PC) with a CuKα irradiation source(λ = 1.5405 A°) at 40 kV and 50 mA.Moreover, the heated samples werecharacterized by using Fourier transforminfrared spectrometer (Digilab ExcaliburSeries, FTS-3000) with KBr as a diluent.
2.2.4.7 Particle size analysisThe average particle size of milled
samples at different milling time (0, 15, 30, 60and 120 min) were analyzed by particle sizeanalyzer (Microtrac MT 3300 EX, Bel JapanInc.).
3. RESULTS AND DISCUSSION3.1 Ultimate Analysis of SugarcaneWastes as Raw Materials
Table 1 shows the characteristics ofsugarcane wastes. The optimum contents ofnitrogen and sulfur are less than 0.5 %w/w.Nitrogen could react to form HCN andNH3 or NOx in the combustion process.In addition, sulfur could also react to formH2S and COS or SOx in combustion process.However, HCN, NH3 or NOx, H2S, COS orSOx formations could not affect or damageto the gasifier/reactor in the combustionprocess [10].
In this work, %N and %S of sugarcanebagasse and sugarcane leaves are both lessthan 0.5 %w/w. There are comparisonbetween the heating value of sugarcanewastes in this work and lignite from U.S.A.(11176.62 kJ/kg), which was used as the rawmaterial for gaseous production and electricityat present [10]. Furthermore, the optimummoisture content is less than 10 %w/w [10].The moisture content of sugarcane bagasseand sugarcane leaves are both less than10 %w/w. All of the characteristics indicatethat both sugarcane bagasse and sugarcaneleaves are acceptable as the good quality ofraw materials for hydrogen production.
Table 1. characteristics of sugarcane bagasse and sugarcane leaves.
Raw materials
Sugarcane bagasseSugarcane leaves
Elemental analysis (%w/w)%C
42.1942.84
%H6.306.63
%O50.9749.85
%N0.270.34
%S0.270.34
Heating value(kJ/kg)
16914.1618814.27
% Moisture content(%w/w)
9.397.61
3.2 Effect of NH4OH Concentration onChemical Treatment
The lignin contents in sugarcane bagasseand sugarcane leaves that treated by NH4OHsolution with different concentration (8, 10and 12 %v/v) for 24 h are shown inFigure 1. The highest lignin content in thesoluble fraction after chemical treatment
from sugarcane bagasse and sugarcaneleaves by using 10 %v/v of NH4OH is 8.1and 10.4 %w/w respectively. These resultsare similar to the results of Jose M.D., etal [11], indicate that NH4OH could breakthe covalent bond between lignin andcellulose/hemicellulose [14].

Chiang Mai J. Sci. 2015; 42(2) 447
is highly concentrated on cell wall ofsugarcane wastes. Additionally, chemicaltreatment with NH4OH could separatecell wall for reducing the amount of silicon.
Figure 1. Lignin contents of sugarcanebagasse and sugarcane leaves that are treatedby using NH4OH solution at differentconcentration (8, 10 and 12 %v/v) for 24 hof reaction time.
3.3 Morphological Studies of Untreatedand Treated Samples
Figure 2(a) - (d) and Figure 3(a) - (d) showSEM images and EDS point analysis ofuntreated and treated sugarcane bagasseand sugarcane leaves with NH4OH solutionrespectively. Figure 2(a) and Figure 3(a)show cell wall in “α” and “ω” areas, whichconsist of lignin, cover on cellulose fibers.Furthermore, Figure 2(b) and Figure 3(b)show cellulose fibers in “β” and “ε” areasare separated from cell wall by removinglignin with NH4OH solution. Thesemicrofibril bundles have lengths of 400-600μm and diameters of 30 - 50 μm. EDS pointanalysis of untreated sugarcane bagasseand untreated sugarcane leaves in “α” and“ω” areas are shown in Figure 2(c) andFigure 3(c), respectively. It appears highpercentage of silicon. On the other hand,Figure 2(d) does not show any peak ofsilicon in “β” area of Figure 2(b) and Figure3(d) shows low percentage of silicon in “ε”area of Figure 3(b). These resultscorrespond to Haibo Z. and Byung D.P.,et al’s results [12, 15]. It indicates that silicon
Figure 2. SEM images and EDS pointanalysis of sugarcane bagasse before andafter chemical treatment; (a) untreatedsugarcane bagasse, (b) treated sugarcanebagasse, (c) EDX point analysis of untreatedsugarcane bagasse and (d) EDX pointanalysis of treated sugarcane bagasse.
Figure 3. SEM images and EDS pointanalysis of sugarcane leaves before and afterchemical treatment; (a) untreated sugarcaneleaves, (b) treated sugarcane leaves, (c) EDXpoint analysis of untreated sugarcane leavesand (d) EDX point analysis of treatedsugarcane leaves.

448 Chiang Mai J. Sci. 2015; 42(2)
3.4 TG/MS Analysis of Gas CompositionFigure 4 and 5 show the TG/MS
spectra of the milled sugarcane bagasse/Ni(OH)2/Ca(OH)2 and sugarcane leaves/Ni(OH)2/Ca(OH)2 mixtures with 120 minof milling time at 700 rpm of speed milling.The Figure 4 and 5 clearly show productionof H2, H2O, CH4, CO and CO2 as the maingaseous products. In TG curve, weight lossdecreases at about 300oC. The MSspectrum is found at the peak of water atthe same temperature. It indicates that adehydration of Ni(OH)2 occurs aroundthis temperature. The reaction ofdehydroxylation of Ni(OH)2 as follow inreaction (2). Furthermore, TG curve showslarge weight loss decrease at about 450 and650oC, which are observed twoendothermic peaks in DTA curvescorrespondingly. MS spectra shows thepeak of H2/CH4 at about 450 oC and thepeaks of CO/CO2 at about 650oC. Itindicates that hydrogen and methane emitat about 450 °C and carbon monoxide andcarbon dioxide emit at about 650 oC. Thereactions of hydrogen, methane, carbonmonoxide and carbon dioxide productionare follow in reaction (1), (2), (3)(methanation), (4) (steam reforming) and (5)(water-gas shift reaction) respectively. Thefact is that at the different temperature,hydrogen emission happens. Therefore,carbon monoxide and carbon dioxide arethe key points to indicate the possibilityof obtaining hydrogen with high purity.
Ni(OH)2 + heat → NiO + H2O (5)
C + 2H2 → CH4 + heat (6)
CH4 + H2O + heat → CO + H2 (4)
CO + H2O → CO2 + H2 (5)
Figure 4. TG/MS spectra of milledsugarcane bagasse/Ni(OH)2/Ca(OH)2
mixture for 120 min of milling time at 700rpm.
Figure 5. TG/MS spectra of milledsugarcane bagasse/Ni(OH)2/Ca(OH)2
mixture for 120 min of milling time at 700rpm.

Chiang Mai J. Sci. 2015; 42(2) 449
Figure 6(a) - (b) show the MS spectraof the sugarcane bagasse/Ni(OH)2/Ca(OH)2 and sugarcane leaves/Ni(OH)2/Ca(OH)2 samples milled for differentmilling time (0, 15, 30, 60 and 120 min) at700 rpm of speed milling. It finds that asmall peak of hydrogen emission occurfrom the sample without milling (0 min).The intensity of hydrogen peak and millingtime increase rapidly indicates thatmechanochemical treatment plays asignificant role in hydrogen productionfrom the mixture.
All of TG/MS results are similar toWilliam T. and Qiwu Z., et al’s results [4-
9]. It understands that the reactions in thiswork are similar to steam reformingreaction but our reactions occur with themilled samples for avoiding tar formationin gaseous products.
3.5 Characterization of The MixturesXRD patterns of sugarcane bagasse/
Ni(OH)2/Ca(OH)2 and sugarcane leaves/Ni(OH)2/Ca(OH)2 mixture prepared bymechanochemical treatment for differentmilling time (0, 15, 30, 60 and 120 min) at700 rpm of speed milling are shown inFigure 7(a) and Figure 7(b) respectively.The peaks of starting materials, includingNi(OH)2 and Ca(OH)2, still appear in themilled mixture, indicate that no solid statereaction occurs during mechanochemicaltreatment. However, the intensity ofstarting material peaks decrease with anincrease in milling time. It indicates thatthe mixture becomes more amorphous statewhen milling time is increased.Furthermore, it finds that the broad peakof amorphous silica in the mixturesindicate that sugarcane wastes are consistof amorphous silica as a trace element.These results in terms of milling time aresimilar to Qiwu Z, et al’s reports [7, 8].
Table 2 shows the average particle sizeof the milled sugarcane bagasse/Ni(OH)2/Ca(OH)2 and sugarcane leaves/Ni(OH)2/Ca(OH)2 mixtures prepared bymechanochemical treatment for differentmilling time (0, 15, 30, 60 and 120 min) at700 rpm of speed milling. The results ofparticle size analysis show that the averageparticle size of the milled mixtures decreasewith an increase in milling time. According to,the MS spectra and GC’s results in Figure 6,Table 3 and 4 respectively show thatamount of H2, concentration of total gasesand concentration of H2 increase whenaverage particle size decreases. It indicates
Figure 6. MS spectra of milled mixturesfor different milling time (0, 15, 30, 60 and120 min) at 700 rpm; (a) sugarcane bagasse/Ni(OH)2/Ca(OH)2 mixture and (b) sugarcaneleaves/Ni(OH)2/Ca(OH)2 mixture.

450 Chiang Mai J. Sci. 2015; 42(2)
indicating that the reduction of NiO forproducing Ni as a catalyst in hydrogenproduction, which are followed in reaction(6), are occur. Furthermore, the peaks ofCaCO3 were found, indicate that thecarbonation of Ca(OH)2 for reducing CO2
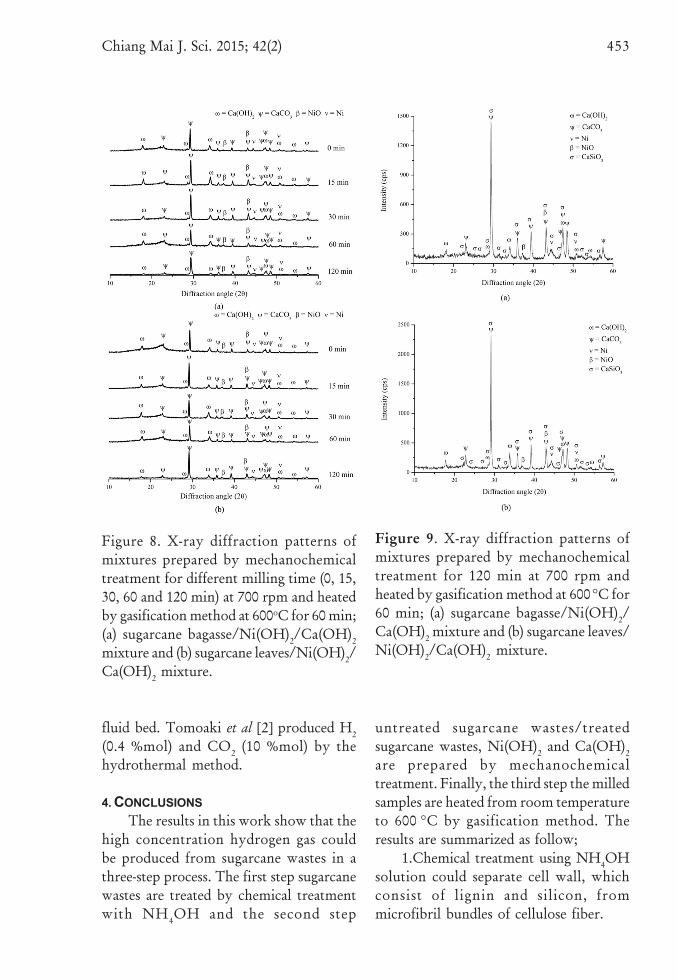
emission, which are followed in reaction (7),is occur. However, the peaks of NiO, whichoccur from the dehydroxylation of Ni(OH)2,and Ca(OH)2 still appear in heated samples.Interestingly the intensity of the peaks ofCaCO3 decreases with an increase in millingtime, because of a formation of CaSiO3 occur.Figure 9(a) - (b) show XRD patterns ofsugarcane bagasse/Ni(OH)2/Ca(OH)2 andsugarcane leaves/Ni(OH)2/Ca(OH)2
mixture prepared by mechanochemicaltreatment for 120 min at 700 rpm of speedmilling and then heated at 600 °C for 1 h.The peaks of CaSiO3, with low intensity,appear in heated samples, indicate thatCaCO3 reacts with SiO2 in sugarcane wastesto produce CaSiO3 and emit CO2 [16]. Theformation of CaSiO3 is followed inreaction (8). The results in terms ofcharacterization of materials are differentfrom Qiwu Z, et al’s researches [7, 8]because of starting materials in theirresearch is cellulose (analytical reagentgrade), which is only consist of carbon,hydrogen and oxygen.
NiO + H2 → Ni + H2O (8)
Ca(OH)2 + CO2 → CaCO3 + H2O (9)
CaCO3 + SiO2 → CaSiO3 + CO2 (10)
FT-IR patterns of sugarcane bagasse/Ni(OH)2/Ca(OH)2 and sugarcane leaves/Ni(OH)2/Ca(OH)2 mixtures prepared bymechanochemical treatment for 120 min at700 rpm of speed milling and then heatedby gasification method at 600 oC for 60 min
that reactivity of reaction increase with thedecrease in average particle size.
Figure 7. X-ray diffraction patterns ofmixtures prepared by mechanochemicaltreatment for different milling time (0, 15,30, 60 and 120 min) at 700 rpm; (a)sugarcane bagasse/Ni(OH)2/Ca(OH)2
mixture and (b) sugarcane leaves/Ni(OH)2/Ca(OH)2 mixture.
XRD patterns of sugarcane bagasse/Ni(OH)2/Ca(OH)2 and sugarcane leaves/Ni(OH)2/Ca(OH)2 mixtures prepared bymechanochemical treatment for differentmilling time (0, 15, 30, 60 and 120 min) at700 rpm of speed milling and then heatedby gasification method at 600 oC for 60 minunder argon gas atmosphere are shown inFigure 8(a) and Figure 8(b) respectively.The peaks of Ni appear in heated samples,
Chiang Mai J. Sci. 2015; 42(2) 451
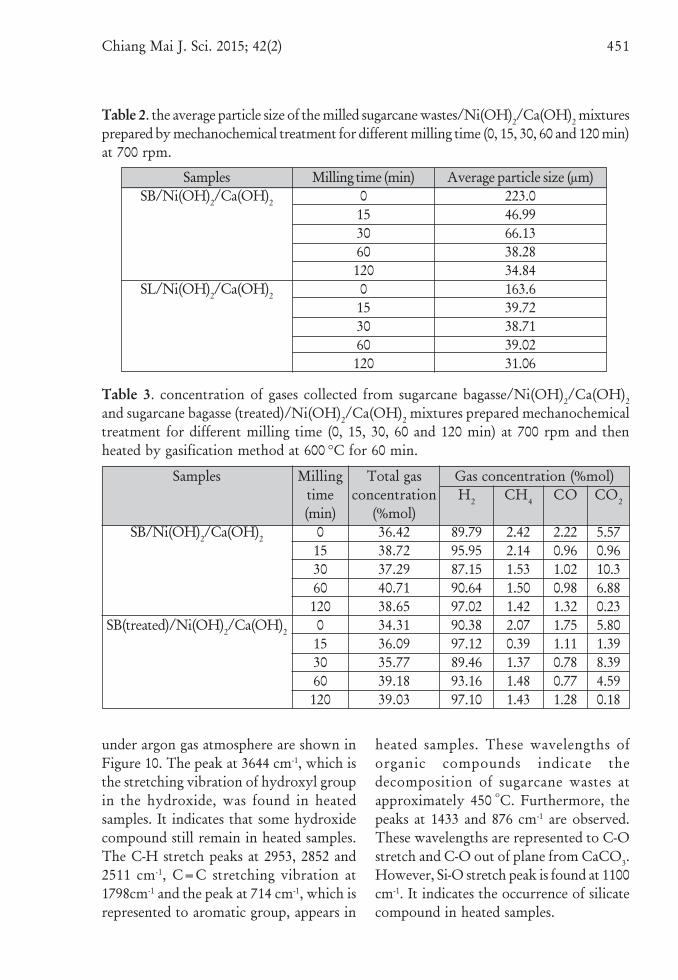
Table 2. the average particle size of the milled sugarcane wastes/Ni(OH)2/Ca(OH)2 mixturesprepared by mechanochemical treatment for different milling time (0, 15, 30, 60 and 120 min)at 700 rpm.
SamplesSB/Ni(OH)2/Ca(OH)2
SL/Ni(OH)2/Ca(OH)2
Milling time (min)01530601200153060120
Average particle size (μm)223.046.9966.1338.2834.84163.639.7238.7139.0231.06
Table 3. concentration of gases collected from sugarcane bagasse/Ni(OH)2/Ca(OH)2
and sugarcane bagasse (treated)/Ni(OH)2/Ca(OH)2 mixtures prepared mechanochemicaltreatment for different milling time (0, 15, 30, 60 and 120 min) at 700 rpm and thenheated by gasification method at 600 °C for 60 min.
Samples
SB/Ni(OH)2/Ca(OH)2
SB(treated)/Ni(OH)2/Ca(OH)2
Millingtime(min)
01530601200153060120
Total gasconcentration
(%mol)36.4238.7237.2940.7138.6534.3136.0935.7739.1839.03
Gas concentration (%mol)CH4
2.422.141.531.501.422.070.391.371.481.43
CO
2.220.961.020.981.321.751.110.780.771.28
CO2
5.570.9610.36.880.235.801.398.394.590.18
H2
89.7995.9587.1590.6497.0290.3897.1289.4693.1697.10
under argon gas atmosphere are shown inFigure 10. The peak at 3644 cm-1, which isthe stretching vibration of hydroxyl groupin the hydroxide, was found in heatedsamples. It indicates that some hydroxidecompound still remain in heated samples.The C-H stretch peaks at 2953, 2852 and2511 cm-1, C=C stretching vibration at1798cm-1 and the peak at 714 cm-1, which isrepresented to aromatic group, appears in
heated samples. These wavelengths oforganic compounds indicate thedecomposition of sugarcane wastes atapproximately 450 oC. Furthermore, thepeaks at 1433 and 876 cm-1 are observed.These wavelengths are represented to C-Ostretch and C-O out of plane from CaCO3.However, Si-O stretch peak is found at 1100cm-1. It indicates the occurrence of silicatecompound in heated samples.

452 Chiang Mai J. Sci. 2015; 42(2)
3.6 Analytical of Product GasConcentration
Table 3 and 4 show gaseousconcentrations collected from sugarcanebagasse/Ni(OH)2/Ca(OH)2, sugarcanebagasse (treated)/Ni(OH)2/Ca(OH)2,sugarcane leaves/Ni(OH)2/Ca(OH)2 andsugarcane leaves (treated)/Ni(OH)2/Ca(OH)2
mixtures prepared by mechanochemicaltreatment for different milling time (0, 15, 30,60 and 120 min) at 700 rpm of speedmilling and then heated by gasificationmethod at 600 °C for 60 min under argongas atmosphere. The data shows theconcentration of H2 increases with anincrease in milling time, indicating thatmechanochemical treatment has influencedto hydrogen concentration in hydrogenproduction. However, the mixtures of H2
concentration milled for 120 min, seem todecrease due to the formation of CaSiO3
occurred to emit CO2 [16]. H2 concentra-tion from treated sugarcane wastesmixtures is higher than H2 concentration
from untreated sugarcane wastes mixtures.In addition, CO2 from treated sugarcanewastes mixtures is lower than CO2 fromuntreated sugarcane wastes mixtures. Theresults reveal that the successful removalof lignin and silicon in chemical treatment.The highest concentration of H2 isapproximately 86-97 %mol. Thus, H2
concentration in our work is in a rangeof high concentration H2 (90-99.9 %mol)[3]. The lowest concentration of CO2 isapproximately 0.18 %mol.
Qiwu, et al’s researches [7, 8] producedthe highest concentration of hydrogengas is approximately 88-99.3 %mol.In addition, the lowest concentration ofCO2 is approximately 0.1 %mol. Further-more, there are the comparisons of H2 andCO2 concentration with other workswhich are the researches of John andNicholas [10] and Tomoaki et al [2]. Johnand Nicholas [10] produced H2 (30-45%mol) and CO2 (15-25 %mol) by thegasification method and also circulating
Samples
SL/Ni(OH)2/Ca(OH)2
SL(treated)/Ni(OH)2/Ca(OH)2
Table 4. concentration of gases collected from sugarcane leaves/Ni(OH)2/Ca(OH)2 andsugarcane leaves (treated)/Ni(OH)2/Ca(OH)2 mixtures prepared mechanochemical treatmentfor different milling time (0, 15, 30, 60 and 120 min) at 700 rpm and then heated by gasificationmethod at 600 °C for 60 min.
Millingtime(min)
01530601200153060120
Total gasconcentration
(%mol)24.8834.7237.9734.1044.9328.8830.7035.1838.8643.30
Gas concentration (%mol)CH4
3.541.091.341.790.804.360.550.542.600.72
CO
4.421.471.690.971.143.571.371.480.901.13
CO2
5.232.972.691.069.043.080.293.041.036.93
H2
86.8294.4794.1896.1989.0388.9997.7994.9495.4791.22
Chiang Mai J. Sci. 2015; 42(2) 453
Figure 9. X-ray diffraction patterns ofmixtures prepared by mechanochemicaltreatment for 120 min at 700 rpm andheated by gasification method at 600 °C for60 min; (a) sugarcane bagasse/Ni(OH)2/Ca(OH)2 mixture and (b) sugarcane leaves/Ni(OH)2/Ca(OH)2 mixture.
fluid bed. Tomoaki et al [2] produced H2
(0.4 %mol) and CO2 (10 %mol) by thehydrothermal method.
4. CONCLUSIONSThe results in this work show that the
high concentration hydrogen gas couldbe produced from sugarcane wastes in athree-step process. The first step sugarcanewastes are treated by chemical treatmentwith NH4OH and the second step
untreated sugarcane wastes/treatedsugarcane wastes, Ni(OH)2 and Ca(OH)2
are prepared by mechanochemicaltreatment. Finally, the third step the milledsamples are heated from room temperatureto 600 °C by gasification method. Theresults are summarized as follow;
1.Chemical treatment using NH4OHsolution could separate cell wall, whichconsist of lignin and silicon, frommicrofibril bundles of cellulose fiber.
Figure 8. X-ray diffraction patterns ofmixtures prepared by mechanochemicaltreatment for different milling time (0, 15,30, 60 and 120 min) at 700 rpm and heatedby gasification method at 600oC for 60 min;(a) sugarcane bagasse/Ni(OH)2/Ca(OH)2
mixture and (b) sugarcane leaves/Ni(OH)2/Ca(OH)2 mixture.

454 Chiang Mai J. Sci. 2015; 42(2)
5. ACKNOWLEDGEMENTSThe authors would like to
acknowledge department of Physics andMaterials Science, Faculty of Science andThe Graduate School, Chiang MaiUniversity, Thailand, Science AchievementScholarship of Thailand, National ResearchUniversity Project under Thailand’s Officeof the Higher Education Commission andInstitute of Multidisciplinary Research forAdvanced Materials, Tohoku University,Japan for chemical materials and financialsupport of this work.
REFERENCES
[1] Tomoaki M. and Tomoko O.,Hydrogen production from celluloseusing a reduced nickel catalyst, Catal.Today, 1998; 45: 411-416.
[2] Meng N., Dennis Y.C.L., MichaelK.H.L. and Sumathy K., An overviewof hydrogen production frombiomass, Fuel Process. Technol., 2006;87: 461-472. DOI 10.1016/j.fuproc.2005.11.003.
[3] Christopher H. and Maarten Van DerB., Gasification, Gulf ProfessionalPublishing, Burlington, 2003.
[4] William T., Qiwu Z. and Fumio S.,Hydrogen generation from polyethyleneby milling and heating with Ca(OH)2and Ni(OH)2, Int. J. Hydrogen Energy,2008; 33: 4097-4103. DOI 10.1016/j.ihydene.2008.05.027.
[5] William T., Qiwu Z. and Fumio S.,Generation of hydrogen gas frompolyethylene mechanically milledwith Ni-doped layered doublehydroxide, Fuel Proces. Technol., 2009;90: 909-913. DOI 10.1010/j.fuproc.2009.01.014.
[6] William T., Qiwu Z., Miyagi S. andFumio S., Generation of hydrogen
2.The significance of mechanochemicaltreatment is that it is used to obtain ahomogeneous composite of startingmaterials. In addition, mechanochemicaltreatment is also used to produce highconcentration hydrogen gas at lowtemperature.
3. The addition of Ni(OH)2, not onlyoffering Ni as a catalyst for thermaldecomposition of organic compound thatsuccessfully produced H2, CH4, H2O, CO andCO2 gases, but also offering H2O for steamreforming and water gas reaction.
4. The addition of Ca(OH)2 to offerCaO as a CO2 capture agent for carbonationof CaO successfully reduced CO2 and offerH2O for steam reforming and water gasreaction.
5. Trace elements in biomass couldreact with starting materials to obtainunwanted condition. In this work siliconis trace elementin sugarcane wastes, whichproduced CaSiO3 and emitted CO2.
Figure 10. FT-IR patterns of sugarcanebagasse/Ni(OH)2/Ca(OH)2and sugarcaneleaves/Ni(OH)2/Ca(OH)2 mixturesprepared mechanochemical treatment for120 min at 700 rpm and then heated bygasification method at 600 °C for 60 min.

Chiang Mai J. Sci. 2015; 42(2) 455
from polyvinyl chloride by millingand heating with CaO and Ni(OH)2,J. Hazard. Mater., 2009; 167: 1002-1006. DOI 10.1016/j.jhazmat.2009.01.076.
[7] Qiwu Z., Incheol K., William T. andFumio S., Generation of high-purityhydrogen from cellulose by itsmechanochemical treatment,Bioresour. Technol., 2009; 100: 3731-37333. DOI 10.1016/j.biortech.2009.02.034.
[8] Qiwu Z. and Fumio S., HydrogenGeneration by thermal decompositionof cellulose or polyethylene usingpreliminary mechanochemical treatment,Waste Biomass Valor., 2010; 1: 41-46. DOI10.1007/s12649-009-9004-z.
[9] William T., Qiwu Z. and Fumio S.,Generation of H2 gas from polystyreneand poly(vinyl alcohol) by milling andheating with Ni(OH)2 and Ca(OH)2,Fuel Proces. Technol., 2010; 91: 272-276. DOI 10.1016/j.fuproc.2009.10.008.
[10] John R. and Nicholas P.C.,Gasification Technology a Primer forEngineers and Scientists, Taylor &Francis Group, Boca Raton, 2005.
[11] Jose M.D., Ningjun C., Gong C.S.and Tsao G.T., Dilute acidhemicellulose hydrolysates from corncobs for xylitol production by yeast,Bioresour. Technol., 1997; 61: 85-90.
[12] Haibo Z., Ja H.K., Conrad Z.Z.,Heather M.B., Bruce W.A. andJohnathan E.H., Study cellulose fiberstructure by SEM, XRD, NMR andacid hydrolysis, Carbohydr. Polym.,2007; 68: 235-241. DOI 10.1016/j.carbol.2006.12.013.
[13] Pattana L., Arthit T., Vichean L. andLakkana L., Acid hydrolysis ofsugarcane bagasse for lactic acidproduction, Bioresour. Technol., 2010;101: 1036-1043. DOI 10.1016/j.biortech.2009.08.091.
[14] Kanatip K., Suttipong S. and ApinonN., Effect of reaction time andhydrochloric acid concentration onacid hydrolysis of rice husk by refluxmethod, Adv. Mat. Res., 2012; 550-553: 592-597. DOI 10.4028/www.scientific.net/AMR.550-553.592.
[15] Byung D.P., Seung G.W., KwangH.L., Adya P.S., Tae H.Y. and YoonS.K., Characterization of anatomicalfeatures and silica distribution in ricehusk using microscopic and micro-analytical techniques, BiomassBioenergy, 2003; 25: 319-327. DOI10.1016/s0961-9534(03)00014-X.
[16] Ildik K. and Agnes B., Synthesis ofwollastonite. Ceram. Int., 1989; 15(2):79-85. DOI 10.1016/0272-8842(89)90018-7.