PRODUCTION AND MARKETING OF PIGEONPEA IN...
150
1 PRODUCTION AND MARKETING OF PIGEONPEA IN ANDHRA PRADESH AND MAHARASHTRA STATES OF INDIA – A SYNTHESIS DRAFT REPORT RG Deshmukh, VK Chopde, VR Kiresur, MCS Bantilan and KC Hiremath International Crops Research Institute for the Semi-Arid Tropics (ICRISAT ® )
Transcript of PRODUCTION AND MARKETING OF PIGEONPEA IN...
1
PRODUCTION AND MARKETING OF PIGEONPEA IN ANDHRA PRADESH AND MAHARASHTRA STATES OF
INDIA – A SYNTHESIS
DRAFT REPORT
RG Deshmukh, VK Chopde, VR Kiresur, MCS Bantilan and KC Hiremath
International Crops Research Institute for the Semi-Arid Tropics (ICRISAT®)
2
PART-I: PRODUCTION OF PIGEONPEA
CHAPTER–I: INTRODUCTION
Pigeonpea is an important pulse crop in semi-arid tropics of Andhra
Pradesh and Maharashtra States. It is a versatile crop and is ideally suited for
drought-prone areas. It is a fast growing crop with extensive root system. Its tap
root system allows optimum utilization of soil moisture and soil nutrients. It is
endowed with diverse useful characteristics and is a multipurpose crop – it
occupies a pride of place in rainfed farming; it is used as food, feed and fuel; it is
grown across slopes to reduce soil erosion; with its high protein content, it is
used as an ideal supplement to traditional cereals, it being a leguminous crop
fixes atmospheric nitrogen to fortify fertility benefit equivalent to about 40 kg of
nitrogenous fertilizer per ha and its heavy shedding adds considerable organic
matter to the soil. It is not only a cash (commercial) crop but also a staple food
crop. Its area and production, however, are highly fluctuating year after year on
account erratic, scanty and uneven rainfall; high infestation of pests and
diseases and highly varying market prices.
Being a drought tolerant crop, pigeonpea is being raised as a sole main
crop in Andhra Pradesh State, while it is grown as an inter-crop and subsidiary
crop in Maharashtra State with cotton, sorghum and/or greengram as the main
crops. It is interesting to note that pigeonpea is being grown as a sole crop in
Andhra Pradesh State, whereas it is raised as a subsidiary and intercrop in

3
Maharashtra State. But achieving the higher and more stable yields remains the
prime and high priority objective of both the states. An in-depth study of
production of pigeonpea was instituted both in Andhra Pradesh and Maharashtra
states to know the problems and prospects of pigeonpea as an enterprise.
Specific Objectives of the study:
The study was undertaken in both the states of Andhra Pradesh and
Maharashtra with the following specific objectives:-
(1) To analyse the trend in area, production and productivity of pigeonpea;
(2) To evaluate the resource use efficiency;
(3) To study the cropping patterns, sources of income and adoption of new
production technologies;
(4) To identify market outlets of pigeonpea;
(5) To determine marketing margins, marketing constraints, preferred traits of
pigeonpea etc. of market functionaries;
(6) To bring out the economic implications of salient findings of the study; and
(7) To recommend policy prescriptions, among others
3. Hypotheses:
The following hypotheses were formulated for testing:-
(1) There is a significant growth in the area, production and productivity of the
pigeonpea crop in the study districts;
4
(2) The sources of growth in the pigeonpea crop production have changed over
the years;
(3) Improved varieties of pigeonpea have higher yields and more stable yields
compared to the traditional varieties both in normal and drought years;
(4) Improved varieties of pigeonpea dominate due to lack of better
alternatives;
(5) The current varieties of pigeonpea cultivated by farmers are economically
viable;
(6) Farmers are aware of the seed quality parameters;
(7) Wages offered in the National Rural Employment Guarantee Project are
adversely affecting labour cost and labour availability for crop production on
farmers’ field;
(8) For pigeonpea the major factors influencing adoption of new varieties are
the yield potential, resistance to pests and diseases and seed availability.
(9) There are several constraints pertaining to seed availability (quantity,
quality, time and prices) which hinder the adoption of improved varieties;
(10) The existing seed delivery system of pigeonpea constrains the technology
adoption.
(11) Incorporation of preferred traits in the pigeonpea crop improvement
programmes will foster adoption;
(12) Different stakeholders along the value chain are willing to pay premium
prices for preferred traits in the pigeonpea varieties;
5
(13) There are various channels of marketing pigeonpea;
(14) Farmers mostly sell their pigeonpea produce through Regulated Markets;
(15) Producer’s share in consumer’s rupee is high, if sold through regulated
markets;
(16) There is significant value addition to pigeonpea along the value chain;
(17) There are several constraints in the marketing of pigeonpea;
(18) Improved technologies affect the existing gender division of labour in the
community;
(19) Increased incomes due to adoption of new technology improves household
food security and nutritional status;
(20) Women’s participation in production and marketing activities is significant;
and
(21) Women also play a significant role in on-farm operations, in decision-
making and in utilization of resources.

6
CHAPTER-II: METHODOLOGY
1. Sampling Plan
The Rangareddy and Mahabubnagar districts of Andhra Pradesh State, and
the Akola district of Maharashtra State, which fall not only under the semi-arid
tropics and drought prone areras but also have relatively more area under the
pigeonpea crop, were purposively selected for the Baseline Survey and in-depth
study. Tandur and Basheerabad Mandals from the Rangareddy district and also
Kondangal Mandal from the Mahabubnagar district of Andhra Pradesh State, and
Akola and Murtijapur Talukas from the Akola district of Maharashtra State were
selected at random for the study and they raised relatively more of pigeonpea
crop. The availability of infrastructural facilities in the form of Research Stations
too played a role in the selection of these Mandals and Talukas.
Six adopted villages at the rate of one village from the Tandur Mahal and
one village from the basheerabad Mahal of the Rangareddy district and also one
village from the Kondangal Mahal of the Mahabubnagar district of Andhra
Pradesh State; and one village from the Akola Taluka and two villages from the
Murtijapur Taluka of Maharashtra State were selected at random. Thus, the six
adopted villages so selected were (1) Old Tandur from the Tandur Mandal, and
also (2) Parwathapally from the Basheerabad Mandal from the Rangareddy
district, and (3) Kondangal from the Kondangal Mahal of the Mahabubnagar
district of Andhra Pradesh State, and (4) Agar from the Akola Taluka and (5)
Kanjara and (6) Sirso from the Murtijapur Taluka of the Akola district of
Maharashtra State.
7
Likewise, for each of these six adopted villages one neighbouring village
enjoying almost identical agro-climatic conditions was selected at random as the
control villages. Thus, the six control villages so selected were; (1)
Mittabasapally for Old Tandur, (2) Domarched for Parvathapally and (3)
Huanabad for Kondangal of Andhra Pradesh State, and (4) Ujwa for Agar, (5)
Kinkheda for Kanjara and (6) Jitapur for Sirso of Maharashtra State.
The census data on operational size of landholdings was gathered from
each of these 12 sample villages (six adopted villages and six control villages),
and the farmers in each of these 12 sample villages were classified into four farm
size groups, namely, (1) Marginal farmers, (2) Small farmers, (3) Medium
farmers and (4) Large farmers based on the size of operational landholdings
according to the standard definition. 30 sample farmers from each of the six
adopted villages were selected at random on probability proportionate to the
number of farmers falling in each of the four farm size groups. Thus, in all, 180
sample farmers were selected at random for the six adopted villages by using
multi-stage stratified random sampling technique and to ensure equal
representation to different farm size groups, the sample farmers were chosen at
random with the probability of proportionate to the number of farmers falling in
each of the four farm size groups.
Likewise, 15 sample farmers for each of the six sample control villages
were chosen at random. Thus, in all, 90 sample farmers were selected at random
for the six sample control villages.
8
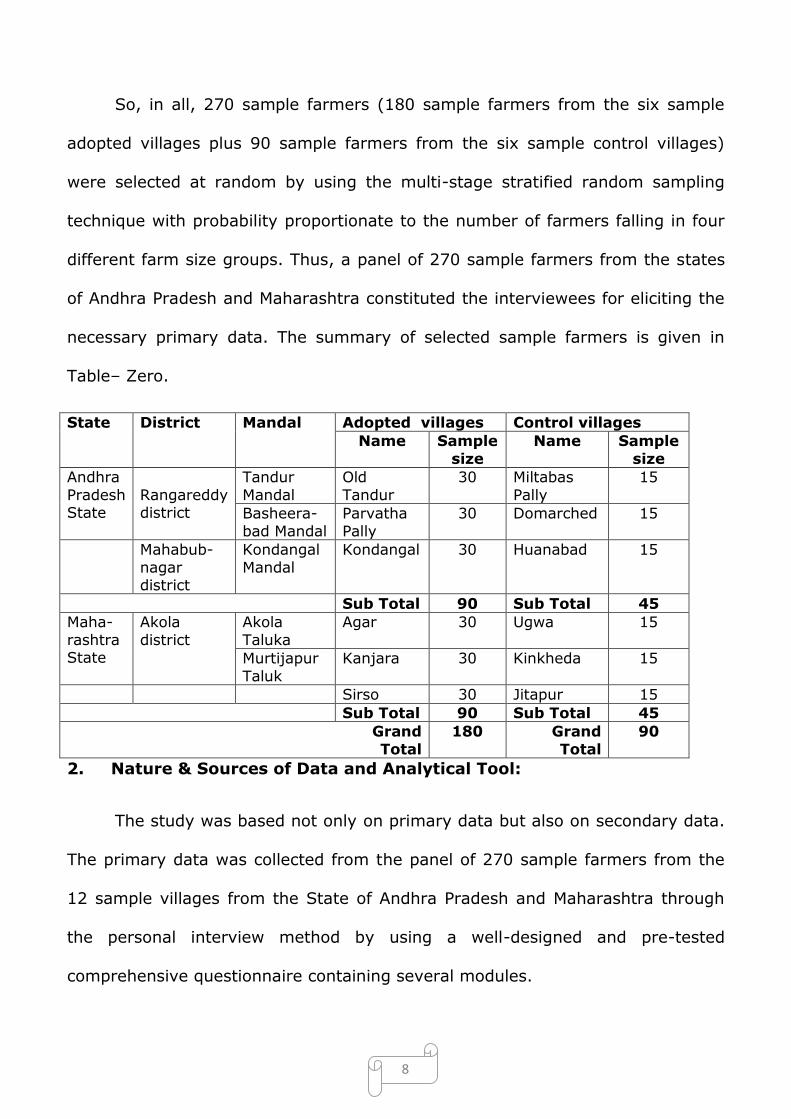
So, in all, 270 sample farmers (180 sample farmers from the six sample
adopted villages plus 90 sample farmers from the six sample control villages)
were selected at random by using the multi-stage stratified random sampling
technique with probability proportionate to the number of farmers falling in four
different farm size groups. Thus, a panel of 270 sample farmers from the states
of Andhra Pradesh and Maharashtra constituted the interviewees for eliciting the
necessary primary data. The summary of selected sample farmers is given in
Table– Zero.
State District Mandal Adopted villages Control villages
Name Sample
size
Name Sample
size
Andhra
Pradesh State
Rangareddy district
Tandur
Mandal
Old
Tandur
30 Miltabas
Pally
15
Basheera-
bad Mandal
Parvatha
Pally
30 Domarched 15
Mahabub-
nagar district
Kondangal
Mandal
Kondangal 30 Huanabad 15
Sub Total 90 Sub Total 45
Maha-
rashtra State
Akola
district
Akola
Taluka
Agar 30 Ugwa 15
Murtijapur
Taluk
Kanjara 30 Kinkheda 15
Sirso 30 Jitapur 15
Sub Total 90 Sub Total 45
Grand
Total
180 Grand
Total
90
2. Nature & Sources of Data and Analytical Tool:
The study was based not only on primary data but also on secondary data.
The primary data was collected from the panel of 270 sample farmers from the
12 sample villages from the State of Andhra Pradesh and Maharashtra through
the personal interview method by using a well-designed and pre-tested
comprehensive questionnaire containing several modules.
9
The necessary secondary data was gathered from various sources such as
the Directorate of Economics and Statistics, Hyderabad for Andhra Pradesh State
and Mumbai for Maharashtra state and 12 village Accountants from 12 sample
villages (six sample villages of Andhra Pradesh State plus six sample villages of
Maharashtra State).
The analytical tool used was simple tabular analysis.
10
CHAPTER-III: SOCIO-ECONOMIC AND DEMOGRAPHIC PROFILE
OF SAMPLE FARMERS
The socio-economic and demographic characteristics did influence the
decision-making process in respect of crop selection, cropping pattern, crop
management practices, adoption of modern technologies, farm investment
activities, income pattern etc. Hence, these characteristics were studied in-
depth. The various socio-economic and demographic features of sample farmers
were analysed and discussed with a view to providing the necessary background
for proper understanding of the economic implications of the salient findings of
the study both in Andhra Pradesh and Maharashtra States in correct
perspectives.
1. Distribution of Sample Farmers According to Farm Size:
The distribution of sample farmers in Andhra Pradesh and Maharashtra
States, according to the farm size, is presented in Table-1. The large farmers
constituted the bulk of sample farmers in Andhra Pradesh State, while in
Maharashtra State, the marginal and small farmers formed the majority. In
Andhra Pradesh State, the proportion of farmers increased with increase in the
farm size, whereas it declined as the farm size declined. The landholdings were
relatively larger in Andhra Pradesh State compared to those in Maharashtra
State.
2. Gender-wise Distribution of Land Ownership:

11
The gender-wise distribution of land ownership in Andhra Pradesh and
Maharashtra States is detailed in Table-2. The land ownership, in general, was
vested with the men both in Andhra Pradesh and Maharashtra States. Among the
sample farmers in Andhra Pradesh State only one woman owned the landholding
in the small farmers group, while several women were the owners of the
marginal small and medium farms. However, it was interesting to observe that
no woman in Andhra Pradesh State as well as in Maharashtra State owned any
land in the category of large farmers. In general, the land ownership by women
tended to diminish with increase in the farm size and it was reduced to zero in
the case of large farms both in Andhra Pradesh and Maharashtra states.
3. Distribution of Sample Farmers According to Age:
The average age of sample farm owners, according to the farm size both in
Andhra Pradesh and Maharashtra States, is given in Table-4. The average age of
farm owners was found to increase with increase in the farm size in Andhra
Pradesh State, whereas it was decreasing in Maharashtra State. The farm
owners, in general, had rich experience in farming in both the states as the
average age of the farm owners was about 42 years in Andhra Pradesh State,
while that of the farm owners in Maharashtra State was 52.
4. Educational Status of Sample Farm Owners:
The educational status of farm owners was measured in terms of the
number of years of schooling completed by the sample farm owners. Its
12
distribution in Andhra Pradesh State and Maharashtra State is given in Table-5.
The average educational status increased with increase in the farm size in
Andhra Pradesh State from 3 years in marginal farmers to 9.5 years in large
farmers. The large farmers were better educated in Andhra Pradesh.
The average educational status also tended to increase with increase in the
farm size in Maharashtra State wherein the marginal farmers had the lowest
education status of 6.67 years, while the large farmers had the highest
educational status of 8.33 years. The farm owners, in general, had better
educational status in Maharashtra State compared to that in Andhra Pradesh
State.
5. Participation of Sample Farmers in Local Bodies:
The participation of sample farmers both in Andhra Pradesh State and
Maharashtra State in local bodies is detailed in Table-6. In Andhra Pradesh State
almost all farm size categories of farmers participated in local bodies, while in
Maharashtra State only the large farmers category was able to participate in the
local bodies. The democracy was more prevalent in Andhra Pradesh State,
whereas in Maharashtra a sort of bureaucracy prevailed where only the large
farmers were allowed to participate in the local bodies. It was quite evident that
in Maharashtra State the size of landholding was the determining factor for
participation of farmers in the local bodies.
6. Caste Composition of Sample Farmers:
13
The caste composition of sample farmers in Andhra Pradesh and
Maharashtra States is presented in Table-8 and Table-9. As the farm size
increased, the backward caste and forward caste became more dominant in
Andhra Pradesh State, indicating that the large farms were owned by the
backward caste and forward caste, while the marginal and small farms were
largely owned by scheduled castes and scheduled tribes. Likewise in Maharashtra
State also backward castes and forward castes owned larger farms, while the
marginal and small farms were mostly owned by scheduled castes and scheduled
tribes.
A few larger farms were owned by scheduled caste and scheduled tribe
farmers in Andhra Pradesh, whereas no scheduled caste and scheduled tribe
farmers owned any larger farms in Maharashtra State. In both the states,
however, the proportion of scheduled castes and scheduled tribes declined with
increase in the farm size, while that of backward castes and forward castes
increased.
7. Religion-wise Distribution of Sample Farmers:
The religion-wise distribution of sample farmers in Andhra Pradesh and
Maharashtra States is presented in Table-10 and Table-11. Both in Andhra
Pradesh and Maharashtra States, the Hindu Community owned most of the
landholdings, while the ownership of landholdings by the Muslim Community,
was numerically small. The Muslim Community, however, owned small, medium
and large farms in both the States but there number was meagre.
14
8. Occupational Structure of Sample Farmers:
The occupational structure of sample farmers of both Andhra Pradesh and
Maharashtra States is described in Table-12 and Table-13. Agriculture as the
main occupation, generally, tended to increase with increase in the farm size
both in Andhra Pradesh and Maharashtra States, while business and services
were the main occupation in the marginal and small farmers in both the states.
The relatively smaller farm size groups in both the states relied more on diverse
occupations in order to see that both the ends met.
9. Distribution of Sample Farmers According to Secondary Occupations:
The distribution of sample farmers, according to the secondary occupations
in Andhra Pradesh and Maharashtra States, is detailed in Table-14 and Table-15.
Both in Andhra Pradesh and Maharashtra States, the secondary occupations
tended to diminish with increase in the farm size. In other words the farmers
who had no secondary occupations increased with increase in the farm size. In
both the States, the secondary occupations increased with decrease in the farm
size and agriculture was the secondary occupation for a large number of
marginal and small farmers.
10. Average Family Size across Farm Size:
The distribution of sample farmers, according to the average family size in
Andhra Pradesh and Maharashtra States, is given in Table-16. In Andhra Pradesh
state the average family size increased with increase in the farm size as also in
Maharashtra State. In Andhra Pradesh State, it rose from 5.17 in marginal
15
farmers to 6.33 in large farmers, while in Maharashtra State from 5.5 in
marginal farmers to 6.5 in large farmers.
11. Land Ownership Pattern of Sample Farmers:
The land ownership pattern of sample farmers in Andhra Pradesh and
Maharashtra States is presented in Table-17. In both the states, a large
proportion of land ownership consisted of dryland and a small proportion of
irrigated land; and the portion of irrigated land increased with increase in the
farm size.
12. Pattern of Ownership of Farm Implements:
The farm size-wise pattern of ownership of farm implements in Andhra
Pradesh and Maharashtra States is detailed in from Table-18 to Table-24. In
Andhra Pradesh State, the marginal farmers and small farmers possessed a large
number of tractors, Bullock carts, sprayers, harvester, trucks, autos, etc. for the
purpose of custom hiring in order to meet both ends because for most of them
agriculture was a secondary occupation. Similarly, the marginal and small
farmers in Maharashtra State owned a fairly large number of farm implements
for the purpose of custom hiring. These farmers were earning a substantial
income by hiring out their farm implements. In Maharashtra State, the rental
income was the highest source of income, and in Andhra Pradesh State, it
formed the third highest source of income. The custom hiring had become an
attractive profession in both the states for all the farm size groups of farmers.
13. Distribution of Durable Assets Among Sample Farmers:
16
The distribution of durable assets among the sample farmers of both
Andhra Pradesh and Maharashtra States is detailed from Table-25 to Table-34.
In both the states all the farmers possessed residential houses and TV or radio
and most of them owned two-wheelers. Practically all the farmers had fans. The
total value of durable assets increased with increase in the farm size.
14. Financial Assets and Liabilities of Sample Farmers:
The financial assets and liabilities of sample farmers of Andhra Pradesh and
Maharashtra States are presented in Table-35. In Andhra Pradesh State, though
the institutional credit constituted the major source of finance, the private money
lenders had lent almost an equal sum of money. The friends & relatives and
private finance companies formed an important source of finance, lending of
fairly substantial sum of money. In Maharashtra State also the institutional credit
constituted the most important and predominant sources of credit. The amount
of money borrowed from private moneylenders was the least.
In Andhra Pradesh State, most of the savings were in the form of LIC
policies and Bank deposits, whereas in Maharashtra State, the savings were in
the farm of bank deposits, followed by LIC Policies and Post Office Saving
Schemes.
15. Average Interest Rates Charged by Public Institutions, Private
Institutions and Individuals:
The average interest rates charged by public institutions, private institution
and individuals in Andhra Pradesh and Maharashtra States are given in Table-36.
17
In Andhra Pradesh State, the cooperatives charged on an average an interest
rate of about 10.5 percent per annum, the Nationalised Banks at about 11.8
percent, the private moneylenders at about 25 percent, the private finance
companies at about 35 percent and Friends and Relatives at about 30 percent,
while in Maharashtra State, the cooperatives charged at about 7 percent, the
Nationalised Bank at about 6.5 percent and private moneylender at 10 percent.
The interest rates charged in Andhra Pradesh State were much on the higher
side and abnormal as compared to those in Maharashtra State where the interest
rates were quite rational and moderate.

18
CHAPTER-IV: RESULTS AND DISCUSSION
1. Area, Production and Productivity of Pigeonpea:
During the period from 1970-71 to 2007-08, the area under pigeonpea in
Andhra Pradesh state had been on the increase and it rose to an extent of
1,34,000 ha, registering a growth rate of 2.85 percent. The pigeonpea
production increased to 1,00,000 tonnes recording a growth rate of 5.57 percent
and the productivity was 292 kg per ha registering a growth rate of 2.46 percent.
It was both area and productivity led growth in Andhra Pradesh State. Adoption
of improved varieties of pigeonpea namely, Abhaya, Asha, Maruti, Lakshmi,
Durga, LRG-30, and LRG-41 contributed immensely for the enhancement of
productivity, in particular in Andhra Pradesh State.
During the long period from 1950-51 to 2006-07, the area in Maharashtra
State increased from 2.18 m.ha to 3.63 m.ha, recording a net increase in area of
66.5 percent, while the production rose from 1.13 m.tonnes to 2.77 m.tonnes,
registering a net increase in production of 145 percent. The productivity of
pigeonpea increased from 448 kg per ha to 867 kg per ha, showing a net
increase in the yield of 93.53 percent. In Maharashtra State also it was area and
yield led growth. Here also adoption of improved varieties of pigeonpea on a
fairly large scale added largely to enhancement of productivity of pigeonpea.
Thus both in Andhra Pradesh and Maharashtra states it was area and yield
led growth due largely to the adoption of improved varieties of pigeonpea on a
large scale.
19
2. Major Sources of Annual Net Income of Sample Farmers:
The major sources of annual net income of sample farmers in Andhra
Pradesh and Maharashtra States are shown in Table-37. In Andhra Pradesh
state, the income from crops formed the highest source of income and rightly so,
constituting more than 50 percent of the total annual income, followed by the
aggregate livestock income, whereas the rental income obtained from hiring out
farm implements constituted the highest source of income in Maharashtra State
forming about 30 percent of the total annual income, follows by the income from
crops which was about 15 percent of the total annual income. It was interesting
to note that in Andhra Pradesh State the income from crops was the dominant
source of income, while it was the second highest source of income in
Maharashtra State where the rental income fetched the highest income and
formed surprisingly the most profitable enterprise. The partial mechanization of
agriculture had been in full swing in Maharashtra State on account of non-
availability of adequate labour for time-bound agricultural operations.
The rental income, obtained from hiring out farm implements, has been, of
late, coming up fast in Andhra Pradesh State also in view of the scarcity of labour
for timely agricultural operations at the peak period, while in Maharashtra state
livestock industry was upcoming and bringing substantial income to the farmers
in the State.
3. Cropping Pattern of sample Farmers:

20
The cropping patterns practised by sample farmers in Andhra Pradesh and
Maharashtra States are detailed in Table-38. In Andhra Pradesh State the major
crops in the kharif seasons were pigeonpea, cotton, blackgram, castor,
greengram, sorghum, paddy as sole crops and in the rabi season rabi sorghum,
safflower, paddy and chickpea as sole crops. Pigeonpea was being grown as a
sole crop mostly under rainfed conditions with gross returns ranging from
Rs.7218 from the local variety to Rs.8480 from the improved variety of
pigeonpea, LRG-30. Several improved varieties of pigeonpea such as Asha, Arun,
Abhaya, Durga, Lakshmi, LRG-30, LRG-41 and Maruti were being raised under
rainfed conditions. The interesting point to note was that pigeonpea was being
raised as a sole crop of Andhra Pradesh State unlike in Maharashtra State where
it was being grown as an inter-crop with cotton, sorghum and greengram as
main crops and largely under rainfed conditions.
In Maharashtra State, the major crops raised in the kharif season were
cotton+greengram+pigeonpea, cotton+pigeonpea, sorghum+ pigeonpea,
cotton+sorghum+pigeonpea and greengram+pigeonpea as inter-crops, and in
the rabi season, rabi sorghum, wheat+sunflower and chickpea+sunflower. The
important point to note was that pigeonpea was raised as an inter-crop and
mostly under rainfed conditions. Only a few improved varieties of pigeonpea
such as Maruti, Asha and Ganesh were grown as inter-crops along with cotton,
sorghum and greengram as the main crops in Maharashtra State. It was
important note that the pigeonpea was being raised throughout Maharashtra
State as an inter-crop and a subsidiary crop unlike in Andhra Pradesh State
where pigeonpea was being grown a sole crop and an entire crop.
21
In Andhra Pradesh State, the cultivation of LRG-30 improved variety of
pigeonpea, LRG-30 as a sale cross brought the highest gross return of Rs.8480
and in Maharashtra State, the contribution of cotton+sorghum+pigeonpea
fetched the maximum gross return of Rs.10112 under the rainfed condition, and
that of sorghum+pigeonpea brought in a gross return of Rs.14450 under the
irrigated condition.
4. Consumption Pattern and Expenditure of Sample Farmers:
The annual consumption pattern and expenditure of sample farmers in
Andhra Pradesh and Maharashtra States are detailed in Table-39. The farmers is
the study area of Andhra Pradesh state were mainly rice eaters, and the rice
constituted 75 percent of the cereals and millets consumed by them. They also
consumed at the same time an exceedingly large quantity of pigeonpea which
formed more than 68 percent of the total pulses consumed by them. Whereas,
the farmers in the study area of Maharashtra State were mainly wheat eaters,
and the wheat formed 70 percent of the cereals and millets consumed by them,
and they also consumed at the same time large quantity of pigeonpea which
constituted more than 40 percent of the total pulses consumed. These were the
distinctive features of farmers in both the study areas – the farmers of Andhra
Pradesh State were mainly rice eaters and those of Maharashtra State were
mainly wheat eaters and both ate plenty of pigeonpea dal.
5. Reasons for Growing Pigeonpea:
22
The reasons for growing pigeonpea in Andhra Pradesh and Maharashtra
States are stated in Table-40. The most important reasons for growing the
pigeonpea crop in Andhra Pradesh and Maharashtra States were that it fetched
very high income as a cash crop to the farmers and it was best suited to their
marginal lands. It also incurred low input costs and it restored soil fertility as a
leguminous crop, capable of fixing atomospheric nitrogen directly into the soil. It
was being consumed as food, feed and fuel.
The pigeonpea crop was being grown every year but in different pieces of
land each year both in Andhra Pradesh and Maharashtra States (Table-41).
6. Crop Rotation followed by Sample Farmers:
The crop rotation followed by sample farmers of Andhra Pradesh and
Maharashtra states is presented in Table-42. In Andhra Pradesh State, in most of
the cases pigenopea succeeded pigeonpea and in seldom cases it succeeded
chickpea and sorghum crops, while in Maharashtra State, it succeed a variety of
crops such as chickpea, wheat, wheat+gram, and wheat+safflower. In
Maharashtra State, however, a good rotational system was followed, while in
Andhra Pradesh State pigeonpea followed pigeonpea in most of the cases.
7. Change in Area of Pigeonpea crop during the Last Five Years:
The change in the area of pigeonpea crop as conceived by the sample
farmers of Andhra Pradesh and Maharashtra States is presented in Table-43. In
Andhra Pradesh State, the farmers were under the impression that the area
under pigeonpea was constant or increasing, whereas the farmers in
23
Maharashtra state thought that the area was either constant or decreasing. Most
of the farmers in both the states conceived that the area under pigeonpea was
constant during the last five years.
8. Crops Replacing Pigeonpea during the Last Five Years:
In Andhra Pradesh state, sorghum and blackgram crops were found to
replace the pigeonpea crop, whereas in Maharashtra State, soyabean and
greengram crop were reported to be replacing the pigeonpea crop (Table-44). Of
late, soyabean has been picking up very fast in Maharashtra State.
9. Whether Pigeonpea was Grown as Sole Crop/Intercrop/Mixed Crop:
In Andhra Pradesh State, pigeonpea was being grown as sole crop, while in
Maharashtra State it was being raised as inter-crop (subsidiary crop) with cotton,
sorghum, soyabean and greengram as the main crops(Table-45).
10. The Year in which the Area under Pigeonpea was Maximum:
In Andhra Pradesh State the area under pigeonpea was maximum in 2006-
07, while in Maharashtra State it was maximum during the year 1974-75 (Table-
46).
11. Average Yield of Pigeonpea in Good and Bad Years:
In Andhra Pradesh State the improved yield obtained was about 506 kg
per acre in good year and 228 kg per acre in drought year, while in Maharashtra
State it was 554 kg per acre in good year and 354 kg per ha in drought year
(Table-47).
24
12. Area under Different Improved Varieties of Pigeonpea during the Last
3 years:
In Andhra Pradesh State the improved variety Asha occupied the maximum
area in 2006-07, while in Maharashtra State. Maruti occupied the maximum area
in 2004-05 (Table-48).
Maruti was the first improved variety of pigeonpea to be introduced in
2001-02 in Andhra Pradesh State and it occupied the peak area in 2006-07,
whereas it was introduced in Maharashtra State in 1999-2000 and it occupied the
peak area in the year of its introduction itself (Table-49).
13. Step followed by sample Farmers in Selecting Seeds from their Own
Crop and Precautions Exercised in their Preservation:
The steps followed by the sample farmers in selecting seeds from their own
crops and precautions exercised in their preservation in Andhra Pradesh and
Maharashtra States are listed in Table-50 and Table-51 respectively. The steps
followed by farmers in selecting seeds from their own crops and precautions
exercised in their preservation were practically the same both in Andhra Pradesh
and Maharashtra States. There was no difference whatsoever.
14. Factors considered by Sample Farmers, when Purchasing Seeds of
Pigeonpea:
The factors considered by the sample farmers of Andhra Pradesh and
Maharashtra States, when purchasing seeds of pigeonpea are stated in Table-52.
The prime factors considered were the market prices and brand name in Andhra
Pradesh State, while in Maharashtra State they were brand name first and
25
market prices second. Therefore, pricing of pigeonpea seeds and brand names
mattered most both in Andhra Pradesh and Maharashtra States. There was
greater need to price the pigeonpea seeds as low as possible and make them
available in sufficient quantities of quality seeds in both the States.
15. Major Constraints confronting Sample Farmers in Purchasing
Pigeonpea Seeds:
The major constraints confronting farmers in purchasing pigeonpea seeds
in Andhra Pradesh and Maharashtra States are given in Table-53. Lack of
information about the variety of seeds recommended for the concerned areas,
non-availability of the required variety of pigeonpea seeds, high pricing of
pigeonpea seeds, non-availability of credit sale facility and the need to travel
long distance to purchase pigeonpea seeds were the major constraints
confronting farmers. Of them, the non-availability of required branch name, high
pricing and non-availability of credit sale facility constituted the greatest
handicaps and they mattered most in both the states.
The quality seeds of pigeonpea must be made available in plenty, and
credit sale facility must be available to facilitate farmers to purchase pigeonpea
seeds in adequate quantities. Furthermore, the seed depots must be opened at
the village level itself in order to avoid the need for farmers to travel long
distances for purchasing pigeonpea seeds.
26
16. Major Pests and Diseases Affecting Pigeonpea:
The major pests and diseases attacking the pigeonpea crop in Andhra
Pradesh and Mahaashtra States are given in Table-54. Both in Andhra Pradesh
and Maharashtra States, the pod borers among pests and the Fusarium wilt
among diseases played havoc in the production of pigeonpea. They occurred
every year in epidemic form and caused tremendous losses.
Therefore, the breeding of pigeonpea cultivars resistant to pod borers and
wilt has been a dire necessity and a major challenge to our plant breeder vis-à-
vis to the ICRISAT, Hyderabad.
The causes for the occurrence of these pests and diseases in Andhra
Pradesh and Maharashtra states are stated in Table-57. Growing pigeonpea
every year without any break and raising pigeonpea varieties which were
susceptible to these pests and diseases in both the states were the predominant
causes. Unless the pigeonpea cultivars, which were totally resistant to these
specific pests and diseases were evolved and adopted, it would be a recurring
feature every year.
The measures adopted by farmers for controlling these pests and diseases
in Andhra Pradesh and Maharashtra States are detailed in Table-58. The
application of insecticides and fungicides and traditional control measure were
found to be effective in both the States.
17. Sources of Information Availed by Sample Farmers on Control
Measures Against Pests and Diseases:
27
The sources of information availed of by the sample farmers in Andhra
Pradesh and Maharashtra States on the control measures as to what to apply,
when to apply, how to apply and how much to apply are given in Table-59. In
Andhra Pradesh State one’s fellow farmers constituted the major source of
information on the control measures, whereas it was news papers in Maharashtra
state. The frequency of these means of communication should be increased to
make them more effective and news papers must be made cheaper and their
circulation must be physically increased.
18. Constraints in Cultivars of Pigeonpea:
The cultivars in pigeonpea, including the improved ones in Andhra Pradesh
and Maharashtra States, suffered from the low yields, small grain size, high pest
and diseases incidence, poor taste, long duration of the crop, low shelling
percentage, etc. (Table-60). The constraints expressed by the farmers should be
eye openers for the R&D of the ICRISAT, Hyderabad and the respective State
Governments to concentrate their efforts in enhancing crop yields, developing
resistance power to pests and diseases, reducing duration of the crop, increasing
the grain size, bringing about better taste, enhancing recovery percentage etc.
These improvements in the cultivars of pigeonpea should be given top priority in
the research agenda.
19. Preferred Traits in Cultivars of Pigeonpea:
The preferred traits in respect of production, consumption, fodder values
and marketing view points as conceived by farmers of Andhra Pradesh and
28
Maharashtra states are expressed in Table-61 to Table-64. By and large the
preferred traits were just the opposite of the defects and deficiencies found in
the existing cultivars of pigeonpea in respect of production, consumption, fodder
and marketing.
These preferred traits served as a good feedback to the ICRISAT,
Hyderabad, and the state Governments of Andhra Pradesh and Maharashtra to
act and support farmers in achieving their desired goals.
20. Incorporation of Preferred Traits in Cultivars of Pigeonpea and
Payment of Premium Prices by Sample Farmers:
The percentage of premium prices the farmers of Andhra Pradesh and
Maharashtra States were willing to pay are presented in Table-65. The farmers
from Andhra Pradesh State were willing to pay a premium price of about 20
percent more than the existing price, whereas the farmers from Maharashtra
State were prepared to pay a premium price ranging from about 30 percent to
50 percent more than the ruling price. The farmers from Maharashtra state were
more enthusiastic and prepared to pay much higher premium prices for the
incorporation of preferred traits in cultivars because they suffered must from the
defects and deficiencies in that existing cultivars.
The farmers, in general, were in favour of bringing about radical
improvements in the new cultivars of pigeonpea.
21. Utilization of Pigeonpea Produce:
29
The variety-wise utilization on pattern of the pigeonpea produce in Andhra
Pradesh and Maharashtra states is given in Table-66. More than 95 percent of
the pigeonpea produce in Andhra Pradesh state was sold out and the rest was
used as food, feed and seed purposes, while nearly 90 percent of it was
marketed in Maharashtra state and nearly 9 percent was for home consumption.
Pigeonpea constituted as a cash cropand a staple food crop in both the states.
22. Market Outlets of Pigeonpea:
The places of marketing of pigeonpea produce in Andhra Pradesh and
Maharashtra states are given in Table-67. In Andhra Pradesh state, the
pigeonpea produced was sold out solely in the Regulated Markets directly to the
commission agents, whereas in Maharashtra State it was mostly sold out in the
Regulated Markets and partly in the village markets. Though the prices obtained
in the Regulated were much higher in Maharashtra state, additional marketing
costs had to be incurred, while no marketing costs were incurred in the village
sales.
23. Time of Sale of Pigeonpea Produce by Sample Farmers:
The time of sale of the pigeonpea produce by farmers of Andhra Pradesh
and Maharashtra States is given in Table-68. A great majority of the farmers
from Andhra Pradesh State sold their pigeonpea produce immediately after the
harvest to have cash on hand to repay the loans and to meet the household
financial obligations, while an overwhelming majority of the farmers from
Maharashtra State marketed their pigeonpea produce for the same reasons,
30
besides the lack of storage facilities at home compelled them to sell their
pigeonpea produce.
In both the states, there was an urgent need for creation of scientific
storage facilities at the village level itself in the form of rural godowns. This
would enable the farmers not only to store their pigeonpea produce for better
prices but also to get pledge loans.
24. Duration of Storage and Structures Used for Storing Pigeonpea
Produce by Sample Farmers and Precautions taken:
The duration of storage and the structures used for storing the pigeonpea
produce by farmers of Andhra Pradesh and Maharashtra states are presented in
Table-69. In Andhra Pradesh State, some of the farmers stored the pigeonpea
produce for about a month in the gunny bags in their houses, while the farmers
of Maharashtra State some farmers stored for over a month after the harvest in
their houses in the gunny bags. The number of farmers, who stored the
pigeonpea produce, was marginal in both the states. This showed the urgency of
creation of rural godowns at the village level to store for better prices and to
obtain pledge loans to meet their urgent financial needs.
The pigeonpea produce was stored in clean gunny bags to allow free
aeration. The pigeonpea produce was mixed with neem leaves in traditional
manner, besides spraying gamaxine periodically apart from using aluminum
phosphide capsule.
25. Sources of Information on Market Prices:
31
The sources of information about market prices for the farmers of Andhra
Pradesh and Maharashtra States are spelled out in Table-71. In Andhra Pradesh
State, one’s relatives, friends and fellow farmers constituted the major source of
information on market prices and partly commission agents also formed an
important source of market prices, whereas in Maharashtra state, the news
papers were the main source of information about market intelligence and
information.
26. Advantages and Disadvantages of Sale of Pigeonpea Produce to
Commission Agents at the Regulated Markets and Village Markets.
The advantage and disadvantages of marketing the pigeonpea produce to
commission agents at the Regulated Markets and Village Markets in Andhra
Pradesh and Maharashtra States are listed in Table-72. In Andhra Pradesh state,
where the entire marketable surplus was sold out to commission agents
stationed at the Regulated Markets, there were some advantages for example,
the commission agents provided credit to the farmers as and when required,
besides the early settlement of their accounts and correct weighment. There
were also some disadvantages, for example, the prices offered were slightly low,
payment of interest on the credit borrowed and at times, the payment of sale
proceeds were delayed.
In Maharashtra State where Village Sales of the Pigeonpea produce
dominated, the advantages were spot payment of sale proceeds, and no
marketing costs were incurred, while the major disadvantage was that the village
rates were definitely much lower than the rates at the Regulated Markets.

32
27. Gender Issues:
The gender issues in the (i) pigeonpea cultivation, (ii) ownership of
resources, (iii) decision-making with respect to different resources and (iv)
utilization of resources in Andhra Pradesh and Maharashtra States are detailed in
Table-73 to Table-76. The issues are almost identical in both the states. Land
preparation, selection of variety of pigeonpea, inter-culture operations,
harvesting, transport of pigeonpea produce and seed selection & storage were
the prerogative of men. In hand weeding operations women participated
significantly, while sowing seeds and threshing & winnowing operations were
decided jointly.
The assets such as land, livestock and farm implements were generally
owned by men. Men had a major role to play in inputs management such as
credit, seeds, fertilizers and pesticides, while use of labour both own and hired
labours were jointly decided. Women had a major say in household maintenance,
children’s education the children’s marriage and migration matters women were
generally consulted and these matters were jointly settled.
28. Sources of Information to Farm Women on New Technologies:
The sources of information to farm women on new technologies in Andhra
Pradesh and Maharashtra States are given in Table-77. IN Andhra Pradesh State,
one’s relatives, friends and fellow farm women constituted the major source of
information on new production technologies and new agricultural programmes,
while in Maharashtra state the news papers served the purpose. The sources of
33
information were precisely the same as in the case of farm men in the respective
states.
29. Constraints Confronting Farm Women in Pigeonpea Cultivars
Selection:
The constraints confronting farm women in the selection of pigeonpea
cultivars in Andhra Pradesh and Maharashtra States are given Table-78. In both
the states the major constraints confronting the farm women were low yields,
high pests and diseases incidence, long duration, small size, dull coloured grains,
poor taste and low recovery percentage. These were precisely the same
constraints expressed by the farm men both in Andhra Pradesh and Maharashtra
States. Both farm men and women thought alike and they were on the same
wave length. The farm women were also willing to pay premium prices, if the
cultivars were to include their preferred traits (Table-83).
30. Preferred Traits, of Farm Women in Pigeonpea Cultivars in respect of
Production, Consumption, Fodder-Production and Marketing-Purpose:
The preferred traits of farm women in the cultivars of pigeonpea in respect
of production, consumption, fodder-production and marketing-purpose in Andhra
Pradesh and Maharashtra States are presented in Table-79 to Table-82. They
were mainly high yields, short duration, drought resistance, resistance to pests
and diseases and high recovery percentage in respect of production; better taste,
less cooking time and high keeping quality from the consumption view point;
more fodder quantity, more portability and more durability from the angle of
34
fodder production; and high demand, higher prices and bigger sized grains from
marketing view point. These were precisely the same preferred traits of farm
men in both the states. Both farm men and farm women in both the states
thought alike and expressed the same preferred traits in respect of production,
consumption, fodder-production and marketing-purpose.
31. Input-output Analyses of Pigeonpea:
The results of input-output analyses of pigeonpea in Andhra Pradesh and
Maharashtra States are presented in Table-84. In Andhra Pradesh state, the
pigeonpea production as the sole crop was economically viable and substantially
profitable, while in Maharashtra state, it was a losing concern as the inter-crop
and as the subsidiary crop in view of the soaring prices of purchased agricultural
inputs, and the income from crops was the second highest source of total income
in view of recurring droughts in the study area in Maharashtra State.
32. Cost & Return Structures of Improved Varieties of Pigeonpea:
The cost and return structures of Asha and Abhaya under rainfed
conditions in Andhra Pradesh State and those of Maruti, Asha and Ganesh under
rainfed conditions and also of Maruti and Asha under irrigated conditions are
presented in Table-85. These improved varieties of pigeonpea in both the states
were economically viable and substantially profitable, and their benefit-cost
ratios were greater than unity. The net returns from Asha and Abhaya varieties,
though grown under the rainfed condition, were substantial as the sole crops,
whereas the net returns from Maruti, Asha and Ganesh were marginal under
35
rainfed conditions in Maharashtra State where they were grown as the inter-crop
and subsidiary crop.
36
PART-II: MARKETING OF PIGEONPEA
CHAPTER-I: INTRODUCTION
Agricultural marketing is a study of all marketing activities, agencies and
policies involved therein. It includes the movement of agricultural produce from
the farmers to consumers. Our farmers have now become more market-oriented
and sell most of their pigeonpea produce in the Regulated Markets. Earlier, most
of the farmers used to sell most of their pigeonpea produce in their own villages
to the commission agents and/or traders visiting their villages for buying the
pigeonpea produce at the mutually agreed prices, and the payment was made on
the spot.
The farmers now realize that the pigeonpea produce would fetch a higher
price, if it were to be sold in the Regulated Markets. Farmers, however, feel that
they are not getting a remunerative price for their produce. The farmers
complain that, though the agricultural input prices have more than doubled in
the last few years, the pigeonpea price have not risen even by 10 percent.
Lack of storage facilities at the household and immediate need for cash on
hand to repay the loans and to meet other domestic financial obligations compel
the farmers to sell their pigeonpea produce soon after the harvest, when the
market prices are at the low ebb, because the market arrivals then are far
greater than the demand for it. Such a situation is bound to depress the market
prices. This phenomenon, unfortunately, is a common recurring situation every
year, and the farmers are at a receiving end.
37
Marketing of pigeonpea has not received as much attention as it reserves.
The Regulated Markets are generally controlled by the market functionaries. With
the gradual displacement of subsistence farming by commercial farming, the
marketing system has assumed paramount importance in recent years. The
pattern of movement of pigeonpea produce from the farmers to the consumers
plays a crucial role in determining the returns to the farmers.
To increase the operational and pricing efficiency, to rationalize marketing
margins and to reduce the marketing costs an understanding of the nature and
extent of existing marketing margins, marketing costs, price spread, etc. is very
essential. Once the existing marketing problems are identified, proper measures
can be effected to solve the burning problems of agricultural marketing. With this
end in view, an in-depth study of marketing of pigeonpea in the Regulated
Market, Tandur of Rangareddy district of Andhra Pradesh and the Regulated
Market of Akola of Akola district of Maharashtra was instituted. This study has
been of great relevance and practical significance for establishing an orderly
marketing system to enable farmers to get their due share in the consumer’s
rupee. Otherwise, increased production of pigeonpea would not serve any
purpose and sustain it.
2. Specific Objectives of the Study:
The following specific objectives were formulated for the study:-

38
(1) To identify the structure and composition of market functionaries operating in
the pigeonpea markets in Tandur and Akola.
(2) To evaluate the conduct and performance of various marketing functionaries.
(3) To break down the marketing margins into different components, and
estimate the share of producer in the consumer’s rupee and
(4) To suggest appropriate measures for improvement of the marketing system,
among others
3. Hypotheses:
The following hypotheses were formulated for testing:-
(1) There are various channels of marketing pigeonpea;
(2) There is a significant value addition to pigeonpea along the value chain;
(3) There are several constraints on marketing of pigeonpea;
(4) The consumers have preferred quality traits for pigeonpea; and
(5) The consumers face several constraints on the consumption of pigeonpea.
CHAPTER-II: METHODOLOGY
1. Sampling Plan:
In order to achieve the objectives of the study, the market functionaries
were first divided into four categories, namely, (1) commission agents, (2)

39
processors, (3) retailers and (4) consumers. Then a representative sample of
these four groups of market functionaries were selected at random. From the
Tandur Regulated Market, 7 commission agents, 4 processors, 5 retailers and 8
consumers (4 rural consumers plus 4 urban consumers) were selected at random
for Andhra Pradesh, whereas from the Akola Regulated Market, 8 commission
agents, 4 processors, 6 retailers and 12 consumers (6 rural consumers plus 6
urban consumers) were selected at random for Maharashtra. Thus, 24 sample
market functionaries constituted the panel of interviewees for the collection of
the necessary primary data for Andhra Pradesh, while 30 sample market
functionaries formed the panel of interviewees for Maharashtra.
2. Nature & Sources of Data and Method of Analysis:
The study was based on primary and secondary data. The necessary
primary data on marketing costs, marketing margins, purchase prices, sale
prices, marketing constraints etc were collected from 24 sample market
functionaries of the Tandur Regulated Market from Andhra Pradesh and 30
sample market functionaries of Akola Regulated Market from Maharashtra State,
and the secondary data on market arrivals and peak months of market arrivals
were gathered from the respective Regulated Markets.
The simple tabular analytical technique was used to analyse the data
collected from various sources.
40
CHAPTER-III: COMMISSION AGENTS
1. Annual Turnover:
In Andhra Pradesh, each commission agent, on an average, handled
annually abut 201 tonnes of pigeonpea in addition to dealing in several other
agricultural crops, while in Maharashtra, each commission agent dealt in, on an
average, annually about 44 tonnes of pigeonpea, besides handling several other
agricultural crops (Table-M1). The commission agent in the Tandur Regulated
Market of Andhra Pradesh negotiated a much higher volume of pigeonpea than
that handled by the commission agent as Regulated Market of Akola,
Maharashtra. Thus, the average annual turn over of the commission agent in
Andhra Pradesh was substantially more than that in Maharashtra State,
considering the fact that the commission agent handled several other crops
simultaneously.
2. Contractual Arrangements and Time of Payment of Sale Proceeds:
The commission agents in Andhra Pradesh had entered into a contractual
arrangement to advance credit to the farmer clientele as and when required and
this contractual arrangement was strictly followed, while no such an arrangement
was in vogue in Maharashtra where spot payment was made soon after the
pigeonpea produce was sold by the commission agent, and the question of delay
in the payment of sale proceeds did not arise in Maharashtra (Table-M2 and
Table-M4). A nominal interest on the credit advanced to farmers by the
commission agent was charged in Andhra Pradesh.
41
3. Quality Characteristics taken into Account by Commission Agents,
while Buying Pigeonpea:
The quality characteristics considered by commission agents of Andhra
Pradesh and Maharashtra States, while buying pigeonpea are presented in Table-
M5. The commission agents both in Andhra Pradesh and Maharashtra States paid
top priority to bigger sized grains, followed by the cleanliness of the pigeonpea
produce and they were also willing to pay premium prices for these quality
characteristics. This gave a clear signal to the farmers to be bring clean
pigeonpea produce to the market, and to the plant breeders to evolve such
varieties of pigeonpea which produced bigger sized grains of pigeonpea.
4. Higher Prices for Higher Grades:
The market prices offered for various grades of pigeonpea (A, B and C
grades) in Andhra Pradesh and Maharashtra States are shown in Table-M6. The
higher the grade of pigeonpea produce the higher was the price offered for it in
both the states. The higher grade of pigeonpea had its own rewards in the form
of higher prices and easy marketability.
5. Crops Traded by Commission Agents:
The number of crops in which the sample commission agents traded in
Andhra Pradesh and Maharashtra States are given in Table-M7b. The commission
agents traded in a number of crops besides the pigeonpea produce, and enlarged
thereby their margin of profit.
6. Purchase and Sale Prices of Pigeonpea of Commission Agents:
42
Table-7b presents the details of purchase and sale prices of pigeonpea of
sample commission agents in Andhra Pradesh and Maharashtra States. The
commission agents of Andhra Pradesh made a gross profit of about 7 percent,
while those of Maharashtra earned a gross profit of 12 percent in pigeonpea
itself, in addition to dealing simultaneously in several other crops. From each
crop they earned a comfortable margin of profit. Thus, the total profit made by
the commission agents was substantial.
7. Marketing Margin of Commission Agents:
The details of market margins earned by sample commission agents of
Andhra Pradesh and Maharashtra States are spelt out in Table-M8. Though in
both the states the margin of profit per quintal was nominal, but the quantity
handled by each commission agent was tremendous. Therefore, the total profit
earned by a single commission agent was substantial. Since each commission
agent dealt in several crops, the cumulative profit was stupendous.
8. Marketing Constraints Confronting Commission Agents:
The marketing constraints confronting sample commission agents in
Andhra Pradesh and Maharashtra States are detailed in Table-M9a. In Andhra
Pradesh, the storage pests and rodents as also wide fluctuations in prices were
great nuisances, while in Maharashtra, poor infrastructural facilities, followed by
wide fluctuations in the prices of pigeonpea were the major constraints faced by
the commission agents. They also complained of lack of scientific storage
facilities.
43
9. Suggestions of Commission Agents for Marketing System
Improvement:
The suggestions made by commission agents for improving the marketing
system in Andhra Pradesh and Maharashtra States are listed in Table-M9b. In
Andhra Pradesh, since the Minimum Support Price Policy had, in fact, become the
Maximum Support Price Policy on account of bad and ineffective handling of this
potent instrument. The Minimum Support Price Policy should be made more
effective. Grading of the pigeonpea produce must be done, before trading in
order to fetch higher prices. These were the major suggestions made by the
commission agents for the improvement of the marketing system in Andhra
Pradesh State.
In Maharashtra also, several suggestions were made to improve the
marketing system. They were (i) to make the Minimum Support Price Policy
really effective as pointed by the commission agents of Andhra Pradesh State,
(ii) to control fluctuations in pigeonpea prices, (iii) to rationalize transport
charges, (iv) to develop the pigeonpea grading skill in farmers, and (v) to create
good market infrastructural facilities.
These are very constructive suggestion which deserve to be implemented
in both the states.
44
CHAPTER-IV: PROCESSORS
1. Procession Capacity:
The processing capacity utilized both in Andhra Pradesh and Maharashtra
states is presented in Table-M10. The processing capacity established was being
underutilized in both the States. The actual capacity utilized was about 60
percent and the remaining 40 percent was the idle capacity in both the states,
while the recovery rate for dal worked out to 75 percent.
2. Sources of Pigeonpea Grains for Processing:
The sources of purchase of pigeonpea grains for processing in Andhra
Pradesh and Maharashtra States are shown in Table-M11. In Andhra Pradesh,
the four sample processors bought annually about 7320 tonnes of pigeonpea
grains from the Regulated Market at Tandur, while the same number of
processors in Maharashtra purchased about 5400 tonnes of pigeonpea grains
from the Regulated Market at Akola. On an average, the quality bought for
processing by each processor was greater in Andhra Pradesh than that in
Maharashtra.
3. Net Margin of Profits:
The net margins of profits earned in Andhra Pradesh and Maharashtra
states are presented in Table-M13. The net margin of profits in Andhra Pradesh
worked out to Rs.1287 per quintal, while that in Maharashtra was Rs.1237.50. In
45
Andhra Pradesh, the processors earned more profit to the tune of about Rs.50
per quintal compared to that in Maharashtra.
4. Quality Characteristics for Processing:
The quality characteristics preferred by the processors of Andhra Pradesh
and Maharashtra states are spelt out in Table-M14. The ranking of these quality
characteristics of pigeonpea grains was almost identical both in Andhra Pradesh
and Maharashtra states. The first priority was given to cleanliness of the
pigeonpea grains, followed by bigger sized grains and high recovery percentage,
and the processors were also willing to pay premium prices for these quality
characteristics.
5. Prices Offered for Different Grades of Pigeonpea:
The prices offered for different grades of pigeonpea in Andhra Pradesh and
Maharashtra states are given in Table-M15. The range of price variation for
different grades of pigeonpea was practically the same in both states. The best
quality of pigeonpea fetched about Rs.60 more in Andhra Pradesh, while the poor
quality of pigeonpea brought in about Rs.155 less compared to the prices
prevailing in Maharashtra state.
6. Constraints Confronting Processors:
The constraints confronting processors in Andhra Pradesh and Maharashtra
states are detailed in Table-M16a. The constraints confronting the processor
were practically the same in both the states. High power rate accompanied by
46
frequent power shedding was the major constraint of the processors in both
states, followed by scarcity of labour for the processing work. Lack of scientific
storage facilities was a special problem for processors in Andhra Pradesh.
7. Suggestions of Processor for Improvement of Marketing System:
The suggestions made by processors of Andhra Pradesh and Maharashtra
States for improvement of the marketing system are presented in Table-M16b.
Uninterrupted power supply at relatively cheaper rates, rationalization of
transport charges and legal empowerment of processors to purchase the
pigeonpea produce directly from farmers were the major suggestions made by
the processors for enhancement operational and pricing efficiency.
47
CHAPTER-V: RETAILERS
1. Profit Margins of Retailers:
The gross profit margins earned by retailers in Andhra Pradesh and
Maharashtra States are presented in Table-M18 and Table-M19. In Andhra
Pradesh, the retailers made a gross profit margin of Rs.367 per quintal, while
those in Maharashtra state earned a gross profit margin of Rs.146. The gross
profit margin earned in Andhra Pradesh was for more than that in Maharashtra.
2. Quality Characteristics Preferred by Retailers:
The quality characteristics preferred by retailers in Andhra Pradesh and
Maharashtra states are given in Table-M20. The ranking of quality characteristics
preferred by retailers was practically the same in both states. They preferred
cleanliness of the pigeonpea dal, bigger sized dal, better taste, high keeping
quality and less cooking time. These quality characteristics indirectly reflected
those of consumers.
3. Constraints Confronting Retailers and Suggestions Made for
Improvement:
The constraints confronting retailers of Andhra Pradesh and Maharashtra
and suggestions made by them for improvement are presented in Table-M21.
The menace of storage pests and rodents and less profit margins were the major
constraints confronting the retailers in Andhra Pradesh, while high transportation
costs and improper grading of pigeonpea dal were the major constraints facing
the retailers in Maharashtra. Proper grading of pigeonpea dal by processors, fool
48
proof measurers for the control of storage pests and rodents, rationalization of
transportation charges, and avoidance of middlemen in the chain were some of
the important suggestions made by the retailers for improvement of the
marketing system.
4. Price Structure for Different Grades of Pigeonpea Dal:
The price structure for different grades of pigeonpea dal in Andhra Pradesh
and Maharashtra states is given in Table-M22. The price structure was higher in
Maharashtra ranging from Rs.3625 to Rs.3442 per quintal of pigeonpea dal,
whereas that in Andhra Pradesh state varied from Rs.3541 to Rs.2971 per
quintal.
5. Factors Considered by Retailers while Fixing Prices for Pigeonpea
Dal:
The factors considered by retailers in Andhra Pradesh and Maharashtra,
while fixing the price of pigeonpea dal are listed in Table-M23. Factors such as
the rate at which the pigeonpea dal was bought, transportation costs, demand
for dal and margin of profit were taken into account while fixing the price for the
pigeonpea dal. The factors considered by retailers in Andhra Pradesh and
Maharashtra states were identical. These were the factors usually taken into
account while fixing the price for the pigeonpea dal.
49
CHAPTER-VI: CONSUMERS
1. Household Consumption:
The household annual consumption of pigeonpea dal in Andhra Pradesh
and Maharashtra States is detailed in Table-M24 and Table-M25. The household
annual consumption of pigeonpea dal was about 76 kg in Andhra Pradesh and it
was bought at about Rs.38 per kg, while that in Maharashtra state was about 56
kg and it was purchased at about Rs.38.50 per kg. Although the quantities of
consumption of pigeonpea dal differed in both the states, the rate of purchase
was more or less the same. This showed the perfect market integration.
2. Ranking of Top Three Quality Characteristics of Pigeonpea Dal:
The ranking of top three quality characteristics of pigeonpea dal in Andhra
Pradesh and Maharashtra states is given in Table-M26. Ranking was identical in
both the states but in Maharashtra state, the consumers desired clean
commodity and uniformity in the grading system.
3. Availability of Preferred Quality Characteristics:
The availability of preferred quality characteristics in Andhra Pradesh and
Maharashtra states is presented in Table-M27. In Andhra Pradesh, only 16
percent of the consumers expressed that they did procure the pigeonpea dal of
the desired quality, while in Maharashtra state about 83 percent of them were
able to procure pigeonpea of the desired quality. The degree of adulteration of
pigeonpea dal was perhaps greater in Andhra Pradesh than in Maharashtra.
50
4. Preferred Quality Traits of Consumers in Pigeonpea Dal:
The preferred quality traits of consumers in pigeonpea dal in Andhra
Pradesh and Maharashtra states are given in Table-M28 and Table-M29. Andhra
Pradesh, the consumers gave high priority for better taste, bigger sized dal,
cleanliness of the commodity, brighter yellow colour dal and high keeping quality
and the consumers were willing to pay premium prices for these quality
characteristics; while consumers in Maharashtra state preferred unadulterated
stuff, less cooking time, better taste and uniformity in grades for which they
were prepared to pay premium prices.
5. Constraints of Consumers:
The constraints of consumers of Andhra Pradesh and Maharashtra are
detailed in Table-M30. In both the states, the consumers bitterly complained of
high percentage of gravels in dal, high prices and frequent fluctuation in prices of
dal and non-uniformity in the size of dal. The tendency for adulteration was high
among the merchants of both the states.
6. Suggestions of Consumers for Improvement:
The suggestions of consumers of Andhra Pradesh and Maharashtra states
for improvement of the situation are given in Table-M31. The consumers in
Andhra Pradesh suggested that only quality dal must be sold and there should be
stability in the prices of dal, while those of Maharashtra state pleaded for
reduction in the prices of dal and proper packing.
51
PART-III: POLICY PRESCRIPTIONS
The results of the studies of Production and Marketing of pigeonpea in
Andhra Pradesh and Maharashtra not only provide a good feedback but also
clearly demonstrate the direction in which the Crop Improvement Research
Programme committee of the ICRISAT, Hyderabad should move, and the State
Governments of Andhra Pradesh and Maharashtra should proceed to enhance the
productivity and profitability of the pigeonpea crop. Thus, the studies have been
found to be useful in identifying a number of policy prescriptions mentioned
below –
(1) The Growth of Pigeonpea in Andhra Pradesh and Maharashtra
States:
The sources of growth of pigeonpea in Andhra Pradesh and Maharashtra
states have hitherto been expansion in the area and increase in the yield. The
further scope for the area to expand has been very much limited. There is,
therefore, no option but to concentrate on increasing the yield potential of
pigeonpea by evolving such varieties of pigeonpea that are high yielding and
resistant to drought conditions, pests and diseases and are of short duration with
bigger sized grains, favourable aroma, brighter yellow coloured dal and higher
recovery percentage accompanied by less wastage. Incorporation of these
preferred traits would not only foster adoption at a faster rate but would also
increase their marketability. The R and D of the ICRISAT, Hyderabad and of the
State Governments of Andhra Pradesh and Maharashtra should make persistent
efforts to incorporate these preferred traits in the new cultivars of pigeonpea.
52
Pigeonpea is a two season (kharif and rabi) crop but the yield is not
commensurate with its long duration. It would be ideal, if the duration of the
crop is reduced and the yield is increased considerably to match its duration.
The pigeonpea crop is being grown as an inter-crop in Maharashtra state,
and its productivity is considerably less. Attempts should be made to induce the
farmers to raise it as a sole crop as in Andhra Pradesh but not as a subsidiary
crop so that it productivity and profitability are increased by mani-fold, and the
pigeonpea enterprise can be enterprising and popular.
(2) Exploration of Irrigation Potential and Expansion of Irrigated Area
under Pigeonpea:
Pigeonpea is mostly grown under rainfed conditions and exposed to
frequently to recurring droughts in both the states – Andhra Pradesh and
Maharashtra. In these states a large irrigation potential still remains untapped.
Every effort should be made to tap the remaining irrigation potential and bring a
large chunk of land under irrigated pigeonpea to enhance the productivity of
pigeonpea and stabilize the yields at higher levels, and overcome thereby the ill-
effect of recurring droughts. In this context, the State Governments of both the
states have a major and vital role to play in providing irrigation opportunities and
increasing and maintaining sustainable growth in the productivity of pigeonpea
in rainfed are as.
(3) Legal Protection to Tenants and Landlords:
53
Owing to the operation of the Law of Inheritance the size of Landholdings
has been shrinking, and the average size of landholdings has been decreasing
faster. Consequently, farmers operating less than 2 ha of land has been
increasing. By putting restrictions in leasing-out land we are forcing the marginal
and small farmers to continue to operate small pieces of land without any
prospect of a fair return of their assets, and at the same time we are depriving
them of the means to supplement their land holdings and make them viable.
Relaxing the tenancy law will produce positive impact on marginal and small
farmers.
There is no legal protection to the tenant as well as to the landlord.
Besides, the tenant cannot raise the required capital from Banks without
adequate legal safeguard to his tenancy. Legalizing tenancy may help the
marginal and small farmers (tenants) in the ambit of institutional credit.
Legalization of the land lease system would enhance the productivity of
pigeonpea.
(4) Effective Implementation of Minimum Support Price Policy:
The objective of the Minimum Support Price policy is to ensure that the
producers are not put to loss, should the market prices fall below the certain
minimum level. The Minimum Support Price acted as a cushion against price-
induced risk.
Owing to bad and ineffective handling of this potent instrument, the
Minimum Support Price policy has become in effect the Maximum Support Price
54
policy. It should be set right by the effective acting of the Food Corporation of
India so that the pigeonpea growers are benefited.
(5) Carrying Pigeonpea Procurement Operations on Commercial Lines:
The procurement operation of pigeonpea for the Public Distribution System
to distribute procured pigeonpea is generally done at a lower price than the
market price. The procurement for the Public Distribution system should be on
the basis of market prices. This would certainly benefit the pigeonpea producers.
(6) Stepping up Pledge Financing:
Linkages between production and marketing need to be strengthened by
increasing pledge finance, credit for marketing and advances against warehouse
receipts. This process would certainly benefit pigeonpea producers.
(7) Reducing Cost of Agricultural Borrowing:
There is a need to make the interest rates on agricultural credit more
affordable, and there should be timeliness and adequacy of credit.
The Banks must also ensure cost-effective landing. These measures would
ensure cost-effective borrowing of agricultural credit from Banks. This would
make the pigeonpea enterprise more prosperous and profitable.
(8) Drought Relief Fund:
55
Pigeonpea is generally grown in drought-prone areas, and recurrent
drought is a common feature. These recurrent droughts need long term loans, in
addition to short-term relief loans.
The Drought Relief Fund must be created so that the pigeonpea growers
from the drought-prone areas could take recourse to this fund to tide over the
situation and to protect themselves from the calamity. This would greatly benefit
the pigeonpea growers.
(9) Value Addition to Pigeonpea through processing:
Processing activity of pigeonpea needs to be expanded and improved in
order to reduce the degree of wastage. This will help pigeonpea producers to
realize better value for their pigeonpea produce.
(10) Amendment to APMC Act to Make Provision for Direct Marketing:
The direct marketing provision enables farmers to sell their pigeonpea
produce directly to the processors at a higher price than what they get from the
intermediaries. The processors can also avail fresh pigeonpea produce at
relatively cheaper price, if the processors buy directly from the farmers. Thus,
direct marketing enables the pigeonpea producing farmers and the processors to
economize. The existing APMC Act will have to be amended to make provision for
direct marketing.
(11) Improvement in Educational Status of Farmers:
56
The primary educational system must be universalized so that adequate
opportunity is given to farmers in order to improve their educational status. The
higher educational status of farmers has its own advantages in accelerated
adoption of new production and marketing technologies, and it would enable
farmers to increase the productivity and profitability of pigeonpea.
(12) Agenda for Plant Breeders:
The feedback clearly prescribes an agenda for plant breeders to pursue
incorporation of the preferred traits of the consumers and farmers, and make the
pigeonpea industry to prosper. The consumers desired bigger size grains,
brighter yellow coloured dal, better taste, protein rich dal, less cooking time and
high keeping quality, while the farmers want high yielding varieties, resistance to
droughts, pests & diseases, short duration and high recovery percentage with
less wastage. The plant breeders should concentrate their attention in
incorporating these preferred traits into the new cultivars of pigeonpea. The plant
breeders should try to identify and include the genes favourable to these
preferred quality characteristics into the new and promising varieties of
pigeonpea. This process would not only foster adoption at an accelerated rate
but would also enhance productivity, profitability and marketability of the
pigeonpea produce.
(13) Creation of Market Infrastructural Facilities:
The State Governments of Andhra Pradesh and Maharashtra should take
immediate steps to create and improve the market infrastructural facilities at
57
their Regulated Markets by introducing electronic weighing machines with print
out facilities, e-tender system, banking facilities, modern communication
facilities, uninterrupted power supply adequate and efficient storage facilities and
scientific grading system for pigeonpea. These infrastructural facilities will go a
long way in improving the operational efficiency as well as pricing efficiency.
They will also help in reducing marketing costs, besides improving the marketing
system. Creation of such infrastructure will enable farmers to get remunerative
prices for their pigeonpea produce.
(14) Establishment of Warehousing Facilities at Regulated Market
Levels and Rural Godowns at Village Levels:
Efforts must be made by the State Governments of Andhra Pradesh and
Maharashtra to establish warehousing facilities at the Regulated Market levels
and rural godowns at village levels to enable farmers to store their pigeonpea
produce and products in a scientific way and wait for market prices to rise,
besides getting pledge loans to meet their immediate financial obligations against
warehouses receipts and rural godowns receipts. These warehousing and rural
godowns facilities will solve many a problem of farmers, market intermediaries,
processors and retailers.
(15) Training of Farmers and Processors in Scientific Grading of
Pigeonpea Produce and Pigeonpea Dal:
Proper arrangements must be made by the State Governments of Andhra
Pradesh and Maharashtra to train farmers and processors in the skill of scientific
grading of pigeonpea produce and pigeonpea dal and in offering clean produce
58
and products. Such scientific training facilities will enable farmers and processors
to get not only higher prices for their products but would also increase their
marketability as the market functionaries including consumers assign top priority
for uniformity in grading and also for cleanliness of the commodity. This will
enable farmers and processors in getting real remunerative prices for their
produce and products.
(16) Legal Provision for Spot Payment of Sale Proceeds and Payment of
Penal Interest on delayed Disbursement:
There should be legal provision for the spot payment of sale proceeds of
pigeonpea produce and products and legal back up for levying penal interest for
the delay in payment of sale proceeds. The penal interest rate must be
progressive in nature in the sense that the longer the delay, the higher should be
the penal interest rate. This will curb the tendency of delay in disbursement of
sale proceeds. The APMC Act should be suitably amended to effect these
provisions.
(17) Rationalization of Transport Costs:
Primarily, all the villages in the state must be linked to the respective
Regulated Markets by all weather good metal roads to improve the means of
communication and to increase the speed of transport of the pigeonpea produce
at the same time. Then, the costs of transportation must be rationalized by
reducing it to a reasonable level. Rationalization of cost of transportation will
produce sobering effect on the prices of pigeonpea dal; and pigeonpea dal can be
marketed at affordable prices.
59
(18) Insurance of Pigeonpea Produce and Products:
There should be legal provision to insure the pigeonpea produce and
products temporarily stored by farmers with the commission agents against
theft, fire, pilferage and physical damage so that the farmers are suitably
compensated whenever these incidents occur. This provision must be legally
enforced to prevent losses to the farming community.
(19) Establishment of Pigeonpea Processing Plants at Village Levels:
The pigeonpea processing plants must be established at village levels so
that farmers could conveniently get their pigeonpea produce processed, and are
enabled to sell pigeonpea dal to improve their profitability through value addition
to the pigeonpea produce. Thereby, farmers can increase their share in
consumer’s rupee.
(20) Factors Considered, while Purchasing Pigeonpea Seeds:
Farmers are fully aware of the seed quality parameters. But are carried
away by brand names and seed prices. Seed companies, should aim at
marketing the seeds of farmers choices in ample quantities, and seed must be
priced as low as possible. Arrangements must also be made to sell seeds on
credit basis, so that farmers can get quality seeds at concessional rates and on
easy terms of payment.
(21) Sources of Information on Latest Production Technologies:
60
The mass media means such as news papers, televisions and radios must
be priced as low as possible and farmers meets must be arranged as frequently
as possible so that dissemination of information on new production and
marketing technologies is effective and rewarding.
(22) Expansion of Economic Viability of Pigeonpea Cultivars:
Although the improved varieties of pigeonpea are economically viable, their
profitability is marginal. If the preferred traits are incorporated in the new
cultivars of pigeonpea, the profitability margin can be enlarged and their
marketability can be enhanced, however severe the droughts may be.
(23) Partial Mechanization of Pigeonpea Cultivation:
In view of the scarcity of labour for timely agricultural operations, partial
mechanization of pigeonpea cultivation seems to be inevitable. Furthermore, for
the marginal and small farmers agriculture is becoming a secondary occupation.
To retain them in agriculture, institutional credit facilities must be liberalized and
extended to them for purchasing adequate number of agricultural implements
such as tractors, power tillers, sprayers, dusters, harvesters, winnowers, bullock
carts, trucks, station wagons etc. for the purpose of custom hiring.
(24) Provision of Institutional Agricultural Credit:
Credit has been not only a critical input to pigeonpea production but also
an effective means of economic transformation. Therefore, institutional
61
agricultural credit facilities should be not only liberalized but also economized.
Interest rate is an important determinant of cost to pigeonpea producers.
Therefore, measures to reduce costs of funds could lower the cost to borrowers.
Banking facilities should be increased and at the same time institutional
agricultural credit policy should be liberalized in order to finance adequately
timely agriculture operations of pigeonpea production and marketing activities.
(25) Strategies for R&D of Agriculture:
The R&D of agriculture of State Governments of Andhra Pradesh and
Maharashtra and that of the ICRISAT, Hyderabad should concentrate upon
incorporating the preferred traits of farmers, processors and consumers of
pigeonpea, instituting training programmes for farmers in scientific grading of
pigeonpea produce and pigeonpea dal, inducing them to go in for institutional
credit and adopting of swiftly new production and marketing technologies for
enhancing the productivity, profitability and marketability of pigeonpea produce
and pigeonpea dal.

62
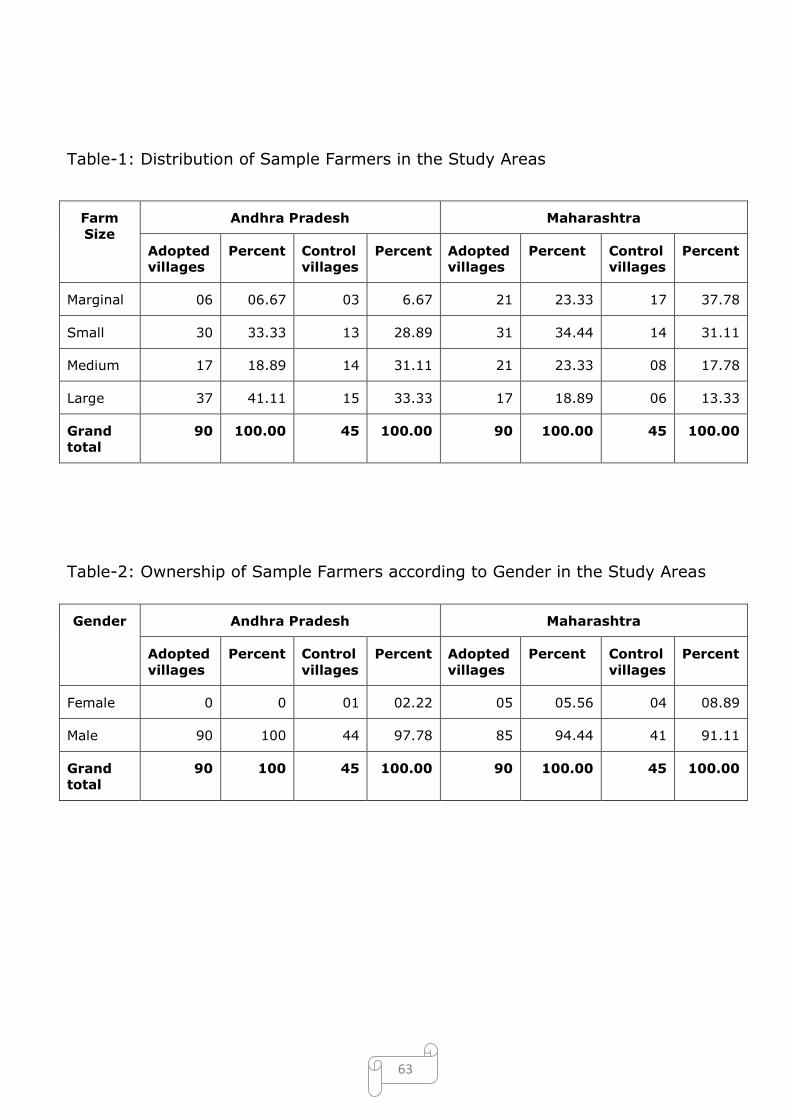
63
Table-1: Distribution of Sample Farmers in the Study Areas
Farm
Size
Andhra Pradesh Maharashtra
Adopted
villages
Percent Control
villages
Percent Adopted
villages
Percent Control
villages
Percent
Marginal 06 06.67 03 6.67 21 23.33 17 37.78
Small 30 33.33 13 28.89 31 34.44 14 31.11
Medium 17 18.89 14 31.11 21 23.33 08 17.78
Large 37 41.11 15 33.33 17 18.89 06 13.33
Grand
total
90 100.00 45 100.00 90 100.00 45 100.00
Table-2: Ownership of Sample Farmers according to Gender in the Study Areas
Gender Andhra Pradesh Maharashtra
Adopted
villages
Percent Control
villages
Percent Adopted
villages
Percent Control
villages
Percent
Female 0 0 01 02.22 05 05.56 04 08.89
Male 90 100 44 97.78 85 94.44 41 91.11
Grand
total
90 100 45 100.00 90 100.00 45 100.00

64
Table-3: Ownership of Sample Farmers Based on Gender across Farm size in the
Study Areas
Farm Size
Gender Andhra Pradesh Maharashtra
Adopted villages
Per cent
Control villages
Per cent
Adopted villages
Per cent
Control villages
Per cent
Marginal Female 00 0.00 00 0.00 00 00.00 02 04.44
Male 06 6.67 03 6.67 21 23.33 15 33.33
Sub total
06 6.67 03 6.67 21 23.33 17 37.77
Small Female 00 0.00 01 2.22 03 03.33 01 02.22
Male 30 33.33 12 26.67 28 31.11 13 24.44
Sub total
30 33.33 13 28.89 31 34.44 14 26.66
Medium Female 00 0.00 00 0.00 02 02.22 01 02.22
Male 17 18.89 14 31.11 19 21.11 07 15.55
Sub
total
17 18.89 14 31.11 21 23.33 08 17.77
Large Female 00 0.00 00 0.00 00 00.00 00 00.00
Male 37 41.11 15 33.33 17 18.88 06 13.33
Sub
total
37 41.11 15 33.33 17 18.88 06 13.33
Grand total 90 100.00 45 100.00 90 100.00 45 100.00
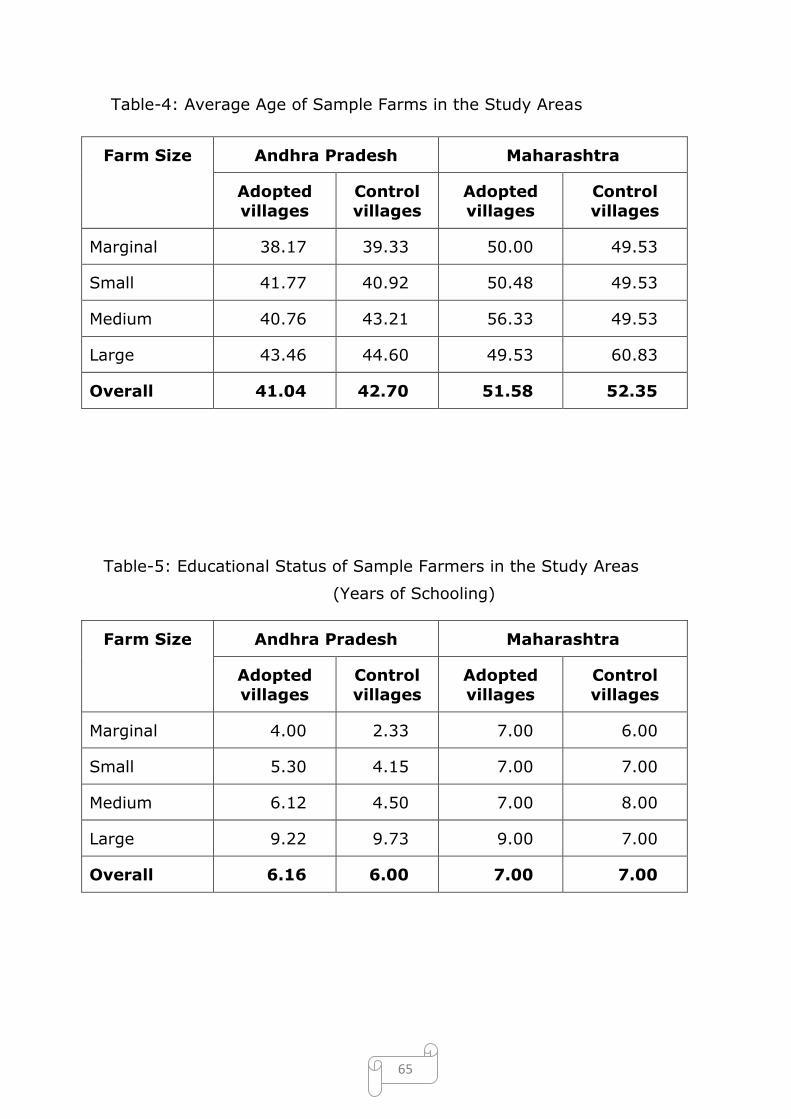
65
Table-4: Average Age of Sample Farms in the Study Areas
Farm Size Andhra Pradesh Maharashtra
Adopted
villages
Control
villages
Adopted
villages
Control
villages
Marginal 38.17 39.33 50.00 49.53
Small 41.77 40.92 50.48 49.53
Medium 40.76 43.21 56.33 49.53
Large 43.46 44.60 49.53 60.83
Overall 41.04 42.70 51.58 52.35
Table-5: Educational Status of Sample Farmers in the Study Areas
(Years of Schooling)
Farm Size Andhra Pradesh Maharashtra
Adopted
villages
Control
villages
Adopted
villages
Control
villages
Marginal 4.00 2.33 7.00 6.00
Small 5.30 4.15 7.00 7.00
Medium 6.12 4.50 7.00 8.00
Large 9.22 9.73 9.00 7.00
Overall 6.16 6.00 7.00 7.00
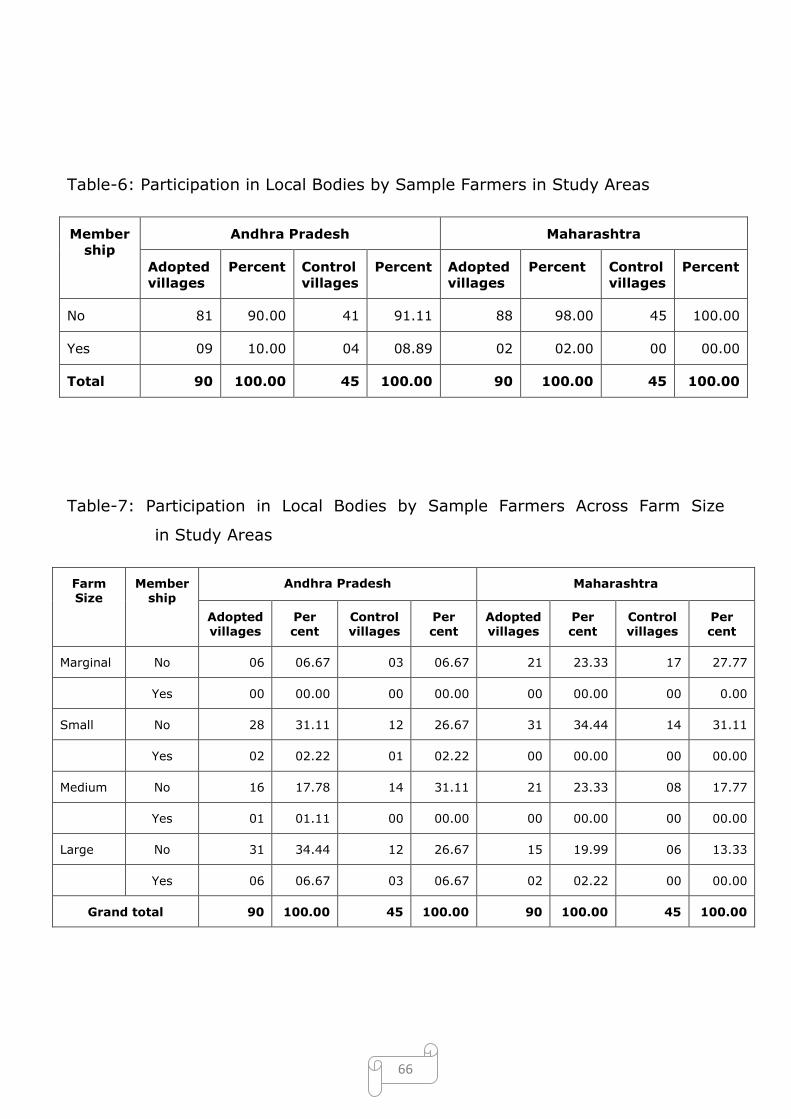
66
Table-6: Participation in Local Bodies by Sample Farmers in Study Areas
Member
ship
Andhra Pradesh Maharashtra
Adopted
villages
Percent Control
villages
Percent Adopted
villages
Percent Control
villages
Percent
No 81 90.00 41 91.11 88 98.00 45 100.00
Yes 09 10.00 04 08.89 02 02.00 00 00.00
Total 90 100.00 45 100.00 90 100.00 45 100.00
Table-7: Participation in Local Bodies by Sample Farmers Across Farm Size
in Study Areas
Farm Size
Membership
Andhra Pradesh Maharashtra
Adopted villages
Per cent
Control villages
Per cent
Adopted villages
Per cent
Control villages
Per cent
Marginal No 06 06.67 03 06.67 21 23.33 17 27.77
Yes 00 00.00 00 00.00 00 00.00 00 0.00
Small No 28 31.11 12 26.67 31 34.44 14 31.11
Yes 02 02.22 01 02.22 00 00.00 00 00.00
Medium No 16 17.78 14 31.11 21 23.33 08 17.77
Yes 01 01.11 00 00.00 00 00.00 00 00.00
Large No 31 34.44 12 26.67 15 19.99 06 13.33
Yes 06 06.67 03 06.67 02 02.22 00 00.00
Grand total 90 100.00 45 100.00 90 100.00 45 100.00
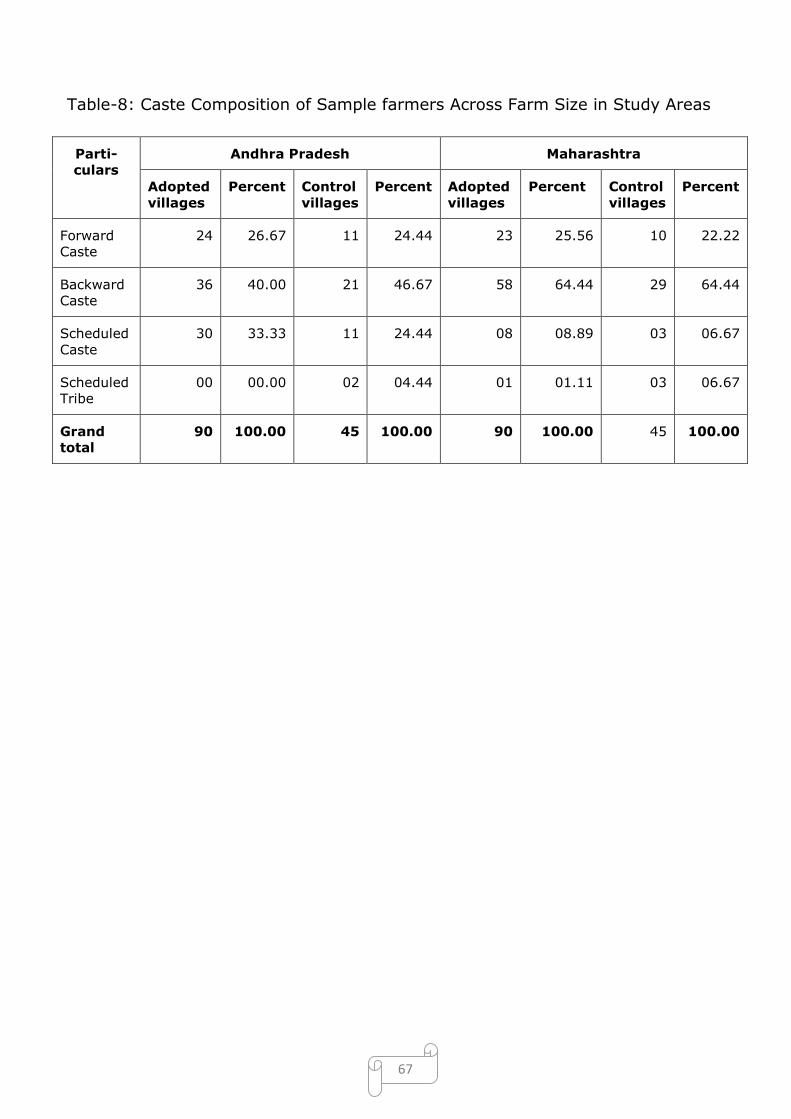
67
Table-8: Caste Composition of Sample farmers Across Farm Size in Study Areas
Parti-
culars
Andhra Pradesh Maharashtra
Adopted
villages
Percent Control
villages
Percent Adopted
villages
Percent Control
villages
Percent
Forward
Caste
24 26.67 11 24.44 23 25.56 10 22.22
Backward
Caste
36 40.00 21 46.67 58 64.44 29 64.44
Scheduled
Caste
30 33.33 11 24.44 08 08.89 03 06.67
Scheduled
Tribe
00 00.00 02 04.44 01 01.11 03 06.67
Grand
total
90 100.00 45 100.00 90 100.00 45 100.00
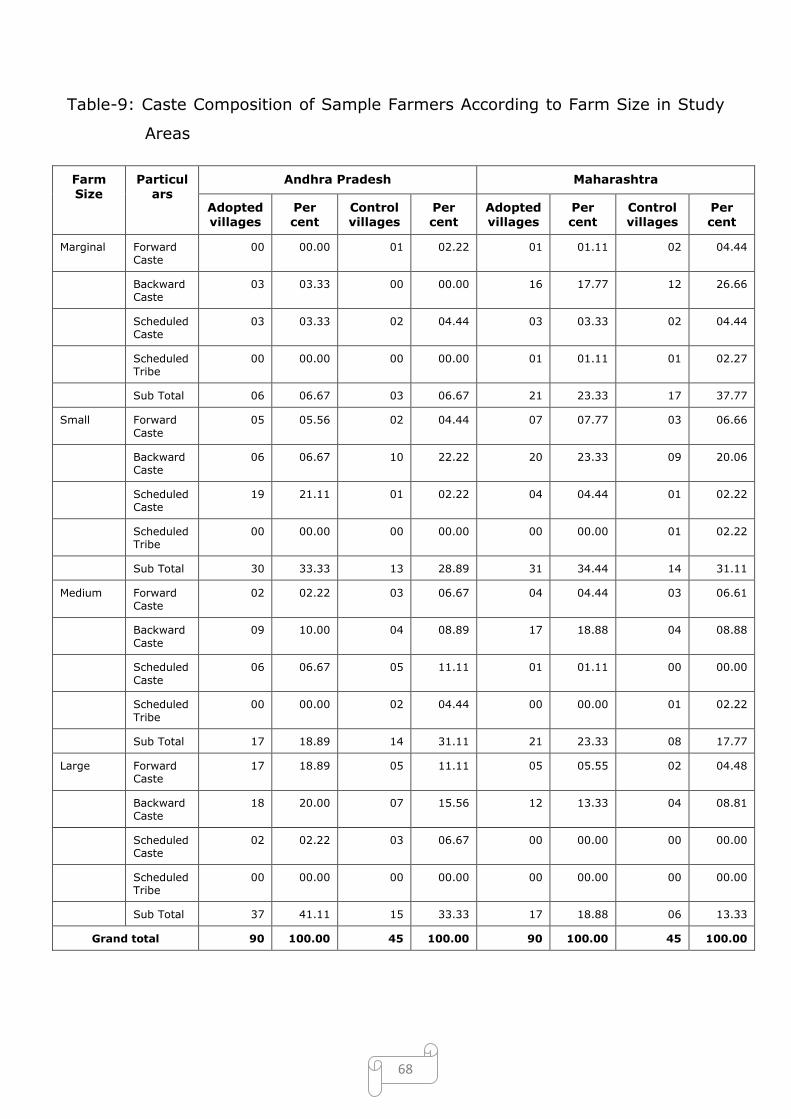
68
Table-9: Caste Composition of Sample Farmers According to Farm Size in Study
Areas
Farm
Size
Particul
ars
Andhra Pradesh Maharashtra
Adopted villages
Per cent
Control villages
Per cent
Adopted villages
Per cent
Control villages
Per cent
Marginal Forward Caste
00 00.00 01 02.22 01 01.11 02 04.44
Backward Caste
03 03.33 00 00.00 16 17.77 12 26.66
Scheduled Caste
03 03.33 02 04.44 03 03.33 02 04.44
Scheduled Tribe
00 00.00 00 00.00 01 01.11 01 02.27
Sub Total 06 06.67 03 06.67 21 23.33 17 37.77
Small Forward
Caste
05 05.56 02 04.44 07 07.77 03 06.66
Backward Caste
06 06.67 10 22.22 20 23.33 09 20.06
Scheduled Caste
19 21.11 01 02.22 04 04.44 01 02.22
Scheduled Tribe
00 00.00 00 00.00 00 00.00 01 02.22
Sub Total 30 33.33 13 28.89 31 34.44 14 31.11
Medium Forward Caste
02 02.22 03 06.67 04 04.44 03 06.61
Backward
Caste
09 10.00 04 08.89 17 18.88 04 08.88
Scheduled
Caste
06 06.67 05 11.11 01 01.11 00 00.00
Scheduled
Tribe
00 00.00 02 04.44 00 00.00 01 02.22
Sub Total 17 18.89 14 31.11 21 23.33 08 17.77
Large Forward Caste
17 18.89 05 11.11 05 05.55 02 04.48
Backward Caste
18 20.00 07 15.56 12 13.33 04 08.81
Scheduled Caste
02 02.22 03 06.67 00 00.00 00 00.00
Scheduled Tribe
00 00.00 00 00.00 00 00.00 00 00.00
Sub Total 37 41.11 15 33.33 17 18.88 06 13.33
Grand total 90 100.00 45 100.00 90 100.00 45 100.00
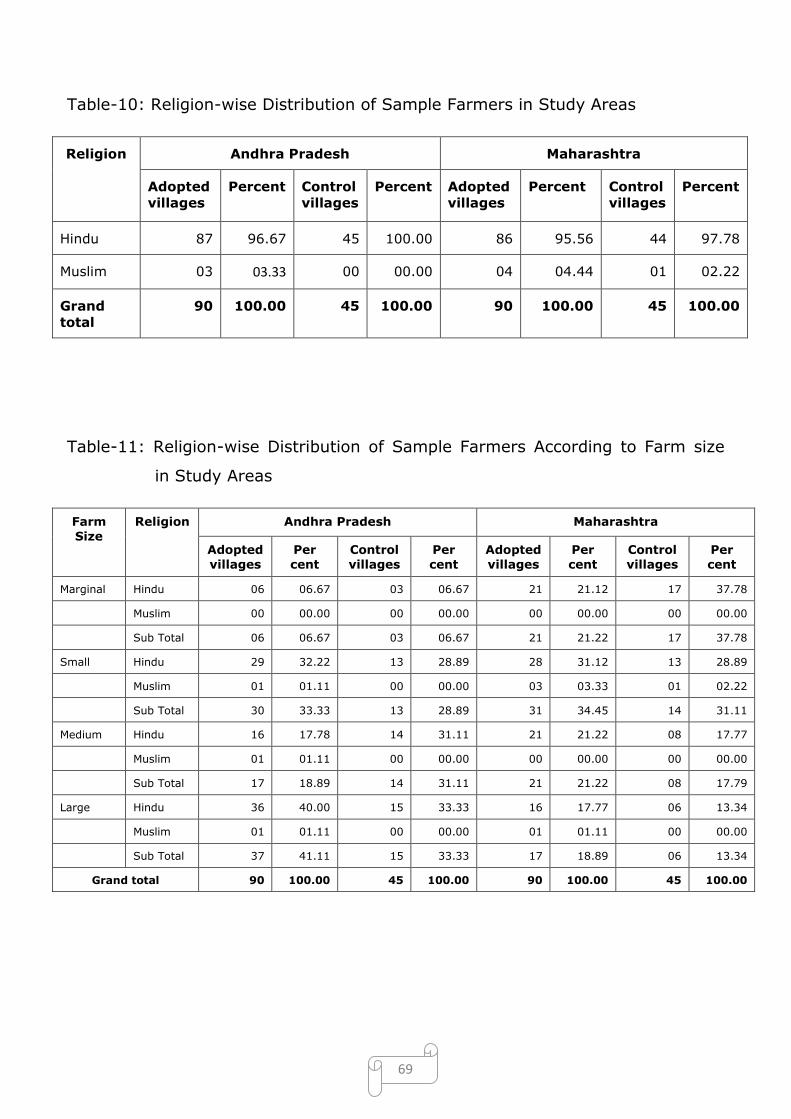
69
Table-10: Religion-wise Distribution of Sample Farmers in Study Areas
Religion Andhra Pradesh Maharashtra
Adopted
villages
Percent Control
villages
Percent Adopted
villages
Percent Control
villages
Percent
Hindu 87 96.67 45 100.00 86 95.56 44 97.78
Muslim 03 03.33 00 00.00 04 04.44 01 02.22
Grand
total
90 100.00 45 100.00 90 100.00 45 100.00
Table-11: Religion-wise Distribution of Sample Farmers According to Farm size
in Study Areas
Farm
Size
Religion Andhra Pradesh Maharashtra
Adopted
villages
Per
cent
Control
villages
Per
cent
Adopted
villages
Per
cent
Control
villages
Per
cent
Marginal Hindu 06 06.67 03 06.67 21 21.12 17 37.78
Muslim 00 00.00 00 00.00 00 00.00 00 00.00
Sub Total 06 06.67 03 06.67 21 21.22 17 37.78
Small Hindu 29 32.22 13 28.89 28 31.12 13 28.89
Muslim 01 01.11 00 00.00 03 03.33 01 02.22
Sub Total 30 33.33 13 28.89 31 34.45 14 31.11
Medium Hindu 16 17.78 14 31.11 21 21.22 08 17.77
Muslim 01 01.11 00 00.00 00 00.00 00 00.00
Sub Total 17 18.89 14 31.11 21 21.22 08 17.79
Large Hindu 36 40.00 15 33.33 16 17.77 06 13.34
Muslim 01 01.11 00 00.00 01 01.11 00 00.00
Sub Total 37 41.11 15 33.33 17 18.89 06 13.34
Grand total 90 100.00 45 100.00 90 100.00 45 100.00
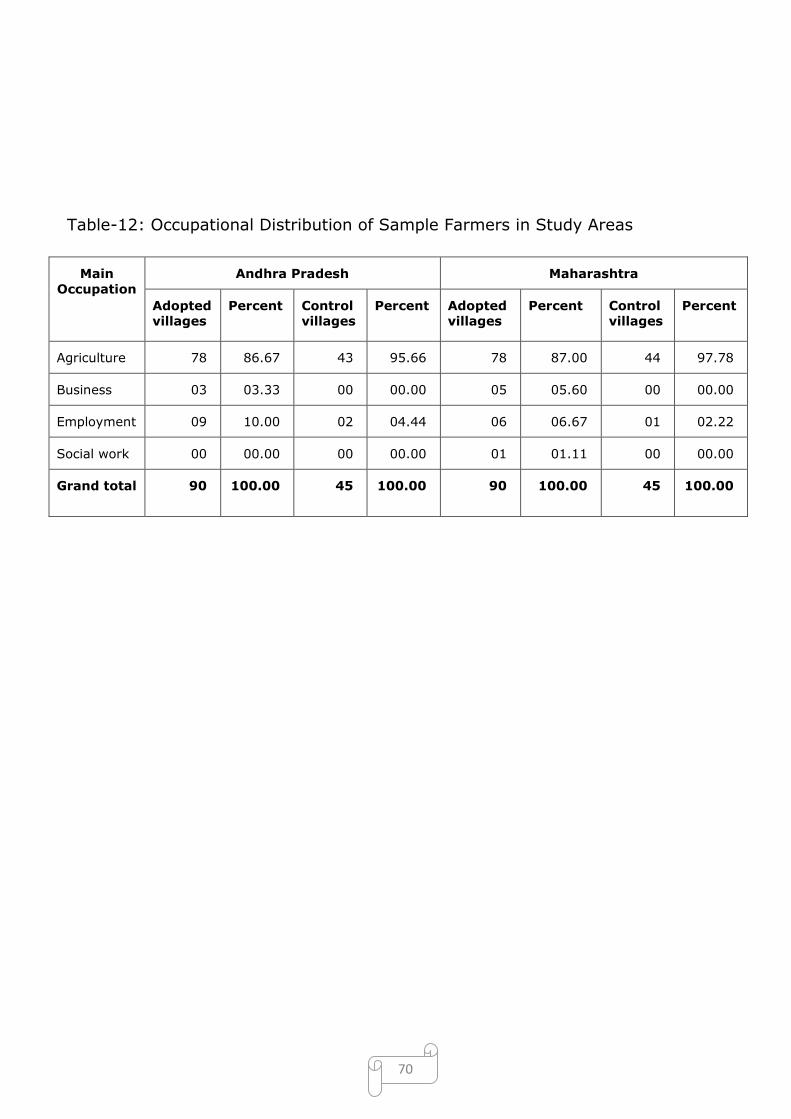
70
Table-12: Occupational Distribution of Sample Farmers in Study Areas
Main
Occupation
Andhra Pradesh Maharashtra
Adopted
villages
Percent Control
villages
Percent Adopted
villages
Percent Control
villages
Percent
Agriculture 78 86.67 43 95.66 78 87.00 44 97.78
Business 03 03.33 00 00.00 05 05.60 00 00.00
Employment 09 10.00 02 04.44 06 06.67 01 02.22
Social work 00 00.00 00 00.00 01 01.11 00 00.00
Grand total 90 100.00 45 100.00 90 100.00 45 100.00
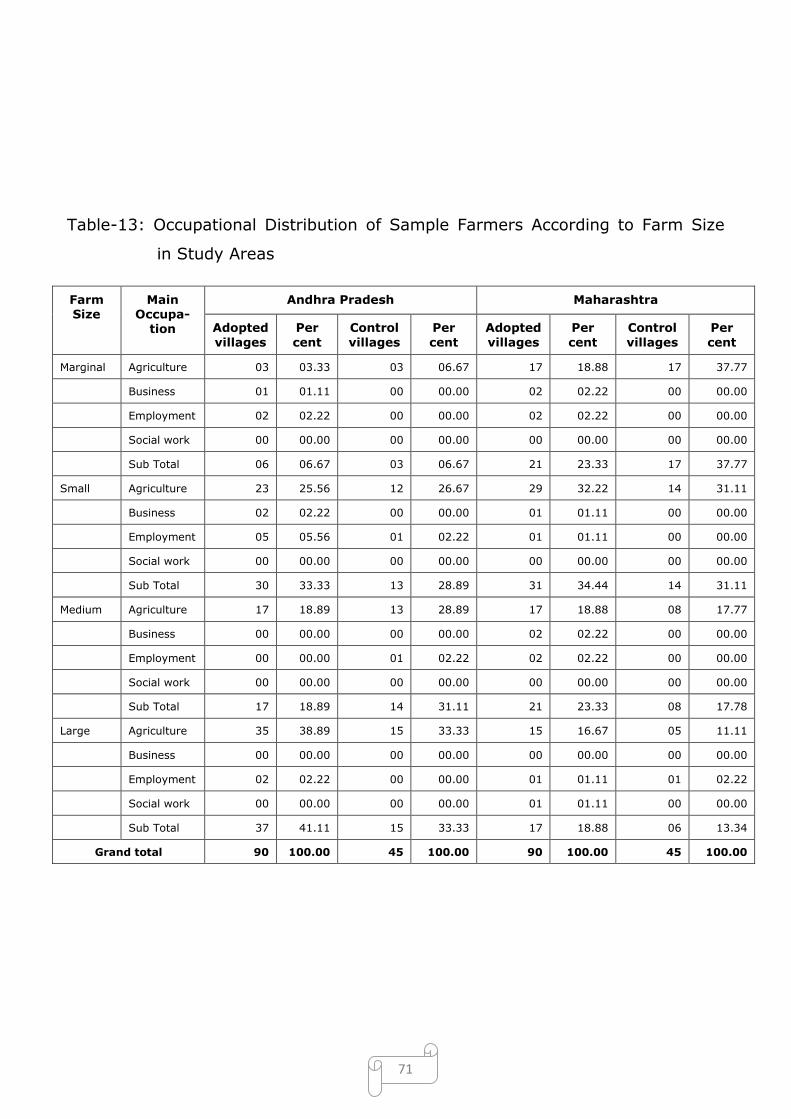
71
Table-13: Occupational Distribution of Sample Farmers According to Farm Size
in Study Areas
Farm Size
Main Occupa-
tion
Andhra Pradesh Maharashtra
Adopted
villages
Per
cent
Control
villages
Per
cent
Adopted
villages
Per
cent
Control
villages
Per
cent
Marginal Agriculture 03 03.33 03 06.67 17 18.88 17 37.77
Business 01 01.11 00 00.00 02 02.22 00 00.00
Employment 02 02.22 00 00.00 02 02.22 00 00.00
Social work 00 00.00 00 00.00 00 00.00 00 00.00
Sub Total 06 06.67 03 06.67 21 23.33 17 37.77
Small Agriculture 23 25.56 12 26.67 29 32.22 14 31.11
Business 02 02.22 00 00.00 01 01.11 00 00.00
Employment 05 05.56 01 02.22 01 01.11 00 00.00
Social work 00 00.00 00 00.00 00 00.00 00 00.00
Sub Total 30 33.33 13 28.89 31 34.44 14 31.11
Medium Agriculture 17 18.89 13 28.89 17 18.88 08 17.77
Business 00 00.00 00 00.00 02 02.22 00 00.00
Employment 00 00.00 01 02.22 02 02.22 00 00.00
Social work 00 00.00 00 00.00 00 00.00 00 00.00
Sub Total 17 18.89 14 31.11 21 23.33 08 17.78
Large Agriculture 35 38.89 15 33.33 15 16.67 05 11.11
Business 00 00.00 00 00.00 00 00.00 00 00.00
Employment 02 02.22 00 00.00 01 01.11 01 02.22
Social work 00 00.00 00 00.00 01 01.11 00 00.00
Sub Total 37 41.11 15 33.33 17 18.88 06 13.34
Grand total 90 100.00 45 100.00 90 100.00 45 100.00
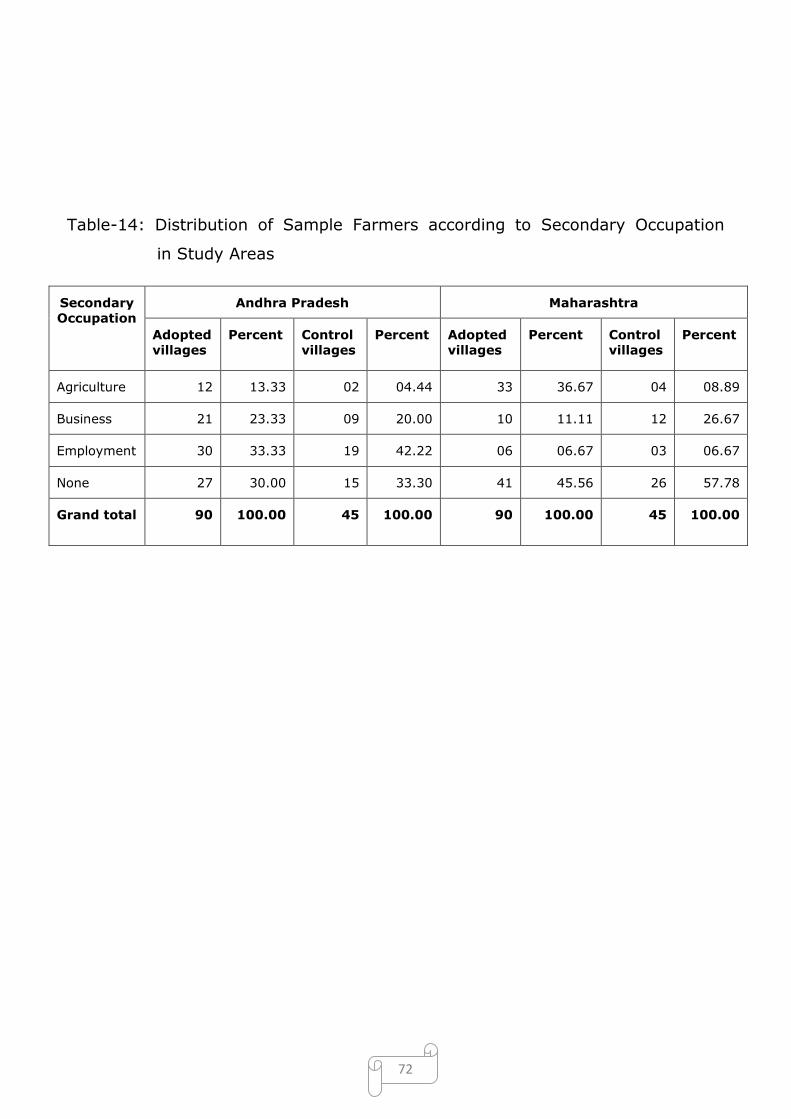
72
Table-14: Distribution of Sample Farmers according to Secondary Occupation
in Study Areas
Secondary
Occupation
Andhra Pradesh Maharashtra
Adopted
villages
Percent Control
villages
Percent Adopted
villages
Percent Control
villages
Percent
Agriculture 12 13.33 02 04.44 33 36.67 04 08.89
Business 21 23.33 09 20.00 10 11.11 12 26.67
Employment 30 33.33 19 42.22 06 06.67 03 06.67
None 27 30.00 15 33.30 41 45.56 26 57.78
Grand total 90 100.00 45 100.00 90 100.00 45 100.00
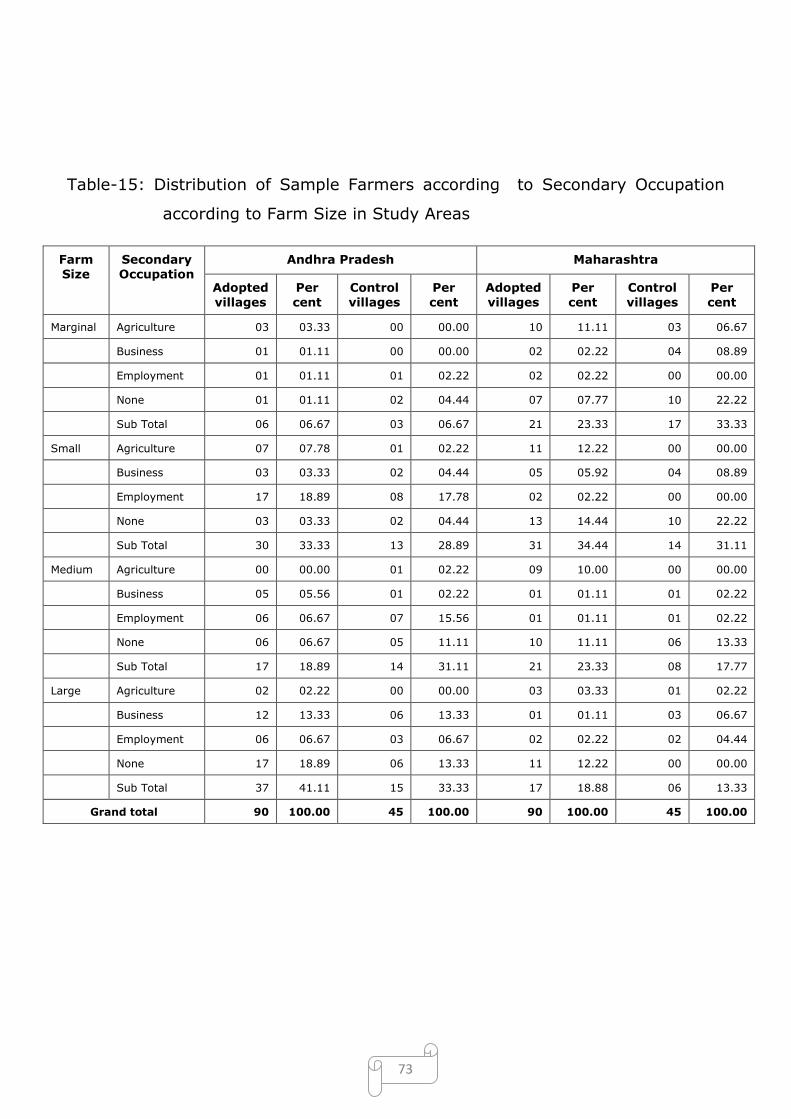
73
Table-15: Distribution of Sample Farmers according to Secondary Occupation
according to Farm Size in Study Areas
Farm
Size
Secondary
Occupation
Andhra Pradesh Maharashtra
Adopted
villages
Per
cent
Control
villages
Per
cent
Adopted
villages
Per
cent
Control
villages
Per
cent
Marginal Agriculture 03 03.33 00 00.00 10 11.11 03 06.67
Business 01 01.11 00 00.00 02 02.22 04 08.89
Employment 01 01.11 01 02.22 02 02.22 00 00.00
None 01 01.11 02 04.44 07 07.77 10 22.22
Sub Total 06 06.67 03 06.67 21 23.33 17 33.33
Small Agriculture 07 07.78 01 02.22 11 12.22 00 00.00
Business 03 03.33 02 04.44 05 05.92 04 08.89
Employment 17 18.89 08 17.78 02 02.22 00 00.00
None 03 03.33 02 04.44 13 14.44 10 22.22
Sub Total 30 33.33 13 28.89 31 34.44 14 31.11
Medium Agriculture 00 00.00 01 02.22 09 10.00 00 00.00
Business 05 05.56 01 02.22 01 01.11 01 02.22
Employment 06 06.67 07 15.56 01 01.11 01 02.22
None 06 06.67 05 11.11 10 11.11 06 13.33
Sub Total 17 18.89 14 31.11 21 23.33 08 17.77
Large Agriculture 02 02.22 00 00.00 03 03.33 01 02.22
Business 12 13.33 06 13.33 01 01.11 03 06.67
Employment 06 06.67 03 06.67 02 02.22 02 04.44
None 17 18.89 06 13.33 11 12.22 00 00.00
Sub Total 37 41.11 15 33.33 17 18.88 06 13.33
Grand total 90 100.00 45 100.00 90 100.00 45 100.00
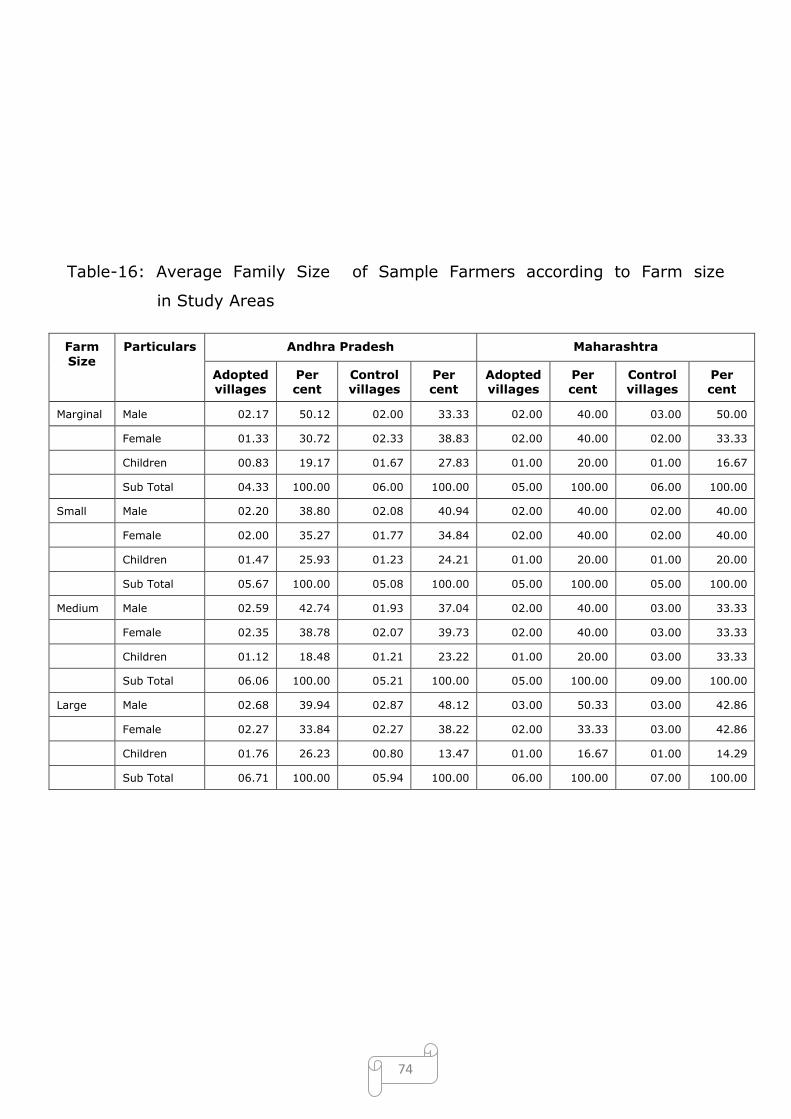
74
Table-16: Average Family Size of Sample Farmers according to Farm size
in Study Areas
Farm
Size
Particulars Andhra Pradesh Maharashtra
Adopted villages
Per cent
Control villages
Per cent
Adopted villages
Per cent
Control villages
Per cent
Marginal Male 02.17 50.12 02.00 33.33 02.00 40.00 03.00 50.00
Female 01.33 30.72 02.33 38.83 02.00 40.00 02.00 33.33
Children 00.83 19.17 01.67 27.83 01.00 20.00 01.00 16.67
Sub Total 04.33 100.00 06.00 100.00 05.00 100.00 06.00 100.00
Small Male 02.20 38.80 02.08 40.94 02.00 40.00 02.00 40.00
Female 02.00 35.27 01.77 34.84 02.00 40.00 02.00 40.00
Children 01.47 25.93 01.23 24.21 01.00 20.00 01.00 20.00
Sub Total 05.67 100.00 05.08 100.00 05.00 100.00 05.00 100.00
Medium Male 02.59 42.74 01.93 37.04 02.00 40.00 03.00 33.33
Female 02.35 38.78 02.07 39.73 02.00 40.00 03.00 33.33
Children 01.12 18.48 01.21 23.22 01.00 20.00 03.00 33.33
Sub Total 06.06 100.00 05.21 100.00 05.00 100.00 09.00 100.00
Large Male 02.68 39.94 02.87 48.12 03.00 50.33 03.00 42.86
Female 02.27 33.84 02.27 38.22 02.00 33.33 03.00 42.86
Children 01.76 26.23 00.80 13.47 01.00 16.67 01.00 14.29
Sub Total 06.71 100.00 05.94 100.00 06.00 100.00 07.00 100.00
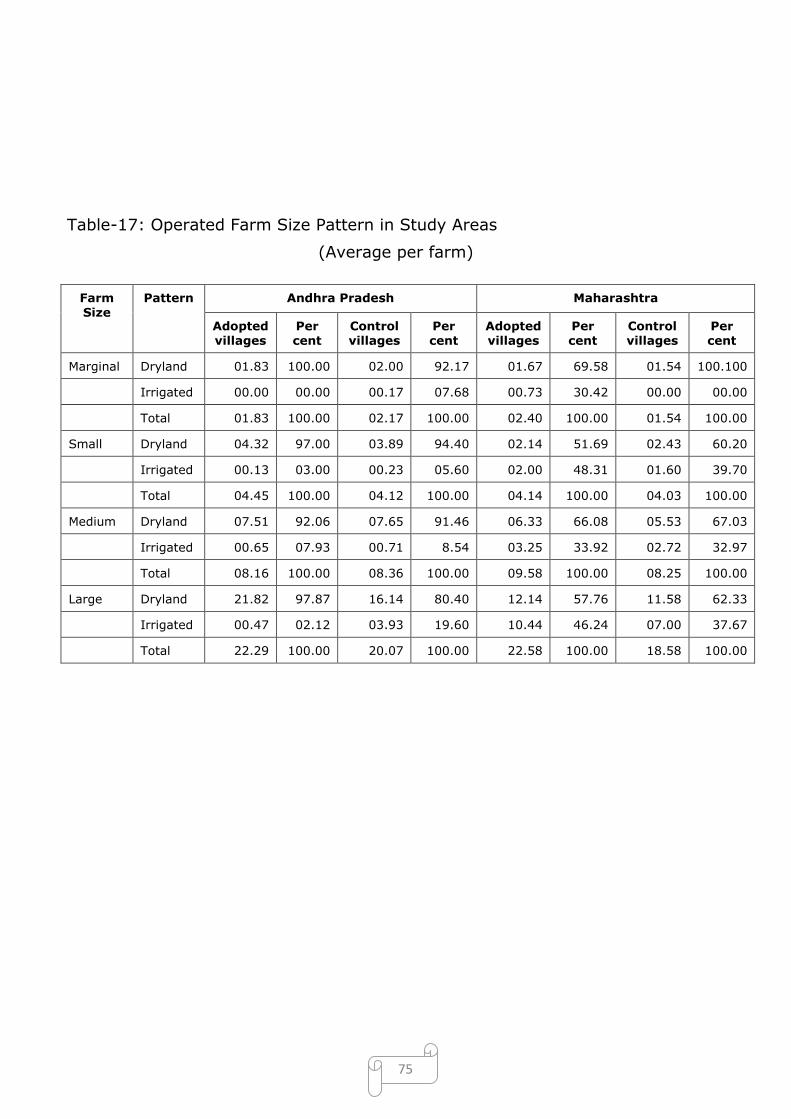
75
Table-17: Operated Farm Size Pattern in Study Areas
(Average per farm)
Farm Size
Pattern Andhra Pradesh Maharashtra
Adopted villages
Per cent
Control villages
Per cent
Adopted villages
Per cent
Control villages
Per cent
Marginal Dryland 01.83 100.00 02.00 92.17 01.67 69.58 01.54 100.100
Irrigated 00.00 00.00 00.17 07.68 00.73 30.42 00.00 00.00
Total 01.83 100.00 02.17 100.00 02.40 100.00 01.54 100.00
Small Dryland 04.32 97.00 03.89 94.40 02.14 51.69 02.43 60.20
Irrigated 00.13 03.00 00.23 05.60 02.00 48.31 01.60 39.70
Total 04.45 100.00 04.12 100.00 04.14 100.00 04.03 100.00
Medium Dryland 07.51 92.06 07.65 91.46 06.33 66.08 05.53 67.03
Irrigated 00.65 07.93 00.71 8.54 03.25 33.92 02.72 32.97
Total 08.16 100.00 08.36 100.00 09.58 100.00 08.25 100.00
Large Dryland 21.82 97.87 16.14 80.40 12.14 57.76 11.58 62.33
Irrigated 00.47 02.12 03.93 19.60 10.44 46.24 07.00 37.67
Total 22.29 100.00 20.07 100.00 22.58 100.00 18.58 100.00
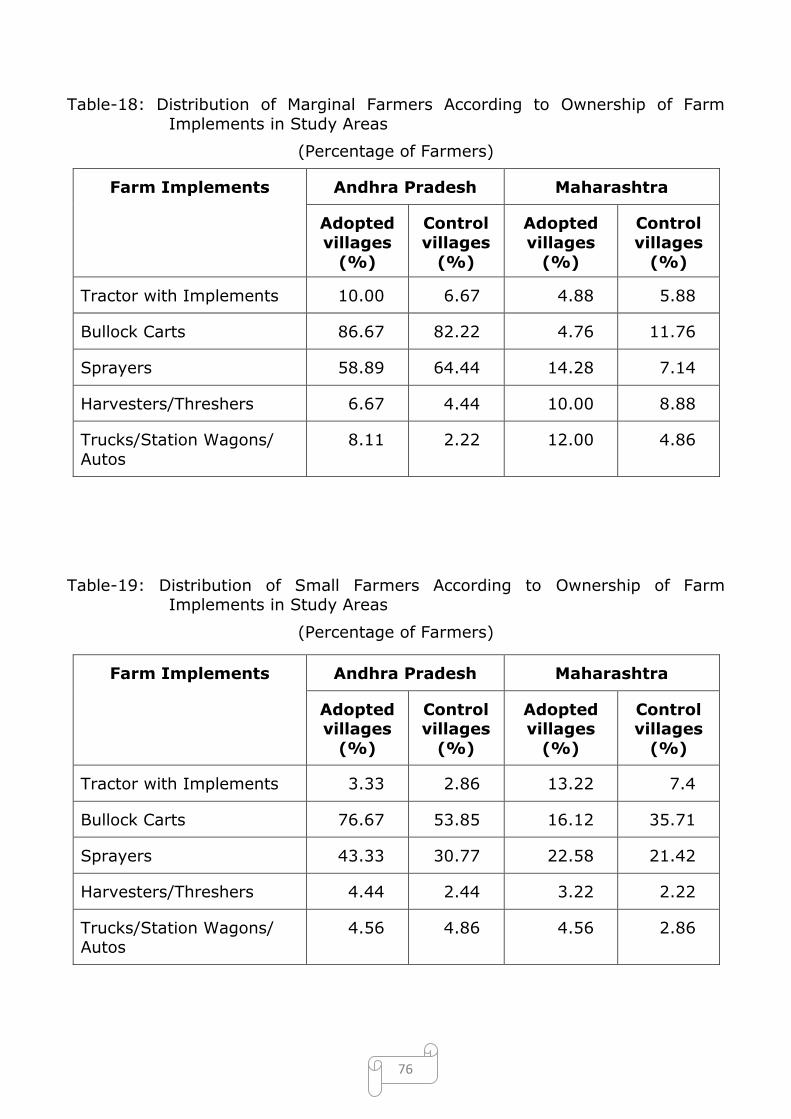
76
Table-18: Distribution of Marginal Farmers According to Ownership of Farm
Implements in Study Areas
(Percentage of Farmers)
Farm Implements Andhra Pradesh Maharashtra
Adopted
villages
(%)
Control
villages
(%)
Adopted
villages
(%)
Control
villages
(%)
Tractor with Implements 10.00 6.67 4.88 5.88
Bullock Carts 86.67 82.22 4.76 11.76
Sprayers 58.89 64.44 14.28 7.14
Harvesters/Threshers 6.67 4.44 10.00 8.88
Trucks/Station Wagons/
Autos
8.11 2.22 12.00 4.86
Table-19: Distribution of Small Farmers According to Ownership of Farm Implements in Study Areas
(Percentage of Farmers)
Farm Implements Andhra Pradesh Maharashtra
Adopted villages
(%)
Control villages
(%)
Adopted villages
(%)
Control villages
(%)
Tractor with Implements 3.33 2.86 13.22 7.4
Bullock Carts 76.67 53.85 16.12 35.71
Sprayers 43.33 30.77 22.58 21.42
Harvesters/Threshers 4.44 2.44 3.22 2.22
Trucks/Station Wagons/ Autos
4.56 4.86 4.56 2.86
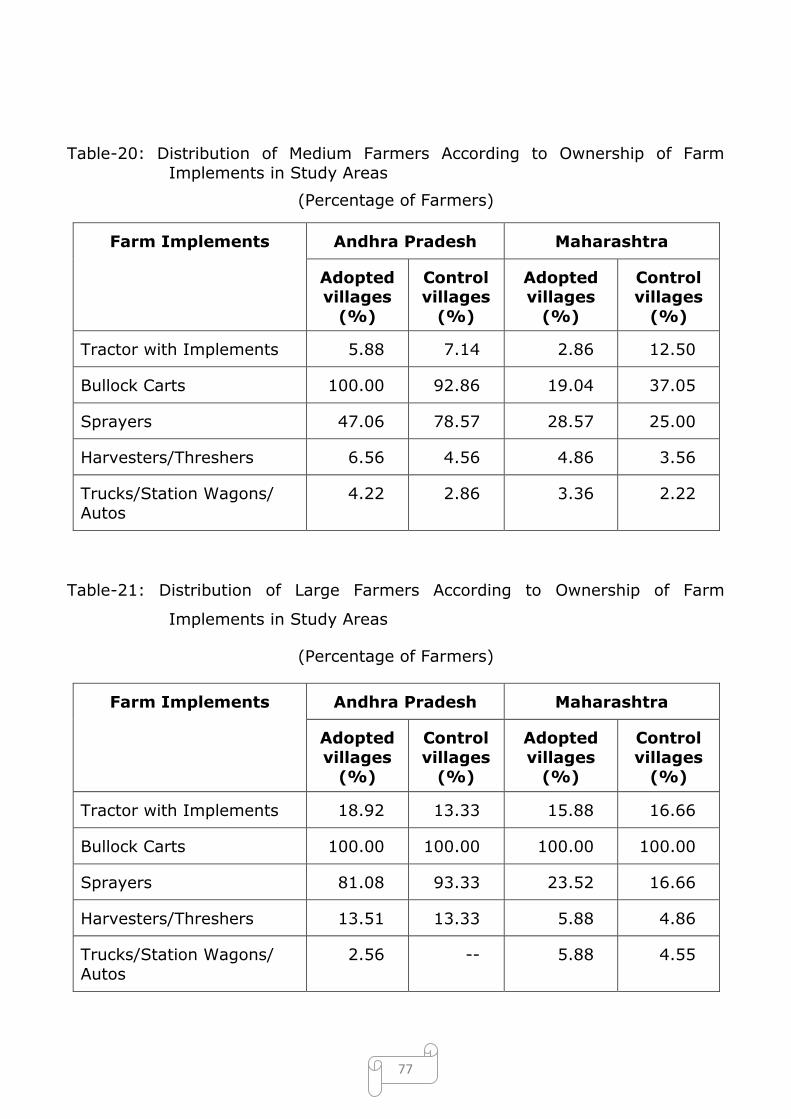
77
Table-20: Distribution of Medium Farmers According to Ownership of Farm
Implements in Study Areas
(Percentage of Farmers)
Farm Implements Andhra Pradesh Maharashtra
Adopted villages
(%)
Control villages
(%)
Adopted villages
(%)
Control villages
(%)
Tractor with Implements 5.88 7.14 2.86 12.50
Bullock Carts 100.00 92.86 19.04 37.05
Sprayers 47.06 78.57 28.57 25.00
Harvesters/Threshers 6.56 4.56 4.86 3.56
Trucks/Station Wagons/
Autos
4.22 2.86 3.36 2.22
Table-21: Distribution of Large Farmers According to Ownership of Farm
Implements in Study Areas
(Percentage of Farmers)
Farm Implements Andhra Pradesh Maharashtra
Adopted
villages (%)
Control
villages (%)
Adopted
villages (%)
Control
villages (%)
Tractor with Implements 18.92 13.33 15.88 16.66
Bullock Carts 100.00 100.00 100.00 100.00
Sprayers 81.08 93.33 23.52 16.66
Harvesters/Threshers 13.51 13.33 5.88 4.86
Trucks/Station Wagons/
Autos
2.56 -- 5.88 4.55
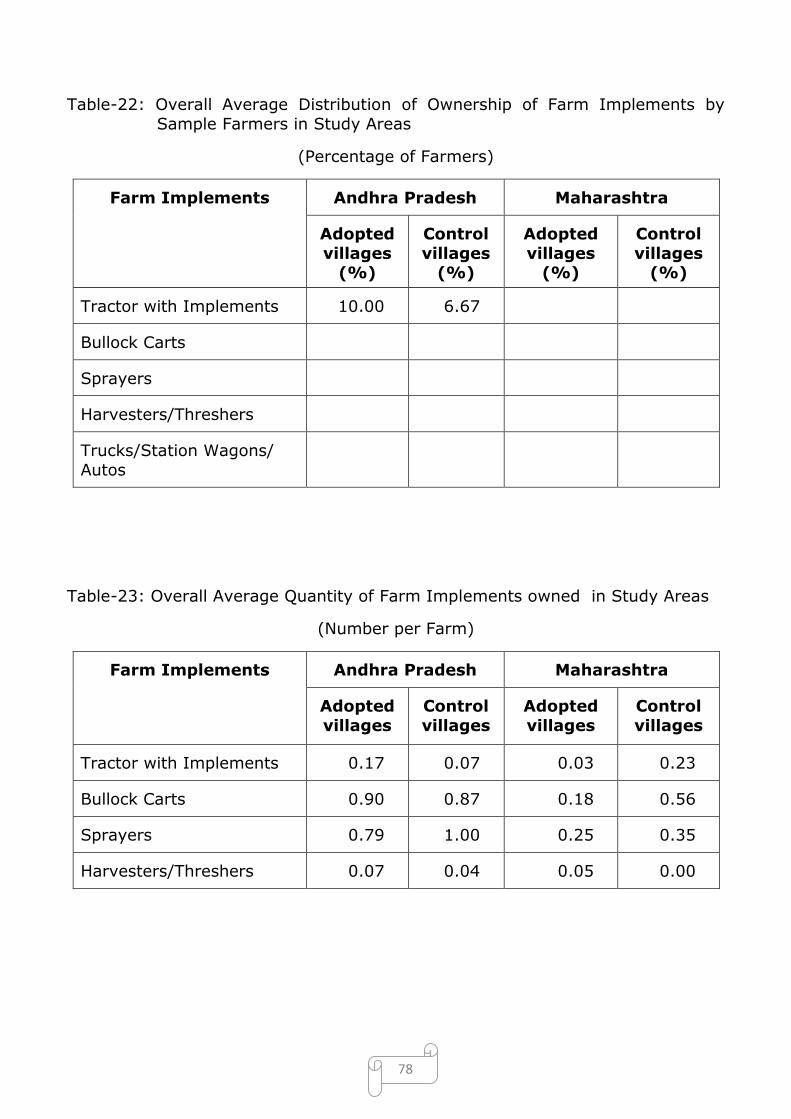
78
Table-22: Overall Average Distribution of Ownership of Farm Implements by
Sample Farmers in Study Areas
(Percentage of Farmers)
Farm Implements Andhra Pradesh Maharashtra
Adopted
villages (%)
Control
villages (%)
Adopted
villages (%)
Control
villages (%)
Tractor with Implements 10.00 6.67
Bullock Carts
Sprayers
Harvesters/Threshers
Trucks/Station Wagons/
Autos
Table-23: Overall Average Quantity of Farm Implements owned in Study Areas
(Number per Farm)
Farm Implements Andhra Pradesh Maharashtra
Adopted
villages
Control
villages
Adopted
villages
Control
villages
Tractor with Implements 0.17 0.07 0.03 0.23
Bullock Carts 0.90 0.87 0.18 0.56
Sprayers 0.79 1.00 0.25 0.35
Harvesters/Threshers 0.07 0.04 0.05 0.00
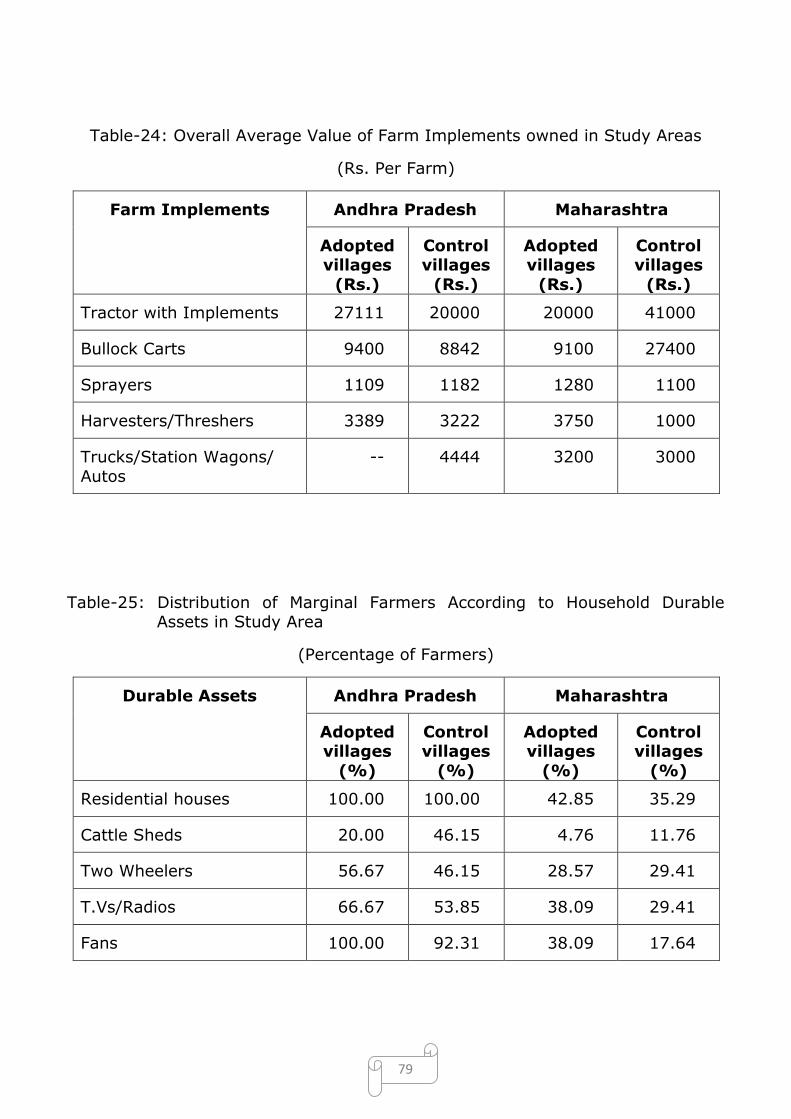
79
Table-24: Overall Average Value of Farm Implements owned in Study Areas
(Rs. Per Farm)
Farm Implements Andhra Pradesh Maharashtra
Adopted villages
(Rs.)
Control villages
(Rs.)
Adopted villages
(Rs.)
Control villages
(Rs.)
Tractor with Implements 27111 20000 20000 41000
Bullock Carts 9400 8842 9100 27400
Sprayers 1109 1182 1280 1100
Harvesters/Threshers 3389 3222 3750 1000
Trucks/Station Wagons/
Autos
-- 4444 3200 3000
Table-25: Distribution of Marginal Farmers According to Household Durable Assets in Study Area
(Percentage of Farmers)
Durable Assets Andhra Pradesh Maharashtra
Adopted villages
(%)
Control villages
(%)
Adopted villages
(%)
Control villages
(%)
Residential houses 100.00 100.00 42.85 35.29
Cattle Sheds 20.00 46.15 4.76 11.76
Two Wheelers 56.67 46.15 28.57 29.41
T.Vs/Radios 66.67 53.85 38.09 29.41
Fans 100.00 92.31 38.09 17.64
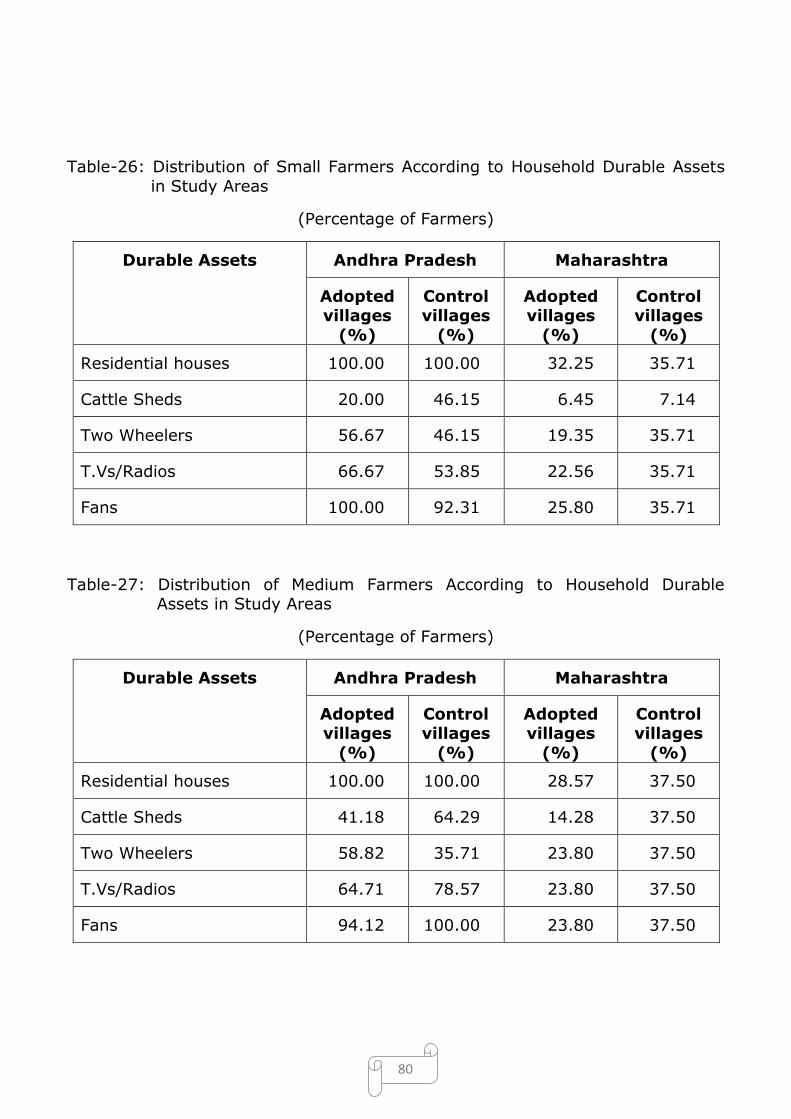
80
Table-26: Distribution of Small Farmers According to Household Durable Assets
in Study Areas
(Percentage of Farmers)
Durable Assets Andhra Pradesh Maharashtra
Adopted villages
(%)
Control villages
(%)
Adopted villages
(%)
Control villages
(%)
Residential houses 100.00 100.00 32.25 35.71
Cattle Sheds 20.00 46.15 6.45 7.14
Two Wheelers 56.67 46.15 19.35 35.71
T.Vs/Radios 66.67 53.85 22.56 35.71
Fans 100.00 92.31 25.80 35.71
Table-27: Distribution of Medium Farmers According to Household Durable Assets in Study Areas
(Percentage of Farmers)
Durable Assets Andhra Pradesh Maharashtra
Adopted villages
(%)
Control villages
(%)
Adopted villages
(%)
Control villages
(%)
Residential houses 100.00 100.00 28.57 37.50
Cattle Sheds 41.18 64.29 14.28 37.50
Two Wheelers 58.82 35.71 23.80 37.50
T.Vs/Radios 64.71 78.57 23.80 37.50
Fans 94.12 100.00 23.80 37.50

81
Table-28: Distribution of Large Farmers According to Household Durable Assets
in Study Areas
(Percentage of Farmers)
Durable Assets Andhra Pradesh Maharashtra
Adopted
villages (%)
Control
villages (%)
Adopted
villages (%)
Control
villages (%)
Residential houses 100.00 100.00 23.52 16.66
Cattle Sheds 40.54 46.67 23.52 16.66
Two Wheelers 83.78 80.00 23.52 16.66
T.Vs/Radios 97.30 93.33 23.52 16.66
Fans 100.00 100.00 23.52 16.66
Table-29: Overall Distribution of Sample Farmers According to Ownership of
Household Durable Assets in Study Areas
(Percentage of Farmers)
Durable Assets Andhra Pradesh Maharashtra
Adopted villages
(%)
Control villages
(%)
Adopted villages
(%)
Control villages
(%)
Residential houses 100.00 100.00 31.80 31.29
Cattle Sheds 35.56 51.11 12.25 18.27
Two Wheelers 68.89 53.33 23.81 29.82
T.Vs/Radios 77.78 73.33 27.00 29.82
Fans 97.78 95.56 27.80 26.88
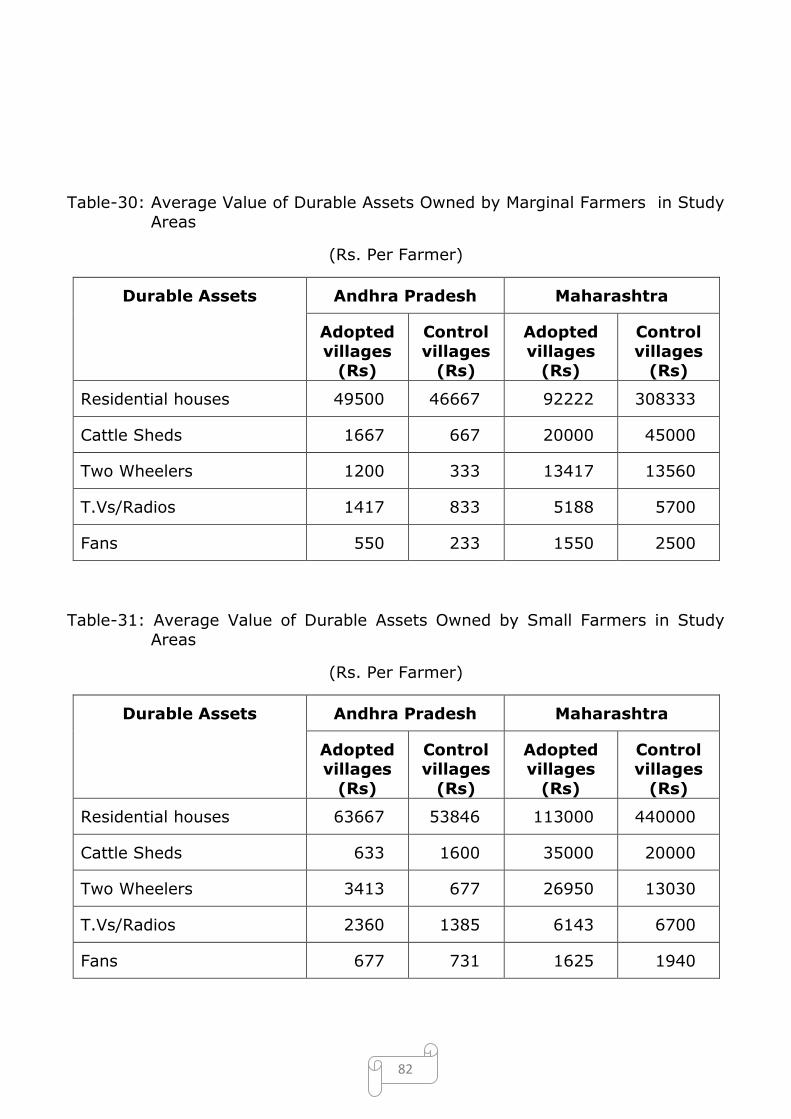
82
Table-30: Average Value of Durable Assets Owned by Marginal Farmers in Study
Areas
(Rs. Per Farmer)
Durable Assets Andhra Pradesh Maharashtra
Adopted
villages (Rs)
Control
villages (Rs)
Adopted
villages (Rs)
Control
villages (Rs)
Residential houses 49500 46667 92222 308333
Cattle Sheds 1667 667 20000 45000
Two Wheelers 1200 333 13417 13560
T.Vs/Radios 1417 833 5188 5700
Fans 550 233 1550 2500
Table-31: Average Value of Durable Assets Owned by Small Farmers in Study
Areas
(Rs. Per Farmer)
Durable Assets Andhra Pradesh Maharashtra
Adopted villages
(Rs)
Control villages
(Rs)
Adopted villages
(Rs)
Control villages
(Rs)
Residential houses 63667 53846 113000 440000
Cattle Sheds 633 1600 35000 20000
Two Wheelers 3413 677 26950 13030
T.Vs/Radios 2360 1385 6143 6700
Fans 677 731 1625 1940
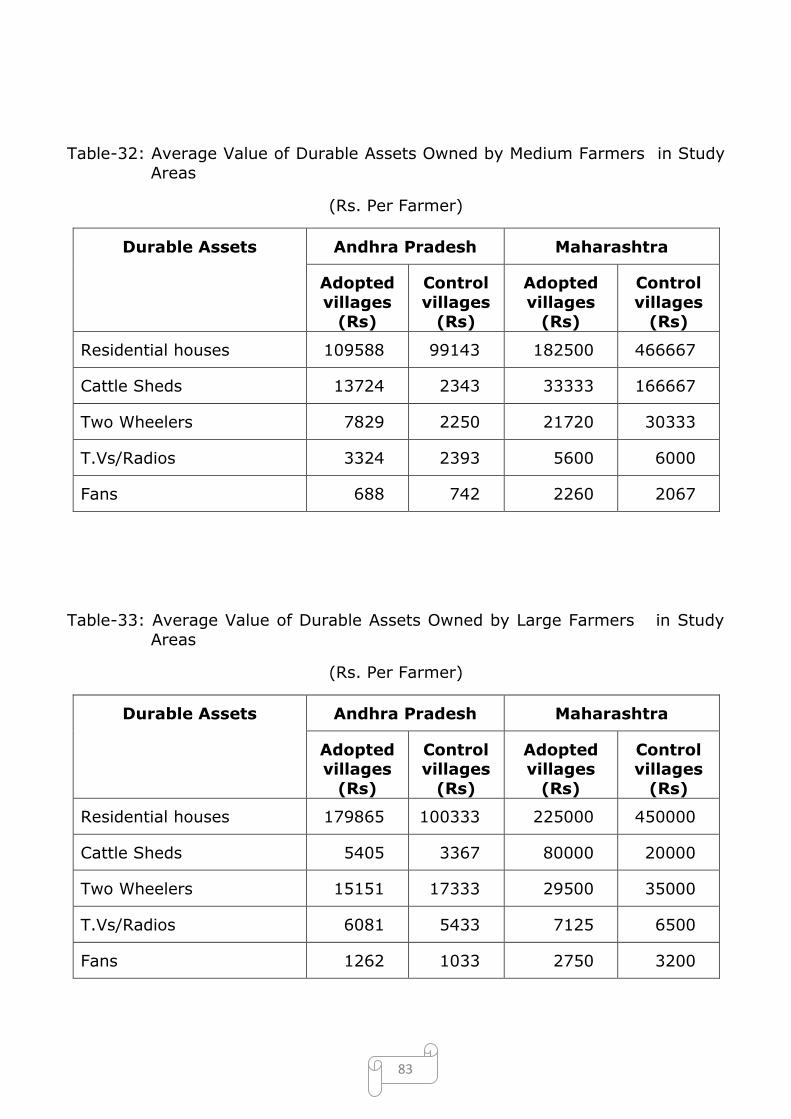
83
Table-32: Average Value of Durable Assets Owned by Medium Farmers in Study
Areas
(Rs. Per Farmer)
Durable Assets Andhra Pradesh Maharashtra
Adopted
villages (Rs)
Control
villages (Rs)
Adopted
villages (Rs)
Control
villages (Rs)
Residential houses 109588 99143 182500 466667
Cattle Sheds 13724 2343 33333 166667
Two Wheelers 7829 2250 21720 30333
T.Vs/Radios 3324 2393 5600 6000
Fans 688 742 2260 2067
Table-33: Average Value of Durable Assets Owned by Large Farmers in Study
Areas
(Rs. Per Farmer)
Durable Assets Andhra Pradesh Maharashtra
Adopted villages
(Rs)
Control villages
(Rs)
Adopted villages
(Rs)
Control villages
(Rs)
Residential houses 179865 100333 225000 450000
Cattle Sheds 5405 3367 80000 20000
Two Wheelers 15151 17333 29500 35000
T.Vs/Radios 6081 5433 7125 6500
Fans 1262 1033 2750 3200
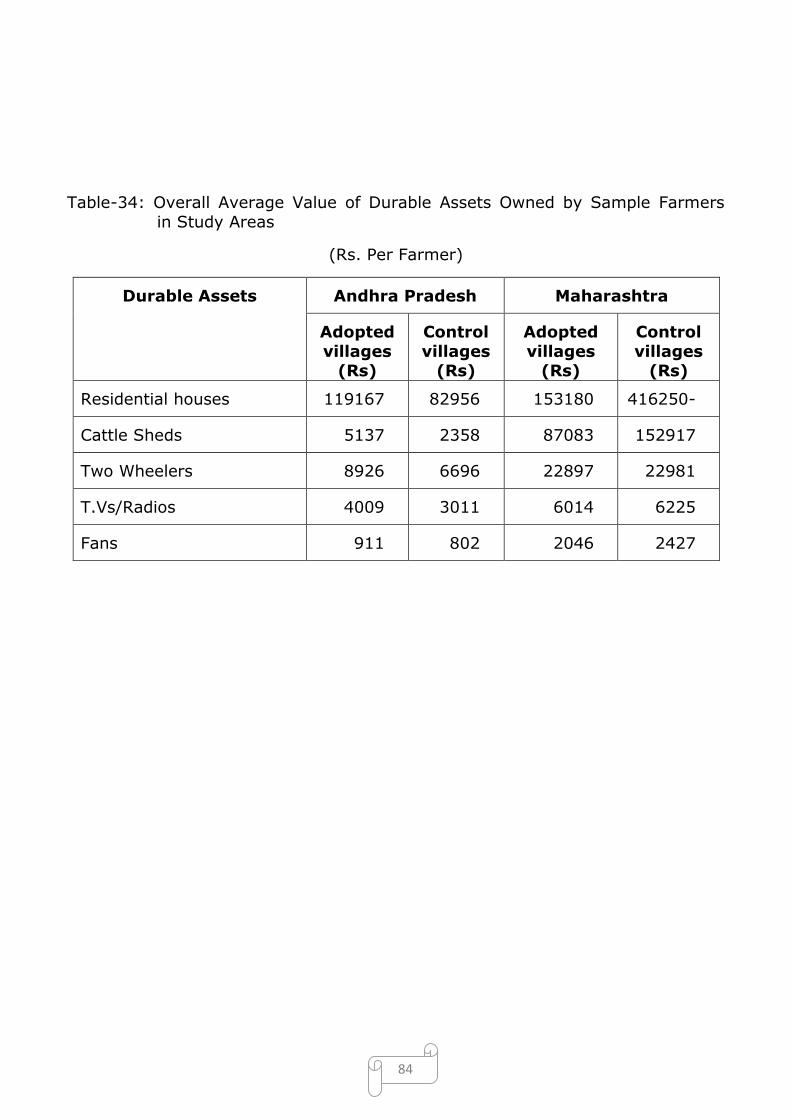
84
Table-34: Overall Average Value of Durable Assets Owned by Sample Farmers
in Study Areas
(Rs. Per Farmer)
Durable Assets Andhra Pradesh Maharashtra
Adopted
villages (Rs)
Control
villages (Rs)
Adopted
villages (Rs)
Control
villages (Rs)
Residential houses 119167 82956 153180 416250-
Cattle Sheds 5137 2358 87083 152917
Two Wheelers 8926 6696 22897 22981
T.Vs/Radios 4009 3011 6014 6225
Fans 911 802 2046 2427
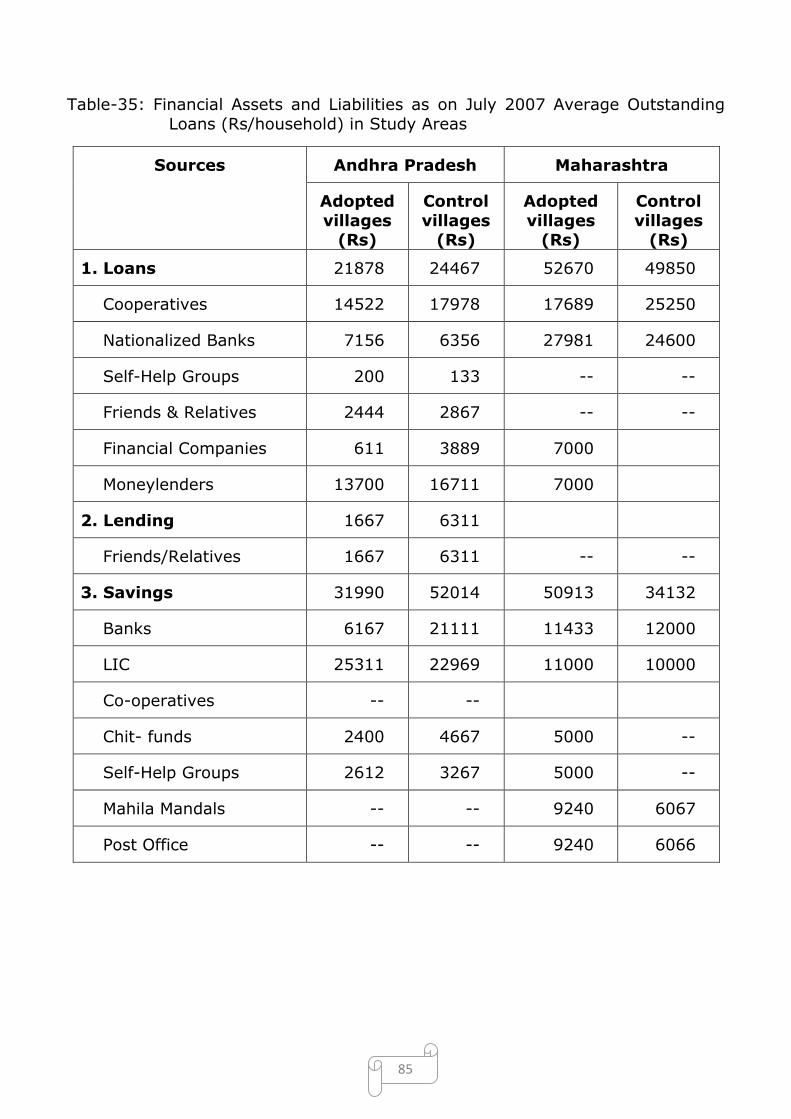
85
Table-35: Financial Assets and Liabilities as on July 2007 Average Outstanding
Loans (Rs/household) in Study Areas
Sources Andhra Pradesh Maharashtra
Adopted
villages (Rs)
Control
villages (Rs)
Adopted
villages (Rs)
Control
villages (Rs)
1. Loans 21878 24467 52670 49850
Cooperatives 14522 17978 17689 25250
Nationalized Banks 7156 6356 27981 24600
Self-Help Groups 200 133 -- --
Friends & Relatives 2444 2867 -- --
Financial Companies 611 3889 7000
Moneylenders 13700 16711 7000
2. Lending 1667 6311
Friends/Relatives 1667 6311 -- --
3. Savings 31990 52014 50913 34132
Banks 6167 21111 11433 12000
LIC 25311 22969 11000 10000
Co-operatives -- --
Chit- funds 2400 4667 5000 --
Self-Help Groups 2612 3267 5000 --
Mahila Mandals -- -- 9240 6067
Post Office -- -- 9240 6066
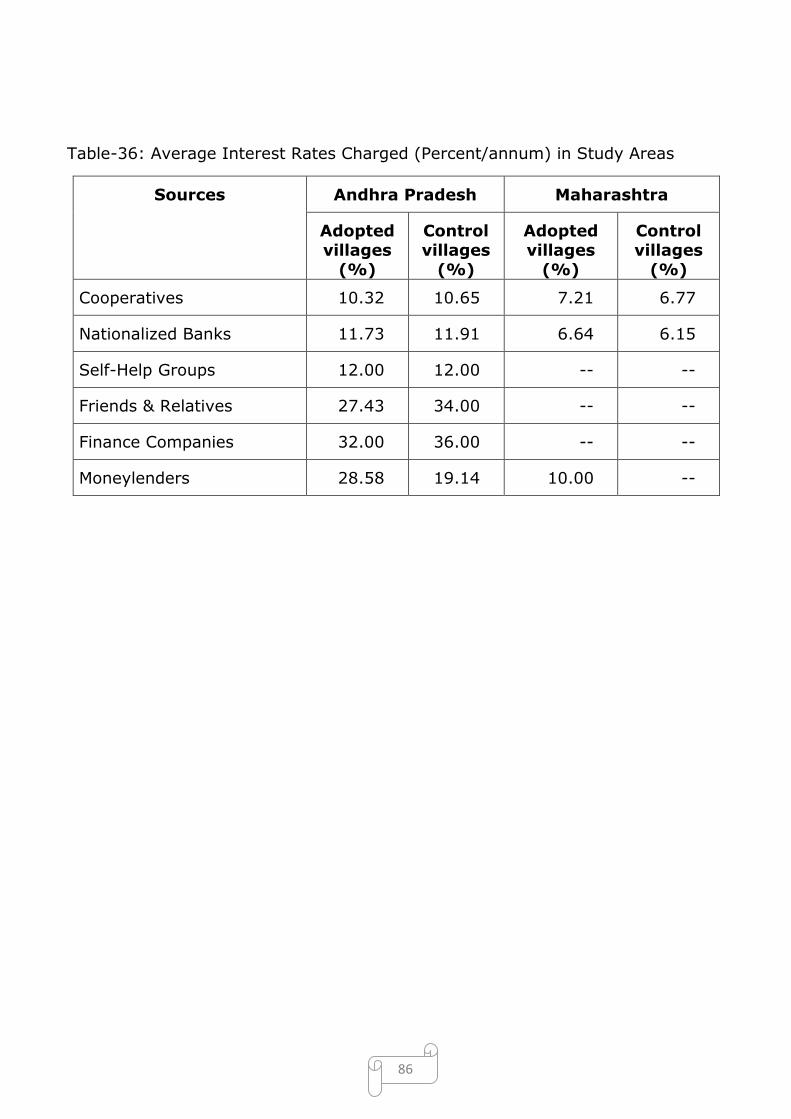
86
Table-36: Average Interest Rates Charged (Percent/annum) in Study Areas
Sources Andhra Pradesh Maharashtra
Adopted villages
(%)
Control villages
(%)
Adopted villages
(%)
Control villages
(%)
Cooperatives 10.32 10.65 7.21 6.77
Nationalized Banks 11.73 11.91 6.64 6.15
Self-Help Groups 12.00 12.00 -- --
Friends & Relatives 27.43 34.00 -- --
Finance Companies 32.00 36.00 -- --
Moneylenders 28.58 19.14 10.00 --
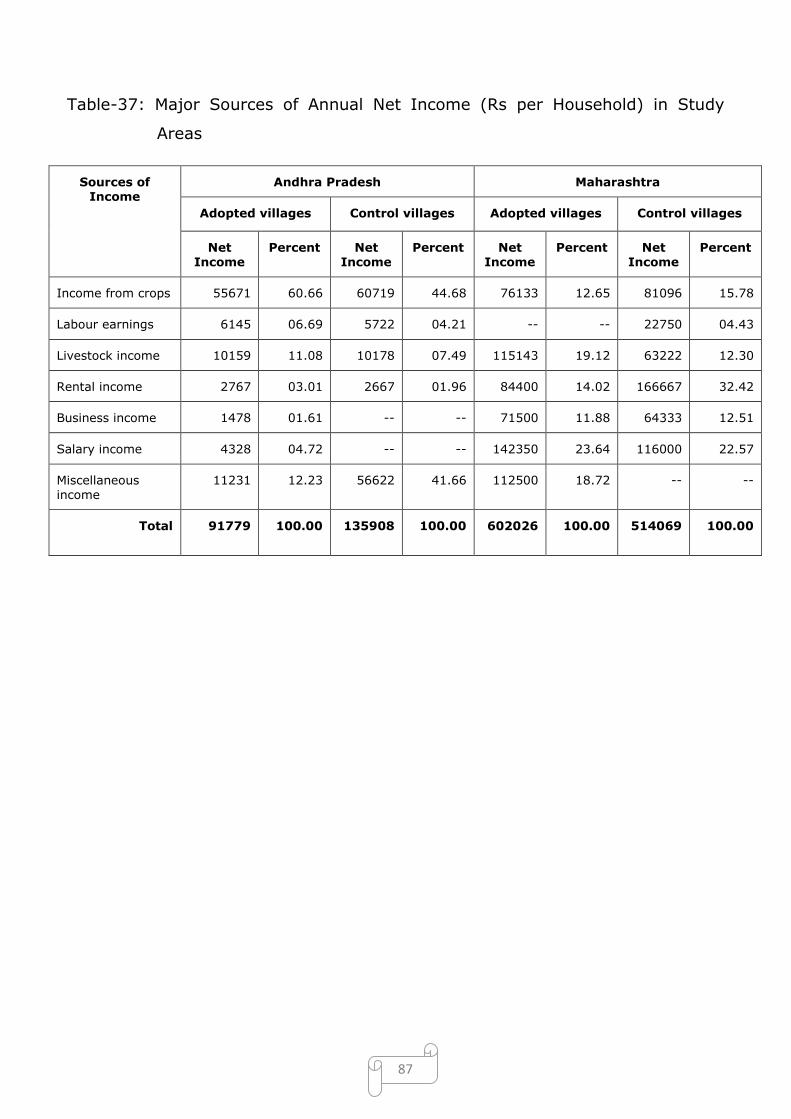
87
Table-37: Major Sources of Annual Net Income (Rs per Household) in Study
Areas
Sources of Income
Andhra Pradesh Maharashtra
Adopted villages Control villages Adopted villages Control villages
Net Income
Percent Net Income
Percent Net Income
Percent Net Income
Percent
Income from crops 55671 60.66 60719 44.68 76133 12.65 81096 15.78
Labour earnings 6145 06.69 5722 04.21 -- -- 22750 04.43
Livestock income 10159 11.08 10178 07.49 115143 19.12 63222 12.30
Rental income 2767 03.01 2667 01.96 84400 14.02 166667 32.42
Business income 1478 01.61 -- -- 71500 11.88 64333 12.51
Salary income 4328 04.72 -- -- 142350 23.64 116000 22.57
Miscellaneous income
11231 12.23 56622 41.66 112500 18.72 -- --
Total 91779 100.00 135908 100.00 602026 100.00 514069 100.00
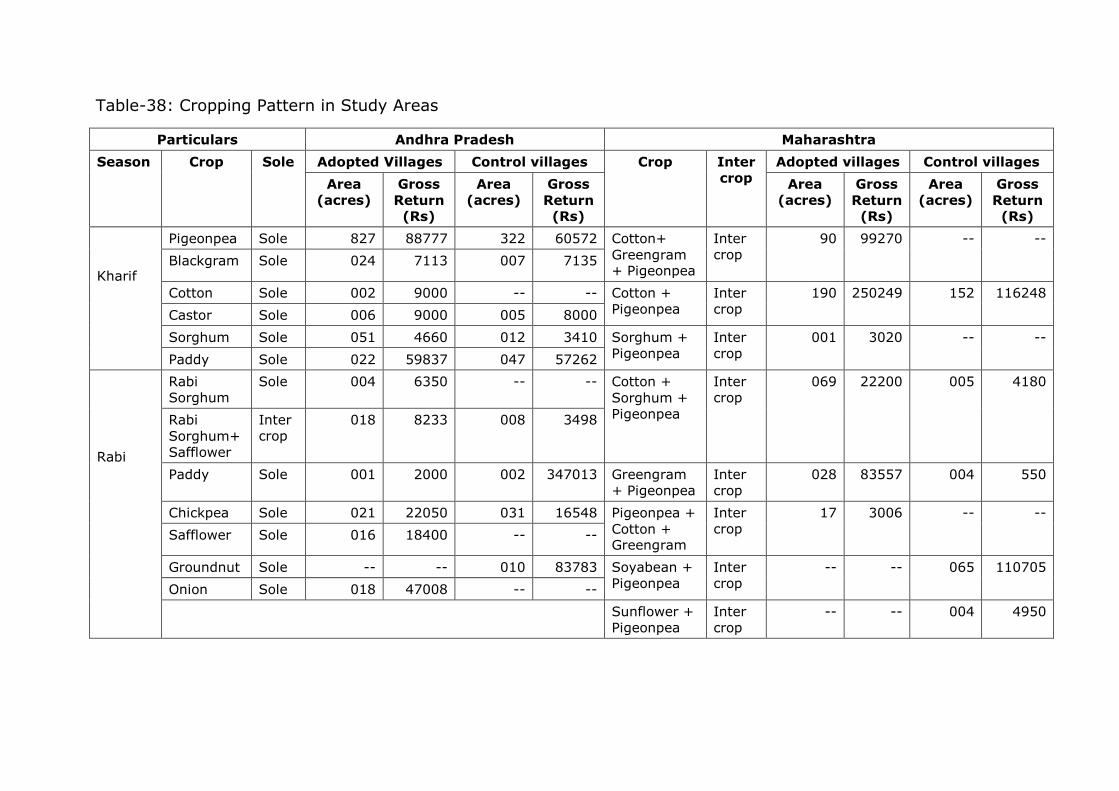
Table-38: Cropping Pattern in Study Areas
Particulars Andhra Pradesh Maharashtra
Season Crop Sole Adopted Villages Control villages Crop Inter
crop
Adopted villages Control villages
Area
(acres)
Gross
Return (Rs)
Area
(acres)
Gross
Return (Rs)
Area
(acres)
Gross
Return (Rs)
Area
(acres)
Gross
Return (Rs)
Kharif
Pigeonpea Sole 827 88777 322 60572 Cotton+
Greengram + Pigeonpea
Inter
crop
90 99270 -- --
Blackgram Sole 024 7113 007 7135
Cotton Sole 002 9000 -- -- Cotton +
Pigeonpea
Inter
crop
190 250249 152 116248
Castor Sole 006 9000 005 8000
Sorghum Sole 051 4660 012 3410 Sorghum +
Pigeonpea
Inter
crop
001 3020 -- --
Paddy Sole 022 59837 047 57262
Rabi
Rabi
Sorghum
Sole 004 6350 -- -- Cotton +
Sorghum +
Pigeonpea
Inter
crop
069 22200 005 4180
Rabi
Sorghum+
Safflower
Inter
crop
018 8233 008 3498
Paddy Sole 001 2000 002 347013 Greengram
+ Pigeonpea
Inter
crop
028 83557 004 550
Chickpea Sole 021 22050 031 16548 Pigeonpea +
Cotton + Greengram
Inter
crop
17 3006 -- --
Safflower Sole 016 18400 -- --
Groundnut Sole -- -- 010 83783 Soyabean +
Pigeonpea
Inter
crop
-- -- 065 110705
Onion Sole 018 47008 -- --
Sunflower +
Pigeonpea
Inter
crop
-- -- 004 4950
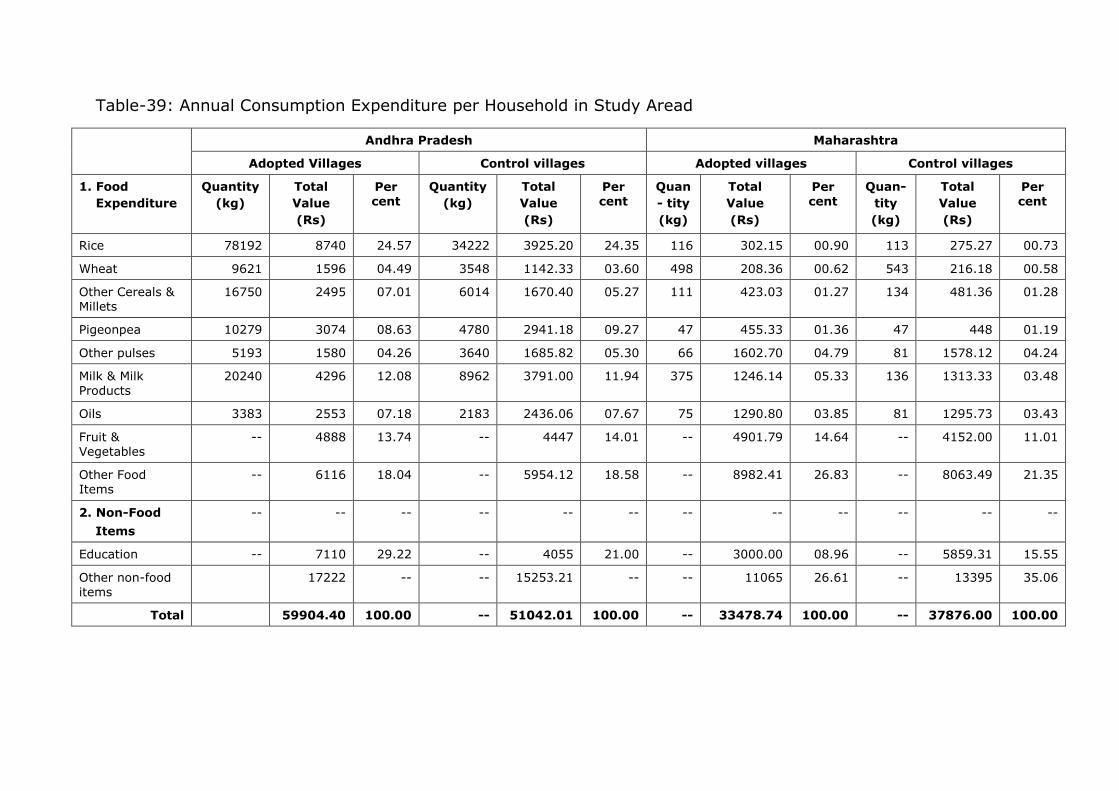
Table-39: Annual Consumption Expenditure per Household in Study Aread
Andhra Pradesh Maharashtra
Adopted Villages Control villages Adopted villages Control villages
1. Food
Expenditure
Quantity
(kg)
Total
Value
(Rs)
Per cent
Quantity
(kg)
Total
Value
(Rs)
Per cent
Quan
- tity
(kg)
Total
Value
(Rs)
Per cent
Quan-
tity
(kg)
Total
Value
(Rs)
Per cent
Rice 78192 8740 24.57 34222 3925.20 24.35 116 302.15 00.90 113 275.27 00.73
Wheat 9621 1596 04.49 3548 1142.33 03.60 498 208.36 00.62 543 216.18 00.58
Other Cereals & Millets
16750 2495 07.01 6014 1670.40 05.27 111 423.03 01.27 134 481.36 01.28
Pigeonpea 10279 3074 08.63 4780 2941.18 09.27 47 455.33 01.36 47 448 01.19
Other pulses 5193 1580 04.26 3640 1685.82 05.30 66 1602.70 04.79 81 1578.12 04.24
Milk & Milk Products
20240 4296 12.08 8962 3791.00 11.94 375 1246.14 05.33 136 1313.33 03.48
Oils 3383 2553 07.18 2183 2436.06 07.67 75 1290.80 03.85 81 1295.73 03.43
Fruit & Vegetables
-- 4888 13.74 -- 4447 14.01 -- 4901.79 14.64 -- 4152.00 11.01
Other Food Items
-- 6116 18.04 -- 5954.12 18.58 -- 8982.41 26.83 -- 8063.49 21.35
2. Non-Food
Items
-- -- -- -- -- -- -- -- -- -- -- --
Education -- 7110 29.22 -- 4055 21.00 -- 3000.00 08.96 -- 5859.31 15.55
Other non-food items
17222 -- -- 15253.21 -- -- 11065 26.61 -- 13395 35.06
Total 59904.40 100.00 -- 51042.01 100.00 -- 33478.74 100.00 -- 37876.00 100.00
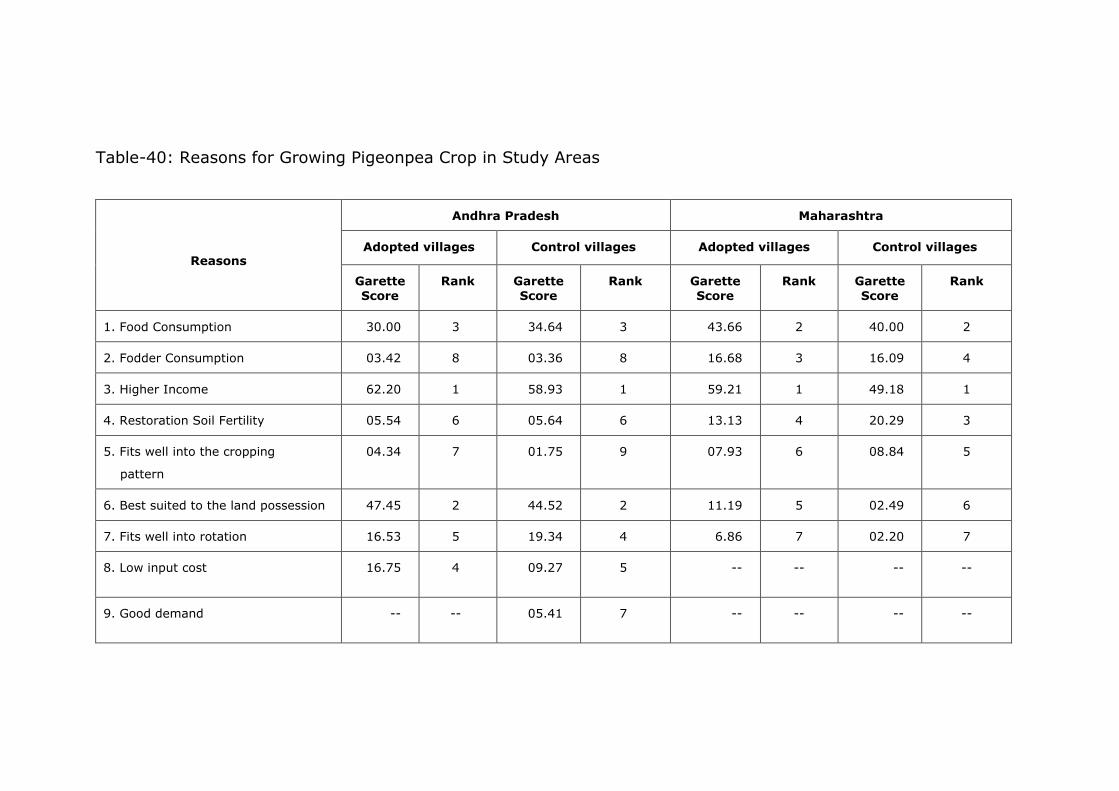
Table-40: Reasons for Growing Pigeonpea Crop in Study Areas
Reasons
Andhra Pradesh Maharashtra
Adopted villages Control villages Adopted villages Control villages
Garette
Score
Rank Garette
Score
Rank Garette
Score
Rank Garette
Score
Rank
1. Food Consumption 30.00 3 34.64 3 43.66 2 40.00 2
2. Fodder Consumption 03.42 8 03.36 8 16.68 3 16.09 4
3. Higher Income 62.20 1 58.93 1 59.21 1 49.18 1
4. Restoration Soil Fertility 05.54 6 05.64 6 13.13 4 20.29 3
5. Fits well into the cropping
pattern
04.34 7 01.75 9 07.93 6 08.84 5
6. Best suited to the land possession 47.45 2 44.52 2 11.19 5 02.49 6
7. Fits well into rotation 16.53 5 19.34 4 6.86 7 02.20 7
8. Low input cost 16.75 4 09.27 5 -- -- -- --
9. Good demand -- -- 05.41 7 -- -- -- --

Table-41: Crop Rotation (once in how many years is pigeonpea crop grown) in Study Areas (Number and
Percentage of Farmers
Frequency
Andhra Pradesh Maharashtra
Adopted villages Control villages Adopted villages Control villages
Number
of
Farmers
Percentage
of Farmers
Number
of
Farmers
Percentage
of Farmers
Number
of
Farmers
Percentage
of Farmers
Number
of
Farmers
Percentage
of Farmers
(a) Every Year 89 98.89 45 100.00 90 100.00 45 100.00
(b) Once in two years 01 01.11 -- -- -- -- -- --
(c) Once in three years -- -- -- -- -- -- -- --

Table-42: Crops Planted Before and After Pigeonpea Crop in Study Areas
Crop
Andhra Pradesh Maharashtra
Adopted villages Control villages Adopted villages Control villages
Number
of
Farmers
Percentage
of
Farmers
Number
of
Farmers
Percentage
of
Farmers
Number
of
Farmers
Percentage
of
Farmers
Number
of
Farmers
Percentage
of
Farmers
Before
Pigeonpea 79 87.78 41 91.11 -- -- -- --
Chickpea 02 02.22 01 02.22 71 78.89 36 80.00
Cotton 01 01.11 00 00.00 00 00.00 00 00.00
Groundnut 01 01.11 00 00.00 00 00.00 00 00.00
Sorghum 07 07.78 02 04.44 00 00.00 00 00.00
Greengram 00 00.00 01 02.22 00 00.00 00 00.00
Wheat 00 00.00 00 00.00 19 21.11 09 20.00
After
Pigeonpea 76 84.44 35 77.78
Chickpea 03 03.33 00 00.00 70 77.78 36 80.00
Cotton 10 11.11 07 15.56 00 00.00 00 00.00
Groundnut 01 01.11 01 02.22 00 00.00 00 00.00
Sorghum 00 00.00 01 02.22 00 00.00 00 00.00
Greengram 00 00.00 01 02.22 00 00.00 00 00.00
Wheat 20 22.22 09 20.00
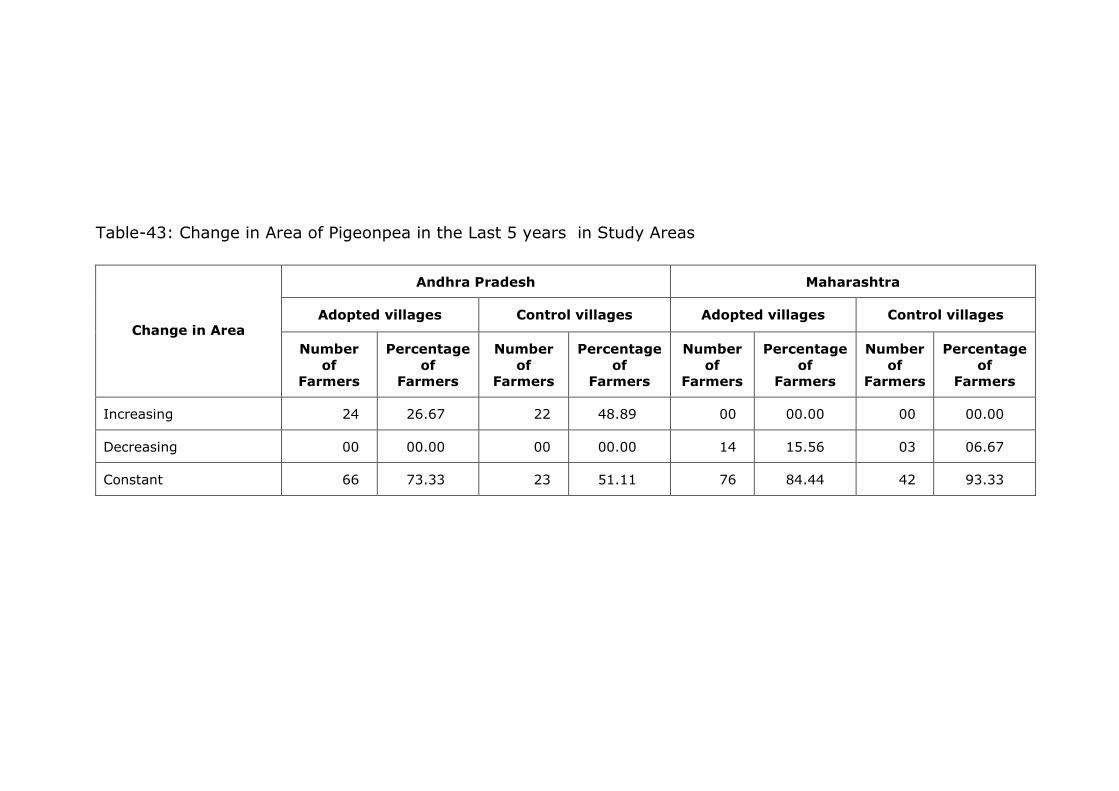
Table-43: Change in Area of Pigeonpea in the Last 5 years in Study Areas
Change in Area
Andhra Pradesh Maharashtra
Adopted villages Control villages Adopted villages Control villages
Number
of
Farmers
Percentage
of
Farmers
Number
of
Farmers
Percentage
of
Farmers
Number
of
Farmers
Percentage
of
Farmers
Number
of
Farmers
Percentage
of
Farmers
Increasing 24 26.67 22 48.89 00 00.00 00 00.00
Decreasing 00 00.00 00 00.00 14 15.56 03 06.67
Constant 66 73.33 23 51.11 76 84.44 42 93.33
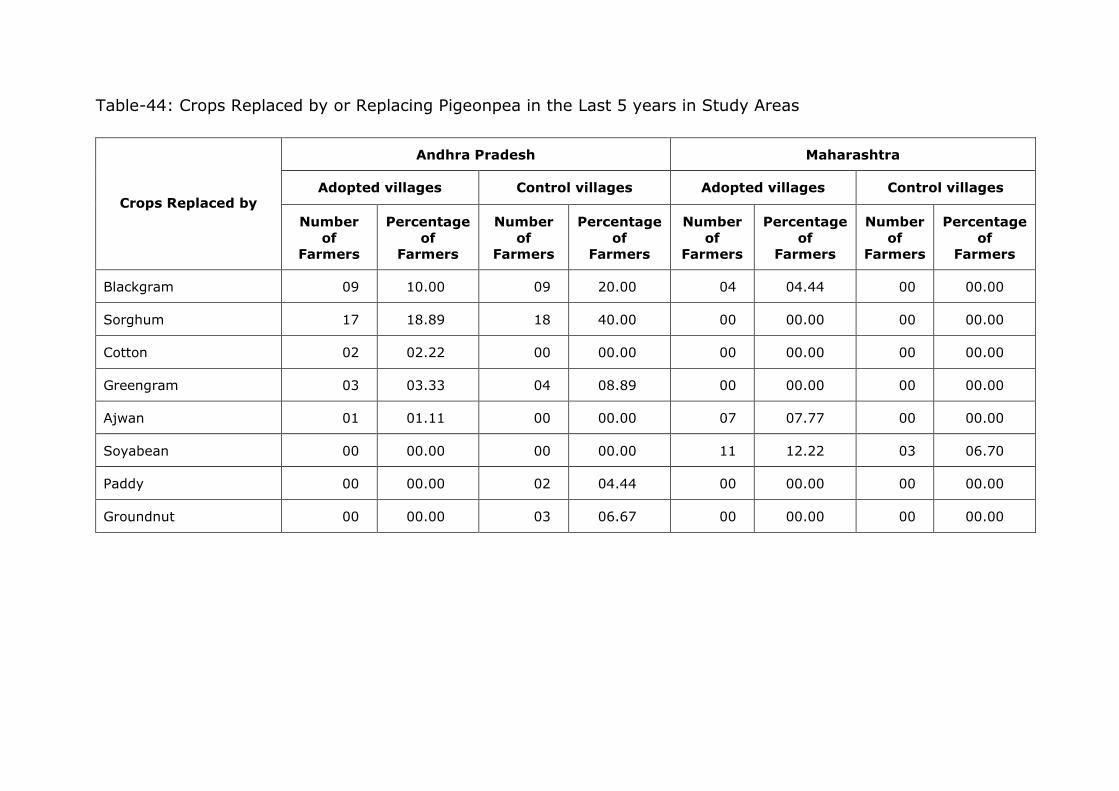
Table-44: Crops Replaced by or Replacing Pigeonpea in the Last 5 years in Study Areas
Crops Replaced by
Andhra Pradesh Maharashtra
Adopted villages Control villages Adopted villages Control villages
Number
of
Farmers
Percentage
of
Farmers
Number
of
Farmers
Percentage
of
Farmers
Number
of
Farmers
Percentage
of
Farmers
Number
of
Farmers
Percentage
of
Farmers
Blackgram 09 10.00 09 20.00 04 04.44 00 00.00
Sorghum 17 18.89 18 40.00 00 00.00 00 00.00
Cotton 02 02.22 00 00.00 00 00.00 00 00.00
Greengram 03 03.33 04 08.89 00 00.00 00 00.00
Ajwan 01 01.11 00 00.00 07 07.77 00 00.00
Soyabean 00 00.00 00 00.00 11 12.22 03 06.70
Paddy 00 00.00 02 04.44 00 00.00 00 00.00
Groundnut 00 00.00 03 06.67 00 00.00 00 00.00

Table-45: Pigeonpea Crop as Sole or Intercrop in Study Areas
Pigeonpea Crop
Andhra Pradesh Maharashtra
Adopted villages Control villages Adopted villages Control villages
Number
of
Farmers
Percentage
of
Farmers
Number
of
Farmers
Percentage
of
Farmers
Number
of
Farmers
Percentage
of
Farmers
Number
of
Farmers
Percentage
of
Farmers
Sole Crop 89 98.89 45 100.00 01 01.00 00 00.00
Inter Crop 01 01.11 00 00.00 89 99.00 45 100.00
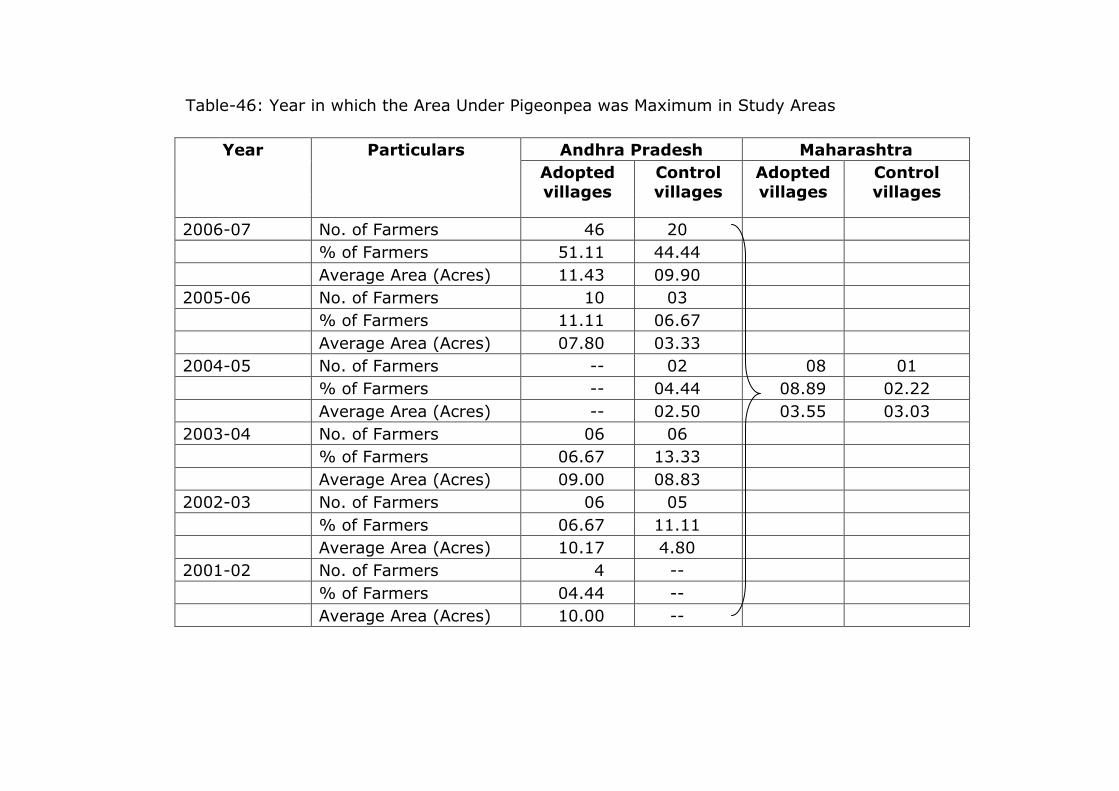
Table-46: Year in which the Area Under Pigeonpea was Maximum in Study Areas
Year Particulars Andhra Pradesh Maharashtra
Adopted
villages
Control
villages
Adopted
villages
Control
villages
2006-07 No. of Farmers 46 20
% of Farmers 51.11 44.44
Average Area (Acres) 11.43 09.90
2005-06 No. of Farmers 10 03
% of Farmers 11.11 06.67
Average Area (Acres) 07.80 03.33
2004-05 No. of Farmers -- 02 08 01
% of Farmers -- 04.44 08.89 02.22
Average Area (Acres) -- 02.50 03.55 03.03
2003-04 No. of Farmers 06 06
% of Farmers 06.67 13.33
Average Area (Acres) 09.00 08.83
2002-03 No. of Farmers 06 05
% of Farmers 06.67 11.11
Average Area (Acres) 10.17 4.80
2001-02 No. of Farmers 4 --
% of Farmers 04.44 --
Average Area (Acres) 10.00 --
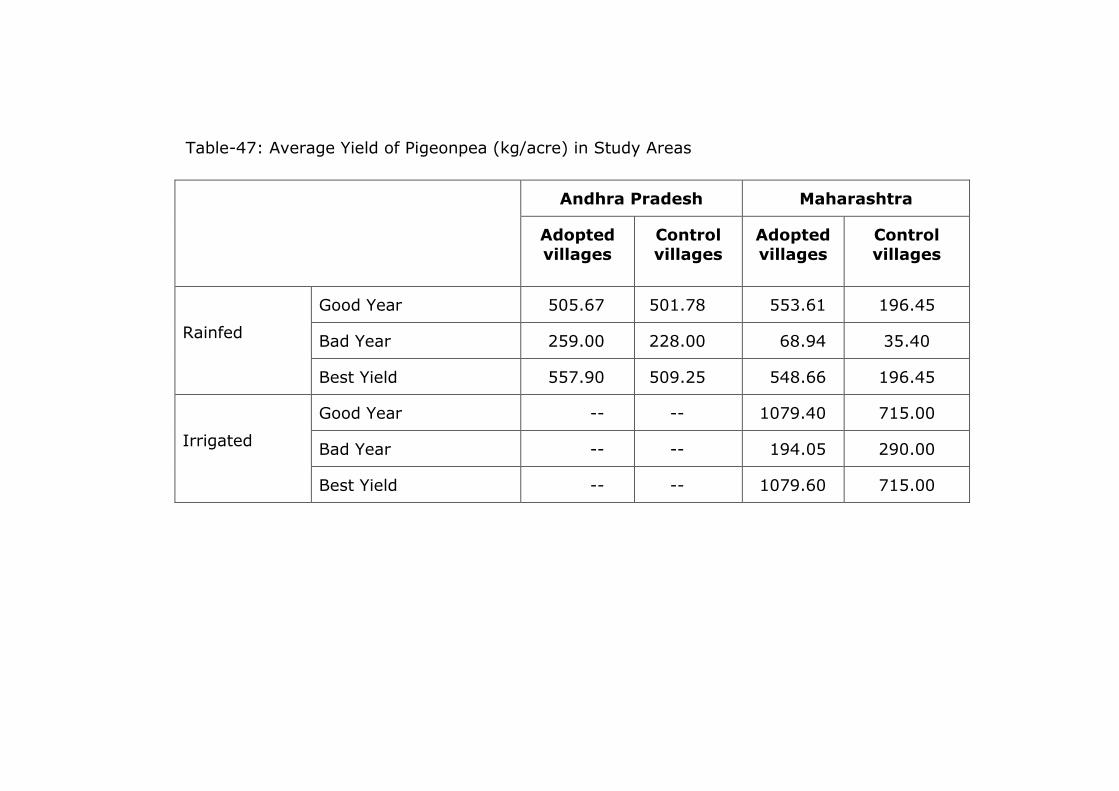
Table-47: Average Yield of Pigeonpea (kg/acre) in Study Areas
Andhra Pradesh Maharashtra
Adopted
villages
Control
villages
Adopted
villages
Control
villages
Rainfed
Good Year 505.67 501.78 553.61 196.45
Bad Year 259.00 228.00 68.94 35.40
Best Yield 557.90 509.25 548.66 196.45
Irrigated
Good Year -- -- 1079.40 715.00
Bad Year -- -- 194.05 290.00
Best Yield -- -- 1079.60 715.00
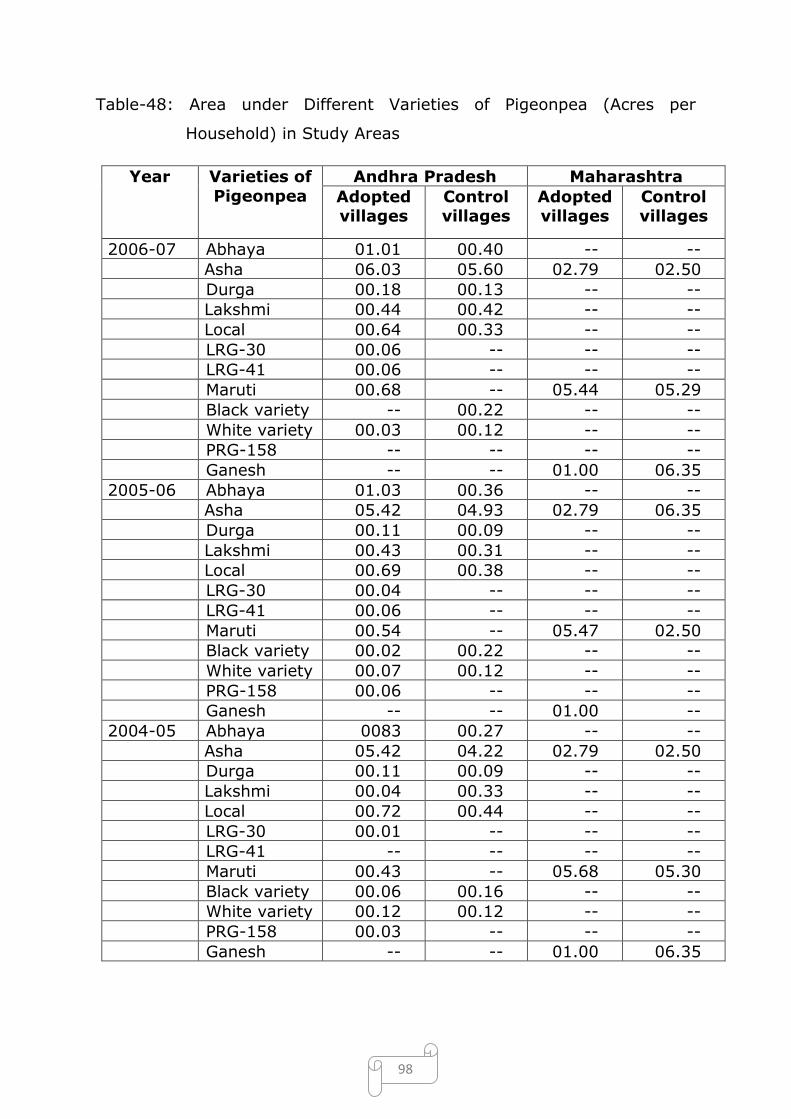
98
Table-48: Area under Different Varieties of Pigeonpea (Acres per
Household) in Study Areas
Year Varieties of
Pigeonpea
Andhra Pradesh Maharashtra
Adopted villages
Control villages
Adopted villages
Control villages
2006-07 Abhaya 01.01 00.40 -- --
Asha 06.03 05.60 02.79 02.50
Durga 00.18 00.13 -- --
Lakshmi 00.44 00.42 -- --
Local 00.64 00.33 -- --
LRG-30 00.06 -- -- --
LRG-41 00.06 -- -- --
Maruti 00.68 -- 05.44 05.29
Black variety -- 00.22 -- --
White variety 00.03 00.12 -- --
PRG-158 -- -- -- --
Ganesh -- -- 01.00 06.35
2005-06 Abhaya 01.03 00.36 -- --
Asha 05.42 04.93 02.79 06.35
Durga 00.11 00.09 -- --
Lakshmi 00.43 00.31 -- --
Local 00.69 00.38 -- --
LRG-30 00.04 -- -- --
LRG-41 00.06 -- -- --
Maruti 00.54 -- 05.47 02.50
Black variety 00.02 00.22 -- --
White variety 00.07 00.12 -- --
PRG-158 00.06 -- -- --
Ganesh -- -- 01.00 --
2004-05 Abhaya 0083 00.27 -- --
Asha 05.42 04.22 02.79 02.50
Durga 00.11 00.09 -- --
Lakshmi 00.04 00.33 -- --
Local 00.72 00.44 -- --
LRG-30 00.01 -- -- --
LRG-41 -- -- -- --
Maruti 00.43 -- 05.68 05.30
Black variety 00.06 00.16 -- --
White variety 00.12 00.12 -- --
PRG-158 00.03 -- -- --
Ganesh -- -- 01.00 06.35
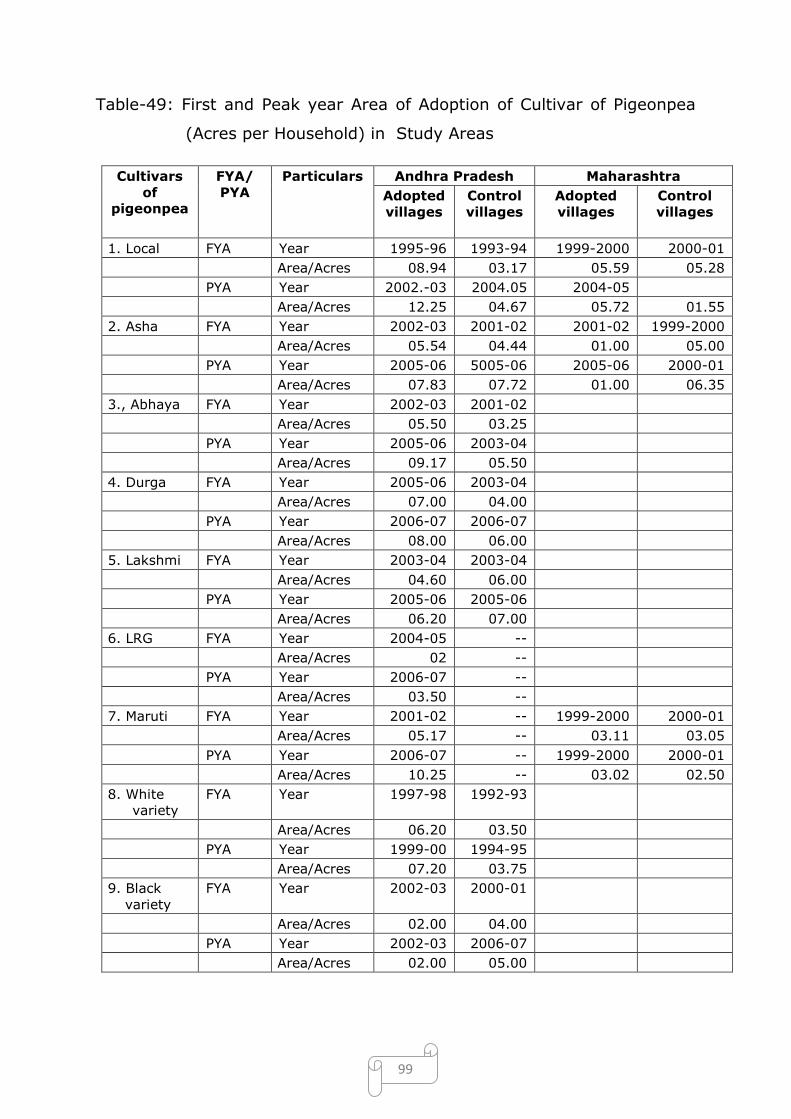
99
Table-49: First and Peak year Area of Adoption of Cultivar of Pigeonpea
(Acres per Household) in Study Areas
Cultivars
of
pigeonpea
FYA/
PYA
Particulars Andhra Pradesh Maharashtra
Adopted
villages
Control
villages
Adopted
villages
Control
villages
1. Local FYA Year 1995-96 1993-94 1999-2000 2000-01
Area/Acres 08.94 03.17 05.59 05.28
PYA Year 2002.-03 2004.05 2004-05
Area/Acres 12.25 04.67 05.72 01.55
2. Asha FYA Year 2002-03 2001-02 2001-02 1999-2000
Area/Acres 05.54 04.44 01.00 05.00
PYA Year 2005-06 5005-06 2005-06 2000-01
Area/Acres 07.83 07.72 01.00 06.35
3., Abhaya FYA Year 2002-03 2001-02
Area/Acres 05.50 03.25
PYA Year 2005-06 2003-04
Area/Acres 09.17 05.50
4. Durga FYA Year 2005-06 2003-04
Area/Acres 07.00 04.00
PYA Year 2006-07 2006-07
Area/Acres 08.00 06.00
5. Lakshmi FYA Year 2003-04 2003-04
Area/Acres 04.60 06.00
PYA Year 2005-06 2005-06
Area/Acres 06.20 07.00
6. LRG FYA Year 2004-05 --
Area/Acres 02 --
PYA Year 2006-07 --
Area/Acres 03.50 --
7. Maruti FYA Year 2001-02 -- 1999-2000 2000-01
Area/Acres 05.17 -- 03.11 03.05
PYA Year 2006-07 -- 1999-2000 2000-01
Area/Acres 10.25 -- 03.02 02.50
8. White
variety
FYA Year 1997-98 1992-93
Area/Acres 06.20 03.50
PYA Year 1999-00 1994-95
Area/Acres 07.20 03.75
9. Black
variety
FYA Year 2002-03 2000-01
Area/Acres 02.00 04.00
PYA Year 2002-03 2006-07
Area/Acres 02.00 05.00
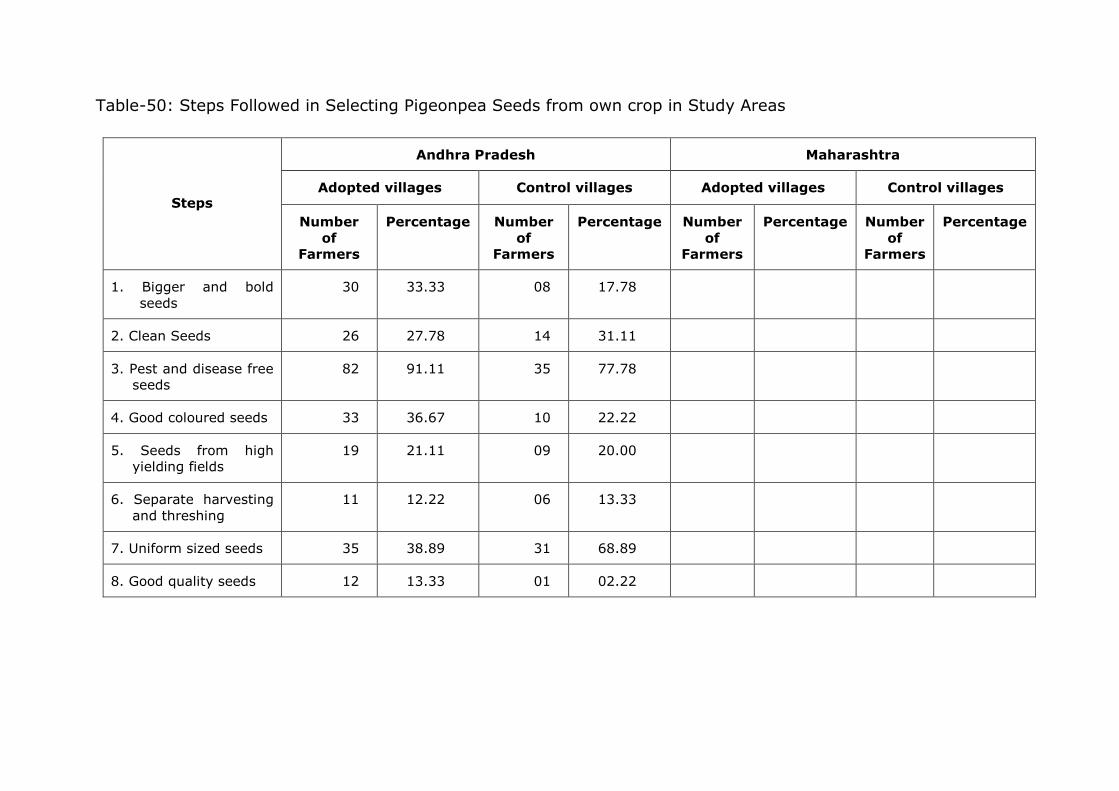
Table-50: Steps Followed in Selecting Pigeonpea Seeds from own crop in Study Areas
Steps
Andhra Pradesh Maharashtra
Adopted villages Control villages Adopted villages Control villages
Number
of
Farmers
Percentage Number
of
Farmers
Percentage Number
of
Farmers
Percentage Number
of
Farmers
Percentage
1. Bigger and bold
seeds
30 33.33 08 17.78
2. Clean Seeds 26 27.78 14 31.11
3. Pest and disease free
seeds
82 91.11 35 77.78
4. Good coloured seeds 33 36.67 10 22.22
5. Seeds from high
yielding fields
19 21.11 09 20.00
6. Separate harvesting
and threshing
11 12.22 06 13.33
7. Uniform sized seeds 35 38.89 31 68.89
8. Good quality seeds 12 13.33 01 02.22
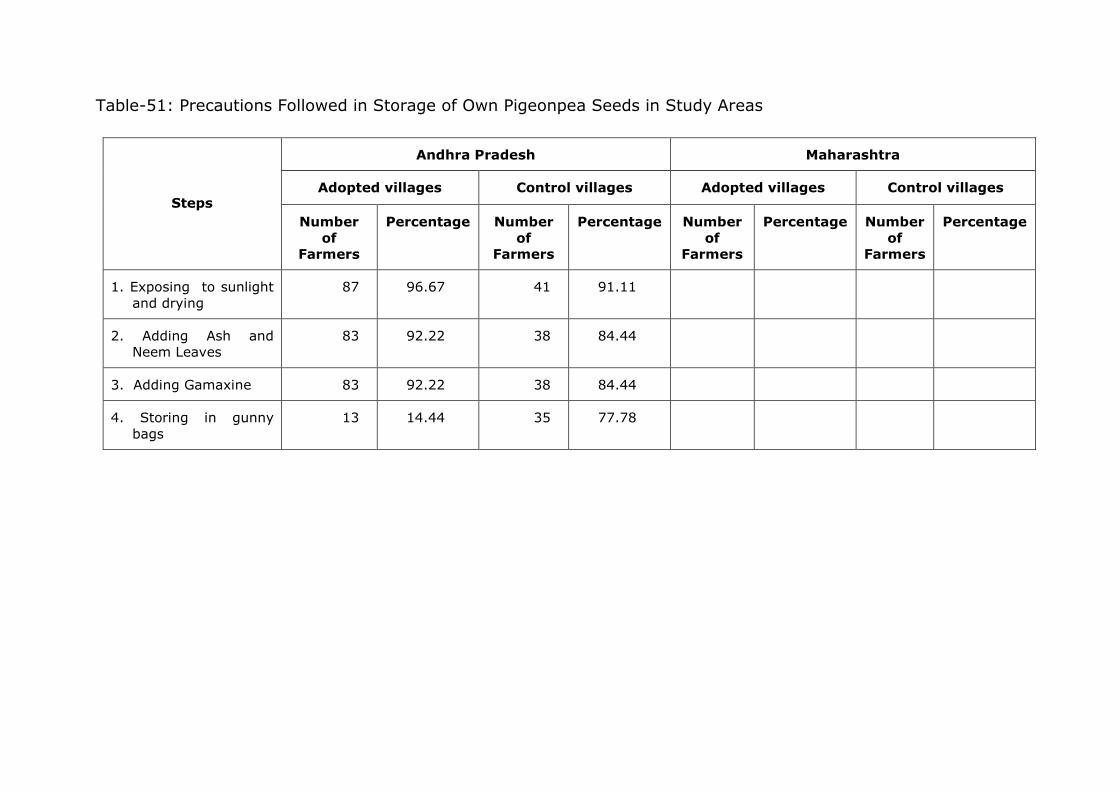
Table-51: Precautions Followed in Storage of Own Pigeonpea Seeds in Study Areas
Steps
Andhra Pradesh Maharashtra
Adopted villages Control villages Adopted villages Control villages
Number
of
Farmers
Percentage Number
of
Farmers
Percentage Number
of
Farmers
Percentage Number
of
Farmers
Percentage
1. Exposing to sunlight
and drying
87 96.67 41 91.11
2. Adding Ash and
Neem Leaves
83 92.22 38 84.44
3. Adding Gamaxine 83 92.22 38 84.44
4. Storing in gunny
bags
13 14.44 35 77.78
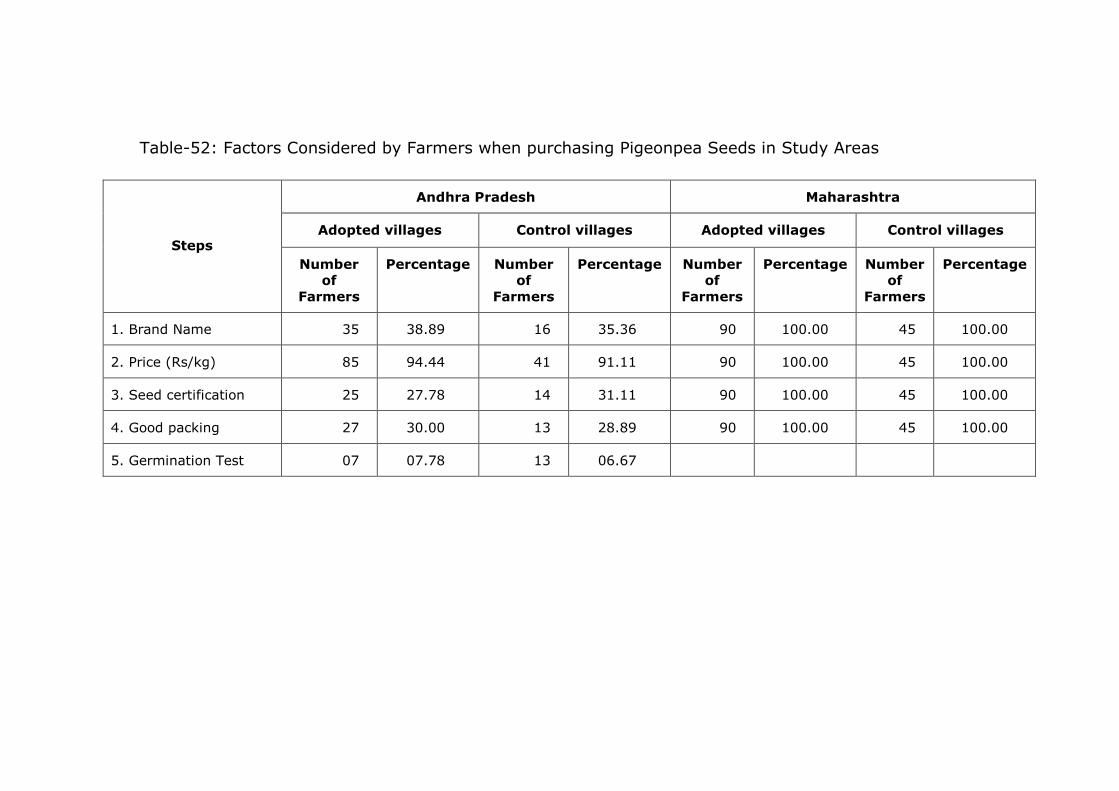
Table-52: Factors Considered by Farmers when purchasing Pigeonpea Seeds in Study Areas
Steps
Andhra Pradesh Maharashtra
Adopted villages Control villages Adopted villages Control villages
Number
of
Farmers
Percentage Number
of
Farmers
Percentage Number
of
Farmers
Percentage Number
of
Farmers
Percentage
1. Brand Name 35 38.89 16 35.36 90 100.00 45 100.00
2. Price (Rs/kg) 85 94.44 41 91.11 90 100.00 45 100.00
3. Seed certification 25 27.78 14 31.11 90 100.00 45 100.00
4. Good packing 27 30.00 13 28.89 90 100.00 45 100.00
5. Germination Test 07 07.78 13 06.67
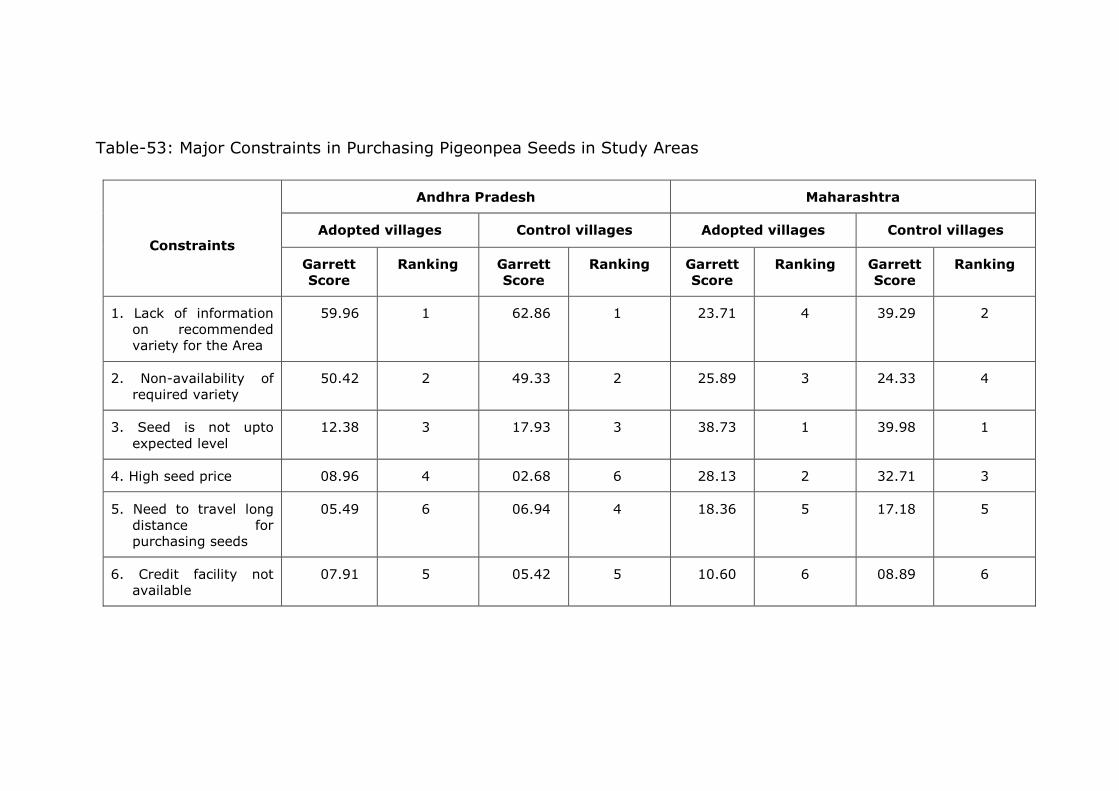
Table-53: Major Constraints in Purchasing Pigeonpea Seeds in Study Areas
Constraints
Andhra Pradesh Maharashtra
Adopted villages Control villages Adopted villages Control villages
Garrett
Score
Ranking Garrett
Score
Ranking Garrett
Score
Ranking Garrett
Score
Ranking
1. Lack of information
on recommended
variety for the Area
59.96 1 62.86 1 23.71 4 39.29 2
2. Non-availability of
required variety
50.42 2 49.33 2 25.89 3 24.33 4
3. Seed is not upto
expected level
12.38 3 17.93 3 38.73 1 39.98 1
4. High seed price 08.96 4 02.68 6 28.13 2 32.71 3
5. Need to travel long
distance for
purchasing seeds
05.49 6 06.94 4 18.36 5 17.18 5
6. Credit facility not
available
07.91 5 05.42 5 10.60 6 08.89 6
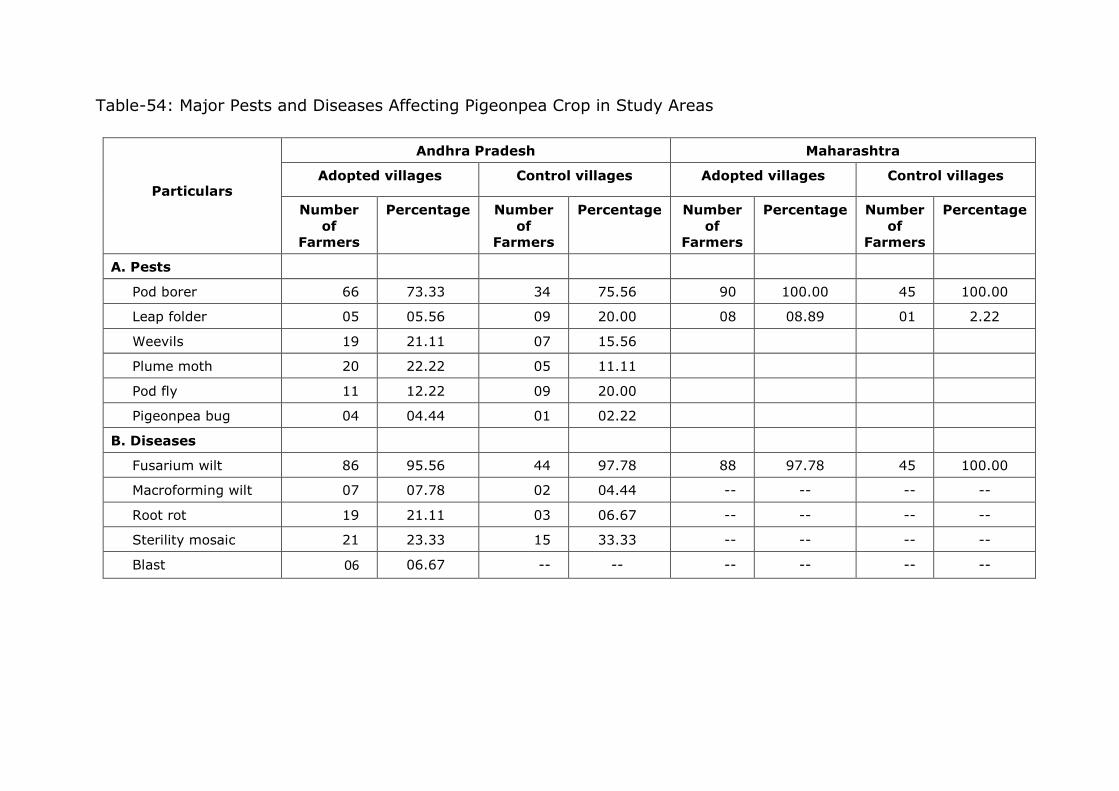
Table-54: Major Pests and Diseases Affecting Pigeonpea Crop in Study Areas
Particulars
Andhra Pradesh Maharashtra
Adopted villages Control villages Adopted villages Control villages
Number
of
Farmers
Percentage Number
of
Farmers
Percentage Number
of
Farmers
Percentage Number
of
Farmers
Percentage
A. Pests
Pod borer 66 73.33 34 75.56 90 100.00 45 100.00
Leap folder 05 05.56 09 20.00 08 08.89 01 2.22
Weevils 19 21.11 07 15.56
Plume moth 20 22.22 05 11.11
Pod fly 11 12.22 09 20.00
Pigeonpea bug 04 04.44 01 02.22
B. Diseases
Fusarium wilt 86 95.56 44 97.78 88 97.78 45 100.00
Macroforming wilt 07 07.78 02 04.44 -- -- -- --
Root rot 19 21.11 03 06.67 -- -- -- --
Sterility mosaic 21 23.33 15 33.33 -- -- -- --
Blast 06 06.67 -- -- -- -- -- --
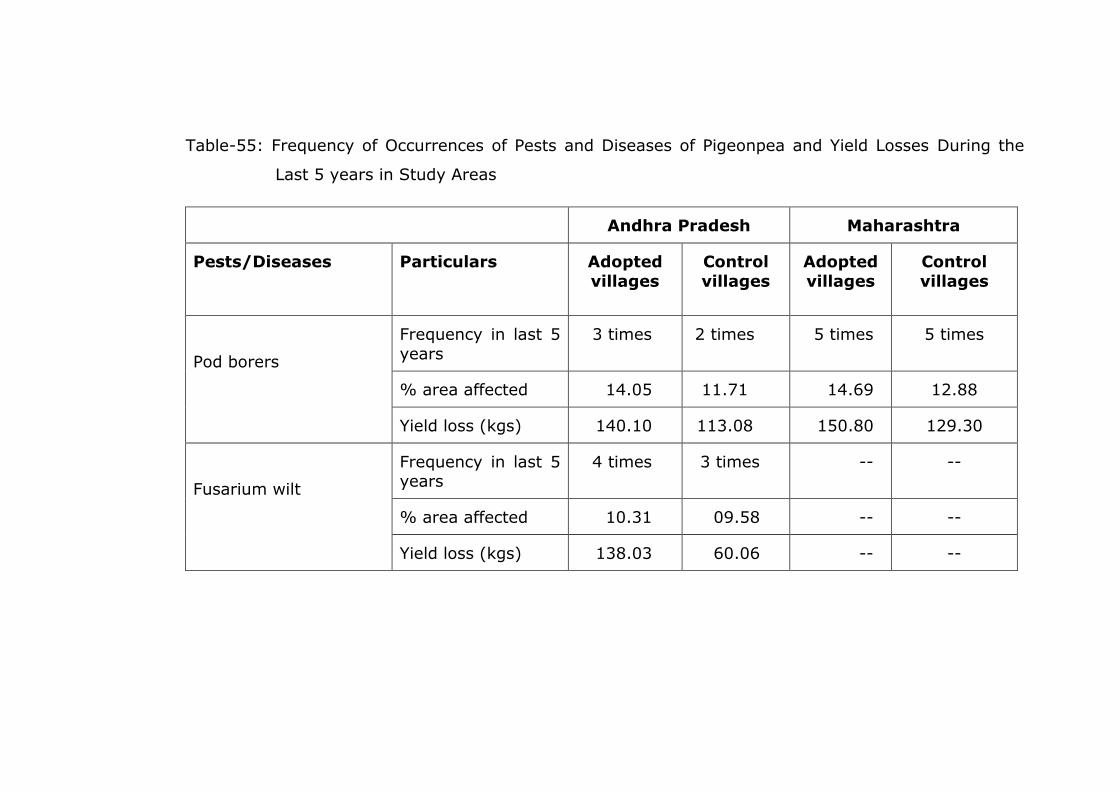
Table-55: Frequency of Occurrences of Pests and Diseases of Pigeonpea and Yield Losses During the
Last 5 years in Study Areas
Andhra Pradesh Maharashtra
Pests/Diseases Particulars Adopted
villages
Control
villages
Adopted
villages
Control
villages
Pod borers
Frequency in last 5
years
3 times 2 times 5 times 5 times
% area affected 14.05 11.71 14.69 12.88
Yield loss (kgs) 140.10 113.08 150.80 129.30
Fusarium wilt
Frequency in last 5 years
4 times 3 times -- --
% area affected 10.31 09.58 -- --
Yield loss (kgs) 138.03 60.06 -- --
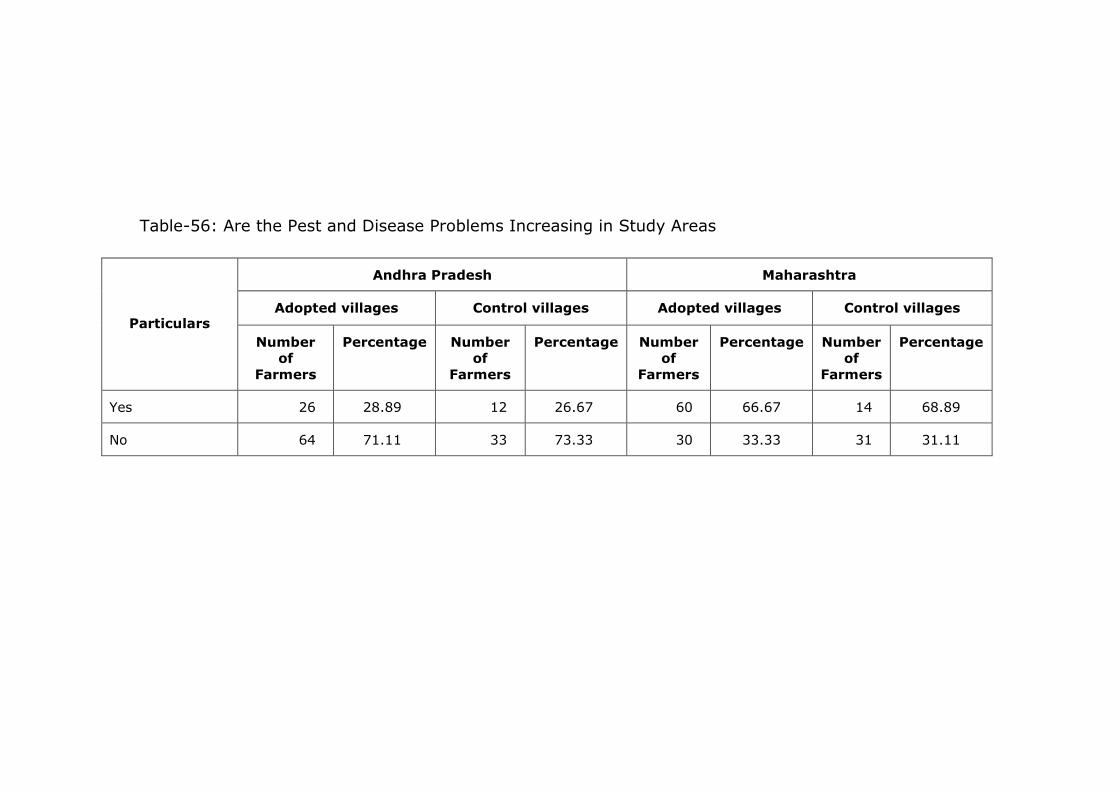
Table-56: Are the Pest and Disease Problems Increasing in Study Areas
Particulars
Andhra Pradesh Maharashtra
Adopted villages Control villages Adopted villages Control villages
Number
of
Farmers
Percentage Number
of
Farmers
Percentage Number
of
Farmers
Percentage Number
of
Farmers
Percentage
Yes 26 28.89 12 26.67 60 66.67 14 68.89
No 64 71.11 33 73.33 30 33.33 31 31.11
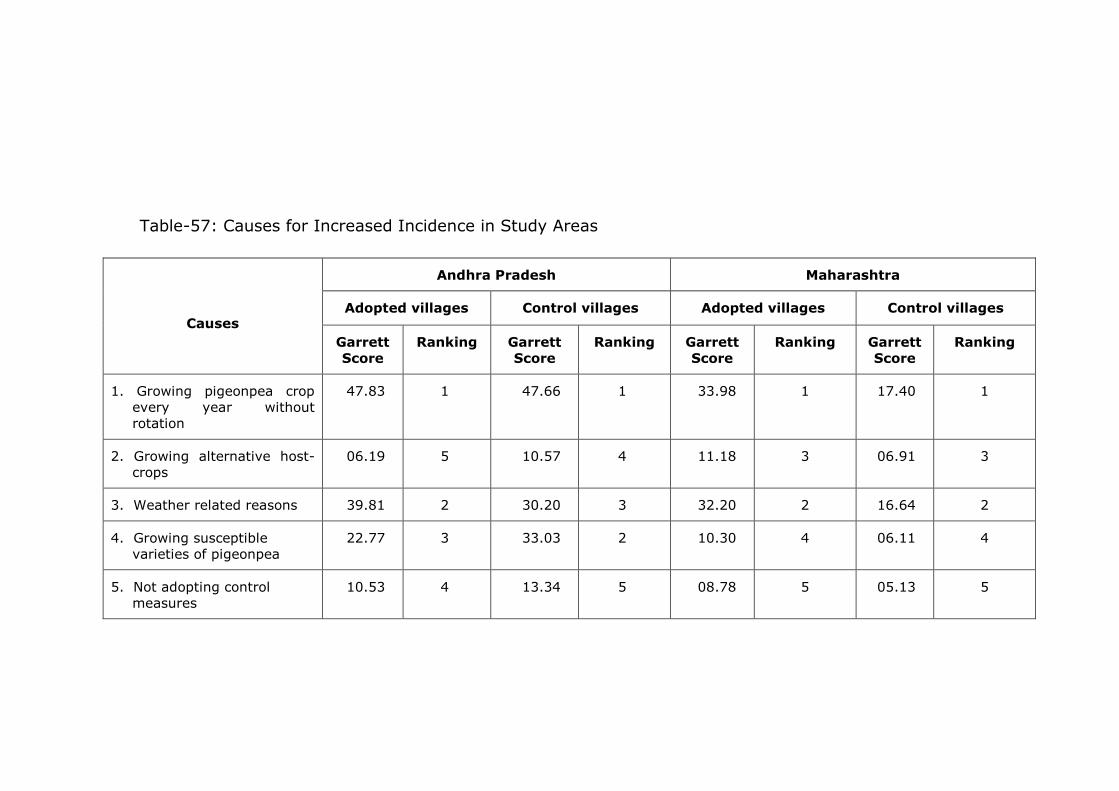
Table-57: Causes for Increased Incidence in Study Areas
Causes
Andhra Pradesh Maharashtra
Adopted villages Control villages Adopted villages Control villages
Garrett
Score
Ranking Garrett
Score
Ranking Garrett
Score
Ranking Garrett
Score
Ranking
1. Growing pigeonpea crop
every year without
rotation
47.83 1 47.66 1 33.98 1 17.40 1
2. Growing alternative host-
crops
06.19 5 10.57 4 11.18 3 06.91 3
3. Weather related reasons 39.81 2 30.20 3 32.20 2 16.64 2
4. Growing susceptible
varieties of pigeonpea
22.77 3 33.03 2 10.30 4 06.11 4
5. Not adopting control
measures
10.53 4 13.34 5 08.78 5 05.13 5
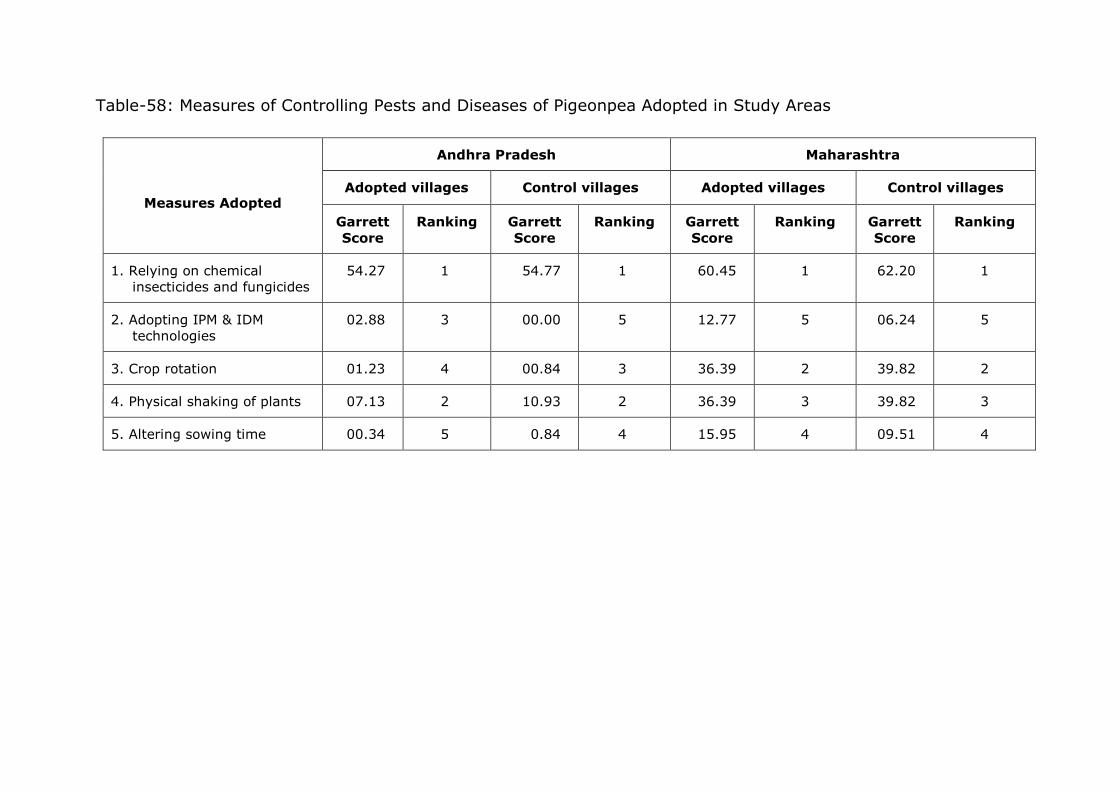
Table-58: Measures of Controlling Pests and Diseases of Pigeonpea Adopted in Study Areas
Measures Adopted
Andhra Pradesh Maharashtra
Adopted villages Control villages Adopted villages Control villages
Garrett
Score
Ranking Garrett
Score
Ranking Garrett
Score
Ranking Garrett
Score
Ranking
1. Relying on chemical
insecticides and fungicides
54.27 1 54.77 1 60.45 1 62.20 1
2. Adopting IPM & IDM
technologies
02.88 3 00.00 5 12.77 5 06.24 5
3. Crop rotation 01.23 4 00.84 3 36.39 2 39.82 2
4. Physical shaking of plants 07.13 2 10.93 2 36.39 3 39.82 3
5. Altering sowing time 00.34 5 0.84 4 15.95 4 09.51 4
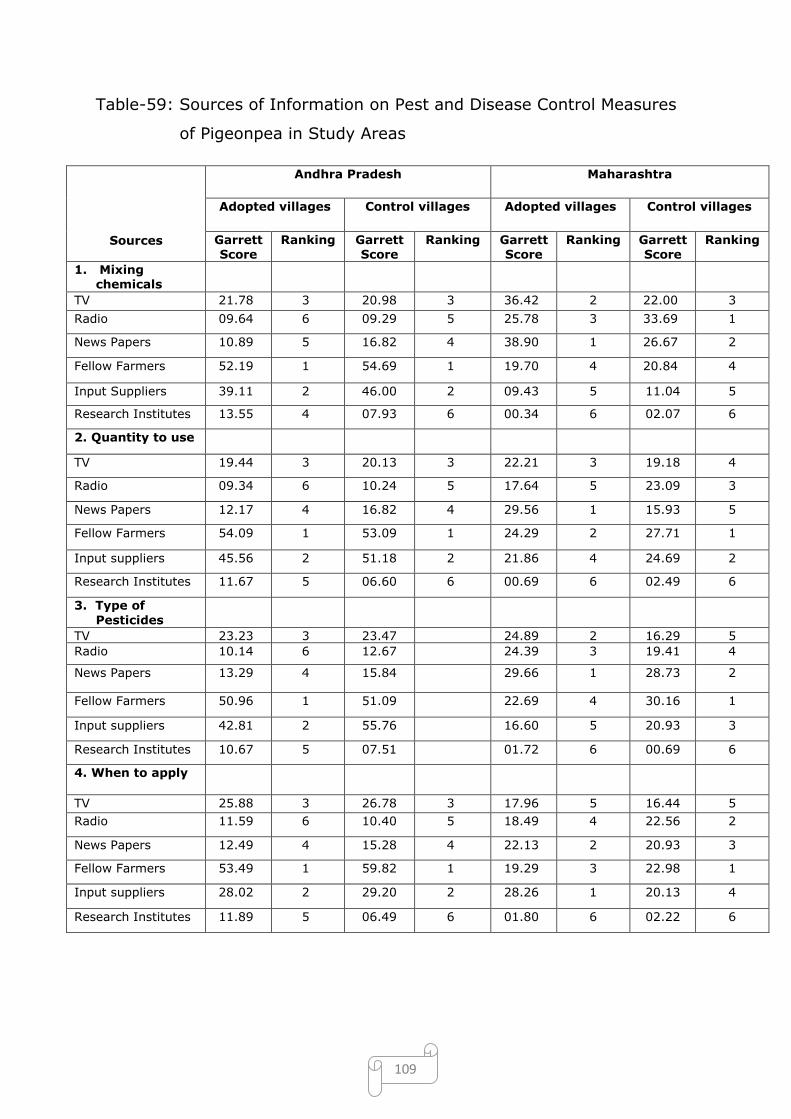
109
Table-59: Sources of Information on Pest and Disease Control Measures
of Pigeonpea in Study Areas
Sources
Andhra Pradesh Maharashtra
Adopted villages Control villages Adopted villages Control villages
Garrett Score
Ranking Garrett Score
Ranking Garrett Score
Ranking Garrett Score
Ranking
1. Mixing chemicals
TV 21.78 3 20.98 3 36.42 2 22.00 3
Radio 09.64 6 09.29 5 25.78 3 33.69 1
News Papers 10.89 5 16.82 4 38.90 1 26.67 2
Fellow Farmers 52.19 1 54.69 1 19.70 4 20.84 4
Input Suppliers 39.11 2 46.00 2 09.43 5 11.04 5
Research Institutes 13.55 4 07.93 6 00.34 6 02.07 6
2. Quantity to use
TV 19.44 3 20.13 3 22.21 3 19.18 4
Radio 09.34 6 10.24 5 17.64 5 23.09 3
News Papers 12.17 4 16.82 4 29.56 1 15.93 5
Fellow Farmers 54.09 1 53.09 1 24.29 2 27.71 1
Input suppliers 45.56 2 51.18 2 21.86 4 24.69 2
Research Institutes 11.67 5 06.60 6 00.69 6 02.49 6
3. Type of
Pesticides
TV 23.23 3 23.47 24.89 2 16.29 5
Radio 10.14 6 12.67 24.39 3 19.41 4
News Papers 13.29 4 15.84 29.66 1 28.73 2
Fellow Farmers 50.96 1 51.09 22.69 4 30.16 1
Input suppliers 42.81 2 55.76 16.60 5 20.93 3
Research Institutes 10.67 5 07.51 01.72 6 00.69 6
4. When to apply
TV 25.88 3 26.78 3 17.96 5 16.44 5
Radio 11.59 6 10.40 5 18.49 4 22.56 2
News Papers 12.49 4 15.28 4 22.13 2 20.93 3
Fellow Farmers 53.49 1 59.82 1 19.29 3 22.98 1
Input suppliers 28.02 2 29.20 2 28.26 1 20.13 4
Research Institutes 11.89 5 06.49 6 01.80 6 02.22 6
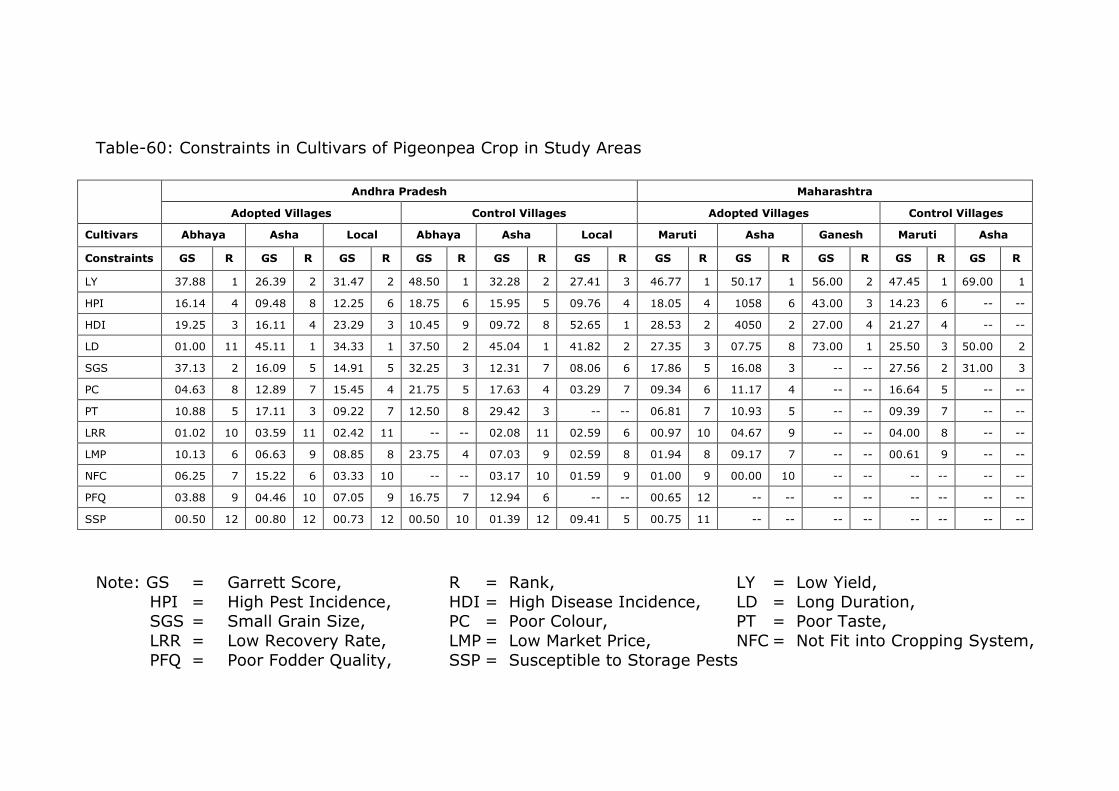
Table-60: Constraints in Cultivars of Pigeonpea Crop in Study Areas
Andhra Pradesh Maharashtra
Adopted Villages Control Villages Adopted Villages Control Villages
Cultivars Abhaya Asha Local Abhaya Asha Local Maruti Asha Ganesh Maruti Asha
Constraints GS R GS R GS R GS R GS R GS R GS R GS R GS R GS R GS R
LY 37.88 1 26.39 2 31.47 2 48.50 1 32.28 2 27.41 3 46.77 1 50.17 1 56.00 2 47.45 1 69.00 1
HPI 16.14 4 09.48 8 12.25 6 18.75 6 15.95 5 09.76 4 18.05 4 1058 6 43.00 3 14.23 6 -- --
HDI 19.25 3 16.11 4 23.29 3 10.45 9 09.72 8 52.65 1 28.53 2 4050 2 27.00 4 21.27 4 -- --
LD 01.00 11 45.11 1 34.33 1 37.50 2 45.04 1 41.82 2 27.35 3 07.75 8 73.00 1 25.50 3 50.00 2
SGS 37.13 2 16.09 5 14.91 5 32.25 3 12.31 7 08.06 6 17.86 5 16.08 3 -- -- 27.56 2 31.00 3
PC 04.63 8 12.89 7 15.45 4 21.75 5 17.63 4 03.29 7 09.34 6 11.17 4 -- -- 16.64 5 -- --
PT 10.88 5 17.11 3 09.22 7 12.50 8 29.42 3 -- -- 06.81 7 10.93 5 -- -- 09.39 7 -- --
LRR 01.02 10 03.59 11 02.42 11 -- -- 02.08 11 02.59 6 00.97 10 04.67 9 -- -- 04.00 8 -- --
LMP 10.13 6 06.63 9 08.85 8 23.75 4 07.03 9 02.59 8 01.94 8 09.17 7 -- -- 00.61 9 -- --
NFC 06.25 7 15.22 6 03.33 10 -- -- 03.17 10 01.59 9 01.00 9 00.00 10 -- -- -- -- -- --
PFQ 03.88 9 04.46 10 07.05 9 16.75 7 12.94 6 -- -- 00.65 12 -- -- -- -- -- -- -- --
SSP 00.50 12 00.80 12 00.73 12 00.50 10 01.39 12 09.41 5 00.75 11 -- -- -- -- -- -- -- --
Note: GS = Garrett Score, R = Rank, LY = Low Yield,
HPI = High Pest Incidence, HDI = High Disease Incidence, LD = Long Duration, SGS = Small Grain Size, PC = Poor Colour, PT = Poor Taste,
LRR = Low Recovery Rate, LMP = Low Market Price, NFC = Not Fit into Cropping System,
PFQ = Poor Fodder Quality, SSP = Susceptible to Storage Pests
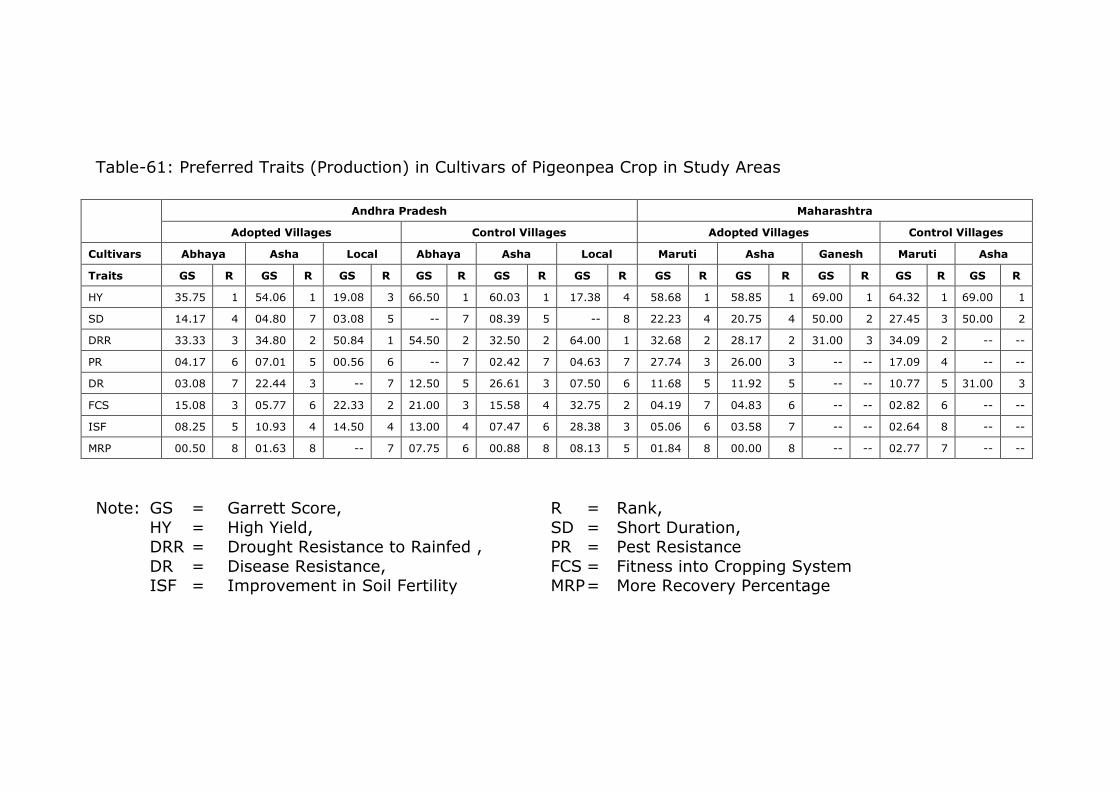
Table-61: Preferred Traits (Production) in Cultivars of Pigeonpea Crop in Study Areas
Andhra Pradesh Maharashtra
Adopted Villages Control Villages Adopted Villages Control Villages
Cultivars Abhaya Asha Local Abhaya Asha Local Maruti Asha Ganesh Maruti Asha
Traits GS R GS R GS R GS R GS R GS R GS R GS R GS R GS R GS R
HY 35.75 1 54.06 1 19.08 3 66.50 1 60.03 1 17.38 4 58.68 1 58.85 1 69.00 1 64.32 1 69.00 1
SD 14.17 4 04.80 7 03.08 5 -- 7 08.39 5 -- 8 22.23 4 20.75 4 50.00 2 27.45 3 50.00 2
DRR 33.33 3 34.80 2 50.84 1 54.50 2 32.50 2 64.00 1 32.68 2 28.17 2 31.00 3 34.09 2 -- --
PR 04.17 6 07.01 5 00.56 6 -- 7 02.42 7 04.63 7 27.74 3 26.00 3 -- -- 17.09 4 -- --
DR 03.08 7 22.44 3 -- 7 12.50 5 26.61 3 07.50 6 11.68 5 11.92 5 -- -- 10.77 5 31.00 3
FCS 15.08 3 05.77 6 22.33 2 21.00 3 15.58 4 32.75 2 04.19 7 04.83 6 -- -- 02.82 6 -- --
ISF 08.25 5 10.93 4 14.50 4 13.00 4 07.47 6 28.38 3 05.06 6 03.58 7 -- -- 02.64 8 -- --
MRP 00.50 8 01.63 8 -- 7 07.75 6 00.88 8 08.13 5 01.84 8 00.00 8 -- -- 02.77 7 -- --
Note: GS = Garrett Score, R = Rank,
HY = High Yield, SD = Short Duration, DRR = Drought Resistance to Rainfed , PR = Pest Resistance
DR = Disease Resistance, FCS = Fitness into Cropping System ISF = Improvement in Soil Fertility MRP = More Recovery Percentage
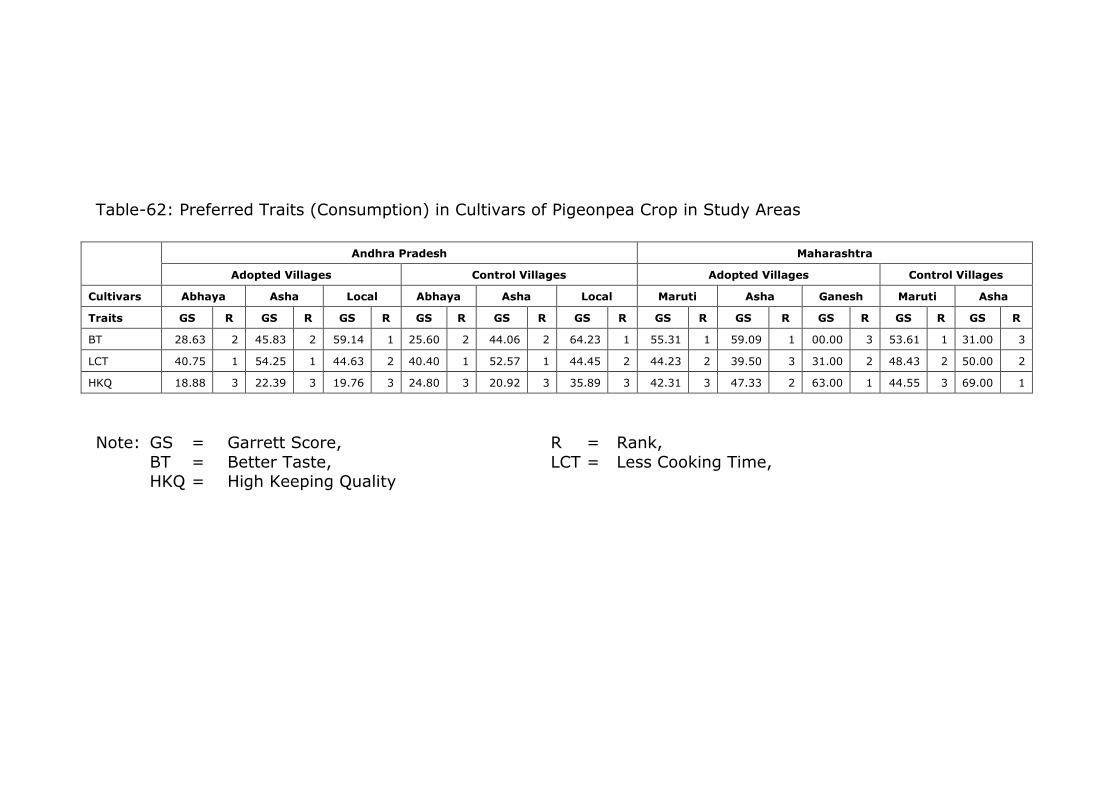
Table-62: Preferred Traits (Consumption) in Cultivars of Pigeonpea Crop in Study Areas
Andhra Pradesh Maharashtra
Adopted Villages Control Villages Adopted Villages Control Villages
Cultivars Abhaya Asha Local Abhaya Asha Local Maruti Asha Ganesh Maruti Asha
Traits GS R GS R GS R GS R GS R GS R GS R GS R GS R GS R GS R
BT 28.63 2 45.83 2 59.14 1 25.60 2 44.06 2 64.23 1 55.31 1 59.09 1 00.00 3 53.61 1 31.00 3
LCT 40.75 1 54.25 1 44.63 2 40.40 1 52.57 1 44.45 2 44.23 2 39.50 3 31.00 2 48.43 2 50.00 2
HKQ 18.88 3 22.39 3 19.76 3 24.80 3 20.92 3 35.89 3 42.31 3 47.33 2 63.00 1 44.55 3 69.00 1
Note: GS = Garrett Score, R = Rank,
BT = Better Taste, LCT = Less Cooking Time, HKQ = High Keeping Quality
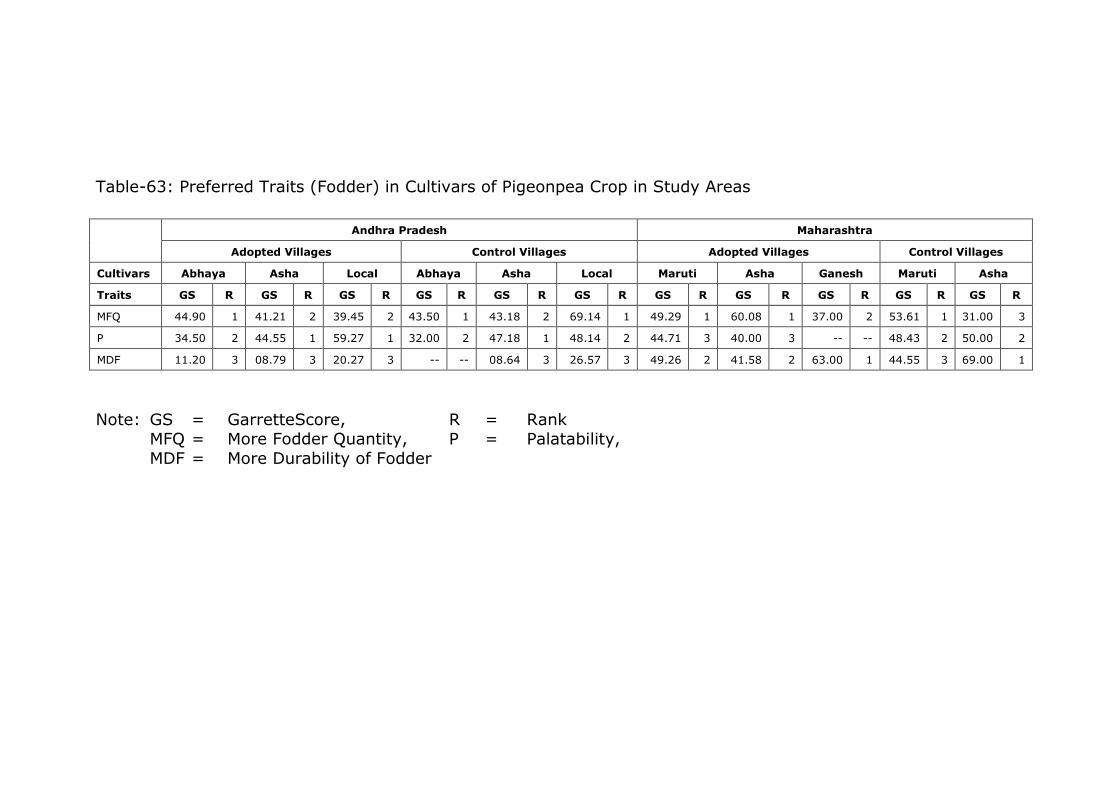
Table-63: Preferred Traits (Fodder) in Cultivars of Pigeonpea Crop in Study Areas
Andhra Pradesh Maharashtra
Adopted Villages Control Villages Adopted Villages Control Villages
Cultivars Abhaya Asha Local Abhaya Asha Local Maruti Asha Ganesh Maruti Asha
Traits GS R GS R GS R GS R GS R GS R GS R GS R GS R GS R GS R
MFQ 44.90 1 41.21 2 39.45 2 43.50 1 43.18 2 69.14 1 49.29 1 60.08 1 37.00 2 53.61 1 31.00 3
P 34.50 2 44.55 1 59.27 1 32.00 2 47.18 1 48.14 2 44.71 3 40.00 3 -- -- 48.43 2 50.00 2
MDF 11.20 3 08.79 3 20.27 3 -- -- 08.64 3 26.57 3 49.26 2 41.58 2 63.00 1 44.55 3 69.00 1
Note: GS = GarretteScore, R = Rank MFQ = More Fodder Quantity, P = Palatability,
MDF = More Durability of Fodder
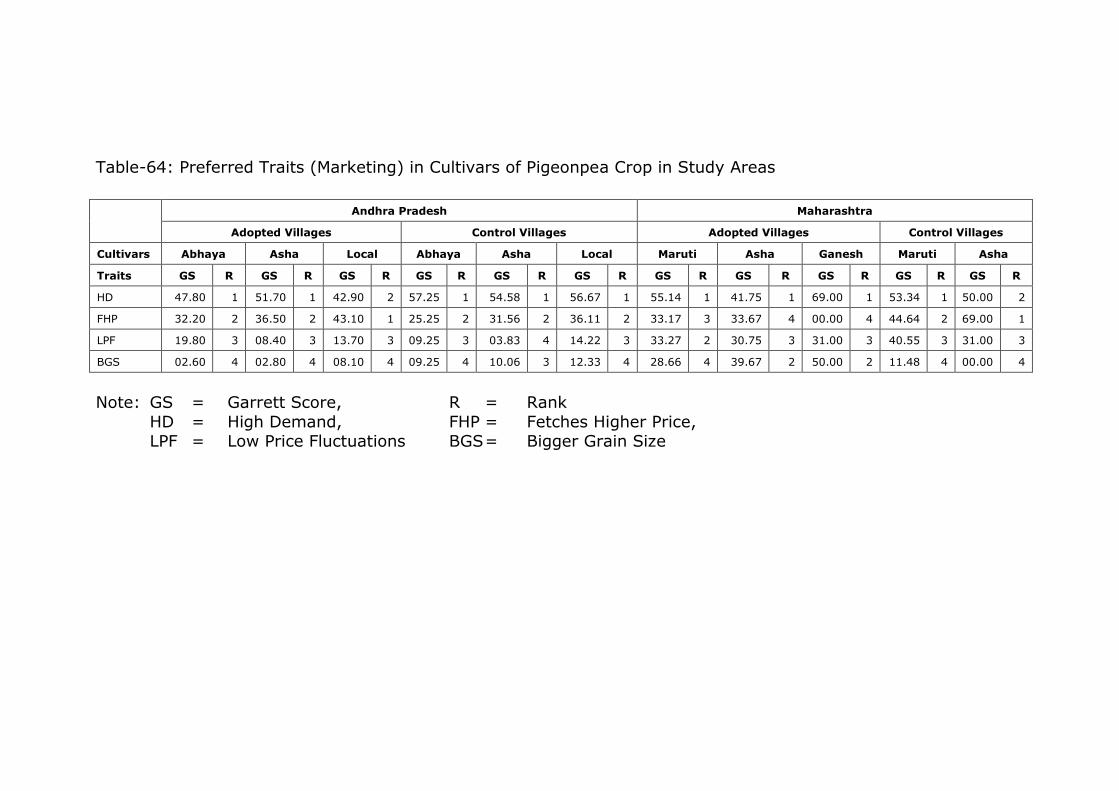
Table-64: Preferred Traits (Marketing) in Cultivars of Pigeonpea Crop in Study Areas
Andhra Pradesh Maharashtra
Adopted Villages Control Villages Adopted Villages Control Villages
Cultivars Abhaya Asha Local Abhaya Asha Local Maruti Asha Ganesh Maruti Asha
Traits GS R GS R GS R GS R GS R GS R GS R GS R GS R GS R GS R
HD 47.80 1 51.70 1 42.90 2 57.25 1 54.58 1 56.67 1 55.14 1 41.75 1 69.00 1 53.34 1 50.00 2
FHP 32.20 2 36.50 2 43.10 1 25.25 2 31.56 2 36.11 2 33.17 3 33.67 4 00.00 4 44.64 2 69.00 1
LPF 19.80 3 08.40 3 13.70 3 09.25 3 03.83 4 14.22 3 33.27 2 30.75 3 31.00 3 40.55 3 31.00 3
BGS 02.60 4 02.80 4 08.10 4 09.25 4 10.06 3 12.33 4 28.66 4 39.67 2 50.00 2 11.48 4 00.00 4
Note: GS = Garrett Score, R = Rank
HD = High Demand, FHP = Fetches Higher Price, LPF = Low Price Fluctuations BGS = Bigger Grain Size
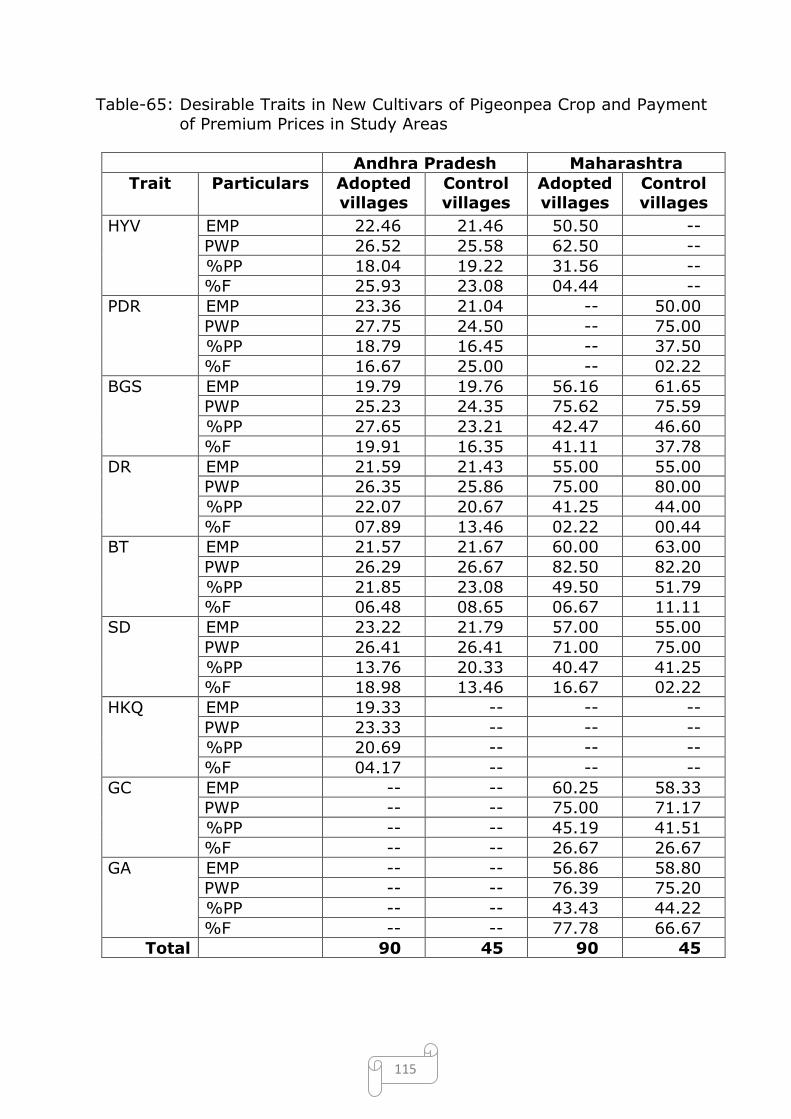
115
Table-65: Desirable Traits in New Cultivars of Pigeonpea Crop and Payment
of Premium Prices in Study Areas
Andhra Pradesh Maharashtra
Trait Particulars Adopted
villages
Control
villages
Adopted
villages
Control
villages
HYV EMP 22.46 21.46 50.50 --
PWP 26.52 25.58 62.50 --
%PP 18.04 19.22 31.56 --
%F 25.93 23.08 04.44 --
PDR EMP 23.36 21.04 -- 50.00
PWP 27.75 24.50 -- 75.00
%PP 18.79 16.45 -- 37.50
%F 16.67 25.00 -- 02.22
BGS EMP 19.79 19.76 56.16 61.65
PWP 25.23 24.35 75.62 75.59
%PP 27.65 23.21 42.47 46.60
%F 19.91 16.35 41.11 37.78
DR EMP 21.59 21.43 55.00 55.00
PWP 26.35 25.86 75.00 80.00
%PP 22.07 20.67 41.25 44.00
%F 07.89 13.46 02.22 00.44
BT EMP 21.57 21.67 60.00 63.00
PWP 26.29 26.67 82.50 82.20
%PP 21.85 23.08 49.50 51.79
%F 06.48 08.65 06.67 11.11
SD EMP 23.22 21.79 57.00 55.00
PWP 26.41 26.41 71.00 75.00
%PP 13.76 20.33 40.47 41.25
%F 18.98 13.46 16.67 02.22
HKQ EMP 19.33 -- -- --
PWP 23.33 -- -- --
%PP 20.69 -- -- --
%F 04.17 -- -- --
GC EMP -- -- 60.25 58.33
PWP -- -- 75.00 71.17
%PP -- -- 45.19 41.51
%F -- -- 26.67 26.67
GA EMP -- -- 56.86 58.80
PWP -- -- 76.39 75.20
%PP -- -- 43.43 44.22
%F -- -- 77.78 66.67
Total 90 45 90 45

116
Table-66: Utilization of Pigeonpea Produce (Kg) in Study Areas
Andhra Pradesh Maharashtra
Variety Particulars Adopted villages
Control villages
Adopted villages
Control villages
Abhaya Grain output 425.56 135.56 -- --
Consumed 11.11 07.78 -- --
Other uses 12.22 13.02 -- --
Marketed 402.23 125.24 -- --
Asha Grain output 2332.67 1821.11 481.25 500.00
Consumed 7378 70.22 42.50 62.50
Other uses 50.77 41.05 -- 2.00
Marketed 2208.12 1709.84 438.75 437.50
Durga Grain output 102.22 53.33 -- --
Consumed 1.11 -- -- --
Other uses 1.11 2.22 -- --
Marketed 100.00 51.11 -- --
Lakshmi Grain output 173.33 191.11 -- --
Consumed 1.89 4.44 -- --
Other uses 5.77 4.23 -- --
Marketed 165.67 182.44 -- --
Local Grain output 392.22 133.33 -- --
Consumed 10.11 6.67 -- --
Other uses 8.78 4.44 -- --
Marketed 373.33 122.22 -- --
Maruti Grain output 265.56 -- 1299.35 1187.62
Consumed 4.00 -- 59.94 49.29
Other uses 4.34 -- 13.58 21.43
Marketed 257.22 -- 1186.33 1116.90
LRG-30&41
Grain output 57.78 -- -- --
Consumed -- -- -- --
Other uses 3.00 -- -- --
Marketed 54.78 -- -- --
Ganesh Grain output -- -- 200.00 700.00
Consumed -- -- 50.00 50.00
Other uses -- -- -- --
Marketed -- -- 150.00 650.00
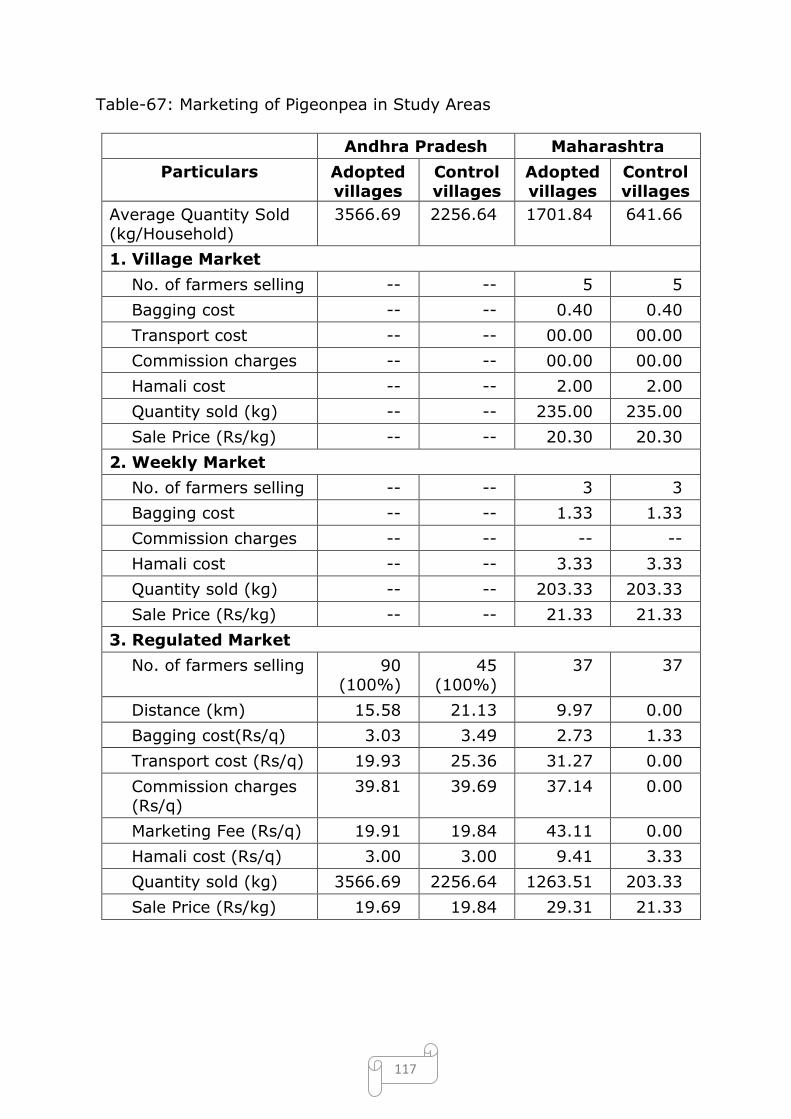
117
Table-67: Marketing of Pigeonpea in Study Areas
Andhra Pradesh Maharashtra
Particulars Adopted villages
Control villages
Adopted villages
Control villages
Average Quantity Sold (kg/Household)
3566.69 2256.64 1701.84 641.66
1. Village Market
No. of farmers selling -- -- 5 5
Bagging cost -- -- 0.40 0.40
Transport cost -- -- 00.00 00.00
Commission charges -- -- 00.00 00.00
Hamali cost -- -- 2.00 2.00
Quantity sold (kg) -- -- 235.00 235.00
Sale Price (Rs/kg) -- -- 20.30 20.30
2. Weekly Market
No. of farmers selling -- -- 3 3
Bagging cost -- -- 1.33 1.33
Commission charges -- -- -- --
Hamali cost -- -- 3.33 3.33
Quantity sold (kg) -- -- 203.33 203.33
Sale Price (Rs/kg) -- -- 21.33 21.33
3. Regulated Market
No. of farmers selling 90 (100%)
45 (100%)
37 37
Distance (km) 15.58 21.13 9.97 0.00
Bagging cost(Rs/q) 3.03 3.49 2.73 1.33
Transport cost (Rs/q) 19.93 25.36 31.27 0.00
Commission charges (Rs/q)
39.81 39.69 37.14 0.00
Marketing Fee (Rs/q) 19.91 19.84 43.11 0.00
Hamali cost (Rs/q) 3.00 3.00 9.41 3.33
Quantity sold (kg) 3566.69 2256.64 1263.51 203.33
Sale Price (Rs/kg) 19.69 19.84 29.31 21.33
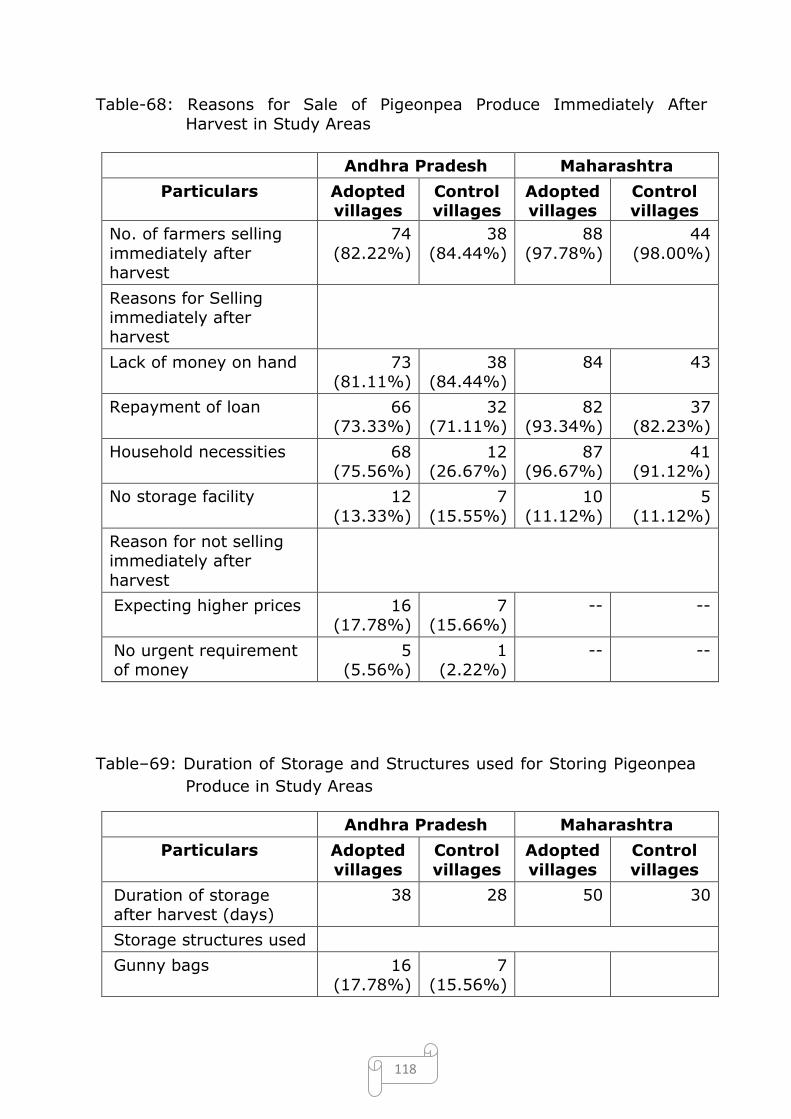
118
Table-68: Reasons for Sale of Pigeonpea Produce Immediately After
Harvest in Study Areas
Andhra Pradesh Maharashtra
Particulars Adopted villages
Control villages
Adopted villages
Control villages
No. of farmers selling
immediately after harvest
74
(82.22%)
38
(84.44%)
88
(97.78%)
44
(98.00%)
Reasons for Selling immediately after harvest
Lack of money on hand 73 (81.11%)
38 (84.44%)
84 43
Repayment of loan 66 (73.33%)
32 (71.11%)
82 (93.34%)
37 (82.23%)
Household necessities 68 (75.56%)
12 (26.67%)
87 (96.67%)
41 (91.12%)
No storage facility 12
(13.33%)
7
(15.55%)
10
(11.12%)
5
(11.12%)
Reason for not selling immediately after
harvest
Expecting higher prices 16 (17.78%)
7 (15.66%)
-- --
No urgent requirement of money
5 (5.56%)
1 (2.22%)
-- --
Table–69: Duration of Storage and Structures used for Storing Pigeonpea
Produce in Study Areas
Andhra Pradesh Maharashtra
Particulars Adopted
villages
Control
villages
Adopted
villages
Control
villages
Duration of storage after harvest (days)
38 28 50 30
Storage structures used
Gunny bags 16 (17.78%)
7 (15.56%)

119
Table-70: Precautions Taken During Storage of Pigeonpea Produce
Against Pests & Diseases Problems in Study Areas
Particulars
Andhra Pradesh Maharashtra
Adopted villages Control villages Adopted villages Control villages
Frequency % of Farmers
Frequency % of Farmers
Frequency % of Farmers
Frequency % of Farmers
Spraying DDT 4 4.44 2 4.44
Spraying Gamaxine
14 15.56 5 11.11
Using Aluminium phosphide capsules
2 2.22 1 2.22
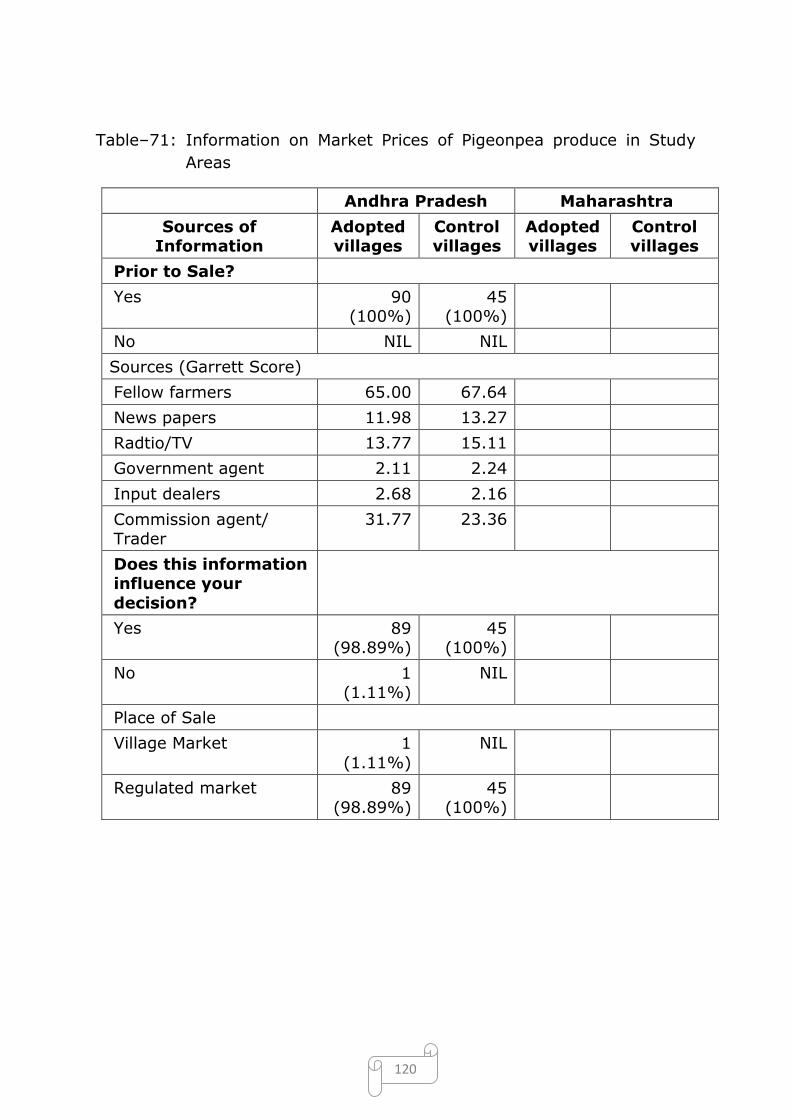
120
Table–71: Information on Market Prices of Pigeonpea produce in Study
Areas
Andhra Pradesh Maharashtra
Sources of Information
Adopted villages
Control villages
Adopted villages
Control villages
Prior to Sale?
Yes 90 (100%)
45 (100%)
No NIL NIL
Sources (Garrett Score)
Fellow farmers 65.00 67.64
News papers 11.98 13.27
Radtio/TV 13.77 15.11
Government agent 2.11 2.24
Input dealers 2.68 2.16
Commission agent/ Trader
31.77 23.36
Does this information influence your
decision?
Yes 89 (98.89%)
45 (100%)
No 1 (1.11%)
NIL
Place of Sale
Village Market 1
(1.11%)
NIL
Regulated market 89 (98.89%)
45 (100%)
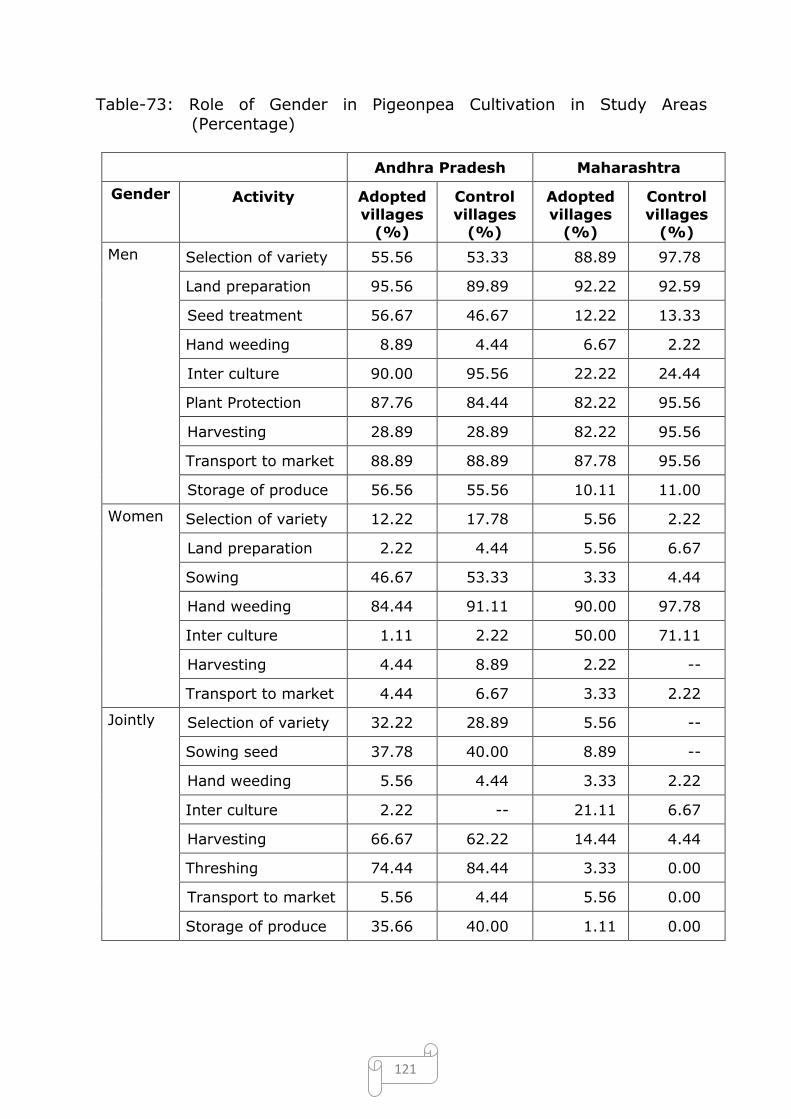
121
Table-73: Role of Gender in Pigeonpea Cultivation in Study Areas
(Percentage)
Andhra Pradesh Maharashtra
Gender Activity Adopted
villages (%)
Control
villages (%)
Adopted
villages (%)
Control
villages (%)
Men Selection of variety 55.56 53.33 88.89 97.78
Land preparation 95.56 89.89 92.22 92.59
Seed treatment 56.67 46.67 12.22 13.33
Hand weeding 8.89 4.44 6.67 2.22
Inter culture 90.00 95.56 22.22 24.44
Plant Protection 87.76 84.44 82.22 95.56
Harvesting 28.89 28.89 82.22 95.56
Transport to market 88.89 88.89 87.78 95.56
Storage of produce 56.56 55.56 10.11 11.00
Women Selection of variety 12.22 17.78 5.56 2.22
Land preparation 2.22 4.44 5.56 6.67
Sowing 46.67 53.33 3.33 4.44
Hand weeding 84.44 91.11 90.00 97.78
Inter culture 1.11 2.22 50.00 71.11
Harvesting 4.44 8.89 2.22 --
Transport to market 4.44 6.67 3.33 2.22
Jointly Selection of variety 32.22 28.89 5.56 --
Sowing seed 37.78 40.00 8.89 --
Hand weeding 5.56 4.44 3.33 2.22
Inter culture 2.22 -- 21.11 6.67
Harvesting 66.67 62.22 14.44 4.44
Threshing 74.44 84.44 3.33 0.00
Transport to market 5.56 4.44 5.56 0.00
Storage of produce 35.66 40.00 1.11 0.00
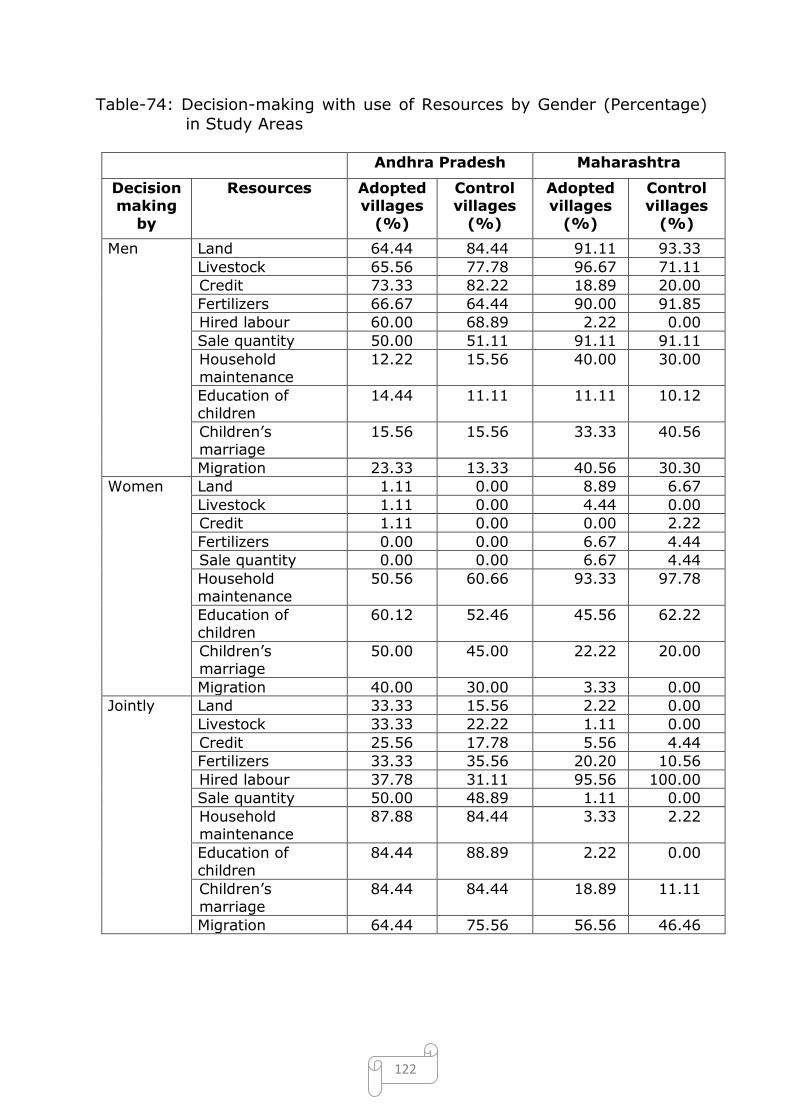
122
Table-74: Decision-making with use of Resources by Gender (Percentage)
in Study Areas
Andhra Pradesh Maharashtra
Decision making
by
Resources Adopted villages
(%)
Control villages
(%)
Adopted villages
(%)
Control villages
(%)
Men Land 64.44 84.44 91.11 93.33
Livestock 65.56 77.78 96.67 71.11
Credit 73.33 82.22 18.89 20.00
Fertilizers 66.67 64.44 90.00 91.85
Hired labour 60.00 68.89 2.22 0.00
Sale quantity 50.00 51.11 91.11 91.11
Household maintenance
12.22 15.56 40.00 30.00
Education of children
14.44 11.11 11.11 10.12
Children’s marriage
15.56 15.56 33.33 40.56
Migration 23.33 13.33 40.56 30.30
Women Land 1.11 0.00 8.89 6.67
Livestock 1.11 0.00 4.44 0.00
Credit 1.11 0.00 0.00 2.22
Fertilizers 0.00 0.00 6.67 4.44
Sale quantity 0.00 0.00 6.67 4.44
Household maintenance
50.56 60.66 93.33 97.78
Education of children
60.12 52.46 45.56 62.22
Children’s marriage
50.00 45.00 22.22 20.00
Migration 40.00 30.00 3.33 0.00
Jointly Land 33.33 15.56 2.22 0.00
Livestock 33.33 22.22 1.11 0.00
Credit 25.56 17.78 5.56 4.44
Fertilizers 33.33 35.56 20.20 10.56
Hired labour 37.78 31.11 95.56 100.00
Sale quantity 50.00 48.89 1.11 0.00
Household maintenance
87.88 84.44 3.33 2.22
Education of children
84.44 88.89 2.22 0.00
Children’s marriage
84.44 84.44 18.89 11.11
Migration 64.44 75.56 56.56 46.46
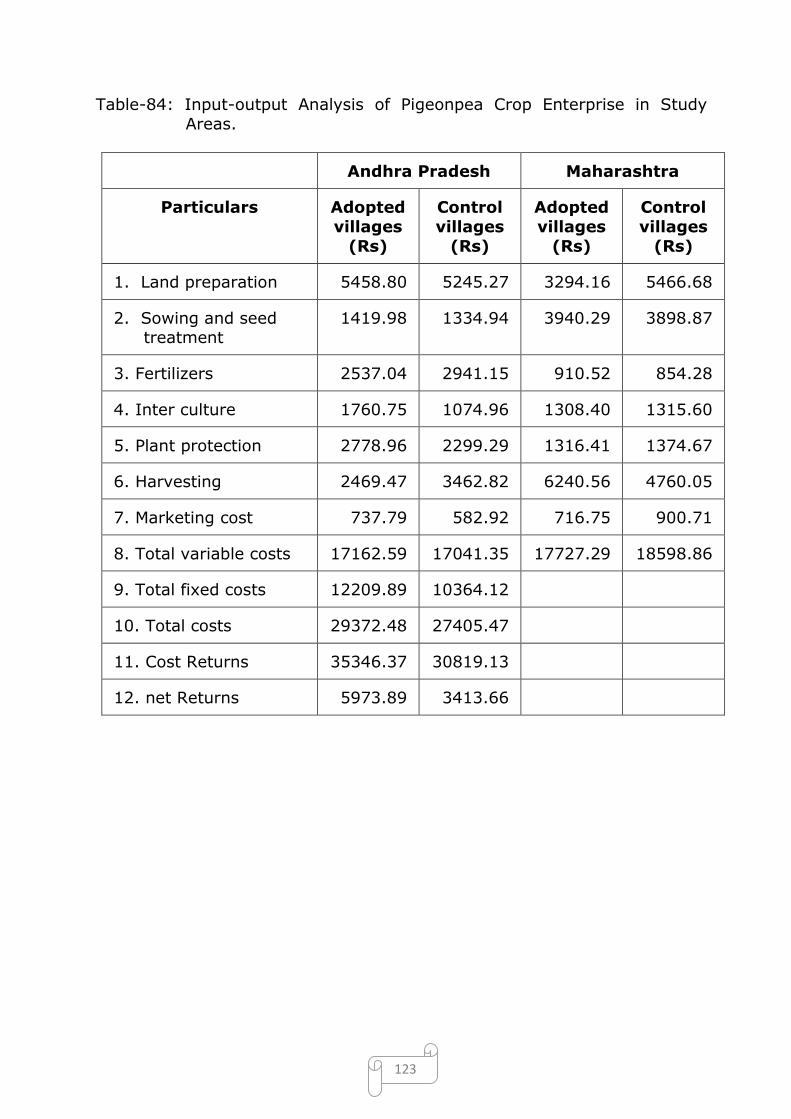
123
Table-84: Input-output Analysis of Pigeonpea Crop Enterprise in Study
Areas.
Andhra Pradesh Maharashtra
Particulars Adopted
villages
(Rs)
Control
villages
(Rs)
Adopted
villages
(Rs)
Control
villages
(Rs)
1. Land preparation 5458.80 5245.27 3294.16 5466.68
2. Sowing and seed treatment
1419.98 1334.94 3940.29 3898.87
3. Fertilizers 2537.04 2941.15 910.52 854.28
4. Inter culture 1760.75 1074.96 1308.40 1315.60
5. Plant protection 2778.96 2299.29 1316.41 1374.67
6. Harvesting 2469.47 3462.82 6240.56 4760.05
7. Marketing cost 737.79 582.92 716.75 900.71
8. Total variable costs 17162.59 17041.35 17727.29 18598.86
9. Total fixed costs 12209.89 10364.12
10. Total costs 29372.48 27405.47
11. Cost Returns 35346.37 30819.13
12. net Returns 5973.89 3413.66
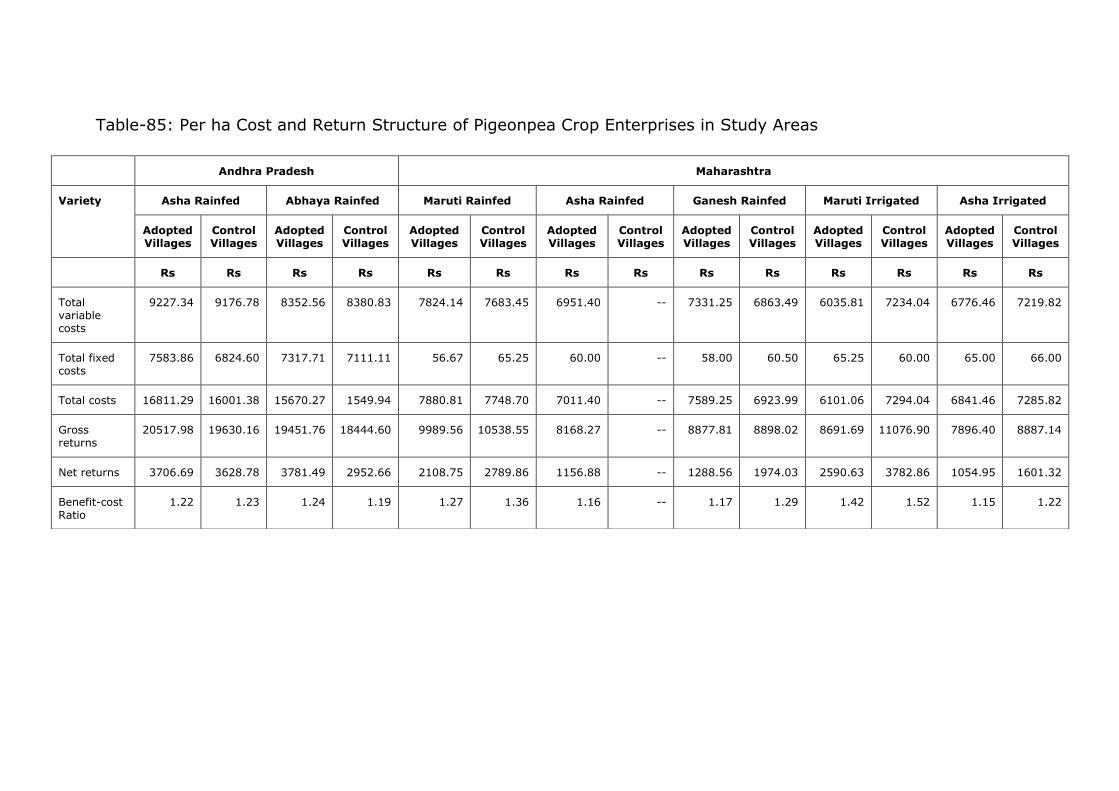
Table-85: Per ha Cost and Return Structure of Pigeonpea Crop Enterprises in Study Areas
Andhra Pradesh Maharashtra
Variety Asha Rainfed Abhaya Rainfed Maruti Rainfed Asha Rainfed Ganesh Rainfed Maruti Irrigated Asha Irrigated
Adopted Villages
Control Villages
Adopted Villages
Control Villages
Adopted Villages
Control Villages
Adopted Villages
Control Villages
Adopted Villages
Control Villages
Adopted Villages
Control Villages
Adopted Villages
Control Villages
Rs Rs Rs Rs Rs Rs Rs Rs Rs Rs Rs Rs Rs Rs
Total variable costs
9227.34 9176.78 8352.56 8380.83 7824.14 7683.45 6951.40 -- 7331.25 6863.49 6035.81 7234.04 6776.46 7219.82
Total fixed costs
7583.86 6824.60 7317.71 7111.11 56.67 65.25 60.00 -- 58.00 60.50 65.25 60.00 65.00 66.00
Total costs 16811.29 16001.38 15670.27 1549.94 7880.81 7748.70 7011.40 -- 7589.25 6923.99 6101.06 7294.04 6841.46 7285.82
Gross returns
20517.98 19630.16 19451.76 18444.60 9989.56 10538.55 8168.27 -- 8877.81 8898.02 8691.69 11076.90 7896.40 8887.14
Net returns 3706.69 3628.78 3781.49 2952.66 2108.75 2789.86 1156.88 -- 1288.56 1974.03 2590.63 3782.86 1054.95 1601.32
Benefit-cost Ratio
1.22 1.23 1.24 1.19 1.27 1.36 1.16 -- 1.17 1.29 1.42 1.52 1.15 1.22

125
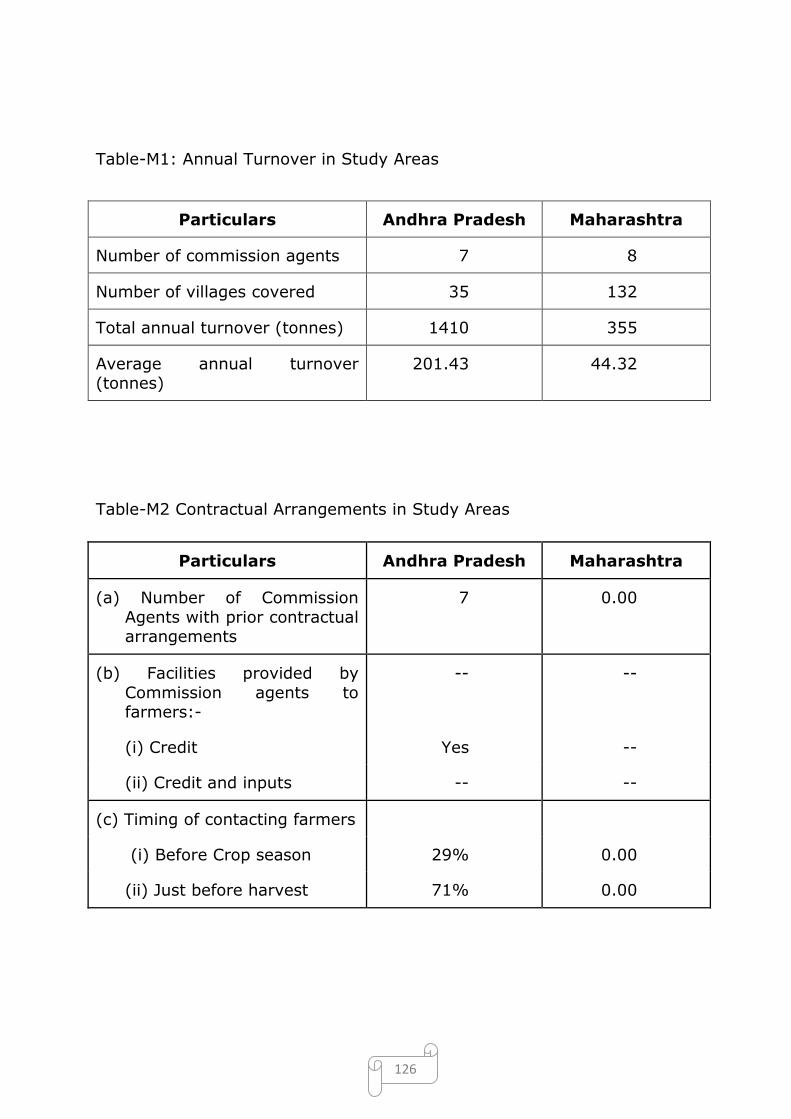
126
Table-M1: Annual Turnover in Study Areas
Particulars Andhra Pradesh Maharashtra
Number of commission agents 7 8
Number of villages covered 35 132
Total annual turnover (tonnes) 1410 355
Average annual turnover (tonnes)
201.43 44.32
Table-M2 Contractual Arrangements in Study Areas
Particulars Andhra Pradesh Maharashtra
(a) Number of Commission
Agents with prior contractual arrangements
7 0.00
(b) Facilities provided by
Commission agents to farmers:-
-- --
(i) Credit Yes --
(ii) Credit and inputs -- --
(c) Timing of contacting farmers
(i) Before Crop season 29% 0.00
(ii) Just before harvest 71% 0.00
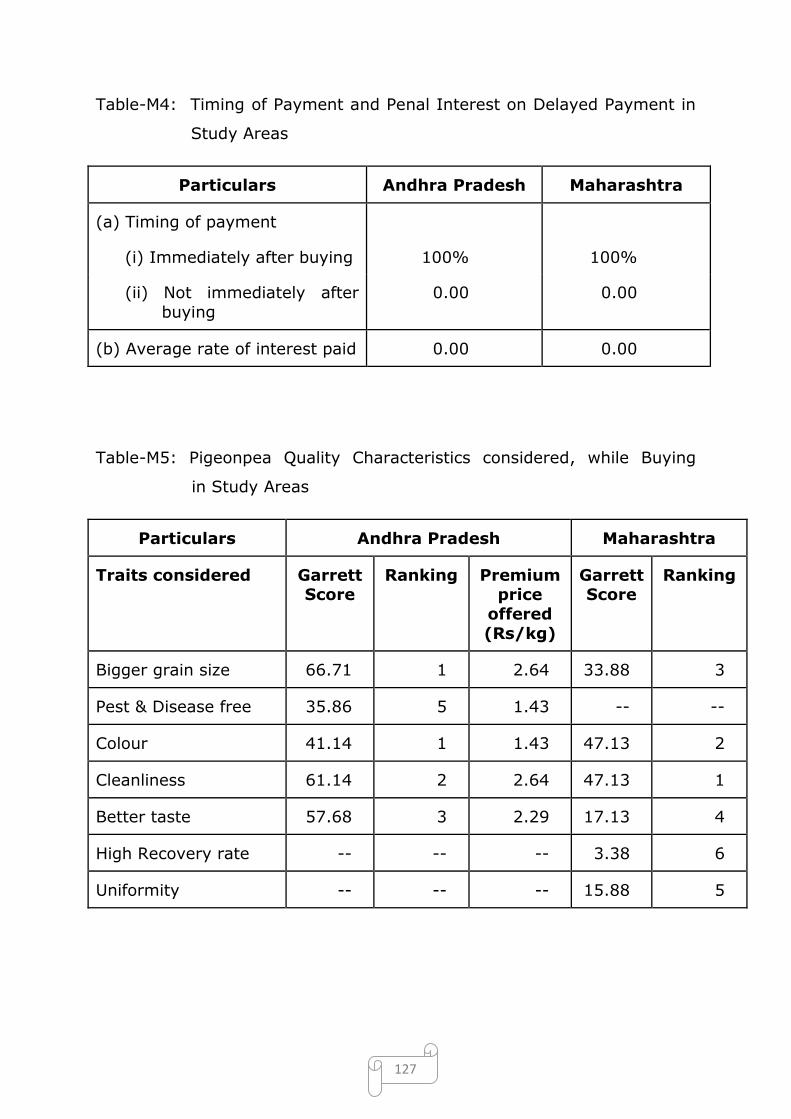
127
Table-M4: Timing of Payment and Penal Interest on Delayed Payment in
Study Areas
Particulars Andhra Pradesh Maharashtra
(a) Timing of payment
(i) Immediately after buying 100% 100%
(ii) Not immediately after
buying
0.00 0.00
(b) Average rate of interest paid 0.00 0.00
Table-M5: Pigeonpea Quality Characteristics considered, while Buying
in Study Areas
Particulars Andhra Pradesh Maharashtra
Traits considered Garrett Score
Ranking Premium price
offered
(Rs/kg)
Garrett Score
Ranking
Bigger grain size 66.71 1 2.64 33.88 3
Pest & Disease free 35.86 5 1.43 -- --
Colour 41.14 1 1.43 47.13 2
Cleanliness 61.14 2 2.64 47.13 1
Better taste 57.68 3 2.29 17.13 4
High Recovery rate -- -- -- 3.38 6
Uniformity -- -- -- 15.88 5

128
Table-M6: Price variation in Pigeonpea in Study Areas
Particulars Andhra Pradesh Maharashtra
Grade Average Price
(Rs/q)
Price (Rs/q)
Min Max Average
Best quality (Grade-A) 2593 2450 2500 2476.11
Medium quality (Grade-B)
2393 2350 2400 2414.44
Poor quality (Grade-C) 2200 2250 2370 2333.00
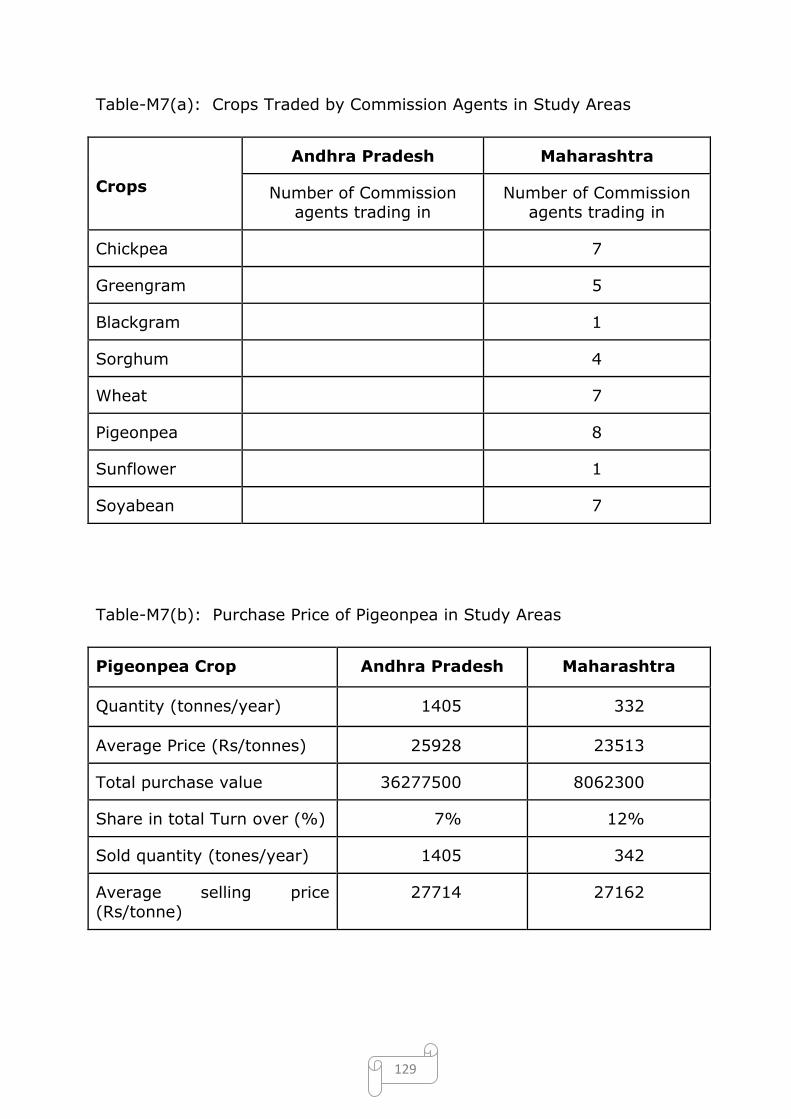
129
Table-M7(a): Crops Traded by Commission Agents in Study Areas
Crops
Andhra Pradesh Maharashtra
Number of Commission agents trading in
Number of Commission agents trading in
Chickpea 7
Greengram 5
Blackgram 1
Sorghum 4
Wheat 7
Pigeonpea 8
Sunflower 1
Soyabean 7
Table-M7(b): Purchase Price of Pigeonpea in Study Areas
Pigeonpea Crop Andhra Pradesh Maharashtra
Quantity (tonnes/year) 1405 332
Average Price (Rs/tonnes) 25928 23513
Total purchase value 36277500 8062300
Share in total Turn over (%) 7% 12%
Sold quantity (tones/year) 1405 342
Average selling price
(Rs/tonne)
27714 27162
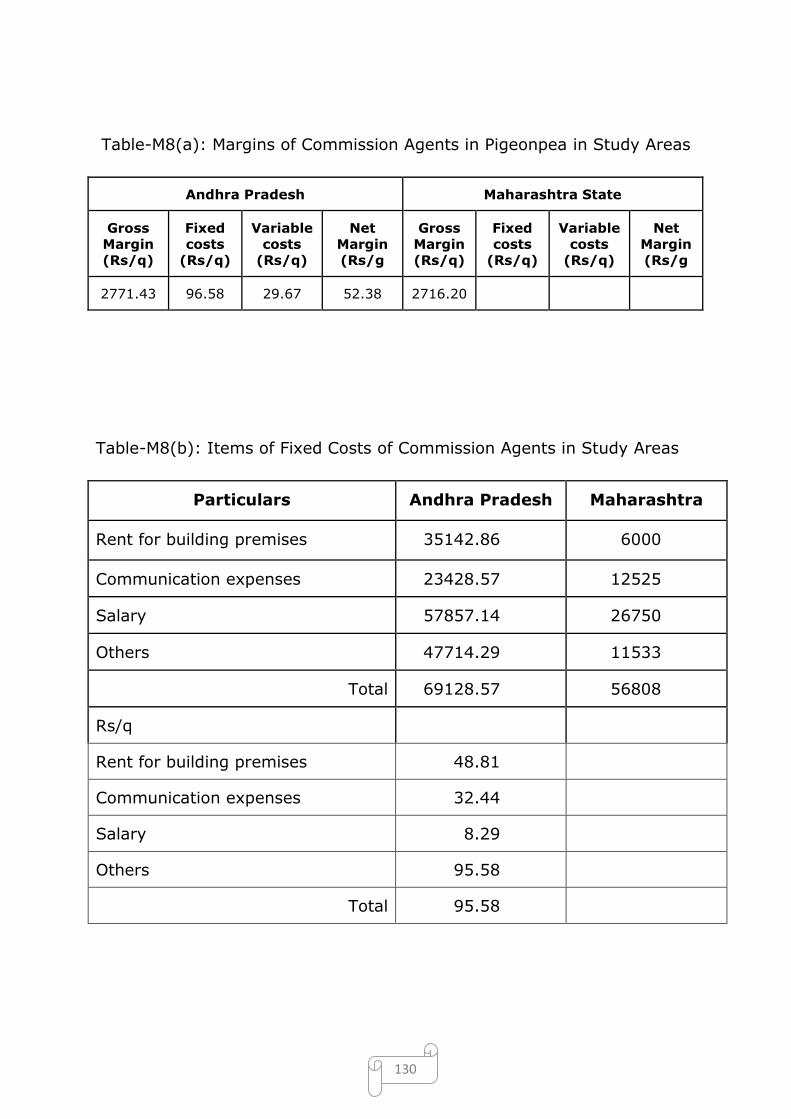
130
Table-M8(a): Margins of Commission Agents in Pigeonpea in Study Areas
Andhra Pradesh Maharashtra State
Gross
Margin
(Rs/q)
Fixed
costs
(Rs/q)
Variable
costs
(Rs/q)
Net
Margin
(Rs/g
Gross
Margin
(Rs/q)
Fixed
costs
(Rs/q)
Variable
costs
(Rs/q)
Net
Margin
(Rs/g
2771.43 96.58 29.67 52.38 2716.20
Table-M8(b): Items of Fixed Costs of Commission Agents in Study Areas
Particulars Andhra Pradesh Maharashtra
Rent for building premises 35142.86 6000
Communication expenses 23428.57 12525
Salary 57857.14 26750
Others 47714.29 11533
Total 69128.57 56808
Rs/q
Rent for building premises 48.81
Communication expenses 32.44
Salary 8.29
Others 95.58
Total 95.58
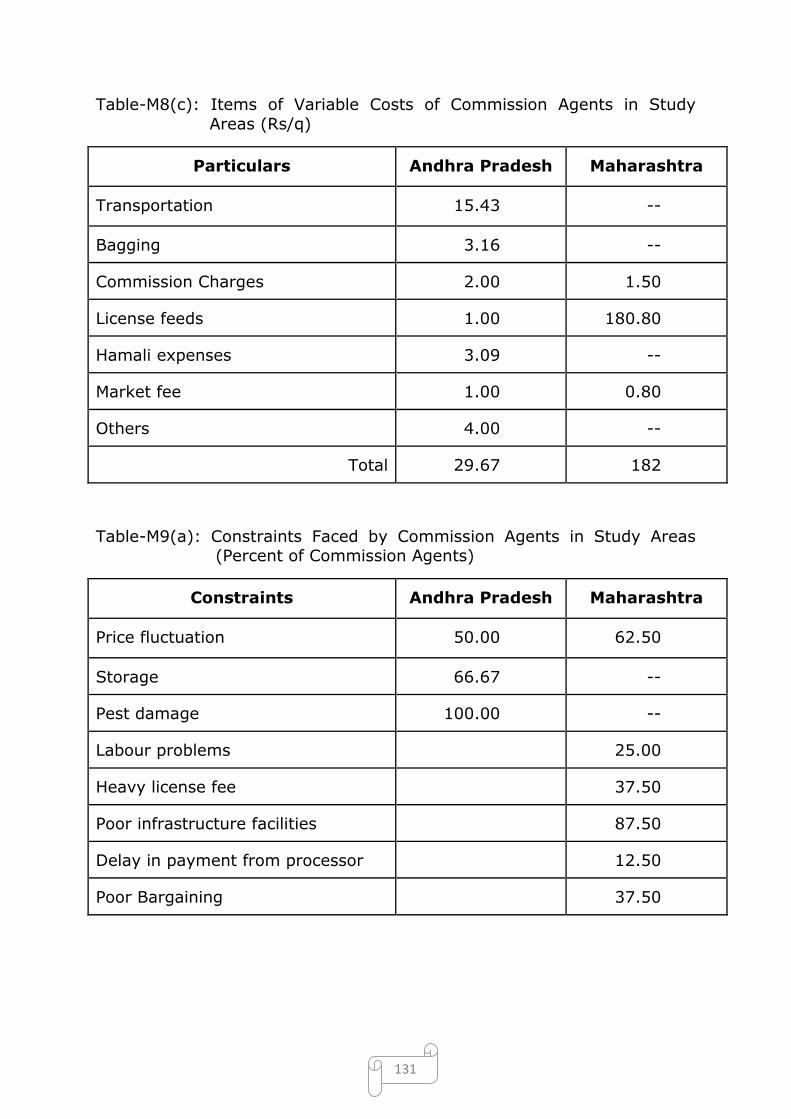
131
Table-M8(c): Items of Variable Costs of Commission Agents in Study
Areas (Rs/q)
Particulars Andhra Pradesh Maharashtra
Transportation 15.43 --
Bagging 3.16 --
Commission Charges 2.00 1.50
License feeds 1.00 180.80
Hamali expenses 3.09 --
Market fee 1.00 0.80
Others 4.00 --
Total 29.67 182
Table-M9(a): Constraints Faced by Commission Agents in Study Areas (Percent of Commission Agents)
Constraints Andhra Pradesh Maharashtra
Price fluctuation 50.00 62.50
Storage 66.67 --
Pest damage 100.00 --
Labour problems 25.00
Heavy license fee 37.50
Poor infrastructure facilities 87.50
Delay in payment from processor 12.50
Poor Bargaining 37.50
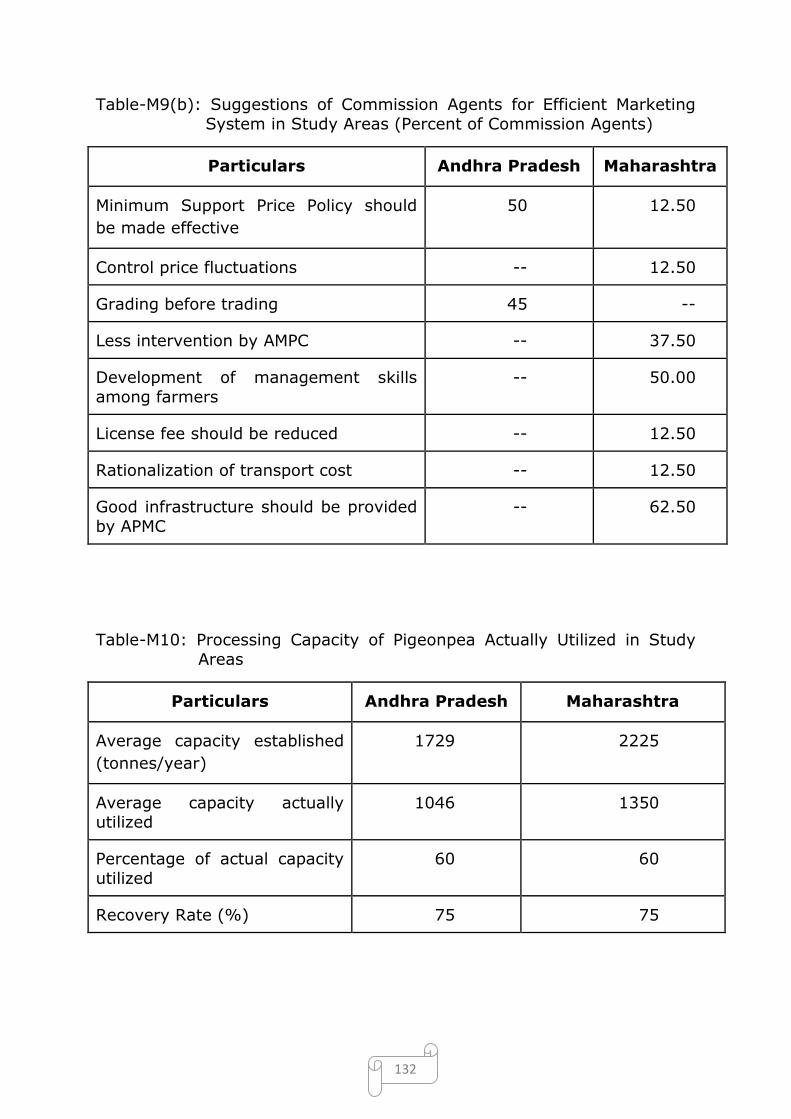
132
Table-M9(b): Suggestions of Commission Agents for Efficient Marketing
System in Study Areas (Percent of Commission Agents)
Particulars Andhra Pradesh Maharashtra
Minimum Support Price Policy should
be made effective
50 12.50
Control price fluctuations -- 12.50
Grading before trading 45 --
Less intervention by AMPC -- 37.50
Development of management skills
among farmers
-- 50.00
License fee should be reduced -- 12.50
Rationalization of transport cost -- 12.50
Good infrastructure should be provided
by APMC
-- 62.50
Table-M10: Processing Capacity of Pigeonpea Actually Utilized in Study
Areas
Particulars Andhra Pradesh Maharashtra
Average capacity established
(tonnes/year)
1729 2225
Average capacity actually utilized
1046 1350
Percentage of actual capacity
utilized
60 60
Recovery Rate (%) 75 75
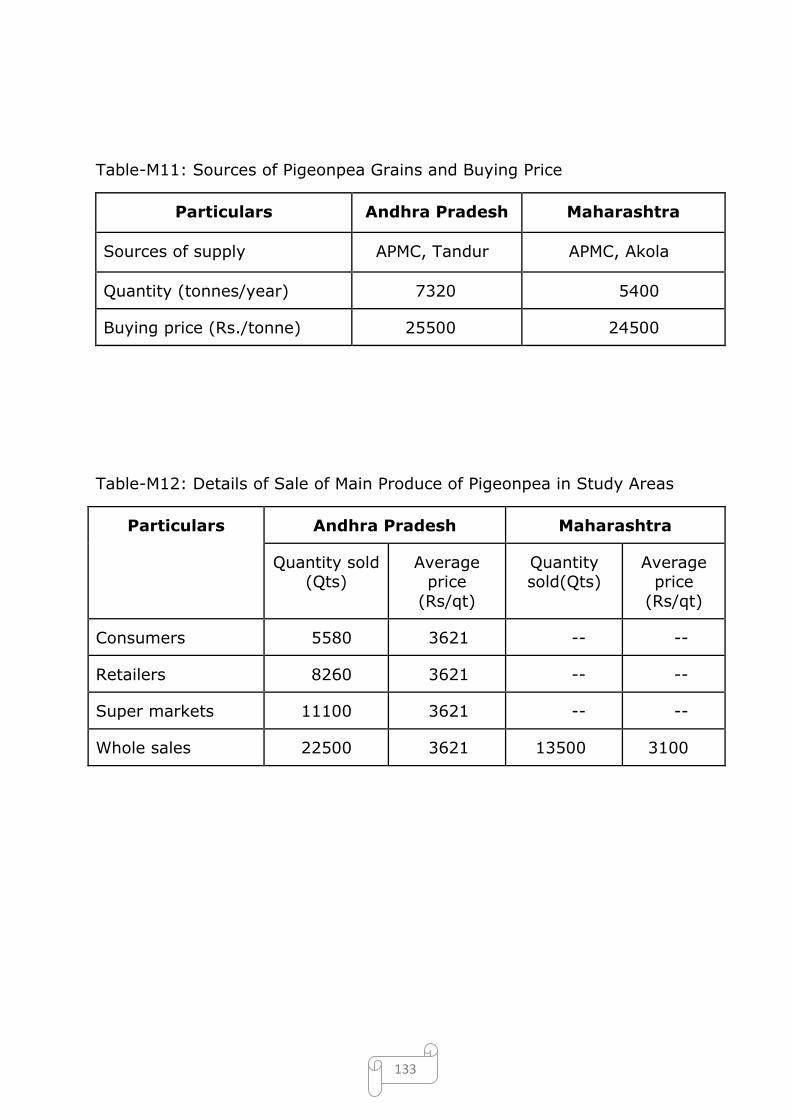
133
Table-M11: Sources of Pigeonpea Grains and Buying Price
Particulars Andhra Pradesh Maharashtra
Sources of supply APMC, Tandur APMC, Akola
Quantity (tonnes/year) 7320 5400
Buying price (Rs./tonne) 25500 24500
Table-M12: Details of Sale of Main Produce of Pigeonpea in Study Areas
Particulars Andhra Pradesh Maharashtra
Quantity sold (Qts)
Average price
(Rs/qt)
Quantity sold(Qts)
Average price
(Rs/qt)
Consumers 5580 3621 -- --
Retailers 8260 3621 -- --
Super markets 11100 3621 -- --
Whole sales 22500 3621 13500 3100
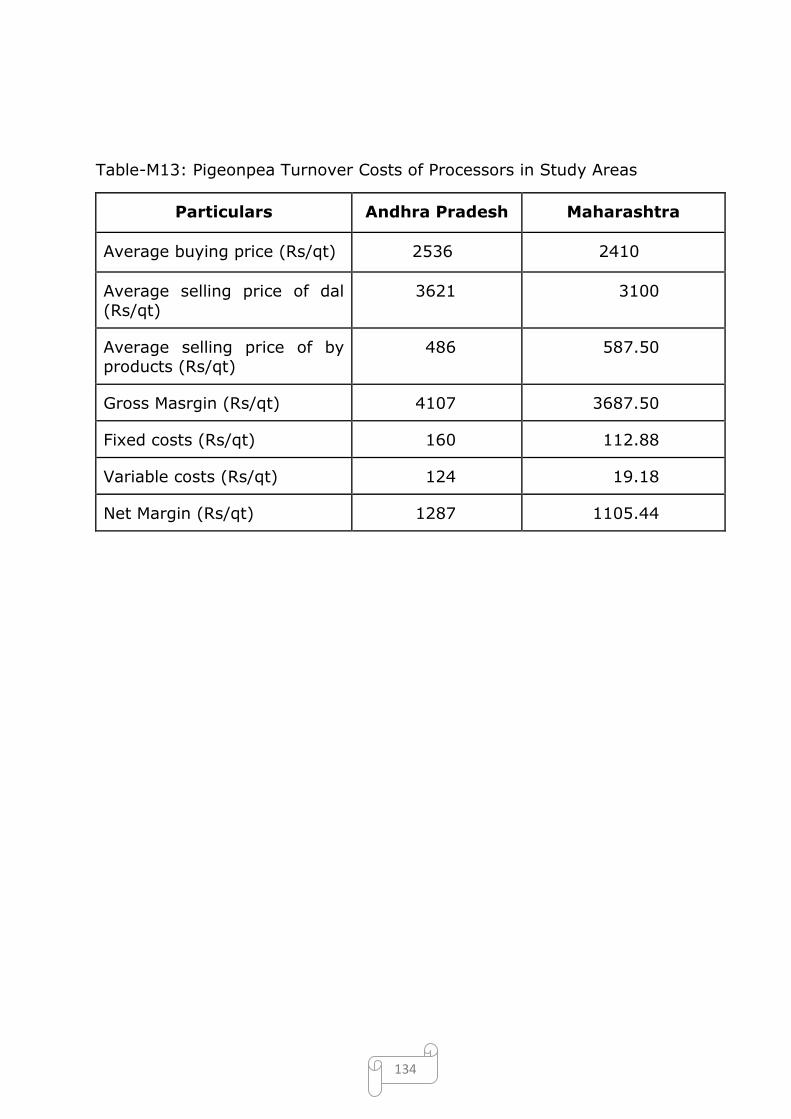
134
Table-M13: Pigeonpea Turnover Costs of Processors in Study Areas
Particulars Andhra Pradesh Maharashtra
Average buying price (Rs/qt) 2536 2410
Average selling price of dal
(Rs/qt)
3621 3100
Average selling price of by products (Rs/qt)
486 587.50
Gross Masrgin (Rs/qt) 4107 3687.50
Fixed costs (Rs/qt) 160 112.88
Variable costs (Rs/qt) 124 19.18
Net Margin (Rs/qt) 1287 1105.44
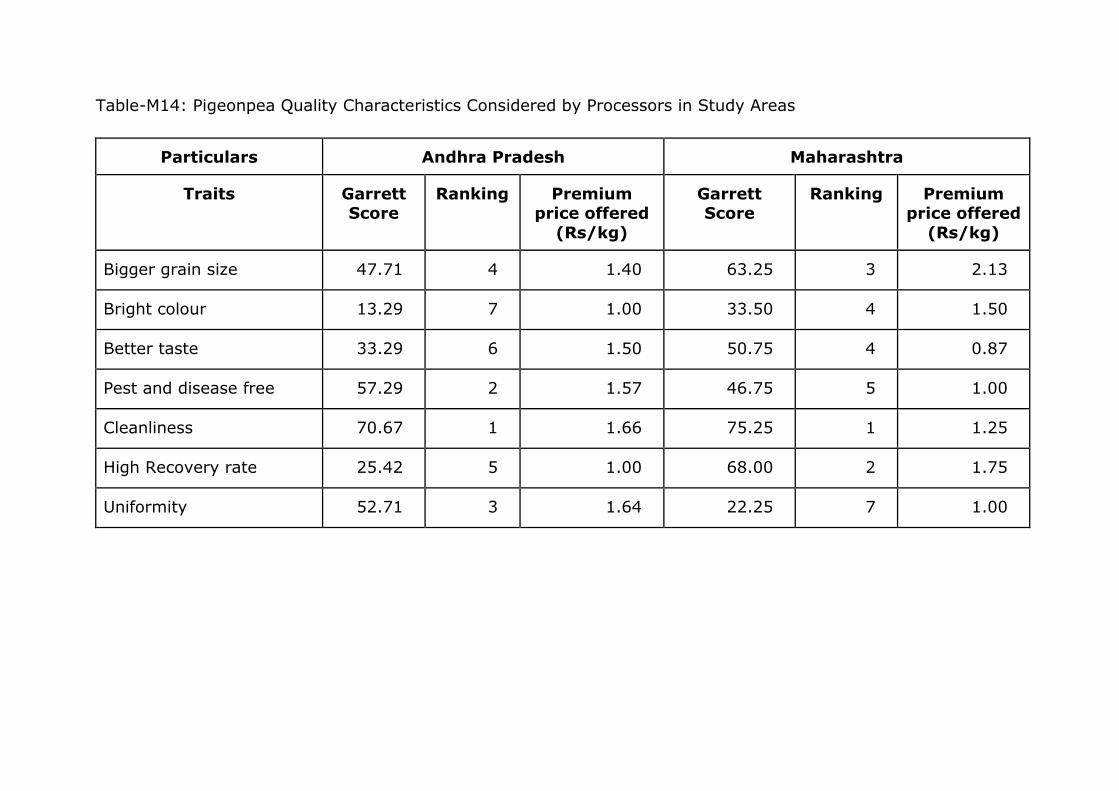
Table-M14: Pigeonpea Quality Characteristics Considered by Processors in Study Areas
Particulars Andhra Pradesh Maharashtra
Traits Garrett Score
Ranking Premium price offered
(Rs/kg)
Garrett Score
Ranking Premium price offered
(Rs/kg)
Bigger grain size 47.71 4 1.40 63.25 3 2.13
Bright colour 13.29 7 1.00 33.50 4 1.50
Better taste 33.29 6 1.50 50.75 4 0.87
Pest and disease free 57.29 2 1.57 46.75 5 1.00
Cleanliness 70.67 1 1.66 75.25 1 1.25
High Recovery rate 25.42 5 1.00 68.00 2 1.75
Uniformity 52.71 3 1.64 22.25 7 1.00
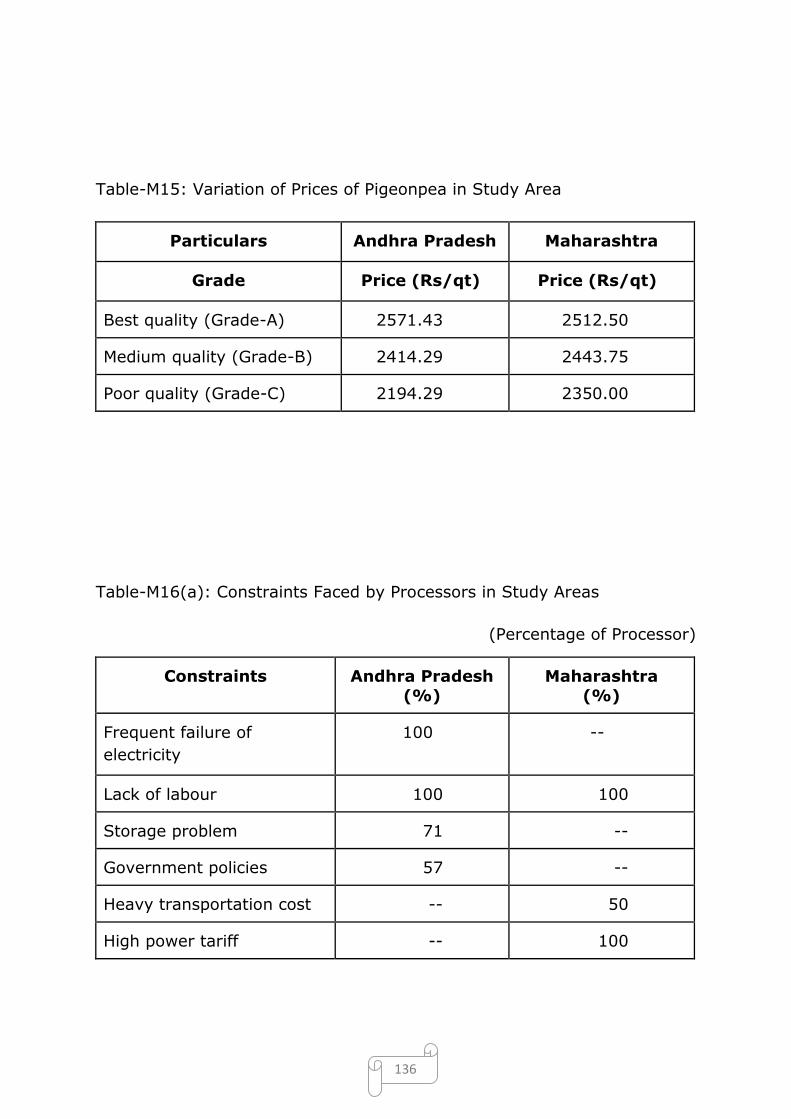
136
Table-M15: Variation of Prices of Pigeonpea in Study Area
Particulars Andhra Pradesh Maharashtra
Grade Price (Rs/qt) Price (Rs/qt)
Best quality (Grade-A) 2571.43 2512.50
Medium quality (Grade-B) 2414.29 2443.75
Poor quality (Grade-C) 2194.29 2350.00
Table-M16(a): Constraints Faced by Processors in Study Areas
(Percentage of Processor)
Constraints Andhra Pradesh
(%)
Maharashtra
(%)
Frequent failure of
electricity
100 --
Lack of labour 100 100
Storage problem 71 --
Government policies 57 --
Heavy transportation cost -- 50
High power tariff -- 100
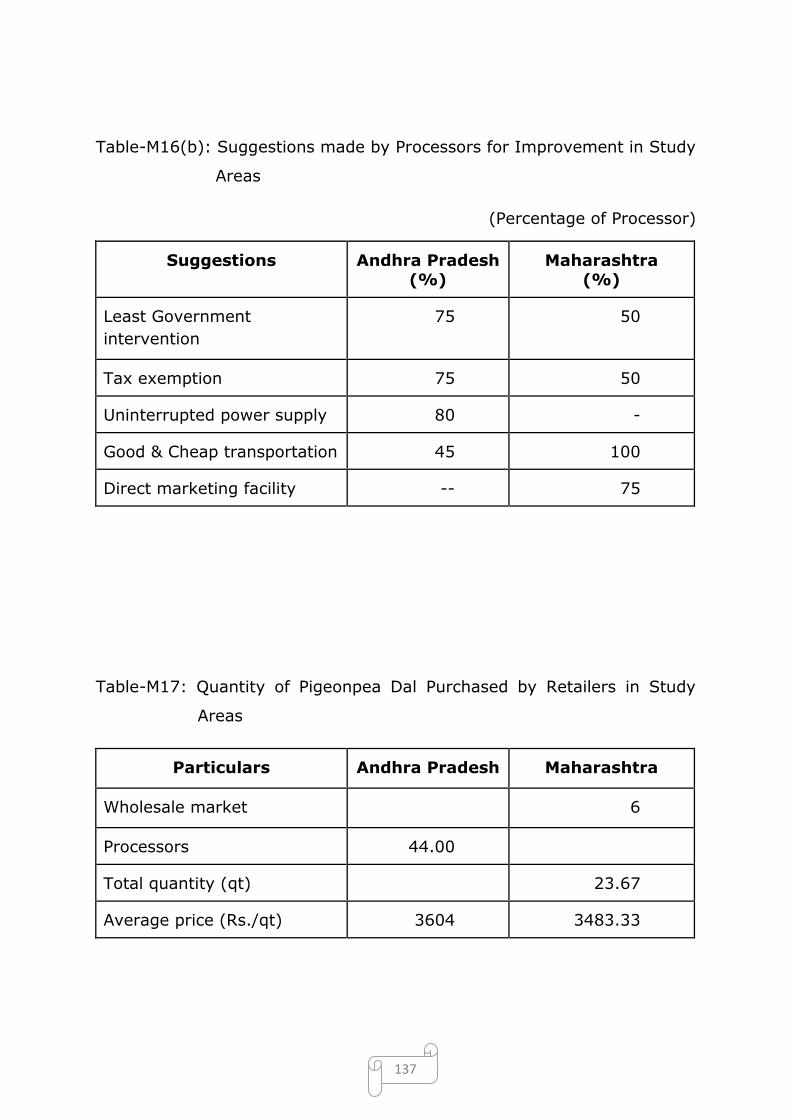
137
Table-M16(b): Suggestions made by Processors for Improvement in Study
Areas
(Percentage of Processor)
Suggestions Andhra Pradesh (%)
Maharashtra (%)
Least Government
intervention
75 50
Tax exemption 75 50
Uninterrupted power supply 80 -
Good & Cheap transportation 45 100
Direct marketing facility -- 75
Table-M17: Quantity of Pigeonpea Dal Purchased by Retailers in Study
Areas
Particulars Andhra Pradesh Maharashtra
Wholesale market 6
Processors 44.00
Total quantity (qt) 23.67
Average price (Rs./qt) 3604 3483.33
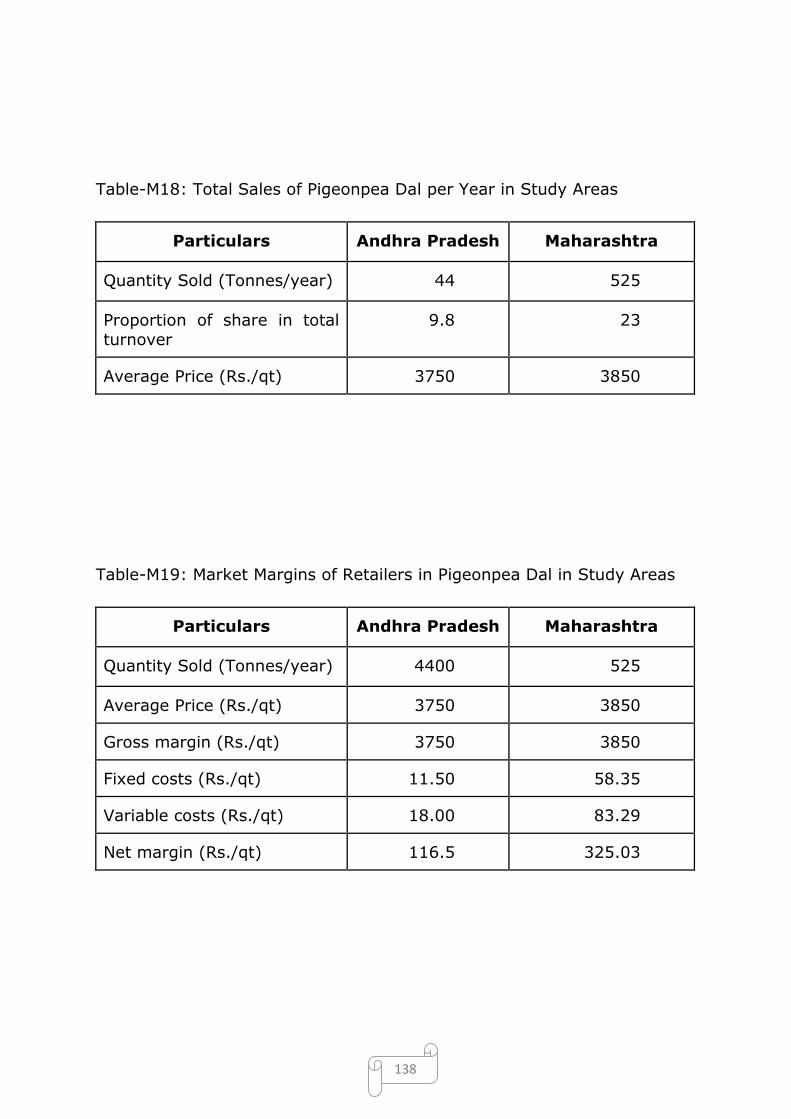
138
Table-M18: Total Sales of Pigeonpea Dal per Year in Study Areas
Particulars Andhra Pradesh Maharashtra
Quantity Sold (Tonnes/year) 44 525
Proportion of share in total
turnover
9.8 23
Average Price (Rs./qt) 3750 3850
Table-M19: Market Margins of Retailers in Pigeonpea Dal in Study Areas
Particulars Andhra Pradesh Maharashtra
Quantity Sold (Tonnes/year) 4400 525
Average Price (Rs./qt) 3750 3850
Gross margin (Rs./qt) 3750 3850
Fixed costs (Rs./qt) 11.50 58.35
Variable costs (Rs./qt) 18.00 83.29
Net margin (Rs./qt) 116.5 325.03
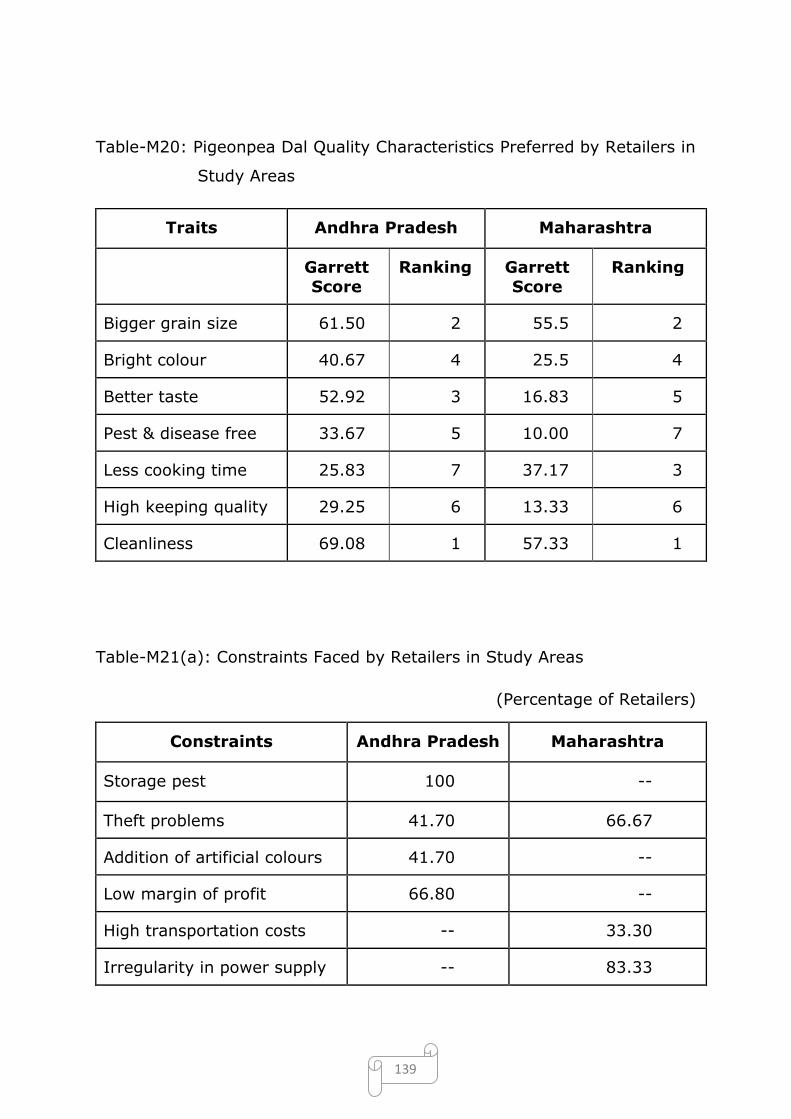
139
Table-M20: Pigeonpea Dal Quality Characteristics Preferred by Retailers in
Study Areas
Traits Andhra Pradesh Maharashtra
Garrett
Score
Ranking Garrett
Score
Ranking
Bigger grain size 61.50 2 55.5 2
Bright colour 40.67 4 25.5 4
Better taste 52.92 3 16.83 5
Pest & disease free 33.67 5 10.00 7
Less cooking time 25.83 7 37.17 3
High keeping quality 29.25 6 13.33 6
Cleanliness 69.08 1 57.33 1
Table-M21(a): Constraints Faced by Retailers in Study Areas
(Percentage of Retailers)
Constraints Andhra Pradesh Maharashtra
Storage pest 100 --
Theft problems 41.70 66.67
Addition of artificial colours 41.70 --
Low margin of profit 66.80 --
High transportation costs -- 33.30
Irregularity in power supply -- 83.33
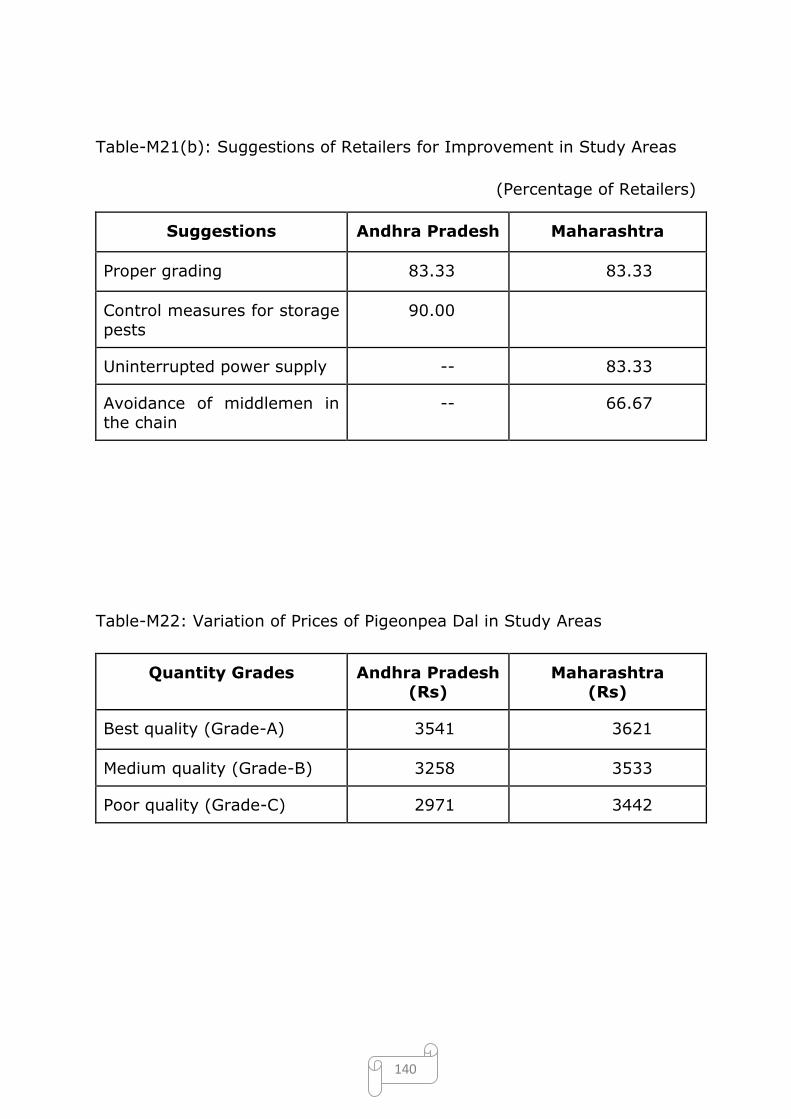
140
Table-M21(b): Suggestions of Retailers for Improvement in Study Areas
(Percentage of Retailers)
Suggestions Andhra Pradesh Maharashtra
Proper grading 83.33 83.33
Control measures for storage pests
90.00
Uninterrupted power supply -- 83.33
Avoidance of middlemen in the chain
-- 66.67
Table-M22: Variation of Prices of Pigeonpea Dal in Study Areas
Quantity Grades Andhra Pradesh (Rs)
Maharashtra (Rs)
Best quality (Grade-A) 3541 3621
Medium quality (Grade-B) 3258 3533
Poor quality (Grade-C) 2971 3442
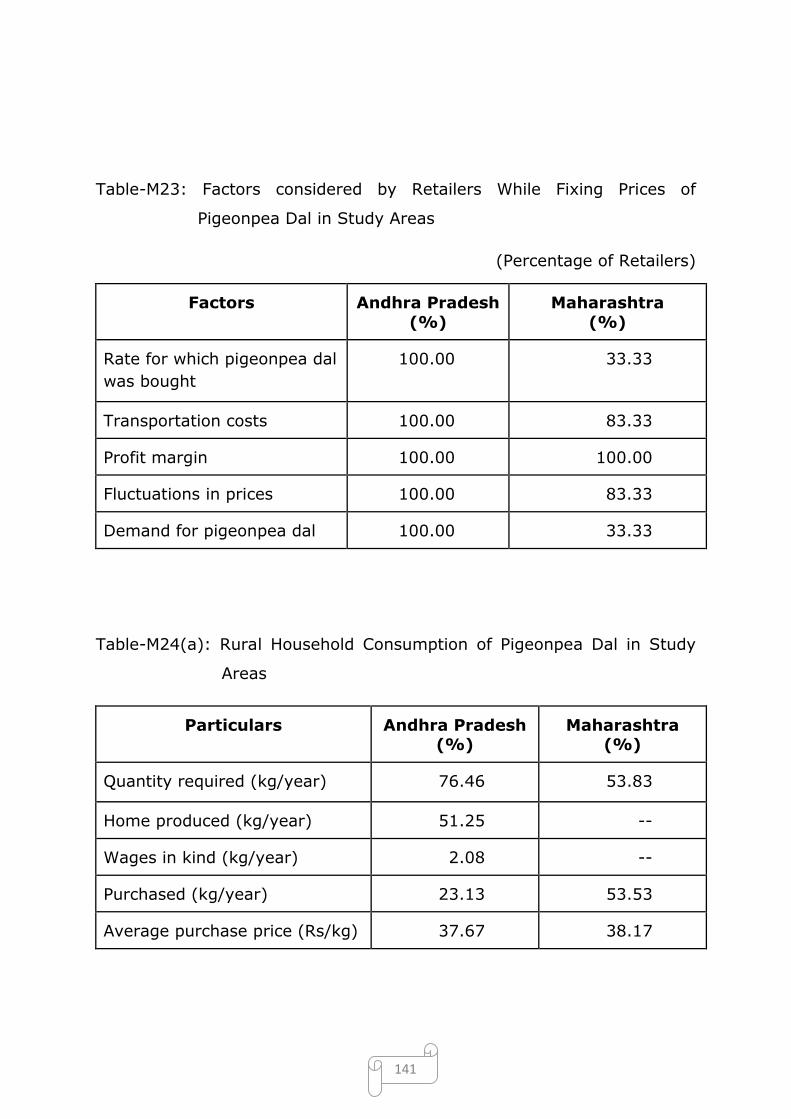
141
Table-M23: Factors considered by Retailers While Fixing Prices of
Pigeonpea Dal in Study Areas
(Percentage of Retailers)
Factors Andhra Pradesh
(%)
Maharashtra
(%)
Rate for which pigeonpea dal
was bought
100.00 33.33
Transportation costs 100.00 83.33
Profit margin 100.00 100.00
Fluctuations in prices 100.00 83.33
Demand for pigeonpea dal 100.00 33.33
Table-M24(a): Rural Household Consumption of Pigeonpea Dal in Study
Areas
Particulars Andhra Pradesh (%)
Maharashtra (%)
Quantity required (kg/year) 76.46 53.83
Home produced (kg/year) 51.25 --
Wages in kind (kg/year) 2.08 --
Purchased (kg/year) 23.13 53.53
Average purchase price (Rs/kg) 37.67 38.17
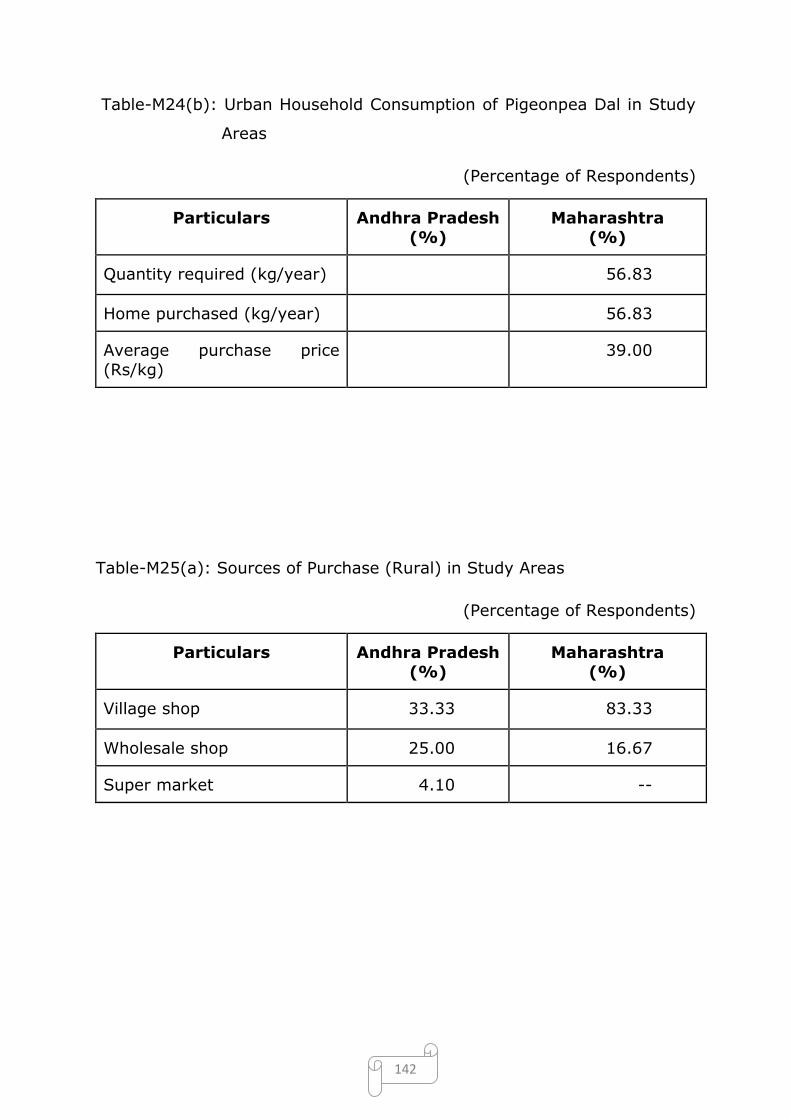
142
Table-M24(b): Urban Household Consumption of Pigeonpea Dal in Study
Areas
(Percentage of Respondents)
Particulars Andhra Pradesh
(%)
Maharashtra
(%)
Quantity required (kg/year) 56.83
Home purchased (kg/year) 56.83
Average purchase price
(Rs/kg)
39.00
Table-M25(a): Sources of Purchase (Rural) in Study Areas
(Percentage of Respondents)
Particulars Andhra Pradesh
(%)
Maharashtra
(%)
Village shop 33.33 83.33
Wholesale shop 25.00 16.67
Super market 4.10 --
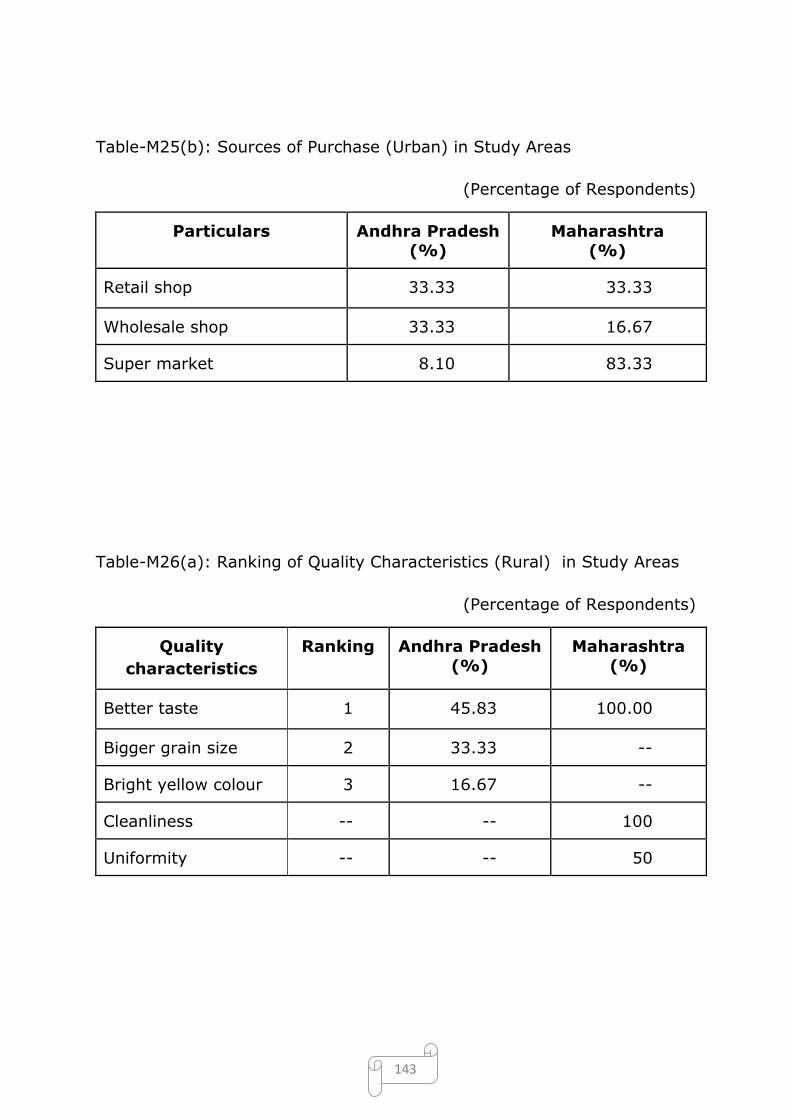
143
Table-M25(b): Sources of Purchase (Urban) in Study Areas
(Percentage of Respondents)
Particulars Andhra Pradesh
(%)
Maharashtra
(%)
Retail shop 33.33 33.33
Wholesale shop 33.33 16.67
Super market 8.10 83.33
Table-M26(a): Ranking of Quality Characteristics (Rural) in Study Areas
(Percentage of Respondents)
Quality
characteristics
Ranking Andhra Pradesh
(%)
Maharashtra
(%)
Better taste 1 45.83 100.00
Bigger grain size 2 33.33 --
Bright yellow colour 3 16.67 --
Cleanliness -- -- 100
Uniformity -- -- 50
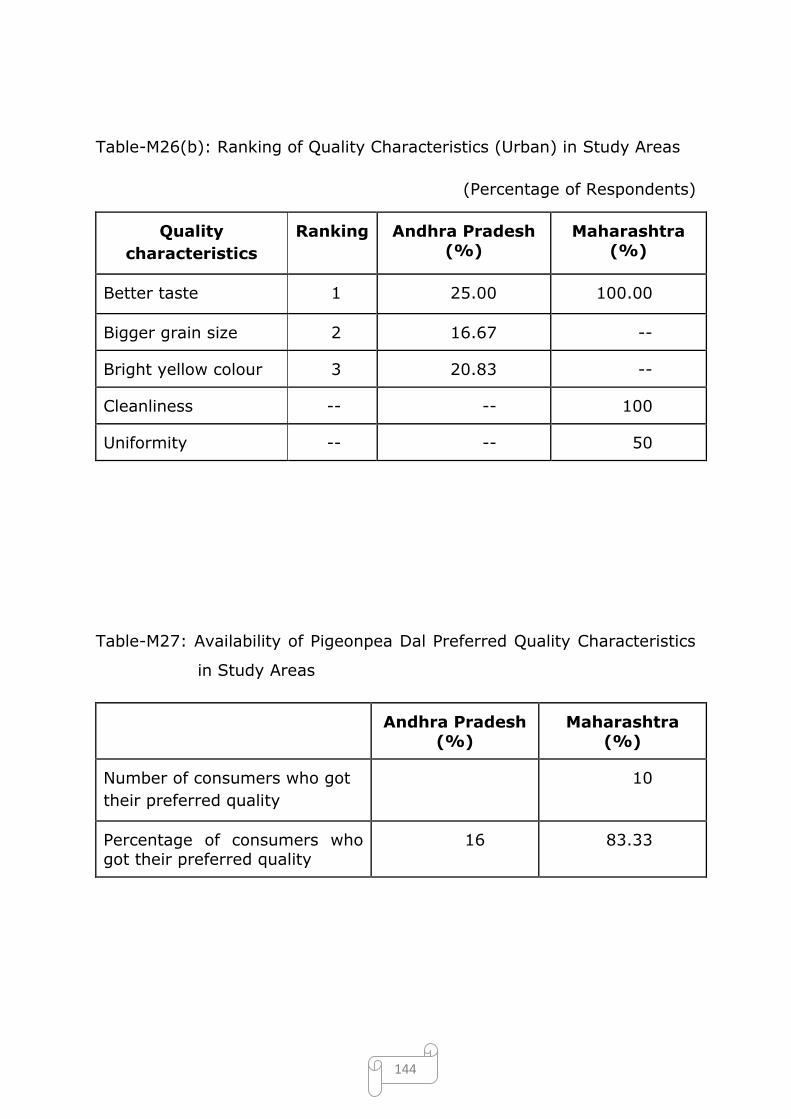
144
Table-M26(b): Ranking of Quality Characteristics (Urban) in Study Areas
(Percentage of Respondents)
Quality
characteristics
Ranking Andhra Pradesh
(%)
Maharashtra
(%)
Better taste 1 25.00 100.00
Bigger grain size 2 16.67 --
Bright yellow colour 3 20.83 --
Cleanliness -- -- 100
Uniformity -- -- 50
Table-M27: Availability of Pigeonpea Dal Preferred Quality Characteristics
in Study Areas
Andhra Pradesh (%)
Maharashtra (%)
Number of consumers who got
their preferred quality
10
Percentage of consumers who got their preferred quality
16 83.33

145
Table-M28(a): Preferred Quality Traits in Pigeonpea Dal (Rural)in Study
Areas
Traits Andhra Pradesh Maharashtra
Garrett
Score
Ranking Garrett
Score
Ranking
Better taste 71.38 1 62.17 1
Cleanliness 51.75 3 49.33 2
Bigger grain size 55.21 2 27.50 4
High keeping quality 35.04 5 -- --
Less cooking time 27.58 6 -- --
Rich protein content 0.92 8 -- --
Bright yellow colour 44.71 4 -- --
Less gravel -- -- 46.83 3
Uniformity -- --
Good round shape 9.29 7 4.67 5
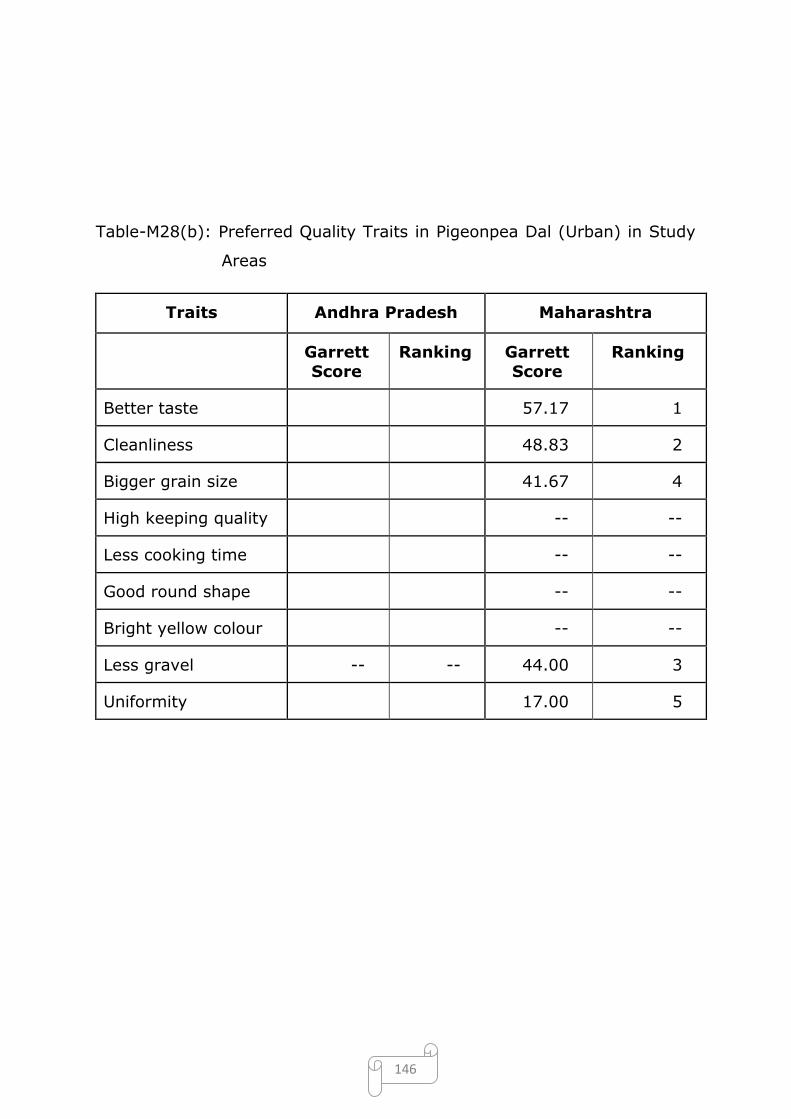
146
Table-M28(b): Preferred Quality Traits in Pigeonpea Dal (Urban) in Study
Areas
Traits Andhra Pradesh Maharashtra
Garrett
Score
Ranking Garrett
Score
Ranking
Better taste 57.17 1
Cleanliness 48.83 2
Bigger grain size 41.67 4
High keeping quality -- --
Less cooking time -- --
Good round shape -- --
Bright yellow colour -- --
Less gravel -- -- 44.00 3
Uniformity 17.00 5
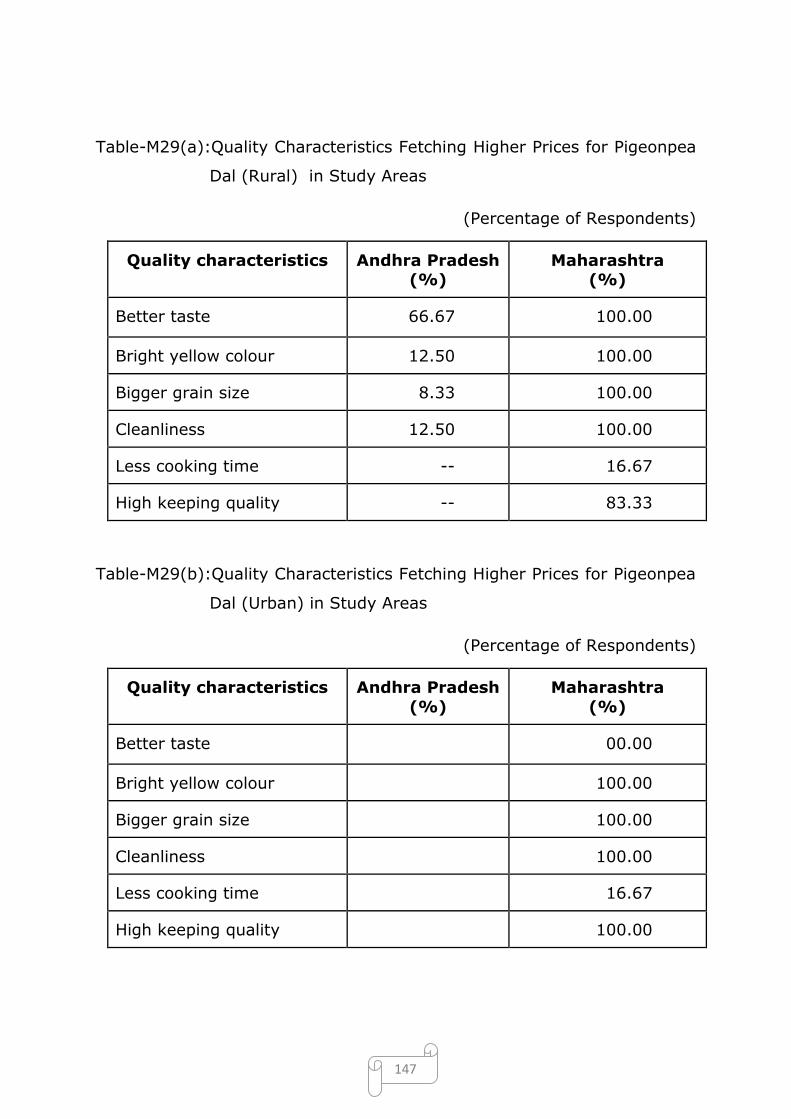
147
Table-M29(a):Quality Characteristics Fetching Higher Prices for Pigeonpea
Dal (Rural) in Study Areas
(Percentage of Respondents)
Quality characteristics Andhra Pradesh (%)
Maharashtra (%)
Better taste 66.67 100.00
Bright yellow colour 12.50 100.00
Bigger grain size 8.33 100.00
Cleanliness 12.50 100.00
Less cooking time -- 16.67
High keeping quality -- 83.33
Table-M29(b):Quality Characteristics Fetching Higher Prices for Pigeonpea
Dal (Urban) in Study Areas
(Percentage of Respondents)
Quality characteristics Andhra Pradesh
(%)
Maharashtra
(%)
Better taste 00.00
Bright yellow colour 100.00
Bigger grain size 100.00
Cleanliness 100.00
Less cooking time 16.67
High keeping quality 100.00
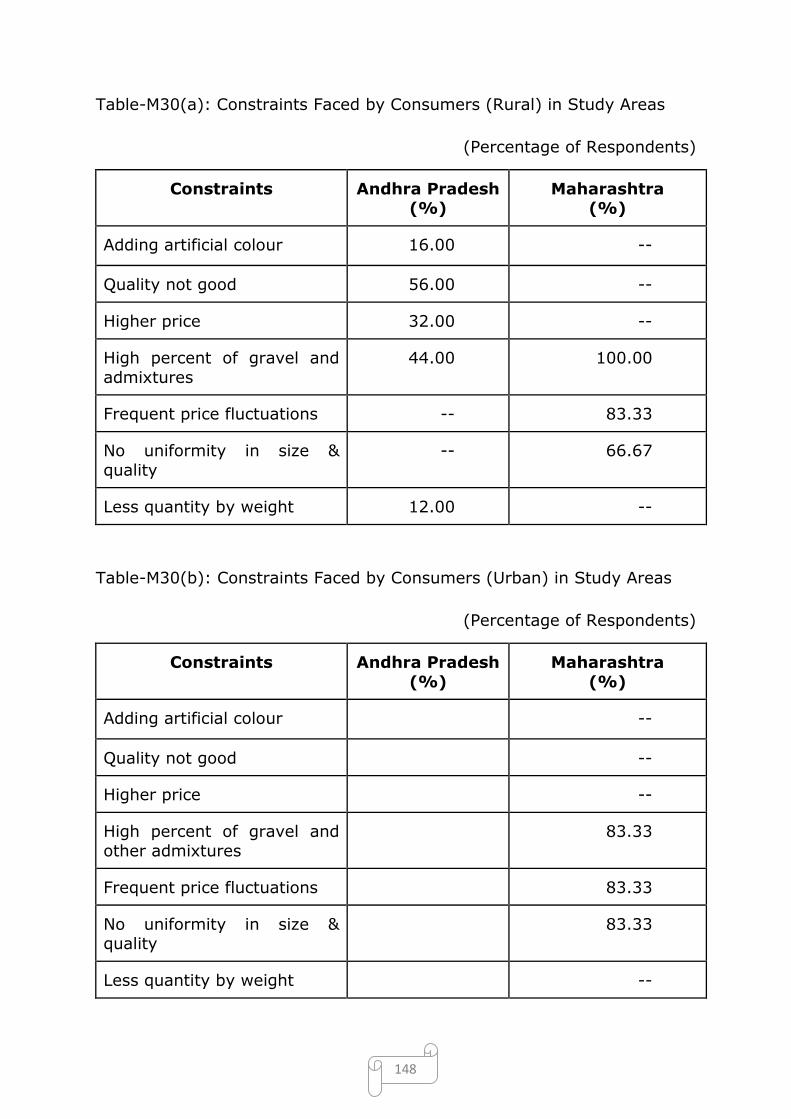
148
Table-M30(a): Constraints Faced by Consumers (Rural) in Study Areas
(Percentage of Respondents)
Constraints Andhra Pradesh (%)
Maharashtra (%)
Adding artificial colour 16.00 --
Quality not good 56.00 --
Higher price 32.00 --
High percent of gravel and
admixtures
44.00 100.00
Frequent price fluctuations -- 83.33
No uniformity in size &
quality
-- 66.67
Less quantity by weight 12.00 --
Table-M30(b): Constraints Faced by Consumers (Urban) in Study Areas
(Percentage of Respondents)
Constraints Andhra Pradesh
(%)
Maharashtra
(%)
Adding artificial colour --
Quality not good --
Higher price --
High percent of gravel and
other admixtures
83.33
Frequent price fluctuations 83.33
No uniformity in size & quality
83.33
Less quantity by weight --
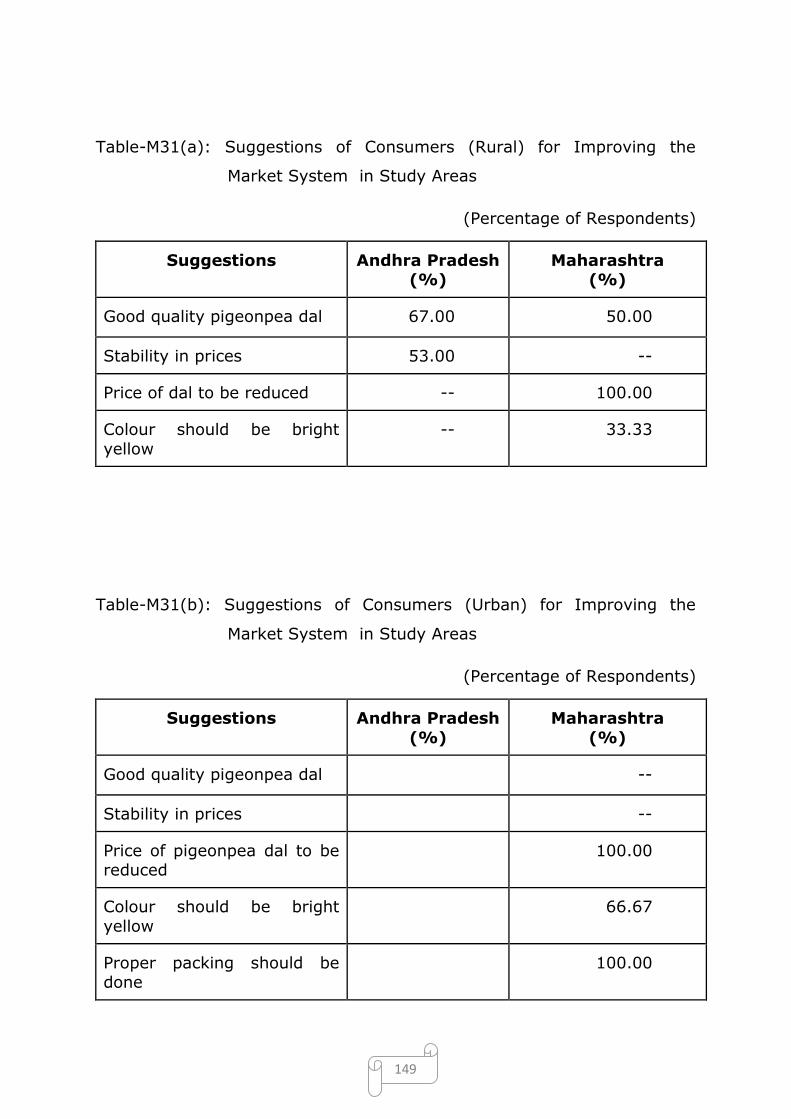
149
Table-M31(a): Suggestions of Consumers (Rural) for Improving the
Market System in Study Areas
(Percentage of Respondents)
Suggestions Andhra Pradesh (%)
Maharashtra (%)
Good quality pigeonpea dal 67.00 50.00
Stability in prices 53.00 --
Price of dal to be reduced -- 100.00
Colour should be bright
yellow
-- 33.33
Table-M31(b): Suggestions of Consumers (Urban) for Improving the
Market System in Study Areas
(Percentage of Respondents)
Suggestions Andhra Pradesh
(%)
Maharashtra
(%)
Good quality pigeonpea dal --
Stability in prices --
Price of pigeonpea dal to be reduced
100.00
Colour should be bright
yellow
66.67
Proper packing should be done
100.00

150