
PRODUCTION AND MARKET RISKS: EX-ANTE RESPONSE …
99
i PRODUCTION AND MARKET RISKS: EX-ANTE RESPONSE MECHANISMS AND INCOME SMOOTHENING IN THE CENTRAL RIFT VALLEY, ETHIOPIA STUDENT: YARED DERIBE TEFERA MSC, ECONOMICS, ENVIRONMENT AND POLICY SUPERVISOR: DR. MARRIT VAN DEN BERG August 30, 2011
Transcript of PRODUCTION AND MARKET RISKS: EX-ANTE RESPONSE …

i
PRODUCTION AND MARKET RISKS: EX-ANTE RESPONSE
MECHANISMS AND INCOME SMOOTHENING IN THE CENTRAL
RIFT VALLEY, ETHIOPIA
STUDENT: YARED DERIBE TEFERA
MSC, ECONOMICS, ENVIRONMENT AND POLICY
SUPERVISOR: DR. MARRIT VAN DEN BERG
August 30, 2011
ii
PRODUCTION AND MARKET RISKS: EX-ANTE RESPONSE MECHANISMS
AND INCOME SMOOTHENING IN THE CENTRAL RIFT VALLEY, ETHIOPIA
Thesis submitted
MSc Degree in Management, Economics and Consumer Studies, with a
Specialization in Economics, Environment and Policy
YARED DERIBE TEFERA
SUPERVISOR
DR. MARRIT VAN DEN BERG (ASIS. PROFESSOR)
DEVELOPMENT ECONOMICS GROUP
WAGENINGEN UNIVERSITY
August 30, 2011
Wageningen, The Netherlands

i
Contents I. Introduction ............................................................................................................................. 1
1.1 Justification and Rationale .................................................................................................... 1
1.2 Problem Statement ............................................................................................................... 2
1.3 Objectives of the Research ................................................................................................... 4
1.4 Outline of the Paper .............................................................................................................. 5
II. Theoretical Background .......................................................................................................... 6
2.1 Risks and Uncertainties ......................................................................................................... 6
2.2 Categorization of Risks in Agriculture ................................................................................... 7
2.3 Production and Market Risks ................................................................................................ 9
2.4 Risk Management ............................................................................................................... 10
2.4.1 Systematic Risk Management .......................................................................................... 10
2.4.2 Ex-ante Risk Management Strategies .............................................................................. 11
2.4.3 Impacts of the Risk Response Practices ........................................................................... 16
2.5 Decision Making and Uncertainty ....................................................................................... 19
2.5.1 Expected Utility Theory (EU) ............................................................................................ 20
2.5.2 Prospect and Cumulative Prospect Theory ..................................................................... 24
2.6 The Farm Household Model ............................................................................................... 26
III. Description of the Research Area ......................................................................................... 29
3.1 Potentials in the Central Rift Valley .................................................................................... 32
3.2 Challenges in the Central Rift Valley ................................................................................... 33
3.3 Status of Formal Insurance in Ethiopia ............................................................................... 34
IV. The Research Methods ......................................................................................................... 36
4.2 Data Collection .................................................................................................................... 36

ii
4.3 Delineation of the Area and Sampling Procedure .............................................................. 37
4.4 Data Analysis and Empirical Models ................................................................................... 37
V. Results and Discussion .......................................................................................................... 42
5.1 Description of the Data ....................................................................................................... 42
5.2 Response Mechanisms Against Production and Market Risk ............................................. 47
5.2.1 Response Towards Market Risk ................................................................................... 54
5.2.2 Responses to Production Risk .......................................................................................... 58
5.2.3 Determinants of Offseason Diversification and Supply of Vegetable ............................. 61
VI. Conclusions ........................................................................................................................... 65
VII. Recommendations ............................................................................................................. 67
VIII. Bibliography ....................................................................................................................... 68
IX. Annex .................................................................................................................................... 72

iii
Preface
This thesis is part of the masters study program in Wageningen University. The study focuses on the the
mechanisms how farmers are reducing the risks of production and marketing in the Central Rift Valley of
Ethiopia.
First and foremost, I am thankful to The Wholly God for His everlasting mercy and complements.
I am very much thankful to the NFP program for sponsoring my MSc education and my stay in The
Netherlands. I would like to extend my appreciation to the Wageningen University in all the student
services. I am very grateful to My Advisor, Dr. Marrit Van Den Berg for her continuous guidance and
shaping of my work starting from the proposal to the end of the thesis research.
I would like to express my gratitude to all the extension experts and development agents located at
Ziway, Meki and Adama for their invaluable support during the sampling and data collection process.
I am grateful to pass my appreciation for my contact families in Wageningen city Mr. Ruud Tegelenbos
and Mariska Ruud, with them I am feeling home. I am greatly thankful to my brother Tilahun Deribe for
his encouragement and advice in every aspect.

iv
Acronyms
WB World Bank
WFP World food program
ADB Agricultural Development Bureau
CRV Central rift valley
SRM Systematic risk management
EU Expected utility
ARA Absolute risk aversion
RRA Relative risk aversion
CARA Constant absolute risk aversion
IARA Increasing absolute risk aversion
DARA Deceasing Absolute risk aversion
IARA Increasing absolute risk aversion
DRRA Decreasing relative risk aversion
SD Standard deviation
SE Standard error

v
Abstract
Agricultural production involves huge uncertainty and risks. Production and market risks are
important in the context of the Ethiopian Central Rift Valley. The region is characterized by the
challenges of drought and food shortages. The aim of the research is to examine the
determinants of the practices of ex-ante response methods by farmers against the major risks. A
household survey was conducted and a sample of about 232 households were interviewed after
stratification of users and non- users of irrigation. Farmers are categorized into similar groups
based on their responses towards risks. It is found out that access to irrigation influences in a
way that the farmers own limited strategies. Education level of the farmers is the determinant
factor for the implementation of the different risk responses. Experience in farming activity is
found to have a moderate impact. Offseason diversification and participation in supplying of
vegetable produce is influenced by the age of the farmer, distance from markets and distance
from irrigation. Educated farmers supply a sizable quantity of vegetable to the market. The
results indicate that there is need of provision of supplemental irrigation and alternatives for the
farmers in the area. The importance of training in risk management and reducing market
inefficiencies is highlighted. Due to the complex nature of the challenge in the area an
integrated approach is required to deal with vulnerability. It is important to design agricultural
and rural development policies towards the management of risks and the resources in the long
term plans.
Key words: production; market; risks; determinants; response; irrigation; vegetable

1
I. INTRODUCTION
1.1 Justification and Rationale
The vast majority of the world’s poor people are dependent on agriculture as a means of their
livelihood (Hurley, 2010). Whereas in general, agriculture inherently is the riskiest venture that
everyday producers deal with a huge uncertainty and insecurity (World Bank, 2008). Risk can be
defined as imperfect knowledge where the probabilities of the possible outcomes are known,
and uncertainty exists when these probabilities are not known (Hardaker, 2004). The sources of
risk in agriculture are found to be numerous and diverse (OECD, 2009) and that agricultural
production is stochastic, crucially influenced by unpredictable and uncontrollable biotic and
abiotic processes (Moschini and Hennessy, 2001; Hurey, 2010). A diversity of hazards related to
weather, pests and diseases or personal circumstances determine production (OECD, 2009).
Risk causes a considerable influence on rural households, particularly in developing countries.
The dependence of agricultural production on the timing and amount of rainfall increases
vulnerability to weather shocks, and this in turn constrains the farmers’ ability to invest in yield
enhancing technologies (Word Bank, 2008). Furthermore, markets for agricultural produce are
characterized by high fluctuations and farmers are much uncertain about what the prices are
likely to be next season (Hurley, 2010; World Bank, 2005) Managing. The instability of the
domestic price tends to be more pronounced in landlocked countries in Africa, such as Ethiopia
and the occurrence of drought exacerbates the impact of domestic shocks (World Bank, 2008).
The Ethiopian central rift valley (CRV) region, which is bordered by the central and south-
eastern highlands is characterised by its erratic rainfall, declining farm productivity and food
shortages (Rahmato, 1989; Mberu, 2006). The losses to vegetable producers in the connection
to market power and risk factors significantly reduce farm prices (Haji, 2008). On the contrary,
considering the opportunities vested in, many studies mention that the region has a potential
for agricultural productivity growth and raising farmers’ income (Haji, 2008; Diga, 2005;
Hengsdijk & Jansen, 2006).

2
It is evidenced that the role of formal insurance markets is limited so that effective pooling of
risks remains a challenge (Fafchamps 1992; Dercon 1996). Hence, the transfer of risks to third
parties is not much dependable and farmers must seek risk management mechanisms to hedge
against potential adverse shocks (Fafchamps, 1992). Adoption of the various risk management
strategies may depend on farmers’ risk aversion behavior (Fafchamps 1992). Many scholars
mention that poor farmers reduce the risks they face by growing their own food (Roumasset,
1976; Fafchamps, 1992a), avoiding new technologies (Feder, 1980; Feder et al., 1985; Antle and
Crissman, 1990), and diversifying their activities (Robinson and Brake, 1979; Walker and Ryan,
1990).
The motivation of the research is to address the challenges of risk in the CRV that why the rural
households in the region become vulnerable to risks that lead them to perpetuating poverty as
opposed to the resources and efforts mode in the past. It is to investigate the farmers’ ex-ante
response mechanisms towards the major risks in agriculture and ways of integrating the
different mechanisms supplemented by off-season income diversification. This is in relation to
the small scale irrigation in the area, its impact on risk behaviour of the farmers and investment
in cash crops production. It involves the comparison of users of irrigation with that of the non-
users, where they especially are unshod against the risk of drought. In the end, the result of the
research could be of significance for a policy advice and decision making in risk management or
agricultural development agendas at local, regional and national levels.
1.2 Problem Statement
Poor households in developing countries are vulnerable to risks that threaten their livelihood
(Alderman and Paxson, 1992; World Bank, 2001). Additionally, these households are often
constrained in their access to formal insurance schemes and formal credit markets, and they
own fewer assets than more affluent households do (Schindlera, 2009). In other words, they fail
to insure themselves effectively without the presence of reliable insurance markets. The
challenge is commonly existent in many of these countries and exposure to such risks is likely to
affect the ex-ante production choices (Fafchamps 1992; Chavas and Holt 1996; Kurosaki and
Fafchamps 2002).

3
In Ethiopia, the prevalence of high variability of rainfall deprived the life of the poor that both
the national and regional droughts have extreme impacts on farmers who have little access to
the modern agricultural practices with little irrigation infrastructures. In addition to this, the
drought further affects the capability and motivation of farmers to adopt improved agricultural
technologies (World Bank, 2005). As a result, the overall production is subject to a decline and
it further decreases the households’ income and finally their consumption. The level of
production is too low to feed the whole population even in good rainfall years as the report of
The Ethiopian ministry of agriculture has indicated (World Bank, 2005).
Huge literature signify that in the CRV, the challenges of erratic rainfall coupled with population
pressure, degradation of the environment and shortage of land result in growing reliance on
food aid, especially in the south (Rahmato, 1989; Mberu, 2006). It is also indicated that prices
tend to be more variable in the isolated regions, because limited market access and greater
costs of getting to market make it more difficult to offset local supply and demand shocks. The
risks in marketing can be for both the staple grain crops and cash crops but the challenge will
be higher in the latter case due to the nature (perishability) of vegetable produce (World bank,
2008/7). A study conducted in the area discusses that the share of traders is large as a result
farmers are earning less for the most perishable vegetables and this is connected due to the
absorption of risks by the traders and lack of effective institutions (Haji, 2008).
The challenges of risk in the central Rift Valley region should be of high concern that the loss as
a result is prominent. The households are increasingly affected that the global climate change is
found to intensify the incidence of droughts. Lack of efficient and long term strategic
approaches in risk management is linked to the support institutions and agricultural policies in
the country. Recently, the role of formal risk sharing acknowledged and that weather index
insurance has been launched by the arrangement of the government and donors, such as the
World Bank (WB) and World Food Program (WFP).

4
1.3 Objectives of the Research
The main objective of the research is to analyse the determinants of farmers’ own ex-ante risk
response strategies against both production and market risk, and income smoothening in the
central Rift valley region in Ethiopia.
As introduced in so far, production and market risks are the core threats to farming activity in
the CRV. Production risks significantly affect the marketing behaviour of farmers and the risks
related with marketing in turn affect production decisions. It is obvious scenario that some
farmers are more vulnerable than the others that they hardly reduce the risks they are in
confront. Conversely, other farmers reduce the effect of the risk in a better way by using
different mechanisms. Thus, in order to lessen the impact of risk or to survive in farm activities,
it is necessary to use risk reducing strategies. The selection of strategies depends on the
farmers themselves as well as also influenced by other exogenous factors.
The central question has been formulated based on the main objective of the research what it
tries to address and is stated as: What are the determinant factors that affect the adoption of
both the traditional and modern risk response methods by the farmers to reduce the impact of
both production and market risk in the CRV region?
Specific research objectives
The presumed factors affecting could be the farmers own anticipation of risks, knowledge and
the resources they own. Access to irrigation is an important infrastructure for reducing the
effect of risks. The specific research objectives are derived after the following specific research
questions and formulated as follows,
What strategies farmers own to cope up with marketing risks and how much is the rate of
adoption?
What strategies farmers are using to hedge against production risks and what is the extent of
implementation by the different household groups?
Which risk strategies are less adopted by the households and what is the reason behind?

5
What is the role of small scale irrigation in influencing the use of strategies by the farmers with
the comparison of areas with no access to the infrastructure?
The last question is related to that, what factors affect diversification of income in the
offseason production and further impacting on the size of vegetable produce supplied to the
markets?
Based on these research questions the first aim of the research is to analyse specific factors
influencing the practice of risk responses towards production risk. Secondly, the attempt is to
examine the level of adoption of strategies in response to market risk. In both the cases, it is to
examine the strategic behaviour of farmers who have access to irrigation facility and those
without such a facility. Thirdly, is to find out the factors favouring off season income
diversification and the size of the supply of vegetables to the market.
In general, this research gives throws some light on the mechanisms farmers reduce risks and
uncertainties in which they are in confront in day-to-day decision-making. How farmers are
using their resources wisely to cope up with the challenges? In addition, information about the
contribution of support institutions will also be entertained.
1.4 Outline of the paper
The second chapter gives a synopsis on the potentials and constraints in the central rift valley
(CRV). The third chapter focuses on the detailed appraisal of the theoretical background about
risks in production and marketing, the risk response methods, decision making under
uncertainty and the farm household model. The fourth chapter concerns with the description of
the area of the research. The fifth chapter explains the methodology on the selection of the
research area, the sampling procedures and data analysis. Chapter six contains the description
of the data, empirical analysis on the determinants of implementation of the risk response
strategies and seasonal diversification will be entertained. Chapter seven includes the
generalizations and conclusions from chapter two and chapter six. Chapter seven gives the
recommendations based on the results from this study by incorporating the results and advise
from beta-gamma research in the CRV.

6
II. THEORETICAL BACKGROUND
2.1 Risks and Uncertainties
Many studies provide an argument against the common definition of risk and uncertainty. Risk
is defined as an imperfect knowledge where the probabilities of the possible outcomes are
known, whereas uncertainty exists when these probabilities are not known. Uncertainty means
imperfect knowledge and on the other side; risk refers to uncertain consequences, particularly
exposure to unfavourable outcomes (Hardaker, 2004). The specific definition of risk given by
(Harwood, 1999), states that risk is uncertainty that matters and may involve the probability of
losing money, possible harm to human health, repercussions that affect resources (irrigation,
credit), and other types of events that affect a person’s welfare. Uncertainty is a situation in
which a person does not know for sure what will happen, however, it need not lead to a risky
situation (Patrick, 1992). According to (Chavas, 2004), the debate about distinction between
risk and uncertainty ultimately boils down to an argument about the existence and
interpretation of probability. There is no sharp distinction between risk and uncertainty and he
uses the terms interchangeably. A clear consensus on the definition of risk is not available yet
(Špicka, 2009).
Literatures discuss that production decisions carried out on the basis of future expected prices
and expected output. Incompatibility of these expectations and the outcomes it is said that
producers face price and income risk. Unlike most other entrepreneurs, farmers cannot predict
with certainty the amount of output their production process will yield because of these
external factors. They can be affected by adverse events during harvesting or collecting that
may result in production losses (World Bank, 2005). Because of risk and uncertainty
components, big fluctuation in yields and prices is the challenge that producers are facing and
the situation leads to important income differences from one year to another. These factors are
the main causes of income fluctuations in agriculture and are therefore of crucial importance.
Given an uncertain income each year, farmers must worry about their ability to repay debt, to
meet overhead costs (e.g. land rents and taxes) and, in many cases, their ability to meet
essential utilities for their families (Hazell, 1992).

7
The sources of risk in agriculture are various and that it range from price and yield risk to risks
directly related with the farmer’s physical injury and poor health conditions. Variability of prices
and yields are major sources of risk in agriculture (World, Bank, 2005; Patrick, 1992). Other
types of risks include individual risk sources such as, market risk caused by unforeseen shocks
of supply and demand forces or production risk born by random factors such as spread of pests
and weather (Abedullah and Ali, 2006; Rosenzweig and Binswanger (1993). Apart from these
technological changes, legal and social concerns, and the human factor itself are also
contributing factors for risk in rural areas.
2.2 Categorization of Risks in Agriculture
The risks in agriculture have different sources and consequences and so they can be classified in
very different ways. It is not necessary to provide a particular classification of risk, and different
ones can be used for different purposes. Some technical characteristics of risks apply across
different classes and can be quite important in terms of the appropriate and available strategies
to deal with each risk.
The classification of risks given by (Rejda, 2003; Hager, 2004 cited on Schaper et.al, 2009) shows
that risk has two major categories, namely corporate risks and personal risks. Other
classifications distinguish between pure and speculative risk concepts (Lu¨ck & Henke, 2004) or
between objective and subjective risks (Rejda, 2003). The categorization of agricultural risks by
(Lehrner, 2002; Chapman et al., 2002) views in terms of whether risks that can be influenced by
farmers (internal risks), and those outside the reach of farmer’s influence (external risks). The
risks and uncertainties in agriculture are conventionally grouped into the management areas of
production, marketing and finance (Boehlje and Eidman, 1994 cited on Morales et.al, 2008).
The other views include that of (Newbery and Stiglitz, 1981) and they distinguished between
systematic and non-systematic risks. Systematic risks refer to events that occur repeatedly over
time with a pattern of probabilities that can be analysed in order to have a good estimate of the
actuarial odds. On the contrary, non-systematic risks are characterised by very short or
imperfect records of their occurrence and, therefore, difficulties in estimating an objective
pattern of the likelihood outcomes.

8
The general category classifies risks in agriculture into idiosyncratic and covariate. Idiosyncratic
risks are affecting individual farmers, whereas covariate shocks affecting the whole farmers in
the region. With reference to the classification given by (OECD, 2000), risks can be viewed as
those that are common to all businesses in general (family situation, health, personal accidents
and macroeconomic risks) and risks that affect agriculture more specifically such as; production
risk, ecological risks, market risks and finally regulatory or institutional risk. Other classifications
are that of (Musser and Patrick, 2001 cited on OECD, 2009) that they follow the discussion by
(Baquet et al., 1997) and define five major sources of risk in agriculture: production risk,
marketing risk, financial risk, legal and environmental risk concerns and finally, human
resources risk.
The sources of uncertainty in agriculture are also discussed by (Moschini and Henessy, 2001).
According to them, production uncertainty concerns that the output that will result from a
given bundle of production decisions are not determined with certainty. Price uncertainty
explains that the price of the output that is not known while making the production decisions.
Technological uncertainty refers to production techniques, which may make quasi-fixed past
investments obsolete and policy uncertainty is related to government interventions, changes in
which may create risk for agricultural investment. In the documents of (World Bank, 2000;
Holzmann and Jorgensen, 2001) summarized risks in six different categories: natural, health,
social, economic, political and environmental. They also cross this typology with an additional
dimension of systemic characteristics of different risks: micro or idiosyncratic risk, Meso-risk,
and macro or systemic risk.
The more general literature on risk management typically adds non-agricultural specific risks in
the classification, particularly when related to developing countries. Any classification of risks
underlines the fact that an individual farmer may be facing very different risks at the same time.
In these conditions, the optimal choice of a strategy to deal with the risks needs to take into
account the correlations among risks (OECD, 2008).

9
2.3 Production and Market Risks
In broad terms, production or yield risk has more of idiosyncratic component. In addition to
systemic shocks, such as like droughts and floods that affect a whole region, there are also
idiosyncratic shocks of rain, hail, frost and so on. The basis that compares individual yields or
production with more aggregate regional or national average yields can vary across space and
time depending on specific local events related to weather or disease. Price and production risk
are two important types of farming risk through the causes are different. Price and production
risks differ with respect to the degree of correlation that exists across farmers. It can easily
occur that a farmer suffers a bad production year while his neighbours have an average year,
while it is very unlikely that a farmer will receive a low price while his neighbours have much
higher prices (except if they were covered by risk management tools such as futures or
contracting agreements). Price and production risk are different with respect to all the
important characteristics mentioned above: systemic nature, information availability,
information asymmetries and existence of potential buyers of the risk (OECD, 2009).
In agriculture, production generally is a lengthy process, for example, livestock production,
typically requires on-going investments in feed and equipment that may not produce returns
for several months or years. Because markets are generally complex and involve both domestic
and international considerations, producer returns may be dramatically affected by events in
far-removed regions of the world. Price or market risk reflects risks associated with fluctuations
in the price of output or of inputs that may occur after the commitment to production has
begun. These fluctuations can occur within a marketing year or in different consecutive years.
Price risk originates in the markets for inputs and outputs; however there is argument that it
could be generated endogenously by the dynamics of markets. Price risk is typically systemic
due to the possibility of arbitrage. In crop agriculture, input price risk has been given
considerably less attention in the literature, and has been considered less substantial than
output price risk and yield risk.
Another kind of market risk arises in the process of delivering production to the market place.
The inability to deliver perishable products to the right market at the right time can impair the
effort of producers. In developing countries, the lack of infrastructure and of well-developed

10
markets makes it a significant source of risk. Many agricultural production cycles stretch over
long periods and farmers are only be able to recuperate after marketing their product. This
leads to potential cash flow problems and often exacerbated by lack of access to credit and the
high cost of borrowing (OECD, 2009).
2.4 Risk Management
2.4.1 Systematic risk management
Risk strategies are defined as the methods applied to remove or reduce partly the effects of
factors creating risk in agriculture. Risk management strategies are developed to provide some
protection in situations in which the outcome of a decision are unknown while the decisions
made (Patrick, 1998). Whereas, other studies discussed that the aim of implementing risk
management instruments is not to minimise the risks a farm faces but to optimise its
opportunity-risk profile while taking into account farm objectives and strategies (Diederichs,
2004; Merna & Al-Thani, 2005).
Systematic risk management enables to identify, quantify, control and monitor risks and
potential losses (Waters, 2007). The risk management process involves a series of steps:
identification, assessment, management, and control of risks (Kenney, 1993; Wolke, 2007). The
identification and assessment of risks is referred to as risk analysis and provide the basis for the
subsequent execution of risk management procedures (Mikus& Go¨tze, 1999). Risk
identification is mainly concerned with the description of the potential risks a farm faces. Risk
analysis focuses on the quantification of the occurrence rates of risks and possible negative
consequences (Diederichs, 2004). Different qualitative and quantitative instruments for
identifying and assessing risks are discussed in literatures such as; checklists, risk maps,
simulations (Merna & Al-Thani, 2005), balance sheets and profit-or-loss statements (Bahrs,
2002) and methods with the fundaments of value-at-risk or extreme-value theory (Crouhy et
al., 2006; Odening et al, 2007 cited on Schaper et al., 2009).
The risk management strategies are can be viewed into three categories: risk prevention, risk
mitigation, and risk coping strategies. Prevention and mitigation strategies are concerned with
income smoothening whereas coping strategies ponder on consumption smoothing. Prevention
strategies can also be termed as risk reduction strategies and are introduced before a risk

11
occurs. Risk mitigation schemes have an ex-ante effect. Prevention strategies are actions
against the risk to happen while in the case of the risk mitigation strategies, the risk may
happen but involves reducing its effect. Coping strategies can relieve the effect of the risk once
it has happened and include mainly the ex-post actions (OECD, 2009).
Income smoothening can be achieved by a risk repose methods known as ex-ante risk reducing
strategies while consumption smoothening can be reached by loss management or ex-post
strategies. Literatures discuss that the two strategies are interconnected, in a sense that with
the practices of ex-post loss management mechanisms, the tendency of the households to
engage in ex ante risk reduction will be minimal. It means that the greater the capability of
effective management of the effect of risks, the concern for protection will be lower.
Consequently, income smoothening strategies cannot be viewed independently of risk-coping
strategies (Valdivia et, al., 1996; Dercon, 1996).
2.4.2 Ex-ante risk management strategies
As it has been discussed in so far, relevant credit and insurance markets are not well developed
and not adequately linked across regions and with urban areas. For many small countries, such
government assistance can be very expensive and may constitute a high share of GNP when the
crisis is substantial. This can impose a serious impact on the monetary and fiscal policies of
small countries (Rezitis and Stavropoulos, 2010). Hence, farmers need to hedge against the risks
by making a choice of both ex-post and ex-ante risk mitigation mechanisms. Particularly, ex
ante crop production decisions remain an important part of risk management strategies for
farm households (Fafchamps, 1992; Dercon, 1996).
Making choices among various alternatives requires a sound decision making process (Tversky
and Kahneman, 1986). The discussions relate to the rational decision making theories that
farmers have specific goals and also exert an effort in order to optimize their benefits.
According to Huijsman's theory, the actions taken by the farmer bases on needs, goals and the
resources owned. The resource he owns also includes social resources, such as information or
access to credits in addition to land, water, and labour (Barlett, 1980). On the other hand,
behavioural approaches to decision making signify that farmers make daily, routine decisions
usually unconsciously or pre-attentively. Skilful farmers with a lot of experience in farming

12
undoubtedly behave this way. They have a stock of practical knowledge, which serves as a kind
of cookbook. This knowledge can be used to solve their everyday problems efficiently (van
Dusseldorp, 1994 cited on Wahab, 1996).
The response mechanisms towards risks can be viewed in several ways depending on the types
of risks exposure (Kay and Edwards, 1994; Hardaker et al., 1997; Musser, 1998). Risk responses
or methods of dealing with variability are commonly grouped into production, marketing, and
financial responses. As the names imply, production and marketing responses deal directly with
the production and market types of risk (1992). Production responses generally involve
lowering of the variability in production, while marketing measures may involve transferring
price risks to other individuals or institutions (Patrick, 1992). Actions to reduce the incident
rates of risk scope primarily with internal risks, usually part of the day-to-day farm management
activities have been discussed. The measures that reduce negative consequences or losses
often have a strategic character, for example, risk mitigation through diversification (Schaper,
et al., 2009)
Ex-ante strategies serve as prevention and reduction methods that desirable actions are taken
before the risk happens or before exposure to it. These strategies are listed in (OECD,2009) and
includes market price support mechanisms, market interventions (private storage support),
non-marketing of agricultural products, support to production techniques such provision of
irrigation, drainage and flood control. The role of the services of extension in the risk
management has also been discussed in this literature. The tools and strategies are not limited
to these but a variety of methods are used by farmers. Producers also respond by altering
output levels, input use, or some combination of the two.
Cultural practices are the mechanism to reduce the yield or income risks, for example, planting
of early maturing varieties, delay or early plating for protecting against the risk of early frost
and yield loss. On-farm strategies enable to reduce the magnitude of the yield risk associated
with some of these perils, e.g. judicious crop selection, improved seeds, pesticides and use of
supplementary irrigation (Patrick, 1998/2). The role of crop rotation in reducing production risk
has been observed by ((Peter and R. Metzger, 1994). The various risk response methods are

13
also listed on (World Bank, 2005) such as, avoiding exposure to risk, and intercropping ,
infrastructures (roads, dams, irrigation systems), sourced by (Anderson 2001; Townsend 2005).
Choosing low risk activities
The diversity of crop and livestock enterprises can have an influence of the production risk. The
explanation is that specialty crops, such as tomatoes and vegetables for processing, the
characterized by more fluctuations in production vis a vis the common crops. These specialty
crops may yield better gross incomes return also may be associated with higher production
costs and challenges of finding marketing outlets. As a result, these crops would be considered
as a high risk activities for most of the producers. Sometimes farmers also may engage in only
part of a production activity for a purpose of reducing risk, for example, custom cattle feeding
largely avoids the marketing and financial risks (Patrick, 1992).
Diversifying Enterprises and crops
Diversification is one of the traditional risk management techniques and is considered the
primary tool as a form of self-insurance in which people make a judicious selection of assets
and activities that have low or negative correlation of incomes (Alderman and Paxson, 1992;
Reardon et al., 1992, 1998, 2000 cited on Patrick, 1998). The impact of weather can be reduced
by a geographic dispersion of production activities and can serve as the other mechanism.
Production practices also can be diversified in relation to marketing responses and continuous
instability of the commodity prices has warned farmers to seek better marketing methods.
(Barrett, et al., 2001; Patrick, 1992)
Spreading of sales
Spreading of sales or making sales at different intervals during a year is found to be a common
practice used by agricultural producers. Spreading sales over time is considered as a form of
diversification and as a mechanism for reducing risk. The flexibility in marketing can also enable
spreading cash sales and obtain a price similar to the season average price. The positive gain
from the strategy depends on the magnitude of the correlation of price and yield plus the
situation of the variability of yield experienced by the farmer (Goodwin and Kastens, 1996;
(Tomek and Peterson, 2001; Patrick, 1992).

14
Options trading and price contracts
The new ways of market response include options trading and minimum price contracts.
Forward contracting practice is utilized to deal with both input and output marketing risks.
Hedging with the futures contracts is a marketing response for reducing risk. The other
marketing response which has recently become common in some agricultural commodities is
options trading (Tomek and Peterson, 2001; Patrick, 1992). The responses help to reduce the
risk by lack of stabilization of markets and whereas the others for the transfer of risks.
Agricultural options provide a farmer with the opportunity to secure price insurance. However,
options will not always be able to guarantee a profit. Minimum price contracts and other
marketing arrangements are being developed based on options. These new marketing
techniques provide producers with greater flexibility and more risk management alternatives.
The use of market information is also indicated; however reliability of information is more
important.
The practice of diversification reduces risk within the farm’s operation while production
contracting contributes for the transfer of risk outside the farm, maintaining liquid assets leads
to build the farm’s capacity for retention of the risk. Production contracting best corrects
defective price signals due to oversupply and undersupply problems on the market, the risk-
return tradeoffs are the mutual benefits for both the producer and the buyer firm. Participation
in a government commodity programs is the other mechanism used by many farmers. These
programs provide downside price protection or floor pricing policy. This is in the form of price
supports, loan programs, target prices, deficiency payments, and payments in kind schemes
(Patrick, 1992).
15
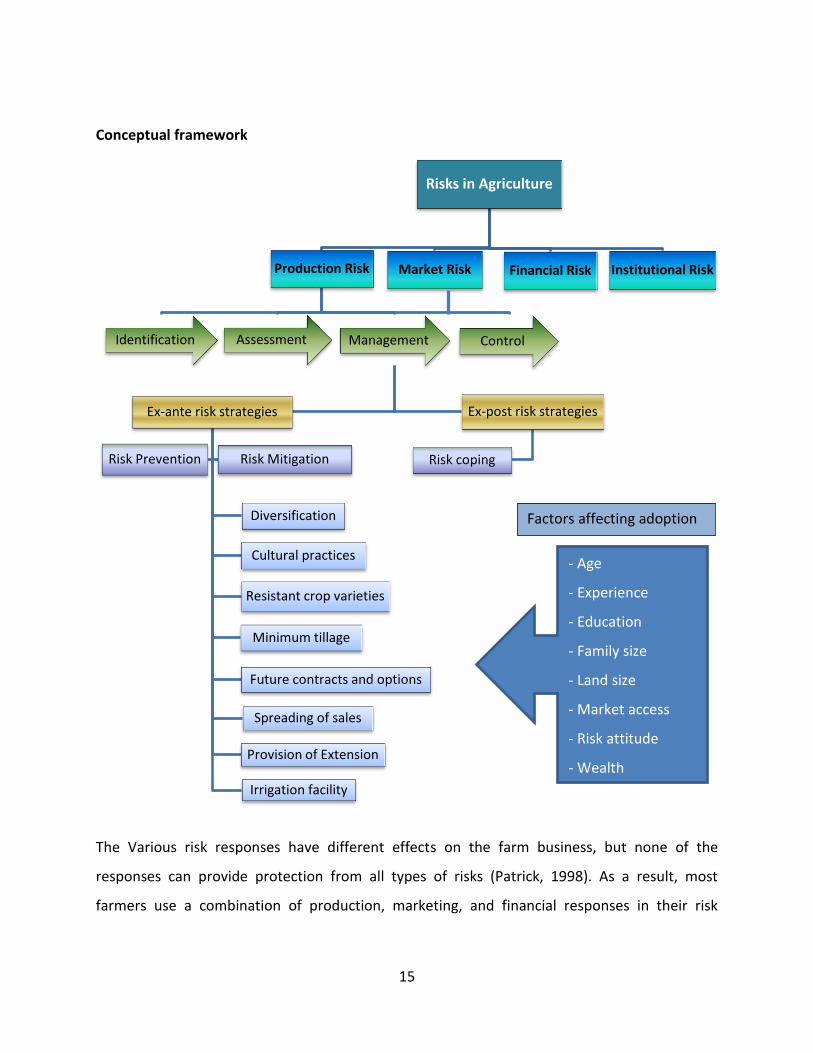
Conceptual framework
The Various risk responses have different effects on the farm business, but none of the
responses can provide protection from all types of risks (Patrick, 1998). As a result, most
farmers use a combination of production, marketing, and financial responses in their risk
Risks in Agriculture
Production Risk
Identification Assessment Management
Ex-ante risk strategies
Diversification
Cultural practices
Resistant crop varieties
Minimum tillage
Future contracts and options
Spreading of sales
Provision of Extension
Irrigation facility
Risk Prevention Risk Mitigation
Ex-post risk strategies
Risk coping
Control
Market Risk Financial Risk Institutional Risk
- Age
- Experience
- Education
- Family size
- Land size
- Market access
- Risk attitude
- Wealth
Factors affecting adoption

16
management strategy. Because farmers differ in their goals and attitudes, as well as their
personal and financial situations, their risk management strategies also differ (Patrick, 1992).
Studies have examined the factors affecting the implementation of risk management tools by
farmers. The evidence is that the age of the farmer is negatively influencing the adoption of
crop insurance, forward contracting and spreading sells. Education of the farmers is negatively
correlated with insurance were as positively influences forward contracts and spreading sells.
The larger the farm, the higher the propensity of buying insurance, entering into forward
contracts and spreading of sells (Velandia, et. al., 2009). The practices of different combination
of the risk strategies have also been discussed. Other studies also indicated that the access to
more irrigated land is found to decrease the frequency of marketing. Older farmers also sell less
frequently and the impact of education is in the opposite direction (Goodwin and Castens,
1996). The influences of changes in wages, seasonality, risk, credit market failures and behavior
on diversification of income is discussed (Ellis, 2000) (Fig. 1 systematic risk management).
It is indicated that the outcome of a risky event depends upon risk management strategies, at
the household, community and extra-community levels. It also depends on anticipation and the
response mechanisms towards the risky events (Ravallion, 1997). It has been recommended
that since there is no ‘silver bullet’ for risk management in rural areas, an integrated approach
of different instruments should be considered for the micro, meso, and macro levels (Siegel, S.
Rani, and Alwang, 2002).
2.4.3 Impacts of the risk response practices
Although the merits of the traditional risk management mechanisms are widely recognized
(Hazell, Pomareda, and Valdes), they also have their shortcomings associated with
inefficiencies. They can be costly that farmers are forfeiting their income opportunities as it
discourages long-term productivity growth that can be achieved with better investments and
technological changes (Rezitis and Stavropoulos, 2010). The practice of diversification strategy
to reduce total income risk as discussed in (Reardon et al., 1992; Walker and Ryan, 1990)
concludes that the poor households may then stay poor in the long run because they are risk
adverse (Dercon, 2000; Alderman and Paxson, 1992). These are in relation to the pioneer
efforts and that the poor becomes more vulnerable that with costly risk management strategies

17
that they will not be able to break the cycle of poverty by investing in Profitable opportunities
(Rosenzweig and Binswanger, 1993; Ellis, 1998; Rosenzweig, 1988, Morduch, 1990 cited on
Rose, 2001). Conversely, they are involved with low return and low risk activities (Dercon and
Christiaensen, 2007: 2 cited on Schindler, 2009; Dercon, 1997) (Fig. 2 risk and cycling poverty).
In connection to the discussions, the earlier efforts by Bliss and Stern (1982) found out that the
poor utilizes less fertiliser and needs more spending to increase yields. The risk of loss of
investment made in bad years will be reduced with underutilization of purchased inputs
(Dercon, 1996, 2000, 2008; Alderman and Paxson, 1992). On the contrary, wealthier
households found to invest assets to riskier activity portfolios (Rosenzweig and Binswanger
(1993) in ICRISAT villages in India. The findings explain the limited income smoothing achieved
in practice as a result of the costly strategies (Dercon, 2000). It has been discussed that there is
a direct link between income-based strategies and asset-based strategies, the analysis given by
Eswaran and Kotwal (1989) on the role of credit, which can serve as insurance substitute. The
imperfect credit market usually involves collateralised lending and as a result the poor
households who possess fewer assets hardly participate into high-risk activities. This is for fear
of the downside risks since are too high while the rich households will be affected less (Dercon,
Risk
Yield, price
Income, assets, saving
Consumption, Investment
Low risk low return
Productivity growth

18
1997). This means that with the missing of perfect insurance and credit markets the poor
households manage risks by choosing lower average incomes in exchange for lower income
variability (Dercon, 2008; Alderman and Paxson, 1992).
The other finding by (Dercon, 1997) discusses the case of Tanzania and households who possess
lower asset holdings allot more of their land to the low risk crop. The poor grows lower return
but drought resistant crops such as, sorghum, millet and sweet potatoes. These are safe crops
and on the other side, cotton is cash crop and mostly grown by the rich. The efforts of (Dercon
and Krishnan (1996) also brought an insight that there are different barriers to participate in
different income sources in Tanzania and Ethiopia. The poor gets involved in a low cost entry
points (Dercon, 2008). The poor also may have different activities performed at different times
for example, seasonal operations with which they earn income across the year by smoothening
their labour supply over time. Other practices termed as risk spreading, such as intercropping
may contribute for supplementary income even at the cost of increased variability (Carter, 1991
cited- on Alderman and Paxson, 1992).
In connection to this, the rational is that the response of households against risks may come at
the cost of longer-term poverty reduction. The finding by (Walker and Ryan, 1990) confirms
that up to 25 percent of the average income will be lost in semi-arid areas of India (cited on
Hoddinott and Quisumbing, 2003). Empirical evidence for quantifying the effect of ex-ante risk
management on income and assets, poverty in Africa is very limited (Dercon, 2008; Schindler,
2009). The magnitude of the income smoothening achieved is the focus of the studies devoted
in quantifying the impact of ex-ante risk strategies, diversification of income sources, for
instance (Dercon, 2000). The recent evidence concludes that the traditional options such as,
growing drought resistant but low return subsistence crops (Dercon, 1996) and less application
of fertilizer (Dercon and Christiaensen, 2007) leads to lower productivity. On the other hand,
the role of income diversification is still more unclear (Barrett et al., 2001 cited on Schindler,
2009).
Quantification is important to keep up with profitable strategies and to replace the costly ones
with better alternatives and decision making. The tendency of more risk aversion behavior
discourages entrepreneurial attitude and the decision made by the poor gets lower earnings in

19
the long run. If people were less risk averse, risk would not be a problem: risk is just a matter of
choice, and preferences drive the entire outcome. The saying highlights the importance and
role of insurance to reduce the effect of risk that leads to risk aversion and unprofitable
investments (Dercon, 2008).
2.5 Decision making and uncertainty
Decision making under uncertainty involves that agents make a choice on prospects explained
by their prediction on the probability (Chow and Sarin, 2002; Fox and Tversky, 1995; Heath and
Tversky, 1991; Viscusi and Chesson, 1999; Viscusi and Magat, 1992, Zeckhauser, 2006). The
extreme situation is where the probabilities are known objectively for example, tails come up in
a coin flip and is termed as risk. The other extreme is the situation where the agents do not
know probability completely is called ambiguity, the possibility of rain tomorrow for instance.
The briefing by Ellsberg (1961) tells the presence of people in general to gamble risky prospects
as opposed to ambiguous prospects, even if normative theory (Savage, 1954) implies
indifference. In support of the inference by Ellsberg, ambiguity aversion has been conducted in
many empirical studies, as well as in relation to market conditions and with monetary
incentives (e.g. Halevy, 2007; Maffioletti and Schmidt, 2005; Sarin and Weber, 1993 cited on
Akay et al., 2009).
It has been highlighted that understanding risk in farming is important for several reasons. The
primary concern is that facing with risky outcomes producers are likely be risk averse. A risk-
averse decision maker is one who would prefer an action that leads to a certain return to
another action that leads to an equal but uncertain expected return (Robison et al., 1984). Risk
behavior, such explained by the tradeoff depending on the personal level of gambling, risk
adverse producers prefer a lower average return and lower uncertainty. First, most producers
are averse to risk when faced with risky outcomes. Someone who is risk averse is willing to
accept a lower average return for lower uncertainty, with the tradeoff depending on the
person’s level of risk aversion. The effectiveness of the strategies should be viewed not only in
the angle of average or expected return but also the risk. Secondly, understanding risk enables
to design mechanisms for mitigating the incident of adverse events, and as well as efforts in by-
passing extreme outcomes that leads to bankruptcy (Harwood, et al., 1999).

20
2.5.1 Expected utility Theory (EU)
The expected utility hypothesis is the predominant theory in economics for explaining decisions
taken in risky circumstances. The theory was first postulated by Daniel Bernoulli in 1738 and
later on Neumann and Morgenstein (1944) made a refining and modification. The rationale
under the expected utility hypothesis is that an individual makes choices with an aspiration to
optimize expected utility (Hurley, 2010). The decision maker has to make a choice among
several alternatives and the approach to measure the risk aversion depends on knowing more
about a decision maker’s preference. To depict the risk preference of decision makers expected
utility approach is convenient way (Harwood, et al., 1999).
In economic theories, the method of discounting of the future expected benefits involves
consideration of allowances for the satisfaction from the expectations (Marshal 1981). The
rationale is that these expectations about the future affect the current situation of the agents
(Loewenstein 1987). This is strongly linked to the fundaments of the works of Bentham (1789)
who traced anticipation which turns out to ingredients of utility, pleasures and pains. He
concludes it is anticipation like consumption was an important source of pleasure and pain. By
including expectations in the discounted utility theory, Lowenstein (1987) made a modification.
He used terms like savouring to refer the positive utility gains from anticipations of the future
and dread for the negative utility derived as a result of the anticipations (cited on Cole, et al.,
2010).
There are three components to expected utility: the prospect or possible outcomes, the
likelihood of prospect, and the utility (or desirability) of the prospect. Possible outcomes were
depicted in terms of aggregate wealth from the inception, but alternatives to aggregate wealth
such as, income or consumption now are used in the literatures (Hurley, 2010). The utility gain
as a result of a particular outcome is a widely used approach for measuring individual risk
perception. Combining the three components altogether, expected utility can be given as,
( ) ∫ ( )
( ⁄ ) , where c is a continuous random variable with a bundle of mutually
exclusive outcomes, x represents an individual’s choice. For a discrete random variable, the

21
arithmetic has been modified as, ( ) ∑ ( ) ( ), where ck is the kth level of
income, and pk(x) is the probability of kth level of income given choice x (Hurley, 2010).
The former characterization of risk is termed as the parameterized distribution approach
(Chambers and Quiggin (2000). The state contingent risk approach is an alternative derived
from Debreu’s (1952) and Arrow’s (1953) characterization and for a continuous random
outcome further represented as, ( ) ∫ ( ( ⁄ ))
( ) where c(x| s) is the level of
income for choice x conditional on outcome s; and ( ) is an individual’s subjective anticipation
about the likelihood of outcome (ibid).
The subtle distinction in interpretation between the two approaches bases on to how an
individual’s perceptions of the likelihood of chance outcomes are characterized. The
parameterized distribution approach characterizes an individual’s perceptions over the
outcome, crop income for instance even though the variation in crop income may depend
crucially determined by the likelihood of adequate rainfall. The state contingent approach
signifies the perceptions over the chance of adequate rainfall rather than crop income. The
basic idea is that individual choices cannot affect the likelihood of chance outcomes in a state
contingent world, while choices determine the likelihood of chance outcomes in the
parameterized distribution world (ibid).
The other simple model given by (Dercon, 2008) explains the risk exposure and behavior of
households. The household makes optimal decisions by maximizing the inter-temporal additive
utility explained by instantaneous utility (v), which further depends on the rate of time
preference and the discount rate for future utility. Risk aversion is assumed and that given the
risk and its occurrence at time (t), the inter-temporal utility is described as expected benefits
over the remainder of the household’s lifetime.
[ ∑( ) ( )
]
The underling theory is that the household owns assets (At) and reaps an income of (Yt). The
household makes a choice on his consumption (Ct) and the saving of the next period (At+1).

22
With the choice on the technology (Xt+1) combined with (At+1), offers him an income of (Yt+1)
in the next period with a particular risk distribution.
( )( )( )
The decisions on the technology (Xt+1) and saving (At+1) have to be taken before the risk
exposure, and affect the income distribution of the household. Hence, such actions commonly
termed as risk management strategies.
Risk preference
Measuring risk perception, whether an individual is risk averse, neutral or preferring depends
on the shape of their utility function U(c) (Hurley, 2010). For risk averse persons, first utility
increases with income to certain level and latter is bends downwards (Harwood et al., 1999).
The utility function is strictly increasing and in arithmetic terms, the first derivative of the utility
function, ( ) It implies that individuals always prefer more to less and a positive
marginal utility (i.e., the change in utility given a change in income). An individual is called risk
averse if the utility function is increasing at a decreasing rate having a strictly concave curvature
and a decreasing marginal utility, ( ) . For a risk neutral decision maker the utility
function is increasing at a linearly constant rate and a constant marginal utility, ( ) . A
decision maker is risk loving if the utility function is increasing at an increasing rate with the
shape of the curvature being convex and an increasing marginal utility and where, ( )
(Hurley, 2010).
The two popular and widely used alternatives to the risk premium for characterizing risk
attitudes in many economic literatures are the Arrow-Pratt coefficients of absolute risk aversion
( ) ( )
( ) and relative risk aversion ( )
( )
( ) (Arrow, 1954 and 1970; and
Pratt, 1964 cited on Harvey, ). Positive values for the ARA and RRA indicate risk averse
attitudes, zero values mean risk neutral attitudes, and negative values imply risk loving
attitudes. For the reason that both of these coefficients of are dependent on income, this has
further led to different demarcations on risk aversion. The first being Increasing Absolute Risk
Aversion (IARA) and in this case the first derivative of the coefficient of absolute risk aversion is
positive: ( ) ). Constant Absolute Risk Aversion (CARA) refers to when ( )
23
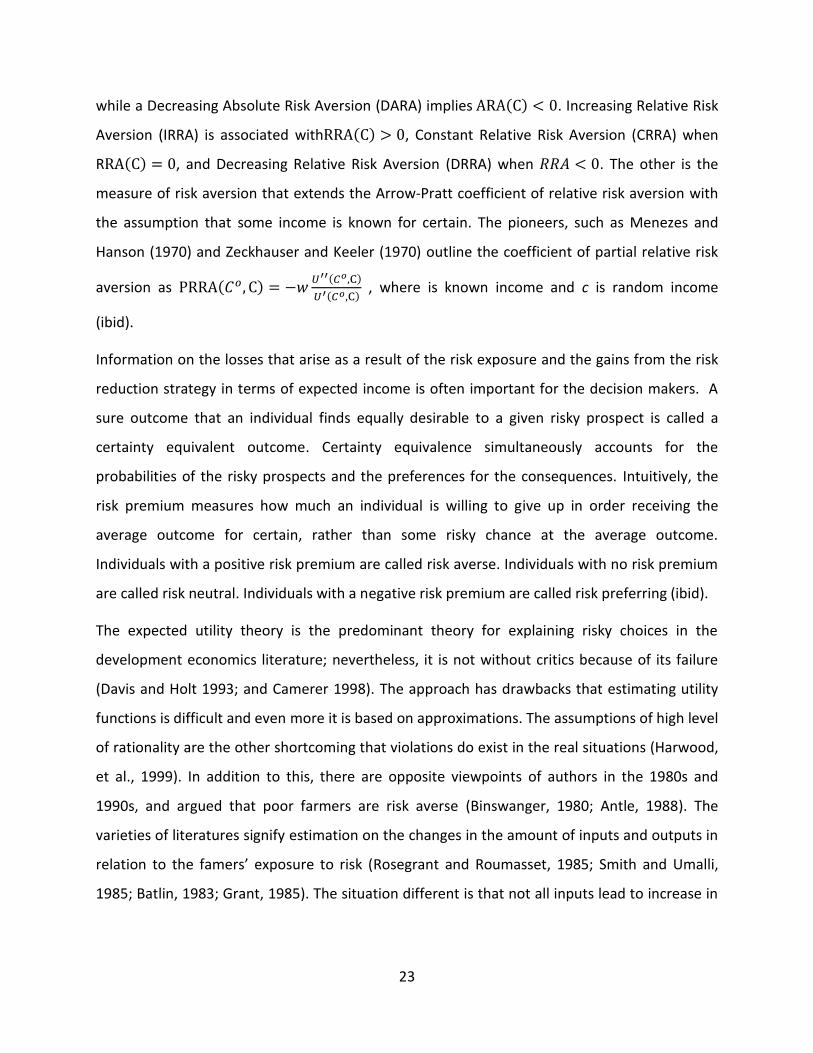
while a Decreasing Absolute Risk Aversion (DARA) implies ( ) . Increasing Relative Risk
Aversion (IRRA) is associated with ( ) , Constant Relative Risk Aversion (CRRA) when
R ( ) , and Decreasing Relative Risk Aversion (DRRA) when . The other is the
measure of risk aversion that extends the Arrow-Pratt coefficient of relative risk aversion with
the assumption that some income is known for certain. The pioneers, such as Menezes and
Hanson (1970) and Zeckhauser and Keeler (1970) outline the coefficient of partial relative risk
aversion as ( ) ( )
( ) , where is known income and c is random income
(ibid).
Information on the losses that arise as a result of the risk exposure and the gains from the risk
reduction strategy in terms of expected income is often important for the decision makers. A
sure outcome that an individual finds equally desirable to a given risky prospect is called a
certainty equivalent outcome. Certainty equivalence simultaneously accounts for the
probabilities of the risky prospects and the preferences for the consequences. Intuitively, the
risk premium measures how much an individual is willing to give up in order receiving the
average outcome for certain, rather than some risky chance at the average outcome.
Individuals with a positive risk premium are called risk averse. Individuals with no risk premium
are called risk neutral. Individuals with a negative risk premium are called risk preferring (ibid).
The expected utility theory is the predominant theory for explaining risky choices in the
development economics literature; nevertheless, it is not without critics because of its failure
(Davis and Holt 1993; and Camerer 1998). The approach has drawbacks that estimating utility
functions is difficult and even more it is based on approximations. The assumptions of high level
of rationality are the other shortcoming that violations do exist in the real situations (Harwood,
et al., 1999). In addition to this, there are opposite viewpoints of authors in the 1980s and
1990s, and argued that poor farmers are risk averse (Binswanger, 1980; Antle, 1988). The
varieties of literatures signify estimation on the changes in the amount of inputs and outputs in
relation to the famers’ exposure to risk (Rosegrant and Roumasset, 1985; Smith and Umalli,
1985; Batlin, 1983; Grant, 1985). The situation different is that not all inputs lead to increase in
24
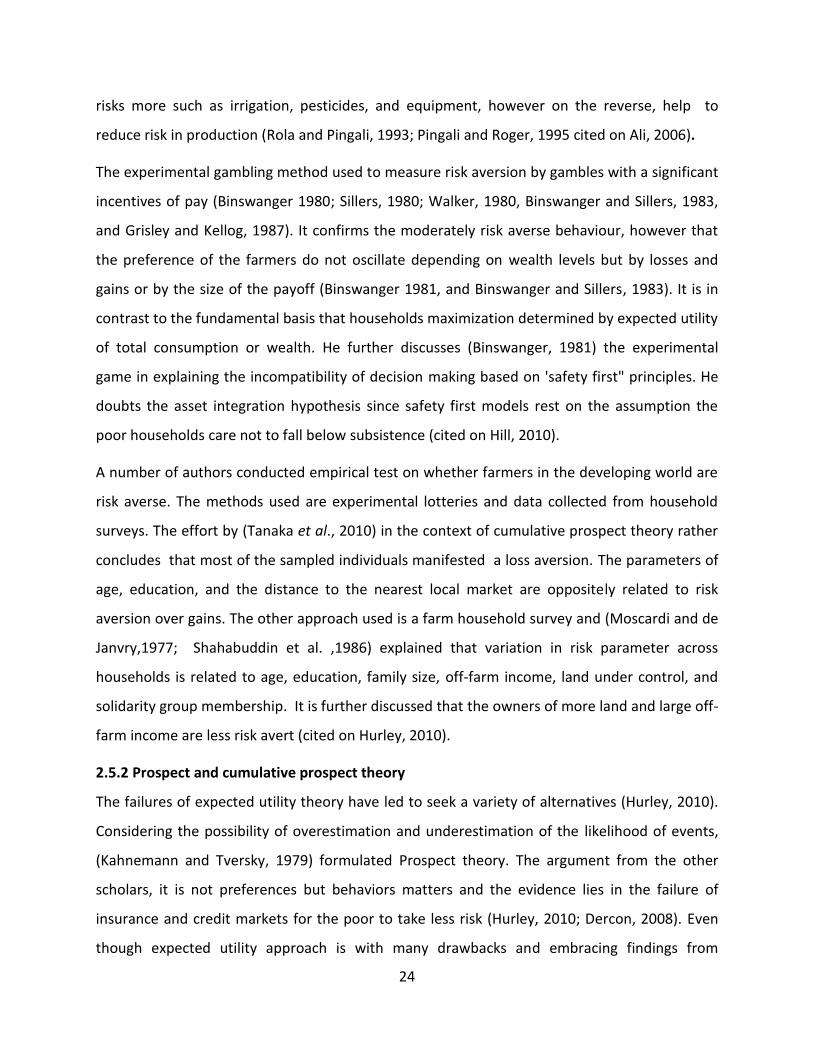
risks more such as irrigation, pesticides, and equipment, however on the reverse, help to
reduce risk in production (Rola and Pingali, 1993; Pingali and Roger, 1995 cited on Ali, 2006).
The experimental gambling method used to measure risk aversion by gambles with a significant
incentives of pay (Binswanger 1980; Sillers, 1980; Walker, 1980, Binswanger and Sillers, 1983,
and Grisley and Kellog, 1987). It confirms the moderately risk averse behaviour, however that
the preference of the farmers do not oscillate depending on wealth levels but by losses and
gains or by the size of the payoff (Binswanger 1981, and Binswanger and Sillers, 1983). It is in
contrast to the fundamental basis that households maximization determined by expected utility
of total consumption or wealth. He further discusses (Binswanger, 1981) the experimental
game in explaining the incompatibility of decision making based on 'safety first" principles. He
doubts the asset integration hypothesis since safety first models rest on the assumption the
poor households care not to fall below subsistence (cited on Hill, 2010).
A number of authors conducted empirical test on whether farmers in the developing world are
risk averse. The methods used are experimental lotteries and data collected from household
surveys. The effort by (Tanaka et al., 2010) in the context of cumulative prospect theory rather
concludes that most of the sampled individuals manifested a loss aversion. The parameters of
age, education, and the distance to the nearest local market are oppositely related to risk
aversion over gains. The other approach used is a farm household survey and (Moscardi and de
Janvry,1977; Shahabuddin et al. ,1986) explained that variation in risk parameter across
households is related to age, education, family size, off-farm income, land under control, and
solidarity group membership. It is further discussed that the owners of more land and large off-
farm income are less risk avert (cited on Hurley, 2010).
2.5.2 Prospect and cumulative prospect theory
The failures of expected utility theory have led to seek a variety of alternatives (Hurley, 2010).
Considering the possibility of overestimation and underestimation of the likelihood of events,
(Kahnemann and Tversky, 1979) formulated Prospect theory. The argument from the other
scholars, it is not preferences but behaviors matters and the evidence lies in the failure of
insurance and credit markets for the poor to take less risk (Hurley, 2010; Dercon, 2008). Even
though expected utility approach is with many drawbacks and embracing findings from

25
Behavioral economics has not been well incorporated though there are cautious reasons not to
rush into this approach since is drawing attention away from the bread and butter of the
economist (Dercon, 2008).
The notions of prospect and cumulative prospect theory are built on expected utility theory to
account for four observed regularities: (i) risk averse behavior for likely gains, (ii) risk preferring
behavior for unlikely gains, (iii) risk averse behavior for unlikely losses, and (iv) risk preferring
behavior for likely losses (Tversky and Kahneman 1992). These approaches further augmented
the expected utility theory in four ways (Hurley, 2010).
First of all, a reference point is set (eg. cr > 0) and in which the shape of the utility function is
assumed to base on. Secondly, the underlying assumption is a situation where the marginal
utility is increasing at a decreasing rate above this reference point and at an increasing rate
below it (e.g., U’’(cr + Δc) < 0 and U’’(cr - Δc) > 0 for Δc > 0). Intuitively, the assumption is that
preferences depend on whether an individual frames the risk in terms of a gain (above) or loss
(below). Thirdly, the marginal utility is assumed to rise up at an increasing rate faster below the
reference point than it is increasing at a decreasing rate above the reference point. The
situation explains that losses are more salient than gains as commonly referred to as loss
aversion. Fourth, the weighting of the probability of an outcome is made before summing up
with the utility of the outcome. The value of a choice defined by cumulative prospect theory
can be given as, ( ) ∫ ( )
( ⁄ )
∫ ( )
( ⁄ )
, where
( ⁄ )
and
( ⁄ )
are the probability weighting functions for outcomes below
and above the reference point; w- (0)= w+(0)=0; and w-(1)=w+(1)=1 (Davies and Satchell 2004).
The weighting functions address individual’s perception that unlikely outcomes are more
common and likely outcomes are less common than in reality. The key difference pertinent to
prospect and cumulative prospect theory is the approach how probabilities are weighted. For
prospect theory, weights merely rely on the likelihood of an outcome rather than the
cumulative likelihood of an outcome (ibid). p28 both prospect and expected utility, pp18
irrigation.

26
2.6 The Farm household model
The consumer worker model explains that with the inputs of land and labor, the farm
household produces output (Q)= f(A, L). The cost of labor used in production equals (wl) and
the household supplies a certain labor time and earns income (wL). The maximum consumption
is equal to the income from the total time worked and the profits from production. The utility
of the household can be given as,
( )
∑
Where, xi -the quantity consumption, T-L- leisure, pi -denotes price of the output, π- profits, w-
the market wage and T- total time. Introducing the Lagrange multiplier, the utility from
consumption of the good, leisure and labor determine the household decisions.
If separability holds, the household’s production depends on profit maximization objective and
independent of the utility function. This means that the production of output or supply of labor
depends on the labor market. In perfect markets, production decision neither depends on nor
determined by the consumption of the households (Fig. 3 production under perfect markets).
Ou
tpu
t
Slope
Family L Farm L Labor
(Π+w)/p

27
The decision of the households is determined by the exogenous changes in wages and price of
the output. The difference of family labor and farm labor is the labor work off farm. The
responses can be examined as a substitution effect between leisure good and consumption
good. Higher wages lead to less leisure and consequently more supply of labor by the
household and also results in more consumption. As the price of the output raises up use of
farm labor, production and profit increases. In addition income effect, asset effect and profit
effect explain different outcomes.
The existence of imperfect labor markets is characterized by the situation where the household
neither sells nor buys labor. The slope of the line connecting the curves of output indicates the
shadow wage of labor. It is not the market wage that determines the household labor supply
and demand of the household. The shadow wage determined by preferences, technology and
inputs. Thus, production decision is endogenously determined by the households in developing
countries (Fig. 4 production under imperfect markets).
Market participation
Market participation involves transaction cost. Higher transaction cost widens the price band
that it lowers the selling price and raises the buying price. The price with which the household
to sell is equivalent to Pim-ti
ps and for the buyer, Pim-ti
pb. Where, Pim is the market price, ti
ps and
tipb , is the proportional transaction cost for the seller buyer, respectively. A wide price band is
a typical market inefficiency existent in developing countries due to infrastructural problems,
imperfect information and market contracts.
Farm L= Family L
shadow
Ou
tpu
t (Q
)
Labor

28
The maximum utility, max U( x1,…., Xn, T-L) is derived by the household selling the output and
that of leisure. The consumption and market surplus depend on the output from the land and
using labor (l). The households utility is determined by the consumption (Xi) and the marketable
surplus (mi). Maximization with the Lagrange multiplier, setting the constraints and transaction
cost, the first order condition of the utility given by,
(
(
) ∑
∑
(
(
) ∑
∑
(
∑
( ∑
))

29
III. DESCRIPTION OF THE RESEARCH AREA
The Ethiopian Rift constitutes part of the Great East African Rift Valley, which is also called with
another name, the Afro-Arabian rift. It stretches from the country of Jordan in the Middle East,
over the Eastern Africa to Mozambique in Southern Africa while in Ethiopia, it includes the
region from the Kenyan border up to the Red Sea and splits the Ethiopian highlands into a
northern and southern halve (fig 5. Map showing the Ethiopian Rift Valley).
The Central Rift Valley (CRV) is located in the East Shoa administrative zone of the Oromia
region. The three counties of the study area Adami Tulu, Dugda and Adama belong to this zone.
The Central Ethiopian Rift valley is characterized by its chain of lakes that are found in the
region and includes Lake Ziway, Lake Abiyata, Lake Langano and Lake Shala (Huib & Herco,
2006)

30
Lake Ziway receives its water from two main tributaries i.e. from Meki River and the Katar
River. Lake Ziway is connected with Lake Abiyata through the Bulbula River. Lake Langano is
connected with Lake Abiyata through the Horakela River. Lake Ziway is the centre of
agricultural development (Hengsdijk and Jansen, 2006; Assefa, 2008) (Fig 6, the Central Rift
Valley of Ethiopia).
Climate
The climate in Ethiopia in general is characterized as one of the most variable rainfall patterns
that form a natural part of farming in the world. It is indicated that the incidence of drought is
as frequent as every 3-4 years in the northern and 6-8 years in other parts of the country (1986)
(Diga, 2005; Makombe, et al., 2007; Awulachew and Menker, 2007). The rainfall has large
spatial and temporal variability and it is largely determined by altitude, areas above 2500m may
receive 1400-1800 mm y-1, mid-altitude regions (600-2500 m) may receive 1000-1400 mm y-1,
and coastal lowlands generally receive less than 200 mm y-1 (Diga, 2005).
In the CRV, the climate also varies significantly with altitude and is generally characterized by
warm, wet summers (with most of the rainfall occurring from June to September) and dry, cold,

31
and windy winters. The main rainy season accounts for 70-90% of the total annual rainfall
(Meshesha, 2010; Hengsdijk and Jansen, 2006; Assefa, 2008). Mean annual rainfall varies in the
valley from approximately 500 mm (weather station at Lake Langano) and 650 mm (weather
station Lake Ziway) to 1150 mm on the plateau. The length of the rainy season varies from
place to place (Diga, 2005).
Irrigation infrastructure
In the country in general, the coverage of the traditional small scale irrigation is about 250,000
hectares and that of the modern small irrigation is utilized for an additional 21,000 hectares of
land. The medium or large scale schemes cover 97,000 hectares of land (Awulachew and
Menker, 2007; Tilahun and Paulos, 2004; MOFED 2006). The estimation results shows the yield
gap between rain-fed and irrigated cereals has an approximation of 40 percent, more
advancement of yields with the irrigated production (Awulachew and Menker 2007; Spielman,
2008)
With regard to the CRV, the total irrigated area is around 12,000 ha and about 500 ha are
closed irrigated production systems and the rest are open irrigation systems. The irrigated
areas are sustained by water coming from Lake Ziway contributes 31 percent, Ketar River 27
percent, groundwater 25 percent and Meki River 11 percent. According to (Jaleta, 2002), about
49 percent of the Adami Tullu-Jiddo Kombolcha Woreda district equivalent to 140,300 ha is
cultivated. Out of this area, 1,267 ha or 1.85 percent is being irrigated (Hengsdijk and Jansen,
2006; Assefa, 2008).
Crop production
The most common farming system in the CRV is the small mixed rain-fed production system
consisting of grain crops and livestock. Cultivated land is mostly located in the valley floor and
major field crops are teff, barley, maize, lentils, horse beans, chickpeas, and field peas. Most of
the arable land is covered, in decreasing order, by teff, barley, maize, and wheat grains (Legesse
and Ayenew; Hengsdijk and Jansen, 2006; Meshesha, 2010). The main cash crops grown in the
region are vegetables such as, onions, tomatoes, haricot beans and cut flowers, mainly roses.
Some vegetables are grown during the rainy season (Moti Jaleta, 2002), but most of the haricot

32
beans production for export to the EU takes place from October to April (Hengsdijk and Jansen,
2006) (fig 7, tomato production in the CRV).
3.1 Potentials in the CRV
The central rift valley (CRV) is typically known for its diverse lakes such as, Ziway, Langano,
Abyata and Shala. The Lakes of Abyata and Shala have important scenic features constituting
the Abyata- Shala Lakes National Park (Hengsdijk and Jansen, 2006). The lakes also can support
for commercial fishery production. In the eastern border of the CRV and in the upper awash
basin, the river called Awash has been widely exploited for irrigation in the areas of Wonji and
Melkasa, the other study area potential for the production of fruits and vegetables.
Studies mention that in the CV, there is a considerable potential for increasing productivity of
the farmers by provision of improved technologies (material and knowledge). One of the
potential is the existence of the most fertile soils, such as the mid Meki-valley and with the
access the micro irrigation and water harvesting techniques, it can serve form a base for an
intensive cropping system (Diga, 2005). Furthermore, the region is known for its suitable
climatologic and socio-economic conditions. The incentives coupled with the GoE’s agricultural
and investment policies; recently the region is attracting a number of investors of both national
and foreign origin in large scale horticulture and floriculture and has been settling down in the

33
area. It is expected that these activities in the region will attract people from other parts of
Ethiopia, associated to domestic water demand (Hengsdijk and Jansen, 2006).
The smallholders are often organized in Peasant Associations (PAs) and they run irrigation
schemes collaboratively. The cooperative called Woyo Seriti Gebreal is multipurpose
cooperatives operating in Dugda Bora woreda. This cooperative is engaged in managing of a
pump irrigation scheme that supplies water from Lake Ziway for the production of cash crops
(onions, chilis, and tomatoes) that could be sold in the neighbouring of Ziway-Meki market
shed. The Oromia Development Association (ODA), a local NGO provided the cooperative with
a small pump and other equipment needed. This multipurpose cooperative also involves in
provision of inputs, such as seeds and fertilizers, collective marketing of output, and a maize
seed multiplication project. The Woyo Seriti Gebreal is growing time to time and is becoming an
invaluable asset for the Meki-Batu Cooperative Union. According to this study, all of the
cooperatives combine irrigation schemes with cash-crop production and collective marketing
(Spielman and Kelemework, 2008).
The central role of irrigated agriculture within the context of recurrent drought and famine is
also well understood in Ethiopia (MoWR, 2002). The Ministry of Agriculture (MoARD) has
incorporated the new approaches into the agricultural policy i.e. stimulating irrigated open field
vegetable and fruit production. The ministry has identified so called “growth corridors” in
Ethiopia based on agricultural potentials and market opportunities. Green bean is one of the
priority crops within the CRV, while also a variety of fruit crops has been identified (Hengsdijk
and Jansen, 2006).
3.2 Challenges in the CRV
The population in the CRV has increased rapidly in the last decades due to natural population
growth and migration to the CRV from other regions. The corresponding average growth rate is
3.15 and this has been discussed to be one of the obstacles for economic development of the
basin. As a result, an increase in animals and causes overgrazing in many parts of the CRV and
pressures on land increase (Scholten, 2007) and lowers holdings per households ((GIRDC and
MoWR, 2009). An average land holdings is about 0.5 but farmers need to invest to increase
productivity and is low (Jansen et al., 2007; Meshesha, 2010; Ayenew, 2004). The open field

34
smallholder vegetable and fruit production systems are much smaller, often less than 0.5 ha
(Jansen et- al., 2007).
In Sub Sahara Africa (SSA), CRV is a place where poverty and degradation of natural resources
intertwined. The region is one of the most environmentally vulnerable areas in the country
pressure far-reaching consequences for the ecosystem (Ayenew, 2004). The highlands where
major feeder rivers originate are highly cultivated and the deforestation rate is growing every
year, so that the sediment yield to the lakes from these rivers is substantially high (Abraham,
2006). Lack of proper land use management systems in the valley, naturally vegetated areas are
increasingly being converted to agricultural land (Legesse et al., 2004). Trees are cut for
construction, direct fuel, and production of charcoal which is an important source of additional
income for local farmers (Bekele, 2003; cited on Meshesha, 2010).
As the consequence of the pressures in the CRV, hydrological and environmental impacts
accumulate. Therefore, any decrease of the inflowing water discharged from Lake Ziway to Lake
Abyata will have a direct environmental impact. The size of the lakes is subject to decline and
any additional water extraction by the floriculture sector will increase the pressure on the
scarce water resources in the area. Currently, water is used in the CRV without planning or
regulation and without monitoring. The current rates of abstraction in the CRV are
unsustainable and therefore any greater abstraction will simply make the situation worse
(Ayenew, 2007).
Considering the inefficient furrow irrigation systems currently used in horticulture, options to
reduce irrigation water should be identified, such as changes in the irrigation system for
example, the introduction of sprinkler or drip irrigation systems, as well as improvements in
water management ('software') (Hengsdijk and Jansen, 2006).
3.3 Status of formal insurance in Ethiopia
Both formal and informal insurance mechanisms are inefficient because of credit constraints,
information asymmetries and commitment failures (Deaton, 1990, Fafchamps, 1992, Kurosaki
and Fafchamps, 2002). It is also mentioned that the safety nets may contribute a limited
support (Jayre et al., 2000; Dercon and Krishnan, 2003; Dercon 2004 cited on Falco and Chavas,
35
2007). The role of formal insurance is very limited in Ethiopia with no exception due to
imperfect information, capability of the farmers, and quantification of the losses, covariate
shocks, recurrent drought and costly insurance policy, insurability of risks and lack of re-
insurance.
Currently two agricultural risk management structures are designed at the farmer or micro level
and at the government or macro level to tackle the existing challenge of in agriculture in
Ethiopia. The state-owned Ethiopia Insurance Corporation (EIC) implemented the micro level
weather insurance with its plans and launching a small pilot weather insurance program for
farmers growing wheat and pepper in southern Ethiopia. The previous approach of the EIC
effort to deliver agricultural insurance for farmers was not much successful and with the new
approach the EIC is keen to explore new potential products to address the risks of larger,
commercial farmers (World Bank, 2005).
Facilitation of ex-ante risk management with a purpose to relief vulnerable groups affected by
the recurrent and catastrophic droughts is the objective of the macro level pilot project. The
effort is to implement and integrate the risk management program with the national and long
term platform of fighting poverty in Ethiopia. In the short term, the shortcomings associated
with the proposed risk management frameworks is the inadequacy of weather observing
networks and the available weather data. With the micro level project, also it is possible to
reach farmers who live near good weather stations and that the rest majority of the farmers are
excluded. In addition to this, the challenge with the EIC may be the difficulty of further pooling
of the risk with reinsurers until the quality and security of the NMSA network improves (ibid).
At the macro-level consideration, the designing of protection using the data from weather
stations has to be in the strict adherence to the quality requirements of the international
weather market. The other constraint relevant for the macro-level weather-risk transfer is that
the involvement of fiscal issues: namely, the ability of the government of Ethiopia eventually to
take over the ex-ante funding of the emergency relief operations program. It is also includes
taking responsibility for the premium payments necessary to establish and maintain this
funding mechanism (ibid).

36
IV. THE RESEARCH METHODS
4.2 Data Collection
Primary data
The collection of primary data was carried out with a household survey in the risk prone central
rift valley region. The data collection includes the household and farm characteristics that are
presumed to affect the practicing of risk strategies. The variables are: age of the farmer,
experience in farming activity, attained formal education level and size of the family are under
the household characteristics. The farm and production characteristics such as, size of land
holdings, production of cereals and vegetables, inputs of irrigation water and distance from the
accessible water are included. The market characteristics such as, distance from the market,
market channels, information sources, reliability of information and etc... are considered.
Production and Market Risks
In these category the exogenous production and marketing shocks, which has occurred in the
past three five years has been surveyed. Production risk occurs as a result of droughts, damages
of by insects and diseases. The occurrence has been recorded whether farmers faced a loss of
yield a consequence and the magnitude of the loss estimated based on the Likert scale in
linguistic terms, (Absolutely low, Low, Medium, High , Absolutely High ). The other important
risk is related to marketing that the occurrence and the magnitude were gathered in similar
manner.
Risk management mechanisms
In the survey, data collection also involves the risk response strategies utilized by the farmers to
cope up with the risks. The activities such as, early and delayed planting, use of resistant crops
and varieties, cultural practices, diversification and seasonal operations has been considered.
Supplementary to this, information about framers’ attitudes and involvement in market
cooperatives and unions has also been also been gathered.
Secondary data
To support the result of this research and to apprehend the complex interrelated and
interconnected socioeconomic constraints in the RRV, secondary literature sources were

37
reviewed. In this part, the results of research in water resources, natural resource
management, cooperatives has been entertained. Furthermore, focuses by the government,
priorities and policies are discussed.
4.3 Delineation of the area and Sampling procedure
Sampling of the locations
The sampling involves a multistage sampling that first, after delineating the area in the CRV,
three counties were selected by a judgment sampling based on their access to and proximity to
irrigation facility. Secondly, in the three respective counties in the CRV, three Kebeles were
selected in the same way by the use of a purposive sampling technique with the cooperation
and information provided by the Woreda’s Agricultural Bureau extension experts (WADB).
These locations selected for the survey constitute the Counties of Adami Tulu (Ziway), Dugda
(Meki) and Adama (Awash Melkasa) and namely, Edo Gejola, Tepo Cheroqe and Waqemiya
Tiyo, respectively.
Selection of the households
After the selection of the locations, the selection of the farmers was done by a stratified
sampling of users and non-users of irrigation followed by a simple random sampling (lottery)
method to pick the respondents from each strata. As to my previous expectation and
information, the development agents responsible in each of the areas own a long list of the
farmers of both the categories and so the sampling was made out of these lists. In addition,
they also gather some of statistical data that contribute to reports at the national level. Thus,
the total number of households selected for this research is about 232, out of which 116
households are users and the rest half of them are non-users of irrigation.
4.4 Data Analysis and Empirical models
Market and production risk
In the survey farmers were asked whether they use the strategies towards the respective risks.
A set of these ex-ante strategies are considered to examine their risk prevention options in the
absence of insurance coverage and with the access to irrigation or without such a facility. Such
types of decisions often have a form of a binary choice and could actually be tested with the
econometric Probit model. However, categorization of farmers into strategy groups helps for

38
testing ways of selection and mixing up of the strategies. For a purpose of condensing among
various mechanisms that help in reducing both production and marketing risks, a cluster
analysis has been carried out.
Cluster analysis
Cluster analysis is a statistical technique that sorts observations into similar sets or groups
(Ketchen, 1 996). Cluster analysis involves a broad suite of techniques designed to find groups
of similar cases within a data set. Hierarchical clustering methods produce a hierarchy of
clusters from small clusters of very similar cases to large clusters that include more dissimilar
cases. Hierarchical methods usually produce a graphical output known as a dendrogram or tree
that shows the hierarchical clustering structure. Oftenly, the primary goal of a cluster analysis is
to determine the number of groups (Holland, 2006).
With the use of a cluster analysis on a panel data, (Van den Berg, 2010) found out the impact of
hurricane on livelihood strategies in Nicaragua. The households first are grouped into different
livelihood strategies and later into welfare categories based on their asset allocations before
and after the calamity. After clustering of a large mass of data, a multinomial Logit model has
been employed to examine the determinants of livelihood strategies. With the use of Wards
linkage of hierarchical clustering, the group of clusters has been formulated with the help of a
dendrogram. After determining the number of groups, kmeans clustering was carried out to
classify based on the distance of the means.
Econometric model
The dependent variable derived from the cluster analysis is a categorical variable with multiple
outcomes. The independent variables that have an influence in the adoption of the risk
strategies include household, farm and market characteristics.
The model has a form, = f(experience in farming activity, family size, education level of the
farmer, total farm size, use of irrigation facility and distance from the nearest market).
Where, represents the cluster variable containing groups of the latent variables, category A,
category B and category C.
39
The categories represent the farmers with similar response strategies against production and
market risks, xi represent the independent variables and p refers to the probability of observing
that the household group use a strategy or not. To analyze the factors influencing the adoption
of several strategies or farmers to be in the cluster group associated with more strategies or in
the less strategic group, a multinomial probit model has been chosen. The choices depend on
the individual farmers and the definition of the model given as (Kobayashi, 2001),
Market risk
To analyze the determinants of adoption of ex-ante risk response mechanisms against market
risk, a multivariate and individual probit model has been employed. With a multivariate probit
model (Lansink, V.d Berg and Huirne, 2003) analysed the influence of the characteristics of the
farmer (e.g. age and attitude to risk) and characteristics of the current farm on the conception
and implementation strategic planning.
The risk response methods of adoption has a discreet values, the probability of choosing the
strategy is given by, * +⁄ ( ) and the determinants, (age, experience, size of
holdings, education, family size, use of irrigation, distance to the market). Where, represent
the strategy for reducing risk, stand for the independent variable and p refers the probability
of observing that the household uses a strategy or not.
The standard normal distribution function, Probit model and multivariate probit models have
been chosen and the estimation proceeds with a Maximum Likelihood procedure (Verbeek,
2008), ( ) ∫
√
{
} . The estimation with the multivariate probit follows

40
the same procedure except that the number of binary dependent variables to be estimated are
more than one and estimated simultaneously, .
The same method has been applied on all the strategies except, the frequency of marketing
which will take a different form. The mechanisms to cope with market risk includes use of early
and delayed planting, frequency of sell, crop diversification and selling to unions.
Frequency of sell
The dependent variable is different from the binary responses having a multiple response with
ordered outcomes, which can be explained by the Ordered Probit or Ordered Logit models. In
this paper, Ordered Probit model has been utilized and arithmetically,
,
Where, represent the cut off points of the outcomes (Verbeek, 2008). The
outcomes includes selling of weekly or less, every two weeks, every month, every three
months, every six months and once in a year.
Production risk
With a multivariate Probit and individual probit models, the same analysis was conducted to
examine determinants of adoption of risk strategies against production risk. Under this risk,
rainfall shock and damages caused by pests has been considered. Planting of diversified crops,
use of resistant crops or varieties of crops and crop rotation are strategies for reducing risk in
production.
Offseason diversification
To analyze the factors contributing for the participation of the farmers in the off season
vegetable production and to determine the factors affecting the size of the produce a Heckman
selection model will be used. The design of the sampling for this research involves the
stratification of farmers into users and non-users of irrigation. The selection problem results in
a truncation on half of the overall sampled population. The amount of supply obtained on

41
average of the three years is associated with those who have produced vegetables with the
access to irrigation.
The estimation of the factors influencing the supply of vegetable produce has been done the
Heckman selection model and the supply equation with the existence of selection bias can be
given as, * + ⁄ * ⁄
( )
( )
Where, is the amount of vegetable supplied to the market, are independent variables and
stands for the selection variable. In the right hand of the second equation, the inverse Mill’
ratio captures the sample selection bias, also referred to as Heckman’s lambda. Hence, the
estimation is performed with a two-step procedure, the selection and the OLS on the main
equation (Verbeek, 2008). Thus, the second equation represents the selection for participation
in vegetable marketing in the offseason.
The independent variables include experience in farming activity, family size, education level of
the farmer, education of the wife and total farm size. The stratification of farmers during
sampling procedure was based on the use of irrigation water and as a result a selection bias is
existent for the participation farmers in production and supply of vegetables. The participation
is explained by the distance to market, distance to accessible irrigation and age of the farmer.

42
V. RESULTS AND DISCUSSION
5.1 Description of the data
As discussed before, random samples of households were selected in three locations in the
central rift valley region. The same proportion of households were included in the sampling
both users and non-users of irrigation for comparison. The result from the survey has been
discussed in two sections with a descriptive and statistical analysis as presented below.
Household Characteristics
The result from the survey shows that the larger proportions of the households are led by
males while the rest are led by females. Thus, genders’ role in agricultural productivity and in
farm decision making is not negligible focusing on women as leaders of the family. It calls for
inclusiveness of women in provision of technologies and training programs risk management
(appendix1, proportion of household heads).
Table 1. Age and experience in farming activity of the household heads
Age Frequency Percent Experience Frequency Percent
21-30 36 15.5 1-10 30 12.9
31-40 94 40.5 11-20 102 44.0
41-50 54 23.3 21-30 53 22.8
51-60 30 12.9 31-40 34 14.7
61-70 13 5.6 41-50 9 3.9
71-80 3 1.3 51-60 3 1.3
81-90 2 0.9 61-70 1 0.4
Total 232 100 Total 232 100
Mean 42.01 Mean 22.50
SD 11.88 11.27
The age of the farmers affects the farming operation both in the physical efforts and decision
making process because of the correlation to experience on the occupation. It may have both
positive and negative effect. Farmers experience in farming activity is believed to have a
considerable influence in decision making process that farmer to farmer learning or farmers by
themselves discover on their own practices. The direct experience on the farm enables farmers

43
to solve their problems and by observing the past and the present they make decisions for the
future. Thus, the age distribution also shows that the majority of the household heads are
adults between thirty one to fourteen (31-40) years and also there are farmers who are older
than seventy one (71) years. The large proportion of the households have an experience of 11-
20 years by being engaged in farming activities.
The size of the families is the other importance household factor to influence in the operation
of the farm and decision making. As the size of family grow more the growing demand for food
is obvious and in turn significantly determine production and marketing choices. The rural labor
demand in the peak seasons is high and that it is the major motivation to increase their family
size. However, apparently it also has an impact on the resources the household owns,
particularly the land holdings. The data shows, in most of the households the number of
families fall in the range of 5-8 and nearly 15 percent have larger than nine families. Also
Households with families of 13-20 are registered that this may be on the grounds of divorce and
polygamy, male farmers married to two or three wives. This shows that it is one of the main
challenges in raising agricultural productivity in the region.
Table 2. Family size and education of the household heads
Family size Frequency Percent Education level Frequency Percent
1-4 62 26.7 No education 100 43.1
5-8 135 58.2 Primary 99 42.7
9-12 25 10.8 Lower secondary 20 8.6
13-16 9 3.9 Higher secondary 13 5.6
17-20 1 0.4 Total 232 100
Total 232 100 Mean 1.77
Mean 6.22 SD 0.83
SD 2.89
Education of the farmers also affects in choosing activities, gathering of information, adoption
of technologies, risk management methods and so on. In the CRV, the majority of the
households have no formal education followed by those who possess only primary education.

44
Only few of the farmers have higher level secondary education, whereas none of the household
heads possess tertiary level of education.
Farm Characteristics
Small family farms are predominant in the area that the largest number of the farmers acquired
less than three hectares. Based on the other question included in the survey and as shown in
the second table, most of the households report that they do not possess adequate land to
support their life and that of their families. A number of farmers reported the lack of access to
land and small number of farmers have adequate access to land. The information is more or
less similar synthesizing these data altogether. If the size of the holdings they own is not
adequate, they were asked how much extra land is needed by the households. Thus, most of
the farmers require additional 1-5 hectares of land.
Table 3. Land holdings of the households
Size of the family Frequency Percent
0-3 185 79.7
4-7 38 16.4
8-11 8 3.5
12-15 1 0.4
Total 232 100
Mean 2.35
SD 1.97
Production characteristics
The mean cereal production is 17.2 quintals and that of the vegetable produce is 31.8 and the
mean livestock holding is 8.4 per households. Quite a few of the farmers do not own livestock;
rather they combine with cereal or with vegetable production or the combination of the three
activities. Most of them produce 21-41 quintals of cereals on average in three years and 1-33
quintals of vegetables. The orientation of irrigation towards the production of onions could be
due to the suitability of the climate and other factors. It is observed that about 40.1 percent
engaged in the production of onions in the past three years followed by the second important
crop tomato, which are 32.3 percent and also cabbage, maize and green pepper are put in
Access to land Frequency Percent
Adequate land 66 28.5
Not adequate 166 71.5
Total 232 100
Mean 0.28

45
order of importance. The larger numbers of them own 1-11 livestock. According the Oromia
region livelihood classification of households, 82.3 percent are very poor whereas only 0.4 per-
cent are in a wealthy category.
The major source of irrigation water about 59.8 percent comes from Lake Ziway and utilized in
the two of the selected locations. Awash River is also supporting the third location in the lower
part of the region. It supports 30.8 percent and a considerable number of the farmers use
ponds, whereas, a small proportion use a combination of ponds and lake. Considering the
distance from accessible irrigation water, the mean distance is 2.58 km. About 66.4 percent are
within 1-5 km from the accessible irrigation water and the rest are above this distance. Even if
the distance is short, the reliability of the irrigation water depends on the slope of their location
(appendix 2a, production characteristics).
Based on the some questions on the survey how farmers are making the decision of production
and supplying for the market, data has been analyzed for an insight of farmers’ strategic
actions. The result shows that nearly 11.2 percent of the households make the decisions of
production without considering the demand situation of the produce. Their decision also
involves less information on the supply than the demand that 23.3 percent of the farmers do
not consider it to produce.
Table 4. Farmers’ production decision
Likert scale Information demand Information supply
Frequency Percent Frequency Percent
Strongly disagree 7 3.0 7 3.0
Disagree 19 8.2 47 20.3
Neutral 22 9.5 30 12.9
Agree 148 63.8 114 49.1
Strongly Agree 36 15.5 34 14.7
Total 232 100 232 100

46
Farmers were asked their tendency of specializing in specific commodities. Out of the total
population 97.4 percent do not want to specialize in one major crop. This implies the risk
averting behavior and their preference for a tendency of diversification.
Market characteristics
Most of farmers the primary market channel for selling of cereals is trough traders followed by
retailers. For that of vegetable produce, the primary channel is via retailer and the secondary
channel is wholesaler. The primary source of information for most households is a market visit
by themselves and the next important source is from friends. The reliability of information is
more important and that the reliability is analogues to the two major information sources. The
means of transport is majorly dominated by the use of cart since getting into rural parts of the
kebeles is possible due to the flat nature of weather road. On average the large number of
households are situated between 7-11 km distance from the market and the mean distance is
5.8 k.m. Very few of them are located in the distance of 0-5 kms. As a matter of fact, these
kebeles are near to markets since the built up of irrigation was designed based on the
accessibility of the markets (appendix3a, market characteristics).
Occurrence of risk in the central rift valley region
The prevalence of production and market risk was the other data included in the survey. It
shows that a number of the farmers reported the occurrence of drought in the region followed
by this risk of crop diseases and the damage of insect pests, respectively. Price risk is also
equally important drought risk. Though they report the risk of insects and disease, it is at a
lesser extent as compared to the risk of drought and price.
Table 5. Occurrence of risk
Drought Insect Disease Price risk
Frequency Percent Frequency Percent Frequency Percent frequency Percent
Yes 154 66.4 84 36.2 95 40.9 156 67.2
No 78 33.6 148 63.8 137 59.1 76 32.8
Total 232 100 232 100 232 100 232 100

47
The estimation of the magnitude of the losses according to the farmers’ perspective at least
gives further an insight on the importance of these risks. The rating of the drought risk in Likert
scale shows that most of the farmers reported a high risk that that lead them to a high loss and
also a considerable number of farmers told an average loss. With respect to price risk, the
majority the farmers faced an average loss due to lower prices on the market. The loss as a
consequence of insects and crop diseases is an average. There is no such a very high loss as a
result of damage caused by insects (appendix 4, score of risks).
5.2 Response mechanisms against production and market risk
Description of the risk response methods
It is believed that by being exposed to risk farmers develop strategies on themselves or acquire
them through training by extension programs, farmers unions and NGOs. The most widely used
strategies are crop diversification and income diversification. There can be more than one
reason for producers to diversify their plots with different crops and that of their income
sources from other activities. One of the reasons of choosing crop diversification is to fulfill
consumption need of their families. On-farm diversification of crops is also used as strategy to
compensate losses as a result of production risk. The result of data confirms that 70.7 percent
of the farmers practice diversified planting of crops. For comparison, the proportion of farmers
using diversification for any of the reasons is about 85.3 percent. Intercropping is also a
mechanism used by farmers planting different crops on the same plot by the selection of
compatible crops (fig 8, Intercropping of maize with papaya in The CRV).

48
The other important strategy to cope up with production risk is the use of drought and pest
resistant crops. It is evidenced that 59 percent of the households in the area use this
mechanism to reduce the risks. Crop rotation is the mechanism with which farmers replenish
the fertility of the soil. In addition, farmers use this method for a purpose of reducing risk of
disease, insects and weeds. It is evidenced that the practice of rotation enables to decrease the
growth and spread of the pests because of the gap created by planting different crops in
between seasons and years. Especially, it is helpful to reduce the damage caused by host
specific pests. Accordingly, the survey shows that 74.6 percent of the farmers use this method.
Comparably, 86 percent of the farmers use rotation for any of the above purposes. Thus,
consideration of rotation for reducing risks as result of pests is realized and as well as practiced
by farmers even during the past, which they have learnt from their traditional knowledge.
Farmers also consider droughts while rotating different crops.
Minimum tillage is one of the mechanisms to deal with drought risk. Though the system
requires less energy in the operation of the farm, it needs to be coupled by the practices of
weed and pest control and crop selection. It is observed that only few farmers adopted
minimum tillage (appendix, 5c).

49
There are various mechanisms by which farmers can reduce market risk. As discussed in so far,
farmers also diversify for many reasons. The practice of diversification to cope up with market
risk could possibly have interconnection with that the motivation of mitigating production risk.
Out of the interviewed farmers, 74.6 percent use this strategy and, even more farmers consider
the strategy for a purpose of reducing market risk, as compared to production risk. Other
households also are considering it for getting different food for their families. Farmers’
engagement in early and delayed planting method has also been dealt. Only about 29.8 percent
of the farmers have shown such ex-ante strategy to reduce price risk. The frequency of
marketing data indicates that a large number of the farmers sell twice a year and almost
comparably others sell every three months.
The establishment of cooperatives in the county has been started since the previous regime
though it came up with less success due to the top down government controls. Currently, some
farmers organize themselves into smaller cooperatives and latter form unions. This is true of
mostly with vegetable producers where perishability and lack of market access are the core
challenges. Farmers could have the capability to save, take loans, get inputs and sell their
produce to the union. The role of marketing cooperatives in reducing market risk has been well
realized. Most the farmers realize the benefits of getting training in risk management and rely
on extension. The attitude of the farmers towards the benefits of unions in reducing the price
risk was also analyzed and the result shows that some of them did not realize its role at all.
Considerably, 55 percent are neutral while others have positive attitude. The data supports that
only about 25.9 percent of the farmers are members of union. The farmers who sold their
produce to the union are about 17.2 percent while some others report that they are benefited
by getting farm inputs such as, fertilizer and seeds. Farmers were asked the reason why they
are not involved in the already established unions. Thus, most of the farmers responded that
they do not have knowledge of unions to be a member of it or sale their produce with better
prices. Some of them do not have trust in it or they do not want to participate even if they have
information (appendix, 5a).
Attracted by the challenges of risks in the region some NGOs such as, FAO put an effort buying
the produce from the farmers. Therefore, about 25 percent sold cereal produce to the NGOs

50
and 13.6 percent for that of vegetable producers. Some households also sell their produce to
NGOs to hedge against risks. Cereal producers sell more than vegetable produce.
From the descriptive analysis, we see that market diversification has the highest mean value
showing that majority of the households are using this method. The other important strategy
used by most of the farmers is crop rotation. Hedging of price risk by selling to the unions is the
least adopted mechanism (Fig. 9, mean values of the risk response).
Econometric model
The main concern of this chapter is to investigate the determinant factors affecting the
strategic actions of farmers to hedge against the risks. As presented in so far, it is to find out
what kinds of responses they use and how they are combining this strategies and what factors
are influencing to behave in this way?
With the cluster analysis, three groups of farmers were identified in their responses towards
the strategies (appendix6b, dendrogram). The binary dependent variables include; planting of
resistant crops, crop diversification, crop rotation and minimum tillage for to cope with
production risk. Methods of early and delayed planting, postponement of sales, diversification,
selling to union and practice of selling in the summer time has been considered for that of
market risk.
0.17
0.75
0.75
0.71
0.29
0.59
0 .2 .4 .6 .8
selling to union
market diversification
crop rotation
production diversification
planting strategy
resistant crop

51
The analysis result shows that the first cluster group includes farmers preferring production
diversification, more frequent sells and market diversification. Farmers who adopt the
combination of more of the risk mitigation strategies against production and market risk are
classified under the cluster group two. The third cluster group contains farmers possessing
more combinations of strategies of crop rotation, resistant crop, early and delayed planting and
less frequent sales. Most of the farmers about 43.0 percent fall into the second cluster group
followed by cluster group three (36.8 percent) and cluster group one (20.2 percent) (appendix
6a, distribution of cluster groups).
Table 6. Mean values of strategies on each cluster group
Risk strategies
Farmers group
Cluster Group1 Cluster Group2 Cluster Group3
Resistant crop 0.385 0.795 0.561
Earl y and delayed planting 0.141 0.386 0.385
Production diversification 0.949 0.920 0.017
Crop rotation 0.641 0.886 0.684
Market diversification 0.910 0.943 0.210
Sales to union 0.064 0.341 0.053
Frequency of selling 3.307 3.807 4.438
For farmers in the first cluster group, the individual score of the strategies of diversification is
higher and is the dominant strategy among all. Selling to union, and early and delayed planting
have shown smaller scores for these group. Frequency of selling has a scale from 1-6 and
smaller means indicate more frequent sells. For farmers in second cluster group, most of the
strategies have the highest mean values and means that they have several strategies against
the risks. With regard to the third cluster group, they have less of both production and market
diversification strategies and also the practice of selling to unions. They prefer strategies of
crop rotation, use of resistance varieties, early and delayed planting, and less frequent sells.
The analysis result from multinomial probit model shows that experience in farming activity,
size of the family, education and distance from the market found to have a positive influence to
be in the first cluster group. As it has been discussed, these farmers own more of the strategies

52
of production diversification, market diversification and more frequent sales. The impact of
experience is rather important that it significantly affects for using these methods. The spatial
parameter i.e. distance from the market proved to have highly significant positive impact to
diversify crops and selling frequently. Conversely, the statistical evidence is that farm size and
use of irrigation facility are proved to have a negative influence in practicing the combinations
of these strategies. The underlying justification is that possession of more land favors taking of
risks. The use of irrigation gives them an option and farmers relatively feel safe that they less
likely avoid risks as compared to the non-users of irrigation.
With respect to the third cluster group, experience, family size, education, farm size positively
influence for utilization of crop rotation, resistant crops and early and delayed planting and less
frequent sales. Among these variables, education of the farmer has a significant effect and the
effect of experience is confirmed only at 10% probability level. The result is in consistent with
the previous findings that educated farmers are risk averse. Experienced farmers are also risk
avert that they prefer crop rotation and use of resistant crops. The accesses to irrigation and
distance from the market have shown a negative influence. However, irrigation is more
important that farmers who own such a facility are less likely to be in this cluster group (cluster
group 2, base category).

53
Table7. The parameter estimates and marginal effects of multinomial probit
Variable Cluster group 1 Cluster group 3
Coefficients, (Standard errors)
Marginal effects
Coefficients, (Standard error)
Marginal effects
Experience 0.039*
0.018
0.005 0.026
0.015
0.004
Family size 0.089
0.089
0.012 0.059
0.065
0.009
education 0.281
0.208
0.019 0.400*
0.165
0.091*
Farm size -0.478**
0.168
-0.101*** 0.091
0.093
0.069*
irrigation -0.381
0.302
-0.004 -0.785**
0.271
-0.191**
distance 0.217***
0.062
0.049*** -0.077
0.059
-0.041**
Log likelihood -202.964
P> X2 0.000
*P<0.05,**P<0.01,***P<0.001
As discussed on the theoretical part on the intertemporal choice model, the households choice
on the ex-ante risk response has an implication on the effect of risks and ex-post coping. With
the additive utility approach, (Dercon, 2008) has explained how the risk mitigation methods
impact on the life time utility by lessening the effect of the risks. The risk averse farmers
practice a set of strategies to smoothen their income and consumption. It is also discussed that
the more the protection against the risks, the higher the capability of the households to
manage the effect after the risk has occurred. With the methods of experimental lottery games
and a household survey, several studies confirmed that the parameters of age, education, and
farm size and etc... have a positive or negative influences on risk aversion by farmers. Farm size
led to less aversion to risks and where, as education and age are affecting positively.
Under perfect markets, households specialize in profitable activities determined by the market
conditions. The owners of more land have an intension to specialize that the justification is

54
related to their decisions based on the market wages and prices rather than consumption. The
further the household from markets, the labor and product market are likely to be imperfect
and coupled by the risks, the households prefer diversification. The decision of the households
is determined by their needs and characteristics. The cash crop production with the use of
irrigation favors specialization for the reason that market conditions determine the decisions
since these produce are more tradable. Production decision is not solely dependent on the
consumption by the households.
5.2.1 Response towards market risk
To analyze the determinants of adoption of ex-ante risk response mechanisms against market
risk, a multivariate and individual Probit model has been employed. The results and
presentation of factors important for the adoption of each strategy has been presented in the
following sections.
Early and delayed planting
In the survey, farmers are asked if and only if they use this strategy for reducing price risk. If
the risk is to happen or prices go down below the expectation of the farmers in the harvest
time, the mechanism enables them to escape the losses as a result. If the risk is not to happen,
they may get high or the same prices depending on the situation of markets. The result from
the analysis shows that education and access to irrigation facility have a significant positive
influence on the adoption of this strategy and coping with price risk. Farmers are uncertain
about the distribution of rainfall if they plant earlier or delayed to the usual practice. It confirms
that access to irrigation reduces the risk of rain and farmers feel safe to make a choice on the
time of investment. Irrigation is majorly devoted for the production of vegetables and partly
maize. Thus, use of irrigation is important to adjust on their planting strategy on these crops.
The experience in farming activity and size of the families has shown a positive impact in
implementing this strategy. Farm size is found to influence negatively. The underlying reason is
that possession of more land leads to be less risk avert in consistent to the theories. Distance to
the market found to influence negatively.

55
Market diversification
The higher the size of the families contributes to planting of more different crops. Education,
experience and land size are found to have a positive effect, however education is found to be
more important. Irrigation has a negative influence that the reason can be farmers produce few
vegetables that helps them to earn more income with the allotment of relatively smaller plots,
on average less than 0.5 hectares of land. Then, when the prices are good depending on the
overall supply or other factors, they enjoy as a result of the gains. On the contrary, if the price
lowers they are negatively affected since they use less diversification in the production of
vegetable produce. The other justification also underlies with the feeling of safeness that
farmers become less risk avert. Distance from the market affects positively because of the fact
that farmers could be more uncertain, tendency of subsistence and less likely to specialize due
to lack of access to markets.
Selling to unions
Farmers can get better market access being a member of unions and by selling their produce to
the unions. Education is found to be the most important factor for farmers to participate in
such cooperatives. Irrigation also has a significant positive influence that vegetable producers
tend to sell to their produce more through these market cooperatives. However, on the
individual Probit, its effect is observed only at 10% level of probability. All the other variables
age, experience, family size and land size also showed positive influence. Farmers located in a
far distant from the markets have a less chance of selling to union and the reason could be they
do not have access to information on prices as well as the union itself as compared to those
located near to markets. This indicates that the service of cooperative union is not extended to
the farmers in remote areas.

56
Table 8. Coefficients and marginal effects from multivariate and individual Probit
Variable
Delay/early planting
Diversification
Selling to union
Coefficients
(SE)
Marginal Effects
Coefficients
(SE)
Marginal Effects
Coefficients
(SE)
Marginal Effects
Experience 0.015
(0.010)
0.005 0.010
(0.012)
0.003 -0.0004
(0.010)
-0.001
Family size 0.020
(0.043)
0.006 0.134*
(0.057)
0.037* 0.032
(0.050)
0.007
Education 0.560***
(0.116)
0.180*** 0.432**
(0.135)
0.124** 0.521 ***
(0.116)
0.118***
Farm size -0.032
(0.059)
-0.011 0.063
(0.073)
0.018 0.085
(0.066)
0.017
Irrigation 0.586**
(0.191)
0.186** -0.600**
(0.190)
-0.184** 0.428*
(0.213)
0.091
Distance -0.135**
(0.049)
-0.042** 0.056
(0.043)
0.016 -0.097*
(0.043)
-0.019
Log Likelihood -305.111
P> X2 0.000
*P<0.05,**P<0.01,P<0.001
The result from the Multivariate Probit regression indicates that the strategies of market
diversification and selling to union are used in combination evidenced at 5% level of
significance. The Likelihood Ratio (LR) test also shows that three strategies are interdependent
and observed at 5% level of probability. The results of this model and that of the individual
Probit are more or less converging, except the impact of irrigation in making sales to the union.
All the marginal effects arise from the individual Probit model.
Frequency of selling
In addition to these responses, spreading of sells is the other option to deal with market risks.
With the use of this strategy farmers could be able to safeguard themselves when prices are
lower than their expectations. Selling their produce in different times across the year helps to
get average prices but not necessarily higher prices, however smoothening of income will be
achieved.

57
Table 9. Frequency of selling of cereal produce, results Ordered Probit model
Variables Coefficients
(SE)
Marginal effects
Weekly or less Once a year
Experience -0.017
(0.010)
0.003
-0.001
Family size -0.044
(0.036)
0.009 -0.004
Education -0.053
(0.110)
0.011 -0.004
Farm size 0.183**
(0.053)
-0.037** 0.015*
Irrigation 0.094
(0.153)
-0.019 0.008
Distance -0.050
(0.036)
0.010 -0.004
Log Likelihood -306.725
P>Chi2 0.029
The Estimation results shown in the below table confirms that experience in farming activity,
size of the family, farmers’ education level and distance from the market reduce the probability
of selling once in a year, meaning they prefer to spread the sales of the produce. The effect of
experience is observed at 10% level of probability. The other variables farm size and access to
irrigation lead to more probability of selling in one time in a year. The owners of more land
prefer less frequent sales mean that, the benefits depend on the time and the prices they sell, it
yields them a lower or higher gains. Hence, there is a tradeoff between such a gain and an
average gain as a result of frequent sells. The risk avert famers prefer spreading their sales over
the year and get average income. The reason behind irrigation is related to vegetable produce,
which naturally cannot favor storage or to be kept for future sells. For most of them, the option
they have is to sell soon after the end of harvest season and what the market can offer them.
The marginal effect also implies that an increase in the farm size lowers the propensity to
distribute sales.
58
5.2.2 Responses to production risk in the CRV
Econometric model
Under this risk, rainfall shock and damages caused by pests has been considered. Planting of
diversified crops, use of resistant crops or varieties of crops and crop rotation are strategies for
reducing risk in production. Rotation is used more for risk of pests.
Resistant crop varieties
Education of the farmers and experience have a significant positive effect that more of both the
variables contribute to more use of resistant crop varieties. The result shows that family size,
farm size and use of irrigation lead to less use of this strategy. Those farmers with smaller land
holdings and no access to irrigation care much against the risk by planting of resistant varieties.
Farmers report that varieties of crops resistant to drought are not readily available and they are
making decisions on the choice of crops.
Diversification
Farmers were asked whether they use this strategy for production risk or price risk or for any
other reasons. Thus, the data tells that experience, family size and education have a significant
positive influence on the probability of planting their plots with different crops against the risk
of production. The size of the farm is also proved to affect positively but its effect is not
significant. Access to irrigation shows significantly negative influence that farmers now can
prioritize commodities, which can produce better yields or prices. The influence of distance to
the market on diversification is positive that these farmers have their own mechanism being
induced by uncertainty of the weather condition and less access to inputs such as, pesticides. It
has also a closer interconnection with that of price risk in final marketing of their produce.
Crop rotation
Since the old age, farmers utilize crop rotation for various reasons as well. The major drive is for
increasing the fertility of the soil by planting of break crops. Farmers also use this method to
reduce the growth and damage caused by pests. The result from the analysis shows that farm
size has a negative significant impact on the practice of rotation. Large holdings lead to less
rotation that farmers again will be less risk averse. Size of the family and education has
important positive influence. Experience and access to irrigation both has similar though are

59
less important. However, with the use of irrigation farmers rotate vegetables in the offseason in
addition to the main season crops.
Minimum Tillage
One of the technologies in crop management is conservation tillage and is advantageous over
conventional tillage that enables in increasing profitability. The benefits accrue from the
strategy includes savings in labour and energy, conserving soil, increasing tolerance to drought.
On the contrary, unless combined with options the control of weeds, pests, and diseases will be
more complex. In this research, the conservation tillage refers to one time ploughing of fields
that the practice of zero tillage is not adopted well.
The result of the analysis confirms that quite few of the farmers are using the technology
against the risk of drought. The experience of the farmers in farming activity has a positive
significant impact for adopting the strategy. The size of the family, education, farm size,
irrigation and distance have shown a negative effect. Irrigation is more important that they do
not have to worry much to conserve moisture. Synthesizing the overall situation, the evidence
is that about percent of the farmers who use the method are in the third location and in other
areas the adoption is almost inexistent. In the off season, the farmers in this area plant less
value crops such as, grass pea which can grow with little moisture reserve and cultural
practices. The benefit from these crops is less and less likely preferred by those who have
better education and farm size. The practice is not an efficient one that it did not incorporate
the modern innovation but experienced farmers use this strategy.
It is also found that crop rotation and the use of resistant crops are significantly and
simultaneously adopted. The use of minimum tillage is also combined with that of plating of
resistant crops. The likelihood ratio test confirmed that there is a correlation of all the
strategies against production risk. The results of the Multivariate and individual Probit more or
less are convergent, except that the effect of experience on minimum tillage is observed only at
5% probability in the latter case. The influence of irrigation is confirmed at 1% probability and
that of distance at 5% probality. All the marginal the marginal effects are derived from the
individual Probit models.

60
Table 10. Coefficients, standard error and marginal effects from Multivariate and individual Probit models
Variable
Resistant crops diversification
Crop rotation minimum tillage
Coefficient
(SE)
Marginal
Effect
Coefficient
(SE)
Marginal
Effect
Coefficient
(SE)
Marginal
Effect
Coefficient
(SE)
Marginal
Effect
Experience 0.019
(0.010)
0.006 0.044**
(0.014)
0.012** 0.002
(0.010)
0.001 0.026**
(0.010)
0.003*
Family size 0.017
(0.045)
0.007 0.239**
(0.074)
0.064** 0.180***
(0.051)
0.057*** -0.158
(0.116)
-0.017
Education 0.335**
(0.118)
0.134** 0.551***
(0.156)
0.148*** 0.414**
(0.130)
0.122** -0.129
(0.160)
-0.019
Farm size -0.181*
(0.076)
-0.065* 0.050
(0.072)
0.014 -0.177**
(0.063)
-0.055** -0.071
(0.102)
-0.009
Irrigation -0.959***
(0.188)
-0.346*** -1.078***
(0.214)
-0.288*** 0.049
(0.197)
0.013 -0.731**
(0.294)
-
0.118***
Distance -0.123**
(0.038)
-0.014** 0.037
(0.044)
0.009 0.042
(0.038)
-0.016 -0.104
(0.053)
-0.015*
P>Chi2 0.000
*P<0.05,**P<0.01,***P<0.001

61
5.2.3 Determinants of farmers’ diversification activities in the offseason
The data shows that the length of cropping season in the three regions varies from 4-8 months
depending on the type of crop farmers are growing. In the main season, for maize it takes up to
eight (8) months starting from seedbed preparation till harvesting. For other cereals and
vegetables, it is as long as 4- 5 months. Thus, the short duration of the main season production
implies that there are extra months in which the family labor can be spent on productive
activities. Without involvement in other on farm and off farm employment or diversification of
into other activities, the resources of land and family labor will be inefficiently utilized. In a
broad spectrum, the management of risk or smoothening of income to be achieved will be less
as compared to households who option or actions for diversifications.
In addition to the activities in the main season, farmers can earn extra incomes being engaged
in activities in the off season. The practices In the CRV include production of vegetables such as,
onions, tomato, maize and cabbage. These depend on the availability of irrigation water that in
other locations far from the source and sloppy lands, farmers hardly involve in such activities.
Some of them also involve in on-farm and none farm employment. Hence, the target of this
section is that taking irrigation into account, what things are determinant for the participation
of farmers in the off season vegetable production or what things affect the size of vegetable
supply and income in the three regions. It is also to determine the participation of farmers in
this temporal diversification of income source.
The activity of cash crop production with the use of supplemental irrigation could serve as an
income smoothening activity. The income earned in the previous period has an implication for
coping against risks in the other year. As discussed on the farm household model, the existence
of imperfect markets is characterized by the inseparability of production and consumption.
Vegetable produce is more tradable and the decisions of the households are influenced by the
market forces. The changes in prices influence the production, labor supply and hiring by the
households. Some farmers may hire external labor or others may work on the farm of other
farmers. The supply of vegetable produce by the farmers is influenced by the transaction cost.

62
The existence of higher transaction costs may affect the responses towards the changes in
prices. Higher transport cost, distance to markets and monopoly power of traders lead to
higher transaction costs. Such a market failure results in a disutility for the farmers that the
costs outweigh the gains. The prevalence of price risk further widens the price band coupled
with poor infrastructures and information flows. Households are unresponsive towards a
change in prices of cash crop if the market for food crops is imperfect. In the case of better food
markets, the orientation will be towards food crop production.
In addition to these factors, household and farm characteristics affect the supply of produce to
the market. The result of the analysis confirms that experience positively influences at 10%
level of probability while education of the farmer and education of the wife significantly
contribute for more production and supply of the produce of onions and tomatoes to the
market. The larger the size of the family, the lower the amount of the supply of these
vegetables has been observed. Previous studies discuss that the lower share of food in the
families budget spent the more the farmers devote a significant amount of resources for the
production of cash crops (Fafchamps, 1992). The result also confirms the larger households will
be oriented towards cereals since that they need more food.
The other result is about the impact of farm size on vegetable supply. The larger the farm size is
associated with the smaller supply of the vegetable produce. The role of farm size in favoring
orientation towards cash crop production is well documented. As compared to small farms,
large farms allot the larger part of their land for the production of cash crops. Other discussions
focused on the difference of farmers ability to cope with risk and that crop portfolio choices
determined by differences in practice of risk strategies (Fafchamps 1985). The literatures of
discussed the land less poor engage in staple crop production. Investment in inputs is more
risky and the poor purchase less inputs. The discussion in favor of irrigation and pesticides
argue that the inputs further help to reduce the risks. Hence, the result is in contrast to the
former findings, whereas in consistent the latter ones. With the access to the small scale
irrigation, the landless poor orient towards vegetable production in the absence of perfect food
markets. The households generate income selling the cash crops.

63
Table 11. Coefficients, standard errors and marginal effects heckman selection model
Variable
Supply of vegetable Supply of vegetable
Coefficients
(Standard errors)
Marginal Effect
Coefficients (Standard errors)
Marginal Effects
Experience 0.018
0.010
0.019 0.017
0.013
0.018t
Family size 0.080
0.049
-0.077 -0.070
0.045
-0.068
Education 0.247*
0.109
0.248* 0.252*
0.110
0.250*
Wife’s Education
0.356*
0.157
0.353* -0.039*
0.062
0.344*
Farm size -0.042
0.062
-0.042 -0.22
0.06
-0.040
Probit
distance -0.197***
0.036
-0.071***
-0.076t
0.039
-0.028*
Age -0.019*
0.008
0.002
-0.007*
-0.013t
0.007
-0.005t
P>Chi2 () 0.5587 0.7919
Log Likelihood
-236.710
P>Chi2 0.011
*P<0.05,**P<0.01,***P<0.001
Studies conducted in North Eastern Ethiopia discusses that those who are near to the towns
grow crops that have higher cost of transportation (such as vegetables). The lesser the
proximity, the orientation will be towards crops with lower transport costs, for example, grains.
The choices made by those who located in the outer annulus may not all because of the
influence of price but could also be tendency of self-sufficiency in staple crops in order to
smooth consumption. Vegetables serve as cash crops that can be sold at higher prices on the
market while the staple food producers located the outskirts can have the opportunity to sell at
low prices (Nuru and Seebens, 2008). The risk averse poor remain self-sufficient in staple crops

64
and diversification is limited to producing different kinds of staple crops alone. (Nuru and
Seebens, 2008).
The descriptive analysis shows that in the main season the farmers’ production concentrates on
cereals. It is apparent fact that the participation of the farmers in vegetable production majorly
determined by their proximity to irrigation facility. The other important determinant factors for
the selection are the farmers’ access to markets that the due to the nature of these produce
transportation is difficult and this raises the transaction cost. The evidence is that factors such
as access to irrigation scheme, climatic conditions, and wealth of the household determine on
the production decision cash crops, sugarcane for instance. In relative terms, wealthier
households are likely afford invest in cash crops (Nuru and Seebens, 2008). Thus, distance to
market distance to accessible irrigation and age are the factors determinant for the
participation of farmers in supplying vegetable produce. The result shows that distance from
the market significantly influences for not participating in this activity and the age of the
household is also negatively leads to be engaged in such an activity at a moderate level.
Presumably with the small scale irrigation, farmers in the area are producing on smaller plots
characterized by manual labor, in the practices of hand weeding and hoeing, and for the older
farmers this could be the constraint.
The distance from the center where the flow of irrigation water is reliable has been estimated
and the results are similar to the above outcome, except that minor deviations exist. The earlier
parameter found to adjust perfectly as compared to this parameter. The second column shows
the results of supply of vegetable produce and the adjustment of selection bias with the
parameters of distance to markets and age of the farmer. I the right had side of the table; the
results are obtained after the correction by the parameters of distance from accessible
irrigation and age of the household.

65
VI. CONCLUSIONS
The appraisal of the bio-physical research conducted in the central rift valley evidences that the
region is full of mixed blessing. Farmers are vulnerable to droughts due to delays on the onset
of rain and its erratic nature. This is coupled with population pressure, declining of land size,
degradation of the environment and decline size of the lakes and rivers utilized for the small
scale vegetable production. The potentials associated with productivity growth are the soil
fertility and favorable climate for supporting high value cash crop production. The proximity of
the region to the larger cities makes it the better for the transportation of the vegetable
produce. The most exportable crops are also grown up in the region.
In the face of risk and in the absence of insurance and credit markets, farmers have methods
for reducing the risks. Farmers differ on the way to react to these risks that part of them are
relatively risk preferring and others are more avert adopting several strategies. Without these
responses, the effect of risks will be much more pronounced that it has implications the ex-post
consumption smoothening mechanisms. More capability for management of the risks implies
that the less concern for the management of the crisis after the shock. Studies also argue that
the traditional risk management strategies are costly; however the empirical results are limited
in identifying their impact.
The results from the major part of this study show that experience of the farmer and distance
from the market are important to influence production and market diversification and frequent
sells in cluster group one. Farm size affects negatively towards the use of these strategies.
Education of the farmer significantly affects the use of crop rotation, resistant crops and early
and delayed planting. Accesses to irrigation and distance from the market have a negative
significant impact for using these strategies for farmers in the third cluster.
Specific to the risks of marketing and responses, early and delayed panting is positively related
to education and irrigation and negatively affected by distance from the market. Farm size and
educational level lead to market diversification while irrigation and distance in the opposite
way. Education and irrigation are important to sell the produce to the union. Experienced
farmers sell more frequently whereas, owners of more land sell less frequently.

66
With regard to production risk, use of resistant crops is positively related to education, and
experience. Farm size, irrigation and distance lead to less use of the strategy. Experience,
education and family size are important for diversification while access to irrigation leads to less
diversification. The practice of rotation is affected by family size and education and oppositely
by land size. The use of minimum tillage is limited to experienced farmers and irrigation users
hardly use it.
The result it is found that access to irrigation makes farmers safer and they less likely adopt the
risk strategies. On the other hand, more education leads to increased risk aversion and the
practice of risk reduction. As is discussed before, it is the target of this research to address the
differences among households, beneficiaries of the infrastructure and their responses towards
risk and farmers exposed risks without such an infrastructure. Thus, irrigation is ex-ante
insurance mechanism for the poor.
The other finding on the third section discusses the factors affecting both the participation of
households in production of vegetables and also the amount of produce supplied to the
market. The temporal diversification is negatively affected by the distance from the market,
distance from irrigation access and age. With respect to the amount of vegetable supply,
education of the wife and that of the farmer influence more supply and experience at a
moderate level.
The research has a limitation that the focus is on the farm, whereas households are both
producers and at the same time consumers, involve in diversification of different income
sources in on farm and off-farm employment. It is important to identify the different strategies
used by the farmers that lead to income smoothing. Different approaches are existent to treat
real impacts and prioritization in training programs.

67
VII. RECOMMENDATIONS
Investment in the horticulture in the region has proved promising results and at the same time
the effect of droughts is causing an increasing impact. The built up of irrigation coupled with ex-
ate risk responses contributes for managing risk in a better way rather than coping with ex-post
mechanisms which leads loss of assets. Hence the development of irrigation infrastructure is
sustainable risk management In CRV is realized. The socioeconomic constraints and the
biophysical phenomena in the CRV found to have a significant challenge for advices, desirable
actions and policy making in the risk management.
It calls for the expansion of irrigation facility to cope with the drought shock by utilizing the
water resources in the area. It is necessary to design and fund alternative projects for the
extensive development of water wells based on accessibility of ground water. However other
studies gave a recommendation against any expansion of irrigation that aggravates the problem
and rather they recommend efficient water use systems. The institutions and NGOs in the CRV
should focus on funding on long term changes in agricultures, training on risk management
methods, conservation measures as a tradeoff between dependency versus sustainability.
Provision of education apparently has an impact on farmers to use the risk strategies and
making of decisions in farming activity. It is the key factor to take actions and to lessen the
effect of risks. Linking of farmers located in far distance away from markets is indispensable.
The encouragement of the establishment of the existing and new comparatives and unions is
also highlighted. Creation of awareness among farmers about cooperatives and building of trust
is essential. Reducing the barriers in the cash crop production is to be highlighted.
Apart from, over and above the risk management strategies and use of irrigation by farmers,
the risks in excess of the capacities of the farmers should be managed. Solving inefficiencies
and subsidization of insurance is important. Due to the complex nature of the challenge in the
CRV an integrated approach is required to deal with the vulnerability in the region. It is
important to design agricultural and rural development policies towards the management of
risks and the resources in long term plans.

68
VIII. BIBLIOGRAPHY
Alderman, H. and Paxson, C.H. (1992), Do the poor insure? A synthesis of the literature on risk and consumption in
developing countries, World Bank Policy Research Working Paper, 1008.
Alison, K. B. (2010), Crop diversification and technology adoption: the role of market isolation in Ethiopia, Montana
state university, Bozeman, Montana.
Fafchamps, M., (1992a), Cash crop production, food price volatility and rural market integration in the third world,
American Journal of Agricultural Economics 74 (1), 90–99, February.
Hardaker, J. B., Huirne, R. B. M., Anderson, J.R., Lien, G. (2004), Coping with Risk in Agriculture, Wallingford, 2nd
ed., CABI Publishing.
Harwood, J. L., Heifner, R., Coble, K., Perry, J., Somwaru, A. (1999), Managing risk in farming: Concepts, research,
and analysis, Agricultural Economic Report No. 774, Washington.
Huib, H. & Herco, J. (2006), Agricultural development in the Central Ethiopian Rift valley: A desk-study on water-
related issues and knowledge to support a policy dialogue, Plant Research International B.V., Note 375.
Kati, S. (2010), Credit for What? Informal Credit as a Coping Strategy of Market Women in Northern Ghana, Journal
of Development Studies,Vol. 46, No. 2, 234–253.
OECD (2009), Managing risk: A holistic approach.
Paul S., K. Sandhya, R. and Jeff A. (2002), Social risk management (SRM) framework: Towards an Action Plan for
the Proposed Andhra Pradesh Rural Poverty Reduction Project (APRPRP), Society for Elimination of Rural Poverty
(SERP) Hyderabad, India.
Solichin, A.W. (1996), How farmers cope? Case Studies of Decision-making in Six Farm Households in South of
Malang, East Java, Wageningen University.
William., G. T., Hanawa, P. (2001), Risk management in agriculture: A review, The Journal of Futures Markets, Vol.
21, No. 10, 953–985 (2001).
Nuru S.A., (2008), The Impact of Location on Crop Choice and Rural Livelihood: Evidences from Villages in Northern
Ethiopia, ZEF Discussion Papers on Development Policy, No. 123
Velandia M., Rejesus R.M., Thomas O. Knight T.O. and Sherrick B.J.(2009), Factors Affecting Farmers’ Utilization of
Agricultural Risk Management Tools: The Case of Crop Insurance, Forward Contracting, and Spreading Sales,
Journal of Agricultural and Applied Economics, 41,1:107–123.
Ellis F. (2000), The Determinants of rural livelihood diversification in developing countries, Journal of Agricultural
Economics, Vol. 51, No.2.

69
Goodwin B.K and Kastens T.L (1996), An analysis of marketing frequency by Kansas crop producers, Review of
Agricultural Economics, Vol. 18, No. 4.
Spielman D.J. and Dawit Kelemework D. (2008), Mobilizing rural institutions for sustainable livelihoods and
equitable development a case study of irrigation, water management and smallholder cooperatives in Ethiopia By
International Food Policy Research Institute Addis Ababa, Ethiopia.
Ayenew T. (2004), Environmental implications of changes in the levels of lakes in the Ethiopian Rift Since 1970,
Regional Environmental Change 4: 12–204.
Legesse, D., Woldu, Z., Mebrate, A., Mengistu, S. & Aenew, T. (2005), A Review of the current status and an outline
of a future management Plan for Lakes Abiyata and Ziway, The Federal Government of Ethiopia; Oromia,
Environmental Protection Office.
Van den Berg (2010), Household income strategies and natural disasters: Dynamic livelihoods in rural Nicaragua,
Ecological Economics 69 (2010) 592–602.
Verbeek M. (2008), A guide to modern econometrics, John Wiley and Sons Ltd, England.
World Bank (2005), Managing Agricultural Production Risk, Innovations in Developing Countries, Washington, DC
Haji J. (2008), Economic Efficiency and Marketing performance of Vegetable Production in the Eastern and Central
Parts of Ethiopia, Doctoral Thesis Swedish University of Agricultural Sciences, Uppsala .
Meshesha D.T, Tsunekawa A., Tsubo M., (2010), Continuing land degradation: cause-effect in Ethiopia’s Central Rift
Valley, land degradation & development Land Degrad. Develop. (2010).
Hengsdijk H., & Herco Jansen (2006), Agricultural development in the Central Ethiopian Rift valley: A desk-study on
water-related issues and knowledge to support a policy dialogue Plant Research International B.V., Wageningen.
Diga G.M., (2005), Using seasonal climate outlook to advise on sorghum production in the Central Rift Valley of
Ethiopia, Doctor of Philosophy in Agro meteorology, University of the Free State, South Africa.
Wahab S.A., (1996), Case Studies of Decision-making in How farmers cope Six Farm Households in South of Malang,
East Java, Wageriingen.
Patrick G. ( 1992 ), Managing Risk in Agriculture, Cooperative Extension Service, Purdue University.
Abedullah and Ali M., (2006), Quantifying the Extent and Nature of Risk in Alternative Cropping Patterns in
Claveria, Philippines, The Pakistan Development Review, 45 : 2.
Schaper C., Lassen B., and Theuvsen L. (2009), Risk Management in Milk Production: A Study in Five European
Countries prepared for presentation at the 113th EAAE Seminar “A resilient European food industry and food chain
in a challenging world”, Chania, Crete, Greece.
70
Morales C., Garrido A., Pálinkás P., and Székely C., (2008), Risks Perceptions and Risk Management Instruments in
the European Union: do farmers have a clear idea of what they need?, 12th Congress of the European Association
of Agricultural Economists – EAAE.
Valdivia C., Elizabeth G. Dunn E.G, Jetté C., (1996), Diversification as a Risk Management Strategy in an Andean
Agropastoral Community, American Journal of Agricultural Economics, Vol. 78, No. 5, Proceedings Issue, pp. 1329.
Dercon S. (1996), Risk, Crop Choice, and Savings: Evidence from Tanzania, Economic Development and Cultural
Change, Vol. 44, No. 3 (Apr., 1996), pp. 485-513.
Barrett C.B, Reardon T., Webb P.(2001), Nonfarm income diversification and household livelihood strategies in rural
Africa: concepts, dynamics, and policy implications, Food Policy 26 (2001) 315–331
Hardaker J., Huirne R. , Anderson J. and Lein G. (2004), Coping with risk in Agriculture, Cabi publishing, Wallingford,
UK.
World bank (2008), World Development Report, Agriculture for development, Washington DC .
Skees J., Hazell P., and Miranda M. (1999), new approaches to crop yield insurance in developing countries,
International Food Policy Research Institute, Washington DC.
Mberu B. (2006), Internal migration and house hold living condition in Ethiopia, Demographic Research, 14: 509–
540.
Rahmato D. (1989), Famine and survival strategies: a case study from North-East, food and famine. Monograph No.
1, Institute of Development Research, Addis Ababa: Addis Ababa University.
Fafchamps M. (1992b), Solidarity Networks in Preindustrial Societies: Rational Peasants with a Moral Economy,
Economic Development and Cultural Change, Vol. 41, No. 1, pp. 147-174.
Dercon (2000), Income risk, coping strategies and safety nets, Background paper World Development Report
2000/01, Centre for the Study of African Economies, Oxford University Department of Economics, Oxford.
Schindler (2009), 'Credit for What? Informal Credit as a Coping Strategy of Market Women in Northern Ghana',
Journal of Development Studies, 46: 2, 234 — 253.
Fafchamps M. (1992b), Solidarity Networks in Preindustrial Societies: Rational Peasants with a Moral Economy,
Economic Development and Cultural Change, Vol. 41, No. 1, pp. 147-174.
Dercon S. (1998), Wealth, risk and activity choice: cattle in Western Tanzania, Journal of Development Economics,
Vol. 55, 1–42.
Dercon S. (2008), Fate and Fear: Risk and Its Consequences in Africa, Journal of African Economies, volume 17, AERC
supplement 2.
71
Akay A., Martinsson P., Medhin H., Trautmann S.T., (2009), Attitudes toward Uncertainty among the Poor: Evidence
from Rural Ethiopia, Discussion Paper No. 4225, Bonn, Germany.
Hill R.V., (2010), Liberalisation and Producer Price Risk: Examining Subjective Expectations in the Ugandan Coffee
Market, Journal of African Economies, Vol. 19, number 4, pp. 433–458.

72
IX. ANNEX
Appendix1.
Head of the household Frequency Percent
Male 209 90.1
Female 23 9.9
Total 232 100
Appendix 2
2a. Land required (hectare) Percent
1-5 94.5
6-10 3.7
11-15 1.8
Mean 3.17
St dev 1.80
2b. Source of irrigation water Percent
Lake Ziway 59.8
Pond 7.7
River 30.8
Lake and pond 1.7
Distance from irrigation
1-3 66.4
4-7 28.4
8-11 5.2

73
mean 2.6
standard deviation 2.3
Crops with irrigation Percent
onion
yes 40.1
no 59.9
tomato
yes 32.3
no 67.7
Cabbage
yes 23.7
no 76.3
maize
yes 18.5
no 81.5
Green pepper
yes 11.2
no 88.8
2c. production
Mean cereal yield 17.2
Standard deviation 12.2
mean Vegetable yield 31.80

74
Standard deviation 46.88
mean livestock number 8.44
Standard deviation 6.82
Cereal yield (quintal)
0 13.8
1-21 52.6
22-42 31.5
43-63 1.7
64-84 0.4
Vegetable yield (quintal)
0 52.2
1-31 16.8
32-62 8.6
63-93 7.8
94-124 7.3
125-165 7.3
Livestock number
1-11 82.0
12-23 13.7
24-35 3.0
36-47 0.9
48-59 0.4

75
Livestock (Oromia Livelihood base)
0 (poorest) 2.16
12-18 (poor) 70.26
19-27 (middle) 12.93
28-48 (better off) 14.66
Appendix 3
3a. Market channel Percent
Cereal (channel 1)
Traders 55.8
Retailers 25.9
wholesalers 17.8
farmers 0.5
Channel 2
Traders 23.2
Retailers 22.6
wholesalers 32.2
farmers 21.4
consumers 0.6
Vegetable (channel 1)
Traders 21.2
Retailers 41.6
wholesalers 37.2

76
Channel 2
Traders 32.2
Retailers 28.8
wholesalers 39.0
3b. Information source1 Percent
Visit 73.9
friends 20.2
radio 2.0
Traders 1.5
Broker 1.4
extension 1.0
Information source2
Source2 11.6
No info 62.6
Visit 1.6
friends 6.3
radio 1.0
Traders 4.2
Broker 1.1
extension 11.6
Reliability 1
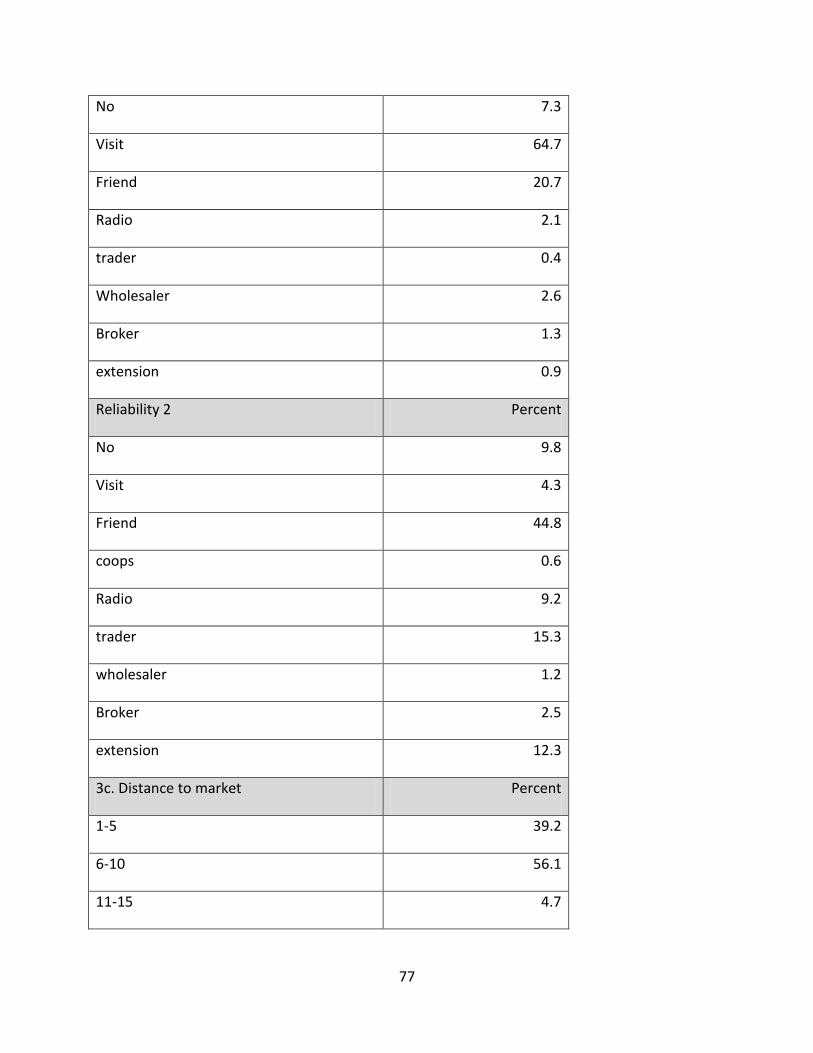
77
No 7.3
Visit 64.7
Friend 20.7
Radio 2.1
trader 0.4
Wholesaler 2.6
Broker 1.3
extension 0.9
Reliability 2 Percent
No 9.8
Visit 4.3
Friend 44.8
coops 0.6
Radio 9.2
trader 15.3
wholesaler 1.2
Broker 2.5
extension 12.3
3c. Distance to market Percent
1-5 39.2
6-10 56.1
11-15 4.7

78
mean 5.8
standard deviation 2.8
Appendix 4
Drought risk Percent
Absolutely low 0
Low 7.5
Medium 36.6
High 52.2
Absolutely high 3.7
Insect damage
Absolutely low 3.7
Low 15.8
Medium 50.0
High 30.5
Absolutely high 0
Disease
Absolutely low 2.3
Low 22.7
Medium 42.0
High 28.4
Absolutely high 4.6
Price risk

79
Absolutely low 7.8
Low 24.5
Medium 49.7
High 14.8
Absolutely high 3.2
Appendix 5
5a. Reason not member of union Percent
No Knowledge 83.8
No trust 4.5
Not useful 4.5
Do not want to save or loan 5.2
Do not need to sell to union 1.9
Attitude towards extension Percent
strongly disagree 0.9
disagree 1.7
neutral 7.8
agree 62.1
strongly agree 27.6
Attitude towards union
strongly disagree 3.5
disagree 3.9

80
neutral 55.0
agree 25.1
strongly agree 12.6
5b. Membership union
yes 74.1
no 25.9
5c. Frequency of selling Percent
Weekly and less 13.2
Every two 9.6
monthly 11.2
quarterly 30.5
Twice a year 31.0
once 4.1
Minimum tillage
yes 11.2
no 88.8
5d. Attitude towards specialization Percent
yes 2.6
no 97.4
Appendix 6
6a. Cluster group Percent

81
Cluster group 1 20.2
Cluster group 2 43.0
Cluster group 3 36.8
Appendix 6b dendrogram and histogram
G1
G2
G3
G4
G5
G6
G7
G8
G9
G10
0 50 100 150L2squared dissimilarity measure
Dendrogram for wardsclusterz cluster analysis
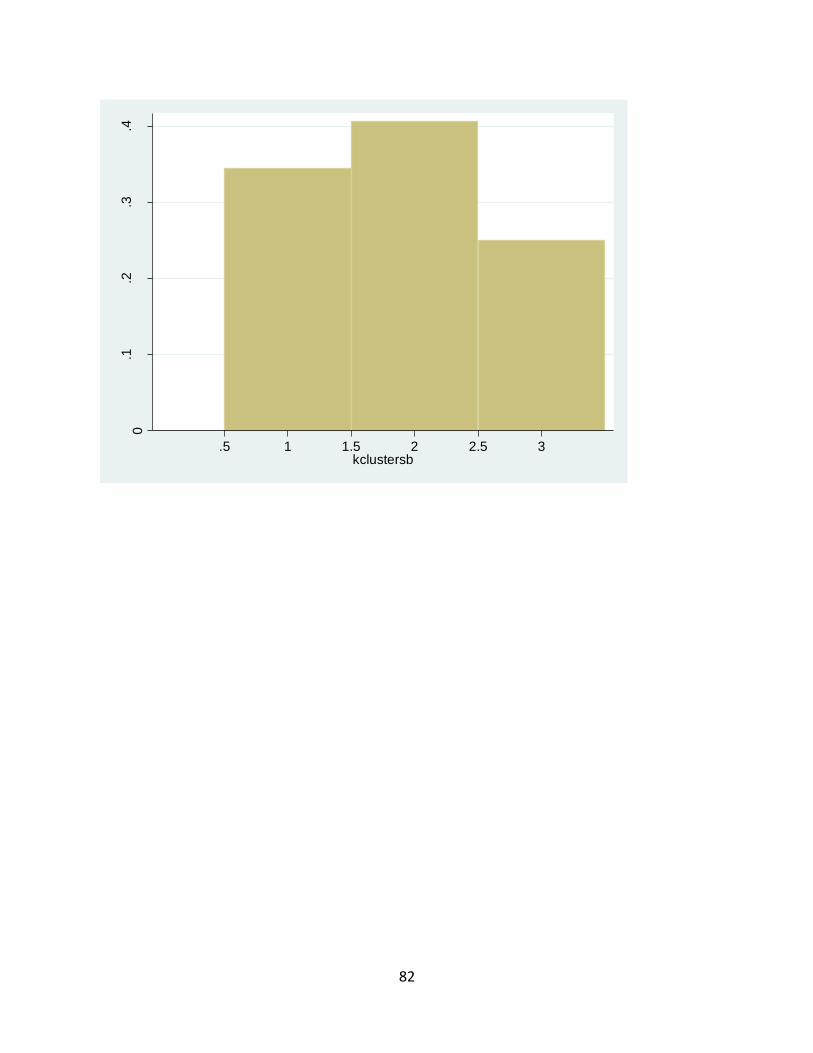
82
0.1
.2.3
.4
Den
sity
.5 1 1.5 2 2.5 3kclustersb

83
Appendix 7
Survey Questionnaire
A. Identification
A1. Zone ______________ A2.Woreda ___________ A3.Kebele __________
A4. I.D ____________ A5. Irrigation user/non user ______________
A6. Start time ________ A7. End time _________
A8. Number of visit _______ A9.Date of interview ________
B. Household Information
B1. Gender ______ 1 Male 2 Female
B2. Household head 1 Male headed 2 Female Headed
B3. Age ________ B4.Years of experience in Agriculture _______
B5. Size of family ___________
B6. Formal Education attained
1 No education 2 Primary 3 Lower secondary 4 Upper secondary 5 Tertiary
Highest level completed _________ Grade ________
Partner’s Education _________ __________
Children 1. __________ __________
2. __________ __________
3. __________ __________
4. __________ __________
C. Farm Characteristics
I. Production Characteristics
C1. Total Size of holdings (Ha, m2) ______________ Crop _________
Livestock _________ Forest_______ Other _________
C2. Total output produced (kg, Quintal)
Year
Main season Off-season Livestock Number + Number of Oxen Cereal Vegetable Cereal Vegetable
1
2
3
C3. Do you have adequate land to support the life of your family? 1 Yes 2 No

84
If No, what size of land (Ha, Gemed) is sufficient for your family _______ (Ha, Gemed)
C4. Length of crop season (months, days) Main Season _______ Off-season______
C5. Do you have access to irrigation facility? 1 Yes 2 No
If yes, what crops you plant with irrigation ______________
C6. Do you irrigate with the optimum amount as needed? 1 Yes 2 No
C7. The source of irrigation water ________________
C8. How you decide to produce in the operation of the farm activities (crops, livestock, and vegetables), indicate your agreement on the following statements with this scale
1 Strongly disagree 2 Disagree 3 Neutral 4 Agree 5 strongly agree
Statements Response (1-5 scale)
1 I decide to produce when I like to do
2 I produce a commodity only produced by neighbouring
farmers
3 When am informed that the market demand is good
4 When I observe there will be shortage of a produce
5 When I get advice from extension agents and other
organizations
6 When I get training and found it useful to me
7 When get new varieties and technologies
8 When I get advice from experienced nearby friends
9 When I get experience from other areas with good
achievement
II. Market Characteristics
C9. Do you sell the produce to the market? 1 Yes 2 No
C10. If, yes which produce you supply to the market
1 Crops 2 Vegetables 3 Livestock 4 Livestock products
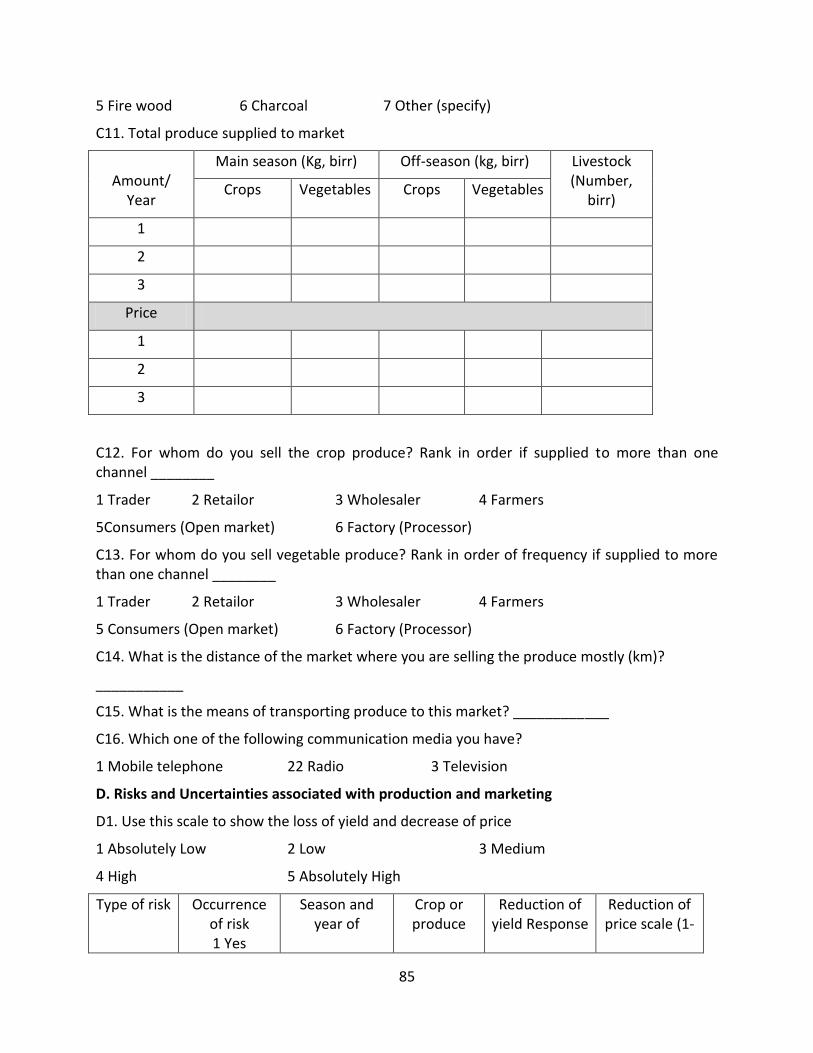
85
5 Fire wood 6 Charcoal 7 Other (specify)
C11. Total produce supplied to market
Amount/
Year
Main season (Kg, birr) Off-season (kg, birr) Livestock (Number,
birr) Crops Vegetables Crops Vegetables
1
2
3
Price
1
2
3
C12. For whom do you sell the crop produce? Rank in order if supplied to more than one channel ________
1 Trader 2 Retailor 3 Wholesaler 4 Farmers
5Consumers (Open market) 6 Factory (Processor)
C13. For whom do you sell vegetable produce? Rank in order of frequency if supplied to more than one channel ________
1 Trader 2 Retailor 3 Wholesaler 4 Farmers
5 Consumers (Open market) 6 Factory (Processor)
C14. What is the distance of the market where you are selling the produce mostly (km)?
___________
C15. What is the means of transporting produce to this market? ____________
C16. Which one of the following communication media you have?
1 Mobile telephone 22 Radio 3 Television
D. Risks and Uncertainties associated with production and marketing
D1. Use this scale to show the loss of yield and decrease of price
1 Absolutely Low 2 Low 3 Medium
4 High 5 Absolutely High
Type of risk Occurrence of risk 1 Yes
Season and year of
Crop or produce
Reduction of yield Response
Reduction of price scale (1-

86
2 No occurrence affected scale (1-5) 5)
Drought/ moisture stress
Insect
Disease
Market or price risk
D2. How do you compare market risk in the main season with that of the off-season when producing crops?
1 Very low 2 Low 3. The same 4 High 5 Very high
D3. How do you compare market risk in the main season with that of the off-season when producing vegetables?
1 Very low 2 Low 3. The same 4 High 5 Very high
E. Risk Management Strategies
I. Farmers’ practice
E1. Do you practice rotation of crops at least in each year? 1 Yes 2 No
E2. If yes, what is the reason behind you need a rotation? Can you quantify the increase of yield?
E3. How many times you plough your land in a production of major crop
1 Minimum tillage 2 twice to three times 3 Four to five times
4Six or more times
E4. How many times you plough your land in a production of major vegetable
1 Minimum tillage 2 twice to three times 3 Four to five times
4 Six or more times
E5. Do you plant drought tolerating crops and varieties of crops? 1 Yes 2 No
E6. Do you diversify your plots with different crops? 1 Yes 2 No
E7. If yes, why you diversify? _____________
E8. Do you want to produce a single commodity? 1 Yes 2 No
Why you want to produce a single commodity?
E9. Do you plant in earlier or delayed time than other neighbour farmers? 1 Yes 2 No
E10. If yes, why you plant with these methods?

87
E11. Do you postpone your sales when prices are lower than your expectation? 1 Yes 2 No
E12. What time you sell the produce of crops, the most usual practice?
1 Soon in theend of harvest 2 When the price gets good
3 When I just need income to buy other utilities 4 During cultural Holydays
5 When sending children to school 6I sell in the summer time
E13. What time you sell the produce of vegetable, the most usual practice.
1 Soon in the end of harvest 2 When the price gets better
3 When I just need income to buy other utilities 4 During cultural Holydays
5 When sending children to school 6 I sell in the off season
E14. Do you use market information to sell crop produce 1 Yes 2 No
E15. If yes, can you tell the sources of your information?
1Visit of Market 2 Ask friends 3 from Cooperative 4 Radio
5 Television 6 Mobile telephone 7 Retailer 8. Wholesalers
9 Brokers 10 extension 11 other
E16. Which source of information is reliable for you (Rank if more than one source) _____
1 Visit of Market 2 Ask friends 3 from Cooperative 4 Radio
5 Television 6 Mobile telephone 7 Retailer 8. Wholesalers
9 Brokers 10 extension 11 other
E17. Do you use market information to sell vegetable produce Yes No
E18. If yes, can you tell the sources of your information?
1 Visit of Market 2 Ask friends 3 from Cooperative 4 Radio
5 Television 6 Mobile telephone 7 Retailers 8 Wholesalers
9 Brokers 10 extension 11 Other
E19 How useful was the information you get and how large was the price you sold with?
Major crop sold and vegetable ______________
E20. How frequently you sell crop produce on average in a year?
1 Two or three times a week 2 Every week 3 Every two weeks 4 Every month
5 Every three month 6 twice a year 7 Once a year
E21. How frequently you sell crop produce on average in a year?
1 Two or three times a week 2 Every week 3 Every two weeks 4 Every month
5 Every three month 6 twice a year 7 Once a year

88
22. It is so useful to participate in extension programs and training regarding risk reduction in both production and market risk
1 Strongly disagree 2 Disagree 3 Neutral 4 Agree 5 Strongly agree
23. It is so useful to participate in marketing cooperative, selling to it and getting training regarding risk reduction in both production and market risk
1 Strongly disagree 2 Disagree 3 Neutral 4 Agree 5 Strongly agree
E24. What is your strategy to reduce the production (yield) risk?
Farmer’s action 1 Yes 2 No
Drought/Low moisture
Pests and disease
Do nothing
Use of drought tolerating crops and varieties of crops
Minimum tillage
Use of crop rotation
Diversification of crops
Using irrigation
Go for help to the local agricultural development office
Using past savings
Asking loans (saving and credit, cooperative, friends, relatives)
Get help from friends, relatives, safety net, gvt, non gvt
Migration
Search for other income (Sell Charcoal, farm and non- farm urban employment)
E25. What is your strategy to reduce market or price risk?
Farmers’ Actions 1 Yes 2 No
Cereals Vegetables Livestock

89
Storage of produce
Early and delayed planting
Diversified planting of plots
Sales plan starting late off-
season and summer (usual
practice)
Gather output market
information
Postponement of sales
Sell to cooperative union
Sell to NGO
Sell at existing price
Process/Semi process
Produce using irrigation
Asking for loans (1 friends, 2
relatives, 3 Saving &C, 4
Cooperative, other)
Get help from friends, relatives,
safety net, government, non-
government
Get help from Agricultural
Development office
Search for other income
(Sell Charcoal, farm and non-

90
farm urban employment)
II. Support Institutions
In which of the following institutions you have membership, obtained training and other benefits
1 Yes
2 No
E26. Marketing cooperatives or Union
E27. Extension Service
Research, Seed Enterprise, NGOs
Training about the cooperative
Training about insurance
Training about risk management/ diversification
Training about cultural practices (rotation of crops)
Training about use of improved Varieties/technologies
Training about using minimum tillage and mulch
Training about using drought tolerant crops and varieties
Training about risk management/ market information
Training about planting strategy (early or delayed planting)
Training about marketing strategy (storage, sell to cooperative,time of selling)
Training about use of irrigation
Setting of floor price
E28. How large was your benefit as a result of floor pricing by a cooperative as compared to the going market price, crop and vegetable_________
E29. Which one of the training you took was very useful to you in your farming activity?

91
E30. If you participate in extension programs and training in risk reduction, what is the main
driving force for using such a service?
1 because my father was participating in extension and I understood it is so useful
2 my friend is participating and so I learn from him
3 my neighbours were participating I realized the benefit
4 It is the influence of educated relatives and families
5 the influence of agricultural development experts and extension agents
6 It is my own interest and motivation 7 Other reason (specify)
E31. If you participate in marketing cooperative (union) and benefit of training, selling to
cooperative and floor pricing in risk reduction, what is the main driving force for using such a
service?
1 because my father was participating in marketing cooperatives and I found it is so useful
2 my friend is participating and so I learn from him
3 my neighbours were participating I realized the benefit
4 It is the influence of educated relatives and families
5 Advise from agricultural development and extension agents, NGOs, Research, seed enterprise
6 It is my own interest and motivation 7 Other reason (specify)
E32. Distance of extension agent from the farmer (km) _______ Woreda Bureau ______
E33. Distance of Union (km) ____________ Distance from irrigation __________
E34. How many times you took training about methods of production and marketing with the help of extension
1 Once or twice 2 three to four times 3 five and more times
E35. How many times you took training about methods of production and marketing with the help of marketing cooperatives
1 Once or twice 2 three to four times 3 five and more times
E36. How many times extension agents has been in contact with you previous production
season ____________
E37.In your view, the interest rate of borrowing from the marketing cooperative is,
1 Very low 2 Low 3 Medium 4 High 5 Very high
E38. If you are not a member of marketing cooperatives or Union, what is the reason you do not become a member

92
1 I do not have knowledge 2 I did not trust marketing cooperatives
3 I do not think this cooperative is useful 4 I do not want to sell to these cooperatives
5 I did not face market risk 6 I do not want to save or take loans
7 I have a bank account 7 other
E39. Has your household gained any income from employment in other farms? 1 Yes 2 No
E40. Has your household gained any income from employment out of any farming activity?
1 Yes 2 No
E41. How much is the income you get from this employment in each case?
E42. Total aid from safety net (mention if more than one year) ___________


![Ex post versus ex ante [CEP] - LSE Research Onlineeprints.lse.ac.uk/19885/1/Ex_Post_Versus_Ex_Ante...Cost_of_Capital.… · Ex Post Versus Ex Ante Measures ... User cost, capital,](https://static.fdocuments.in/doc/165x107/5aca2f657f8b9aa3298d6bee/ex-post-versus-ex-ante-cep-lse-research-ex-post-versus-ex-ante-measures-.jpg)
