Product Catalogue International Solar - eupd...
64
Product Catalogue International Solar EuPD Research
Transcript of Product Catalogue International Solar - eupd...

Product Catalogue International SolarEuPD Research
© a
+f
Gm
bH

Product Catalogue International SolarEuPD Research

4 EuPD Research 2011
Content
The Hoehner Research & Consulting Group Value Cycle ....................................... 6
EuPD Research – PV Research & Consulting Services ............................................. 7
1. The Global PV Market .......................................................................................... 9
ManufacturersMonitor© ......................................................................................10
PV Executive News Summary© ..............................................................................12
PV Thin Film Guidebook© 2011 ............................................................................14
Global Off-Grid PV Markets© ...............................................................................16
Potential of Building-Integrated PV 2010 ..........................................................18
2. The European PV Market ..................................................................................... 21
PV Market Matrix© ................................................................................................22
European PV InstallerMonitor© 2011/12 .............................................................24
European PV InverterMonitor© ............................................................................26
PV BrandMonitor© 2011/12 – Europe ...................................................................28
PV Seal ...................................................................................................................30
European PV ModulePriceMonitor© ....................................................................32
PV SalesMonitor© – Germany ...............................................................................34
Dawning of a New Era – Photovoltaics on the Edge of Grid Parity ..................36
PV MarketMonitor© – Germany ...........................................................................38
Regional Market Attractiveness© – Germany ......................................................40
The German Photovoltaic Market 2010 ...............................................................42
The UK Photovoltaic Market 2010 .......................................................................44

EuPD Research 2011 5
3. The US PV Market ................................................................................................. 47
US PV InstallerMonitor© 2011 ...............................................................................48
US PV BrandMonitor 2011© (East) ........................................................................50
US PV BrandMonitor 2011© (West) .......................................................................52
US PV ModulePriceMonitor© ...............................................................................54
4. The Asian PV Market ............................................................................................ 57
The Indian Photovoltaic Market 2010/11 ............................................................58
The Chinese PV Market .........................................................................................60
Imprint ....................................................................................................................... 62

6 EuPD Research 2011
The Hoehner Research & Consulting Group Value Cycle
We deliver comprehensive solutions from one source.
By applying an integrated approach, our customers
save time, reduce costs and mitigate risks in new,
highly dynamic markets.
By offering integrated business solutions
we maximize value for money:
Research, Consulting, Communications
Products & Services
Business Drivers
Your Added Value
CustomerYou
Des
ign
D
ialogue Data Research
Co
mm
unications Consulting Training
Ana
lysi
s
Com
pany/Organisation
Cust
omer
s
Co
mpe
titio
n
Market Enviroment
360
| Co
ncep
t
EuPD Research
360 | Consult
>>
>>>>
We maximize our customers value through
Market coverageGlobal approach ▪Local offices ▪Close to market ▪
Industry knowledgeIndustry Experience, high level of ▪
industry specific knowledgePublished more than 100 studies ▪Successfully accomplished ▪
1000+ projects
MethodologyProfound primary data due to ▪
own interview centerReliable secondary data elaborated ▪
on by our analytics divisionProven qualitative and quantitative ▪
market research
SustainabilitySustainable industries in focus ▪Balance between business and ▪
sustainabilityEconomic, ecologic and social ▪
perspectives
PeopleInterdisciplinary team ▪Multi-cultural, skilled, experienced ▪Cross-linked with excellent ▪
and reliable partners

EuPD Research 2011 7
As part of HRCG, EuPD Research provides customers with in-depth PV market research and consulting services. This document presents an overview of the products that EuPD Research currently offers. The catalogue does not include the variety of exclusive research or consulting projects which you can also order from us. The three types of products reflect our strategy of offering our customers various product types according to their requirements, e.g. depth of information, exclusivity and budget.
Customized services enable the generation and exploitation of strategic competitive advantages.
Our exclusive research projects are always targeted to your company specific ▪ information requirements.
You, as the client, determine the focus, extent and time frame of the survey. ▪The rights to use the findings are reserved exclusively for you. ▪
A limited number of customers ensure cost-efficient research.Our shared service projects ensure that our clients receive information that is ▪
not made available to everyone whilst sharing the costs for primary research. Where possible, we carry out exclusive analyses specifically for our shared ▪
service customers.
Detailed market surveys and information services for everyone.These products cover different scopes and markets in the field of PV. ▪The products differ with respect to focal points, theoretical bases, market ▪
data or actions recommended. Furthermore, informative news services delivered on a regular basis are also ▪
among our portfolio of products.
Individual requirements, competitive advantages, exclusiveness
EuPD Research – PV Research & Consulting Services
PV RMS – Maximize the value of your research
Our services will be available online via the PV Research Management System (PV RMS) provided by EuPD Research. It allows you to work immediately and flexibly via three online accounts*. This personal online version allows you …
» to have the product immediately at hand upon completion
» to exclusively access the digital version of the productyou ordered, enabling you to… download high resolution pages ▪ immediately make use of the documents, e.g. in presentations ▪ efficiently make use of products in further processes ▪
» to manage your information from anywhere in the world
» to store all relevant EuPD Research services – and your company‘s own research – in one place
» to alleviate communicate with your company’s subsidiaries worldwide
» to train your new employees in a more time-efficient and effective manner with the assistance of a centralized information management system
* You may purchase further accounts upon request.
Exclusive Services
Shared Services
Multi-Client Services

8 EuPD Research 2011
EuPD Research 2011 9
1. The Global PV Market

10 EuPD Research 2011
ADVANCED RESEARCH
MODELING TOOL
COMPANY PROFILING
ManufacturersMonitor© A Dynamic Modeling Tool for Analysis of PV Manufacturers Worldwide
The ManufacturersMonitor is a comprehensive tool that includes data about all manufacturers ▪ active in the PV value chain and forecasts demand and supply scenarios up to 2020.
The tool is delivered in the form of an Excel. ▪It is ownloadable via our PV-RMS online platform. ▪
Detailed company profiles
The Company Profiling Tool generates a detailed profile sheet including all data available for approximately 1,200 companies of all relevant levels of the value chain: silicon, wafer/ingot, cells, crystalline and thin-film modules.
The profile sheet provides general information, value chain pres-ence, latest news, capacity and production data from 2008-2015, financial information such as revenues, investments, EBIT, ASPs and stock performance.
Dynamic Modeling of Market and Manufacturers
This tool makes it possible to view and model the market and ma-nufacturers according to each value chain. In addition to viewing individual capacity and production data according to companies, the demand and supply situation of the whole value chain can be simulated using input variables such as company strength indica-tors and other forecasting conditions.
Analysis via customized options
As an addition, user friendly interfaces along with graphic displays are created that allow precise and one-stop-shop for customized analysis:
by company ▪by region/subregion ▪by value chain ▪by technology ▪by capacity or production level ▪
Japan webadress42
Stocklisted (Stock | Currency1) Asessement: 0
Production:
Vaue Chain Positioning:
C d t e C I G S a -S i µ -S i
Year-over-Year News:
Thin-film
Company47 | Company Information
14.10.2011
Headquarters:
Company Type:
Silicon Ingot Wafer Cell Panel
Poly Mono Poly
Web:
Mono Poly Mono Poly Mono
22.07.2011:PVTECH News: "News sample 1"*
09.06.2011:PV Magazine: "News sample 2.[...]"*
4.07.2011: Xyz PV Lowers Q2 2011 Revenue Guidance. For the second quarter of 2011, news sample 3[…]
EuPD ManufacturerMonitor
0 0Japan 0 0 0 0

Product Data Sheet
EuPD Research 2011 11
Information Sources Annual reports ▪Industrial sector analyses ▪Press reports ▪Telephone interviews ▪PV Executive News Summary ▪
Contents Production capacity covering years 2008 to 2020 ▪ including announced plans
Output covering years 2008 to 2020 ▪Data access on an aggregated level as well as on firm level ▪Output interface according to value chain and ▪
company locationFinancial information ▪Demand and supply situation (2008-2020) ▪Dynamic simulation of market and manufacturer ▪
performance up to 2020
Benefits for your Company
Analyze the entire value chain with a mouse click; from sili- ▪ con to wafers and ingots to crystalline and thin-film modules
Access data on 1,200 manufacturers around the world ▪ – either individually or according to specific criteria – and use it for a competitive analysis
Find information about production capacity and production ▪ either globally or organized according to country
Call up up-to-date data on prognoses from the present ▪ time to 2020
Price Single subscription Twelve month subscription
€ 5,900* € 9,500*
$ 8,100* $ 14,500*
Author/Contact Markus Lohr
Glo
bal
*(excluding sales tax/VAT) **(excluding sales tax/VAT and P&P)

12 EuPD Research 2011
BENEFITS
PRODUCT THEME
PRODUCT BACKGROUND
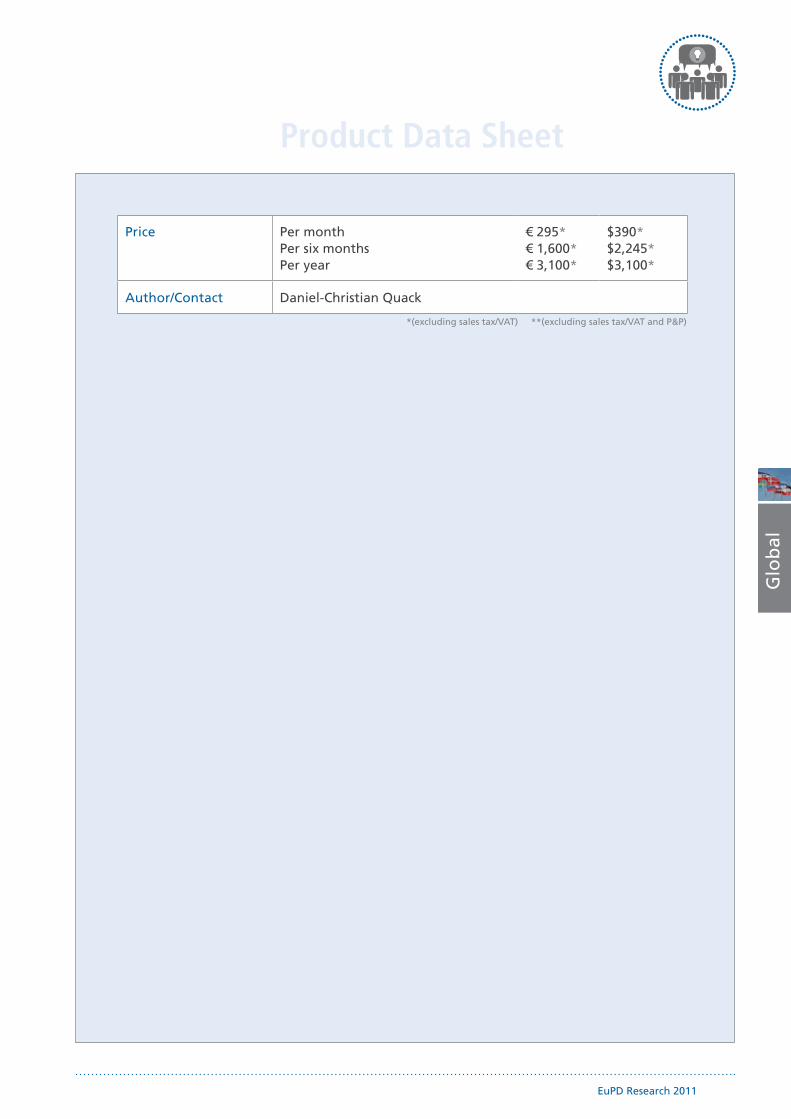
PV Executive News Summary©
Overview of important daily news from global PV markets. ▪Saves time as the five most important news items are highlighted. ▪Biweekly publication of executive summaries. ▪
Product information
The following services are included:Daily monitoring and selection of relevant articles, based on ▪
the photovoltaic market from international online platforms and newsletters.
Classification of articles: company news is categorized accor- ▪ ding to the firms’ level on the value-added chain, other news according to main topics (market, politics, etc.)
Publication on a biweekly basis. ▪Articles in English ensuring a consistent information flow ▪
making it suitable for international companies.
Product objectives
The news overview delivers up-to-date and comprehensive infor-mation about:
International PV companies, new production sites, supply ▪ agreements, mergers and acquisitions, projects and install- ations as well as technological developments.
International PV market and political conditions, e.g. changes ▪ in funding conditions and country installation figures.
ContentsTop five news items ▪News along the value chain ▪Market and political news ▪Miscellaneous ▪
“Executive PV News Summary” will provide your company with decisive competitive advantages:
Continuous tracking of developments in the PV branch. ▪Quick and relevant information about partners. ▪
and competitors.The top 5 news items are highlighted informing about the ▪
most important PV news.Product can be customized according to your company profile. ▪
Source: EuPD Research April 2011
Product Data Sheet
EuPD Research 2011 13
Price Per month Per six months Per year
€ 295* € 1,600* € 3,100*
$390* $2,245* $3,100*
Author/Contact Daniel-Christian Quack
Glo
bal
*(excluding sales tax/VAT) **(excluding sales tax/VAT and P&P)
14 EuPD Research 2011
MARKET OUTLOOK 2020
THE PV TECHNOLOGIES RACE & MANUFACTURERS´ STRATEGIC POSITIONING
STATUS QUO ANALYSIS – DEMAND AND SUPPLY UP TO 2011
PV Thin Film Guidebook© 2011 Status Quo, Challenges and Long Term Perspectives
Findings of a comprehensive survey that address customers, thin film manufacturers (150), crystalline ▪ manufacturers (150), project developers (50), banks and financers (20), as well as the research community.
Overview of the status quo of technologies, the market and the manufacturing landscape. ▪Competitor analyses and strategic positioning within the industry. ▪Comparison and benchmark of the different thin film technologies. ▪Manufacturer and customer assessment of the USPs of various thin film technologies. ▪Content of report partially codetermined by industry participants. ▪Receive profile sheets of the most important thin film companies. ▪
This chapter provides a concise overview of major developments of the past in PV thin film.
Overview and status quo of currently commercialized ▪ thin film technologies.
Market development 2007 – 2011 according to country ▪ and segment.
Market shares of each type of PV thin film technology. ▪Development of PV technologies production capacities. ▪
Issues to be tackled:Efficiency roadmaps ▪Real-life performance ▪Cost reduction potential according to technology ▪Segments and niches ▪Scarcity of raw materials ▪
The future development of thin film PV will be assessed: which technologies will dominate and why? The objective at hand is not only to provide a ballpark figure but also to collect in-depth data from which long term development scenarios can be derived.
Where will the future of thin film markets be? ▪What will the impact of grid parity be, and when will it be ▪
reached? What are the challenges to further growth, and what key ▪
success factors will play a role?
Sample slide
Sample slide
Sample slide

Product Data Sheet
EuPD Research 2011 15
Release Date August 2011
Information Sources Quantitative interviews with thin film producers and ▪ market entrants
Qualitative interviews with analysts, academics and other ▪ stakeholders
Systematic desk research (external databases, business ▪ reports, etc.)
EuPD DAT – internal database (developed in over ten years ▪ of industry expertise)
Contents(Subject to change)
Acquire an overview of the status quo of the thin film industryRecent developments regarding supply and demand ▪Mapping of the current manufacturer landscape in the ▪
thin film industry
One industry but several technologies – who will win the race?Identification & analysis of key success factors ▪Technology benchmarks ▪First-hand information and assessments from market participants ▪
Ways to differentiate with increasingly commoditized products Comparison of unique selling positions (USPs) communicated ▪
by various manufacturersGap analysis of customer perception and manufacturer ▪
portrayal of USPsBest practice cases – what can a manufacturer do to achieve a USP ▪
Market outlook 2020 Collection of data and opinions regarding future market ▪
development (insights from Delphi-Survey)Impact assessment of different parities ▪
Special topic & company profiles The role of carbon footprint in PV ▪Profile sheets of the most important thin film companies ▪
Benefits for your company
Provides a comprehensive foundation for strategic decision ▪ making in a setting where thin film manufacturers face tightening global markets and increased competition
Receive profile sheets of the most important thin film companies ▪
Included in Delivery 1x report, high quality binding; a digital version is available on request
Price Standard For Semi Members (proof required)
€ 4,900** € 4,410**
$ 6,950** $ 6,190**
Author/Contact Rob van der Meulen and Juan Pablo Ralón-Fonseca
Glo
bal
*(excluding sales tax/VAT) **(excluding sales tax/VAT and P&P)

16 EuPD Research 2011
PROJECT FINANCING AND FUTURE MARKET DEVELOPMENT
MARKET CONDITIONS ON COUNTRY LEVEL
GLOBAL OFF-GRID PV MARKET RATING
Global Off-Grid PV Markets©
In times of an oversupply of PV modules, off-grid PV offers a very promising alternative for market ▪ participants from the PV production and distribution sector.
This Q2/2009 chart report is based on primary research from more than 60 market players from the ▪ distribution and production sector of off-grid PV.
This report gives you comprehensive information on the most promising markets and their most ▪ important participants.
Identification and analysis of the international key regions
At the moment many PV producers are looking for new sales markets. But which are the regions with the biggest potential for off-grid PV? To answer this question EuPD Research carried out a country market rating based on a general market and specific off-grid PV market assessment. Afterwards, an analysis took into account the following aspects:
Current and future significance of electricity generation ▪ technologies.
Distribution of PV system components. ▪Unaided brand awareness of panel, inverter and battery ▪
producers.Important criteria when selecting PV modules and inverters. ▪Price comparison of PV panels and complete systems. ▪
Analysis of market segmentation as well as advantages and dis-advantages of the country markets
Along with the regions, the most relevant country markets within these regions were identified. In order to open up these new sales markets, it is crucial to know the necessary facts about the needs of the relevant customers. Based on the survey of 46 local distributors active in the key regions, learn more about the fol-lowing topics:
Current and future market segmentation regarding ▪ application types, customer groups, system sizes and module technologies.
Drivers and hindrances of the country market. ▪
Illustration of project financing methods and outlook on the further global market
Finally, EuPD Research provides qualitative information on several project financing methods and regarding a successful targeting of different end customer types and active market intermediaries.
The study closes with two scenarios of the further development of the global off-grid PV market until 2020. In a second step, EuPD Research calculated the likely development of the segmen-tation of the global off-grid PV market regarding application types up to 2020.
Total (n=40) Latin America (n=16)
productcharacteristics
delivery time/availability
warranty
service
quality
performance/efficiency
brand/certificates
financial aspects
awareness and experience of supplier/location of supplier
Product Data Sheet
EuPD Research 2011 17
Release Date May 2009
Information Data Quantitative and qualitative interviews with distributors ▪ and installation companies as well as module producers and inverter producers active in the field of off-grid PV
Qualitative background interviews with international project ▪ financers, development banks and NGOs
Data retrieval from the EuPD Research database (more than ▪ 750 projects in the field of photovoltaics since 2003)
Systematic desk research (media analysis, literature, ▪ industry portals)
Benefits for your Company
Get the knowledge required on countries where off-grid ▪ PV makes the most sense
Discover the segmentation of almost unknown PV sales ▪ markets around the world
Learn more about the crucial criteria for the selection of ▪ PV components and directly satisfy the needs of local distributors
Gain an overview of your competitors outside of Europe ▪ and North America
Receive information on ways of PV project financing in ▪ developing countries
Included in Delivery 1x chart report (140 slides)
Price € 1,490** $ 2,090**
Author/Contact Florian Schmidt
Glo
bal
*(excluding sales tax/VAT) **(excluding sales tax/VAT and P&P)
18 EuPD Research 2011
MARKET INTERMEDIARIES/END CUSTOMERS
SUPPLY OF BIPV PRODUCTS
MARKET ANALYSIS
Potential of Building-Integrated PV 2010First-hand information on the markets for building-integrated photovoltaics (BIPV). ▪Legal explanations, promising customer groups and market share forecasts. ▪Identification of factors for success for companies and investors. ▪
Identification of the building-integrated PV market
Which systems are considered as building-integrated by the different promotion legislations? Which are the most promising application types, and what are typical system prices? These issues are covered by the report:
Presentation of the top five BIPV markets and their ▪ developments: USA, Germany, France, Italy and Spain.
Legal framework of the top five BIPV markets. ▪Presentation of upcoming BIPV market. ▪Identification of drivers and hindrances in the markets. ▪Current prices of PV modules and BIPV systems. ▪
Intermediaries and distribution channel analysisIntermediaries’ evaluation of product characteristics ▪
and added values (guarantees, certifications, workshops and trainings, lifetime, design, ease of installation, etc).
Insights in procurement channels for BIPV products. ▪Current trends and issues concerning BIPV with regard to ▪
the end customer.Requirements/unmet needs/reasons for BIPV ▪
(broken down according to region).
New products for BIPV
Analysis of the currently available BIPV products and the top manufacturers of BIPV systems.
Overview of module manufacturers active in BIPV. ▪Overview of BIPV products (in-roof, façade, flexible). ▪Assessment of selected BIPV products regarding product ▪
criteria as well as additional values.Benchmark of selected BIPV products. ▪Benchmark of selected BIPV manufacturers. ▪
Product Data Sheet
EuPD Research 2011 19
Release Date February 2010
Information Sources Expert interviews with 39 manufacturers of BIPV modules ▪ and components from Europe and the US
Expert interviews with 22 selected contacts from BIPV ▪ planning, engineering and architecture in all major markets
Expert interviews with 23 project developers and installation ▪ companies in the top 5 markets
Further data sources were analyzed: ▪ - “EuPD PV Heaven“ – EuPD Research upstream database of all cell, module and inverter manufacturers - “EuPD Research company database/EuPD DAT”
Annual EuPD Research national market studies ▪ (of the German, Italian, Spanish, French and US PV markets, among others)
Further EuPD Research studies (e.g. “Installer Monitor ▪ 2009/2010”, “Global Off-Grid PV Markets” etc.)
Contents Research design & methodology1.
Introducing building-integrated PV2.
Analysis of top five BIPV markets3.
BIPV manufacturers (supply side)4.
Product requirements and procurement (demand side)5.
Add-on: installer insights6.
What lies ahead?7.
Benefits for your Company
Gain an overview of the conditions, the future development ▪ and the segmentation of most relevant markets for BIPV
Find out your partners in the area of product supply and ▪ the design and construction of roofs and facades
Understand the unmet needs and expectations of roof ▪ and facade engineering companies and end customers
Included in Delivery Primary survey of PV panel producers and market ▪ intermediaries
Analysis and interpretation ▪One annotated printed report, high quality binding ▪Optional: specific analysis of your company if mentioned ▪
frequently enough
Price € 2,490** $ 3,490**
Author/Contact Jan Winkler
Glo
bal
*(excluding sales tax/VAT) **(excluding sales tax/VAT and P&P)

20 EuPD Research 2011

EuPD Research 2011 21
2. The European PV Market

22 EuPD Research 2011
BACKGROUND
OBJECTIVES
ADVANTAGES
PV Market Matrix©
Dynamic tool to evaluate and compare PV country markets according to their appeal and investment risk. ▪Data aggregation guarantees reduction of complexity and compact information for decision maker level. ▪Quarterly updates ensure up-to-date information on changing investment conditions. ▪
Challenges for PV investments
Despite the strong growth of the European PV market, invest-ment decisions regarding PV have become more difficult. Also, the dynamic and volatility of PV market development has incre-ased. Reasons for this range from decreasing political support as grid parity approaches to major bureaucratic barriers.
Therefore, investing in PV requires both a sound understanding of the respective country markets as well as the capability of in-terpreting these insights with respect to individual needs.
Consideration of individual investment profiles
Feed-in-tariff
Country risk
Investment freedom
electricity prices (comm. & priv.)
Development of electricity prices
LCOE of PV systems / grid-parity
Profitability of net-metering
PV feed-in-tariff & irradiation
Irradiation
Availability of green certificates
Existence of green certificates
Independence from PV subsidies
General country conditions/risks
PV market sustainability
Stability of PV subsidy scheme
Grid capacity
Bureaucracy
PV market volume 2009, 2010, 2011
Grid capacity
Date of implementation
Perceived stability/instability
Price guarantee
General level of bureaucracy & corruption
Degree of bureaucracy in relevant segments
Perceived intensity of bureaucracy
Regional level of bureaucratic hurdles
0 100
0 100
0 100
0 100
0 100
0 100
0 100
0 100
0 100
0 100
0 100
0 100
0 100
0 100
0 100
0 100
0 100
0 100
0 100
0 100
0 100
0 100
0 100
0 100
0 100
0 100
Feed-in-tariff
Country risk
Investment freedom
electricity prices (comm. & priv.)
Development of electricity prices
LCOE of PV systems / grid-parity
Profitability of net-metering
PV feed-in-tariff & irradiation
Irradiation
Availability of green certificates
Existence of green certificates
Independence from PV subsidies
General country conditions/risks
PV market sustainability
Stability of PV subsidy scheme
Grid capacity
Bureaucracy
PV market volume 2009, 2010, 2011
Grid capacity
Date of implementation
Perceived stability/instability
Price guarantee
General level of bureaucracy & corruption
Degree of bureaucracy in relevant segments
Perceived intensity of bureaucracy
Regional level of bureaucratic hurdles
0 100
0 100
0 100
0 100
0 100
0 100
0 100
0 100
0 100
0 100
0 100
0 100
0 100
0 100
0 100
0 100
0 100
0 100
0 100
0 100
0 100
0 100
0 100
0 100
Systematic market analysis and evaluation option
The understanding of PV country markets requires knowledge of fundamental market data and relevant market trends. Thus, the “PV Market Matrix” provides:
an extensive database with quantitative information on more ▪ than 20 criteria relevant for determining the appeal and risk of investing in 30 European PV markets.
differentiation according to market segments (residential, ▪ commercial, open-space).
a quarterly update of these criteria. ▪the possibility to weight these criteria according to the indivi ▪
dual investment profile.
Reduced complexity of analyzed PV investment factors
The results of the individual weighting of the relevant criteria can be displayed in the “PV Market Matrix” from a “risk” and “profit” perspective.
Individual country rankings per mouse-click facilitate the ▪ optimal allocation of resources.
An ideal starting point for the elaboration of strategic options ▪ in finding the right target markets for PV investments.
Screenshots – Weighting the Overall Dimensions and Interpreting the Results
Consideration of individual investment profiles
Product Data Sheet
EuPD Research 2011 23
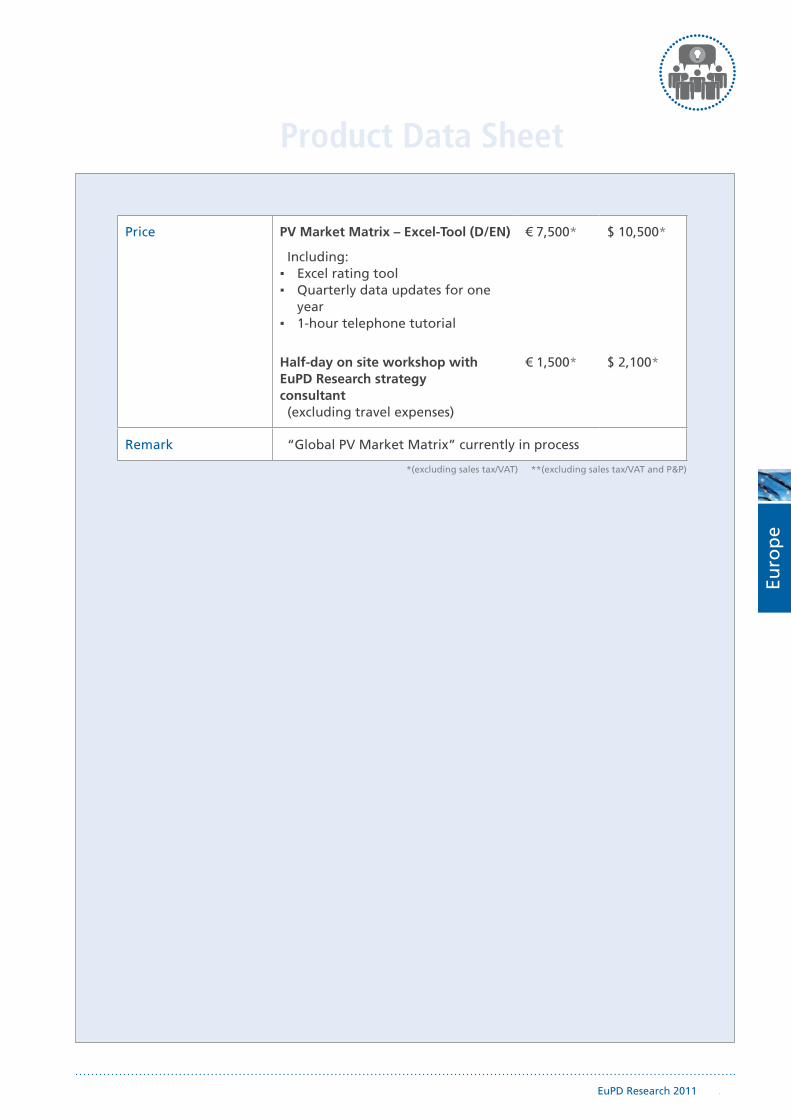
Price PV Market Matrix – Excel-Tool (D/EN)
Including:Excel rating tool ▪Quarterly data updates for one ▪year1-hour telephone tutorial ▪
Half-day on site workshop with EuPD Research strategy consultant (excluding travel expenses)
€ 7,500*
€ 1,500*
$ 10,500*
$ 2,100*
Remark “Global PV Market Matrix” currently in process
Euro
pe
*(excluding sales tax/VAT) **(excluding sales tax/VAT and P&P)
24 EuPD Research 2011
TURBULENT MARKET SITUATION IN KEY EUROPEAN PV MARKETS
GROWING IMPORTANCE OF EFFECTIVE AND EFFICIENT BRAND MANAGEMENT
THE NECESSITY OF BUILDING AND ExTENDING EFFECTIVE SALES CHANNELS
European PV InstallerMonitor© 2011/12 Procurement Management | Brand Significance | Sales Strategies
Receive comprehensive information on procurement management and distribution strategies from ▪ PV market intermediaries in the key European PV markets, Germany, Italy, France, Spain as well as UK, Belgium and Greece (optional).
Learn how installers, the gatekeepers to the end customer, perceive your brand. ▪Utilize markets insights to improve your current market situation as well as to identify promising ▪
business opportunities for the future.
Feed-in tariffs have been either cut or largely modified in all core European markets. As a result, market consolidation and compe-titive rivalry are on the increase. In order to remain successful in this challenging market situation, it is necessary to be up-to-date on the framework conditions and market figures of the key Euro-pean PV markets. Therefore, the study includes:
A detailed overview of framework conditions. ▪A display of market development and segmentation figures. ▪An identification of promising application types/customer ▪
groups etc.
The study will help you to increase or improve your sales channel activities. An insight into the procurement activities of installers is provided in order to support and secure this. Furthermore, both distribution activities and supplier strategies will be analyzed in detail. Amongst others, the following points will be covered:
Procurement channels. ▪Market positioning of the most important PV suppliers. ▪Distribution ranges of top PV module and inverter manufac- ▪
turers, as well as of top wholesalers.
On the basis of a large number of quantitative interviews, the study will provide a detailed impression of installer brand awa-reness and recognition in all sales markets subject to analysis. This will allow your company to successfully adjust its marketing strategies and brand management. For instance, the following essential aspects will be looked at:
Assessment of brand status, value and loyalty. ▪Reasons for selecting or not selecting a PV brand. ▪Benchmark of most important PV suppliers. ▪
Ab
ove
ave
rag
e im
po
rtan
ceB
elo
w a
vera
ge
imp
ort
ance
+30%
-30%
PriceTechnology Availability Prior experience Brand image
Price Technology Availability Prior experience Brand image
BRAND
BRAND
BRAND
BRAND
BRAND
BRAND
BRAND
BRAND
BRAND
BRAND
Ab
ove
ave
rag
e im
po
rtan
ceB
elo
w a
vera
ge
imp
ort
ance
+30%
-30%
PriceTechnology Availability Prior experience Brand image
Price Technology Availability Prior experience Brand image
BRAND
BRAND
BRAND
BRAND
BRAND
BRAND
BRAND
BRAND
BRAND
BRAND
Sample chart
Sample chart
Sample chart

Product Data Sheet
EuPD Research 2011 25
Information Sources Standard package: Approx. 750 quantitative interviews with ▪ PV installers from Germany, Italy, France and Spain
Extended package (optional): UK, Belgium, Greece ▪Systematic desk research (external databases, business ▪
reports, etc.)EuPD DAT – internal database (quarterly EuPD studies, EuPD ▪
market reports, etc.)
Contents General Introduction I. BackgroundII. ContentsIII. Theoretical CommentsIV. Research Design V. Description of the Sample
Part I. – Germany A. Market AnalysisB. Procurement Management C. Market Penetration: Supplier Positioning D. Brand Management: Awareness and Image
Part II. – Spain A.-D. (as shown in Part I.)
Part III. – ItalyA.-D. (as shown in Part I.)
Part IV. – FranceA.-D. (as shown in Part I.)
Country Comparison
Benefits for your Company
Become part of an exclusive client group which receives ▪ comprehensive market knowledge at an attractive price
Fully understand installer attitudes, requirements and ex- ▪ pectations of PV components and supplier services based on the survey results
Identify the most promising sales markets and customer ▪ segments based on a detailed country comparison in order to increase sales margin
Included in Delivery Standard package: 1x report, high quality binding, digital ePaper and 1x Excel table reportExtended package: 1x seperate report for each country market
Price Standard packageExtended package: Standard packa-ge plus (Price depends on number of countries)
€ 14,900**€ 4,500 to € 7,500**
$ 22,900**$ 6,300 to $ 10,500**
Author/Contact René Mund and Stefano Reccia
Euro
pe
*(excluding sales tax/VAT) **(excluding sales tax/VAT and P&P)

26 EuPD Research 2011
SALES CHANNEL ARCHITECTURE
PRODUCT FEATURES AND SUCCESS FACTORS
VALUE OF BRAND MANAGEMENT
European PV InverterMonitor©
Recognize the main players in the most important European PV markets (Germany, Italy and France). ▪ This helps you to navigate within this fast moving industry.
Focus on downstream data in order to leverage your sales activities. ▪Receive comprehensive primary data-based information on the PV inverter market. ▪Understand installer behavior and dynamics in the market for an increasingly important system ▪
component. Learn how installers, the gatekeeper to the end customer, perceive different brands. ▪
The study will help you to extend and improve your sales channel activities. An insight into the procurement activities of installers is provided in order to support and secure this.
Furthermore, both distribution activities and supplier strategies will be analyzed in detail. Amongst others, installer procurement channels, distribution ranges of top PV inverter manufacturers as well as the market penetration of the most important PV inverter suppliers will be covered.
On the basis of more than 400 quantitative interviews, the study will provide a detailed impression of installer brand awareness and recognition. This will support your company in improving its marketing strategies and brand management.
The analyses include assessment of brand status, brand value and loyalty as well as the reasons for selecting or not selecting a spe-cific PV inverter brand. Furthermore a benchmark of most impor-tant PV inverter suppliers will be given. Brands covered include SMA, Fonius, Solarmax, Kaco, Danfoss or Mastervolt.
A substancial part of the report will cover the subject of product features required by the installer:
What are the features most desired by the installers? ▪Which technological developments have to be considered? ▪Which technological features are required? ▪The study will provide an overview with regard to current ▪
and future product characteristics of interest.This will provide you with additional knowledge to more ▪
accurately meet your customer requirements.
Source: EuPD Research 2010
Siemens (n=11)
SMA (n=201)
Schüco (n=9)
Mastervolt (n=9)
Kostal (n=24)
PowerOne (n=13)
Fronius (n=75)
Sunways (n=15)
Solarmax (n=31)
Kaco (n=41)
Danfoss (n=31)
Exclusive: no other thin-film module brands in installer's portfolio (proportion = 100%)Dominator: brand dominates installer's portfolio (proportion ≥ 50%) Complementary: brand influences the portfolio without dominating (proportion between 25% and 50%)Space-filler: brand has an inferior position in the installer's portfolio (proportion between 0% and 25%)
Exclusive: no other thin-film module brands in installer's portfolio (proportion = 100%)Dominator: brand dominates installer's portfolio (proportion ≥ 50%) Complementary: brand influences the portfolio without dominating (proportion between 25% and 50%)Space-filler: brand has an inferior position in the installer's portfolio (proportion between 0% and 25%)
Sample chart
Source: EuPD Research 2010
2008: n=245
2007: n=257
2009: n=249
2010: n=237
< 0%
> 0%
Market shares
> 6%
> 4% – 6%
0% – 4%
= 0%
Dis
trib
uti
on
ran
ge
2007
Dis
trib
uti
on
ran
ge
2008
Dis
trib
uti
on
ran
ge
2009
Dis
trib
uti
on
ran
ge
2010
abso
lute
ch
ang
ein
co
mp
aris
on
to 2
009
Dis
trib
uti
on
ran
ge
2007
Dis
trib
uti
on
ran
ge
2008
Dis
trib
uti
on
ran
ge
2009
Dis
trib
uti
on
ran
ge
2010
abso
lute
ch
ang
ein
co
mp
aris
on
to 2
009
Company 1 48.3% 54.4% 54.8% 52.6% -2.2% SolarWorld 2.5% 1.0% 0.4% 0.6% 0.2%
Company 2 17.1% 14.7% 16.2% 9.8% -6.4% Refu 0.0% 0.0% 0.5% 0.5% 0.0%
Company 3 10.9% 8.4% 6.6% 7.8% 1.2% IBC Solar 0.0% 0.7% 0.8% 0.5% -0.3%
Company 4 3.2% 3.6% 2.5% 4.8% 2.3% Steca 0.0% 0.3% 0.4% 0.4% 0.0%
Company 5 0.0% 0.6% 1.5% 3.3% 1.8% Diehl 0.4% 0.2% 0.7% 0.4% -0.4%
Company 6 0.0% 2.2% 2.8% 2.9% 0.1% Conergy 1.0% 0.1% 0.3% 0.4% 0.1%
Company 7 0.0% 0.0% 1.5% 2.7% 1.2% Mitsubishi 0.0% 0.0% 0.0% 0.2% 0.2%
Company 8 1.6% 0.9% 0.5% 2.2% 1.7% AEG 0.0% 0.0% 0.1% 0.2% 0.1%
Company 9 0.0% 3.3% 1.5% 1.9% 0.4% Aixcon 0.0% 0.0% 0.0% 0.2% 0.2%
Company 10 2.0% 1.1% 0.4% 1.8% 1.4% Voltwerk 0.0% 0.0% 0.0% 0.2% 0.2%
Company 11 2.0% 1.8% 1.8% 1.8% 0.0% Other 10.8% 5.9% 6.5% 4.0%
Company 12 0.2% 0.7% 0.1% 0.8% 0.7%
Dis
trib
uti
on
ran
ge
2007
Dis
trib
uti
on
ran
ge
2008
Dis
trib
uti
on
ran
ge
2009
Dis
trib
uti
on
ran
ge
2010
abso
lute
ch
ang
ein
co
mp
aris
on
to 2
009
Dis
trib
uti
on
ran
ge
2007
Dis
trib
uti
on
ran
ge
2008
Dis
trib
uti
on
ran
ge
2009
Dis
trib
uti
on
ran
ge
2010
abso
lute
ch
ang
ein
co
mp
aris
on
to 2
009
Company 1 48.3% 54.4% 54.8% 52.6% -2.2% SolarWorld 2.5% 1.0% 0.4% 0.6% 0.2%
Company 2 17.1% 14.7% 16.2% 9.8% -6.4% Refu 0.0% 0.0% 0.5% 0.5% 0.0%
Company 3 10.9% 8.4% 6.6% 7.8% 1.2% IBC Solar 0.0% 0.7% 0.8% 0.5% -0.3%
Company 4 3.2% 3.6% 2.5% 4.8% 2.3% Steca 0.0% 0.3% 0.4% 0.4% 0.0%
Company 5 0.0% 0.6% 1.5% 3.3% 1.8% Diehl 0.4% 0.2% 0.7% 0.4% -0.4%
Company 6 0.0% 2.2% 2.8% 2.9% 0.1% Conergy 1.0% 0.1% 0.3% 0.4% 0.1%
Company 7 0.0% 0.0% 1.5% 2.7% 1.2% Mitsubishi 0.0% 0.0% 0.0% 0.2% 0.2%
Company 8 1.6% 0.9% 0.5% 2.2% 1.7% AEG 0.0%
Dis
trib
uti
on
ran
ge
2007
Dis
trib
uti
on
ran
ge
2008
Dis
trib
uti
on
ran
ge
2009
Dis
trib
uti
on
ran
ge
2010
abso
lute
ch
ang
ein
co
mp
aris
on
to 2
009
Dis
trib
uti
on
ran
ge
2007
Dis
trib
uti
on
ran
ge
2008
Dis
trib
uti
on
ran
ge
2009
Dis
trib
uti
on
ran
ge
2010
abso
lute
ch
ang
ein
co
mp
aris
on
to 2
009
Company 1 48.3% 54.4% 54.8% 52.6% -2.2% SolarWorld 2.5% 1.0% 0.4% 0.6% 0.2%
Company 2 17.1% 14.7% 16.2% 9.8% -6.4% Refu 0.0% 0.0% 0.5% 0.5% 0.0%
Company 3 10.9% 8.4% 6.6% 7.8% 1.2% IBC Solar 0.0% 0.7% 0.8% 0.5% -0.3%
Company 4 3.2% 3.6% 2.5% 4.8% 2.3% Steca 0.0% 0.3% 0.4% 0.4% 0.0%
Company 5 0.0% 0.6% 1.5% 3.3% 1.8% Diehl 0.4% 0.2% 0.7% 0.4% -0.4%
Company 6 0.0% 2.2% 2.8% 2.9% 0.1% Conergy 1.0% 0.1% 0.3% 0.4% 0.1%
Company 7 0.0% 0.0% 1.5% 2.7% 1.2% Mitsubishi 0.0% 0.0% 0.0% 0.2% 0.2%
Company 8 1.6% 0.9% 0.5% 2.2% 1.7% AEG 0.0% 0.0% 0.1% 0.2% 0.1%
Company 9 0.0% 3.3% 1.5% 1.9% 0.4% Aixcon 0.0% 0.0% 0.0% 0.2% 0.2%
Company 10 2.0% 1.1% 0.4% 1.8% 1.4% Voltwerk 0.0% 0.0% 0.0% 0.2% 0.2%
Company 11 2.0% 1.8% 1.8% 1.8% 0.0% Other 10.8% 5.9% 6.5% 4.0%
Company 12 0.2% 0.7% 0.1% 0.8% 0.7%
0.0% 0.1% 0.2% 0.1%
Company 9 0.0% 3.3% 1.5% 1.9% 0.4% Aixcon 0.0% 0.0% 0.0% 0.2% 0.2%
Company 10 2.0% 1.1% 0.4% 1.8% 1.4% Voltwerk 0.0% 0.0% 0.0% 0.2% 0.2%
Company 11 2.0% 1.8% 1.8% 1.8% 0.0% Other 10.8% 5.9% 6.5% 4.0%
Company 12 0.2% 0.7% 0.1% 0.8% 0.7%
Sample chart
“How important you consider the following control and MV connection features?”
Product features
Bi-directional communication
VAR support
Remote VAR control
Anti-Islanding
Total ## ## ## ##
Static and dynamic VAR control
2.33
##
Frequency response
3.002.672.75 2.002.38
Over and under voltage protection
2.13 2.502.501.67 2.002.14
2.33 3.252.401.75 2.472.43
2.22 3.252.832.00 2.292.46
1.75 3.002.672.33 2.152.26
1.71 2.002.331.33 2.132.00
1.44 2.502.331.751.92 1.93
very important1 42 important 3 of average relevance of less relevance not important at all5 (mean values)
Sample chart
EuPD Research 2011 27
Product Data Sheet
Information Sources Quantitative interviews with installation companies in the ▪ key European PV markets
Systematic desk research (external databases, business ▪ reports, etc.)
EuPD DAT – internal market & industry database ▪
Contents(Subject to change)
Executive SummaryPart I. – Industry Overview ▪Part II. – Brand Awareness ▪Part III. – Procurement Behavior ▪Part IV. – Price Development ▪Part V. – Product Characteristics ▪Part VI. – Conclusion ▪
Benefits for your Company
Receive helpful information in order to develop innovative ▪ marketing strategies
Realize the dynamics of this rapidly changing industry to ▪ gain a competitive advantage
Better understand customer attitudes, requirements and ▪ expectations with regard to PV inverters
Leverage your sales efforts by efficiently targeting customer ▪ expectations in order to increase sales margin
Included in Delivery 1x report, high quality binding
Price € 4,950** $ 6,900**
Author/Contact Stefan Pietzsch
Euro
pe
*(excluding sales tax/VAT) **(excluding sales tax/VAT and P&P)
28 EuPD Research 2011
BRAND AWARENESS
PRICE SITUATION AND FUTURE TRENDS
NEW: FORECAST SCENARIO OF MODULE PRICE DEVELOPMENT
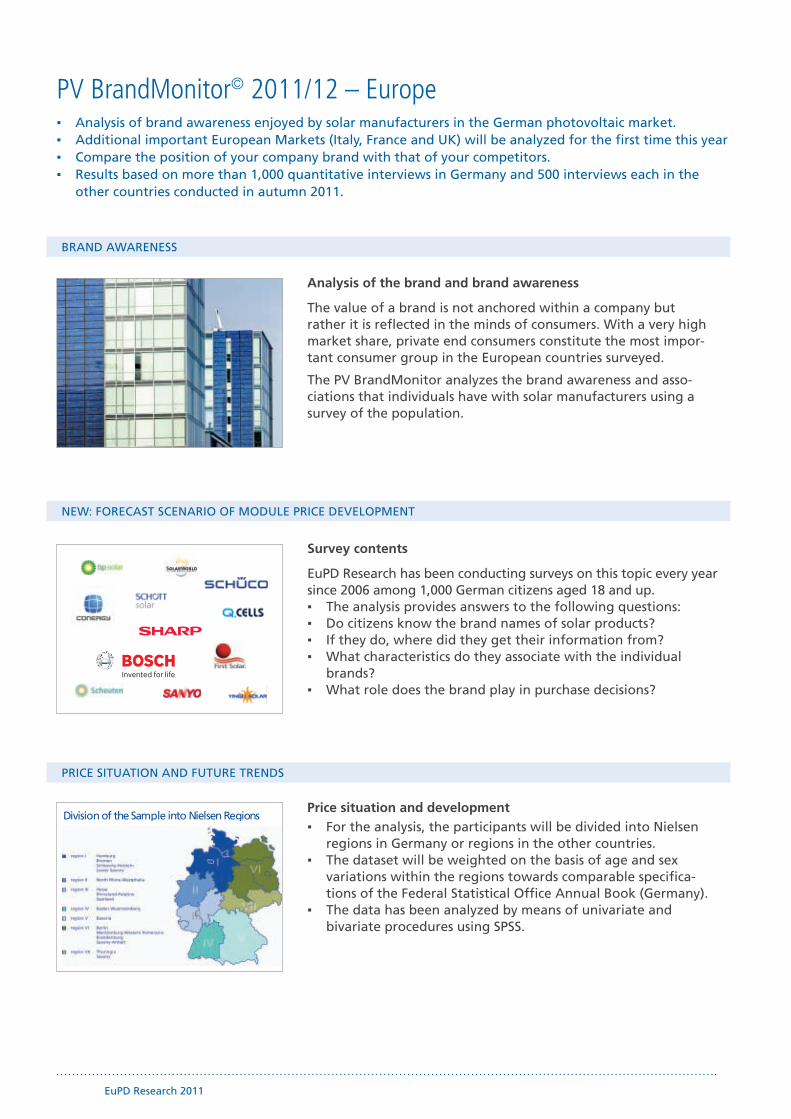
PV BrandMonitor© 2011/12 – Europe Analysis of brand awareness enjoyed by solar manufacturers in the German photovoltaic market. ▪Additional important European Markets (Italy, France and UK) will be analyzed for the first time this year ▪Compare the position of your company brand with that of your competitors. ▪Results based on more than 1,000 quantitative interviews in Germany and 500 interviews each in the ▪
other countries conducted in autumn 2011.
Analysis of the brand and brand awareness
The value of a brand is not anchored within a company but rather it is reflected in the minds of consumers. With a very high market share, private end consumers constitute the most impor-tant consumer group in the European countries surveyed.
The PV BrandMonitor analyzes the brand awareness and asso-ciations that individuals have with solar manufacturers using a survey of the population.
Survey contents
EuPD Research has been conducting surveys on this topic every year since 2006 among 1,000 German citizens aged 18 and up.
The analysis provides answers to the following questions: ▪Do citizens know the brand names of solar products? ▪If they do, where did they get their information from? ▪What characteristics do they associate with the individual ▪
brands?What role does the brand play in purchase decisions? ▪
Price situation and developmentFor the analysis, the participants will be divided into Nielsen ▪
regions in Germany or regions in the other countries.The dataset will be weighted on the basis of age and sex ▪
variations within the regions towards comparable specifica- tions of the Federal Statistical Office Annual Book (Germany).
The data has been analyzed by means of univariate and ▪ bivariate procedures using SPSS.
Divisio n of the Sam p le into Niel sen Re gions

EuPD Research 2011 29
Product Data Sheet
Release Date January 2012
Information Sources Representative, nationwide random sample ▪CATI-survey of persons aged 18 years and older ▪Survey by the last-birthday-method within a household ▪1,000 questionnaires answered in Germany, 500 each in Italy, ▪
France and UKSurvey period: November/December 2011 ▪
Contents Basic Version:
Background of the Study 1.
Objectives, Method and Sample 2.
Composition of the Sample3.
Owner and Planner of a Solar Plant4.
Attitude and Reception Analysis5.
Brand Analysis 6.
Conclusion 7.
Exclusive Version:
If your company is mentioned more than 30 times, an exclusive analysis of your brand name can be conducted in comparison to other well-known solar brands.
1. Individual Solar Brand Analysis (brand awareness in different subgroups, associations with your brand and illustration of different attributes)
2. Regional Analysis (comparison of brand awareness on a regional level)
Benefits for your Company
Compare the position of your company brand to that of ▪ your competitors
Monitor the success of your advertising ▪Advertise on the channels that end customers use to inform ▪
themselves about solar energyAdjust your advertising messages to suit the consumer types ▪
identifiedLearn more about the end customer attitudes toward ▪
certain energy topicsDesign your brand image on the basis of the status quo ▪Better assess the positioning of your competitors ▪
Included in Delivery Printed annotated report (min. 50 pages), high quality binding
Price Basic version per country Exclusive version per country
€ 5,500** € 9,500**
$ 8,900** $ 14,900**
Author/Contact Richard Peikert
Euro
pe
*(excluding sales tax/VAT) **(excluding sales tax/VAT and P&P)
30 EuPD Research 2011
THE EUPD RESEARCH PV SEAL | SUCCESSFUL BRAND MANAGEMENT
MULTIPLE BENEFITS FOR YOU AND YOUR CUSTOMERS
VALUE COMBINATION OF THE TWO EUPD RESEARCH FLAGSHIP PRODUCTS
PV Seal 2011/12Module and inverter producers profi t by differentiating themselves from their competitors. ▪The PV Seal increases credibility and create trust among end customers and business partners. ▪Digital PV Seal for direct use in all online and print media plus creation of an offi cial seal certifi cate. ▪
For brand management to be successful, a brand should be independent and possess differentiating functional or emotional characteristics in order to be desirable. Only then does it have its own specifi c signature making it distinguishable and recogniz-able. Based on more than ten years of research, EuPD Research has developed an evaluation model to emphasize the aspects of successful brand management – the basis of the PV Seal.
So far awards in the photovoltaic branch have focused only on the technical aspects of the various module and inverter manufacturers. Currently, there is no seal representative of the attitudes of quali-fi ed installers and end customers to the brands they buy. EuPD Research took this as an an impetus to create the PV seal which combines the results from the PV InstallerMonitor and the PV BrandMonitor relevant for brand differentiation.
Manufacturers of PV panels and inverters benefi t from the ▪ results of our independent analyses, increase credibility and create trust among end customers and business partners. As the seal can be integrated fl exibly into any marketing strategy, companies receive a multi-purpose design element to differentiate themselves from their competitors. The accompanying communications material contributes signifi - cantly to brand perception.
Market intermediaries can use the “Top Brand PV” seal to ▪ differentiate their portfolios from the competition. This enables cost-effi cient marketing measures, at no extra cost for your intermediaries.�
End customers can use the seal for the reduction of uncer- ▪ tainty in the buying process as it can be easily understood by end customers.
PV Seal
Image
Brand Awareness
CoherentIndependent
Results
Free Benefits for Intermediaries
Holistic
Approach
EuPD Research PV Seal
Communications
Support
Distinguishing Features
Strengthens Corporate Identity
Differentiation
EuPD Research – Shared Services
PV InstallerMonitor©
EuPD Research – Shared Services
PV InstallerMonitor
EuPD Research – Multi Client Services
PV BrandMonitor©

EuPD Research 2011 31
Product Data Sheet
Euro
pe
Information Sources PV InstallerMonitor®
PV BrandMonitor®
Included Delivery PV Seal 2011/12 (EPS, JPG, GIF or PNG) for direct use online ▪ and in print media
Only available for the Top 20 PV brands and to participants ▪ of the PV InstallerMonitor and the PV BrandMonitor
Creation of an official seal certificate to be given to ▪ intermediaries (PDF)
Press release to the EuPD journalist network ▪Info-Mail to be sent to over 10,000 relevant intermediaries ▪
in the most important PV marketsBrand mentioned in the EuPD Research Corporate Newsletter, ▪
with more than 4,000 recipients from all levels of the PV value chain
Country Options: Germany (Italy, France, and UK are to be offered soon)
Price For use until 31/12/2012 € 10,000** $ 13,990**
*(excluding sales tax/VAT) **(excluding sales tax/VAT and P&P)
32 EuPD Research 2011
PRODUCT AND APPLICATION
PRICE SITUATION AND FUTURE TRENDS
NEW: FORECAST SCENARIO OF MODULE PRICE DEVELOPMENT
European PV ModulePriceMonitor©
Quarterly panel research to measure the price of PV modules and PV systems in Germany, Spain, ▪ Italy and France.
Display of price climate based on the current pricing situation and the expected development ▪ and forecast.
Module prices of the most installed brands for the three different module technologies. ▪
Composition of the European PV ModulePriceMonitor
As part of an exclusive customer group you will be able to access the results of the quarterly Europe-wide survey on PV installers at a preferential price. The goal of this product is to collect specific information on price developments in the most important Euro-pean PV markets (GER, IT, FR, ES). It includes:
Relative shares and purchase prices of the three module ▪ technologies.
Current system sales prices for rooftop PV systems. ▪Actual module prices of the most used brands and country ▪
of origin (by headquarter) for the three different module technologies.
Analysis of price differences between certain groups of ▪ installers (e.g. grouped by different customer groups).
Method and advantages of the forecast scenario
A panel of installers, who can provide reliable statements on price development considering their product portfolios and sales volumes, will be asked in every quarter about the future trend of prices of crystalline and thin film modules:
There will be a short-term (3 month) price forecast for three ▪ different module technologies in Eurocent.
Price changes can be compared to current prices, and a pro- ▪ gressive price forecast can be developed.
Price forecasts will reveal information about the installers’ ▪ perception of prices and will give market players the possibi- lity to react to short term changes.
Price situation and development
To determine a sustainable price policy, it is important for every company active in the PV market to observe the price develop-ments of the most significant photovoltaic markets:
Price levels and expectations for the different technologies. ▪Net purchase prices and price development for the three ▪
different module types (mono, polycrystalline and thin film).Price index for panel technologies. ▪Current system sales prices for rooftop PV systems (sales price ▪
for systems 3-10 kWp, 30-50 kWp, 300 kWp, 1,000 kWp open- space), plus cost breakdown for system <30 kWp.
Nominal interest rate regarding capital return. ▪
2.07
3.172.91
2.582.15
1.5 €
2.0 €
2.5 €
3.0 €
3.5 €
4.0 €
Source: EuPD Research 11/2009
Ger
man
y
Spai
n
Ital
y
2.04
2.53
3.242.92
2.25
1.5 €2.0 €2.5 €3.0 €3.5 €4.0 €
2.01
2.392.80
3.053.27
1.5 €2.0 €2.5 €3.0 €3.5 €4.0 €
2.80
3.863.33 3.26
2.66
1.5 €2.0 €2.5 €3.0 €3.5 €4.0 €
Fran
ce
Q2 2009 Q3 2009 Q1 2010 Q4 2009 Q2 2010
22.007722.1155
22.004422..2255
22.0011
2..39
2.8022.6666
* example figures
Domestic
No name manufacturer
brand Foreign brand
ES
FR
IT
GER
98,4%
93,6%
87,1%86,5%
85,5%
89,7%88,6%
95,1%
90,1%
86,6%
89,5% 87,5%
89,5%91,1%
86,6%87,5%
88,2%
95,3%
90,6%89,3%
90,6%
93,6%93,6%94,3%
100,0%
80%
85%
90%
95%
100%
105%
Bezug Q2 2006 3. Quartal 2006 4. Quartal 2006 1. Quartal 2007 2. Quartal 2007 3. Quartal 2007 4. Quartal 2007 1. Quartal 2008 2. Quartal 2008 3. Quartal 2008
monokristalline Module polykristalline Module Dünnschicht-Module Start: 2. Quartal 2006 = 100%
Quelle: EuPD Research 08/2008
Preisindex PV-Module
%
93,6%
89,7%%88,6%
90,1%
86,6%
89,5% 87,5%
89,5%91,1%
93,6%93,6%994,,3%
1. Quartal 2007 2. Quartal 2007 3. Quartal 2007 4. Quartal 2007
Für das 3. Quartal 2006 sind keine Angaben verfügbar
Module technology price index (weighted by technology shares)
3.7003.800
3.9003.9004.1344.158
4.392 4.373
4.8504.800
5.100 5.200
0 €
1.000 €
2.000 €
3.000 €
4.000 €
5.000 €
6.000 €
7.000 €
2. Quartal 2008 3. Quartal 2008 2. Quartal 2008 3. Quartal 2008
Minimum Mittelwert Maximum
Quelle: EuPD Research 08/2008
Wie hoch ist derzeit der Systempreis für eine PV-Aufdachanlage pro kWp?
Anlage unter 10 kWp Anlage zwischen 10 und 100 kWp
n = 100
System price development andcomparison of prices by different sizes
41,2 44,039,1 39,8 37,1 39,8 38,3 39,0
52,7 49,853,8 51,5 53,8 49,2 52,0 52,6
6,2 6,2 7,0 8,8 9,1 11,0 9,7 8,4
0%
10%
20%
30%
40%
50%
60%
70%
80%
90%
100%
4. Quartal 2006 1. Quartal 2007 2. Quartal 2007 3. Quartal 2007 4. Quartal 2007 1. Quartal 2008 2. Quartal 2008 3. Quartal 2008
monokristalline Module polykristalline Module Dünnschicht-Module
Quelle: EuPD Research 08/2008
Entwicklung der Anteile der PV-Modultechnologien an der installierten Leistung im Quartalsvergleich
n = 100
Development of technology shares41,2 44,0
39,1 39,8 37,1 39,8 38,3 39,0
52,7 49,853,8 51,5 53,8 49,2 52,0 52,6
6,2 6,2 7,0 8,8 9,1 11,0 9,7 8,4
0%
10%
20%
30%
40%
50%
60%
70%
80%
90%
100%
4. Quartal 2006 1. Quartal 2007 2. Quartal 2007 3. Quartal 2007 4. Quartal 2007 1. Quartal 2008 2. Quartal 2008 3. Quartal 2008
monokristalline Module polykristalline Module Dünnschicht-Module
Quelle: EuPD Research 08/2008
Entwicklung der Anteile der PV-Modultechnologien an der installierten Leistung im Quartalsvergleich
n = 100
Development of technology shares-3,61
0,770,70
1,64
0,96
2,49
0,97
0,31
5,00
-1,92
1,74
0,000,63
3,47
-0,96
0,00
-4,0%
-3,0%
-2,0%
-1,0%
0,0%
1,0%
2,0%
3,0%
4,0%
5,0%
6,0%
deutscheMarkenhersteller
ausländischeMarkenhersteller
ausländische No-Name-Hersteller
deutscheMarkenhersteller
ausländischeMarkenhersteller
ausländische No-Name-Hersteller
deutscheMarkenhersteller
ausländischeMarkenhersteller
1. Quartal bis 2. Quartal 2008 2. Quartal bis 3. Quartal 2008
Quelle: EuPD Research 08/2008
Wie haben sich die Netto-Einkaufspreise zwischen dem ersten Quartal 2008 und dem zweiten Quartal 2008 zu dem zweiten und dritten Quartal 2008 verändert (Mittelwerte)?
n = 100
monokristalline Module polykristalline Module Dünnschicht-Module
Development of net purchase prices-3,61
0,770,70
1,64
0,96
2,49
0,97
0,31
5,00
-1,92
1,74
0,000,63
3,47
-0,96
0,00
-4,0%
-3,0%
-2,0%
-1,0%
0,0%
1,0%
2,0%
3,0%
4,0%
5,0%
6,0%
deutscheMarkenhersteller
ausländischeMarkenhersteller
ausländische No-Name-Hersteller
deutscheMarkenhersteller
ausländischeMarkenhersteller
ausländische No-Name-Hersteller
deutscheMarkenhersteller
ausländischeMarkenhersteller
1. Quartal bis 2. Quartal 2008 2. Quartal bis 3. Quartal 2008
Quelle: EuPD Research 08/2008
Wie haben sich die Netto-Einkaufspreise zwischen dem ersten Quartal 2008 und dem zweiten Quartal 2008 zu dem zweiten und dritten Quartal 2008 verändert (Mittelwerte)?
n = 100
monokristalline Module polykristalline Module Dünnschicht-Module
Development of net purchase prices
EuPD Research 2011 33
Product Data Sheet
Release Date Second month of each quarter
Information Sources Quantitative survey of a minimum of 235 installers who made statements regarding module technologies from brand manu-facturers in their portfolio.
Distribution of installers surveyed:Germany (100 participants) ▪France (minimum 45 participants) ▪Italy (minimum 45 participants) ▪Spain (minimum 45 participants) ▪
Contents Background and Research Approach1.
Sample Description2.
General Price Development3.
Purchase Prices4.
Panel Manufacturers5.
System Prices6.
System Prices (Nominal Interest Rate Regarding 7. Capital Return)
Benefits for your Company
Be part of an exclusive customer group able to access the ▪ results of the Europe-wide survey on PV installers at a preferential price
Get an overview of module prices for installers in the most ▪ important European markets
Compare country-specific prices for modules and systems for ▪ the different technologies and monitor their development
Appraise the market situation and potential of various ▪ markets by comparing the module prices of different brands and price differences between certain groups of installers
Get forecasts of module price development in the most ▪ important European markets
Included in Delivery 1x chart report per quarter (end of second month of each quarter)
Price Per year € 9,500* $ 14,500*
Author/Contact Michael Reuter and Richard Peikert
Euro
pe
*(excluding sales tax/VAT) **(excluding sales tax/VAT and P&P)
34 EuPD Research 2011
MODULE 1: ExCEL-TOOL
MODULE 2: CHART REPORT
PV SalesMonitor© – Germany Price Differentiation, Benchmark Analysis, System Configuration
Excel-Tool for the analysis of comprehensive PV system data in Germany. ▪Optional data report summary and overview of the most important results. ▪Monthly updates are provided via an update of the Excel-Tool. ▪
Comprehensive PV system data analysis
Detailed characteristics of German PV systems are aggregated by postal code. By means of this Excel-Tool, analyses can be conduc-ted on the following characteristics:
System price ▪Module manufacturer ▪Inverter brand ▪System size ▪Zip-code regions ▪System configuration ▪
Annotated data report (optional)
An optional report summarizes the most important results by making use of visual and graphical tools. The most relevant out-comes are presented and annotated. The following questions will be answered:
What was the system price range observed? ▪Which inverters were installed in combination with ▪
which module?How do regional prices differ? ▪
aleo solar, 1.93aleo solar, 1.88
SCHOTT Solar, 1.97
SCHOTT Solar, 2.83
Schüco, 1.95
Schüco, 2.10
SolarWorld, 2.34
SolarWorld, 2.05SolarWorld, 2.00 SolarWorld, 2.00
Sovello, 1.78
BP Solar, 1.95Kyocera Solar, 2.00
Kyocera Solar, 1.95
Suntech, 1.65
Suntech, 1.76
Yingli Solar, 1.54
ATERSA, 1.71
Conergy, 2.10
Solar Power, 1.88
Mitsubishi, 1.50
SHARP, 2.60
Photowatt, 3.41
Solar-Fabrik, 2.38
BP Solar, 2.00
BP Solar, 1.88 Kyocera Solar, 1.92
Kyocera Solar, 3.12
Suntech, 1.62
Conergy, 1.92
SHARP, 1.60
1.40 €
1.60 €
1.80 €
2.00 €
2.20 €
2.40 €
2.60 €
2.80 €
3.00 €
3.20 €
3.40 €
3.60 €
3.80 €
Region 1 Region 2 Region 3 Region 4
CONTINUOUS ENHANCEMENT
Monthly updates
Underlying data for the Excel-Tool are updated on a monthly basis. You benefit from a comprehensive overview of the market, enabling you to react faster than competitors.
Sample chart
Sample chart
Sample chart

Product Data Sheet
EuPD Research 2011 35
Contents The product contains information regarding the following aspects:
System prices1.
Module brands2.
Inverter brands3.
System sizes4.
Zip-code regions5.
System configuration6.
Benefits for your Company
Gain competitive advantages by optimizing the application ▪ of marketing instruments
Gain information for the support of your pricing strategy ▪Optimize your sales controlling ▪Monitor your market presence in the several zip-code ▪
regions in GermanyReceive a database for individual benchmark analyses ▪
Included in Delivery Module 1: MS Excel tool (including twelve monthly updates, in German or English language)
Module 2: Optional MS PowerPoint report presents the most important results of module 1 in an annotated presentation
Price Module 1 Module 2 plus For four quarterly updates
€ 4,950* € 3,480 + € 2,460*
$ 6,950* $ 4,890 + $ 3,450*
Author/Contact Till von Versen
Euro
pe
*(excluding sales tax/VAT) **(excluding sales tax/VAT and P&P)
36 EuPD Research 2011
UNDERSTANDING GRID PARITY
IS A PARADIGM SHIFT IN THE PV INDUSTRY ON THE HORIZON?
Dawning of a New Era – Photovoltaics on the Edge of Grid Parity Develop insights on ‘Grid Parity’ and when it will be reached in key EU PV markets/segments. ▪Learn about the effects that the grid parity phenomenon could have on the dynamics of the PV ▪
market.Benefit from the latest strategy recommendations provided by EuPD consultants. Utilize them to ▪
improve your current market situation and identify promising business opportunities for the future.
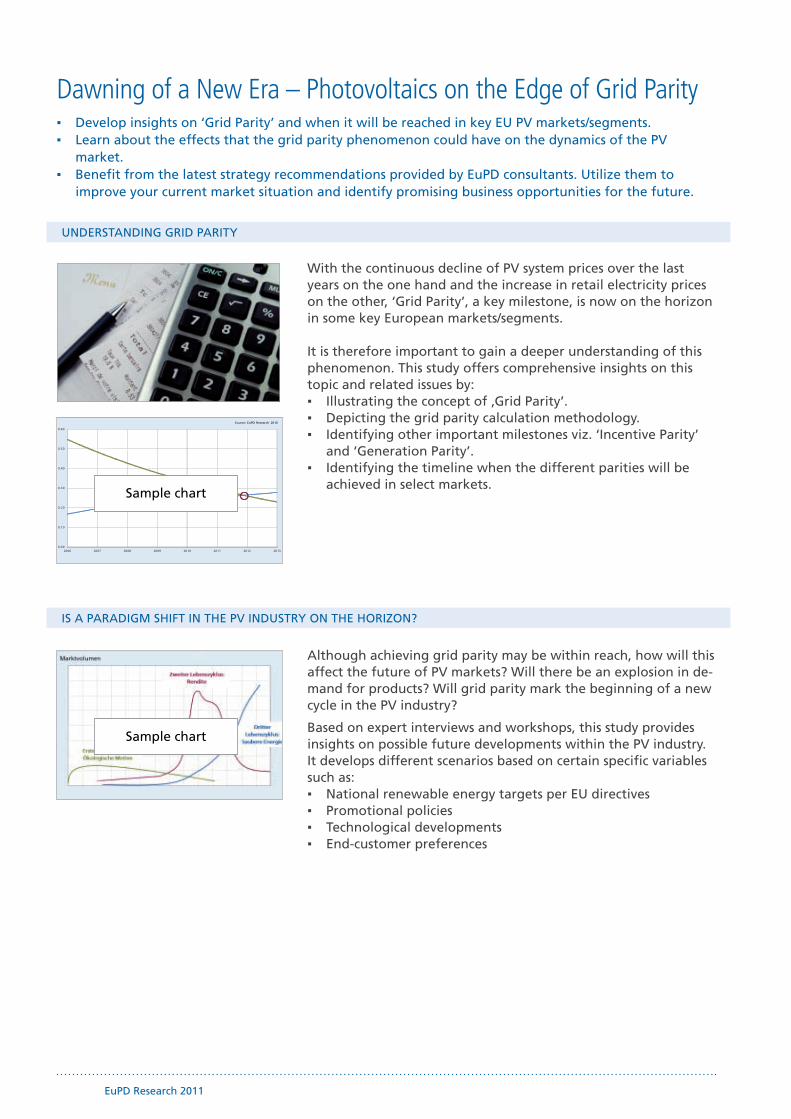
With the continuous decline of PV system prices over the last years on the one hand and the increase in retail electricity prices on the other, ‘Grid Parity’, a key milestone, is now on the horizon in some key European markets/segments. It is therefore important to gain a deeper understanding of this phenomenon. This study offers comprehensive insights on this topic and related issues by:
Illustrating the concept of ‚Grid Parity’. ▪Depicting the grid parity calculation methodology. ▪Identifying other important milestones viz. ‘Incentive Parity’ ▪
and ‘Generation Parity’.Identifying the timeline when the different parities will be ▪
achieved in select markets.
Although achieving grid parity may be within reach, how will this affect the future of PV markets? Will there be an explosion in de-mand for products? Will grid parity mark the beginning of a new cycle in the PV industry?
Based on expert interviews and workshops, this study provides insights on possible future developments within the PV industry. It develops different scenarios based on certain specific variables such as:
National renewable energy targets per EU directives ▪Promotional policies ▪Technological developments ▪End-customer preferences ▪
0.00
0.10
0.20
0.30
0.40
0.50
0.60
2006 2007 2008 2009 2010 2011 2012 2013
€/kW
p
Source: EuPD Research 2010
Sample chart
Sample chart

Product Data Sheet
EuPD Research 2011 37
Information Sources Quantitative and qualitative interviews with industry experts ▪Systematic desk research (external databases, business ▪
reports, etc.)EuPD DAT – internal database (quarterly EuPD studies, ▪
EuPD market reports, etc.)
Contents(Subject to Change)
Executive Summary
Part I. Growth of Renewable Energy | Top EU Electricity Markets
Part II. PV Market Analysis | Key European Markets
Part III. Major Milestones towards PV Competitiveness
A. Incentive Parity
B. Grid Parity
C. Generation Parity
Part IV. Looking Ahead | The Face of the Future PV Market
Benefits for your Company
Discover future trends and developments in the rapidly ▪ evolving PV industry
Receive information that can assist in developing strategies ▪ for the post grid parity era
Learn about future success factors and pathways to the ▪ ‘sweet spots’ of tomorrow’s PV market
Included in Delivery 1x report, high quality binding
Price € 1,450** $ 1,990**
Author/Contact Parag Bhamre
Euro
pe
*(excluding sales tax/VAT) **(excluding sales tax/VAT and P&P)
38 EuPD Research 2011
GERMANY – A COMPLEx MARKET
MARKET OVERVIEW
GERMANY – A COMPLEx MARKET
PV MarketMonitor© – GermanyGain detailed information on newly installed capacity and number of plants in all German regions. ▪Identify „blank spots“ per system size and analyze your company’s sales volume in relation to the ▪
total market.Receive quarterly data updates and develop regional sales strategies. ▪
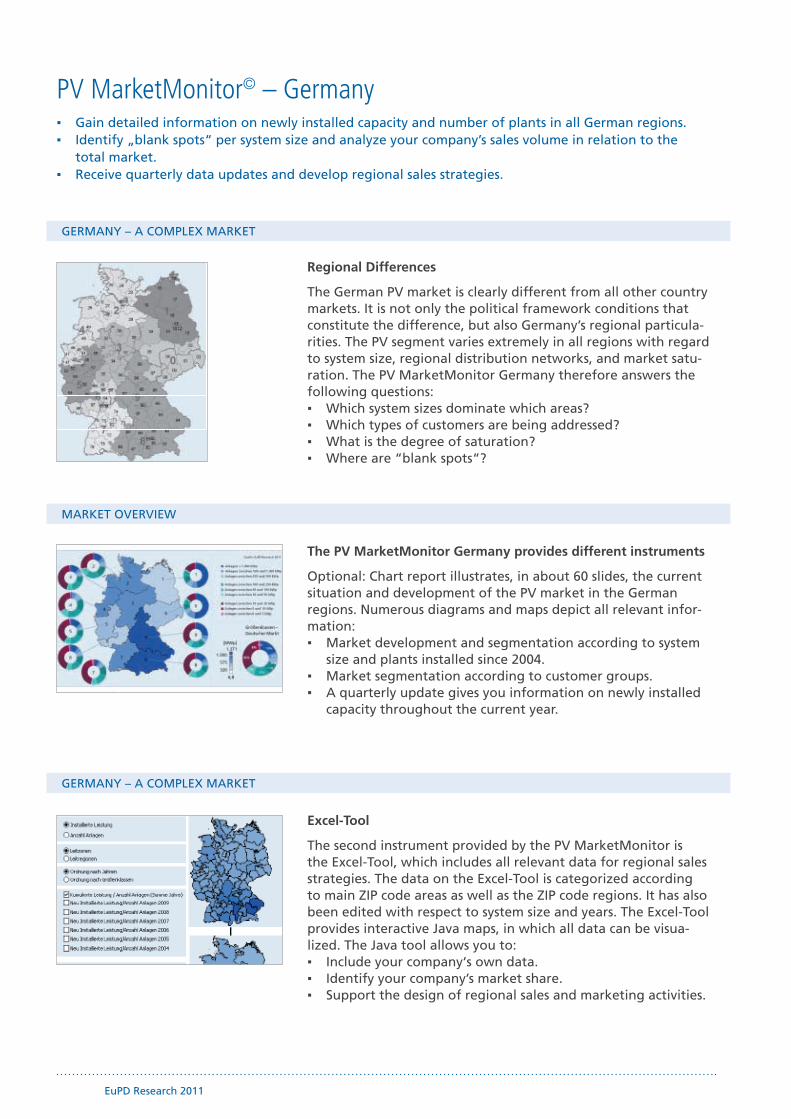
Regional Differences
The German PV market is clearly different from all other country markets. It is not only the political framework conditions that constitute the difference, but also Germany’s regional particula-rities. The PV segment varies extremely in all regions with regard to system size, regional distribution networks, and market satu-ration. The PV MarketMonitor Germany therefore answers the following questions:
Which system sizes dominate which areas? ▪Which types of customers are being addressed? ▪What is the degree of saturation? ▪Where are “blank spots“? ▪
The PV MarketMonitor Germany provides different instruments
Optional: Chart report illustrates, in about 60 slides, the current situation and development of the PV market in the German regions. Numerous diagrams and maps depict all relevant infor-mation:
Market development and segmentation according to system ▪ size and plants installed since 2004.
Market segmentation according to customer groups. ▪A quarterly update gives you information on newly installed ▪
capacity throughout the current year.
Excel-Tool
The second instrument provided by the PV MarketMonitor is the Excel-Tool, which includes all relevant data for regional sales strategies. The data on the Excel-Tool is categorized according to main ZIP code areas as well as the ZIP code regions. It has also been edited with respect to system size and years. The Excel-Tool provides interactive Java maps, in which all data can be visua-lized. The Java tool allows you to:
Include your company‘s own data. ▪Identify your company’s market share. ▪Support the design of regional sales and marketing activities. ▪

Product Data Sheet
EuPD Research 2011 39
Information Sources Federal Network Agency´s Data Base ▪Internal database containing historic information on the ▪
German regional PV markets
Contents(Subject to change)
Market developement1.
Regional Market Segmentation according to system size2.
Regional Market segmentation according to customer 3. groups
Benefits for your Company
Examine the German PV market from a micro perspective ▪ and bring your operative marketing into line with the deci ding customer groups in the respective regions
Find out which regions in Germany have the most potential ▪ for your company
Analyze your company‘s sales and installation volume in ▪ relation to the total market
Identify white flag regions in Germany ▪Create regional strategies to penetrate the German market ▪
more preciselyPut your sales force as well as your advertising and marke- ▪
ting resources to even more cost-saving and efficient use
Included in Delivery Excel-Tool and quarterly updates
Optional: Chart report of approx. 60 slides
Price Standard version Extended version
€ 2,500* € 2,950*
$ 3,500* $ 4,150*
Author/Contact Till von Versen
Euro
pe
*(excluding sales tax/VAT) **(excluding sales tax/VAT and P&P)
40 EuPD Research 2011
SCORING REGIONAL APPEAL
GAP ANALYSIS
Regional Market Attractiveness© – GermanyRegional PV-Market Appeal- & Gap-Analysis
Excel-Tool for the analysis of comprehensive PV system data in Germany. ▪Optional data report summary and overview of the most important results. ▪Monthly updates are provided for the Excel-Tool and the report. ▪
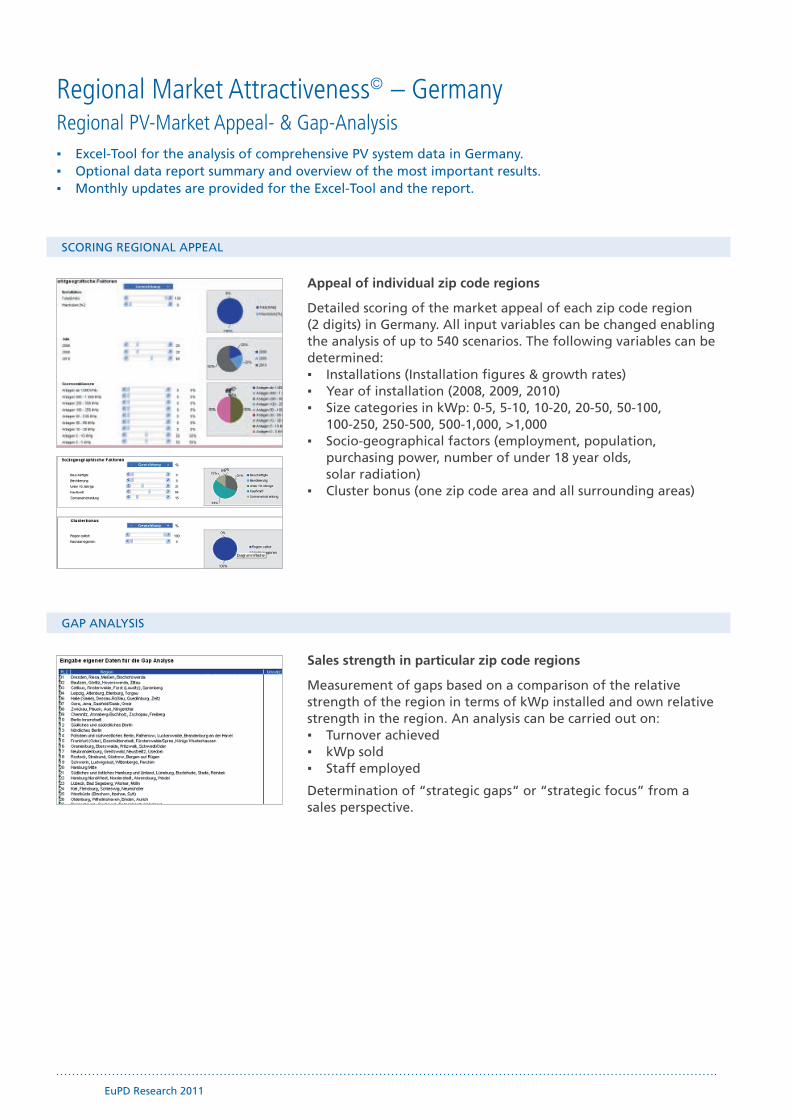
Appeal of individual zip code regions
Detailed scoring of the market appeal of each zip code region (2 digits) in Germany. All input variables can be changed enabling the analysis of up to 540 scenarios. The following variables can be determined:
Installations (Installation figures & growth rates) ▪Year of installation (2008, 2009, 2010) ▪Size categories in kWp: 0-5, 5-10, 10-20, 20-50, 50-100, ▪
100-250, 250-500, 500-1,000, >1,000 Socio-geographical factors (employment, population, ▪
purchasing power, number of under 18 year olds, solar radiation)
Cluster bonus (one zip code area and all surrounding areas) ▪
Sales strength in particular zip code regions
Measurement of gaps based on a comparison of the relative strength of the region in terms of kWp installed and own relative strength in the region. An analysis can be carried out on:
Turnover achieved ▪kWp sold ▪Staff employed ▪
Determination of “strategic gaps“ or “strategic focus” from a sales perspective.

Product Data Sheet
EuPD Research 2011 41
Content The product contains information on the following topics:
Regional appeal from a zip code perspective (2 digits) 1.
Appeal of regional clusters 2.
Gap analysis (strategic gaps or strategic focus)3.
Benefits for your Company
Identification of top regions in Germany based on the ▪ variables defined
Tracking of historical developments („migration“ of top ▪ regions) identification of untapped sales potential
Competitor benchmarking by means of a gap analysis ▪Optimize the allocation of sales resources ▪Evaluation of market entry strategies ▪
Included in Delivery Module 1: MS Excel-Tool (including twelve monthly updates)
Module 2: Optional MS PowerPoint report presents the most important results of module 1 in an annotated presentation
Product Delivered Excel-Tool (Retainer, consultants on request)
Price Module 1 € 1,950* $ 2,750*
Module 2 upon request
Author/Contact Stefan Pietzsch
Euro
pe
*(excluding sales tax/VAT) **(excluding sales tax/VAT and P&P)
42 EuPD Research 2011
GLOBAL MARKET DEVELOPMENT
THE SITUATION IN GERMANY
FOCUS ON MARKETING MIx
The German Photovoltaic Market 2010 Gigawatt Crisis or Way to Promotion Parity
The German market was the most important PV market in 2010. This report informs decision makers. ▪ on the PV lead market and shows how to target relevant market segments successfully.
It is based on quantitative and qualitative primary surveys and analyzed secondary sources. ▪
Status and potential of the worldwide PV markets
In the first part, an overview on the PV markets is given – from the global view down to the level of the most important PV country markets. Besides the description of funding schemes, the focus is on the current status and future potential. The following markets are described:
European markets such as Italy, Czech Republic, France, ▪ UK and Spain
US market ▪Asian markets such as Japan, South Korea, China and Taiwan ▪
Overview on changes in funding scheme and their effects
After a description of the German PV market development up to now, the reader gains information on what the drivers and obsta-cles in the market and how the market will develop. Further content discussed:
PV business climate. ▪Development of returns in the case of complete feed-in ▪
and own consumption.
In addition, an outlook discusses the different scenarios for the future development of the German market including different ‘Grid Parity’ definitions.
Optimal application of marketing instruments
Furthermore, the report gives a comprehensive overview of the current development and future potential of the market segments after Q2. On the basis of primary data raised in various recently conducted research projects, deciders receive concrete recommen-dations regarding a successful design of the marketing mix.
Product positioning ▪Pre- and after-sales management ▪Procurement management of German installers ▪Communication strategies ▪Buying behavior and preferences of different end ▪
customer groups
SALE
Product Data Sheet
EuPD Research 2011 43
Information Sources Qualitative background interviews with PV market players ▪Recently published EuPD Research reports based on ▪
primary data Systematic desk research (media analysis, reports, industry ▪
portals)EuPD Research Database - Internal database covering ▪
background information on global PV markets
Contents(Subject to Change)
Preface1.
Executive Summary2.
PV World Market3.
The German PV Market4.
PV Business Climate5.
PV Price Index6.
EEG Amendment7.
Returns8.
Market Segments9.
Marketing Mix10.
Outlook11.
Benefits for your Company
Anticipate future developments on the world market ▪ and adapt the strategy of your company
Learn more about segmentation shifts caused by the ▪ modification of the German EEG
Get profound insights into developments regarding return ▪ on invest and how the buying behavior of your customers may be affected
Gain competitive advantages by optimizing the application ▪ of marketing instruments
Included in Delivery 1x report, high quality binding
Price € 660** $ 890**
Author/Contact Jan Winkler
Euro
pe
25%Off
*(excluding sales tax/VAT) **(excluding sales tax/VAT and P&P)
44 EuPD Research 2011
STIMULATION THROUGH POLICIES
HIGH GROWTH POTENTIAL
MARKET CHARACTERISTICS
The UK Photovoltaic Market 2010 Tapping the Fullest Potential
Comprehensive information on the newest and most significant developments in the UK PV market. ▪Analysis of manufacturing and market potentials at national and regional level. ▪Introduction of political, regional and investment particularities in the UK PV market. ▪
The FIT – a driving force for the UK PV market
On April 1st, 2010, a new feed-in tariff (FIT) was introduced in Great Britain. At a total installed capacity of 34 MW in 2009, this will undoubtedly transform the British PV market from merely a niche industry to a market with huge potential. This study offers valuable insight to this new and upcoming sector.
General market overview by means of a PESTE analysis. ▪Overview of the FIT and its implications for the UK market. ▪Additional PV promotion schemes available in the UK. ▪Technical certifications and MCS accreditation. ▪
The supply side of the UK PV market
On the basis of semi-qualitative interviews, the study will provi-de insight to the UK’s PV supply market on all levels of the value chain, including silicon, solar cell and module manufacturers.
General overview of the UK’s PV value chain. ▪Identification of significant cell and module manufacturers. ▪Production figures. ▪
The demand side of the UK PV market
Through the use of primary research, the study will outline the demand side of the UK’s PV market. For a successful market entry, it is crucial to understand various distribution channels as well as system price development in this market. The following points will also be discussed:
Financing models available in the UK. ▪Market shares by technology and customer segment. ▪Top module and inverter brands. ▪Drivers and hindrances to the UK PV market. ▪
Over 1200 kWh/ m²
1100 to 1200 kWh/m²
1000 to 1100 kWh/m²
900 to 1000 kWh/m²
Less than 900 kWh/m²
Key
Map source: Solar Trade Association (STA)
SALE
EuPD Research 2011 45
Product Data Sheet
Information Sources Qualitative interviews with PV manufacturers, installers ▪ and distributors in the UK
Systematic desk research (media analysis, reports, ▪ industry portals)
EuPD DAT - Internal database covering background ▪ information on global PV markets
Contents(Subject to Change)
Fundamental Background Analysis1.
Supply and Demand in the UK PV Market2.
A Promising Future Outlook3.
Benefits for your Company
Discover trends and developments in the UK’s PV industry ▪ along the value chain
Receive the information needed to develop suitable market ▪ entry strategies
Understand drivers and hindrances to the UK’s PV market ▪Identify significant regions for the various application types ▪Receive insight to product specifications needed for ▪
successful sales
Included in Delivery 1x report, high quality binding
Price € 2,980** $ 4,190**
Author/Contact Stefan Pietzsch
Euro
pe
40%Off
*(excluding sales tax/VAT) **(excluding sales tax/VAT and P&P)

46 EuPD Research 2011

EuPD Research 2011 47
3. The US PV Market
48 EuPD Research 2011
PRODUCT DETAILS
PROCUREMENT MANAGEMENT
SUPPLIER-CUSTOMER RELATIONSHIP
US PV InstallerMonitor© 2011Be part of an exclusive customer group in an in-depth survey of US PV installers at a preferential price. ▪Receive crucial and up-to-date information for a successful penetration of the key PV markets in the ▪
US states. The study helps you understand the brand preferences of PV installers. ▪Receive a detailed analysis of the market position of you and your competitors in the US PV market. ▪
This product will provide you with comprehensive information on installers as your main target group in the most important PV states of the US: Arizona, California, Colorado, New Jersey and Pennsylvania.
The study is structured into four main parts: Key market figures of the US PV markets: Market develop- 1.
ment, customer segmentation, incentive framework.Brand performance and distribution ranges: Installer 2.
product portfolios, brand awareness and loyalty.Procurement management: Procurement and distribution 3.
channels.Supplier-customer relationship: Satisfaction with suppliers, 4.
sales strategies, customer groups.
It is of utmost importance for PV providers to penetrate new distribution channels and to strengthen or extend their existing ones in order to ensure profitable market growth.
The study therefore analyzes the following aspects: Brand loyalty, preference and recommendation ▪Procurement strategies ▪Procurement channels 2010-2011 ▪Purchase decision according to brands/technologies ▪
From a PV module manufacturer’s perspective, it is crucial to keep track of how a brand is perceived by customers. This helps to en-sure that a successful marketing strategy is implemented.
Several important aspects of the supplier-installer relationship are addressed:
Installers’ perception of manufacturers’ products and brands ▪Categorization of several brands into different product classes ▪Display of preferred brands ▪Level of satisfaction/recommendation of brands ▪
101
Installers as Market IntermediariesE.2.
Breakdown of distribution channels for 2009 installed PV capacity
Trade/ system
integration
End market
Installation
Residential buildings
Module manufacturers
Solar installerGeneral installer (roofer, electrician,
HVAC installer)
Non-residential buildingsOpen-space
65.7%33.4% 0.9%8.5% 40.7%50.8%
41.4% 16.3% 49.4% 38.1% 29.7% 7.7% 14.8%
Electrical wholesalers
System integrators/ PV wholesalers
HVAC and roofing wholesalers
Source: EuPD Research 2009
Answers missing to add up to 100% = procurement through other channels
1
Contents
US InstallerMonitor 2010
Analysis Key PV US Markets
Analysis of ProcurementManagement
Analysis Supplier-CustomerRelationship
Analysis Product Policy and Distribution Range
Aided recall of brand awareness and classification according to product classes
Brand Status and Value
n = 273
PremiumMid-range Low price
Aided brandawareness No answer
45% 4%232 44%
37% 7%237 40%
32% 2%244 57%
57% 11%246 22%
39% 3%236 48%
17% 2%240 79%
60% 12%208 13%
59% 6%218 23%
52% 10%215 27%
7%
16%
9%
10%
10%
2%
15%
12%
11%
50% 13%202 15% 22%
Number ofmentions
Source: EuPD Research 2010
Brand 1
Brand 4
Brand 6
Brand 3
Brand 5
Brand 7
Brand 8
Brand 10
Brand 9
Brand 2
EuPD Research 2011 49
Product Data Sheet
Release Date December 2011 (subject to a minimum number of participants)
Information Sources Primary Research: Quantitative interviews with PV installers.
The following states will be covered by the sample:Arizona ▪California ▪Colorado ▪New Jersey ▪Pennsylvania ▪(Optional: Florida and New York) ▪
Desk Research: gathering of information from national and state organizations, industry portals and media. Cross-check of data with external sources and amplification of database.
EuPD DAT: constant tracking of the global PV markets and rele-vant market participants. Comprehensive background informati-on on global PV markets.
Contents Content1.
Research design 2.
Market structure of analyzed US markets3.
Procurement management4.
Brand management5.
Customer satisfaction analysis 6.
Comparison of state markets 7.
Benefits for your Company
Learn details of PV installer procurement processes ▪Identify the most important brands and suppliers from a ▪
US installer perspective Discover the most successful strategies for business with ▪
PV installersUnderstand your competitors and be able to more effectively ▪
position your brand and products in order to increase your business opportunities with PV installers
Included in Delivery 1x printed report, high quality binding
Price € 10,500** $ 13,900**
Author/Contact Christian Schossig
USA
*(excluding sales tax/VAT) **(excluding sales tax/VAT and P&P)
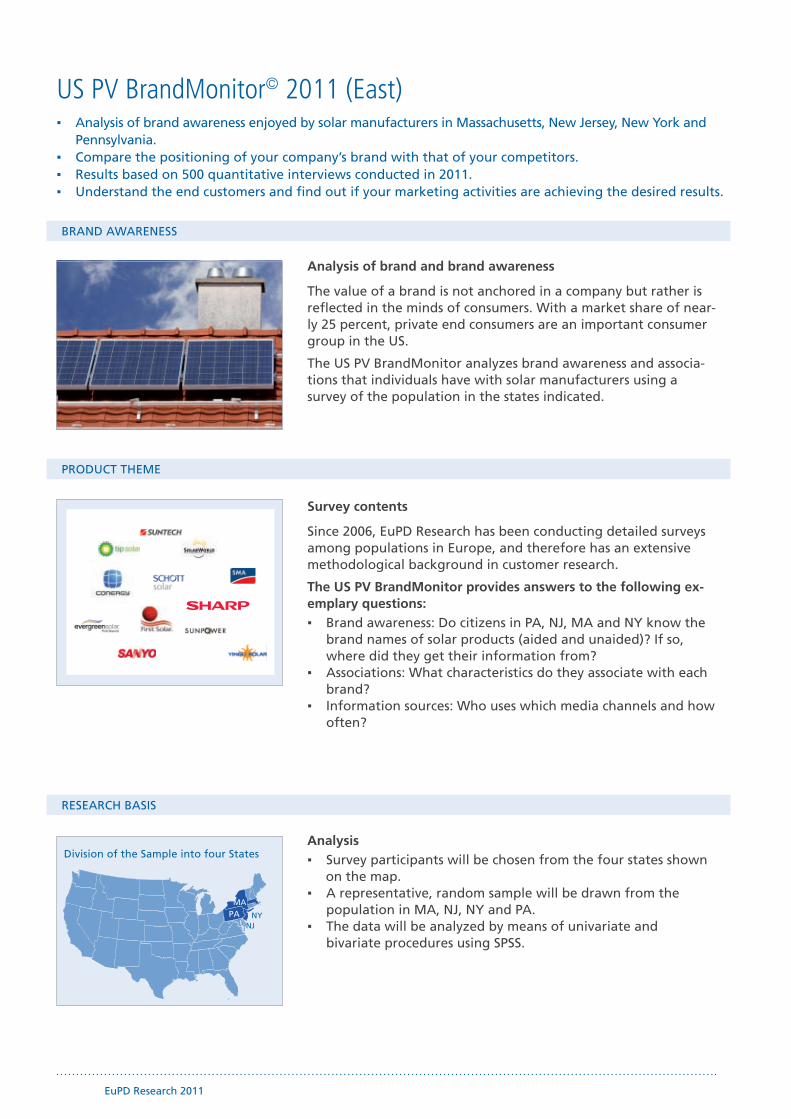
50 EuPD Research 2011
RESEARCH BASIS
PRODUCT THEME
BRAND AWARENESS
US PV BrandMonitor© 2011 (East)Analysis of brand awareness enjoyed by solar manufacturers in Massachusetts, New Jersey, New York and ▪
Pennsylvania. Compare the positioning of your company’s brand with that of your competitors. ▪Results based on 500 quantitative interviews conducted in 2011. ▪Understand the end customers and find out if your marketing activities are achieving the desired results. ▪
Analysis of brand and brand awareness
The value of a brand is not anchored in a company but rather is reflected in the minds of consumers. With a market share of near-ly 25 percent, private end consumers are an important consumer group in the US.
The US PV BrandMonitor analyzes brand awareness and associa-tions that individuals have with solar manufacturers using a survey of the population in the states indicated.
Survey contents
Since 2006, EuPD Research has been conducting detailed surveys among populations in Europe, and therefore has an extensive methodological background in customer research.
The US PV BrandMonitor provides answers to the following ex-emplary questions:
Brand awareness: Do citizens in PA, NJ, MA and NY know the ▪ brand names of solar products (aided and unaided)? If so, where did they get their information from?
Associations: What characteristics do they associate with each ▪ brand?
Information sources: Who uses which media channels and how ▪ often?
AnalysisSurvey participants will be chosen from the four states shown ▪
on the map.A representative, random sample will be drawn from the ▪
population in MA, NJ, NY and PA.The data will be analyzed by means of univariate and ▪
bivariate procedures using SPSS.
PA
NY
Division of the Sample into four States
MA
NYNJ

EuPD Research 2011 51
Product Data Sheet
Release Date Subject to a minimum number of participants
Information Sources Representative, four-state-wide random sample ▪CATI-survey or online panel survey of persons aged 18 years ▪
and older500 questionnaires in NY, NJ, PA and MA ▪Survey period: Q4 2011 ▪
Contents Background of the study 1.
Objectives, method and sample 2.
Composition of the Sample3.
Owner and planner of a solar plant4.
Attitude and reception analysis5.
Brand analysis 6.
Conclusion7.
Benefits for your Company
Compare the positioning of your company brand to that of ▪ your competitors
Monitor the success of your advertising campaigns ▪Know the best place to put your advertisements to ▪
reach your target customersAdjust your advertising to the consumer groups identified ▪Learn more about end-customer attitudes toward certain ▪
energy topicsDesign your brand image on the basis of the status quo ▪Better assess the positioning of your competitors ▪
Included in Delivery Printed annotated chart report (60-90 pages), high quality binding
Price € 8,100** $ 11,500**U
SA*(excluding sales tax/VAT) **(excluding sales tax/VAT and P&P)

52 EuPD Research 2011
US PV BrandMonitor© 2011 (West)Analysis of brand awareness enjoyed by solar manufacturers in California, Colorado and Arizona. ▪Compare the positioning of your company’s brand with that of your competitors. ▪Results based on 500 quantitative interviews conducted in 2011. ▪Understand end-customers and find out if your marketing activities are achieving the desired results. ▪
BRAND AWARENESS
Analysis of brand and brand awareness
The value of a brand is not anchored in a company but rather is reflected in the minds of consumers. With a market share of nearly 25 percent, private end consumers are an important consumer group in the US.
The PV BrandMonitor analyzes brand awareness and asso- ciations that individuals have with solar manufacturers using a survey of the population in the states indicated.
Survey contents
Since 2006, EuPD Research has been conducting detailed sur-veys among populations in Europe, and therefore has an extensive methodological background in customer re-search.
The US PV BrandMonitor provides answers to the following ex-emplary questions:
Brand awareness: Do citizens in CA, CO and AZ know the ▪ brand names of solar products (aided and unaided)? If so, where did they get their information from?
Associations: What characteristics do they associate with ▪ each brand?
Information sources: Who uses which media channels do they ▪ use and how often?
Optimal application of marketing instruments. ▪Reception analysis: What information is remembered? ▪
PRODUCT THEME
RESEARCH BASIS
AnalysisSurvey participants will be chosen from the three states shown ▪
on the map.The dataset will be weighted on the basis of variations in age ▪
and sex. The aim is to have a representative sample of the population of CA, CO and AZ.
The data will be analyzed by means of univariate and biva- ▪ riate procedures using SPSS.
CA
AZ
CO
Division of the Sample into three States

EuPD Research 2011 53
Product Data Sheet
Release Date Subject to a minimum number of participants
Information Sources Representative, three-state-wide random sample ▪CATI-survey or online panel survey of persons aged ▪
18 years and older 500 questionnaires in CA, CO and AZ ▪Survey period: Q4 2011 ▪
Contents Background of the study 1.
Objectives, method and sample 2.
Composition of the sample3.
Owner and planner of a solar plant4.
Attitude and reception analysis5.
Brand analysis 6.
Conclusion7.
Benefits for your Company
Compare the positioning of your company brand to that of ▪ your competitors
Monitor the success of your advertising ▪Know the best place to put your advertisements so as to ▪
reach your target customersAdjust your advertising to the consumer groups identified ▪Learn more about the end-customer attitudes toward ▪
certain energy topicsDesign your brand image on the basis of the status quo ▪Better assess the positioning of your competitors ▪
Included in Delivery Printed annotated chart report (60-90 pages), high quality binding
Price € 8,100** $ 11,500**U
SA*(excluding sales tax/VAT) **(excluding sales tax/VAT and P&P)

54 EuPD Research 2011
PRICE SITUATION AND FUTURE TRENDS
FORECAST SCENARIO OF MODULE PRICE DEVELOPMENT BY INSTALLERS
PRODUCT AND APPLICATION
US PV ModulePriceMonitor©
Quarterly conducted survey to measure the price of PV modules and PV systems in the US. ▪Display of price climate based on the current pricing situation and the expected development ▪
and forecast.Module prices of the most frequently installed brands for different module technologies. ▪
Composition of the US PV ModulePriceMonitor©
Be part of an exclusive customer group and access the results of this quarterly US survey at a preferential price. The goal of the product is to collect specific information on price developments in the key US states. The report includes:
Relative shares and purchase prices of the three module tech- ▪ nologies and their shares in the total market volume.
Purchase price differences according to model origins. ▪Current system sales prices for rooftop PV systems. ▪Analysis of price differences between certain groups of ▪
installers (e.g. sorted according to various customer groups).
Method and advantages of the forecast scenario
The target group is PV installation companies who can provide reliable statements on price development considering their pro-duct portfolios and sales volumes. This target group will be asked in every quarter about future trends in the prices of crystalline and thin-film modules:
There will be a short-term price forecast for three different ▪ module technologies in cents.
Price changes can be compared to current prices; and a ▪ progressive price forecast can be developed.
Price forecasts will reveal information about the installers’ per- ▪ ception of prices and will give market players the possibility to react to changes immediately.
Price situation and development
To determine a sustainable price policy, it is important for every company active in the PV market to observe the price develop-ments of the most significant photovoltaic markets:
Price levels and expectations for the different technologies. ▪Net purchase prices and price development for the three dif- ▪
ferent module types (mono, polycrystalline and thin-film).Price index for panel technologies. ▪Current system sales prices for rooftop PV systems (by typical ▪
system size).Breakdown of system price. ▪
2.07
3.172.91
2.582.15
1.5 €
2.0 €
2.5 €
3.0 €
3.5 €
4.0 €
Source: EuPD Research 11/2009
Ge
rma
ny
Sp
ain
It
aly
2.04
2.53
3.242.92
2.25
1.5 €2.0 €2.5 €3.0 €3.5 €4.0 €
2.01
2.392.80
3.053.27
1.5 €2.0 €2.5 €3.0 €3.5 €4.0 €
2.80
3.863.33 3.26
2.66
1.5 €2.0 €2.5 €3.0 €3.5 €4.0 €
Fra
nce
2.07
3.172.91
2.582.15
1.5 €
2.0 €
2.5 €
3.0 €
3.5 €
4.0 €
Source: EuPD Research 11/2009
Ge
rma
ny
Sp
ain
It
aly
2.04
2.53
3.242.92
2.25
1.5 €2.0 €2.5 €3.0 €3.5 €4.0 €
2.01
2.392.80
3.053.27
1.5 €2.0 €2.5 €3.0 €3.5 €4.0 €
2.80
3.863.33 3.26
2.66
1.5 €2.0 €2.5 €3.0 €3.5 €4.0 €
Fra
nce
Q2 2009 Q3 2009 Q1 2010 Q4 2009 Q2 2010
22.007722.1155
22.004422..2255
22.0011
2..39
2.8022.6666
Forecast: development of prices
98,4%
93,6%
87,1%86,5%
85,5%
89,7%88,6%
95,1%
90,1%
86,6%
89,5% 87,5%
89,5%91,1%
86,6%87,5%
88,2%
95,3%
90,6%89,3%
90,6%
93,6%93,6%94,3%
100,0%
80%
85%
90%
95%
100%
105%
Bezug Q2 2006 3. Quartal 2006 4. Quartal 2006 1. Quartal 2007 2. Quartal 2007 3. Quartal 2007 4. Quartal 2007 1. Quartal 2008 2. Quartal 2008 3. Quartal 2008
monokristalline Module polykristalline Module Dünnschicht-Module Start: 2. Quartal 2006 = 100%
Quelle: EuPD Research 08/2008
Preisindex PV-Module
3.7003.800
3.9003.9004.1344.158
4.392 4.373
4.8504.800
5.100 5.200
0 €
1.000 €
2.000 €
3.000 €
4.000 €
5.000 €
6.000 €
7.000 €
2. Quartal 2008 3. Quartal 2008 2. Quartal 2008 3. Quartal 2008
Minimum Mittelwert Maximum
Quelle: EuPD Research 08/2008
Wie hoch ist derzeit der Systempreis für eine PV-Aufdachanlage pro kWp?
Anlage unter 10 kWp Anlage zwischen 10 und 100 kWp
n = 100
41,2 44,039,1 39,8 37,1 39,8 38,3 39,0
52,7 49,853,8 51,5 53,8 49,2 52,0 52,6
6,2 6,2 7,0 8,8 9,1 11,0 9,7 8,4
0%
10%
20%
30%
40%
50%
60%
70%
80%
90%
100%
4. Quartal 2006 1. Quartal 2007 2. Quartal 2007 3. Quartal 2007 4. Quartal 2007 1. Quartal 2008 2. Quartal 2008 3. Quartal 2008
monokristalline Module polykristalline Module Dünnschicht-Module
Quelle: EuPD Research 08/2008
Entwicklung der Anteile der PV-Modultechnologien an der installierten Leistung im Quartalsvergleich
n = 100
-3,61
0,770,70
1,64
0,96
2,49
0,97
0,31
5,00
-1,92
1,74
0,000,63
3,47
-0,96
0,00
-4,0%
-3,0%
-2,0%
-1,0%
0,0%
1,0%
2,0%
3,0%
4,0%
5,0%
6,0%
deutscheMarkenhersteller
ausländischeMarkenhersteller
ausländische No-Name-Hersteller
deutscheMarkenhersteller
ausländischeMarkenhersteller
ausländische No-Name-Hersteller
deutscheMarkenhersteller
ausländischeMarkenhersteller
1. Quartal bis 2. Quartal 2008 2. Quartal bis 3. Quartal 2008
Quelle: EuPD Research 08/2008
Wie haben sich die Netto-Einkaufspreise zwischen dem ersten Quartal 2008 und dem zweiten Quartal 2008 zu dem zweiten und dritten Quartal 2008 verändert (Mittelwerte)?
n = 100
monokristalline Module polykristalline Module Dünnschicht-Module
98,4%
93,6%
87,1%86,5%
85,5%
89,7%88,6%
95,1%
90,1%
86,6%
89,5% 87,5%
89,5%91,1%
86,6%87,5%
88,2%
95,3%
90,6%89,3%
90,6%
93,6%93,6%94,3%
100,0%
80%
85%
90%
95%
100%
105%
Bezug Q2 2006 3. Quartal 2006 4. Quartal 2006 1. Quartal 2007 2. Quartal 2007 3. Quartal 2007 4. Quartal 2007 1. Quartal 2008 2. Quartal 2008 3. Quartal 2008
monokristalline Module polykristalline Module Dünnschicht-Module Start: 2. Quartal 2006 = 100%
Quelle: EuPD Research 08/2008
Preisindex PV-Module
%
93,6%
89,7%%88,6%
90,1%
86,6%
89,5% 87,5%
89,5%91,1%
93,6%93,6%994,3%
1. Quartal 2007 2. Quartal 2007 3. Quartal 2007 4. Quartal 2007
Für das 3. Quartal 2006 sind keine Angaben verfügbar
3.7003.800
3.9003.9004.1344.158
4.392 4.373
4.8504.800
5.100 5.200
0 €
1.000 €
2.000 €
3.000 €
4.000 €
5.000 €
6.000 €
7.000 €
2. Quartal 2008 3. Quartal 2008 2. Quartal 2008 3. Quartal 2008
Minimum Mittelwert Maximum
Quelle: EuPD Research 08/2008
Wie hoch ist derzeit der Systempreis für eine PV-Aufdachanlage pro kWp?
Anlage unter 10 kWp Anlage zwischen 10 und 100 kWp
n = 100
41,2 44,039,1 39,8 37,1 39,8 38,3 39,0
52,7 49,853,8 51,5 53,8 49,2 52,0 52,6
6,2 6,2 7,0 8,8 9,1 11,0 9,7 8,4
0%
10%
20%
30%
40%
50%
60%
70%
80%
90%
100%
4. Quartal 2006 1. Quartal 2007 2. Quartal 2007 3. Quartal 2007 4. Quartal 2007 1. Quartal 2008 2. Quartal 2008 3. Quartal 2008
monokristalline Module polykristalline Module Dünnschicht-Module
Quelle: EuPD Research 08/2008
Entwicklung der Anteile der PV-Modultechnologien an der installierten Leistung im Quartalsvergleich
n = 100
-3,61
0,770,70
1,64
0,96
2,49
0,97
0,31
5,00
-1,92
1,74
0,000,63
3,47
-0,96
0,00
-4,0%
-3,0%
-2,0%
-1,0%
0,0%
1,0%
2,0%
3,0%
4,0%
5,0%
6,0%
deutscheMarkenhersteller
ausländischeMarkenhersteller
ausländische No-Name-Hersteller
deutscheMarkenhersteller
ausländischeMarkenhersteller
ausländische No-Name-Hersteller
deutscheMarkenhersteller
ausländischeMarkenhersteller
1. Quartal bis 2. Quartal 2008 2. Quartal bis 3. Quartal 2008
Quelle: EuPD Research 08/2008
Wie haben sich die Netto-Einkaufspreise zwischen dem ersten Quartal 2008 und dem zweiten Quartal 2008 zu dem zweiten und dritten Quartal 2008 verändert (Mittelwerte)?
n = 100
monokristalline Module polykristalline Module Dünnschicht-Module

EuPD Research 2011 55
Product Data Sheet
Release Date Subject to a minimum number of participants
Information Sources EuPD Research´s installer panel
Contents Background and research approach1.
Sample description2.
General price development3.
Purchase prices4.
Panel manufacturers5.
System prices (nominal interest rate regarding 6. capital return)
Benefits for your Company
Be part of an exclusive customer group able to access the ▪ results of the US survey on PV installers at a preferential price
Get an overview of module prices for installers in the most ▪ important US markets
Compare state-specific prices for modules and systems for ▪ the different technologies, monitor their development
Appraise the market situation and potential of various mar- ▪ kets by a comparison of module prices of different brands and price differences between certain groups of installers
Get forecasts of module price development in the most im- ▪ portant US markets
Included in Delivery 1x chart report per quarter (two weeks after field time ending)
Price For Q4/2011 and Q1/2012 € 4,800* $ 6,800*
USA
*(excluding sales tax/VAT) **(excluding sales tax/VAT and P&P)

56 EuPD Research 2011

EuPD Research 2011 57
4. The Asian PV Market

58 EuPD Research 2011
MANUFACTURER´S ExPANSION PLANS ARE OPTIMISTIC
UNDERSTAND A HIGHLY FRAGMENTED EMERGING MARKET
THE INDIAN GOVERNMENT FORSEES HUGE POTENTIAL IN SOLAR ENERGY MARKETS
The Indian Photovoltaic Market 2010/11 Dynamics and Potential of the Indian PV Market
Receive comprehensive information on the Indian PV market and understand market ▪ conditions as well as dynamics.
Recognize the main players within the market and adapt your strategies according ▪ to the market situation.
Understand customer behaviour in a rapidly emerging market. ▪
Within the last years, the situation in the Indian PV market has changed profoundly: the Indian government foresees the poten-tial solar energy can bring to its economy, how it can enhance the standard of living whilst combating climate change. The National Solar Mission set a target of 20,000 MW of installed grid connec-ted solar power and 2,000 MW of off grid solar power for 2022:
Obtain a detailed overview of framework conditions. ▪Trends in of market development and segmentation. ▪Identify promising application types/customer groups etc. ▪
Since the Indian market is highly fragmented and complex, it is crucial to understand the opportunities and challenges according to each region and devise corresponding strategies. Hence, it is important to monitor how the gap between production and in-stalled capacity will emerge in order to anticipate future market development.
Identify the main industry players. ▪Expansion plans vs. demand situation. ▪What opportunities and challenges will arise? ▪
The largest survey to date on the Indian PV market is based on primary interviews with 115 downstream players and qualitative interviews with 37 manufacturers from all regions of India. Addi-tionally, other strategic sources of data are also used:
Assessment of brand status and value. ▪Anticipate future market development. ▪Recommendation of promising and successful market ▪
entry strategies.
0 MWp
500 MWp
1000 MWp
1500 MWp
2000 MWp
2500 MWp
3000 MWp
3500 MWp
Off-grid 18 22 78 90 125 170 220 270
On-grid 2 4 7 35 140 350 600 900
Cumulated 110 136 221 346 611 1131 1951 3121
2007 2008 2009 2010e* 2011e* 2012e* 2013e* 2014e*
Source: EuPD Research 2010
specifications in MWp
e* = estimated
Sample chart
Sample chart
Sample chart
Product Data Sheet
EuPD Research 2011 59
Information Sources Quantitative interviews with 115 Indian downstream players ▪Qualitative interviews with 37 manufacturers across India ▪Systematic desk research (external databases, business ▪
reports, etc.)EuPD DAT – internal database (quarterly EuPD studies, ▪
EuPD market reports, etc.)
Contents Executive Summary
Part 1 – India: Background
Part 2 – PV Policies
Part 3 – PV Market Development
Part 4 – The Upstream Segment
Part 5 – The Downstream Segment
Part 6 – Conclusion
Benefits for your Company
Discover trends and opportunities in the Indian PV market ▪ along the whole value chain
Understand drivers and hindrances to the Indian PV market ▪Receive the information needed to develop innovative ▪
market entry strategiesUnderstand the dynamics of an emerging market and gain ▪
a competitive edge
Included in Delivery 1x report (approximately 60 pages), high quality binding
Price € 950** $ 1,350**
Author/Contact Ramesh Kumar and Nishit Shah
ASI
A
*(excluding sales tax/VAT) **(excluding sales tax/VAT and P&P)
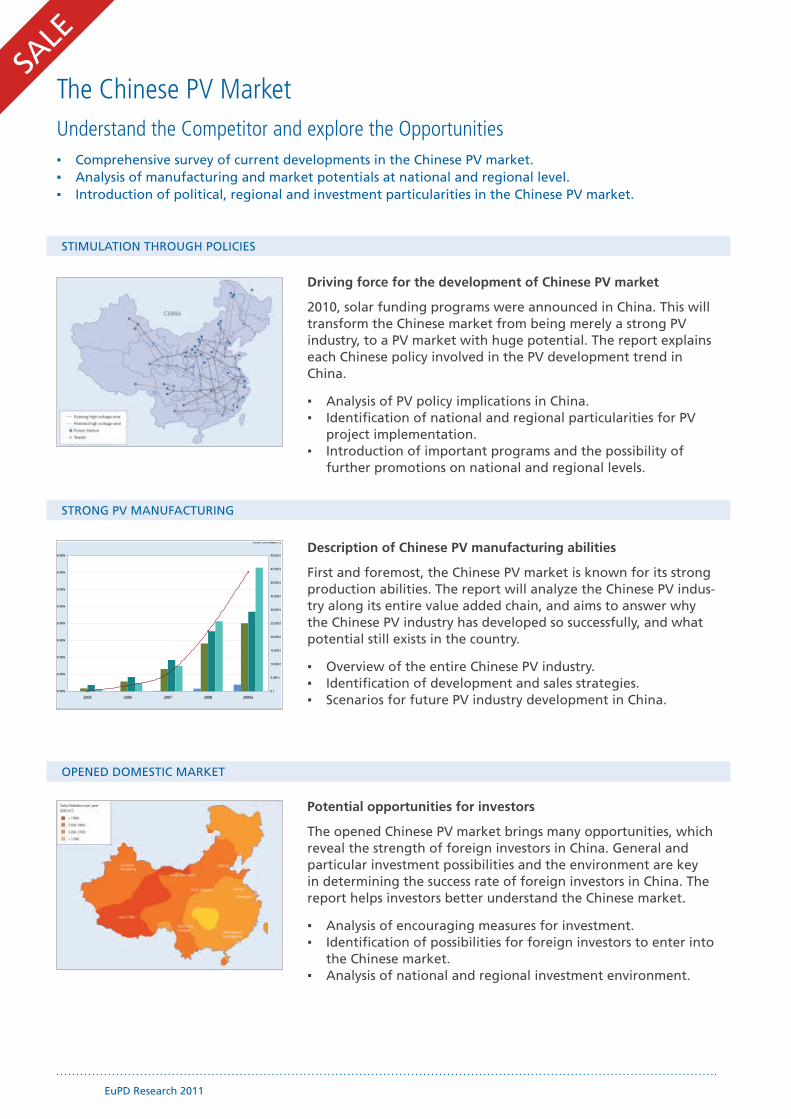
60 EuPD Research 2011
OPENED DOMESTIC MARKET
STRONG PV MANUFACTURING
STIMULATION THROUGH POLICIES
The Chinese PV Market Understand the Competitor and explore the Opportunities
Comprehensive survey of current developments in the Chinese PV market. ▪Analysis of manufacturing and market potentials at national and regional level. ▪Introduction of political, regional and investment particularities in the Chinese PV market. ▪
Driving force for the development of Chinese PV market
2010, solar funding programs were announced in China. This will transform the Chinese market from being merely a strong PV industry, to a PV market with huge potential. The report explains each Chinese policy involved in the PV development trend in China.
Analysis of PV policy implications in China. ▪Identification of national and regional particularities for PV ▪
project implementation.Introduction of important programs and the possibility of ▪
further promotions on national and regional levels.
Description of Chinese PV manufacturing abilities
First and foremost, the Chinese PV market is known for its strong production abilities. The report will analyze the Chinese PV indus-try along its entire value added chain, and aims to answer why the Chinese PV industry has developed so successfully, and what potential still exists in the country.
Overview of the entire Chinese PV industry. ▪Identification of development and sales strategies. ▪Scenarios for future PV industry development in China. ▪
Potential opportunities for investors
The opened Chinese PV market brings many opportunities, which reveal the strength of foreign investors in China. General and particular investment possibilities and the environment are key in determining the success rate of foreign investors in China. The report helps investors better understand the Chinese market.
Analysis of encouraging measures for investment. ▪Identification of possibilities for foreign investors to enter into ▪
the Chinese market.Analysis of national and regional investment environment. ▪
0 MW
2,000 MW
4,000 MW
6,000 MW
8,000 MW
10,000 MW
12,000 MW
14,000 MW
16,000 MW
2005 2006 2007 2008 2009e
0 t
5,000 t
10,000 t
15,000 t
20,000 t
25,000 t
30,000 t
35,000 t
40,000 t
45,000 t
50,000 t
Source: EuPD Research 12/2009
0 MW
xxx MW
xxx MW
xxx MW
xxx MW
xxx MW
xxx MW
xxx MW
xxx MW
2005 2006 2007 2008 2009e
0 t
xxx t
xxx t
xxx t
xxx t
xxx t
xxx t
xxx t
xxx t
xxx t
xxx t
Source: EuPD Research 2009
0 MW
2,000 MW
4,000 MW
6,000 MW
8,000 MW
10,000 MW
12,000 MW
14,000 MW
16,000 MW
2005 2006 2007 2008 2009e
0 t
5,000 t
10,000 t
15,000 t
20,000 t
25,000 t
30,000 t
35,000 t
40,000 t
45,000 t
50,000 t
Source: EuPD Research 12/2009
0 MW
xxx MW
xxx MW
xxx MW
xxx MW
xxx MW
xxx MW
xxx MW
xxx MW
2005 2006 2007 2008 2009e
0 t
xxx t
xxx t
xxx t
xxx t
xxx t
xxx t
xxx t
xxx t
xxx t
xxx t
Source: EuPD Research 2009
SALE
Product Data Sheet
EuPD Research 2011 61
Release Date January 2010
Information Sources In-depth analysis of Chinese databases ▪Qualitative interviews with representatives from investors ▪
and the industrySystematic desk research (media analysis, reports, industry ▪
portals)
Contents China – Framework Conditions and Background Information1. 1.1. General natural conditions 1.2. Economic frameworks1.3. Investment encouragements in China
Photovoltaic industry in China2. 2.1. Photovoltaic capacity and production
2.1.1. Silicon manufacturing2.1.2. Wafer and ingot manufacturing2.1.3. Crystalline cells manufacturing2.1.4. Crystalline modules manufacturing2.1.5. Thin film manufacturing
2.2. Development strategies2.2.1. Tendency to industry consolidation 2.2.2. Expansion to vertical mode2.2.3. Regional distribution of chinese manufacturers2.2.4. Research and development
2.3. Sales strategies2.3.1. Price advances2.3.2. Building of foreign bases2.3.3. Alliance with domestic state-owned-enterprises
Photovoltaic policy in China 3. 3.1. National photovoltaic policies and programs3.2. Regional photovoltaic policies and programs3.3. Policy drive PV development in China3.4. Potential for foreign investors
Benefits for your Company
Keep track of trends and developments in the Chinese PV ▪ industry along the value added chain
Gain a comprehensive understanding of national and ▪ regional particularities within the market, as well as Chinese manufacturing advantages and their development strategies
Understand the possibilities of entering the Chinese market ▪
Included in Delivery 1x report (approximately 60 pages), high quality binding
Price € 660** $ 890**
Author/Contact Martin Ammon
ASI
A
30%Off*(excluding sales tax/VAT) **(excluding sales tax/VAT and P&P)
Imprint
EuPD Research
Adenauerallee 134
D-53113 Bonn
Phone +49 (0) 228 – 971 43 - 0
Fax +49 (0) 228 – 971 43 -11
www.eupd-research.com
Contact
Stefano Reccia
Product Management
© EuPD Research 10/2011
EuPD Research® is a brand of
HOEHNER RESEARCH & CONSULTING GROUP GmbH.
EuPD Research® is a member of ESOMAR World Research.
List of Figures
p.9 www.fotolia.de: internationale Flaggen © S.Alias
p.21 www.fotolia.de: Europa © view7
p.18/42 www.fotolia.de: Solarhochhaus 1 ©danielschoenen
p.28 www.fotolia.de: GoldSolarhochhaus_3 ©danielschoenen
p.30 www.fotolia.de: erneuerbare energien konzept © Massimo Cavallo
p.36 www.fotolia.de: A calculator with a receipt and menu ©Mirabelle Pictures
p.44 www.fotolia.de: The Big Ben, the Houses of Parliament and Westminster Bridge ©kmiragaya
p.47 www.fotolia.de: Freiheit © Zarathustra
p.50/52 www.fotolia.de: Solar assembling at the beginning ©Marina Lohrbach
p.57 www.fotolia.de: indian flag © Paul Cowan


www.eupd-research.com