Product Bans and Restrictions · Product Bans and Restrictions: ... but I don [t know that banning...
26
February 2016 Product Bans and Restrictions: A guide for local government policy makers
Transcript of Product Bans and Restrictions · Product Bans and Restrictions: ... but I don [t know that banning...
February 2016
Product Bans and Restrictions:
A guide for local government policy makers
Minnesota Pollution Control Agency
520 Lafayette Road North | Saint Paul, MN 55155-4194 | www.pca.state.mn.us | 651-296-6300
Toll free 800-657-3864 | TTY 651-282-5332
This report is available in alternative formats upon request, and online at www.pca.state.mn.us .
February 2016 | Document number: p-p2s1-06
Authors
Madalyn Cioci, Minnesota Pollution Control
Agency
Emily Barker, Minnesota Pollution Control
Agency
Kris Van Amber, Management Analysis &
Development, Minnesota Management and
Budget
Beth Bibus, Management Analysis &
Development, Minnesota Management and
Budget
Contributors/acknowledgements
Cover art: Wordcloud produced using Tagxedo,
http://www.tagxedo.com/
Clip art in Prologue: Long Haired Woman Outline, by rejon
https://openclipart.org/detail/21972/long-haired-woman-outline
Colleen Hetzel, Minnesota Pollution Control
Agency
The MPCA is reducing printing and mailing costs
by using the Internet to distribute reports and
information to wider audience. Visit our
website for more information.
MPCA reports are printed on 100% post-
consumer recycled content paper
manufactured without chlorine or chlorine
derivatives.
Table of Contents
Table of Contents ............................................................................................................................... ii
Prologue: The City Council Meeting ................................................................................................... iii
Overview ...........................................................................................................................................1
Why and how do communities restrict products? ...............................................................................1
Different goals require different policies ......................................................................................................... 2
Potential trade-offs in policy impacts .............................................................................................................. 2
Who has enacted a product restriction or ban? .............................................................................................. 4
Policy Examples ................................................................................................................................................ 5
What information will be helpful? .................................................................................................... 11
Getting the product’s whole environmental picture ..................................................................................... 11
Knowing the local context.............................................................................................................................. 14
Defining success and evaluating policy ............................................................................................. 16
How can communities use this information? .................................................................................... 16
What about compostable products? ................................................................................................. 17
What does the MPCA say about product restrictions and bans? ........................................................ 19
Summary ......................................................................................................................................... 20
Resources ........................................................................................................................................ 22
Contact the MPCA .......................................................................................................................................... 22
Examples of life cycle assessments ................................................................................................................ 22
Waste generation and composition data ...................................................................................................... 22
Examples of community evaluations of policy options ................................................................................. 22
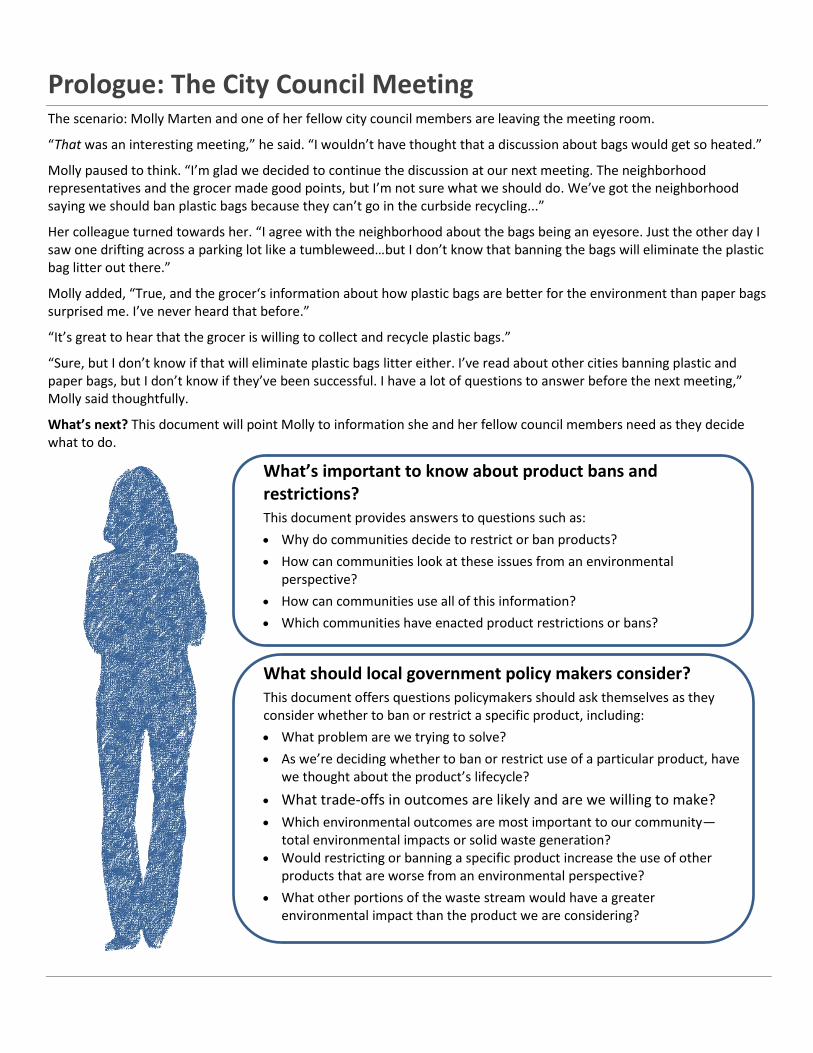
Prologue: The City Council Meeting The scenario: Molly Marten and one of her fellow city council members are leaving the meeting room.
“That was an interesting meeting,” he said. “I wouldn’t have thought that a discussion about bags would get so heated.”
Molly paused to think. “I’m glad we decided to continue the discussion at our next meeting. The neighborhood representatives and the grocer made good points, but I’m not sure what we should do. We’ve got the neighborhood saying we should ban plastic bags because they can’t go in the curbside recycling...”
Her colleague turned towards her. “I agree with the neighborhood about the bags being an eyesore. Just the other day I saw one drifting across a parking lot like a tumbleweed…but I don’t know that banning the bags will eliminate the plastic bag litter out there.”
Molly added, “True, and the grocer‘s information about how plastic bags are better for the environment than paper bags surprised me. I’ve never heard that before.”
“It’s great to hear that the grocer is willing to collect and recycle plastic bags.”
“Sure, but I don’t know if that will eliminate plastic bags litter either. I’ve read about other cities banning plastic and paper bags, but I don’t know if they’ve been successful. I have a lot of questions to answer before the next meeting,” Molly said thoughtfully.
What’s next? This document will point Molly to information she and her fellow council members need as they decide what to do.
What’s important to know about product bans and restrictions? This document provides answers to questions such as:
Why do communities decide to restrict or ban products?
How can communities look at these issues from an environmental perspective?
How can communities use all of this information?
Which communities have enacted product restrictions or bans?
What should local government policy makers consider? This document offers questions policymakers should ask themselves as they consider whether to ban or restrict a specific product, including:
What problem are we trying to solve?
As we’re deciding whether to ban or restrict use of a particular product, have we thought about the product’s lifecycle?
What trade-offs in outcomes are likely and are we willing to make?
Which environmental outcomes are most important to our community—total environmental impacts or solid waste generation?
Would restricting or banning a specific product increase the use of other products that are worse from an environmental perspective?
What other portions of the waste stream would have a greater environmental impact than the product we are considering?
1
Overview Over the last few years, many local, state and international governments have enacted ordinances and laws to restrict the sale, distribution or use of some consumer products. The most common product restrictions (including fees and bans) to date are directed at single-use shopping bags, polystyrene containers and bottled water. Some local governments in Minnesota have sought guidance as they consider whether to restrict these types of products at all, and if they do, how to craft the most effective policy.
The Minnesota Pollution Control Agency (MPCA) prepared this document as a resource for local governments during their decision making processes. The MPCA has no plans to promote a specific policy at the state level. However, agency comments about specific single-use product policy can be found on page 19 of this document and MPCA staff are able to provide additional technical information and assistance to cities and counties.
Local government actions could include voluntary educational efforts or projects to foster increased reuse or recycling behavior or infrastructure, or regulatory fees, bonuses/refunds, or outright bans.
This guide primarily examines impacts of bonuses, fees or bans on sale or distribution from an environmental perspective. It does not examine disposal bans that restrict placing specific items in the trash nor does it review educational campaigns. When considering a product restriction or ban, policy makers weigh the potential positive and negative impacts of their decisions on various constituent groups, the potential for a policy to actually address an identified problem or issue, and the values held by the community.
Many times actions that seem evident, popular or “the right thing to do” can result in unintended consequences—good or bad.
This document provides information that may be useful to policy makers as they consider whether to adopt product restrictions or bans. It also identifies key questions that may help contribute to policy discussions.
Why and how do communities restrict products? At the heart of decisions about whether to restrict or ban a product is a set of values, a specific goal, or a problem. Once the goal is clear, then the question becomes how to craft a policy that reaches that goal. Common reasons for restricting products include:
Environmental impact: Is there a desire to decrease greenhouse gas emissions, energy or natural resource use, air or water pollution?
Solid waste reduction: Is there a desire to meet a comprehensive solid waste plan goal or become a “zero waste to disposal” city?
Litter: Does the product have a documented adverse impact on local aesthetics or cause potential harm to ecosystems and wildlife?
Health/toxicity: Does the production, use or disposal of the product release chemicals that negatively affect living organisms?
Social or environmental justice: Is the production, use or disposal of the product adversely affecting a specific group of people?
2
Different goals require different policies
It is laudable for communities to draw attention to behaviors and products that have environmentally beneficial impacts. The key is for this intention to be translated into well-crafted policies to achieve specifically defined environmental outcomes rather than a general, less-specific outcome of “environmentally friendly.” Why? Because in this arena of consumer products, there can be contradictory trade-offs in impacts that make defining “environmentally friendly” complex.
Potential trade-offs in policy impacts
Historically, single attributes like “recyclability” or “made from renewable materials” were the primary factors used to evaluate products from an environmental perspective. Now, tools like life cycle assessment (LCA) allow policy professionals to have a more complete environmental picture.1 A life cycle assessment details all environmental impacts of a product throughout all stages of the product’s life. It takes into account the amount of resources that go into the product and the emissions, waste, and pollution that result from the manufacture, distribution, use and disposal of a product. An LCA may also detail outcomes like ecosystem toxicity and human health impacts caused throughout a product’s life cycle.
For single-use disposable products, making the product usually causes the large majority of the environmental impact. Discard choices, whether an item is recycled, incinerated or landfilled matters, once the product is created.
For bottled water, life cycle analysis shows that recycling the bottle reduces energy consumption and greenhouse gas emissions (GHG) by about 20% compared to disposing of it. Tap water in a reusable bottle however, can result in about 80-90% reductions of GHG and other impacts.2 Why? Because most of the environmental impact occurs prior to discarding the bottle, during making of the disposable bottle, and bottling and transporting the water.
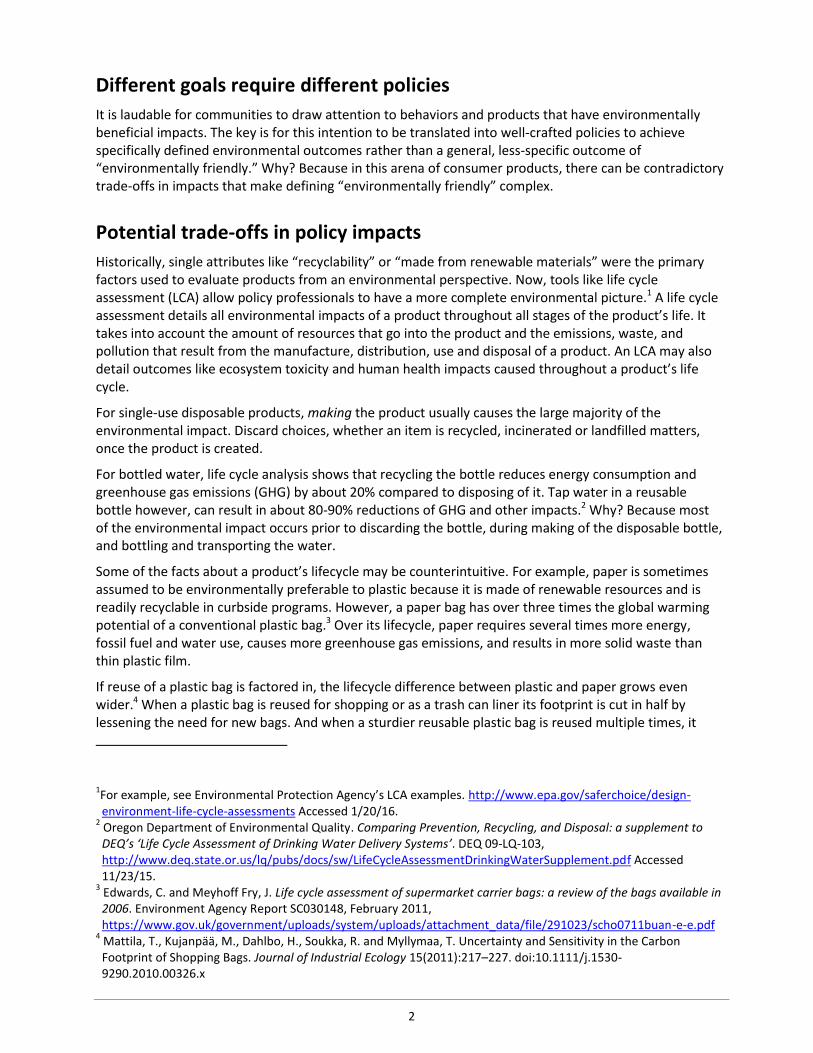
Some of the facts about a product’s lifecycle may be counterintuitive. For example, paper is sometimes assumed to be environmentally preferable to plastic because it is made of renewable resources and is readily recyclable in curbside programs. However, a paper bag has over three times the global warming potential of a conventional plastic bag.3 Over its lifecycle, paper requires several times more energy, fossil fuel and water use, causes more greenhouse gas emissions, and results in more solid waste than thin plastic film.
If reuse of a plastic bag is factored in, the lifecycle difference between plastic and paper grows even wider.4 When a plastic bag is reused for shopping or as a trash can liner its footprint is cut in half by lessening the need for new bags. And when a sturdier reusable plastic bag is reused multiple times, it
1For example, see Environmental Protection Agency’s LCA examples. http://www.epa.gov/saferchoice/design-environment-life-cycle-assessments Accessed 1/20/16.
2 Oregon Department of Environmental Quality. Comparing Prevention, Recycling, and Disposal: a supplement to DEQ’s ‘Life Cycle Assessment of Drinking Water Delivery Systems’. DEQ 09-LQ-103, http://www.deq.state.or.us/lq/pubs/docs/sw/LifeCycleAssessmentDrinkingWaterSupplement.pdf Accessed 11/23/15.
3 Edwards, C. and Meyhoff Fry, J. Life cycle assessment of supermarket carrier bags: a review of the bags available in 2006. Environment Agency Report SC030148, February 2011, https://www.gov.uk/government/uploads/system/uploads/attachment_data/file/291023/scho0711buan-e-e.pdf
4 Mattila, T., Kujanpää, M., Dahlbo, H., Soukka, R. and Myllymaa, T. Uncertainty and Sensitivity in the Carbon Footprint of Shopping Bags. Journal of Industrial Ecology 15(2011):217–227. doi:10.1111/j.1530-9290.2010.00326.x
3
environmentally outperforms both paper and plastic—even though it requires more resources to produce initially.5 Yet, using a reusable bag just once and then letting it sit in a closet significantly undermines its potential benefit over a single-use bag.
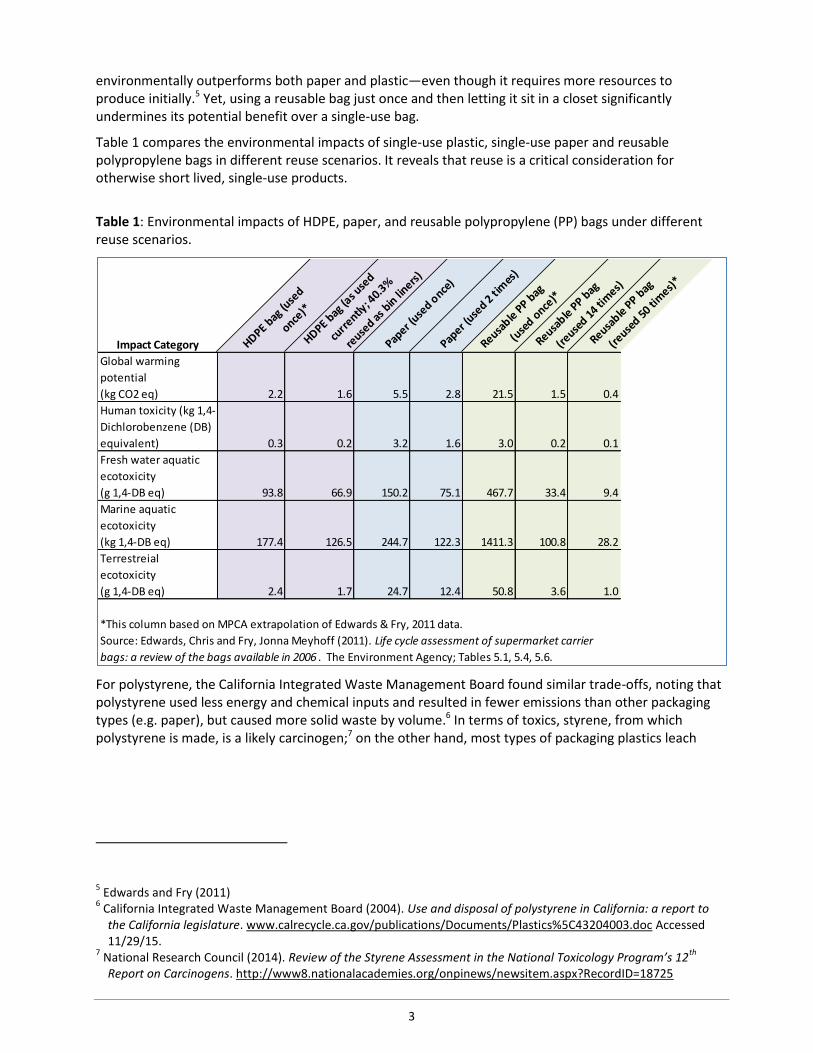
Table 1 compares the environmental impacts of single-use plastic, single-use paper and reusable polypropylene bags in different reuse scenarios. It reveals that reuse is a critical consideration for otherwise short lived, single-use products.
Table 1: Environmental impacts of HDPE, paper, and reusable polypropylene (PP) bags under different reuse scenarios.
For polystyrene, the California Integrated Waste Management Board found similar trade-offs, noting that polystyrene used less energy and chemical inputs and resulted in fewer emissions than other packaging types (e.g. paper), but caused more solid waste by volume.6 In terms of toxics, styrene, from which polystyrene is made, is a likely carcinogen;7 on the other hand, most types of packaging plastics leach
5 Edwards and Fry (2011)
6 California Integrated Waste Management Board (2004). Use and disposal of polystyrene in California: a report to
the California legislature. www.calrecycle.ca.gov/publications/Documents/Plastics%5C43204003.doc Accessed 11/29/15.
7 National Research Council (2014). Review of the Styrene Assessment in the National Toxicology Program’s 12
th
Report on Carcinogens. http://www8.nationalacademies.org/onpinews/newsitem.aspx?RecordID=18725
Impact Category HDPE bag
(use
d
once)*
HDPE bag
(as u
sed
curr
ently; 4
0.3%
reuse
d as b
in lin
ers)
Paper (
used o
nce)
Paper (
used 2
tim
es)
Reusable
PP b
ag
(use
d once
)*
Reusable
PP b
ag
(reuse
d 14 ti
mes)
Reusable
PP b
ag
(reuse
d 50 ti
mes)
*
Global warming
potential
(kg CO2 eq) 2.2 1.6 5.5 2.8 21.5 1.5 0.4
Human toxicity (kg 1,4-
Dichlorobenzene (DB)
equivalent) 0.3 0.2 3.2 1.6 3.0 0.2 0.1
Fresh water aquatic
ecotoxicity
(g 1,4-DB eq) 93.8 66.9 150.2 75.1 467.7 33.4 9.4
Marine aquatic
ecotoxicity
(kg 1,4-DB eq) 177.4 126.5 244.7 122.3 1411.3 100.8 28.2
Terrestreial
ecotoxicity
(g 1,4-DB eq) 2.4 1.7 24.7 12.4 50.8 3.6 1.0
*This column based on MPCA extrapolation of Edwards & Fry, 2011 data.
Source: Edwards, Chris and Fry, Jonna Meyhoff (2011). Life cycle assessment of supermarket carrier
bags: a review of the bags available in 2006 . The Environment Agency; Tables 5.1, 5.4, 5.6.
4
chemicals that can interfere with human hormone activity.8 A switch to paper or to other plastics may increase energy or chemical use, but raise recycling or composting rates.
In short, it’s complicated. Policies will have trade-offs. There may be trade-offs in environmental impacts because of the relative impacts of different product materials or because of how a policy affects citizen behaviors.
Examples of possible environmental impact trade-offs or unintended consequences:
If a policy causes a reduction in plastic bags, but drives an increase in paper bag use, that may increase recycling rates (because paper is more recovered and heavier), but also increase net greenhouse gas emissions.
A policy that increases use of reusable shopping bags, but also drives more purchases of new trash can liner bags, may not result in less plastic or fewer emissions overall.9
A policy that eliminates bottled water may find increased sales of less nutritional, more environmentally intensive soda (i.e. sugar production).
A policy that bans polystyrene to reduce marine litter, may find that other types of plastics increase and there is no net change in marine litter.
Who has enacted a product restriction or ban?
Minnesota
A handful of Minnesota cities have considered product restrictions or bans. Recent passage of ordinances in Minneapolis and St. Louis Park restrict the use of takeout food containers that are not reusable, recyclable or compostable. Macalester College and College of St. Benedict have banned on-campus sales of bottled water. The state of Minnesota does not routinely offer single-use bottled water on state contract and Executive Order 11-13 sets a goal for agencies to reduce their use of bulk bottled water coolers.
Other Cities, Counties, States and Countries
Disposable shopping bags
There are currently no statewide bans or bag fees in the United States. California’s law banning plastic bags state-wise is not yet in force, and is facing a referendum vote in November 201610. However, many cities have bans, fees or combinations of these restrictions that apply to plastic or to both plastic and paper single-use shopping bags. In some cases, policies have been changed after implementation data are gathered (San Jose, CA) or repealed under political pressure (Dallas, TX). Some countries have banned or restricted the use of plastic bags, including China, France, Germany, India and Ireland.
Bottled water
8 Yang, C. Z., Yaniger, S. I., Jordan, V. C., Klein, D. J., & Bittner, G. D. (2011). Most plastic products release estrogenic
chemicals: A potential health problem that can be solved. Environmental Health Perspectives, 119(7), 989–996. http://doi.org/10.1289/ehp.1003220
9 Frisman, Paul. Effect of Plastic Bag Taxes and Bans on Garbage Bag Sales. Connecticut General Assembly, Office of
Legislative Research, Report 2008-R-0685, December 17, 2008. http//www.cga.ct.gov/2008/rpt/2008-R-0685.htm Accessed 6/16/15.
10 McGreevey, P. California’s plastic-bag ban put on hold by ballot referendum. Los Angeles Times, February 24, 2015. http://www.latimes.com/local/political/la-me-pc-california-plastic-bag-ban-20150223-story.html
5
Some colleges and universities in the United States have taken action to end the sales of bottled water on their campuses. A few municipalities and federal agencies have also banned bottled water sales in government facilities.
Polystyrene foam containers
There are some 65 city or county ordinances in California that ban the use of polystyrene food containers for food vendors, restaurants and at government facilities.11 Polystyrene bans are also in place at the local level in other states including Florida, Maine, Oregon and Massachusetts. Additionally, Haiti has a (poorly enforced) ban on polystyrene containers, and Guyana plans to ban import and use of expanded polystyrene foam in 2016.
Policy Examples
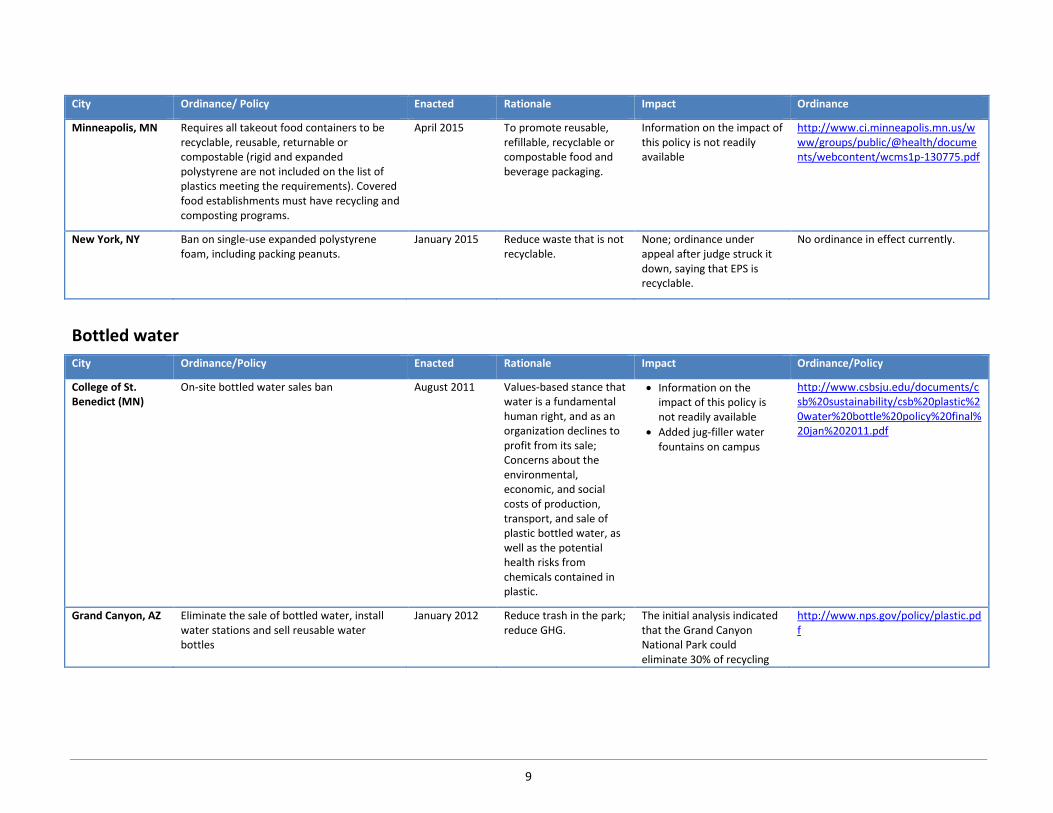
The MPCA asked Minnesota local governments what information would be helpful when considering product restrictions or bans. Many asked for information about how other governments have approached this issue. Table 2 presents samples of policies addressing single-use shopping bags, polystyrene and bottled water. The examples illustrate different strategies communities have taken to meet identified needs and goals. The table is not comprehensive, but is intended to give an overview of policy approaches, stated goals, and outcomes (if any). Detailed citations are provided in footnotes for information about policy outcomes.
The table and referenced ordinances suggest that policies are often enacted with broad and varied sets of goals, and that policies are rarely evaluated. When policy evaluations are undertaken they often reveal unintended consequences.
For policy makers, the first step is to clearly identify the goal of a potential product restriction or ban. Knowing why community action is desired and for which specific outcomes grounds any policy development. The next step is to consider whether a restriction or ban will meet that goal, and what the trade-offs may be.
Questions to consider:
What problem(s) are we trying to solve? What are our specific goals as we consider this product restriction or ban? What trade-offs in outcomes are likely and are we willing to make?
11
Surfrider Foundation, http://www.surfrider.org/pages/polystyrene-ordinances Accessed 1/21/16.
6
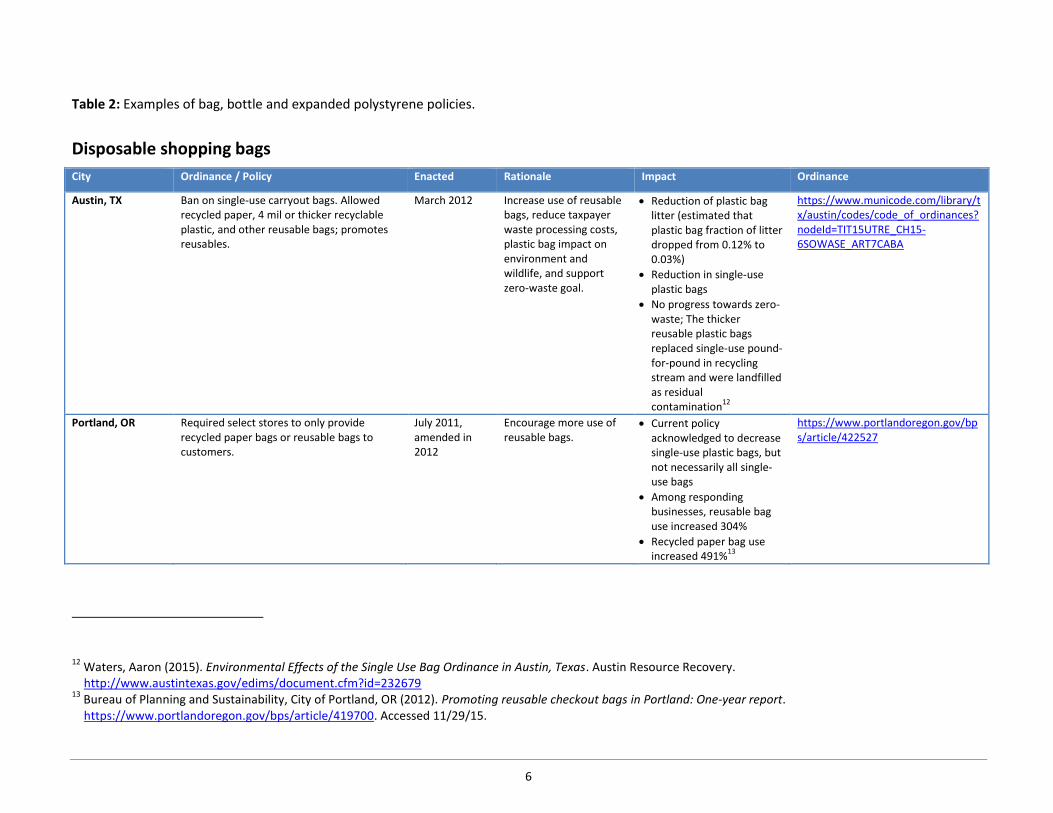
Table 2: Examples of bag, bottle and expanded polystyrene policies.
Disposable shopping bags
City Ordinance / Policy Enacted Rationale Impact Ordinance
Austin, TX Ban on single-use carryout bags. Allowed recycled paper, 4 mil or thicker recyclable plastic, and other reusable bags; promotes reusables.
March 2012 Increase use of reusable bags, reduce taxpayer waste processing costs, plastic bag impact on environment and wildlife, and support zero-waste goal.
Reduction of plastic bag litter (estimated that plastic bag fraction of litter dropped from 0.12% to 0.03%)
Reduction in single-use plastic bags
No progress towards zero-waste; The thicker reusable plastic bags replaced single-use pound-for-pound in recycling stream and were landfilled as residual contamination
12
https://www.municode.com/library/tx/austin/codes/code_of_ordinances?nodeId=TIT15UTRE_CH15-6SOWASE_ART7CABA
Portland, OR Required select stores to only provide recycled paper bags or reusable bags to customers.
July 2011, amended in 2012
Encourage more use of reusable bags.
Current policy acknowledged to decrease single-use plastic bags, but not necessarily all single-use bags
Among responding businesses, reusable bag use increased 304%
Recycled paper bag use increased 491%
13
https://www.portlandoregon.gov/bps/article/422527
12
Waters, Aaron (2015). Environmental Effects of the Single Use Bag Ordinance in Austin, Texas. Austin Resource Recovery. http://www.austintexas.gov/edims/document.cfm?id=232679
13 Bureau of Planning and Sustainability, City of Portland, OR (2012). Promoting reusable checkout bags in Portland: One-year report. https://www.portlandoregon.gov/bps/article/419700. Accessed 11/29/15.
7
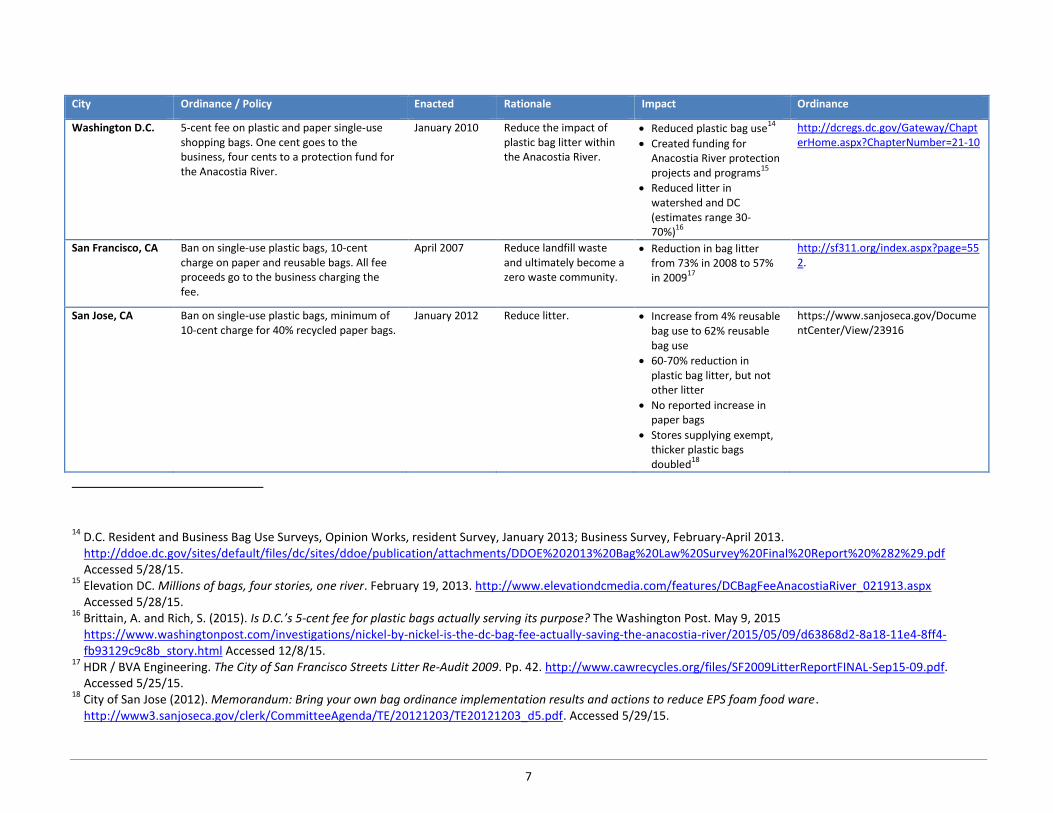
City Ordinance / Policy Enacted Rationale Impact Ordinance
Washington D.C. 5-cent fee on plastic and paper single-use shopping bags. One cent goes to the business, four cents to a protection fund for the Anacostia River.
January 2010 Reduce the impact of plastic bag litter within the Anacostia River.
Reduced plastic bag use14
Created funding for Anacostia River protection projects and programs
15
Reduced litter in watershed and DC (estimates range 30-70%)
16
http://dcregs.dc.gov/Gateway/ChapterHome.aspx?ChapterNumber=21-10
San Francisco, CA Ban on single-use plastic bags, 10-cent charge on paper and reusable bags. All fee proceeds go to the business charging the fee.
April 2007 Reduce landfill waste and ultimately become a zero waste community.
Reduction in bag litter from 73% in 2008 to 57% in 2009
17
http://sf311.org/index.aspx?page=552.
San Jose, CA Ban on single-use plastic bags, minimum of 10-cent charge for 40% recycled paper bags.
January 2012 Reduce litter. Increase from 4% reusable bag use to 62% reusable bag use
60-70% reduction in plastic bag litter, but not other litter
No reported increase in paper bags
Stores supplying exempt, thicker plastic bags doubled
18
https://www.sanjoseca.gov/DocumentCenter/View/23916
14
D.C. Resident and Business Bag Use Surveys, Opinion Works, resident Survey, January 2013; Business Survey, February-April 2013. http://ddoe.dc.gov/sites/default/files/dc/sites/ddoe/publication/attachments/DDOE%202013%20Bag%20Law%20Survey%20Final%20Report%20%282%29.pdf Accessed 5/28/15.
15 Elevation DC. Millions of bags, four stories, one river. February 19, 2013. http://www.elevationdcmedia.com/features/DCBagFeeAnacostiaRiver_021913.aspx Accessed 5/28/15.
16 Brittain, A. and Rich, S. (2015). Is D.C.’s 5-cent fee for plastic bags actually serving its purpose? The Washington Post. May 9, 2015 https://www.washingtonpost.com/investigations/nickel-by-nickel-is-the-dc-bag-fee-actually-saving-the-anacostia-river/2015/05/09/d63868d2-8a18-11e4-8ff4-fb93129c9c8b_story.html Accessed 12/8/15.
17 HDR / BVA Engineering. The City of San Francisco Streets Litter Re-Audit 2009. Pp. 42. http://www.cawrecycles.org/files/SF2009LitterReportFINAL-Sep15-09.pdf. Accessed 5/25/15.
18 City of San Jose (2012). Memorandum: Bring your own bag ordinance implementation results and actions to reduce EPS foam food ware. http://www3.sanjoseca.gov/clerk/CommitteeAgenda/TE/20121203/TE20121203_d5.pdf. Accessed 5/29/15.
8
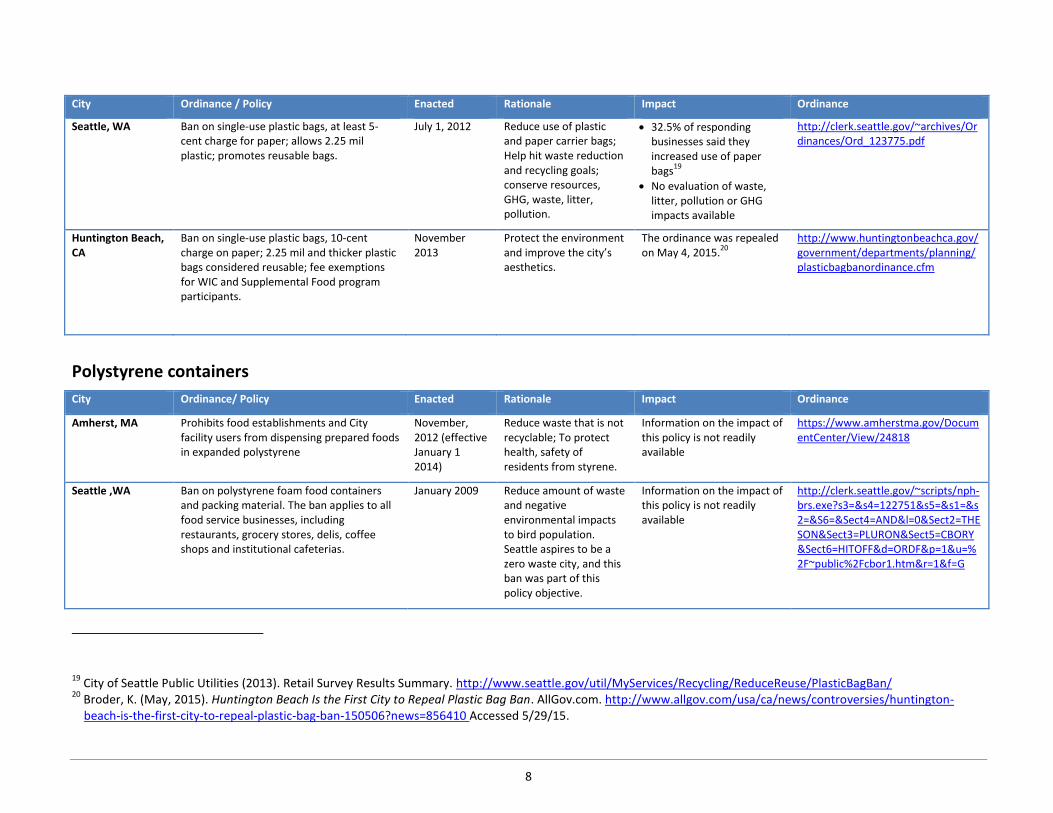
City Ordinance / Policy Enacted Rationale Impact Ordinance
Seattle, WA Ban on single-use plastic bags, at least 5-cent charge for paper; allows 2.25 mil plastic; promotes reusable bags.
July 1, 2012 Reduce use of plastic and paper carrier bags; Help hit waste reduction and recycling goals; conserve resources, GHG, waste, litter, pollution.
32.5% of responding businesses said they increased use of paper bags
19
No evaluation of waste, litter, pollution or GHG impacts available
http://clerk.seattle.gov/~archives/Ordinances/Ord_123775.pdf
Huntington Beach, CA
Ban on single-use plastic bags, 10-cent charge on paper; 2.25 mil and thicker plastic bags considered reusable; fee exemptions for WIC and Supplemental Food program participants.
November 2013
Protect the environment and improve the city’s aesthetics.
The ordinance was repealed on May 4, 2015.
20
http://www.huntingtonbeachca.gov/government/departments/planning/plasticbagbanordinance.cfm
Polystyrene containers
City Ordinance/ Policy Enacted Rationale Impact Ordinance
Amherst, MA Prohibits food establishments and City facility users from dispensing prepared foods in expanded polystyrene
November, 2012 (effective January 1 2014)
Reduce waste that is not recyclable; To protect health, safety of residents from styrene.
Information on the impact of this policy is not readily available
https://www.amherstma.gov/DocumentCenter/View/24818
Seattle ,WA Ban on polystyrene foam food containers and packing material. The ban applies to all food service businesses, including restaurants, grocery stores, delis, coffee shops and institutional cafeterias.
January 2009 Reduce amount of waste and negative environmental impacts to bird population. Seattle aspires to be a zero waste city, and this ban was part of this policy objective.
Information on the impact of this policy is not readily available
http://clerk.seattle.gov/~scripts/nph-brs.exe?s3=&s4=122751&s5=&s1=&s2=&S6=&Sect4=AND&l=0&Sect2=THESON&Sect3=PLURON&Sect5=CBORY&Sect6=HITOFF&d=ORDF&p=1&u=%2F~public%2Fcbor1.htm&r=1&f=G
19
City of Seattle Public Utilities (2013). Retail Survey Results Summary. http://www.seattle.gov/util/MyServices/Recycling/ReduceReuse/PlasticBagBan/ 20
Broder, K. (May, 2015). Huntington Beach Is the First City to Repeal Plastic Bag Ban. AllGov.com. http://www.allgov.com/usa/ca/news/controversies/huntington-beach-is-the-first-city-to-repeal-plastic-bag-ban-150506?news=856410 Accessed 5/29/15.
9
City Ordinance/ Policy Enacted Rationale Impact Ordinance
Minneapolis, MN Requires all takeout food containers to be recyclable, reusable, returnable or compostable (rigid and expanded polystyrene are not included on the list of plastics meeting the requirements). Covered food establishments must have recycling and composting programs.
April 2015 To promote reusable, refillable, recyclable or compostable food and beverage packaging.
Information on the impact of this policy is not readily available
http://www.ci.minneapolis.mn.us/www/groups/public/@health/documents/webcontent/wcms1p-130775.pdf
New York, NY Ban on single-use expanded polystyrene foam, including packing peanuts.
January 2015 Reduce waste that is not recyclable.
None; ordinance under appeal after judge struck it down, saying that EPS is recyclable.
No ordinance in effect currently.
Bottled water
City Ordinance/Policy Enacted Rationale Impact Ordinance/Policy
College of St. Benedict (MN)
On-site bottled water sales ban August 2011 Values-based stance that water is a fundamental human right, and as an organization declines to profit from its sale; Concerns about the environmental, economic, and social costs of production, transport, and sale of plastic bottled water, as well as the potential health risks from chemicals contained in plastic.
Information on the impact of this policy is not readily available
Added jug-filler water fountains on campus
http://www.csbsju.edu/documents/csb%20sustainability/csb%20plastic%20water%20bottle%20policy%20final%20jan%202011.pdf
Grand Canyon, AZ Eliminate the sale of bottled water, install water stations and sell reusable water bottles
January 2012 Reduce trash in the park; reduce GHG.
The initial analysis indicated that the Grand Canyon National Park could eliminate 30% of recycling
http://www.nps.gov/policy/plastic.pdf
10
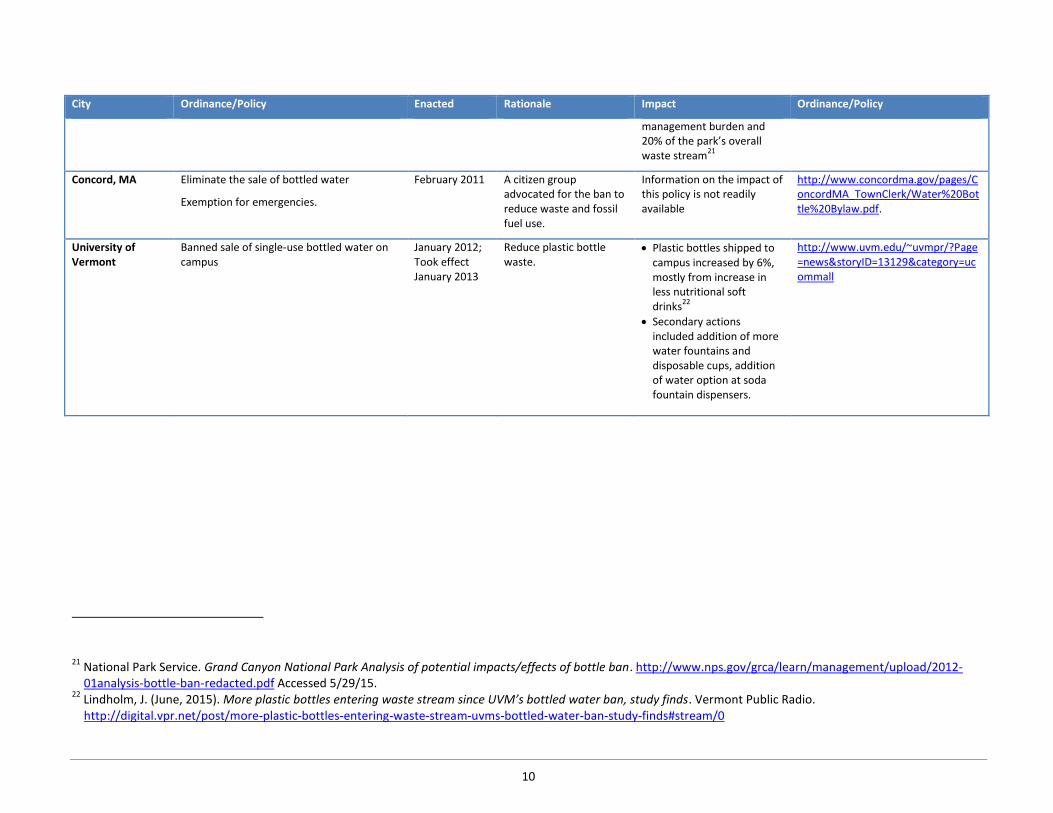
City Ordinance/Policy Enacted Rationale Impact Ordinance/Policy
management burden and 20% of the park’s overall waste stream
21
Concord, MA Eliminate the sale of bottled water
Exemption for emergencies.
February 2011 A citizen group advocated for the ban to reduce waste and fossil fuel use.
Information on the impact of this policy is not readily available
http://www.concordma.gov/pages/ConcordMA_TownClerk/Water%20Bottle%20Bylaw.pdf.
University of Vermont
Banned sale of single-use bottled water on campus
January 2012; Took effect January 2013
Reduce plastic bottle waste.
Plastic bottles shipped to campus increased by 6%, mostly from increase in less nutritional soft drinks
22
Secondary actions included addition of more water fountains and disposable cups, addition of water option at soda fountain dispensers.
http://www.uvm.edu/~uvmpr/?Page=news&storyID=13129&category=ucommall
21
National Park Service. Grand Canyon National Park Analysis of potential impacts/effects of bottle ban. http://www.nps.gov/grca/learn/management/upload/2012-01analysis-bottle-ban-redacted.pdf Accessed 5/29/15.
22 Lindholm, J. (June, 2015). More plastic bottles entering waste stream since UVM’s bottled water ban, study finds. Vermont Public Radio. http://digital.vpr.net/post/more-plastic-bottles-entering-waste-stream-uvms-bottled-water-ban-study-finds#stream/0
11
What information will be helpful? Review of policies from other locales, such as those just presented, is helpful. However, before adopting a policy “as is” from elsewhere, there are several other types of information that local communities may want to consider.
Getting the product’s whole environmental picture
As mentioned before, a full understanding of the environmental impacts of a product compared to other products is complicated. Three possible lenses through which to look at environmental impact are life cycle assessment (mentioned earlier), the preferred waste management methods, and overall material and waste trends. Using all of them will help yield a more complete picture.
Life cycle assessment is a helpful analysis approach that yields information otherwise hidden about a product’s whole footprint, from mining or growing raw resources to manufacture. A plastic bag may be made from nonrenewable fossil fuel, but it is often the by-products of natural gas production, whereas a paper bag, though manufactured with pulp from renewable trees or recycled paper, are typically produced using more fossil resources than the plastic bags contain or use.
Interpreting LCAs is difficult without training or experience. Like any analysis they can be done well or poorly, credibly or with bias. Look for LCAs that have been reviewed by independent reviewers, appear in peer-reviewed journals, and that are conducted according to accepted standards for LCA. It can also help to look for patterns in results of multiple LCAs examining the same type of product. While some industry-sponsored LCAs are quite credible, scrutinize them carefully.
LCAs have some limitations. They often aren’t helpful in choosing among different options of the same product type – for example is one manufacturer’s polystyrene made more sustainably than another’s? LCAs do not account for social or environmental justice considerations. Is visible plastic litter in your community more of a concern than water pollution from paper manufacturing in another country? LCAs also cannot tell you which environmental impacts or program outcomes to value. Is protecting water quality more important than conserving energy? Is maximizing recycling more important than preventing discards in the first place? Which of these is most important is a question of values, and one that communities have to answer for themselves.
Some examples of life cycle assessments can be found on page 22 under Resources.
Questions to consider:
What is the overall lifecycle of the product we’re considering restricting or banning?
What life cycle assessments reveal about single-use products:
Generally, the less mass in a product, the less its total impact.
Consumers don’t see all of the pollution and solid waste generated during the entire lifecycle of a product.
The disposal phase is not the only factor to consider and may not have the biggest impact. Because the lion’s share of impact is from production, reuse can result in large benefits when it displaces need for new production.
12
If people might pick an alternative product in reaction to a ban or restriction, what is the lifecycle of that alternative product?
Which environmental outcomes are most important to our community—total environmental impacts throughout product life cycle or solid waste generation?
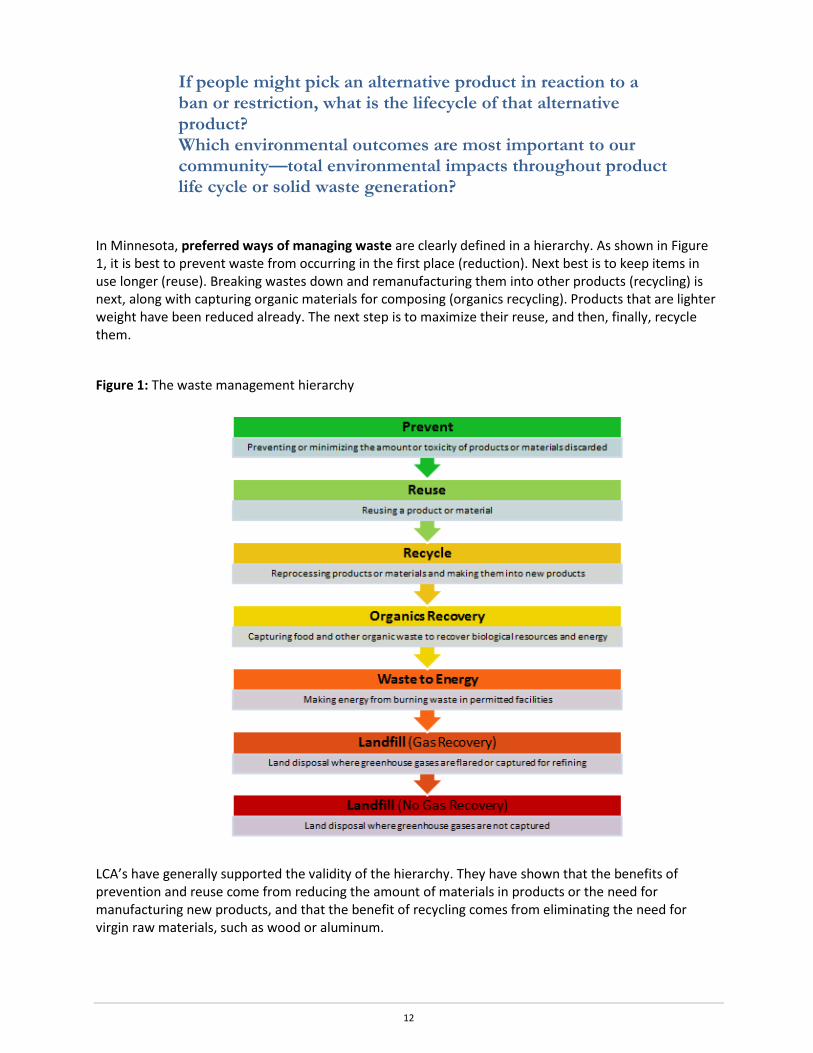
In Minnesota, preferred ways of managing waste are clearly defined in a hierarchy. As shown in Figure 1, it is best to prevent waste from occurring in the first place (reduction). Next best is to keep items in use longer (reuse). Breaking wastes down and remanufacturing them into other products (recycling) is next, along with capturing organic materials for composing (organics recycling). Products that are lighter weight have been reduced already. The next step is to maximize their reuse, and then, finally, recycle them.
Figure 1: The waste management hierarchy
LCA’s have generally supported the validity of the hierarchy. They have shown that the benefits of prevention and reuse come from reducing the amount of materials in products or the need for manufacturing new products, and that the benefit of recycling comes from eliminating the need for virgin raw materials, such as wood or aluminum.
13
Contrary to frequent assumption, keeping waste out of landfills is not where most environmental benefit of reduction, reuse and recycling happens. It happens by displacing the need to extract virgin materials for production or for the production of new products at all.
This is the underlying rationale for promoting a circular economy – in which resources continue to circulate and are not disposed. In this model, businesses either take back their own products for reuse or recycling, or discarded products (e.g. milk jugs) are used as the raw material for another business’ product (e.g. outdoor furniture).
In some cases, threat of local bans on specific products or materials has prompted businesses to step forward with offers to support take back or recycling programs.
Questions to consider:
Where does the proposed policy restriction or ban fit in the waste management hierarchy? Will the proposed policy restriction or ban shift a portion of the community’s waste toward a more preferred management option? How could our community support better capture, reuse, or recycling of this type of product?
Reviewing overall waste trends while considering targeting a specific product can be helpful in understanding the relative prevalence of the product in waste compared to other waste stream components. Developing and passing policy requires time and money as well as political capital. Understanding waste trends can help a community narrow in on types of wastes that are prevalent in tonnage or problematic because of volume, or that are growing or shrinking. Consumer packaging products like bags and bottles aren’t the only parts of the waste stream that policy makers may want to consider.
With growth in research and popular focus on marine plastics, public sentiment seems drawn to targeting plastics for product restrictions. In general, in the municipal solid waste (MSW) stream, plastics are among the waste types that are increasing, while paper and metals are decreasing, reflecting, in part, changes in packaging. However, paper, paperboard and food are still larger components of discards in municipal solid waste than plastic.23 Plastic is a lightweighted material and is helping packaging become lighter (using less material) all the time (e.g. flexible packaging pouches versus metal cans or glass jars).
It is easy to think that household and commercial waste makes up all the waste. However, in Minnesota, about half of waste is from construction and demolition and industrial processes. In 2013, about 4.7 million tons of construction, demolition and industrial waste went to landfills alone. This doesn’t include any recycling of these waste types. For comparison, about 5.7 million tons of household and commercial waste was generated (and managed by recycling, composting, waste-to-energy or landfill). Generally, construction and demolition wastes are recycled at a much lower rate than MSW in Minnesota because relatively little emphasis has been placed on construction and demolition recycling.
Considering the whole waste picture (trends in waste generation, as well as all types of waste) may help a community decide the best target for policy to achieve stated goals.
23
United States Environmental Protection Agency (2015). Advancing Sustainable materials management: Facts and Figures. http://www.epa.gov/smm/advancing-sustainable-materials-management-facts-and-figures#Materials
14
The MPCA and the United States Environmental Protection Agency both offer waste characterization studies that describe disposal and recycling rates of different materials from MSW, industrial, and construction and demolition waste streams (see Resources).
Questions to consider:
What are the largest components of our community-generated discards? What resources are available (existing reports, advice from staff, data or expertise from MPCA) to help us understand our local waste issues? What other portions of the waste stream, if addressed, would have a greater environmental impact than the product we are considering? How would a specific ban or restriction affect trends in solid waste disposal? Would a specific ban or restriction have environmental impacts beyond the solid waste stream?
Knowing the local context
Taking time to understand details of the local context can help in crafting better policy. Specifically, information about local litter composition, consumer patterns of use of the targeted products and potential alternatives, and constituent values can all inform policy development.
Litter is a common reason for product restrictions. For a product policy to be effective at addressing litter, a community needs to know how much of which items is littered in their community, a question that can be answered by a litter audit. Billowing bags are visible, but are they actually more of a problem than beverage bottles or snack bags and candy wrappers? A litter audit will provide baseline data that will help target types of wastes and guide actions. Minnesota and national litter data is sparse. As an example, Texas did a thorough study in 2013 by counting the number of items at over 200 sites around the state. Of all visible litter items, 2% were plastic retail bags, 2.5% were polystyrene foam cups and clamshells, tires and vehicle debris were 20% and other beverage containers and tops/straws comprised 18.5%. Of micro litter (less than 2 square inches), cigarette butts were 48%.24
Sometimes, plastics in oceans or other waters are a particular concern. Again, it will help to know the degree to which the community contributes to this problem prior to taking action, in order to know the potential effect and to have a baseline to measure against. Most ocean plastic is caused by people living within 30 miles of a coast. The U.S. is responsible for 0.3 million metric tons, under 1% of ocean plastic globally.25
Consumer behaviors in response to the policy will partially determine policy impacts – intended and unintended, so it is helpful to understand them before passing product-specific policy. Most research in
24
Environmental Resources Planning, LLC (2013). 2013 Texas litter Survey. http://www.dontmesswithtexas.org/docs/DMWT_2013_Litter_Survey.pdf Accessed on 7/1/15.
25 Hotz, R.L. Which Countries Create the Most Ocean Trash? Wall Street Journal, Feb 12, 2015 http://www.wsj.com/articles/which-countries-create-the-most-ocean-trash-1423767676
15
this area examines impacts of single-use shopping bag restrictions, though some lessons may transfer to other products.
Consumer reuse affects environmental impacts: To what degree are single-use bags reused currently? Are plastic bags routinely reused as trash bin liners? If so, there is some evidence that bag bans may cause increased purchase of new plastic trash bags, reducing waste reduction impacts.26
Will consumers actually use thicker plastic bags as reusables? In Austin, Texas what were intended to be reusable plastic bags were sometimes used as single-use bags, and often ended up being pulled out of recycling lines and sent to landfill.
Fees versus bonuses: Research suggests that fees are more powerful behavior levers than bonuses (e.g. five cent refund for bringing a reusable bag). A 2013 study on shopping bag taxes and bonuses found that even a small fee of 5¢ is enough to compel a customer to use reusable bags rather than pay the fee. 27
Convenience: Innovative approaches can influence behavior by making desired behaviors more convenient and appealing. For example, if a goal is to reduce bottled water use, communities might consider something like the Tap Minneapolis campaign which promotes drinking tap water by providing water fountain/jug filling stations at community events, and by installing public water fountains.
An example to increase recycling of plastic bags would be requiring businesses that give out plastic bags to collect them for recycling as the state of Delaware has done.28
There is some evidence that there is an interaction of fees and reuse behaviors. When Ireland raised
their bag fees beyond the cost of new trash can liners, sales of trash can liners reportedly increased by
over 70%. In Seattle, 5% of people reported that they would increase their purchase of trash can liners if
a fee were charged on plastic shopping bags.29
Additionally, there can be important social justice impacts to consider. Would the proposed policy
impact those with low-incomes differently than those with middle- or high- incomes? Are there ways to
offset those impacts? Are their cultural differences in bag use or preferences?
Consumer behavior is complex. A thorough understanding of current consumer behavior is important
when crafting a policy, as is a commitment to measuring the impact of any enacted policy.
Encouraging or partnering with the private sector can be another consideration. Some retailers have
taken steps to reduce the use of some products or support recovery of products for recycling. For
example, IKEA used a phased approach to discourage use of single-use bags. They started with a fee on
26
Connecticut Office of Legislative Research (2008). Effect of plastic bag taxes and bans on garbage bag sales.
https://www.cga.ct.gov/2008/rpt/2008-R-0685.htm Accessed 12/3/15. 27
Homonoff, T. (2013). Can Small Incentives Have Large Effects? The Impact of Taxes versus Bonuses on Disposable Bag Use. http://www.human.cornell.edu/pam/people/upload/Homonoff-Can-Small-Incentives-Have-Large-Effects.pdf Accessed 5/29/15.
28 State of Delaware. http://delcode.delaware.gov/title7/c060/sc09/index.shtml Accessed 12/3/15.
29 Frisman, P. Effect of Plastic Bag Taxes and Bans on Garbage Bag Sales. December 17, 2008. http://www.cga.ct.gov/2008/rpt/2008-R-0685.htm Accessed on 6/16/15.
16
disposable bags and lowered the cost of reusable bags, then they stopped offering single-use bags
altogether.30 Local governments could work with retailers to encourage similar approaches.
Questions to consider:
Would restricting or banning a specific product increase the use of other products that are worse from an environmental perspective? Would the proposed policy take advantage of patterns in consumer behavior? Are there other approaches that could drive the desired consumer behavior?
Defining success and evaluating policy Passing a policy or ordinance does not guarantee compliance or success. For that reason, it is helpful to be clear at the outset about what will constitute success. Consider writing into the policy details for enforcement and a requirement to evaluate policy effects a year or two after implementation.
In the review of policies for this paper, wherever product policies have been evaluated, findings suggested improvements or other changes. In one case, a policy was working so well that the planned fee increase on bags wasn’t necessary.31
There are many possible policy approaches – fees, bans, education, new recycling requirements or reuse infrastructure. No one can anticipate all consequences of an ordinance, but taking time to gather information outlined in this section prior to finalizing policy may make success more likely.
How can communities use this information? In summary, determining if a product policy is appropriate requires defining the goals. These goals will
depend on values and behaviors of the community. Different goals are likely to require different
strategies and policies regarding the types of materials being addressed. In the Resources section on
page 22, there are examples of the process and analysis that two communities Fort Collins, Colorado
and St. Louis Park, Minnesota, used in evaluating possible policy approaches. Table 3 below provides
ideas for consideration.
30
IKEA to Charge Customers for Plastic Bags. Environmental Leader. February 20, 2007. www.environmentalleader.com/2007/02/20/ikea-to-charge-customers-for-plastic-bags/ See also IKEA to Ban All Plastic Bags. Environmental Leader. April 2, 2008. http//www.environmentalleader.com/2008/04/02/ikea-to-ban-all-plastic-bags/ Accessed 6/16/15.
31 City of San Jose. Bring Your Own Bag webpage. https://www.sanjoseca.gov/index.aspx?NID=1526 Accessed 1/21/16.
17
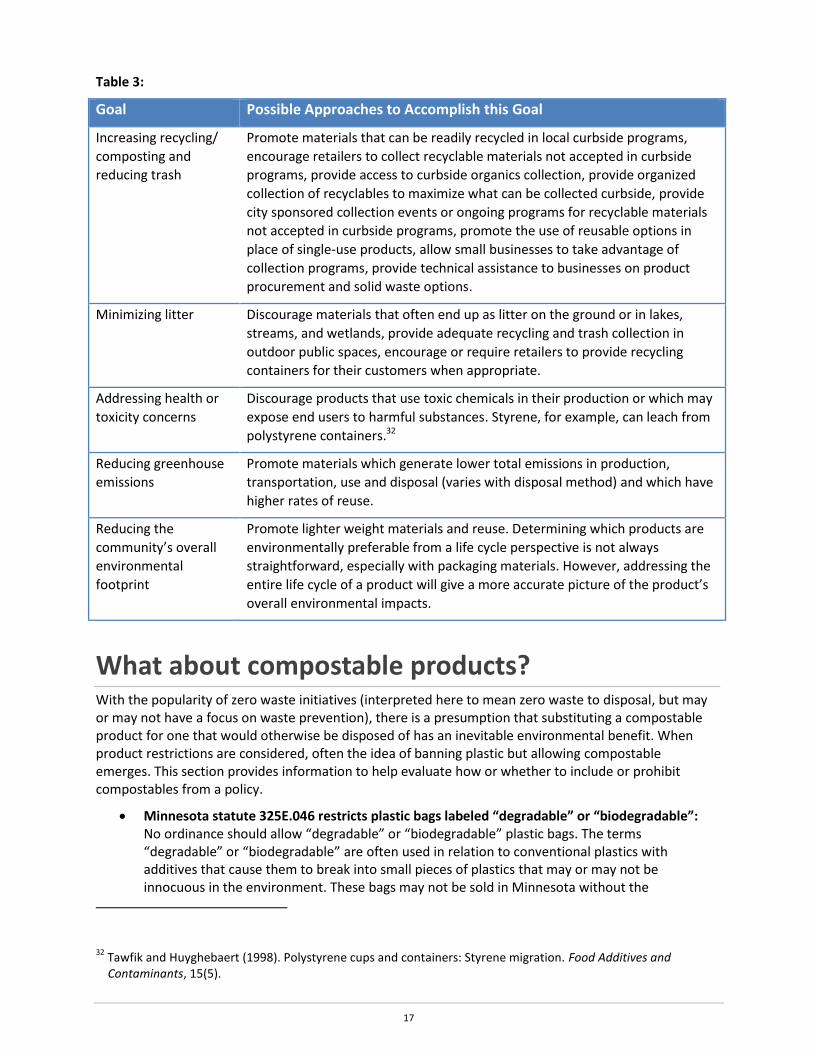
Table 3:
Goal Possible Approaches to Accomplish this Goal
Increasing recycling/
composting and
reducing trash
Promote materials that can be readily recycled in local curbside programs,
encourage retailers to collect recyclable materials not accepted in curbside
programs, provide access to curbside organics collection, provide organized
collection of recyclables to maximize what can be collected curbside, provide
city sponsored collection events or ongoing programs for recyclable materials
not accepted in curbside programs, promote the use of reusable options in
place of single-use products, allow small businesses to take advantage of
collection programs, provide technical assistance to businesses on product
procurement and solid waste options.
Minimizing litter Discourage materials that often end up as litter on the ground or in lakes,
streams, and wetlands, provide adequate recycling and trash collection in
outdoor public spaces, encourage or require retailers to provide recycling
containers for their customers when appropriate.
Addressing health or
toxicity concerns
Discourage products that use toxic chemicals in their production or which may
expose end users to harmful substances. Styrene, for example, can leach from
polystyrene containers.32
Reducing greenhouse
emissions
Promote materials which generate lower total emissions in production,
transportation, use and disposal (varies with disposal method) and which have
higher rates of reuse.
Reducing the
community’s overall
environmental
footprint
Promote lighter weight materials and reuse. Determining which products are
environmentally preferable from a life cycle perspective is not always
straightforward, especially with packaging materials. However, addressing the
entire life cycle of a product will give a more accurate picture of the product’s
overall environmental impacts.
What about compostable products? With the popularity of zero waste initiatives (interpreted here to mean zero waste to disposal, but may or may not have a focus on waste prevention), there is a presumption that substituting a compostable product for one that would otherwise be disposed of has an inevitable environmental benefit. When product restrictions are considered, often the idea of banning plastic but allowing compostable emerges. This section provides information to help evaluate how or whether to include or prohibit compostables from a policy.
Minnesota statute 325E.046 restricts plastic bags labeled “degradable” or “biodegradable”: No ordinance should allow “degradable” or “biodegradable” plastic bags. The terms “degradable” or “biodegradable” are often used in relation to conventional plastics with additives that cause them to break into small pieces of plastics that may or may not be innocuous in the environment. These bags may not be sold in Minnesota without the
32
Tawfik and Huyghebaert (1998). Polystyrene cups and containers: Styrene migration. Food Additives and Contaminants, 15(5).
18
establishment of a scientifically valid and certifiable standard. At this time there are no such standards. Bags that are labeled “compostable” must be designed and tested to meet the ASTM Standard Specification for Compostable Plastics (D6400) and be labeled to reflect that it meets the standard. These bags will decompose into healthy compost under commercial organics composting conditions (but not in backyard compost bins). Compost facilities in Minnesota prefer (and some municipalities only allow) bags that also have third party testing through the Biodegradable Products Institute or Cedar Grove.
Compostables may or may not have a smaller footprint: In a comprehensive study of drinking water delivery systems, Oregon Department of Environmental Quality found that compostable plastic (polylactic acid, PLA) performed better than PET plastic in some environmental impact areas (less ecotoxicity) but worse in others (water quality).33
Compostable products can vary widely in their base materials (corn, wood, sugarcane pulp, etc.), how those base materials are grown, and the intensity of resources needed in manufacturing. Thus, the life cycle impacts will vary depending on the product or even on the facility where they are manufactured, and may or may not be better than conventional plastics.
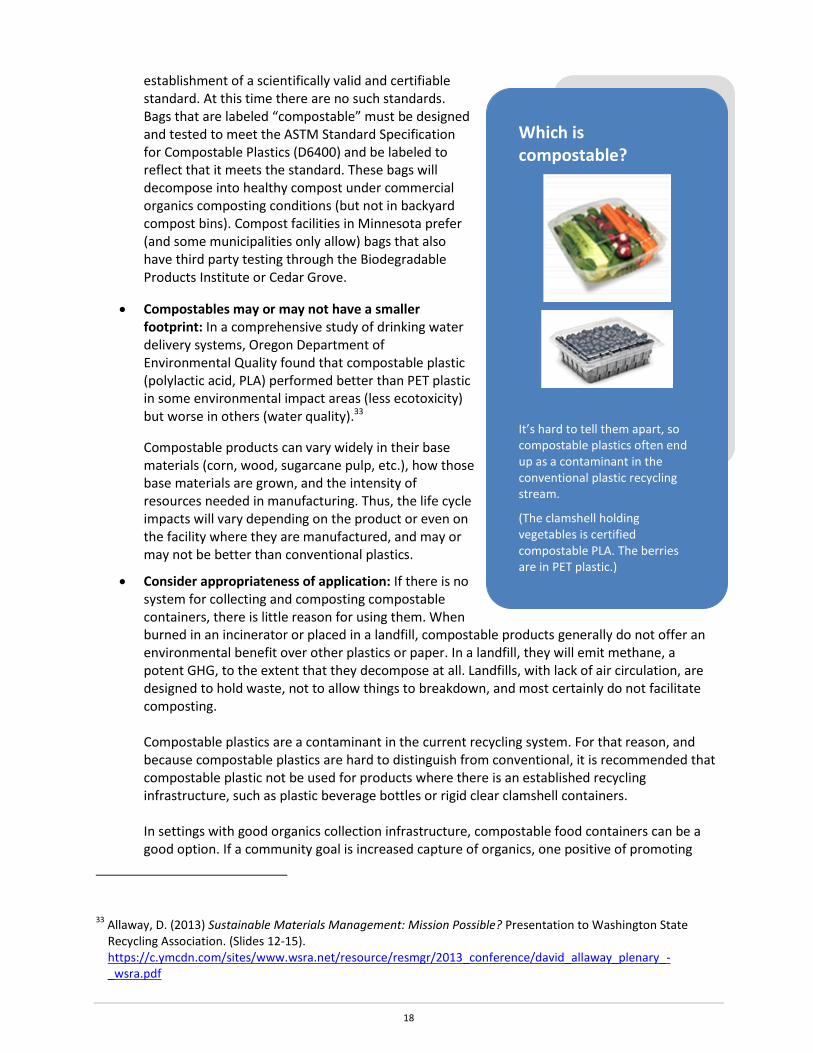
Consider appropriateness of application: If there is no system for collecting and composting compostable containers, there is little reason for using them. When burned in an incinerator or placed in a landfill, compostable products generally do not offer an environmental benefit over other plastics or paper. In a landfill, they will emit methane, a potent GHG, to the extent that they decompose at all. Landfills, with lack of air circulation, are designed to hold waste, not to allow things to breakdown, and most certainly do not facilitate composting. Compostable plastics are a contaminant in the current recycling system. For that reason, and because compostable plastics are hard to distinguish from conventional, it is recommended that compostable plastic not be used for products where there is an established recycling infrastructure, such as plastic beverage bottles or rigid clear clamshell containers. In settings with good organics collection infrastructure, compostable food containers can be a good option. If a community goal is increased capture of organics, one positive of promoting
33
Allaway, D. (2013) Sustainable Materials Management: Mission Possible? Presentation to Washington State Recycling Association. (Slides 12-15). https://c.ymcdn.com/sites/www.wsra.net/resource/resmgr/2013_conference/david_allaway_plenary_-_wsra.pdf
Which is compostable?
It’s hard to tell them apart, so compostable plastics often end up as a contaminant in the conventional plastic recycling stream.
(The clamshell holding vegetables is certified compostable PLA. The berries are in PET plastic.)
19
compostable containers over non-recyclable or traditional recyclable containers is that any food residue would be composted right along with the container.
What does the MPCA say about product restrictions and bans? In general, the MPCA is supportive of policies that result in net prevention of waste, conserve natural resources, lower life cycle pollution and emissions, and push management of wastes to their highest and best uses. The waste management hierarchy in state statute promotes source reduction first, then reuse, and then recycling, in that order.
MPCA encourages lifecycle or systemic thinking about these issues. Communities should avoid replacing a material with an equally or more problematic material.
Recognizing that citizen behavior is an important part of determining environmental impacts of these products, the MPCA encourages consideration of adding education and other behavioral campaigns to any restriction.
Currently, the MPCA doesn’t have a blanket position on policies to prohibit or restrict any single-use consumer packaging products at the city, county or state level. However, MPCA offers the following for specific product types.
Shopping bags: If a community has determined to take action to reduce single-use shopping bags, the MPCA suggests a policy approach that, based on current information, effectively supports reuse – charging a fee for both plastic and paper bags, while promoting reusable bags and more convenient and effective opportunities for recycling of paper and plastic single-use bags. This approach encourages use of reusable bags while still allowing citizens the option of occasionally using whichever single-use bag they are most likely to reuse and/or recycle. It recognizes that for some people plastic bags are frequently reused in place of new (thicker plastic) trash bags or pet waste bags and that this reuse is an environmental benefit. For others, paper bags may be more often reused at the store or more easily recycled than plastic. It may also minimize opposition by not banning any single product type over another.
For communities writing ordinances, defining what is “reusable” is often a challenge. Green Seal standard GS-16 defines standards for reusable bags. While no products are currently listed as certified under the standard, a community could draw from the standard in defining the term in policy.
Polystyrene: Fostering reuse where possible is desirable. Minnesota Department of Health rules allow people to bring their own containers to restaurants for purposes of taking home uneaten food. Communities may want to educate and promote this behavior in ways similar to promotion of reusable shopping bags and coffee cups. Ambitious communities could support development of reusable and returnable take out container businesses similar to the Go Box program in Portland, OR, and San Francisco, CA.
For takeout food, a ban on polystyrene containers will result in an increase in the products that replaces it – another type of plastic, paper with plastic lining, or compostable containers. Some specific alternative products may be manufactured in such a way to decrease life cycle impacts compared to polystyrene.34 Though more of the alternatives may be recyclable, they are also likely to weigh more
34
See for example, Vink, E., Davies, S., and Kolstad, J. (2010). The eco-profile for current Ingeo polylactide production. Industrial Biotechnology, 6(4), p. 212-224.
20
than polystyrene, so waste generation tonnage may go up along with recycling rates. Switches to compostable products are beneficial only if there are prevalent organics collections programs in place.
Bottled water: While the MPCA promotes no specific policy approach for bottled water restrictions at city or county level, research is clear that reusable containers and tap water are an environmentally preferable source of drinking water than bottled water.35 State agencies in Minnesota operate under an Executive Order (11-13) goal to reduce use of bulk bottled water by fifty percent and are encouraged to use jug-filling water fountains instead. Interested communities may be interested in City of Minneapolis’ Tap Mpls campaign, through which the city makes clean city tap water available for free at large community events.
Summary Local governments have much to consider when they make decisions about proposed product bans and restrictions. This guide points to resources and data that can help officials make sound decisions that are aligned with their community’s goals.
This guide also provides policy-makers with ideas for questions to keep in mind as they discuss product restrictions and bans:
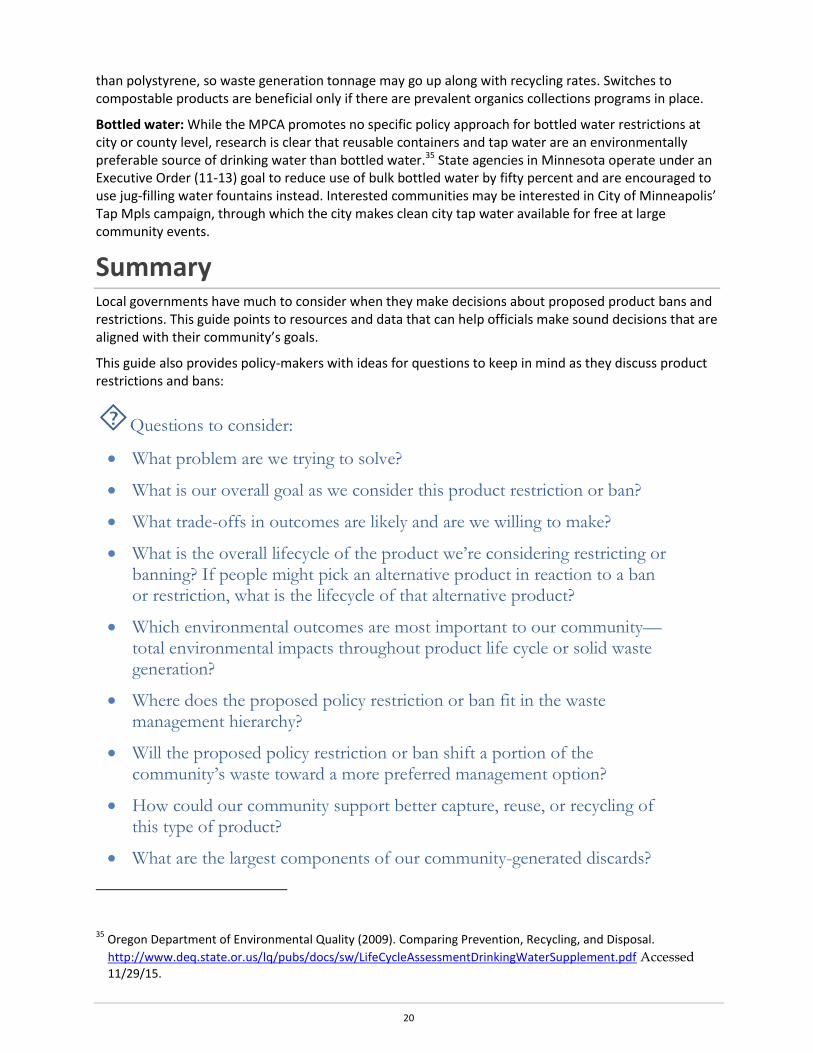
Questions to consider:
What problem are we trying to solve?
What is our overall goal as we consider this product restriction or ban?
What trade-offs in outcomes are likely and are we willing to make?
What is the overall lifecycle of the product we’re considering restricting or banning? If people might pick an alternative product in reaction to a ban or restriction, what is the lifecycle of that alternative product?
Which environmental outcomes are most important to our community—total environmental impacts throughout product life cycle or solid waste generation?
Where does the proposed policy restriction or ban fit in the waste management hierarchy?
Will the proposed policy restriction or ban shift a portion of the community’s waste toward a more preferred management option?
How could our community support better capture, reuse, or recycling of this type of product?
What are the largest components of our community-generated discards?
35
Oregon Department of Environmental Quality (2009). Comparing Prevention, Recycling, and Disposal.
http://www.deq.state.or.us/lq/pubs/docs/sw/LifeCycleAssessmentDrinkingWaterSupplement.pdf Accessed 11/29/15.
21
What resources are available (existing reports, advice from staff, data or expertise from MPCA) to help us understand our local waste issues?
What other portions of the waste stream, if addressed, would have a greater environmental impact than the product we are considering?
How would a specific ban or restriction affect trends in solid waste disposal?
Would a specific ban or restriction have environmental impacts beyond the solid waste stream?
Would restricting or banning a specific product increase the use of other products that are worse from an environmental perspective?
Would the proposed restriction or ban take advantage of patterns in consumer behavior?
Are there other approaches that could drive the desired consumer behavior?
22
Resources
Contact the MPCA
Minnesota Pollution Control Agency Phone: 651-296-6300 Toll free: 800-657-3864 Website: www.pca.state.mn.us
Examples of life cycle assessments
Disposable Shopping Bags
Dr. Chris Edwards and Jonna Meyhoff Fry. “Life cycle assessment of supermarket carrier bags: a review of the bags available in 2006.” Environment Agency Report SC030148, February 2011. https://www.gov.uk/government/uploads/system/uploads/attachment_data/file/291023/scho0711buan-e-e.pdf
Bottled Water
Franklin Associates, “Life Cycle assessment of Drinking Water Systems: Bottled Water, Tap Water, and Home/Office Delivery Water.” October 22, 2009: www.deq.state.or.us/lq/pubs/docs/sw/LifeCycleAssessmentDrinkingWaterFullReport.pdf or http://www.fal.com/projects.html
Polystyrene Foam Containers
Franklin Associates, “Life Cycle Inventory of Foam Polystyrene, Paper-Based and PLA Foodservice Products.” February 4, 2011. http://www.fal.com/projects.html
Waste generation and composition data
United States Environmental Protection Agency (2015). Advancing Sustainable materials Management: Facts and Figures. http://www2.epa.gov/smm/advancing-sustainable-materials-management-facts-and-figures-report
Minnesota Pollution Control Agency (2013). Minnesota Statewide Waste Characterization Study. http://www.pca.state.mn.us/zihy86c
Minnesota Pollution Control Agency (2015). Report on 2013 SCORE Programs: A summary of recycling and waste management in Minnesota. http://www.pca.state.mn.us/pyrie49
Examples of community evaluations of policy options
Fort Collins, CO (2012). Triple Bottom Line Evaluation: Plastic Bag Policy Options. http://www.fcgov.com/recycling/pdf/triple-bottom-line-evaluation-plastic-bag-policy-options-10-2012.pdf
City of St. Louis Park, MN (2015). Plastic bags web page. http://www.stlouispark.org/sustainability/plastic-bags.html
City of St. Louis Park, MN (2016). Zero Waste Packaging webpage. http://www.stlouispark.org/sustainability/polystyrene.html