Producer Best Management Practices - US EPA · Producer Best Management Practices ... Source:...
38
Producer Best Management Practices Lessons Learned from the Natural Gas STAR Program ConocoPhillips The Colorado Oil and Gas Association, and The Independent Petroleum Association of Mountain States Producers Technology Transfer Workshop Durango, Colorado September 13, 2007 epa.gov/gasstar
Transcript of Producer Best Management Practices - US EPA · Producer Best Management Practices ... Source:...
Producer Best Management Practices
Lessons Learned from the Natural Gas STAR Program
ConocoPhillipsThe Colorado Oil and Gas Association, andThe Independent Petroleum Association of
Mountain States
Producers Technology Transfer Workshop Durango, Colorado
September 13, 2007
epa.gov/gasstar

1
Best Management Practices: AgendaPlunger Lifts and Smart Automation Well Venting
Methane LossesMethane SavingsIs Recovery Profitable?Industry Experience
Vapor Recovery UnitsMethane LossesMethane SavingsIs Recovery Profitable?Industry ExperienceLessons Learned
Discussion

2
Smart Automation Well VentingAutomation can enhance the performance of plunger lifts by monitoring wellhead parameters such as:
Tubing and casing pressureFlow ratePlunger travel time
Using this information, the system is able to optimize plunger operations
To minimize well venting to atmosphereRecover more gasFurther reduce methane emissions
3
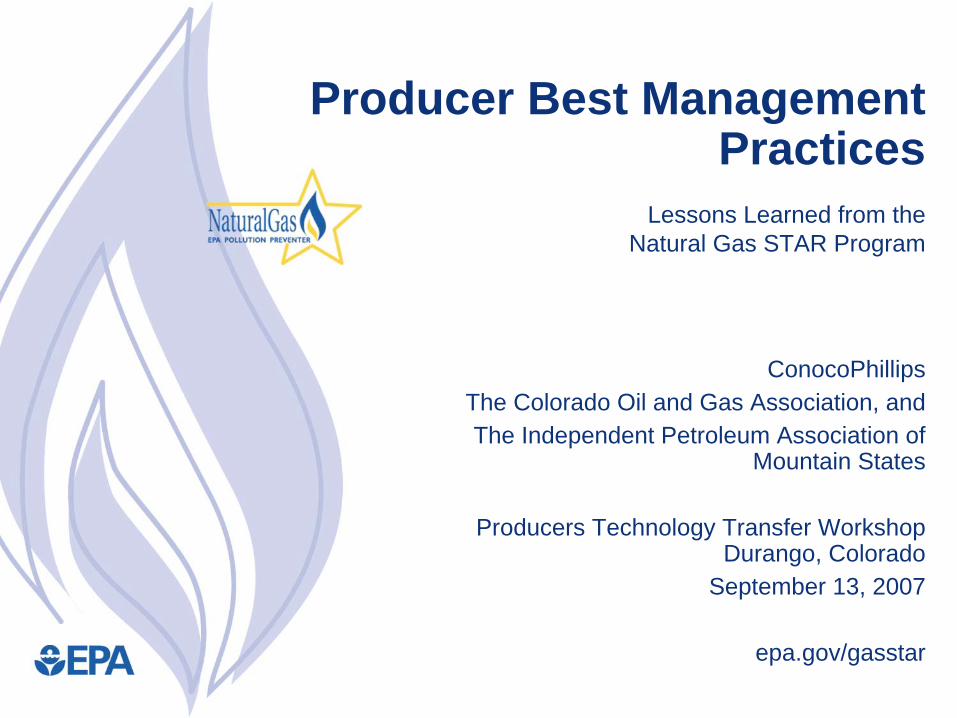
Methane LossesThere are 395,000 natural gas and condensate wells (on and offshore) in the U.S.1Accumulation of liquid hydrocarbons or water in the well bores reduces, and can halt, productionCommon “blow down” practices to temporarily restore production can vent 80 to 1600 Mcf/year2 to the atmosphere per wellEstimate 9 Bcf/year methane emissions from U.S. onshore well venting1
1 - Inventory of U.S. Greenhouse Gas Emissions and Sinks 1990 - 2004 2 - Mobil Big Piney Case Study 1997

4
What is the Problem?Conventional plunger lift systems use gas pressure buildups to repeatedly lift columns of fluid out of wellFixed timer cycles may not match reservoir performance
Cycle too frequently (high plunger velocity)
Plunger not fully loadedCycle too late (low plunger velocity)
Shut-in pressure can’t lift fluid to topMay have to vent to atmosphere to lift plunger
Source: Weatherford
5
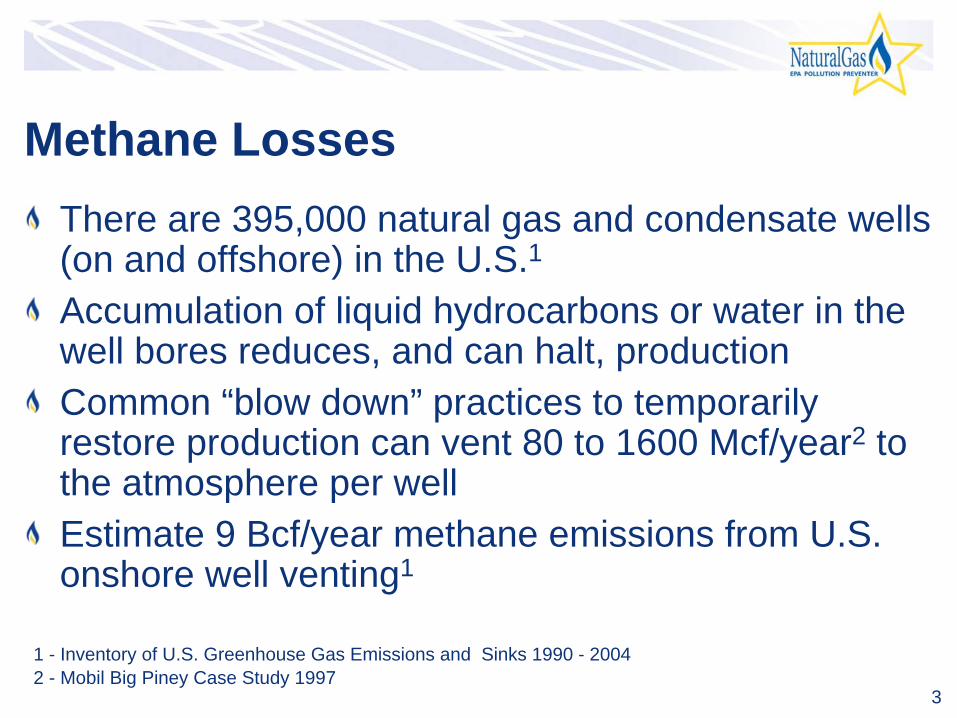
Conventional Plunger Lift OperationsManual, on-site adjustments tune plunger cycle time to well’s parameters
Not performed regularlyDo not account for gathering line pressure fluctuations, declining well performance, plunger wear
Results in manual venting to atmosphere when plunger lift is overloaded
6
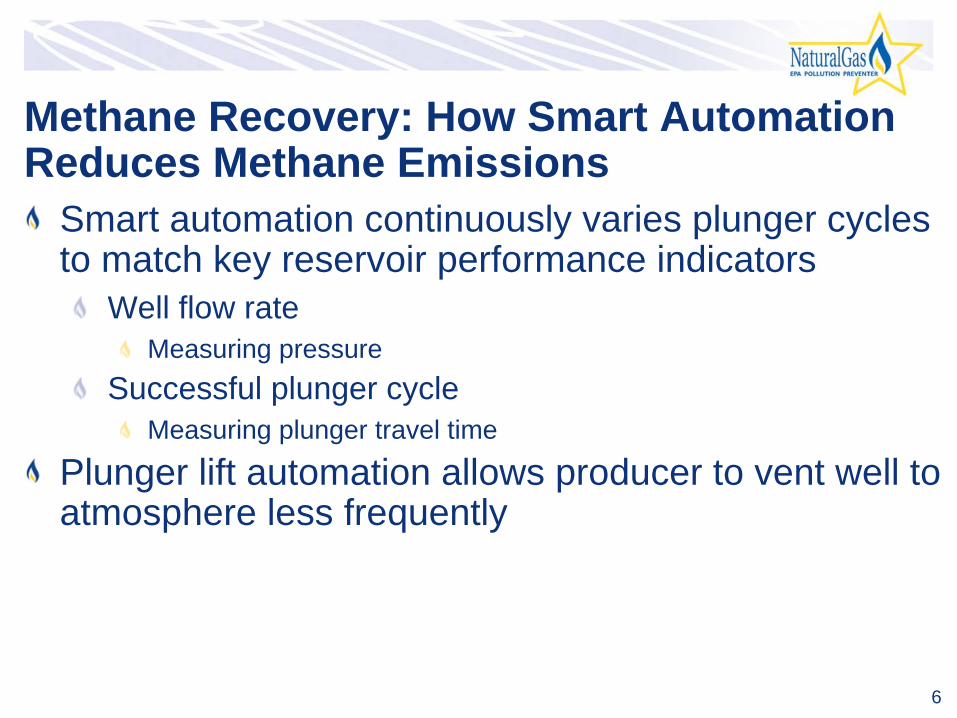
Methane Recovery: How Smart Automation Reduces Methane Emissions
Smart automation continuously varies plunger cycles to match key reservoir performance indicators
Well flow rateMeasuring pressure
Successful plunger cycleMeasuring plunger travel time
Plunger lift automation allows producer to vent well to atmosphere less frequently

7
Automated ControllersLow-voltage; solar recharged battery powerMonitor well parametersAdjust plunger cycling
Source: Weatherford
Remote well managementContinuous data logging
Remote data transmission
Receive remote instructions
Monitor other equipmentSource: Weatherford

8
Plunger Lift Cycle
9
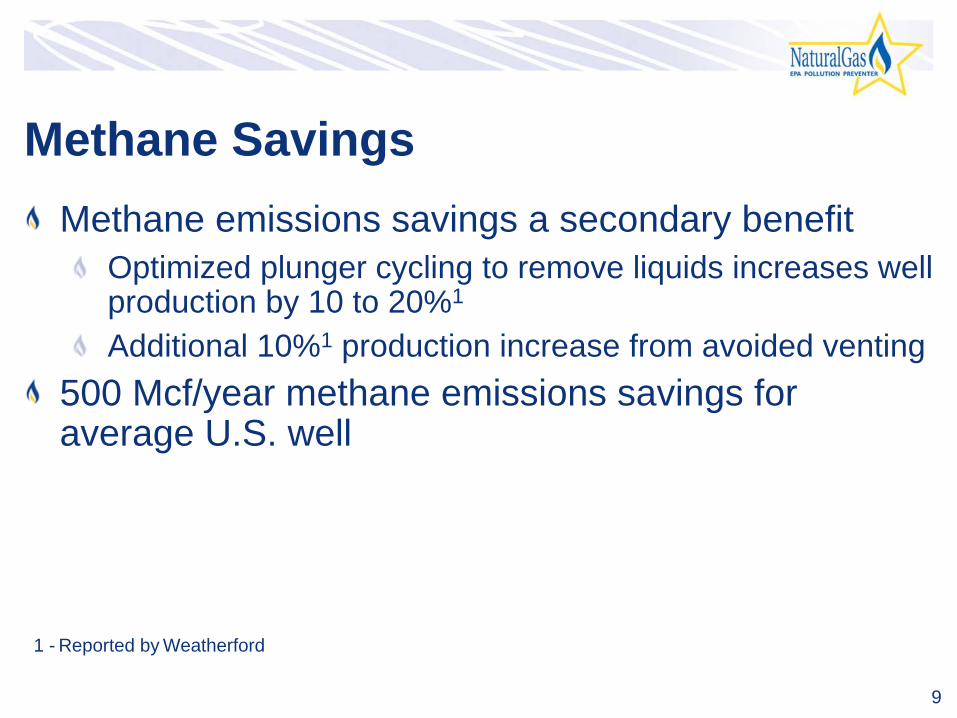
Methane SavingsMethane emissions savings a secondary benefit
Optimized plunger cycling to remove liquids increases well production by 10 to 20%1
Additional 10%1 production increase from avoided venting500 Mcf/year methane emissions savings for average U.S. well
1 - Reported by Weatherford

10
Other BenefitsReduced manpower cost per wellContinuously optimized production conditionsRemotely identify potential unsafe operating conditionsMonitor and log other well site equipment
Glycol dehydratorCompressorStock TankVapor Recovery Unit

11
Is Recovery Profitable?Smart automation controller installed cost: ~$11,000
Conventional plunger lift timer: ~$5,000Personnel savings: double productivityProduction increases: 10% to 20% increased production
Savings = (Mcf/year) x (10% increased production) x (gas price)
+ (Mcf/year) x (1% emissions savings) x (gas price)+ (personnel hours/year) x (0.5) x (labor rate)
$ savings per year
12
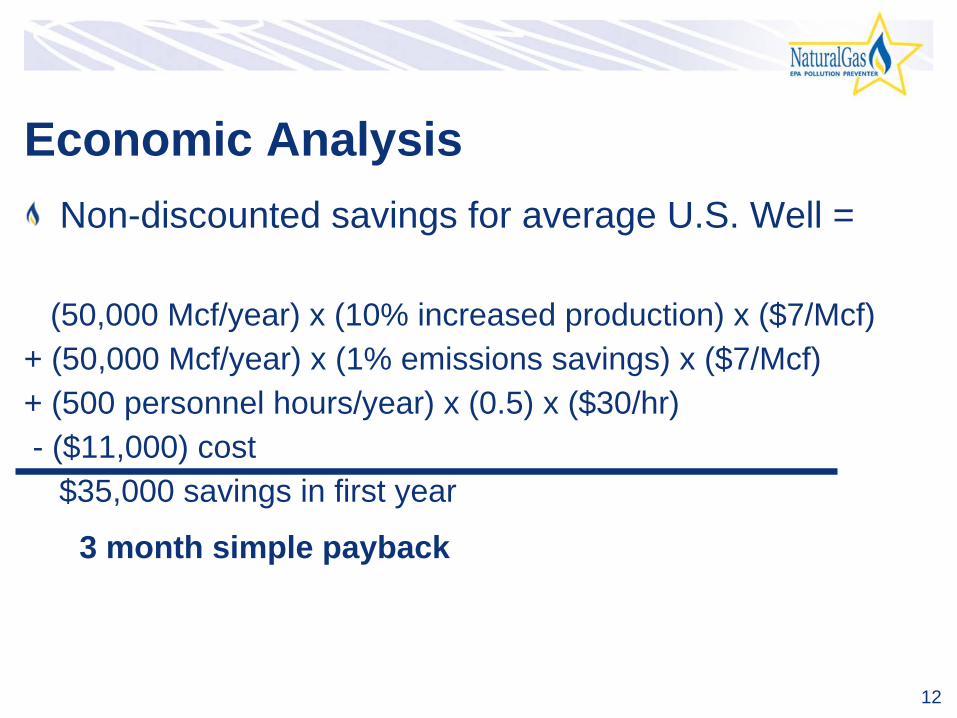
Economic AnalysisNon-discounted savings for average U.S. Well =
(50,000 Mcf/year) x (10% increased production) x ($7/Mcf)+ (50,000 Mcf/year) x (1% emissions savings) x ($7/Mcf)+ (500 personnel hours/year) x (0.5) x ($30/hr)- ($11,000) cost
$35,000 savings in first year
3 month simple payback
13
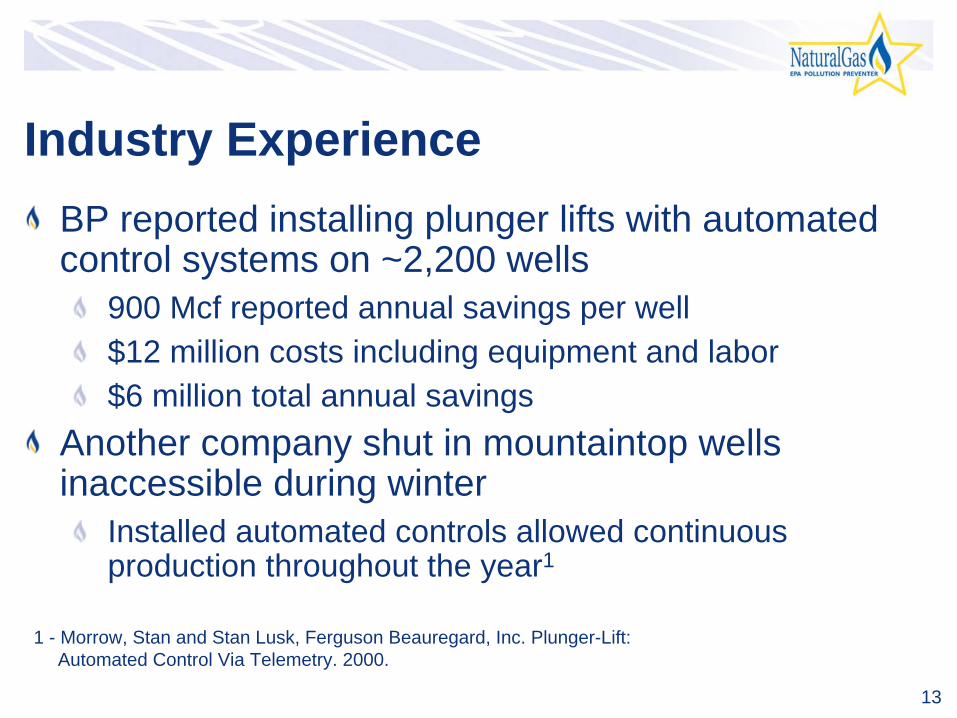
Industry ExperienceBP reported installing plunger lifts with automated control systems on ~2,200 wells
900 Mcf reported annual savings per well$12 million costs including equipment and labor$6 million total annual savings
Another company shut in mountaintop wells inaccessible during winter
Installed automated controls allowed continuous production throughout the year1
1 - Morrow, Stan and Stan Lusk, Ferguson Beauregard, Inc. Plunger-Lift: Automated Control Via Telemetry. 2000.
14
Vapor Recovery UnitsMethane LossesMethane SavingsIs Recovery Profitable?Industry ExperienceLessons Learned

15
Sources of Methane LossesA storage tank battery can vent 5,000 to 500,000 thousand cubic feet (Mcf) of natural gas and light hydrocarbon vapors to the atmosphere each year
Vapor losses are primarily a function of oil throughput, gravity, and gas-oil separator pressure
Flash lossesOccur when crude is transferred from a gas-oil separator at higher pressure to a storage tank at atmospheric pressure
Working lossesOccur when crude levels change and when crude in tank is agitated
Standing lossesOccur with daily and seasonal temperature and barometric pressure changes

16
Methane Savings: Vapor RecoveryVapor recovery can capture up to 95% of hydrocarbon vapors from tanksRecovered vapors have higher heat content than pipeline quality natural gasRecovered vapors are more valuable than natural gas and have multiple uses
Re-inject into sales pipelineUse as on-site fuelSend to processing plants for recovering valuable natural gas liquids

17
Types of Vapor Recovery UnitsConventional vapor recovery units (VRUs)
Use rotary or vane compressor to suck vapors out of atmospheric pressure storage tanksScroll compressors are new to this marketRequire electrical power or engine driver
Venturi ejector vapor recovery units (EVRUTM) or Vapor Jet
Use Venturi jet ejectors in place of rotary compressorsContain no moving partsEVRUTM requires a source of high pressure motive gas and intermediate pressure discharge systemVapor Jet requires a high pressure water motive

18
Conventional Vapor Recovery Unit
Crude Oil Stock
Tank(s)
ControlPilot
Vent LineBack Pressure Valve
SuctionScrubber
SuctionLine
Condensate Return
BypassValve
ElectricControlPanel
Electric DrivenRotary Compressor
Gas SalesMeter Run
Gas
Liquid Transfer Pump
Check Valve
Source: Evans & Nelson (1968)
Sales

19
Vapor Recovery Installations

20
Venturi Jet Ejector*
High-PressureMotive Gas(~850 psig)
Flow Safety Valve
Pressure Indicator Temperature Indicator
PI TI
TI
PI
Low-Pressure Vent Gas from Tanks(0.10 to 0.30 psig)
PI TI
Discharge Gas (~40 psia)
Suction Pressure(-0.05 to 0 psig)
*EVRUTM Patented by COMM EngineeringAdapted from SRI/USEPA-GHG-VR-19psig = pound per square inch, gaugepsia = pounds per square inch, absolute
21
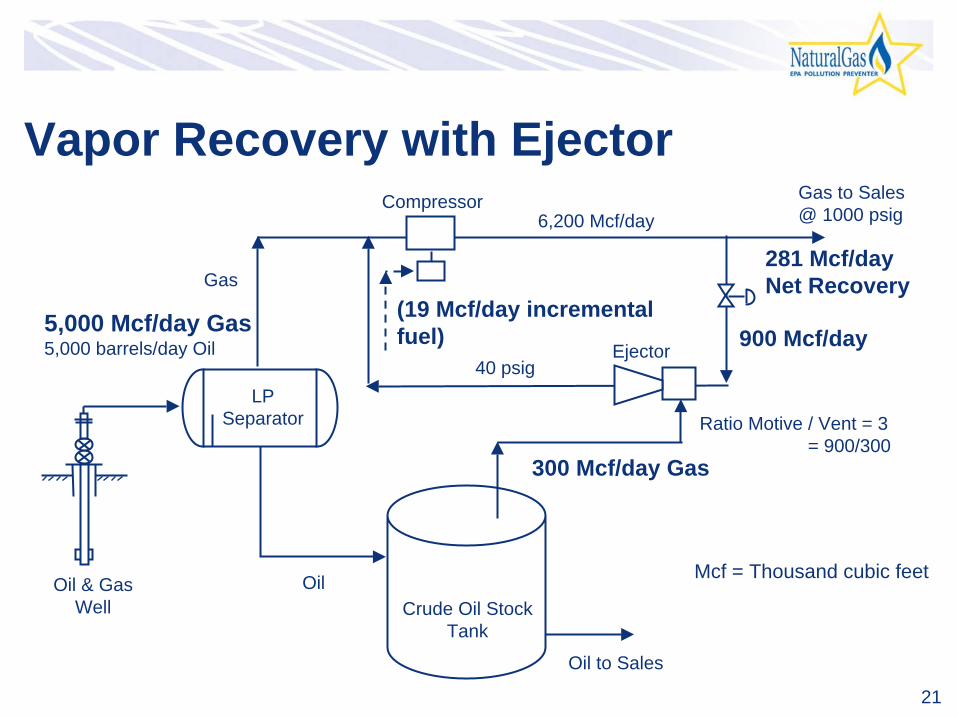
Vapor Recovery with Ejector
Oil to Sales
Gas to Sales@ 1000 psig
LP Separator
Oil
Gas
Compressor
Ejector
Oil & Gas Well
5,000 Mcf/day Gas5,000 barrels/day Oil 900 Mcf/day
Ratio Motive / Vent = 3= 900/300
300 Mcf/day Gas
40 psig
6,200 Mcf/day
Crude Oil Stock Tank
(19 Mcf/day incremental fuel)
281 Mcf/dayNet Recovery
Mcf = Thousand cubic feet
22
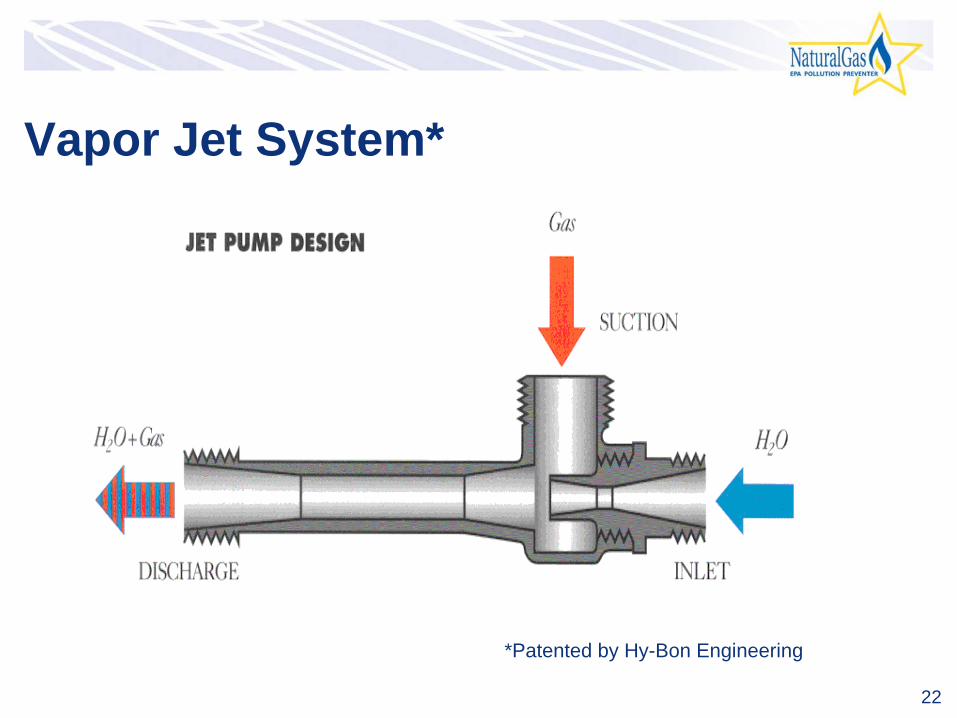
Vapor Jet System*
*Patented by Hy-Bon Engineering
23
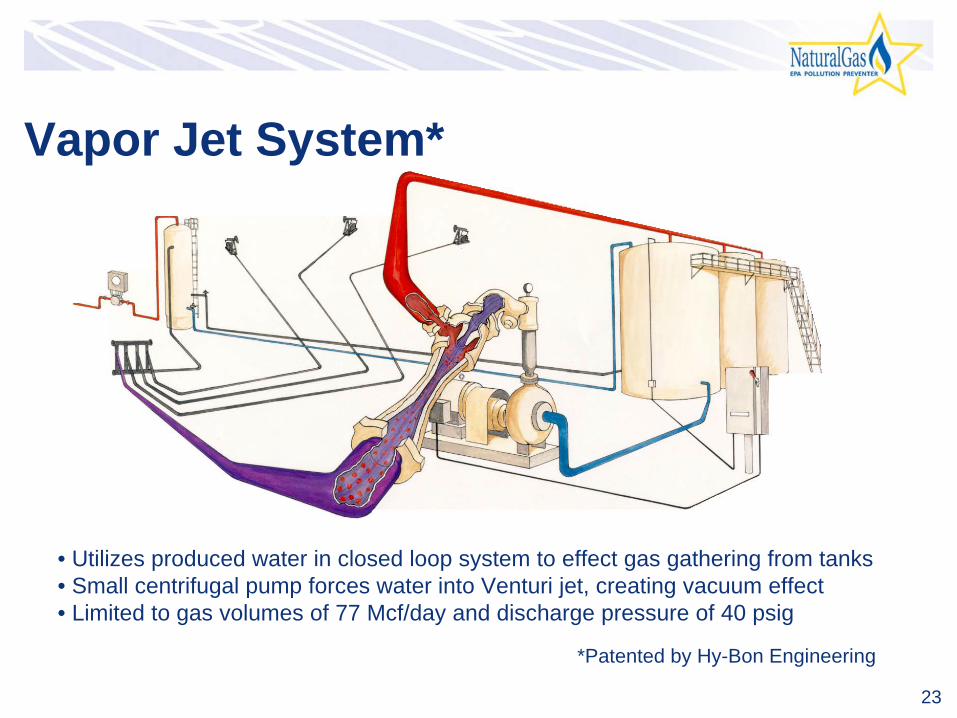
Vapor Jet System*
*Patented by Hy-Bon Engineering
• Utilizes produced water in closed loop system to effect gas gathering from tanks• Small centrifugal pump forces water into Venturi jet, creating vacuum effect • Limited to gas volumes of 77 Mcf/day and discharge pressure of 40 psig

24
Criteria for Vapor Recovery Unit Locations
Steady source and sufficient quantity of lossesCrude oil stock tankFlash tank, heater/treater, water skimmer ventsGas pneumatic controllers and pumps
Outlet for recovered gasAccess to low pressure gas pipeline, compressor suction, or on-site fuel system
Tank batteries not subject to air regulations

25
Quantify Volume of LossesEstimate losses from chart based on oil characteristics, pressure, and temperature at each location (± 50%)Estimate emissions using the E&P Tank Model (± 20%)Engineering Equations – Vasquez Beggs (± 20%)Measure losses using recording manometer and well tester or ultrasonic meter over several cycles (± 5%)
This is the best approach for facility design

26
Estimated Volume of Tank Vapors
Pressure of Vessel Dumping to Tank (Psig)
Vap
or V
ente
d fro
m T
anks
,cu
bic
foot
/ ba
rrel
Gas
/Oil
Rat
io110
100
90
80
70
60
50
40
30
10
20
10 20 30 40 50 60 70 80
Under 30° API30° API to 39° API40° API and Over
o API = API gravity
AP
I Gra
vitie
s

27
Estimated Volume of Tank VaporsAtmospheric tanks may emit large amounts of tank vapors at relatively low separator pressure
Vasquez-Beggs Equation
psig – pounds per square inch, gaugescf – standard cubic feetbbl – barrels

28
What is the Recovered Gas Worth?Value depends on heat content of gasValue depends on how gas is used
On-site fuelValued in terms of fuel that is replaced
Natural gas pipelineMeasured by the higher price for rich (higher heat content) gas
Gas processing plantMeasured by value of natural gas liquids and methane, which can be separated
Gross revenue per year = (Q x P x 365) + NGLQ = Rate of vapor recovery (Mcf per day)P = Price of natural gasNGL = Value of natural gas liquids
29
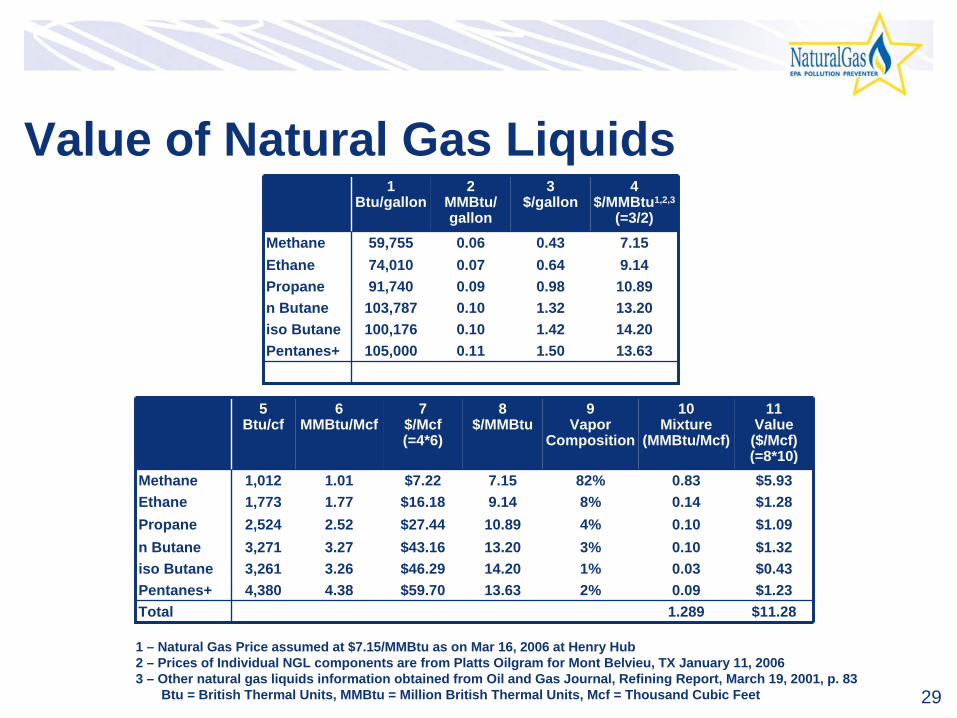
Value of Natural Gas Liquids
$11.281.289Total$1.230.092%13.63$59.704.384,380Pentanes+$0.430.031%14.20$46.293.263,261iso Butane$1.320.103%13.20$43.163.273,271n Butane$1.090.104%10.89$27.442.522,524Propane$1.280.148%9.14$16.181.771,773Ethane$5.930.8382%7.15$7.221.011,012Methane
11Value($/Mcf)(=8*10)
10Mixture
(MMBtu/Mcf)
9Vapor
Composition
8$/MMBtu
7$/Mcf(=4*6)
6MMBtu/Mcf
5Btu/cf
13.631.500.11105,000Pentanes+14.201.420.10100,176iso Butane13.201.320.10103,787n Butane10.890.980.0991,740Propane9.140.640.0774,010Ethane7.150.430.0659,755Methane
4$/MMBtu1,2,3
(=3/2)
3$/gallon
2MMBtu/ gallon
1Btu/gallon
1 – Natural Gas Price assumed at $7.15/MMBtu as on Mar 16, 2006 at Henry Hub2 – Prices of Individual NGL components are from Platts Oilgram for Mont Belvieu, TX January 11, 20063 – Other natural gas liquids information obtained from Oil and Gas Journal, Refining Report, March 19, 2001, p. 83
Btu = British Thermal Units, MMBtu = Million British Thermal Units, Mcf = Thousand Cubic Feet
30
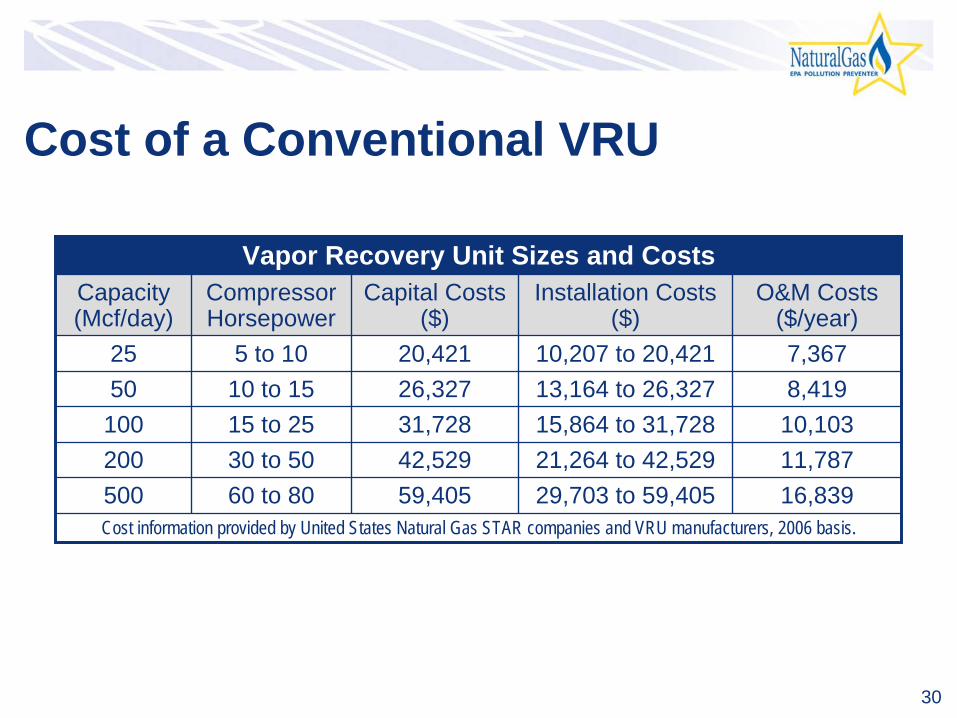
Cost of a Conventional VRU
Cost information provided by United States Natural Gas STAR companies and VRU manufacturers, 2006 basis. 16,83929,703 to 59,40559,40560 to 8050011,78721,264 to 42,52942,52930 to 5020010,10315,864 to 31,72831,72815 to 251008,41913,164 to 26,32726,32710 to 15507,36710,207 to 20,42120,4215 to 1025
O&M Costs ($/year)
Installation Costs ($)
Capital Costs ($)
Compressor Horsepower
Capacity (Mcf/day)
Vapor Recovery Unit Sizes and Costs

31
Is Recovery Profitable?
1 – Unit cost plus estimated installation of 75% of unit cost2 – $11.28 x ½ peak capacity x 365, Assumed price includes Btu enriched gas (1.289 MMBtu/Mcf)
974%2$1,012,461$1,029,300$16,839$103,959500537%3$399,933$411,720$11,787$74,425200352%4$195,757$205,860$10,103$55,524100204%6$94,511$102,930$8,419$46,07350121%10$44,098$51,465$7,367$35,73825
Internal Rate of Return
Simple Payback (months)
Annual Savings
($)
Value of Gas2
($/year)
O&M Costs
($/year)
Installation & Capital
Costs1
($)
Peak Capacity (Mcf/day)
Financial Analysis for a Conventional VRU Project

32
Industry Experience: AnadarkoVapor Recover Tower (VRT)
Add separation vessel between heater treater or low pressure separator and storage tanks that operates at or near atmospheric pressure
Operating pressure range: 1 psi to 5 psi
Compressor (VRU) is used to capture gas from VRTOil/Condensate gravity flows from VRT to storage tanks
VRT insulates the VRU from gas surges with stock tank level changesVRT more tolerant to higher and lower pressuresStable pressure allows better operating factor for VRU

33
Industry Experience: AnadarkoVRT reduces pressure drop from approximately 50 psig to 1-5 psig
Reduces flashing lossesCaptures more product for salesAnadarko netted between $7 to $8 million from 1993 to 1999 by utilizing VRT/VRU configuration
Equipment Capital Cost: $11,000Standard size VRTs available based on oil production rate
20” x 35’48” x 35’
Anadarko has installed over 300 VRT/VRUs since 1993 and continues on an as needed basis
34
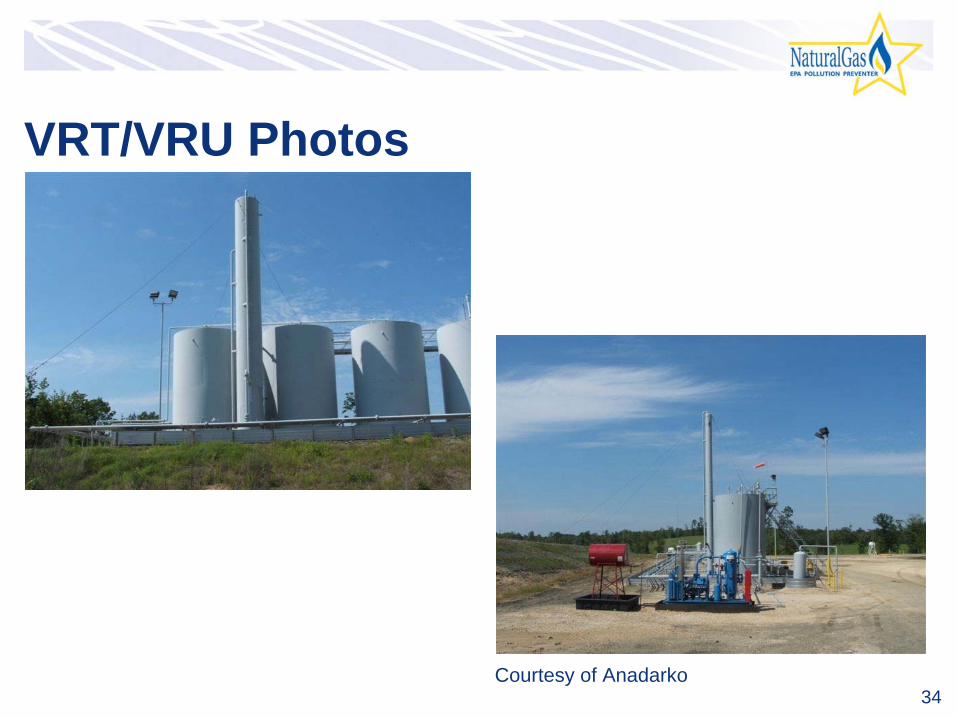
VRT/VRU Photos
Courtesy of Anadarko

35
Lessons LearnedVapor recovery can yield generous returns when there are market outlets for recovered gas
Recovered high heat content gas has extra valueVapor recovery technology can be highly cost-effective in most general applicationsVenturi jet models work well in certain niche applications, with reduced operating and maintenance costs
Potential for reduced compliance costs can be considered when evaluating economics of VRU, EVRUTM, or Vapor Jet
36
Lessons Learned (continued)VRU should be sized for maximum volume expected from storage tanks (rule-of-thumb is to double daily average volume)Rotary vane, screw or scroll type compressors recommended for VRUs where Venturi ejector jet designs are not applicableEVRUTM recommended where there is a high pressure gas compressor with excess capacityVapor Jet recommended where there is produced water, less than 75 Mcf per day gas and discharge pressures below 40 psig

37
DiscussionIndustry experience applying these technologies and practices
Limitations on application of these technologies and practices
Actual costs and benefits