processng and analysis of data
20
PROCESSING AND ANALYSIS OF DATA 12/6/2014 ITFT COLLEGE CHANDIGARH
-
Upload
aruna-poddar -
Category
Education
-
view
84 -
download
2
Transcript of processng and analysis of data

PROCESSING AND ANALYSIS OF DATA
12/6/2014 ITFT COLLEGE CHANDIGARH

12/6/2014 ITFT COLLEGE CHANDIGARH

PROCESSING OPERATIONS1) EDITING
Editing of data is a process of examining the
collected raw data (especially in surveys) to
detect errors and omissions and to correct these
when possible.
Editing is done to assure that the data are
accurate, consistent with other facts gathered,
uniformly entered, as completed as possible and
have been well arranged to facilitate coding and
tabulation.
EDITING FIELD EDITING
CENTRAL EDITING
12/6/2014 ITFT COLLEGE CHANDIGARH

FIELD EDITING
Field editing consists in the review of the reporting forms by the
investigator for completing (translating or rewriting) what the latter
has written in abbreviated and/or in illegible form at the time of
recording the respondents’ responses.
This type of editing is necessary in view of the fact that
individual writing styles often can be difficult for others to decipher.
CENTRAL EDITING
Central editing should take place when all forms or schedules
have been completed and returned to the office.
This type of editing implies that all forms should get a thorough
editing by a single editor in a small study and by a team of editors
in case of a large inquiry.
12/6/2014 ITFT COLLEGE CHANDIGARH

2) CODING
Coding refers to the process of assigning
numerals or other symbols to answers so
that responses can be put into a limited
number of categories or classes.
Coding is necessary for efficient analysis
and through it the several replies may be
reduced to a small number of classes which
contain the critical information required for
analysis.
Coding decisions should usually be taken
at the designing stage of the questionnaire.
It makes it possible to precode the
quesistionnaire choices and which in turn is
helpful for computer tabulation as one can
straight forward key punch from the original
questionnaires.12/6/2014 ITFT COLLEGE CHANDIGARH

3) CLASSIFICATION
Classification of data which happens to be the
process of arranging data in groups or classes on the
basis of common characteristics.
Data having a common characteristic are placed in
one class and in this way the entire data get divided
into a number of groups or classes.
TYPES OF CLASSIFICATION ACC. TO ATTRIBUTES
ACC. TO CLASS INTERVAL
ACC. TO ATTRIBUTES
data are classified on the basis of common characteristics which can either be
descriptive (such as literacy, sex, honesty, etc.) or numerical (such as weight,
height, income, etc.)
ACC. TO CLASS INTERVAL EXCLUSIVE TYPE
INCLUSIVE TYPE 12/6/2014 ITFT COLLEGE CHANDIGARH

EXCLUSIVE TYPE CLASS INTERVALS: They are usually stated as follows:
10–20
20–30
30–40
40–50
The above intervals should be read as under:
10 and under 20
20 and under 30
30 and under 40
40 and under 50
An item whose value is exactly 30 would be put in 30–40 class interval and not
in 20–30 class interval.
INCLUSIVE TYPE CLASS INTERVALS: They are usually stated as follows:
11–20
21–30
31–40
41–50
Thus, an item whose value is 20 will be put in 11–20 class interval. 12/6/2014 ITFT COLLEGE CHANDIGARH
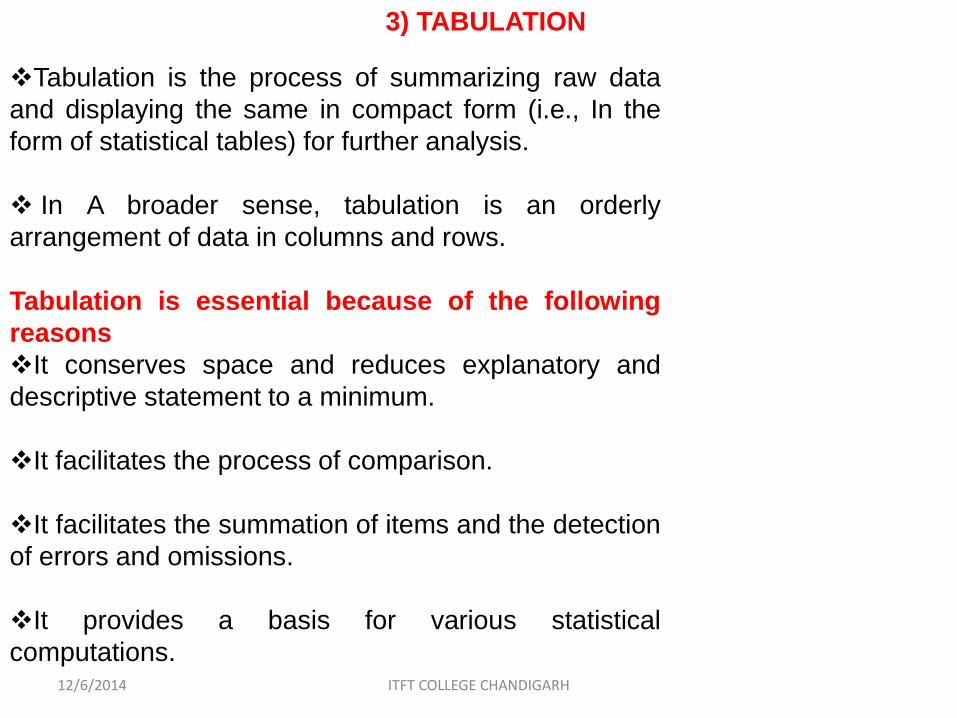
3) TABULATION
Tabulation is the process of summarizing raw data
and displaying the same in compact form (i.e., In the
form of statistical tables) for further analysis.
In A broader sense, tabulation is an orderly
arrangement of data in columns and rows.
Tabulation is essential because of the following
reasons
It conserves space and reduces explanatory and
descriptive statement to a minimum.
It facilitates the process of comparison.
It facilitates the summation of items and the detection
of errors and omissions.
It provides a basis for various statistical
computations.12/6/2014 ITFT COLLEGE CHANDIGARH

GENERALLY ACCEPTED PRINCIPLES OF TABULATION:
1) Every table should have a clear, concise and adequate title and this title
should always be placed just above the body of the table.
2) Every table should be given a distinct number to facilitate easy reference.
3) The column headings (captions) and the row headings (stubs) of the table
should be clear and brief.
4) The units of measurement under each heading or sub-heading must
always be indicated.
5) Explanatory footnotes, if any, concerning the table should be placed
directly beneath the table, along with the reference symbols used in the
table.
6) Source or sources from where the data in the table have been obtained
must be indicated just below the table.
7) Usually the columns are separated from one another by lines which make
the table more readable and attractive.12/6/2014 ITFT COLLEGE CHANDIGARH

8) Those columns whose data are to be compared should be kept side by
side. Similarly, percentages and/or averages must also be kept close to the
data.
9) It is generally considered better to approximate figures before tabulation
as the same would reduce unnecessary details in the table itself.
10) It is important that all column figures be properly aligned. Decimal points
and (+) or (–) signs should be in perfect alignment.
11) Abbreviations should be avoided to the extent possible and ditto marks
should not be used in the table.
12) Miscellaneous and exceptional items, if any, should be usually placed in
the last row of the table.
13) The arrangement of the categories in a table may be chronological,
geographical, alphabetical or according to magnitude to facilitate
comparison.
12/6/2014 ITFT COLLEGE CHANDIGARH
12/6/2014 ITFT COLLEGE CHANDIGARH

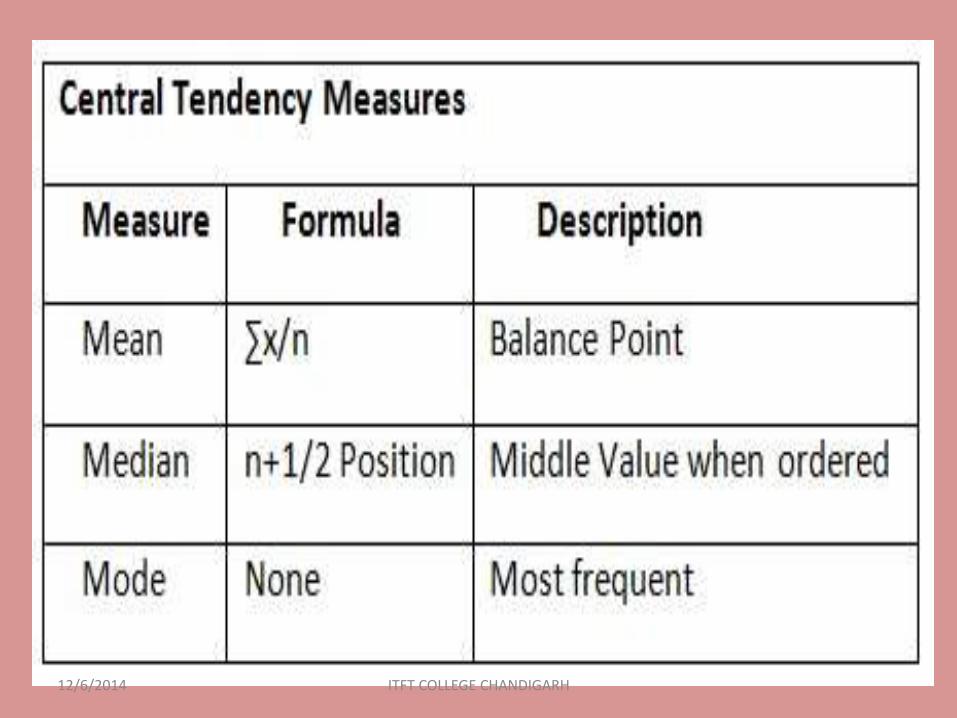
MEASURES OF CENTRAL TENDENCY
What is a measure of central
tendency?
Measures of Central Tendency
•Mode
•Median
•Mean
Shape of the Distribution
Considerations for Choosing
an Appropriate Measure of
Central Tendency 12/6/2014 ITFT COLLEGE CHANDIGARH

What is a measure of Central Tendency?
12/6/2014 ITFT COLLEGE CHANDIGARH
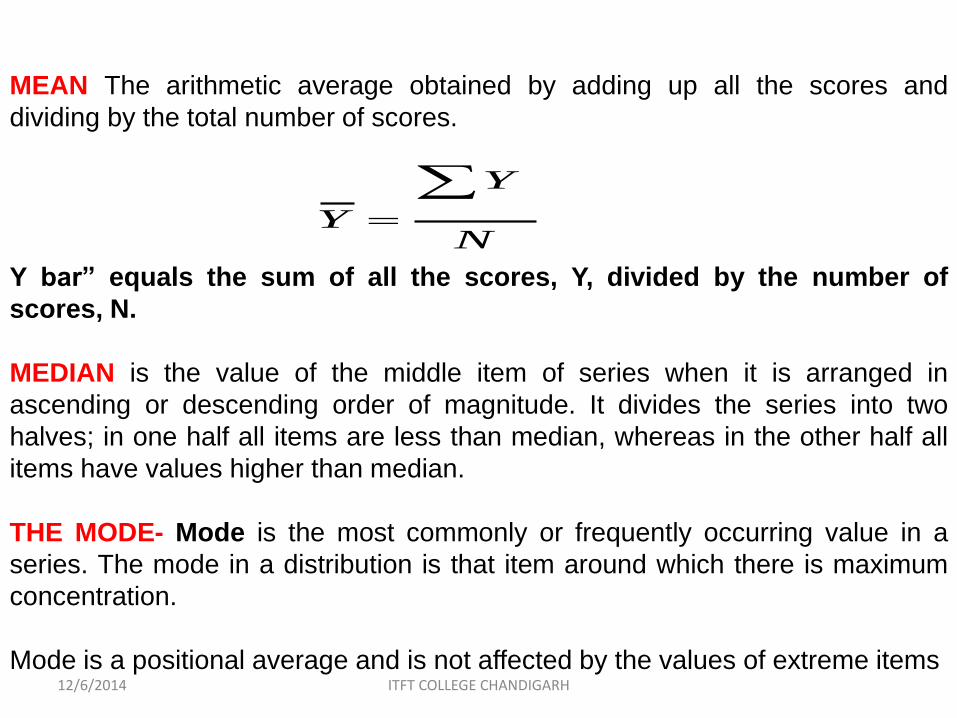
MEAN The arithmetic average obtained by adding up all the scores and
dividing by the total number of scores.
Y bar” equals the sum of all the scores, Y, divided by the number of
scores, N.
MEDIAN is the value of the middle item of series when it is arranged in
ascending or descending order of magnitude. It divides the series into two
halves; in one half all items are less than median, whereas in the other half all
items have values higher than median.
THE MODE- Mode is the most commonly or frequently occurring value in a
series. The mode in a distribution is that item around which there is maximum
concentration.
Mode is a positional average and is not affected by the values of extreme items
N
Y
Y
12/6/2014 ITFT COLLEGE CHANDIGARH

12/6/2014 ITFT COLLEGE CHANDIGARH

12/6/2014 ITFT COLLEGE CHANDIGARH
12/6/2014 ITFT COLLEGE CHANDIGARH
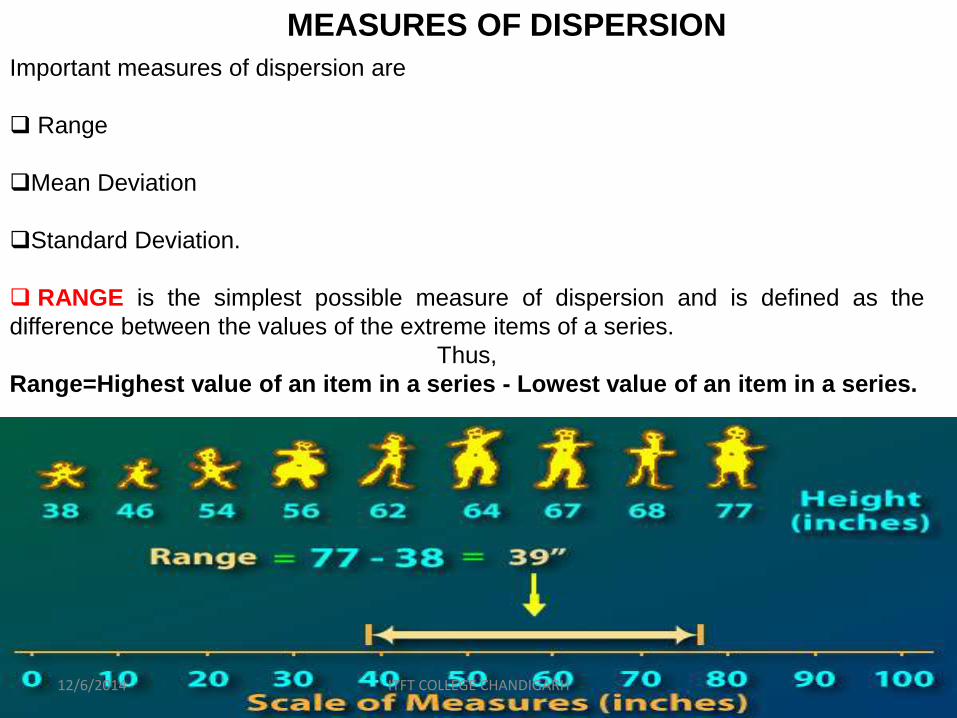
MEASURES OF DISPERSION
Important measures of dispersion are
Range
Mean Deviation
Standard Deviation.
RANGE is the simplest possible measure of dispersion and is defined as the
difference between the values of the extreme items of a series.
Thus,
Range=Highest value of an item in a series - Lowest value of an item in a series.
12/6/2014 ITFT COLLEGE CHANDIGARH

MEASURE OF SKEWNESS
12/6/2014 ITFT COLLEGE CHANDIGARH

12/6/2014 ITFT COLLEGE CHANDIGARH