Processing, storage and display of physiological measurements
5
PHYSICS ANAESTHESIA AND INTENSIVE CARE MEDICINE 10:1 65 Crown Copyright © 2008 Published by Elsevier Ltd. All rights reserved. Processing, storage and display of physiological measurements Gary Thomas Richard Isaacs Abstract The key to the successful and safe management of patients is regular and accurate recording of their ‘vital signs’ as indicators of well-being. Some physiological parameters can be measured and processed manu- ally (blood pressure, pulse rate and respiratory rate), whereas others (pH, partial pressure of oxygen (P a O 2 ) and partial pressure of carbon dioxide in arterial blood (P a co 2 )) rely on electronic interpretation. In modern operating theatre and critical care settings, fully integrated, elec- tronic, multiparameter monitoring systems based on microprocessors are standard. It is important that anaesthetists, as well as other healthcare professionals, understand the basic principles behind patient monitor- ing, including data processing, storage and display. Most physiological measurement systems include a sensor, transmission pathway, signal- processing stage and a display and storage device. This system may be simplified by regarding the different elements as a series of black boxes with the output from one box forming the input to the subsequent box. The initial input is a biological signal that results from the natural physiological processes occurring within the body. This signal may be chemical, electrical or mechanical in origin and is sensed by a transducer that converts it into an electrical output. Signal processing must then occur which aims to produce a meaningful output through amplification, digitization and ‘noise’ reduction. Once data have been acquired, there is usually a requirement to retain them for both immediate and long-term reference and to display them via a visual display unit. Keywords amplifiers; analogue to digital converter (ADC); digital signal storage devices; electrical noise; physiological measurements; signal processing; visual display unit Standards of monitoring The Association of Anaesthetists of Great Britain and Ireland (AAGBI) has updated its recommendations for the standards Gary Thomas, MB, BCh (Wales), FRCA is a Consultant Anaesthetist at Bro Morgannwg NHS Trust, Wales. He graduated from the Welsh National School of Medicine in 1981, and trained in anaesthesia in Wales, London and Melbourne. His main interests are anaesthesia for vascular surgery and teaching. He is currently a final FRCA examiner. Conflicts of interest: none declared. Richard Isaacs, BSc (Hons), M.B, BChir (Cantab), FRCA is a Specialist Trainee 4 in Anaesthesia currently on the Welsh rotation. He graduated from the University of St Andrews and Cambridge University Medical School. Conflicts of interest: none declared. of monitoring during anaesthesia and recovery (March 2007). Essential monitors for both induction and maintenance of anaes- thesia are pulse oximetry, non-invasive blood pressure, electro- cardiograph (ECG), airway gases and airway pressure. Nerve stimulators and thermometers should be available. These stan- dards also apply in critical care areas where parameters such as invasive vascular or intracranial pressures, cardiac output and the processed electroencephalograph (EEG) are routinely measured. Physiological measurements Biological signals result from natural physiological processes occurring within the body. These signals may be chemical, elec- trical (currents/potentials) or mechanical (pressure/tempera- ture) and can be measured in respect of time. Each signal has a finite range, frequency and method of sensing. A device that converts the energy of one signal into another form is known as a transducer, and examples used in physiological measurement are shown in Table 1. Bioelectrical signals Bioelectrical signals result from the movement of ions across cell membranes, when myocardial, skeletal muscle or neuronal cells become excitable. The resulting depolarization and repolarization Examples of transducers used in clinical measurement Physiological measurement Transducer Conversion Pressure Strain gauge Resistance change Capacitance transducer Capacitance change Temperature Thermistor Resistance change Thermocouple Thermojunction voltage change Platinum wire Resistance change ECG/EMG/EEG Ag/AgCl electrodes Potentiometric change pH pH electrodes Potentiometric change P a CO 2 Severinghaus electrode Amperometric change P a O 2 Clarke electrode Amperometric change Fuel cell Potentiometric change Cardiac output Ultrasound (piezoelectric crystal) Frequency change Ag/AgCl electrodes Thoracic bioimpedance change S a O 2 Photoplethysmograph Potentiometric change ECG, electrocardiograph; EEG, electroencephalograph; EMG, electromyogram. Table 1
-
Upload
gary-thomas -
Category
Documents
-
view
212 -
download
0
Transcript of Processing, storage and display of physiological measurements

Physics
Processing, storage and display of physiological measurementsGary Thomas
Richard isaacs
AbstractThe key to the successful and safe management of patients is regular
and accurate recording of their ‘vital signs’ as indicators of well-being.
some physiological parameters can be measured and processed manu-
ally (blood pressure, pulse rate and respiratory rate), whereas others
(ph, partial pressure of oxygen (Pao2) and partial pressure of carbon
dioxide in arterial blood (Paco2)) rely on electronic interpretation. in
modern operating theatre and critical care settings, fully integrated, elec-
tronic, multiparameter monitoring systems based on microprocessors are
standard. it is important that anaesthetists, as well as other healthcare
professionals, understand the basic principles behind patient monitor-
ing, including data processing, storage and display. Most physiological
measurement systems include a sensor, transmission pathway, signal-
processing stage and a display and storage device. This system may
be simplified by regarding the different elements as a series of black
boxes with the output from one box forming the input to the subsequent
box. The initial input is a biological signal that results from the natural
physiological processes occurring within the body. This signal may be
chemical, electrical or mechanical in origin and is sensed by a transducer
that converts it into an electrical output. signal processing must then
occur which aims to produce a meaningful output through amplification,
digitization and ‘noise’ reduction. Once data have been acquired, there is
usually a requirement to retain them for both immediate and long-term
reference and to display them via a visual display unit.
Keywords amplifiers; analogue to digital converter (ADc); digital signal
storage devices; electrical noise; physiological measurements; signal
processing; visual display unit
Standards of monitoring
The Association of Anaesthetists of Great Britain and Ireland (AAGBI) has updated its recommendations for the standards
Gary Thomas, MB, BCh (Wales), FRCA is a Consultant Anaesthetist at Bro
Morgannwg NHS Trust, Wales. He graduated from the Welsh National
School of Medicine in 1981, and trained in anaesthesia in Wales,
London and Melbourne. His main interests are anaesthesia for vascular
surgery and teaching. He is currently a final FRCA examiner. Conflicts
of interest: none declared.
Richard Isaacs, BSc (Hons), M.B, BChir (Cantab), FRCA is a Specialist Trainee 4
in Anaesthesia currently on the Welsh rotation. He graduated from the
University of St Andrews and Cambridge University Medical School.
Conflicts of interest: none declared.
ANAEsThEsiA AND iNTENsiVE cARE MEDiciNE 10:1 65
of monitoring during anaesthesia and recovery (March 2007). Essential monitors for both induction and maintenance of anaes-thesia are pulse oximetry, non-invasive blood pressure, electro-cardiograph (ECG), airway gases and airway pressure. Nerve stimulators and thermometers should be available. These stan-dards also apply in critical care areas where parameters such as invasive vascular or intracranial pressures, cardiac output and the processed electroencephalograph (EEG) are routinely measured.
Physiological measurements
Biological signals result from natural physiological processes occurring within the body. These signals may be chemical, elec-trical (currents/potentials) or mechanical (pressure/tempera-ture) and can be measured in respect of time. Each signal has a finite range, frequency and method of sensing. A device that converts the energy of one signal into another form is known as a transducer, and examples used in physiological measurement are shown in Table 1.
Bioelectrical signals
Bioelectrical signals result from the movement of ions across cell membranes, when myocardial, skeletal muscle or neuronal cells become excitable. The resulting depolarization and repolarization
Examples of transducers used in clinical measurement
Physiological
measurement
Transducer Conversion
Pressure strain gauge Resistance change
capacitance transducer capacitance change
Temperature Thermistor Resistance change
Thermocouple Thermojunction
voltage change
Platinum wire Resistance change
EcG/EMG/EEG Ag/Agcl electrodes Potentiometric
change
ph ph electrodes Potentiometric
change
Paco2 severinghaus
electrode
Amperometric change
Pao2 clarke electrode Amperometric change
Fuel cell Potentiometric
change
cardiac output Ultrasound
(piezoelectric crystal)
Frequency change
Ag/Agcl electrodes Thoracic
bioimpedance change
Sao2 Photoplethysmograph Potentiometric
change
EcG, electrocardiograph; EEG, electroencephalograph; EMG, electromyogram.
Table 1
crown copyright © 2008 Published by Elsevier Ltd. All rights reserved.

Physics
potentials are usually sensed by electrodes on the skin surface. The ECG, EEG and electromyogram (EMG) are the most common bioelectrical potentials measured.
A typical surface electrode is the silver/silver chloride elec-trode, and a chloride gel applied to the skin acts as an ionic conductor. The following reaction takes place:
Ag + Cl− AgCl + e−
Both reversible and irreversible electrochemical changes occur at the electrode resulting in current flow within the ECG leads. The potential difference required for current to flow is measured by the front end of the monitor before the signal is processed.
Mechanical signals
A bonded strain gauge transducer attached to a diaphragm can sense dynamic changes in pressure. Small changes in the length of the strain gauge, and therefore its resistance, result from move-ment of the diaphragm. This is incorporated into a Wheatstone bridge arrangement whose resulting output, in the order of a few millivolts, is directly proportional to the applied stress.
The ability of a transducer to respond to a stimulus that is constantly changing is called the dynamic response.
Signal processing
These small measurements will need processing prior to their display. This may be simplified by regarding the different ele-ments as a series of ‘black boxes’ with the output from one box forming the input to the subsequent box until the final signal enters a microprocessor unit (Figure 1). Once sensed, these small analogue signals will require amplification.
The processing sequence of an electronic signal
Input signal from transducer
Amplifier
Filters
Analogue-to-digital converter
Computer
Digital-to-analogue
Input signal to display
Figure 1
ANAEsThEsiA AND iNTENsiVE cARE MEDiciNE 10:1 66
Amplifiers
These are electronic components that increase the amplitude of the input signal. The voltage output is called the gain (output voltage/input voltage).
Single-ended amplifiersThe simplest form is shown in Figure 2a. It amplifies an input signal that is applied between the input and the earth or ground. Since there is only one input (the wire connected to the elec-trode), it can pick up interference from external electrical fields, which in turn is amplified causing gross distortion of the signal. This is called noise.
Signal noise may be defined as ‘an undesired disturbance within the frequency band of interest or the summation of unwanted or disturbing energy introduced into a communica-tions system from man-made and natural sources’. Examples of external interference in a theatre environment include surgical diathermy (500 kHz to 2 MHz), 50 Hz mains electricity or elec-trode movement artefact. Signal-to-noise ratio (often abbreviated as SNR or S/N) is an electrical engineering concept defined as the ratio of a signal power to the noise power corrupting the signal. It is measured using the logarithmic bel scale so that 1 bel is a ratio of 10:1 and 2 bel is a ratio of 100:1. For convenience, bels are often multiplied by 10 to give decibels. So, when presented with a low signal-to-noise ratio, a variety of signal-processing techniques are employed to improve the signal quality. These include the use of differential amplifiers, electronic filters or sig-nal averaging techniques.
Single-ended and differential amplifiers
a
Input (noise + measured signal)
Output (amplified noise + measured signal)
a Single-ended amplifier. The amplifier is unable to differentiate between
the signal to be measured and the noise. b Differential amplifier. There is
zero output when identical signals are applied to the two inputs, with only
the measured signal remaining. This is called common mode rejection.
Vout
–
+
–
+
Common reference
Vout
0 V (earth)
b
Input (noise + measured signal)
Input (noise) Output (measured signal)
Vout Vout
0 V (earth)
Figure 2
crown copyright © 2008 Published by Elsevier Ltd. All rights reserved.
Physics
The noise picked up by cables can be attenuated prior to amplification by shielding them with copper and aluminium cladding.
Differential amplifiersThe input to a differential amplifier (Figure 2b) has three con-nections which are denoted ‘+’, ‘−’ and ‘ground’. The recorded input signal is connected between points + and −. Both inputs at + and − are exposed to the same external interference and the ideal differential amplifier has zero potential difference between these points. There is zero output when identical signals are applied to the two inputs; only the measured signal remains. This is called common mode rejection.
FiltersThe bandwidth of an amplifier is the range of frequencies that it can accurately reproduce. In selecting the right device to match the range of biological signal frequencies, interference can be reduced. Thus, for an ECG theatre monitor the amplifier must function from less than 0.5 Hz to 40 Hz in monitor mode and up to 100 Hz in diagnostic mode to allow detection of very low pulse rates to more detailed QRS information. Electronic filters are commonly built into amplifiers and, as the name suggests, they block undesirable frequencies to help reduce signal noise. In their simplest form, filters are combinations of resistors and capacitors (RC) or resistors and inductors (RL). A low-pass fil-ter eliminates high-frequency interference from sources such as diathermy, whereas a high-pass filter performs the opposite function. These two filters combine to produce band-pass filters. Notch filters can be used to reject a specific narrow band of fre-quencies, for example a 48–52 Hz filter would reject 50 Hz mains interference, which is particularly useful when monitoring the ECG.
Signal averaging
Signals with a low S/N ratios can be improved if the monitored biological signal is repetitive in nature. Noise is a chaotic and random process and can be electronically integrated to zero or near zero over time, leaving the desired waveform.
Digital processing
Analogue signals continuously change in amplitude and fre-quency with time. They are usually represented by changes in voltage or current but can also be reflected by changing tempera-ture or pressure. Digital signals, however, are presented as a set of discrete quantitative variables.
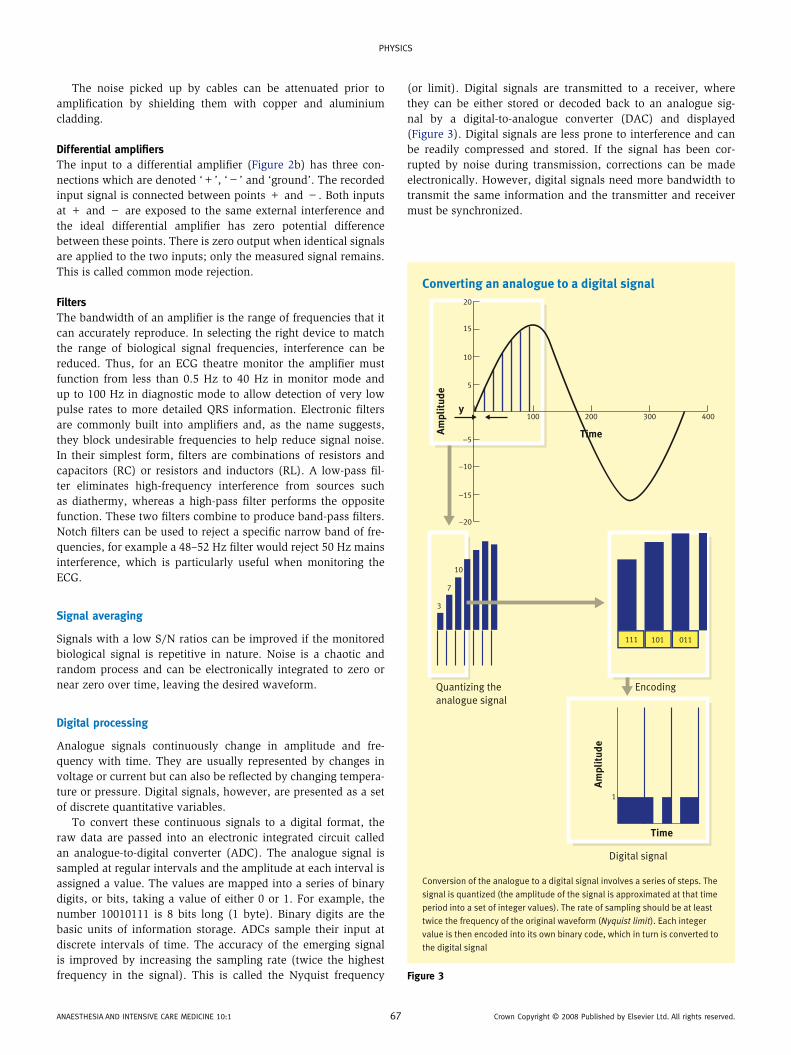
To convert these continuous signals to a digital format, the raw data are passed into an electronic integrated circuit called an analogue-to-digital converter (ADC). The analogue signal is sampled at regular intervals and the amplitude at each interval is assigned a value. The values are mapped into a series of binary digits, or bits, taking a value of either 0 or 1. For example, the number 10010111 is 8 bits long (1 byte). Binary digits are the basic units of information storage. ADCs sample their input at discrete intervals of time. The accuracy of the emerging signal is improved by increasing the sampling rate (twice the highest frequency in the signal). This is called the Nyquist frequency
ANAEsThEsiA AND iNTENsiVE cARE MEDiciNE 10:1 6
(or limit). Digital signals are transmitted to a receiver, where they can be either stored or decoded back to an analogue sig-nal by a digital-to-analogue converter (DAC) and displayed (Figure 3). Digital signals are less prone to interference and can be readily compressed and stored. If the signal has been cor-rupted by noise during transmission, corrections can be made electronically. However, digital signals need more bandwidth to transmit the same information and the transmitter and receiver must be synchronized.
Converting an analogue to a digital signal
Conversion of the analogue to a digital signal involves a series of steps. The
signal is quantized (the amplitude of the signal is approximated at that time
period into a set of integer values). The rate of sampling should be at least
twice the frequency of the original waveform (Nyquist limit). Each integer
value is then encoded into its own binary code, which in turn is converted to
the digital signal
400300200100
20
15
5
−5
−10
−15
−20
10
1
TimeAm
pli
tud
e
Am
pli
tud
e
y
111 101 011
Quantizing the
analogue signal
Encoding
Time
Digital signal
3
7
10
Figure 3
7 crown copyright © 2008 Published by Elsevier Ltd. All rights reserved.

Physics
Data storage devices
Once data have been acquired, it is usually necessary to retain them for either immediate or long-term reference. Historically, computer data storage was divided into primary and secondary storage methods, but these terms are now referred to as ‘memory’ and ‘storage’ respectively. Primary storage is the only one directly accessible by the central processing unit (CPU), so that it can con-tinuously read and execute instructions stored there. Items that are loaded or opened are placed into the random access memory (RAM), the computer’s temporary storage area. The CPU requests the data it needs from the RAM, processes them and writes new data back to the RAM in a continuous cycle. However, if the power supply is switched off then the data will be lost (volatile memory). Secondary storage refers to data that are not directly accessible by the CPU, that are often retained on removable exter-nal devices and that, even when the power supply is switched off, remain (non-volatile). Modern removable storage devices have storage capacities ranging from the 1.44 megabytes of a standard floppy disk to more than 160 gigabytes for some portable drives.All of these devices fall into one of three categories: magnetic, optical, or solid-state storage.• Magnetic storage uses different patterns of magnetization on a magnetically coated surface to store information and includes devices such as the hard disk and floppy disks.• Optical disk storage (CD, DVD) uses tiny pits etched onto the surface of a circular disk to store information, and reads this infor-mation by illuminating the surface with a laser diode, then observ-ing the reflection. This method of data recording is much better for longer-term storage since the data quality does not rapidly decline.• Solid-state storage is non-volatile computer memory that can be electrically erased and reprogrammed. This technology is pri-marily used in memory cards, smartmedia cards and USB mem-ory sticks. This solid-state technology has no moving parts and is a popular type of removable storage for small devices such as digital cameras. There is no need for a constant power source to retain stored information. These devices have fast read access times, are extremely durable and have a long lifespan (Table 2).
Display of the signal
An output device is any item of hardware that conveys the results of data processed by the computer. The data can be transferred
Modern digital storage devices
• Magnetic storage
devices
Magnetic tape
hard disk drives
Floppy disk drives
UsB (universal serial bus) flash drives
• Optical storage cD-ROM (compact disk – read-only
memory)
DVD (digital versatile disk)
cD-R (compact disk – write once)
cD-RW (compact disk rewritable)
BD (blu-ray disk)
Table 2
ANAEsThEsiA AND iNTENsiVE cARE MEDiciNE 10:1 68
via cable or digital telemetry (DT). Digital telemeters are small, wireless, battery-operated, multichannel (up to 16) devices that record wide-band bioelectrical signals. The digitized sig-nals are combined into a single data stream, serialized and then transmitted to a remote display. These systems are widely used in coronary and critical care units.
Basic systems can display numerical values using seven-seg-ment light-emitting diode (LED) display or alphanumerical 16-segment LEDs. Many non-invasive blood pressure monitors and pulse oximeters use these formats.
A monitor screen or visual display unit (VDU) presents more detailed information from the CPU. These displays include the cathode ray tube (CRT) or liquid crystal display (LCD).
Cathode ray tubeThe CRT is an evacuated glass shell containing an electron gun and a fluorescent screen, usually with internal or external means to accelerate and deflect the electrons. Electrons are produced via thermionic emission from the hot cathode and, upon striking the fluorescent screen, light is emitted. An oscilloscope is a slightly modified CRT that allows signal voltages to be displayed, usually as a graph of one or more electrical potential differences (y-axis) plotted as a function of time or of some other voltage (x-axis). Although CRT technology has been in use for over 100 years, the advantages of excellent colour resolution and refresh rates have been outweighed by its bulk, weight and high energy consump-tion. Many manufacturers no longer produce CRTs in favour of LCD panels.
Liquid crystal displaysLCDs are thin, flat, lightweight, portable display devices whose screen is made of a thin liquid-crystal gel (typically 10 mm thick) sandwiched between two glass-mounted polarizing panels which are orientated at 90° to one another. The panels are divided into individual pixels (single point in a graphic image). The display resolution depends upon the number of rows and columns per unit area, for example 800 × 600 or 1024 × 768. In a resting state, the liquid crystals arrange themselves as helical structures (twisted nematics) which reorientate light waves. When an inci-dent electroluminescent light is shone from behind, it passes through both filters and the screen appears transparent. When exposed to an electric field the liquid crystals become untwisted and orientate themselves parallel to it. In this state, light passing through the first filter does not pass through the second polar-izer and the screen appears opaque. By controlling the voltage applied across the liquid crystal layer in each pixel, light can be allowed to pass through in varying amounts thus constituting different levels of grey.
Colour LCD systems use the same technique, with colour fil-ters used to generate red, green and blue pixels.
These multiparameter monitors provide not only real-time waveform and numerical displays of the parameters monitored but 48-hour (more if required) trending, events memory and full disclosure archives. Available parameters include ECG, ST segment analysis, respiration, temperature, invasive and non-invasive blood pressures (the last with manual and automatic modes) and haemoglobin oxygen saturation measured by a pulse oximeter (Spo2) as well as end-tidal carbon dioxide concentration (Etco2), cardiac output and arrhythmia analysis. Monitors can
crown copyright © 2008 Published by Elsevier Ltd. All rights reserved.

Physics
also connect to a central station for data archiving and printing. The screen configuration can be rearranged manually to suit the individual patient and many have touch-screen capabilities.
Modern integrated monitoring systems may be classified as modular, configured or a hybrid of the two. Modular monitors have a base system with docking slots for inserting modules and offer greater flexibility, particularly in the theatre or intensive care environment where a patient may require transfer from one area to another.
Smaller configured monitors suitable for measurement of ECG, blood pressure (invasive and non-invasive), Spo2 and Etco2 use simple numerical and alphanumerical displays using LED or LCD technology which are also suited for patient transfer.
Auditory signalsModern monitoring systems have parameter alarms with standard range defaults. These can be altered manually, automatically or even inactivated! The display of the ECG signal or plethysmo-graphic signal from a pulse oximeter is often accompanied by an audible ‘beep’. An alteration in the rate or the pitch of the sound can warn of physiological change before an alarm is triggered.
Printers and plotters (hard copy output devices)Printouts are hard copies, which can provide a permanent record of the physiological measurements recorded. The quieter, more expensive, high-output laser or bubble-jet printers are supersed-ing the older, poor-quality dot matrix and daisy wheel printers. Flatbed and drum plotters use fine pens to chart changes in phys-iological measurements with time (ECG, EEG, cardiotocograph).
Automated record displaysThe problem with the current hand-written anaesthetic charts is that they can be illegible or inaccurate because during periods of intense activity the documentation of events will occur at a later stage. There has been much interest in trying to develop an automated record-keeping device for anaesthetists. Such systems
ANAEsThEsiA AND iNTENsiVE cARE MEDiciNE 10:1 6
would continuously record data from the various patient moni-tors, allow manual inputting of drugs and infusions and then at the end of surgery produce a printout more accurate than a manual version. Also, the storage of anaesthesia records in a digital database would allow the rapid and easy retrieval of a patient’s previous anaesthetic record, a feature particularly use-ful for audit or research. However, this process is far from being widely introduced into UK practice.
Data protection
It is the responsibility of any person collecting, processing and storing information to be aware of the Data Protection Act (1998). This resulted from the implementation of the earlier European Convention for the Protection of Individuals with regard to Auto-matic Processing of Personal Data (1981). This act of law also covers the security and confidentiality of any information or data that may be disclosed. ◆
FurThEr rEADing
Association of Anaesthetists of Great Britain and ireland (AAGBi).
standards of monitoring during anaesthesia and recovery, 4th edn.
London: Association of Anaesthetists of Great Britain and ireland,
2007.
Brown Bh, Lawford PV, smallwood Rh, et al. Medical physics and
biomedical engineering. Bristol: institute of Physics, 1999.
chapman J. Amplifiers and biological signal. Anaesthesia intensive care
Medicine. 2005; 6(9): 299–301.
Magee P, Tooley M. The physics, clinical measurement and equipment
of anaesthetic practice, Oxford: Oxford University Press, 2005.
signal noise. http://en.wikipedia.org/wiki/signal_noise (accessed 20 Nov
2007).
sykes MK, Vickers D, hull cJ. Principles of measurement and monitoring
in anaesthesia and intensive care, 3rd edn. Oxford: Blackwell
scientific Publications, 1991.
9 crown copyright © 2008 Published by Elsevier Ltd. All rights reserved.