PROCESSING OF COCONUT WATER WITH HIGH PRESSURE …
175
PROCESSING OF COCONUT WATER WITH HIGH PRESSURE CARBON DIOXIDE TECHNOLOGY By SIBEL DAMAR A DISSERTATION PRESENTED TO THE GRADUATE SCHOOL OF THE UNIVERSITY OF FLORIDA IN PARTIAL FULFILLMENT OF THE REQUIREMENTS FOR THE DEGREE OF DOCTOR OF PHILOSOPHY UNIVERSITY OF FLORIDA 2006
Transcript of PROCESSING OF COCONUT WATER WITH HIGH PRESSURE …

PROCESSING OF COCONUT WATER WITH HIGH PRESSURE CARBON
DIOXIDE TECHNOLOGY
By
SIBEL DAMAR
A DISSERTATION PRESENTED TO THE GRADUATE SCHOOL OF THE UNIVERSITY OF FLORIDA IN PARTIAL FULFILLMENT
OF THE REQUIREMENTS FOR THE DEGREE OF DOCTOR OF PHILOSOPHY
UNIVERSITY OF FLORIDA
2006

To my Mom and Dad

iii
ACKNOWLEDGMENTS
I would like to thank my advisor Dr. Murat O. Balaban for his guidance and
invaluable support in all stages of my research. He taught me how to do research, how to
work in a team, how to be productive and also prepared me for a professional
environment. I would also like to thank Dr. Marty R. Marshall, Dr. Russell L. Rouseff
and Dr. Bruce A. Welt for their guidance in instrumental analysis. My special thanks go
to Dr. Charles A. Sims, Dr. Robert P. Bates and Dr. Ramon C. Littell for sharing their
expertise and contributing to my dissertation.
I also would like to thank my dear friends Gogce and Stefan for their help
throughout my research. My special thanks go to my dad and mom for their invaluable
support and making life easier for me, through all stages of my doctoral work.
El Salvador Farms (Homestead, FL) provided the coconuts, their contribution is
appreciated.

iv
TABLE OF CONTENTS page
ACKNOWLEDGMENTS ................................................................................................. iii
LIST OF TABLES............................................................................................................ vii
LIST OF FIGURES ........................................................................................................... xi
ABSTRACT..................................................................................................................... xiv
CHAPTER
1 INTRODUCTION ...........................................................................................................1
2 LITERATURE REVIEW ................................................................................................4
Coconut Water: Composition and Characteristics........................................................4 Flavor Analysis.............................................................................................................8
Introduction ...........................................................................................................8 Instrumental Analysis..........................................................................................10
Gas chromatography/olfactometry (GC/O)..................................................10 Solid phase microextraction (SPME)...........................................................11
Sensory Analysis .................................................................................................12 Coconut Flavors...................................................................................................13
Thermal Processing Methods .....................................................................................15 Pasteurization ......................................................................................................15 Ultrapasteurization ..............................................................................................15 Ultra High Temperature (UHT)...........................................................................15 Heat Pasteurization of Juices...............................................................................16
Non-thermal Processing Methods...............................................................................17 Dense Phase Carbon Dioxide Technology .................................................................19
Mechanisms of Microbial Inactivation by DPCD ...............................................19 pH lowering effect........................................................................................20 Inhibitory effect of molecular CO2 and bicarbonate ion ..............................22 Physical disruption of cells ..........................................................................23 Modification of cell membrane and extraction of cellular components.......25
Inactivation of Vegetative Cells by DPCD .........................................................27 Inactivation of Spores by DPCD .........................................................................34 Inactivation of Enzymes by DPCD .....................................................................37 DPCD Treatment Systems...................................................................................41

v
DPCD Food Applications and Quality Effects....................................................45 Objectives of the Study...............................................................................................48
3 MATERIALS AND METHODS...................................................................................49
Preliminary Experiments with Coconuts ....................................................................49 Juice Extraction and Initial Quality Tests ...........................................................49 Pinking of Coconut Water ...................................................................................49 Tests with Commercial Coconut Water Drinks...................................................51
Extraction of Coconut Water from Coconuts .............................................................51 Formulation of Coconut Water Beverage...................................................................52 DPCD Processing Equipment.....................................................................................53
Continuous-flow DPCD System..........................................................................53 Cleaning of the Equipment ..................................................................................53
Heat Pasteurization Equipment...................................................................................54 Carbonation Equipment ..............................................................................................55 Optimization of DPCD Treatment Conditions for Microbial Reduction ...................56
Aging of Coconut Water .....................................................................................56 Experimental Design ...........................................................................................56
Storage Study..............................................................................................................58 Microbial Tests....................................................................................................59 pH ........................................................................................................................60 Titratable Acidity (%TA) ....................................................................................60 oBrix.....................................................................................................................60 Color ....................................................................................................................60 Sensory Evaluation..............................................................................................61 Flavor Analysis....................................................................................................62
Data Analysis..............................................................................................................64
4 RESULTS AND DISCUSSION....................................................................................65
Formulation of Coconut Water Beverage...................................................................65 Objective 1: Quantification of Microbial Reduction in Coconut Water as a
Function of Treatment Conditions .........................................................................65 Objective 2: Evaluation of Physical, Chemical and Microbial Quality of DPCD
Treated Coconut Water Beverage during Storage .................................................70 Objective 3: Comparison of Untreated Control, DPCD and Heat Treated Coconut
Water by Sensory Evaluation.................................................................................78 Objective 4: To Identify Flavor Compounds in Coconut Water and Compare
Flavor Profile of DPCD and Heat Treated Coconut Water ...................................87
5 CONCLUSIONS............................................................................................................94
APPENDIX
A RESULTS OF PRELIMINARY TESTS WITH COCONUT WATER .......................98
B BOX-BEHNKEN EXPERIMENTAL DESIGN, DATA and ANALYSIS................102

vi
C GC/O AND GC/MS FLAVOR ANALYSIS DATA AND RESULTS ......................106
D STORAGE STUDY: MICROBIAL, CHEMICAL AND PHYSICAL QUALITY DATA .......................................................................................................................117
E STORAGE STUDY TASTE PANELS: DATA AND ANALYSIS ...........................125
LIST OF REFERENCES.................................................................................................151
BIOGRAPHICAL SKETCH ...........................................................................................160

vii
LIST OF TABLES
Table page 2-1. A summary of contents for coconut water and human blood plasma .........................7
2-2. Chemical and physicochemical composition of green coconuts .................................7
2-3. Mineral composition of tender coconut water.............................................................8
2-4. Volatile compound classes and their sensory characteristics ......................................9
2-5. Non-volatile compound classes and their sensory characteristics.............................10
2-6. Summary of the studies on inactivation of various microorganisms.........................32
2-7. Summary of studies on spore inactivation by DPCD................................................36
2-8. Summary of studies on inactivation of enzymes by DPCD ......................................39
3-1. Three factor-3 level Box-Behnken experimental run coded variables and conditions .................................................................................................................57
3-2. Temperature programming conditions used for GC/O runs with DB-5 and Carbowax columns. ..................................................................................................64
4-1. Log microbial reductions at each experimental point determined by Box-Behnken design ........................................................................................................67
4-2. Comparison of overall mean values for sensory attributes from different treatments (α=0.05). .................................................................................................86
4-3. The percentages of panelists answering “yes” to the question: Would you buy that product? .............................................................................................................86
4-4. The percentages of panelists answering “no” the first purchase intent question and answering still “no” the second purchase intent question: Would you buy this product if you knew coconut water had rehydrating properties? ......................87
4-5. The list of flavor compounds that were identified in untreated fresh coconut water .........................................................................................................................89

viii
4-6. Standard chemicals (10 ppm of each in a mixture) that were run in GC/O with DB-5 column ............................................................................................................91
4-7. Standard chemicals (100 ppm each in a mixture) that were run in GC/O with Carbowax column ....................................................................................................92
4-8. The descriptors given by sniffers for the flavor compounds identified in coconut water .........................................................................................................................92
A-1. Initial aerobic plate count (APC) and yeast and mold (YM) counts for coconut water from eight immature green coconuts..............................................................98
A-2. Day 9 aerobic plate count (APC) and yeast and mold (YM) counts for coconut water from selected coconuts of eight immature green coconuts ............................98
A-3. Preliminary pinking test 1: Visual observation of the color of coconut water after different treatments during storage at 4oC in glass tubes .........................................99
A-4. Preliminary pinking test 2: Visual observation of the color of coconut water after different treatments during storage at 4oC in opaque plastic cups ...........................99
A-5. Preliminary pinking test 3: Visual color observation of untreated, heat treated or aerated coconut water during storage in glass tubes at 4oC. ..................................100
A-6. The pH, oBrix and ingredients of commercially available coconut water beverages ................................................................................................................100
B-1. The average initial and final aerobic plate counts (APC) ± standard deviations at 15 experimental runs from 3-factor, 3-level Box-Behnken experimental design ..102
B-2. SAS software code used for the response surface methodology (RSM) analysis of 15 experimental runs determined by Box-Behnken experimental design .........103
B-3. SAS software output of the response surface methodology (RSM) regression analysis of 15 experimental-run data determined by Box-Behnken experimental design including variables X1 (coded variable for Temperature), X2 (coded variable for Pressure) and X3 (coded variable for %CO2 level) ............................103
B-4. SAS software output of the response surface methodology (RSM) regression analysis of 15 experimental-run data determined by Box-Behnken experimental design including variables X1 (coded variable for Temperature) and X3 (coded variable for %CO2 level) ........................................................................................104
C-1. Excel output of alkane standards’ linear retention index (LRI) calculations in GC/O with a Carbowax column .............................................................................106
C-2. Excel output of alkane standards’ linear retention index (LRI) calculations in GC/O with a DB-5 column.....................................................................................107

ix
C-3. Retention times (RT), linear retention indices (Wax LRI) and GC/MS degree of match values of four mixed group of standard chemicals that were run in GC/MS for possible confirmation ..........................................................................111
C-4. Flavor compounds identified in coconut water through GC/O runs: Retention times, calculated Linear Retention Indices (LRI’s) and aroma descriptors given by sniffers in GC/O runs with DB-5 and Carbowax columns................................113
C-5. Peak areas of the sniffed compounds (olfactory port responses) and the aroma descriptors given by sniffers for DPCD treated (25oC, 34.5 MPa, 13% CO2, 6 min) and carbonated coconut water samples in GC/O with Carbowax column ....114
C-6. Peak areas of the sniffed compounds (olfactory port responses) and the aroma descriptors given by sniffers for heat treated (74oC, 15 s) and carbonated coconut water in GC/O with Carbowax column ....................................................115
D-1. Total aerobic plate counts (APC) of untreated, DPCD treated (34.5 MPa, 25oC, 13% CO2, 6 min) and heat treated (74oC, 15 s) coconut water during storage (4oC) .......................................................................................................................117
D-2. Excel outputs of one-tail t tests conducted for comparison of mean aerobic plate counts (APC) and yeast and mold (YM) counts for week 0 and week 9 samples. 117
D-3. Aerobic plate counts (APC) and yeast and mold (YM) counts of sterile distilled water before and after carbonation with the Zalhm carbonator .............................120
D-4. Yeast and mold (YM) counts of untreated, heat treated (74oC, 15 s) and DPCD treated (34.5 MPa, 25oC, 13% CO2, 6 min) coconut water beverages during storage ....................................................................................................................120
D-5. The pH of untreated, DPCD treated and heat pasteurized samples during storage120
D-6. SAS software output of analysis of variance (ANOVA) for the pH data of different treatments from the storage study............................................................121
D-7. The oBrix of untreated, DPCD treated and heat pasteurized samples during storage ....................................................................................................................121
D-8. SAS software output of analysis of variance (ANOVA)for oBrix data of different treatments from the storage study ..........................................................................122
D-9. Titratable acidity (as % malic acid (w/v)) of untreated, DPCD treated and heat pasteurized coconut water beverages during storage .............................................123
D-10. SAS software output of analysis of variance (ANOVA) for % titratable acidity data of different treatments from storage study .....................................................123

x
D-11. The mean L*, a*, b* values of untreated, DPCD (34.5 MPa, 25oC, 13% CO2, 6 min) and heat treated (74oC, 15 s) coconut water beverages during storage .........124
E-1. Taste panel data output obtained by Compusense software: Sensory evaluation scores of treatments during the storage study (Evaluation score scales: Overall likeability: 9 point scale; Aroma difference and taste difference from control: 15 cm line scale; Off flavor: 6 point scale; Purchase intent and ask again: 1=Yes and 2=No)...............................................................................................................125
E-2. SAS software output of analysis of variance (ANOVA) for “overall likeability” data for untreated, DPCD and heat treated coconut water by panelists .................144
E-3. The weekly mean “overall likeability” scores for untreated, DPCD and heat pasteurized samples during storage........................................................................144
E-4. SAS software output of analysis of variance (ANOVA) for “aroma difference from control scores” (corrected data) of different treatments during storage study145
E-5. The weekly mean “aroma difference from control” scores for untreated, DPCD treated (34.5 MPa, 25oC, 13% CO2, 6 min) and heat treated (74oC, 15 s) coconut water during storage (4oC) .....................................................................................145
E-6. SAS software output for analysis of variance (ANOVA) for “taste difference from control scores” (corrected data) of different treatments during the storage study .......................................................................................................................146
E-7. The weekly mean “taste difference from control” scores for untreated, DPCD treated (34.5 MPa, 25oC, 13% CO2, 6 min) and heat treated (74oC, 15 s) coconut water during storage (4oC) .....................................................................................146
E-8. SAS software output for analysis of variance (ANOVA) of “off flavor” scores of different treatments during storage study...............................................................147
E-9. The weekly mean “off flavor” scores for untreated, DPCD treated (34.5 MPa, 25oC, 13% CO2, 6 min) and heat treated (74oC, 15 s) coconut water during storage (4oC)...........................................................................................................147
E-10. Sample ballots that were used in sensory panels throughout the storage study (Output obtained by Compusense software). .........................................................148

xi
LIST OF FIGURES Figure page
2-1. Cross section of coconut (Cocos nucifera) fruit.........................................................4
2-2. Coconut producing areas of the world.........................................................................5
2-3. Measured and calculated pH of pure water pressurized with CO2 up to 34.5 MPa ..20
2-4. Scanning electron micrographs (SEM) of untreated (a) and DPCD treated (b) S.cerevisiae cells .....................................................................................................25
2-5. Transmission electron micrographs (TEM) of untreated (a) and DPCD (b,c) treated L.plantarum cells at 7 MPa, 30oC, 1 h .........................................................26
2-6. A typical batch DPCD system...................................................................................42
2-7. A continuous micro-bubble DPCD system ...............................................................43
2-8. A continuous CO2 membrane contactor system........................................................44
2-9. A continuous flow DPCD system..............................................................................45
3.1. Schematic drawing of heat pasteurization equipment ...............................................55
3-2. Schematic drawing of steps followed in preparation of storage study samples ........59
4-1. Geometry of the 3-factor 3-level Box-Behnken design.............................................66
4-2. Plots of the response surface for the quadratic model with the variables X1: Temperature (coded) and X3: %CO2 level (coded) .................................................69
4-3. Total aerobic plate counts (APC) of untreated control, DPCD and heat treated coconut water during storage (DPCD treatment at 25oC, 34.5 MPa,13% CO2 for 6 min; Heat treatment at 74oC for 15 s)....................................................................71
4-4. Yeast counts of untreated control, DPCD and heat treated coconut water during storage (DPCD treatment at 25oC, 34.5 MPa, 13% CO2 for 6 min; Heat treatment at 74oC for 15 s) .......................................................................................71

xii
4-5. The pH of untreated, DPCD and heat treated coconut water during storage (DPCD treatment at 25oC, 34.5 MPa, 13% CO2 for 6 min; Heat treatment at 74oC for 15 s) ...........................................................................................................73
4-6. The oBrix of untreated, DPCD and heat treated coconut water during storage (DPCD treatment at 25oC, 34.5 MPa, 13% CO2 for 6 min; Heat treatment at 74oC for 15 s) ...........................................................................................................74
4-7. Titratable acidity (as % malic acid (w/v)) of untreated, DPCD treated and heat pasteurized samples during storage (DPCD treatment at 25oC, 34.5 MPa, 13% CO2 for 6 min; Heat treatment at 74oC for 15 s) ......................................................76
4-8. Mean L* values of untreated control, DPCD and heat treated coconut water during storage (DPCD treatment at 25oC, 34.5 MPa, 13% CO2 for 6 min; Heat treatment at 74oC for 15 s) .......................................................................................77
4-9. Mean a* values of untreated control, DPCD and heat treated coconut water during storage (DPCD treatment at 25oC, 34.5 MPa, 13% CO2 for 6 min; Heat treatment at 74oC for 15 s) .......................................................................................77
4-10. Mean b* values of untreated control, DPCD and heat treated coconut water during storage (DPCD treatment at 25oC, 34.5 MPa, 13% CO2 for 6 min; Heat treatment at 74oC for 15 s) .......................................................................................78
4-11. Comparison of overall likeability of each treatment during storage .......................80
4-12.The frequency histograms of storage study aroma difference from control scores of untreated (control) samples..................................................................................82
4-13.The frequency histograms of storage study taste difference from control scores of untreated (control) samples..................................................................................83
4-14. Comparison of treatments for aroma difference from control scores during storage ......................................................................................................................84
4-15. Comparison of treatments for taste difference from control scores during storage .84
4-16. Comparison of treatments for off flavor scores during storage...............................85
4-17. Comparison of aromagrams of DPCD (25oC, 34.5 MPa, 13% CO2, 6 min) and heat (74oC, 15 s) treated carbonated coconut water beverages obtained from olfactory port responses (2 weeks storage at 4oC). ..................................................93
A-1. Pictures of coconut water from eight immature green coconuts at day 0 (left) and day 9 (right) ..............................................................................................................99
A-2. Pictures showing the steps of extraction of coconut water from coconuts.............101

xiii
C-1.Plot of the formula relating the LRI’s to the retention times for aroma compounds in GC/O with a Carbowax column.........................................................................106
C-2. Plot of the formula relating the LRI’s to the retention times for aroma compounds in GC/O with a DB-5 column .............................................................107
C-3. An example of GC/MS peak identification using National Institute of Science and Technology (NIST) library database ...............................................................108
C-4. GC/MS chromatograms of the four mixed groups of standard chemicals that were run in GC/MS for a possible confirmation ....................................................110
C-5. Sample GC/MS chromatograms obtained by running fresh coconut water samples. ..................................................................................................................112
C-6. GC/MS chromatograms of DPCD treated (coconut0011 and coconut0013) and heat treated (coconut0013 and coconut0014) coconut water beverages (carbonated)............................................................................................................116

xiv
Abstract of Dissertation Presented to the Graduate School of the University of Florida in Partial Fulfillment of the Requirements for the Degree of Doctor of Philosophy
PROCESSING OF COCONUT WATER WITH HIGH PRESSURE CARBON DIOXIDE TECHNOLOGY
By
Sibel Damar
August 2006
Chair: Murat O. Balaban Major Department: Food Science and Human Nutrition
Coconut water, the clear liquid inside immature green coconuts, is highly valued
due to its nutritional and therapeutic properties. It has been successfully used in several
parts of the world for oral rehydration, treatment of childhood diarrhea, gastroenteritis
and cholera. This juice is mostly consumed locally as fresh in tropical areas since it
deteriorates easily once exposed to air. Commercially, it is thermally processed using
ultra high temperature (UHT) technology. However, coconut water loses its delicate fresh
flavor and some of its nutrients during heating. A non-thermal process is desirable to
protect the fresh flavor and nutrient content of coconut water, which would increase
marketability of this healthy drink and availability to consumers throughout the world.
This study evaluated the effects of dense phase CO2 (DPCD) pasteurization on sensory,
physical and chemical quality of a coconut water beverage. The coconut water beverage
was formulated by acidification with malic acid to pH around 4.30, sweetened with
Splenda (0.7% w/w) and carbonated at 1.82 atm CO2 at 4oC. Microbial reduction was

xv
quantified as a function of pressure, temperature and % CO2 level. Optimum DPCD
treatment conditions for microbial inactivation were determined to be 13% CO2, 25oC,
34.5 MPa for 6 min. Quality attributes such as pH, oBrix, % titratable acidity (%TA) and
color of DPCD treated, fresh and heat pasteurized (74oC for 15 s) coconut water
beverages were measured and compared throughout refrigerated storage (4oC for 9
weeks). DPCD treatment did not cause a change in pH or oBrix. The color of coconut
water eventually turned pink during storage, independent of treatment. Sensory panels
showed that DPCD treated coconut water was liked as much as fresh coconut water;
whereas heat pasteurized coconut water was significantly less liked (α=0.05) at the
beginning of storage. Flavor compounds of immature coconut water were identified.
Flavor profiles showed that heat treated coconut water had more aroma active compounds
than DPCD treated coconut water.
This study showed that a fresh-like tasting coconut water beverage can be produced
by DPCD technology with an extended shelf-life of more than 9 weeks at 4oC.

1
CHAPTER 1 INTRODUCTION
Coconut water, as a tropical fruit juice, is highly valued and consumed in tropical
areas since it is tasty and has desirable nutritional and therapeutic properties. The total
world coconut cultivation area was estimated in 1996 at 11 million hectares (ha), and
around 93% was found in the Asian and Pacific regions (Punchihewa and Arancon
2005). Indonesia, the Philippines, and India are the largest producers of coconut in the
world. Coconut (Cocos nucifera Linn.) fruit is filled with the sweet clear liquid “coconut
water” when the coconut is about 5 to 6 months old. Coconut water has been called the
“fluid of life” due to its medicinal benefits such as oral rehydration, treatment of
childhood diarrhea, gastroenteritis and cholera (Kuberski 1980, Carpenter and others
1964). It is high in electrolyte content and has been reported as an isotonic beverage due
to its balanced electrolytes like sodium and potassium that help restore losses of
electrolytes through skin and urinary pathways. Coconut water was claimed as a natural
contender in the sports drink market with its delicate aroma, taste and nutritional
characteristics together with the functional characteristics required in a sports drink (Food
and Agricultural Organization [FAO] 2005).
The constituents of coconut water are water 94% (w/v), sugars such as glucose,
fructose and sucrose around 5% (w/v), proteins around 0.02% (w/v) and lipids only about
0.01% (w/v). It is rich in minerals such as potassium, calcium, magnesium and
manganese, and low in sodium.

2
Most coconut water is consumed fresh in tropical coastal areas due to its short
shelf-life. Once exposed to air, it loses most of its sensory and nutritional characteristics
and deteriorates. Commercially, juice production is carried out mostly in Indonesia, the
Philippines, and Thailand using ultra high temperature (UHT) sterilization while some of
coconut water’s nutrients and its delicate flavor are lost during this thermal processing
(FAO 2005), which limits the product’s marketability.
Usually juices are pasteurized by a low temperature long time (LTLT) process at
about 145oF (63oC) for 30 min or a high temperature short time (HTST) process at about
162oF (72oC) for 15 s. Resulting shelf-life is about 2 to 3 weeks under refrigeration
(lower than 7oC). Heat treatment can cause significant reduction in physical, nutritive and
sensory quality of foods. Flavor changes in foods due to heating have been reported by
many studies (Shreirer and others 1977, Shaw 1982, Bell and Rouseff 2004). Non-
thermal processing methods have been receiving an increasing interest as alternative or
complementary processes to traditional thermal methods because they minimize quality
degradation by keeping the food temperature below the temperatures used in thermal
processing.
Dense phase CO2 (DPCD) technology is a non-thermal method emerging as an
alternative to traditional thermal pasteurization. It is a cold pasteurization method that
does not use heat to destroy microorganisms and enzymes, but instead uses the molecular
effects of CO2 at pressures lower than 50 MPa. Therefore, DPCD pasteurized foods are
not exposed to adverse effects of heat, and are expected to retain their fresh-like physical,
nutritional and sensory qualities.

3
The lethal effects of CO2 under high pressure on microorganisms have been
investigated since the 1950’s. Carbon dioxide is suitable for use in foods since it is a non-
toxic, non-flammable, and an inexpensive gas. It is a natural constituent of many foods,
and has generally recognized as safe (GRAS) status. The study of Fraser (1951) is the
first research showing that CO2 can inactivate bacterial cells under high pressure. Since
then many researchers investigated effects of DPCD on microorganisms (pathogenic and
spoilage organisms, vegetative cells and spores, yeasts and molds), enzymes, and quality
attributes of foods. Within the last two decades, the number of research studies and
patents has increased, and commercialization efforts intensified. DPCD is one of the
emerging non-thermal technologies that satisfied FDA’s requirement of 5 log pathogen
reduction for juice manufacturers.
DPCD technology has a great potential for use in the fruit juice industry especially
for tropical fruits that have limited availability to consumers throughout the world. This
study evaluated the use of DPCD technology with coconut water regarding microbial
inactivation, and physical, chemical and sensory quality evaluation. Objectives of this
study included quantification of microbial inactivation as a function of DPCD treatment
conditions, evaluation of beverage quality during storage, comparison of DPCD treated
coconut water beverage with fresh and heat treated coconut water beverages, and finally
the identification of flavor compounds in coconut water and comparison of flavor profiles
for heat treated and DPCD treated beverages. The demonstrated quality retention and
shelf-life extension in coconut water with DPCD technology would increase its
marketability and availability to the consumer.

4
CHAPTER 2 LITERATURE REVIEW
Coconut Water: Composition and Characteristics
The coconut (Cocos nucifera Linn.) fruit, egg-shaped or elliptic, consists of a
fibrous outer layer called coconut husk (mesocarp), which covers a hard layer called shell
(endocarp). Inside the shell is a kernel (endosperm), which is considered the most
important part of the fruit. It is the source of various coconut products such as copra, i.e.,
the dried meat of mature fruit with 5% water content, coconut oil, coconut milk, coconut
water and coconut powder. The cavity within the kernel contains coconut water (Figure
2-1) (Woodroof 1979). This part begins to form as a gel when the coconut is about 5 to 6
months old, becomes harder and whiter as coconut matures, and the inside is filled with
coconut water (Oliveira and others 2003). An immature coconut between 6 to 9 months
contains about 750 mL of water that eventually becomes the flesh (FAO 2005).
Figure 2-1. Cross section of coconut (Cocos nucifera) fruit

5
Total world coconut cultivation area in 1996 was estimated at 11 million hectares
(ha), and around 93% is found in Asian and Pacific regions (Figure 2-2) (Reynolds 1988).
The two biggest producers, Indonesia and the Philippines, have about 3.7 million ha and
3.1 million ha, respectively. India is the third largest producer. In the South Pacific
countries, Papua New Guinea is the leading producer. In Africa, Tanzania is the largest
producer while in Latin America Brazil accounts for more than one half of the total
coconut area for that region (Punchihewa and Arancon 2005).
Figure 2-2. Coconut producing areas of the world
Coconut water has been called the “fluid of life” in many parts of the world due to
its medicinal benefits. It has been reported as a natural isotonic beverage due to
electrolytes like sodium and potassium, and its isotonic properties are demonstrated by its
osmol (the number of moles of osmotically active particles; 1 mole of glucose, which is
not ionizable, forms 1 osmol, 1 mole of sodium chloride forms 2 osmols) concentration,
which lies in the range of 300-330 mOsmol/kg (Gomes and Coelho 2005). With its high

6
electrolyte content, it has been studied for its potential use as an oral rehydration solution.
Comparison of coconut water with a “carbohydrate electrolyte beverage” resulted in
similar rehydration indices (SDcoconut 2005). There are many reports of its successful
use in gastroenteritis or diarrhea (Kuberski 1980). It is suggested as a readily available
source of potassium for cholera patients (Carpenter and others 1964). Coconut water
resembles blood plasma in its contents. Its successful intravenous use has been
documented (Falck and others 2000). During the Pacific War of 1941-45, coconut water
was siphoned directly from the nut to wounded soldiers for emergency plasma
transfusions (FAO 2005). Although its glucose, potassium, magnesium and calcium
levels are higher and sodium content is lower than blood plasma, studies on its
intravenous infusion show no allergenic or sensitivity reactions (Fries and Fries 1983). A
summary of the contents of coconut water and normal blood plasma is given in Table 2-1.
Campos and others (1996) determined the chemical and physicochemical
composition of a pool of coconut water from 30 green coconuts. They measured water
content, total solids, soluble solids, total sugars, reducing sugars, ash, protein, lipids, total
phenolics, total titratable acidity and turbidity (Table 2-2). Carbohydrates are the main
constituents of coconut water, and glucose and fructose are the most abundant soluble
solids in green coconuts, while sucrose is the main one in ripe coconuts (Oliveira and
others 2003).

7
Table 2-1. A summary of contents for coconut water and human blood plasma
Study Specific gravity pH
Na+ meq/L
K+ meq/L
Cl- meq/L
Glucose g/L
Ca+2 meq/L
PO4 meq/L
Mg+2 meq/L
Pradera and others 1942*
1.018 ---- 5.0 64 45.5 1.2 17 2.8 ----
Elseman 1954* ---- 5.6 4.2 53.7 57.6 1.8 9 2.4 17
Rajasurya 1954* 1.02 4.8 ---- 38.2 21.3 ---- 14.5 4.4 ----
DeSilva 1959* 1.02 4.9 ---- ---- ---- ---- ---- ---- 19
Olurin 1972* 1.02 5.6 0.7 81.8 38.6 ---- 3.6 3.2 25
Iqbal 1976* 1.019 5.6 5.0 49 63 2.1 12 8 4.7
Kuberski 1979* ---- ---- 4.0 35.1 41 2.8 13.1 4 5.2
Msengi 1985* 1.023 6.0 2.9 49.9 ---- ---- 5.3 ---- 13.4
Atoiffi 1997* ---- 4.2 9.7 43.1 39.8 1.73 ---- ---- ----
Normal plasma 1.027 7.4 140 4.5 105 0.1 5.0 2.0 1.8
(* Cited in Falck and others 2000) Table 2-2. Chemical and physicochemical composition of green coconuts Water (g/100 mL) 94.2±1.90 Total solids (g/100 mL) 5.80±0.12 Soluble solids (Brix, 20oC) 5.27±0.11 Total sugars (g/100 mL) 5.30±0.21 Reducing sugars (g/100 mL) 4.90±0.20 Non-reducing sugars (g/100 mL) 0.40±0.04 Ash (g/100 mL) 0.50±0.01 Protein (mg/100 mL) 19.50±0.50 Lipids (mg/100 mL) 11.00±0.60 Total phenolics (mg catechin/100 mL) 6.86±0.55 Total titratable acidity (mg citric acid/100 mL) 131.20±2.80 pH 5.20±0.10 Transmittance (%) 81.00±1.70 (Campos and others 1996)

8
Coconut water is rich in mineral composition (Table 2-3). It is high in potassium,
calcium, magnesium, and manganese, and low in sodium. Coconut water is low in fat and
proteins. It is rich in many essential amino acids such as lysine, leucine, cystine,
phenylalanine, histidine and tryptophan (Pradera and others 1942). Its arginine, alanine,
cysteine and serine percentage is higher than those of cow’s milk (Maciel and others
1992). It contains ascorbic acid and B complex vitamins. Ascorbic acid content of
coconut water from a 7-9 month coconut has been reported to be 2.2 to 3.7 mg/100 mL
(Mantena and others 2003). Coconut water is low in calories with a caloric value of 17.4
kcal/100 g (Woodroof 1979).
Table 2-3. Mineral composition of tender coconut water
(Krishnankutty 2005)
Coconut water is mostly consumed fresh in tropical coastal areas today. In addition,
commercial juice production is carried out in Indonesia, the Philippines and Thailand by
heating with Ultra High Temperature (UHT). Although thermal processing eliminates
bacteria, it causes loss of the delicate flavor and some nutrients of coconut water.
Flavor Analysis
Introduction
Flavor is a combination of the perceived aroma, taste and trigeminal sensations
(Fisher and Scott 1997). Taste sensation has four major categories; sweet, sour, bitter,
Minerals (mg /100 mL) Copper 26 Potassium 290 Sodium 42 Calcium 44 Magnesium 10 Phosphorous 9.2 Iron 106

9
and salty. Umami is included as the fifth category by some scientists. Trigeminal
sensations give the pungency, cooling or astringency. Taste and trigeminal components
of flavor are polar, non-volatile and water-soluble compounds. Aroma, on the other hand,
is created by the volatile compounds. A summary of the volatile and non-volatile
compounds and the examples of their sensory descriptors are given in Tables 2-4 and 2-5
(Fisher and Scott 1997).
Fruit flavors are a combination of sweet and sour tastes and the characteristic
aroma compounds. Sugars such as glucose, fructose and sucrose are responsible for the
sweetness of the fruit. Organic acids such as malic, citric, tartaric, etc. give sourness.
These compounds are common in most fruits. Most volatile constituents in fruits contain
aliphatic hydrocarbon chains, or their derivatives such as esters, alcohols, acids,
aldehydes, ketones and cyclic compounds such as lactones. These compounds are
reported as ripening products that develop from two different sources including fatty
acids by several lipid oxidation pathways, and amino acids via amino acid metabolism.
Generally, aromas of citrus fruits are created by terpenoids while that of non-citrus fruits
consists of esters and aldehydes (Fisher and Scott 1997).
Table 2-4. Volatile compound classes and their sensory characteristics Compound class Sensory character Examples Aldehydes Fruity, green, oxidized,
sweet Acetaldehyde, hexanal, decanal, vanillin
Alcohols Bitter, medicinal, piney, caramel
Linalool, menthol, α-terpineol, maltol
Esters Fruity Ethyl acetate, ethyl butyrate Citrus Geraniol acetate Ketones Butter, caramel Diacetyl, furanones Maillard reaction products Brown, burnt, caramel,
earthy Pyrazines, pyridine, furans
Phenolics Medicinal, smokey Phenols, guaiacols Terpenoids Citrus, piney Limonene, pinene, valencene (Fisher and Scott 1997)

10
Table 2-5. Non-volatile compound classes and their sensory characteristics Compound class Sensory character Examples Acids: Amino acids
Sweet, sour, bitter
Organic acids Sour Citric, malic, tartaric Polyphenolic acids Astringent, bitter Chlorogenic, caffeic Flavonoids Astringent, bitter Flavonols, anthocyanins Phenolics Medicinal, smokey Guaicols, phenols Sweeteners: Sugars
Sweet, body
Sucrose, glucose, fructose
High intensity sweeteners Sweet Aspartame, acesulfame-K (Fisher and Scott 1997) Instrumental Analysis
Gas chromatography/olfactometry (GC/O)
Gas chromatography (GC) is typically the method of choice for the analysis of
flavor compounds. Initial studies of flavor analysis were conducted using packed column
GC, which gave poor analytical results compared to today’s capillary column GC.
Combining GC with mass spectrometry (GC/MS) allowed separation and identification
of numerous volatile compounds (Mistry and others 1997). It is possible to identify more
than 6900 volatile compounds by using these techniques. However, not all of these
volatiles have odor impact, only a few give the characteristic odor of the foods. GC
olfactometry (GC/O) is an important analytical tool in flavor research to characterize the
odors emerging from a sniffing port. GC/O allows the separation of odor active chemicals
from the volatile chemicals with no or minimal odor response.
Due to the complexity of the food matrix and aromas, and low concentration levels
of aroma compounds, typically in the parts per million (ppm), parts per billion (ppb) or
parts per trillion (ppt) ranges, generally isolation and concentration of the flavors are
needed prior to the analysis with GC. The most commonly used techniques are solvent
extraction, headspace sampling, and distillation methods. Each method has advantages

11
and disadvantages. For example, in headspace sampling, analytes are removed from the
sample without the use of an organic solvent. However, this method usually has low
sensitivity and can give poor quantitative results (Reineccius 1984). Headspace isolates
can be concentrated by the use of cryogenic or adsorbent traps. In cryogenic traps, water
is the most abundant volatile isolated from the food and should be removed by additional
steps that may cause sample contamination. Adsorbent traps offer advantage of water-
free isolates, but differential affinity of analytes for adsorbent can result in low sensitivity
for some chemicals. Solvent extraction is an accurate qualitative and quantitative method,
however, it can be laborious and its use is limited to fat-free foods. Although distillation
is an effective method, it takes a long time and impurities from the system components or
thermally induced chemical changes can be a problem. Recently, solid phase
microextraction (SPME) has found applications and is recommended as a convenient
method for sample preparation before GC analysis (Wardencki and others 2004).
Solid phase microextraction (SPME)
SPME is a relatively new sample preparation technique for rapid and solvent-free
extraction or pre-concentration of volatile compounds before analysis with GC. The key
component of SPME is the fused silica fiber coated with an adsorbent polymeric material.
This is an equilibrium technique and utilizes the partitioning of organic compounds in the
sample between the aqueous or vapor phase and the thin adsorbent film coating.
Adsorbed materials are thermally desorbed in a GC injection port. SPME is a simple,
rapid, solvent-free and inexpensive method when compared with other sample
preparation techniques such as solvent extraction, purge-and-trap, simultaneous
distillation/extraction and conventional solid-phase extraction (Yang and Peppard 1994).
Each additional step in the analytical procedure increases the possibility of analyte loss,

12
sample contamination and analytical error. SPME minimizes the number of steps used in
sample preparation by combining extraction and concentration steps. For volatile/semi-
volatile and non-polar/semi-polar analytes, SPME can reach detection limits of 5-50 pg/g,
with an approximate sample preparation time of 15-60 min (Wardencki and others 2004).
The effectiveness of the SPME depends on many factors such as type of fiber, sample
volume, temperature, extraction time, mode of extraction and desorption of analytes from
the fiber. The most commonly used commercially available fibers are non-polar
Polydimethylsiloxane (PDMS), semi-polar PDMS/divinylbenzene and polar
Carbowax/divinylbenzene.
Yang and Peppard (1994) used SPME liquid sampling and solvent extraction with
dichloromethane to extract flavor compounds of a fruit juice beverage and analyzed the
compounds by GC/MS. They showed comparable or higher sensitivity than solvent
extraction method for most esters, terpenoids and γ-decalactone. They also analyzed a
vegetable oil for butter flavor by SPME headspace sampling and found that this
technique was effective in detection of diacetyl, δ-decalactone and δ-dodecalactone. They
reported that conventional headspace sampling method generally was more sensitive for
highly volatile compounds while the SPME headspace method picked up more of the less
volatile compounds.
Sensory Analysis
Flavor research studies the effect of changes in foods on flavor, and characterizes
these changes. Consumer acceptability or likeability of products developed with the new
technologies is a major tool for commercialization. Sensory evaluation of food provides

13
guidance for the maintenance, optimization and improvement of these products (Lawless
and Heymann 1998).
Sensory methods commonly used are separated into three groups: discriminant,
descriptive and affective methods. The method of choice depends on which questions are
to be asked about the product during the test. Discrimination methods answer whether
any difference exists between products, while descriptive tests answer how products
differ in specific sensory characteristics and provides quantification of these differences
(Lawless and Heymann 1998). Once differences are observed by discrimination type
tests, then descriptive tests can provide further information on the reasons for the
differences found. Affective tests are conducted to find out how well the products are
liked or which products are preferred. Examples of discrimination tests are triangle, duo-
trio and paired comparison tests. In some cases, difference-from-control test is used
instead of triangle or duo-trio tests, when the magnitude of difference from a control is
important (Miller and others 1998). This test not only assesses difference but also
quantifies the magnitude of difference.
Coconut Flavors
The desirable flavor of coconut water is sweet and slightly astringent, with a pH
around 5.6 (Maciel and others 1992). There are a limited number of studies on the
analysis of coconut flavor compounds. Lin and Wilkens (1970) identified 15 aroma
compounds in coconut meat by GC/MS analysis. Among these, δ-C8 and –C10 lactones
were the major volatile components and were described as buttery, tropical-fruity and
coconut-like. The other aroma compounds were octanal, 2-heptanol, 2-octanol, 2-
nonanol, 2-undecanol, hexanol, octanol, 2-phenylethanol, benzothiazole, ethyl decanoate

14
and dodecanoic acid, that were described mostly as fruity and also as nutty, rancid, green,
lemon and rose aromas.
Jayalekshmy and others (1991) determined aroma compounds of roasted coconut
meat by GC/MS. They suggested that roasting of coconut meat led to the formation of
heterocyclic aroma compounds, especially pyrazines. The δ-lactones, alcohols, esters and
fatty acids also contributed to the overall roasted coconut flavor. They isolated acid,
neutral and basic fractions from roasted coconut by selective solvent extraction and pH
adjustment. They identified pyrazines and other heterocyclic compounds, which gave the
roasted aroma, in the basic fraction. There were twenty different types of pyrazines
identified, and their amount increased with time of roasting. The GC profile of neutral
fraction was dominated by δ-lactones, and their amount decreased from 80% to 60%
during roasting. The basic and acid fractions were dominated by pyrazines and short
chain fatty acids, respectively.
Jirovetz and others (2003) identified aroma compounds in the coconut milk and
meat of ripe coconuts from Cameroon. They extracted headspace volatiles by SPME, and
identified more than thirty compounds using GC/MS. The main components of coconut
aroma were nonanal, nonanol, heptanal, ethyl octanoate, heptanol and 2-nonanol, while
coconut meat was rich in δ-octalactone, ethyl octanoate, nonanal, nonanoic acid, decanol,
decanal and nonanol. Other short chain alcohols, aldehydes, ketones, lactones, acids and
esters were present in lower concentrations. They did not detect any γ-lactones or δ-C14
lactone that were reported in coconut meat by previous researchers. Although there are a
few studies regarding the flavor compounds in coconut meat or milk, there is no flavor
study with coconut water from immature fruit.

15
Thermal Processing Methods
Pasteurization
Pasteurization is a mild heat treatment for high-acid foods such as juices and
beverages, and low-acid refrigerated foods such as milk and dairy products. It is used in
order to inactivate vegetative cells of pathogenic microorganisms. Usually foods are
pasteurized by a low temperature long time (LTLT) process at about 145oF (63oC) for 30
min or a high temperature short time (HTST) process at about 162oF (72oC) for 15 s
(David and others 1996). The resulting shelf-life of the product is about 2 to 3 weeks
under refrigerated (lower than 7oC) conditions. The pasteurization process does not
intend to inactivate all spoilage bacteria or any heat-resistant spores, thus the product is
not commercially sterile after pasteurization (David and others 1996).
Ultrapasteurization
The objective of ultrapasteurization is similar to pasteurization but it is done at
higher temperatures with shorter exposure times and extends the shelf-life about 6 to 8
weeks under refrigeration. Foods are ultrapasterized at 280oF (138oC) or above for 2 s or
longer (David and others 1996). This process is usually used for dairy products, juices
and non-dairy creamers.
Ultra High Temperature (UHT)
Commercially sterile products are obtained by a UHT process at temperatures in
the range of 265 to 295oF (130 to 145oC) and holding times between 2 and 45 s. The
product is aseptically packaged after UHT processing in order to obtain a shelf stable
product with a shelf life of 1 to 2 years at ambient temperatures.

16
Heat Pasteurization of Juices
Common thermal processes used for juices and soft drinks are flash pasteurization,
hot filling, in-pack pasteurization and aseptic filling (Tompsett 1998, Lea 1998). Usually
flash pasteurization is done by passing juice rapidly through heated plates by HTST
treatment at 96oC for 4 s, or by standard process at 80oC for 20 s. In hot filling, the
product is heated in a heat exchanger above 80oC (typically 87oC) , sent to the filler while
hot, filled into containers and held for about 2 min. Hot fill process is adequate for acidic
beverages to obtain a shelf stable product with a shelf-life of 6 to 12 months. In-pack
pasteurization is achieved by passing completely filled closed packs through a heating
and a superheated zone, and then through a pasteurizing zone for the desired period of
time, and finally through a cooling zone. Typical in-pack processing is done at 74oC for
17 min. A special in-pack process is possible by heating the product above 100oC in a
retort and then cooling (Lea 1998, Tompsett 1998). Aseptic filling may involve HTST
pasteurization or UHT sterilization, depending on the high-acid or low-acid character of
the juice, which is then filled into sterile containers in a sterile environment (David and
others 1996).
The choice of pasteurization method depends on the level of microbial
contamination of the raw materials and packaging, the ability of the product to withstand
heat, growth potential of microorganisms and the pH of the product. In orange and
tangerine juice processing, pasteurization does not only kill microorganisms but also
inactivates pectinesterase. Normally, temperatures above 71oC are enough to kill
pathogens and spoilage bacteria in orange juice. However, temperatures between 86 and
99oC are required to inactivate pectinesterase. In commercial practice, orange and
tangerine juices are flash pasteurized by heating the juice rapidly to about 92oC for 1 to

17
40 s (Nordby and Nagy 1980). In lemon juice the pectinesterase enzyme can be
inactivated at lower temperatures (69 to 74oC), and commercial pasteurization is done at
77oC for 30 s.
Thermal processing methods have been shown to change the flavor of foods. For
example, the delicate flavor of fresh orange juice is easily changed by heat treatment.
Citrus processors and flavorists search for methods to make processed orange juice and
orange-flavored beverages taste more like fresh orange juice (Shaw 1982). Shreirer and
others (1977) reported that some volatile compounds such as α-terpineol and carveol,
which are formed by the oxidation of d-limonene, increased and the amount of terpene
hydrocarbons decreased in heat pasteurized orange juice.
Bell and Rouseff (2004) determined changes in the flavor of grapefruit juice after
heat processing. Sensory analysis of juices processed at 100ºC for 10 min indicated
formation of a heated, pineapple, metallic, and cooked off-flavor, while the initial
unheated juice had a typical fresh grapefruit character. Analysis of flavor compounds by
GC/O showed that there was at least a 45% decrease in levels of volatile compounds
associated with fresh grapefruit juice after heat processing. A corresponding increase in
compounds associated with flavor degradation such as furaneol and methional was
observed after heating.
Non-thermal Processing Methods
Non-thermal processing methods have gained increasing interest in recent years
and several emerging technologies are under intense research to evaluate their potential
as alternatives to traditional thermal methods. Traditionally, most foods are preserved by
subjecting to temperatures between 60oC to 100oC for a certain period of time (Barbosa-
Cánovas 1998). The large amount of energy transferred to food during heat treatment

18
may initiate unwanted reactions and result in undesirable changes in the physical, sensory
and nutritional quality of food.
Quality degradation is minimized using non-thermal technologies since the food
temperature is held below the temperatures used in thermal processing. Among the
emerging non-thermal technologies are ultra high pressure (UHP), high intensity pulsed
electric fields (PEF), irradiation, oscillating magnetic fields, pulsed high intensity light,
and dense phase CO2 (DPCD). UHP and irradiation are being used in commercial
operations. One of the most important issues in the commercialization of non-thermal
technologies is regulatory approval. Processes must comply with pasteurization or
sterilization requirements of Food and Drug Administration (FDA) and also ensure the
safety of equipment operators and consumers. Each of these technologies can be used for
specific food applications; some are more suitable for liquid products whereas some are
appropriate for solids. It is important to determine the quality of non-thermally processed
foods, especially in cases where the nature of the food precludes use of thermal methods.
Evaluation of sensory, nutritional and physical changes resulting from non-thermal
processes is essential (Barbosa-Cánovas 1998).
Several studies evaluated the quality of fruit juices processed by non-thermal
technologies. PEF treated orange juice had significantly higher (P<0.05) ascorbic acid,
flavor compounds and color than thermally processed orange juice (Hye and others 2000,
Min and others 2003). Jia and others (1999) showed that there was 10 to 40% loss in the
major orange juice flavor compounds after heat pasteurization while 0 to 5% losses
occurred for the same compound with PEF processing. Ayhan and others (2002) reported
that PEF processing did not alter sensory evaluation of flavor and color of fresh orange

19
juice. Similarly, Min and others (2003) reported higher sensory scores for flavor and
overall acceptability of PEF treated tomato juice compared to heat pasteurization. Apple
juice retained fresh like ascorbic acid levels and color after PEF processing (Akdemir and
others 2000, Liang and others 2003).
UHP processing at pressures between 100 to 800 MPa has been reported to be
effective in inactivation of pathogens without affecting taste or nutritional value of fresh
juices (Morris 2000). UHP treated citrus juices retained a fresh-like flavor with no loss of
vitamin C and a shelf-life of approximately 17 months (Farr 1990). Polydera and others
(2003) compared shelf-life and ascorbic acid retention of reconstituted orange juice
processed by heat at 80oC for 30 s with that of UHP processed juice (500 MPa, 35oC, 5
min). UHP processing resulted in 24% to 57% increase in the shelf-life compared to
thermal pasteurization. Sensory characteristics of UHP pasteurized juice were rated
superior and ascorbic acid retention was higher.
FDA’s juice HACCP regulations require validation of 5 log pathogen reduction for
juice manufacturers. Dense phase CO2 (DPCD) is one of the emerging non-thermal
technologies that conforms to this requirement and has a great potential for commercial
use in juice pasteurization.
Dense Phase Carbon Dioxide Technology
Mechanisms of Microbial Inactivation by DPCD
Several hypotheses have been proposed to explain the lethal effects of DPCD on
microorganisms. Although the exact means are not clear, studies show that several
mechanisms may be involved. DPCD was claimed to inactivate microorganisms by:

20
pH lowering effect
CO2 can lower pH when dissolved in the aqueous part of a solution by forming
carbonic acid. Carbonic acid further dissociates to give bicarbonate, carbonate and H+
ions lowering extra-cellular pH by the following equations:
Meyssami and others (1992) predicted the pH of simple model liquid foods under
DPCD and obtained good correlations with the experimentally measured pH values. They
found that the presence of dissolved materials other than CO2 such as acids and salts had
a reducing effect on the lowering of pH by DPCD treatment (Figure 2-3).
0 10 20 30
Process Pressure, P(MPa)
pH
7
6
5
4
3
2
1
Measured pH Predicted pH
Figure 2-3. Measured and calculated pH of pure water pressurized with CO2 up to 34.5
MPa
3222 COHOHCO ↔+
−+ +↔ 332 HCOHCOH pKa = 6.57
233
−+− +↔ COHHCO pKa = 10.62

21
However, the internal pH of microbial cells, not the external pH, has the largest
effect on cellular destruction. When there is a sufficient amount of CO2 in the
environment, it can penetrate through the cell membrane, which consists of phospholipid
layers, and lowers internal pH by exceeding the buffering capacity of the cell. Normally,
cells have to maintain a pH gradient between the internal and external environments.
Cellular systems actively pump hydrogen ions from the inside to the outside of the cell.
These systems can be overwhelmed with sufficient CO2, reducing internal pH. It is
believed that reduced internal pH may inactivate microorganisms by the inhibition of
essential metabolic systems including enzymes (Daniels and others 1985, Ballestra and
others 1996). Ballestra and others (1996) measured the activities of eight enzymes from
E.coli cells before and after DPCD treatment (5 MPa, 15 min, 35oC). These enzymes
were selectively inactivated. The activity of some enzymes having an acidic isoelectric
point such as alkaline phosphatase and β-galactosidase disappeared, whereas those with
basic isoelectric points such as acid phosphatase were slightly affected.
Hong and Pyun (2001) treated L.plantarum cells by DPCD under 7 MPa at 30oC
for 10 min, and measured activity of 13 different enzymes. They also observed that
enzymes were inactivated selectively. Some enzymes such as cystine arylamidase, α-
galactosidase, α- and β--glucosidase lost their activities significantly, whereas enzymes
such as lipase, leucine arylamidase, and acid and alkaline phosphatase were little affected
by DPCD treatment. At the same time, cell viability of L.plantarum decreased by more
than 90% under these conditions. They concluded that it was uncertain whether the
observed inactivation of some enzymes was a primary cause of cell death. Evidence in

22
the literature does not specify which of the enzymes mentioned are critical for survival
and therefore vital in their inactivation.
Inhibitory effect of molecular CO2 and bicarbonate ion
Another suggestion to explain inactivation of bacterial enzymes is the inhibitory
effect of CO2 itself on some enzymes (Ishikawa and others 1995a). Weder (1990) and
Weder and others (1992) claimed that under a low pH environment, arginine could
interact with CO2 to form a bicarbonate complex, and inactivate the enzyme containing
this amino acid. Jones and Greenfield (1982) have shown that decarboxylases are
inhibited by excess CO2, breaking the metabolic chain (Spilimbergo and Bertucco 2003).
Ishikawa and others (1995a) obtained complete inactivation of alkaline protease
and lipase at 35oC and 15 MPa treatment by using a micro-bubble system. They
compared residual activity of these enzymes by supercritical CO2 (SCCO2) to that of low
pH (3.0) and concluded that alkaline protease could be inactivated due to pH lowering by
dissolved CO2; whereas lipase must have been inactivated by a different mechanism.
They also conducted a study with glucoamylase and acid protease, showing that a higher
SCCO2 density resulted in lower residual activity of these enzymes. As a result, they
claimed that inactivation of these enzymes could be caused by the sorption of CO2 into
the enzyme molecules.
Another mechanism proposed is precipitation of intracellular calcium and
magnesium ions by the effect of carbonate (Lin and others 1993). When the applied CO2
pressure is released, bicarbonate converts to carbonate, which can precipitate intracellular
calcium, magnesium and similar ions from the cell and cell membrane. Calcium-binding
proteins are known as the most important class involved in intracellular regulation
(Aitken 1990). Certain types of calcium- and magnesium-sensitive proteins could be

23
precipitated by carbonate, depending on the binding site of the ion and chemical structure
of the protein. Consequently, a lethal change to the biological system is produced (Lin
and others 1993).
Physical disruption of cells
The first suggested mechanism of inactivation of microorganisms by DPCD was
the physical disruption of cells (Fraser 1951). E.coli cells were almost totally killed under
50.7 MPa in less than 5 min and were thought to burst due to the rapid release of applied
gas pressure and the expansion of CO2 gas within the cell during depressurization.
However, the extent of bursting of cells was determined by the Petroff-Hauser counting
method that uses a microscope for direct cell counting. Therefore, it is hard to conclude if
the cells were actually burst without observation with an electron microscope. Other
researchers investigated the physical rupture of cells by DPCD as a possible mechanism
of inactivation (Lin and others 1991, Nakamura and others 1994, Isenschmid and others
1995, Ishikawa and others 1995b, Ballestra and others 1996, Dillow and others 1999,
Hong and Pyun 1999, Spilimbergo and others 2003, Folkes 2004). Lin and others (1991)
claimed that yeast (S.cerevisiae) cells could be ruptured by pressurized CO2 under 6.9-
34.4 MPa for 5 to 15 h treatments. They measured total protein concentration in the
supernatant of treated cells as an indication of cell rupture, however they did not have a
direct physical observation of cells. They have shown that the amount of total proteins
released in the supernatant of DPCD treated cells was about the same amount as in the
supernatant of cells autolyzed by other disruption methods. The leakage of the proteins
into the environment depends on the size of the breach in the cell membrane. Nakamura
and others (1994) demonstrated mechanical rupture of yeast cells by DPCD treatment (4
MPa, 40oC for 5 h) by scanning electron micrographs. They observed that some cells

24
were completely burst whereas some only lost surface smoothness and had some wrinkles
or holes on the membrane surface. Folkes (2004) also observed physical disruption of
yeast cells in beer by scanning electron micrographs (Figure 2-4). The process conditions
in a continuous dense phase CO2 pasteurizer were: pressure 27.5 MPa, temperature 21oC,
CO2/beer ratio (10%), and residence time of 5 min.
Although cell rupture is possible during DPCD treatment, it is not necessary for
cell inactivation. For instance, Ballestra and others (1996) treated E.coli cells at 5 MPa
and 35oC, and observed that more than 25% of cells had intact cell walls while the
viability was only 1%. They did not observe cell rupture or burst, but only some signs of
deformation in cell walls. There have been studies showing that cells were completely
inactivated even when they remained intact after treatment. For example, Hong and Pyun
(1999) demonstrated that L. plantarum cells treated with CO2 at 6.8 MPa and 30oC for 60
min were completely inactivated but SEM micrographs did not show any cell rupture.
The morphological changes caused by DPCD may differ based on treatment conditions,
gas release rate, or the type of microorganism. Dillow and others (1999) observed that
SEM micrographs of S.aureus (Gram(+)), P.aeruginosa (Gram(-)), and E.coli (Gram(-))
cell walls were largely unchanged before and after DPCD treatment. However, they
found that Gram(-) cells had more defects on the cell wall after treatment. They explained
this by Gram(-) cells having thinner cell walls compared tocompared to Gram(+) cells.

25
Figure 2-4. Scanning electron micrographs (SEM) of untreated (a) and DPCD treated (b)
S.cerevisiae cells
It is important to note here that cells without any rupture, i.e., with intact cell walls
could show modifications or damage in microstructural observations.
Modification of cell membrane and extraction of cellular components
Another mechanism suggested by researchers is based on the lipo- and
hydrophilicity and solvent characteristics of CO2. Kamihira and others (1987) mentioned
extraction of intracellular substances such as phospholipids by DPCD as one of the
possible mechanisms of microbial inactivation. Isenchmid and others (1995) proposed
that molecular CO2 diffused into cell membrane and accumulated there, since the inner
layer is lipophilic. Accumulated CO2 increased fluidity of the membrane due to the order
loss of the lipid chains, also called the “anesthesia effect”, and the increase of fluidity
causes an increase in permeability. Lin and others (1992) suggested that once CO2 has
penetrated into the cell, it could extract cellular components and transfer extracted
materials out of the cell during pressure release. Upon extraction of essential lipids or
other vital components of cells or cell membranes, the cells are inactivated. These
hypotheses have been investigated by several researchers either by measuring the amount

26
of materials in the supernatant of treated cells or by some microstructural observations on
the treated cells.
Hong and Pyun (1999) have shown that although SEM observations of L.plantarum
cells had demonstrated intact cell walls after DPCD treatment, microstructural
observations by transmission electron micrographs (TEM) showed modifications in the
cell membrane with possible leakage of cytoplasm (Figure 2-5). These pictures show
enlarged periplasmic space between cell walls and the cytoplasmic membranes, and
empty spaces in the cytoplasm. In a further study in 2001, Hong and Pyun have shown
that cells treated with DPCD at 7 MPa for 10 min and 30oC showed irreversible cellular
damage including loss of salt tolerance, leakage of UV-absorbing substances, release of
intracellular ions and impaired proton permeability. They have also used Phloxine B
staining on L.plantarum cells as an indication of loss of cell membrane integrity, and
shown that cell membrane has lost its integrity immediately after being exposed to high
pressure CO2.
Figure 2-5. Transmission electron micrographs (TEM) of untreated (a) and DPCD (b,c)
treated L.plantarum cells at 7 MPa, 30oC, 1 h
Although the strongest effect of the above mechanisms on microbial destruction by
DPCD is still in question, researchers agree in the governing role of CO2. Several
researchers have concluded that CO2 has a unique role in inactivation of cells (Haas and

27
others 1989, Wei and others 1991, Lin and others 1992, Nakamura and others 1994,
Ballestra and others 1996, Dillow and others 1999, Hong and Pyun 2001).
Haas and others (1989) observed that altering external pH by acids such as
phosphoric and hydrochloric did not cause as much cell inactivation as CO2. These acids
cannot enter cells easily as CO2. This implied that the ability of CO2 to penetrate through
the cell membrane has a key role in reducing the internal pH of cells. Similarly, Wei and
others (1991) added 0.1N HCl to the Listeria suspension to decrease pH by about 1.8
units. The same amount of pH reduction was achieved by treatment of cells with CO2
under 6.18 MPa for 2 h. The acidification by HCl did not cause a microbial reduction
whereas treatment with CO2 caused complete inactivation.
Alternatively, Nakamura and others (1994) have shown that N2 gas when applied
under the same conditions as CO2 (4 MPa, 40oC, 4 h) did not have an effect on viability
of yeast cells. Lin and others (1992) have shown that 90% of cells survived after
treatment with N2 under 6.9 MPa for 20 and 40 min whereas complete inactivation was
achieved after treatment with CO2 in less than 12 min. Similarly, Dillow and others
(1999) applied tetrafluoroethane (TFE) to bacterial cells at 38oC and 11 MPa for 45 min
and compared the viability of cells with treatment of CO2 under the same conditions.
Although TFE did not result in reduction of viable cells, total inactivation was achieved
by CO2 treatment.
Inactivation of Vegetative Cells by DPCD
There are a number of studies showing that DPCD is effective in killing vegetative
forms of pathogenic and spoilage bacteria, yeasts and molds. A summary of these studies
is given in Table 2-6 including the media, treatment conditions, microorganisms, their log
reduction, and the type of system used. The microbial inactivation achieved by DPCD

28
changed from 2 and 12 logs, pressures under 50 MPa, and temperatures between 5oC to
60oC, mostly in the 25-35oC range. Treatment times were significantly different
depending on the treatment system used and could be as long as 6 h when batch systems
were used, to as low as 2.5 min for continuous or semi-continuous systems.
Water activity (aw) of treatment medium and water content of the vegetative cells
were shown to have a significant role in the killing effect of DPCD. Kamihira and others
(1987) compared inactivation of wet (70-90% water) and dry (2-10% water) cells of
Baker’s yeast, E.coli and S.aureus by DPCD treatment at 20 MPa for 2 h and 35oC. Dry
cells were inactivated by less than 1 log whereas wet cells were inactivated by 5 to 7 logs.
Haas and others (1989) showed that DPCD was more effective as aw of the food
increased. Kumagai and others (1997) studied sterilization kinetics of S. cerevisiae cells
at various water contents and CO2 pressures. The first order sterilization rate constant, k,
was almost zero at water contents below 0.2 g/g dry matter, and increased with increasing
water content. This increase was slight at water contents above 1g/g dry matter.
Moreover, k increased with increasing CO2 pressure at an identical water content of cells.
Similarly, Dillow and others (1999) compared inactivation kinetics of E.coli cultures in
the presence and absence of water in the cell culture when treated with DPCD at 34oC
and 14 MPa. They observed that small amounts of water greatly enhanced the sterilizing
effect of DPCD. It is important to note that water content of treatment medium and
therefore the water content of the cells would increase CO2 solubility in the cells, which
would explain increased microbial inactivation.
The unique role of CO2 in the inactivation of microbial cells has been shown by
many researchers and the details of their studies were listed in the “Mechanisms” section.

29
Generally, any effect that increases the level and rate of CO2 solubility, and therefore,
penetration of CO2 into cells in a treatment medium enhances microbial inactivation by
DPCD. For instance, CO2 solubility increases with increasing pressure, other conditions
being equal. However, this increase is limited by the saturation solubility of CO2 in the
medium. Generally, inactivation efficiency increases with higher pressure, temperature
and residence time. Nakamura and others (1994) demonstrated that the bactericidal effect
of CO2 treatment on baker’s yeast dramatically increased by increasing pressure from 2
to 4 MPa, by increasing temperature from 20 to 40oC, and by increasing treatment time
from 0.5 h to 3 h. Hong and others (1999) achieved a 5 log reduction for L.plantarum by
DPCD at 30oC. It took 50 to 55 min to achieve this reduction at 6.9 MPa while it took
only 15-20 min to achieve the same level of reduction at 13.8 MPa. Isenschmid and
others (1995) showed that viability of Kluveromyces fragilis, S.cerevisiae, and Candida
utilis decreased with increasing CO2 pressure following a typical S-shaped curve. Sims
and Estigarribia (2002) showed that once the treatment medium is fully saturated with
CO2, the killing effect of DPCD did not change significantly with the enhancing effects
of pressure or temperature. For example, 7.5 MPa was nearly as effective as 15 MPa, and
room temperature was as effective as 31oC in reducing E.coli cells by using a membrane
contactor system. This can be explained by the rapid increase of CO2 solubility in water
with increasing pressure up to 7.5 MPa, but pressure increases above 7.5 MPa result in
small increases in solubility (Dodds and others 1956).
On the other hand, temperature has a more complex role in increasing microbial
inactivation by DPCD. Although solubility of CO2 decreases with increasing
temperatures, higher temperatures can increase the diffusivity of CO2 and the fluidity of

30
cell membrane that facilitate penetration of CO2 into the cells. Another important effect
of temperature is the phase change of CO2 from sub-critical to supercritical conditions
(Tc = 31.1oC). The penetrating power of CO2 is higher under supercritical conditions, and
there is a rapid change in solubility and density of CO2 by temperature at the near-critical
region. Hong and Pyun (1999) observed that under a constant pressure of 6.8 MPa,
microbial inactivation of L. plantarum increased by a log as temperature decreased from
40oC (7 log reduction) to 30oC (8 log reduction). They explained this less effective
inactivation at 40oC by the decrease in solubility of CO2 in this region.
Initial pH of treatment medium is an important factor affecting microbial reduction
by DPCD. Low pH environment facilitates penetration of carbonic acid, like many other
carboxylic acids (Lindsay, 1976) through the cell membrane, therefore more inactivation
is achieved as the medium pH decreases. For example, Hong and Pyun (1999)
demonstrated that under a CO2 pressure of 6.8 MPa at 30oC, treatmens of 25 min in
acetate buffer (pH 4.5), 35 min in sterile distilled water (pH 6.0) and 60 min in phosphate
buffer (pH 7.0) were required to achieve 5 log reduction of L.plantarum cells.
Cell growth phase or age is another factor affecting inactivation of microbial cells
by DPCD. Young cells are more sensitive than mature ones. Hong and Pyun (1999)
compared inactivation of L.plantarum cells in log phase with those in stationary phase,
and found that cells in the late log phase were more sensitive to DPCD than those in the
stationary phase. They attributed this to the ability of bacteria entering the stationary
phase of growth to synthesize new proteins that protect cells against adverse
environmental conditions (Koltter 1993, Mackey and others 1995).

31
Different types of bacteria have different susceptibilities to DPCD treatment. It is
hard to make comparisons since the treatment systems, solutions or conditions also differ
in these studies. Referring to specific studies, it can be concluded that some
microorganisms seem more affected by DPCD treatment. For example, Sims and
Estigarribia (2002) showed that Lactobacillus plantarum cells were more resistant to
DPCD than E.coli, S. cerevisiae and Leuconostoc mesenteroides cells. Dillow and others
(1999) treated G(+) bacteria (S. aureus, B. cereus, L. innocua) and G(-) bacteria (S.
salford, P. vulgaris, L. dunnifii, P. aeruginosa and E.coli) with DPCD. They found that
B.cereus cells were more resistant to DPCD while E.coli and P.vulgaris were more
sensitive. They suggested that the nature of the cell wall could be an important factor in
the difference in sensitivity of these bacteria. Because of their thin cell walls, G(-)
bacteria are expected to be more sensitive and their cell wall could be ruptured more
easily than that of the G(+) bacteria. More studies need to be conducted in this area to
have a clear conclusion.
The type of system used for DPCD treatment can change the microbial inactivation
rate by DPCD. Treatment systems that allow better contact of CO2 with the treatment
solution are shown to be more effective in microbial reduction because of the more rapid
saturation of the solution with CO2. Usually, batch systems require longer treatment times
in order to be effective in microbial inactivation compared to continuous systems. On the
other hand, it is possible to increase the inactivation rate of batch systems by agitation
(Lin and others 1993, Hong and Pyun 2001). Spilimbergo and others (2003) showed that
a semi-continuous system is more efficient than a batch system. Treatment of 40 to 60
min was necessary for inactivation of a wide range of bacteria with the batch system,

32
whereas less than 10 min was enough by using a semi-continuous system. Ishikawa and
others (1995b) obtained more than 4 orders and 3 orders higher inactivation in L.brevis
cells and S.cerevisiae, respectively, by using a micro-bubbling filter in their system.
Table 2-6. Summary of the studies on inactivation of various microorganisms Solution Microorganism P
(MPa) Time Temp.
(oC) System Log
redn. Reference
aPS S.cerevisiae 20 2 h 35 Batch 7.5 (gC)
Kamihira and others 1987
E.coli 20 2 h 35 6.5 (C) S.aureus 20 2 h 35 5 (C) A.niger 20 2 h 35 5 (C) Herbs Total bacteria
count 5.52 2 h 45 Batch 5-8 (C) Haas and
others 1989 Apple juice Total bacteria
count 5.52 30 min 45 >3 (C)
Orange juice Total bacteria count
5.52 30 min 55 4 (C)
Nutrient broth
E.coli
6.21 2 h Room temp.
2
S.aureus 6.21 2 h Room temp.
2
Salmonella seftenberg
6.21 2 h Room temp.
2
Distilled water
L.monocytogenes 6.18 2 h 35 Batch 9 (C) Wei and others 1991
Egg yolk S.thyphimurium 13.7 2 h 35 >8 Orange juice Total plate count
(TPC) 33 1 h 35 Batch 2 Arreola and
others 1991b Growth medium
S.cerevisiae 6.9 15min 35 Batch 7 (C) Lin and others 1992
Growth medium
L.dextranicum 6.9 -21min
15-20 min
35 Batch >8 Lin and others 1993
Sterile water S.cerevisiae 4 >3 h 40 Batch 8 (C) Nakamura and others 1994
PS L.brevis 25 30 min 35 Micro-bubble
6 (C) Ishikawa and others 1995b
S.cerevisiae 25 30 min 35 6 (C) PS E.coli 5 20 min 35 Batch 6 (C) Ballestra and
others 1996 Sterile Water
S.cerevisiae 15 1 h 40 Batch 8 Kumagai and others1997
bMRS broth Lactic acid bacteria
6.9 200 min 30 Batch 5 Hong and others 1997
cBHIB S.aureus 8 60 min 25 Batch 7 (C) Erkmen 1997 Whole milk Aerobic plate
count 14.6 5h 25 Batch >8

33
Table 2-6 Continued Solution Microorganism P
(MPa) Time Temp.
(oC) System Log
redn. Reference
dTSB w/ polymers
B.cereus 20.5 4 h 60 Batch 8 (C) Dillow and others 1999
L.innocua 20.5 0.6 h 34 9 (C) S.aureus 20.5 4 h 40 9 (C) S.salford 20.5 4 h 40 9 (C) P.auruginosa 20.5 4 h 40 8 (C) E.coli 20.5 0.5 h 34 8 (C) P.vulgaris 20.5 0.6 h 34 8 (C) L.dunnifi 20.5 1.5 h 40 4 (C) Growth medium
L.plantarum 13.8 30 min 30 Batch >6 (C) Hong and others 1999
ePS with broth
L.monocytogenes 6 75 min 35 Batch 6.98 (C) Erkmen 2000a
PS E.faecalis 6.05 18 min 35 Batch 8 (C ) Erkmen 2000b
Fruit juice- milk
E.faecalis 6.05 3-6 h 45 5 (C )
PS Brocothirix thermosphacta
6.05 100 min
35 Batch 5.5 (C) Erkmen 2000c
Skinned meat
Brocothirix thermosphacta
6.05 150 min
35 Batch 5 (C)
MRS broth L.plantarum 7 100 min
30 Batch >8 Hong and Pyun 2001
PS S.thyphimurium 6 15 min 35 Batch 7 (C) Erkmen and Karaman 2001
PS w/broth S.thyphimurium 6 140 min
25 Batch 7 (C)
Whole milk E.coli 10 6 h 30 Batch 6.42 (C) Erkmen 2001 Skim milk E.coli 10 6 h 30 Batch 7.24 (C) PS B.subtilis 7.4 2.5 min 38 SCh 7 (C) Spilimbergo
and others 2002
P.aeruginosa 7.4 2.5 min 38 7 (C) Sterile water E.coli 7.5 5.2 min 24 CMi 8.7 Sims and
Estigarribia 2002
Orange Juice
E.coli 15 4.9 min 24 >6
Orange juice L.mesenteroids 15 <10 min
25 >6
Orange juice S.cerevisiae 15 <10 min
25 12
Orange juice L.plantarum 7.5 <10 min
35 >8
Orange juice S.thyphimurium 38 10 min 25 CF 6 Kincal and others 2005
Orange juice L.monocytogenes 38 10 min 25 6 Orange juice E.coliO157:H7 107 10 min 25 5 Apple juice E.coliO157:H7 20.6 12 min 25 5.7

34
Table 2-6 Continued Solution Microorganism P
(MPa) Time Temp.
(oC) System Log
redn. Reference
Carrot juice Aerobic plate count
4.9 10 min 5 Batch 4 Park,and others 2002
fWM juice
Aerobic plate count
34.4 5 min 40 CF 6.5 Lecky 2005
Mandarin juice
Aerobic plate count
41.1 9 min 35 CF 3.47 Lim and others 2006
Coconut water
Aerobic plate count
34.5 6 min 25 CF >5 Damar and Balaban 2005
aPS: Physiological Saline, bMRS: De Man Rogosa Sharpe, cBHIB: Brain-Heart Infusion Broth, dTSB: Tryptic Soy Broth , eCF: Continuous flow, fWM: Watermelon, gC: Complete inactivation, hSC: Semi-continuous, iCM: Continuous membrane Inactivation of Spores by DPCD
Spores are highly resistant forms of bacteria to the physical treatments such as heat,
drying, radiation and chemical agents (Watanabe and others 2003a). A limited number of
studies in the literature investigating inactivation of spores by DPCD show that the extent
of inactivation achieved changes with treatment conditions, treatment systems and the
type of organism (Table 2-7).
Studies suggested that processing temperature had a significant role in inactivation
of spores by DPCD. Several researchers observed that a temperature threshold should be
exceeded in order to achieve a killing effect on bacterial or fungal spores (Enomoto and
others 1997, Ballestra and Cuq 1998, Watanabe and others 2003b). This threshold
temperature can be different for different spores. Kamihira and others (1987) did not
observe any killing effect of DPCD on B. stearothermophilus spores and observed only
53% inactivation of B.subtilis spores by DPCD treatment at a relatively low temperature
(35oC). Enomoto and others (1997) showed that there was not a significant inactivation of
B.megaterium spores at temperatures below 50oC, and survival ratio of spores decreased
dramatically by increasing temperature from 50 to 60oC. On the other hand, Ballestra and
Cuq (1998) did not observe antimicrobial activity of DPCD treatment on B.subtilis spores

35
and Byssochlamys fulva ascospores below 80oC, and on A.niger conidia below 50oC.
Similarly, Watanabe and others (2003b) observed that DPCD treatments at temperatures
in the range of 35oC to 85oC did not have a killing effect on Geobacillus
stearothermophilus spores. However, it may be possible to achieve significant amounts
of spore inactivation at relatively low temperatures by using continuous DPCD treatment
systems that are shown to be more efficient than batch systems. For instance, Ishikawa
and others (1997) achieved 6 log reduction in B. polymyxa, B.cereus, and B. subtilis
spores at 45oC, 50oC and 55oC, respectively, by using a continuous micro-bubble system.
Micro-bubbling by the use of a filter improved the inactivation of spores by 3 log cycles.
There was only 1 log reduction of spores without micro-bubbling and 4 log reduction
with micro-bubbling under the same treatment conditions.
The mechanism of inactivation of spores by DPCD is not known. Watanabe and
others (2003a) compared the killing effect of DPCD with heat and high hydrostatic
pressure (HHP) treatments. DPCD had more lethality than HHP treatment or heat
treatment alone, showing that CO2 had a unique role in inactivation. They suggested that
inactivation mechanisms of bacterial spores by DPCD and heat were different, since
inactivation of Bacillus spores by heat treatment occurred in a single step whereas
inactivation by DPCD occurred in two steps. Ballestra and Cuq (1998) also observed two
steps in the inactivation of B.subtilis spores at 5 MPa CO2 and 80oC. They suggested that
the first step of inactivation could represent penetration of CO2 into the cells that is
associated with heat activation of the dormant spores. Heat activation can make spores
more sensitive to the antimicrobial effects of CO2. However, there may be another
explanation for spore inactivation by DPCD based on the study of Furukawa and others

36
(2004). This study believes that DPCD is able to germinate bacterial spores even at
relatively low treatment temperatures. Approximately, 40% of B. coagulans and 70% of
B. licheniformis spores were germinated by DPCD at 6.5 MPa and 35oC. Therefore,
DPCD could be the reason for germination of spores making the resulting vegetative cells
more sensitive to heat inactivation. The study of Watanabe and others (2003a) shows that
inactivation of B. coagulans and B. licheniformis spores by heat treatment only is much
lower than inactivation obtained when a combination of DPCD and the same heat
treatment is applied. In the combined treatment, DPCD is applied first and heat is applied
afterwards. Their study suggests that DPCD may decrease heat tolerance of bacterial
spores. The calculated z values with and without DPCD were the same. However, the D
values with DPCD were much smaller, indicating an upward shift in the log inactivation
vs. time curve with DPCD. The role of DPCD and heat treatments in spore inactivation
needs to be investigated more explicitly.
Table 2-7. Summary of studies on spore inactivation by DPCD Solution Microorganism Pressure
(MPa) Time Temp
(oC) System Log
redn. Reference
Sterile water
B.subtilis
20 2 h 35 Batch 0.3 Kamihira and others 1987
Growth medium
P.roqueforti 5.52 4 h 45 Batch >6 Haas and others 1989
Sterile distilled water
B. megaterium 5.8 30 h 60 Batch 7 Enomoto and others 1997
B. polymyxa 30 60min 45 Micro-bubble
6 Ishikawa and others 1997
B.cereus 30 60min 50 6
aPS
B.subtilis 30 60min 55 6 B.subtilis 5 1 h 80 Batch 3.5 Ballestra and Cuq
1998 B. fulva ascospores 5 1 h 80 Batch 0.7
Sterile Ringer solution
Sterile water
B.stearothermophilus 20 2 h 35 Batch 0

37
Table 2-7 Continued Solution Microorganism Pressure
(MPa) Time Temp
(oC) System Log
redn. Reference
S.cerevisiae ascospores
15 <10min 45 Continuous Membrane
filter
>6 Sims and Estigarribia 2002
Alicyclobacillus acidoterretis spores
7.5 <10min 45 >6
Orange juice
G.stearothermophilus 30 2 h 95 Batch 5 Watanabe and others 2003b
aPS: Physiological saline Inactivation of Enzymes by DPCD
Inactivation of certain enzymes that affect the quality of foods by DPCD has been
shown by several researchers (Balaban and others 1991a&b, Chen and others
1992&1993, Tedjo and others 2000, Park and others 2002). A summary of the literature
including the enzymes treated with DPCD, the amount of activity loss achieved in these
treatments and DPCD treatment conditions is given in Table 2-8. DPCD can inactivate
certain enzymes at temperatures where thermal inactivation is not effective (Balaban and
others 1991a). Among these enzymes, pectinesterase (PE) causes cloud loss in some fruit
juices; polyphenol oxidase (PPO) causes undesirable browning in fruits, vegetables,
juices and some seafood; lipoxygenase (LOX) causes chlorophyll destruction and off-
flavor development in frozen vegetables; and peroxidase (POD) has an important role in
discoloration of foods and is used as an index for efficacy of heat treatment in processing
fruits and vegetables. The PE, PPO, POD and LOX from various foods were shown to be
effectively inactivated by DPCD. Although the number of studies on enzyme inactivation
by DPCD is limited, the studies conducted so far point to the potential of DPCD
technology in especially fruit and vegetable juice processing, where these enzymes cause
quality deterioration if not inactivated.

38
Studies suggest that enzyme inactivation by DPCD could be due to several causes
such as pH lowering, conformational changes of the enzyme, and inhibitory effect of
molecular CO2 on the enzyme.
Balaban and others (1991a) studied the inactivation of PE in orange juice by
DPCD. The pH of orange juice must be lowered to 2.4 for substantial PE inactivation.
However, by DPCD treatment pH of orange juice was lowered only to 3.1. Therefore,
pH-lowering alone was not sufficient to explain enzyme inactivation by DPCD. The
results of Chen and others (1992) support their approach. They used a pH control and
measured the activity of lobster PPO that was kept under pH of 5.3, which is the same as
the pH of samples achieved by DPCD treatment. Although the pH control sample
retained 35% of its original activity at 35oC after 30 min, DPCD treated enzyme lost its
activity after 1 min at the same temperature.
CO2 was suggested to have a unique role in the inactivation of enzymes. Balaban
and others (1993) applied the following treatments to orange juice and observed the
decrease of PE activity. Untreated control had a decrease in PE activity of 8% after 20
days storage. Supercritical CO2 treatment (31 MPa, 40oC, 45 min) showed 31%
reduction; juice acidified with HCl to pH=3.1 and pressurized with N2 (24 MPa, 40oC, 45
min) had a 36% reduction; juice buffered to pH=3.8 with citrate buffer, then treated with
supercritical CO2 (31 MPa, 40oC, 45 min) reduced PE by 23%; juice pressurized with N2
(20.6 MPa, 55oC, 1 h) showed an increase in PE activity. These results suggest that the
buffered juice PE activity decreased only by the molecular effect of CO2, while the
unbuffered CO2 combined the effects of pH lowering and CO2 effects. Pressurized N2 did

39
not lower activity. Similarly, Chen and others (1993) have shown that N2 treatment
under the same conditions as CO2 treatment did not cause any inactivation of PPO.
Table 2-8. Summary of studies on inactivation of enzymes by DPCD Enzyme Source of
enzyme Pressure (MPa)
Time Temp (oC)
System Loss of activity
(%)
Reference
Lipase Commercial (62-68% water)
20 2 h 35 Batch 12-22 1
α-amylase Commercial (62-68% water)
20 2 h 35 0
Gluco-amylase
Commercial (5-7% water)
20 1 h 35 Batch 0 2
Catalase Commercial (5-7% water)
20 1 h 35 10
Lipase Commercial (5-7% water)
20 1 h 35 0
Glucose isomerase
Commercial (5-7% water)
20 1 h 35 0
PEa Orange juice 26.9 145 min 56 Batch 100 3 PPOb Spiny lobster 5.8 1 min 43 Batch 98 4 PPO Brown shrimp 5.8 1 min 43 78 PPO Potato 5.8 30 min 43 91 PPO Spiny lobster 0.1 30 min 33 Batch 98.5 5 LOXc Soybean 10.3 15 min 50 Batch 100 6 PODd Horseradish 62.1 15 min 55 100 LOX Soybean 62.1 15 min 35 95 PPO Carrot juice 4.9 10 min 5 Batch 61 7 LOX Carrot juice 2.94 10 min 5 >70 PPO Muscadine
grape juice 27.6 6.25 min 30 Continuous
flow 75 8
aPE: Pectinesterase, bPPO: Polyphenol oxidase, cLOX: Lipoxygenase, dPOD: Peroxidase 1Kamihira and others 1987, 2 Taniguchi and others 1987,3 Balaban and others 1991b, 4Chen and others 1992, 5 Chen and others 1993, 6 Tedjo and others 2000, 7 Park and others 2002, 8Del Pozo-Insfran and others 2006
DPCD can change isoelectric profiles and protein patterns of PPO (Chen and others
1992). However, these changes were not caused by CO2 under atmospheric pressure
(Chen and others 1993). Chen and others (1992) obtained Circular Dichroism spectra of
untreated and treated lobster, brown shrimp and potato PPOs. Their results showed that
DPCD caused conformational changes in the secondary structures (α-helix, β-sheet, β-
turn and random coil) of the enzymes. High pressure is also reported to cause

40
conformational changes in protein and enzyme molecules (Suzuki and Taniguchi 1972).
On the other hand, Hendrickx and others (1998) reported that pressures around 310 MPa
can cause irreversible damage to the secondary structure of proteins, but pressures below
it cause no change or changes that are reversible upon depressurization. DPCD pressures
are very much lower than 310 MPa, therefore, the conformational changes occurring by
DPCD may not be caused by a high pressure effect. This needs to be confirmed by
further research.
Extent of enzyme inactivation by DPCD is affected by the type and source of the
enzyme, DPCD treatment conditions such as pressure, temperature and time, and
treatment medium properties. Balaban and others (1991a) observed that higher
temperatures and pressures of DPCD treatment results in higher %PE inactivation. An
enzyme isolated from different sources has different resistance to DPCD treatment, as is
the case with heat inactivation. For example, potato PPO is more resistant to inactivation
by DPCD compared to spiny lobster and shrimp PPOs (Chen and others 1992). The
presence of other soluble compounds in the treatment medium may have a protective
effect against DPCD treatment. Tedjo and others (2000) showed that %LOX and %POD
activity increased by increasing sucrose concentration up to 40%. This could be
explained by decrease in the solubility of CO2 as sucrose concentration increases.
DPCD treatment is reported to be more effective than heat treatment in enzyme
inactivation and can inactivate enzymes at much lower pressures compared to High
Hydrostatic Pressure, an alternative non-thermal processing method. Significant amounts
of inactivation of PE, PPO, LOX and POD are possible by DPCD at temperatures lower
than 55oC. Park and others (2002) achieved significant inactivation of LOX and PPO in

41
carrot juice at a temperature as low as 5oC. Heating at 55oC for 30 min results in only
about 18% and 13% inactivation of LOX and POD, respectively, while DPCD results in
total inactivation of these enzymes after 15 min treatment at the same temperature.
DPCD Treatment Systems
Several batch, semi-continuous and continuous treatment systems have been
developed since the first DPCD applications. In a batch system, CO2 and treatment
solution are stationary in a container for a certain period of time during treatment. A
semi-continuous system allows a continuous flow of CO2 through the treatment chamber,
while a continuous system allows continuous flow of both CO2 and the treatment solution
through the system.
Most of earlier studies have been performed using batch systems. A typical batch
system consists of a CO2 gas cylinder, a pressure regulator, a pressure vessel, a water
bath or heater, a CO2 release valve, and a data logger (Figure 2-6) (Hong and Pyun 1999).
At the beginning of the operation, the sample solution is placed into the pressure vessel
and temperature is set to the desired value. Next, CO2 is introduced into the vessel until
the sample in the vessel is saturated at the desired pressure and temperature. The sample
solution is left in the vessel for a certain amount of time and then the CO2 outlet valve is
opened to release the gas. Some systems contain an agitator that decreases the time to
saturate the sample solution with CO2.

42
Figure 2-6. A typical batch DPCD system
In 1995, Ishikawa and others (1995a) developed a semi-continuous micro-bubbling
system that uses a cylindrical filter to micro-bubble CO2 entering into the pressure vessel.
They showed that the use of the filter significantly increased the efficiency of the system.
They could achieve three times more inactivation of enzymes using a micropore filter
than without it. They also showed that using a filter increased the concentration of
dissolved CO2 in the sample from 0.4 to 0.92 mol/L at 25 MPa and 35oC. In 1998,
Shimoda and others developed a continuous micro-bubble system that was very effective
in the inactivation of microorganisms (Figure 2-7). In this system, liquid CO2 and a saline
solution were pumped through a CO2 dissolving vessel at certain flow rates. Liquid CO2
was changed to gaseous state using an evaporator and then dispersed into the saline
solution from a stainless steel mesh filter with 10 µm pore size. The micro-bubbles of
CO2 moved upwards while dissolving CO2 into the saline solution. Then, the saline
solution saturated with CO2 was passed through a heater to reach the desired temperature

43
and a suspension of microorganisms was pumped into it at this point. Another coil with a
heater was used to adjust the residence time (Shimoda and others 2001).
Figure 2-7. A continuous micro-bubble DPCD system
A continuous membrane contact CO2 system was developed by Sims in 2001
(Figure 2-8) (Sims and Estigarribia 2002). This system consists of four in series hollow
polypropylene membrane modules. Each tubular module has 15 parallel fibers of 1.8 mm
ID, 39 cm length and 83 cm2 active surface area. A CO2 pump is used to pressurize the
system, and the test liquid is pumped continuously into the system with a HPLC pump.
This setup is very efficient in saturating the liquid with CO2 since it provides a large
contact area between CO2 and the test liquid by the use of the membranes. In the
membrane contactor, CO2 is not mixed with the test liquid but instead diffuses into it at
saturation levels instantaneously. CO2 is recycled back and re-used.

44
Figure 2-8. A continuous CO2 membrane contactor system
In 1999, Praxair (Chicago, IL) developed a continuous flow DPCD system (Figure
2-9). This system consists of CO2 tanks and a CO2 pump, a product tank and product
pump, a high pressure pump, holding coils, decompression valve and a vacuum tank. CO2
and the product are pumped through the system and mixed before passing through the
high pressure pump. This pump increases the pressure to the processing levels, and the
product temperature is brought to the desired level in holding coils. Residence time is
adjusted by setting the flow rate of the product passing through holding coils. At the end
of the process, an expansion valve is used to release CO2 from the mixture. It is possible
to pull out the remaining CO2 in the product by a vacuum tank. This system has been
shown to be very effective in killing pathogens and spoilage bacteria for short periods of
time (Folkes 2004, Damar and Balaban 2005, Kincal and others 2005, Lecky 2005, Lim
and others 2006).

45
P
Mai
n Pu
mp
Ju ice stream
Vacu
um
H ea ting system
H old tube
Trea ted
C O 2
ju ice
CO
ta
nk2
E xpansion va lve
Pum p
Pum p
C hille r
4
1
2
3
5
6
78
9
Figure 2-9. A continuous flow DPCD system
DPCD Food Applications and Quality Effects
DPCD has been applied mostly to liquid food products, particularly to fruit juices.
To date, there is no commercial food product processed by DPCD. There are a limited
number of published studies in the literature regarding the effect of DPCD on the quality
of foods including a few test results published by companies offering commercial
systems.
Among the first food applications of DPCD is treatment of whole fruits such as
strawberry, honeydew melon, and cucumber for inhibition of mold growth. Haas and
others (1989) demonstrated that although mold inhibition is possible by DPCD treatment
of fruits, DPCD may cause severe tissue damage in some fruits even at low pressures.
Studies with orange juice shows that DPCD treatment can improve some physical
and nutritional quality attributes such as cloud formation and stability, color and ascorbic
acid retention. Arreola and others (1991a) treated fresh orange juice with DPCD in a
batch system from 7 to 34 MPa, 35 to 60oC and for 15 to 180 min time periods. They also

46
had temperature controls that were kept under the same temperatures for the same
amount of time without DPCD treatment. Ascorbic acid retention of DPCD treated
orange juice was between 71 to 98%. Ascorbic acid retention levels of DPCD treated
samples were significantly higher than that of temperature controls. Higher ascorbic acid
retention by DPCD was explained by the exclusion of O2 from the system and lower pH
of orange juice by DPCD. Ascorbic acid has higher stability under low pH and oxidizes
easily when oxygen is present in the environment. On the other hand, cloud of orange
juice was enhanced by 1.3 to 4.0 times after DPCD treatment compared to original
untreated orange juice. Cloud stability of orange juice treated by DPCD at 29 MPa and
50oC for 4 h was retained after 66 days of refrigerated storage. However, temperature
controls (50oC for 4 h) and room temperature controls (25oC for 4 h) lost cloud
completely during refrigerated storage. In the same study, instrumentally measured color
scores showed that DPCD treated juice was brighter than untreated juice. Sensory
evaluation of DPCD treated and untreated juices indicated that there was no significant
difference in flavor, aroma and overall acceptability of these samples. The color and
cloudiness of DPCD treated juice were preferred over those of untreated juice.
Park and others (2002) treated carrot juice with a combined effect of 4.9 MPa
DPCD and 600 MPa ultra-high pressure. They observed reduction of pectin
methylesterase (PME) activity by 65%, and a cloud loss of 47%. This suggests that the
cloud loss in different food systems, even with the same enzyme (PME), could follow
different mechanisms, and cloud retention in e.g. orange juice does not necessarily imply
cloud retention in carrot juice.

47
Later studies using continuous systems also show nutritional and sensory quality
retention and improvements in the physical attributes of orange juice treated with DPCD.
Kincal and others (2006) obtained up to 846% cloud increase in orange juice by DPCD
treatment (38 MPa, room temperature, 10 min). There were no significant changes in pH
and oBrix of treated samples. Small, but statistically insignificant increase in L* and a*
values of color occurred by DPCD. Sensory evaluations of DPCD treated and untreated
orange juice were not significantly different. Ho (2003) used the continuous flow system
of Praxair (Chicago, IL) and reported that there were no significant differences between
physical attributes (pH, oBrix and titratable acidity), nutritional content (vitamin C and
folic acid) and aroma profile for untreated and DPCD treated orange juice.
Folkes (2004) used continuous DPCD technology for pasteurization of beer and
compared physical and sensory quality attributes of DPCD treated beer with that of fresh
(untreated) and heat pasteurized beer. The aroma and flavor of DPCD treated beer was
not significantly different from fresh beer even after 1 month storage at 1.67oC, but heat
treated beer was found significantly different than others in taste and aroma at the end of
storage (α=0.1). DPCD treated beer had significantly less foam capacity and stability
compared to heat pasteurized beer, but not at levels detrimental to the finished product
quality. On the other hand, beer haze was significantly reduced by DPCD.
Lim and others (2006) treated mandarin juice with DPCD using the continuous
flow system by Praxair and measured the pH, oBrix, titratable acidity, cloud and color
after DPCD treatment at 13.8-41.4 MPa, 25-45oC and 7-9 min. DPCD treatment
enhanced the cloud up to 38.4%, increased lightness and yellowness, and decreased

48
redness of mandarin juice. DPCD treated samples had higher titratable acidity than
untreated samples. The pH and oBrix did not change after DPCD treatment (α=0.05).
It is important to conduct studies regarding the consumer likeability of food
products that are processed by DPCD since the consumer is the target in
commercialization of this technology.
Objectives of the Study
The objectives of this study were:
i. To quantify microbial reduction in coconut water as a function of treatment conditions
such as pressure, temperature, time and CO2 level
ii. To evaluate quality of DPCD treated coconut water during storage
iii. To compare untreated fresh, DPCD- and heat-treated coconut water by sensory
evaluation
iv. To identify flavor compounds in coconut water and compare the flavor profile of
untreated, DPCD- and heat-treated coconut water

49
CHAPTER 3 MATERIALS AND METHODS
Preliminary Experiments with Coconuts
Juice Extraction and Initial Quality Tests
Eight immature green coconuts (Malaysian Dwarf) were obtained from Homestead,
FL. A ½ in Makita Drill (Buford, GA) was used to drill two holes on opposite sides of
coconuts and the water was poured into 1L glass bottles. Each bottle was numbered from
1 to 8 and stored in a refrigerator (4oC). Weight of coconuts ranged between 1.85 to 2.40
kg and coconut water extracted from these ranged between 435 to 490 g. oBrix was
between 6.3 and 6.6, while pH ranged between 5.35 and 5.50. Total aerobic plate counts
(APC) were between zero count and >190 cfu/mL, and there was no yeast and mold
(YM) growth initially (Table A-1). APC and YM counts were repeated at day 9 for
selected bottles and increase in counts were observed (Table A-2). Presence of PPO and
POX enzyme activity in coconut water was confirmed by following the method described
by Campos and others (1996).
Pinking of Coconut Water
Coconut water from the eight coconuts in each bottle changed color during
refrigerated storage. The pictures of the coconut water in each bottle at day 0 and day 9
were given in Figure A-1. Some of the bottles showed browning of coconut water at day
zero. This could be due to enzymatic browning that was accelerated by introducing
phenolic compounds from the outer surface of the green shell, as well as heating and
metal contact during drilling of the coconuts.

50
Preliminary tests were conducted to understand the mechanisms causing or
accelerating pinking in coconut water.
In Test 1, coconut water extracted from one immature green coconut was divided
into two. One part was placed into 20 mL glass test tubes and divided into five treatment
groups (three tubes/group). Treatments were control (no treatment)(1), frozen and thawed
at 4oC the next day(2), N2 bubbling for 15 min (3), heating at 80oC for 5 min (4) and
heating at 80oC for 5 min while exposed to the air (5). All tubes were stored under
refrigeration (4oC). Tubes were observed for color at days 0, 4, 7, 9 and 12. On day 7, one
of the three tubes from control, frozen/thawed and heating (closed caps) groups were
removed from that group and bubbled with air for 15 min. Color observation results are
given in Table A-3. Two out of three N2 bubbled tubes and all open heated tubes turned
pink earlier than others on day 4. On day 12, one tube of N2 bubbled and two unaerated
controls, frozen/thawed and heated (closed cap) tubes were still colorless whereas all
aerated tubes, open heated tubes and two N2 bubbled tubes were pink. Although it is hard
to draw a clear conclusion on the effect of heating or N2 bubbling based on this test,
aeration seems to accelerate pinking.
In Test 2, the second part of the coconut water was placed into 50 mL opaque
plastic cups and were exposed to different treatments such as ascorbic acid (100 ppm)(1),
potassium metabisulfite (40 ppm)(2) or 0.1N HCl addition to lower the pH to 4.0(3) and
3.0(4). Two cups were untreated and used as control (pH=4.8). The color observations
were done every day until day 12 and also 3 months later (Table A-4). Control cups
turned pink on day 12 whereas others were still colorless. At the end of 3 months, all

51
cups other than ascorbic acid added and potassium metabisulfite added cups turned pink.
Ascorbic acid and potassium metabisulfite seem to stabilize the color of coconut water.
Test 3 was conducted to observe the effect of aeration and heating on pinking of
coconut water. Coconut water extracted from a coconut was divided into 20 mL glass
tubes, three tubes in each treatment. Treatments were control (1), heated at 85oC for 5
min (2), boiled for 5 min (3), and air bubbled for 15 min (4). Color observations on day 6
and day 10 showed that all heated and aerated tubes eventually turned pink, whereas
control tubes were still clear at the end of 10 days refrigerated storage (Table A-5). These
results suggested that aeration and heating might accelerate pinking. It is unlikely that
pinking is due to microorganisms since boiling did not prevent it.
Tests with Commercial Coconut Water Drinks
In order to understand some properties of commercially available coconut water,
six different brands of coconut water drinks were obtained from the market and their
sensory evaluation was made by an informal tasting. The measured pH and oBrix values
and the contents of these products are given in Table A-6. Four of these products were in
aluminum cans while two others were in Tetrapak boxes. The pH of these drinks changed
between 4.12 and 5.16 while the oBrix was in the range of 5.6 to 10.8. Cooked, metallic,
soapy and artificial coconut flavors were recognized by some of the panelists. Products
with lower oBrix were mostly found to have a bland or no taste whereas the ones with
higher oBrix were usually found to be too sweet.
Extraction of Coconut Water from Coconuts
About 1,140 immature green coconuts (Cocos nucifera, Malaysian Dwarf) were
obtained from growers (El Salvador Farm) in Homestead, Florida. Coconuts were left in
a commercially available bleach solution (1.0% (v/v)) and rinsed with water before

52
cutting. Washed coconuts were passed through a band saw and cut horizontally in one
end. The liquid inside was taken to a clear glass bottle by the use of a peristaltic pump,
and checked for color, smell and taste. Any turbid, or abnormally colored liquid was
discarded. Clear liquid was placed in 3 gallon plastic pail containers that were kept in ice.
Once each pail was full, the juice was frozen at –20oC immediately in order to prevent
any microbial or enzymatic activity. This procedure was used to mix juices from many
coconuts and make the sample homogeneous as much as possible. Although all the
coconut water could not be mixed into one batch, the liquid was a representative of a
broad number of coconuts. During experiments whenever needed, the pails were taken
randomly into 4oC cold room and thawed. Pictures in Figure A-2 show steps used in
extraction of coconut water.
Formulation of Coconut Water Beverage
Preliminary tests were performed to determine the necessity for acidification,
sweetening and carbonation of coconut water. Safety considerations against C. botulinum
required acidification. Food grade citric acid (Presque Isle, North East, PA), malic acid
(Presque Isle, North East, PA) and pHase (Jones-Hamilton, Walbridge, OH) were
compared by preliminary tastings for their suitability to sweeten coconut water. Malic
acid was chosen as the most suitable acid and added to coconut water to lower the pH to
4.30. Malic acid is naturally present in coconut water and was preferred over citric acid
and pHase by the panelists. Preliminary tasting showed that a sweetener was needed to
compensate for the sourness caused by acidification. Splenda (McNeil-PPC, Fort
Washington, PA), which is basically a chemically modified form of sucrose, was used as
the sweetener and the amount was determined by informal tastings. Splenda has no
caloric value and was preferred over other artificial sweetners because it gives relatively

53
higher sweetness (600 times that of sucrose) and lack of strong aftertaste. oBrix of
coconut water did not change after Splenda addition. Finally, carbonated coconut water
was compared to non-carbonated for likeability by informal tastings. Carbonation was
done at 4oC and 1.82 atm CO2 pressure. It was decided to carbonate coconut water after
acidification and sweetening because carbonated samples were preferred over non-
carbonated by panelists.
DPCD Processing Equipment
Continuous-flow DPCD System
A continuous high pressure CO2 machine of 55.16 MPa pressure and about 0.8
liters/min flow rate capacity (Praxair Co., Chicago, IL) was used for pasteurization of
coconut juice. The components of the system and their functions were described in
section “DPCD treatment systems” of Chapter 2.
The system was run at a juice flow rate of 417 g/min in order to obtain 6 min
residence time in the holding tube (79.2 m length and 0.635 cm ID). Sterile water was run
through the system until the desired levels of pressure, temperature and CO2 level were
reached. Coconut water was then poured in the juice tank and the first 3.5 L of coconut
water were discarded. Approximately 1 L of treated coconut water was collected into a
sterile 1 L glass bottle at the exit valve. Processed coconut water was cooled down
immediately at 4oC until further use. Whenever the treatment parameters were changed,
sterile water was run through the system until the desired levels were reached. The
equipment was cleaned after each use as described below.
Cleaning of the Equipment
Oxonia and Principal solutions (Ecolab, St. Paul, MN) were the chemicals used to
sanitize the equipment. Concentrations of solutions were determined as 0.38% Principal

54
and 0.44% Oxonia solutions (v/v) with the help of an Ecolab representative. The
equipment was first cleaned with 26.5 L of Principal solution and then with 22.7 L of
Oxonia solution the day before the experiment. On the day of the experiment, 24 L of
sterile distilled water was passed through the equipment. At the end of the experimental
run, the same sanitization procedure was followed. Previous cleanability studies on
DPCD equipment shows that a concentration of 0.5% Principal solution and 0.28%
Oxonia solution were sufficient to confirm that the equipment was sanitized (Lecky
2005).
Heat Pasteurization Equipment
Heat pasteurization equipment consisted of a water bath (Precision Scientific
Group, Chicago, IL) that was set to the pasteurization temperature (74oC), two 5.4 m
stainless steel tubing (0.476 cm ID) and a peristaltic pump (Figure 3.1). Coconut water
was pumped by the peristaltic pump at a flow rate of 385 mL/min through the first
stainless steel tubing (placed in the water bath) in order to be heated to 74oC and then
passed through a second stainless steel tubing at 74oC for 15 s. D value of
L.monocytogenes at 74oC is 0.72 s and its z value is 5.56oC (Freier 2001). Treatment for
15 s gives 20 log cycles reduction in this microorganism. Coconut water exiting the
second tubing was immediately cooled to approximately 10oC by passing through 3.2 m
of stainless steel tubing (0.476 cm ID) that was placed in ice slush. Heat treated coconut
water was collected in sterile glass containers (6 L) and placed in the cold room and at
4oC.

55
juic
e
pum
pWater bath Ice slush
Pasteurizedjuice
1
2
3 4
Figure 3.1. Schematic drawing of heat pasteurization equipment
Carbonation Equipment
Untreated, DPCD and heat pasteurized coconut water samples were carbonated by
using a Zahm & Nagel Pilot Plant Carbonator (Zahm & Nagel Co., Buffalo, NY) with a
capacity of around 7.5 liters. Carbonator was cleaned by soap, distilled water and alcohol
before each use. Coconut water at 4oC was placed in the carbonator unit that was kept in
ice throughout carbonation in order to keep the temperature of the juice at about 4oC. CO2
gas was sent from the gas tank (BOC Group, NJ) to the carbonator and the air remaining
in the carbonator was replaced by CO2 gas. Next, the CO2 pressure was brought to 1.82
atm and CO2 was bubbled through the juice until all juice inside the carbonator was
collected. Carbonated coconut water was immediately filled into glass champagne bottles
of 750 mL capacity each and capped with metal caps. All carbonated water bottles were
stored at 4oC.

56
Optimization of DPCD Treatment Conditions for Microbial Reduction
Aging of Coconut Water
Aging of coconut water was necessary to bring the initial microbial load of coconut
water to 107 colony forming units (cfu/mL). Frozen coconut water kept in plastic pails at
–20oC, was thawed for 1 week at 4oC and then formulated by the addition of malic acid to
lower the pH to 4.3 and 0.7% (w/w) Splenda with a final oBrix of 6.0. Then the coconut
water was aged at room temperature (24oC) for about 46 h in order to increase microbial
load to >107 cfu/mL.
Experimental Design
Response surface methodology (RSM) was used for the design and optimization of
DPCD treatment conditions for microbial reduction. DPCD process variables were
pressure, temperature, CO2 to juice ratio (w/w) and residence time. Experimental
conditions were determined by a 3-factor, 3-level Box-Behnken design, which is one of
the Response surface designs. Residence time was decided to be 6 min, and kept constant
throughout the treatments since long times would not be economically feasible.
Independent variables were pressure (13.8, 24.1, 34.5 MPa), temperature (20, 30,
40oC) and CO2 to juice ratio (7, 10, 13 g CO2/ 100 g juice). The maximum pressure level
was chosen as 34.5 MPa because this pressure can be achieved safely considering the
limitations of the system, where 55.16 MPa is the maximum. The minimum pressure
level was chosen as 13.8 MPa since below that pressure level a significant microbial
reduction was not expected based on previous studies. Minimum temperature was
determined by the limitations of the equipment and had to be chosen as the room
temperature at the time of the experiment. Middle temperature value was 30oC that was a
close to the critical temperature for CO2 (31oC). Maximum temperature (40oC) was in

57
supercritical range, and higher temperatures than this could affect the quality of the juice.
Dependent variable was log reduction in aerobic microbial load (cfu/mL) of juice after
treatment. Microbial log reduction was calculated for each experimental run as;
log[(initial number of cfu /mL)([number of cfu/mL after treatment)]. Fifteen
experimental runs were determined by applying Box-Behnken coded design. The codes
and conditions for each variable are shown in Table 3-1. The following equations give
the relation between the codes (X1, X2, X3) and the variables (T, P and % CO2 level):
X1= 0.10 * T(oC) – 3.0
X2=0.097 * P(MPa) – 2.33
X3=0.333 * % CO2(g CO2/ 100 g juice) – 3.33
Table 3-1. Three factor-3 level Box-Behnken experimental run coded variables and conditions
RUN# Coded T : X1
Coded P : X2
Coded CO2/juice ratio: X3
Temperature (oC)
Pressure (MPa)
% CO2 Level (w/w)
1 -1 -1 0 20 13.8 10 2 1 -1 0 40 13.8 10 3 -1 1 0 20 34.5 10 4 1 1 0 40 34.5 10 5 -1 0 -1 20 24.1 7 6 1 0 -1 40 24.1 7 7 -1 0 1 20 24.1 13 8 1 0 1 40 24.1 13 9 0 -1 -1 30 13.8 7
10 0 1 -1 30 34.5 7 11 0 -1 1 30 13.8 13 12 0 1 1 30 34.5 13 13 0 0 0 30 24.1 10 14 0 0 0 30 24.1 10 15 0 0 0 30 24.1 10
X1: Code for Temperature, X2: Code for Pressure, X3: Code for % CO2 level

58
Storage Study
A storage study was conducted for 9 weeks and samples were taken at weeks 0, 2,
3, 5 and 9 in order to evaluate microbial, physical (pH, color, titratable acidity, oBrix)
and sensory attributes of untreated (fresh control), DPCD and heat pasteurized coconut
water beverage samples. Flavor profiles of stored samples were also analyzed
instrumentally. Storage study was ended at the 9th week since the microbial load for
untreated coconut water exceeded 105cfu/mL and the flavor was undesirable.
At the beginning of the storage study, frozen coconut water was thawed at 4oC and
formulated by malic acid and Splenda addition. DPCD treated samples were treated at
previously determined optimum conditions (25oC, 34.5 MPa, 13% CO2), and heat treated
samples were pasteurized at 74oC for 15 s. All samples were then carbonated and capped
in 750 mL champagne bottles, and stored at 4oC until further needed. These steps are
shown in a schematic drawing (Figure 3-2). Untreated control samples were prepared
fresh as described above for each week of sensory panels, whereas the DPCD and heat
pasteurized samples were stored samples. DPCD and heat pasteurized samples were
analyzed for microbial load prior to the taste panels in order to ensure the safety of these
samples.

59
(Swe
Figure 3-2. Schematic drawing of
Microbial Tests
Aerobic plate count (APC),
and heat pasteurized samples were
Microbiology, St.Paul, MN). The
with 1N NaOH and then 10-fold s
coconut water into 90 mL of Butte
Maria,CA). Two replicates of each
replicates of 3M Petrifilms. Aerob
while yeast and mold petrifilms w
petrifilms with the cfu’s between 2
average cfu’s corresponding to the
Heat treatment 74oC, 15 s 34.5
Carbonation
Coconut water
etening, Acidification)
steps followed in preparation of storage study samples
and yeast and mold count (YM) of untreated, DPCD
determined by using 3M Petrifilms (3M
pH of coconut water was first adjusted to around 7.0
erial dilutions were prepared by adding 10 mL of
rfield’s phosphate buffer (Hardy Diagnostics, Santa
dilution were prepared and each was plated on two
ic plate petrifilms were incubated at 35oC for 48 hr,
ere incubated at 25oC for 5 days before counting. The
0 and 200 were taken into consideration and the
dilution was calculated.
DPCD MPa, 25oC, 13% CO2,
6 min
Untreated (Control)
Carbonation Carbonation
Storage 4oC, 9 weeks

60
pH
Orion (EA 920) pH meter (Boston, MA) was used for pH measurements. The pH
meter was calibrated using pH 4 and pH 7 standard solutions (Fisher Scientific, NJ) on
each test day. The pH measurements were done in triplicate.
Titratable Acidity (%TA)
A Brinkmann Instrument (Brinkmann Instruments Co., Westbury, NY) consisting
of Metrohm 655 Disomat, Metrohm 614 Impulsomat and Metrohm 632 pH-meter was
used for titration of coconut water samples. Samples were placed in a vacuum oven at
room temperature (22oC) and 0.75 atm vacuum for 1 hr in order to remove CO2 gas
before titrating. 20 mL of coconut water sample was titrated to an end point of pH 8.2 by
using standardized 0.1 N NaOH and the amount of NaOH used for titration was recorded.
Percent titratable acidity (w/v) was expressed as % malic acid and calculated by the
following equation:
%TA= (mL of NaOH used) (Normality of NaOH) (meq of malic acid = 0.067) (100)/
(mL of sample)
%TA measurements were done in triplicate for each sample.
oBrix
A Fisherbrand hand held refractometer with a 0o to 18o Brix scale (Fisher
Scientific, Pittsburg, PA) was used for oBrix measurements. 2-3 drops of coconut water
were placed onto the prism and the reading was recorded. Measurements were done in
duplicate.
Color
Color of coconut water samples was measured in a CIE L* (Lightness) a*
(Redness) b*(Yellowness) color scale by using the Colorgard 14 system (BYK-Gardner

61
Inc., Columbia, MD). Quartz halogen lamp (2845 K) was used as the light source, and
allowed to warm up for 10 min prior to measurements. The system was calibrated using
black (Zero reference) and white standard (L, a*, b*: 94.31, -0.92, -0.50) tiles. A
standard measurement was done by placing a glass cup filled with 50 mL of distilled
water and the white tile placed on top of the cup in a facedown position. The same
procedure was followed with the coconut water samples. The cup was rinsed with
distilled water and wiped with Kimwipes between samples. Measurements were done in
triplicates.
Sensory Evaluation
Sensory panels were conducted during storage at weeks 0, 2, 3, 5 and 9 in order to
evaluate overall likeability, aroma, taste and off flavor of untreated, DPCD and heat
pasteurized samples. University of Florida FSHN Dept.’s taste panel facility (University
of Florida, Gainesville, FL) consisting of 10 private booths with computers was used to
conduct sensory panels. Samples were stored capped in champagne bottles in an ice bath
before being poured into 60 mL plastic cups, in order to prevent carbonation loss. Each
sample was assigned with a randomly selected three-digit code, and placed in cups on a
tray in all possible combinations of order. Red light was used in the panelist booths in
order to prevent bias on samples due to pinking of some samples. Panelists were asked to
answer some demographic questions at the beginning, and then were offered with an
untreated (fresh control) reference, and three samples (fresh control, DPCD treated, heat
treated). Panelists were asked to rate aroma and taste difference of each sample from the
given reference (continuous 15 cm line scale with values from 0 to 15) using difference-
from-control test. In addition, overall likeability (9 point hedonic scale), off flavor (6
point scale) and their purchase intent for each sample were asked. Panelists took a bit of

62
cracker and a sip of water to rinse their mouth between the samples. Fifty untrained
panelists evaluated the samples at each storage week. Compusense 5 software
(Compusense Inc., Ontario, CA) was used to design and conduct the test, and to collect
and analyze the data. Sample ballots that were used in sensory panels are given in Table
E-10.
Flavor Analysis
Solid phase micro-extraction (SPME) was used to extract aroma compounds from
coconut water. The SPME fiber was a 1 cm StableFlex PDMS/CAR/DVB fiber (Supelco,
St.Louis, MO) which is a bipolar phase fiber suitable to extract high and low volatile
compounds. 10 mL of coconut water was placed into 40 mL glass vials and brought to
42-45oC in a water bath. SPME fiber was inserted into the headspace of the vial and
extraction was held under continuous stirring at 42-45oC for 45 min using a magnetic stir
bar. SPME fiber was inserted into the GC injection port and exposed for 5 min for
desorption of aroma compounds. GC/O (HP 5890 Series II) equipment with a FID
detector was used to separate and analyze the aroma compounds. Two different columns
were used in GC/O; a non-polar DB-5 column (Zebron, 30 m x 0.32 mm ID x 0.50 µm
FT) and a polar Carbowax column (Restek, 30 m x 0.32 mm ID x 0.5 µm df).
Temperature programming conditions for GC/O using each column are given in Table 3-
2. With each column, two persons sniffed twice each SPME extract. Sniffers used a
continuous scale slide marked as low, medium and high to rate the intensity of the sniffed
compound and also indicated aroma descriptors of each sniffed compound at the
corresponding retention time. The chromatograms for both the FID and sniff port were
recorded and saved. C5-C20 alkane standards were run at each experiment day and their

63
retention times were recorded. Their literature linear retention indices (LRI’s) were
plotted against their retention times and the equation relating the LRI’s as a function of
retention times was obtained by using the Excel graph options. The same equation was
used to calculate LRI’s of the sniffed compounds at the corresponding retention times.
Examples of LRI calculations of standard alkanes and the formulas relating LRI’s to the
retention times are given in Table C-1 and Figure C-1, respectively, for the Carbowax
column, and in Table C-2 and Figure C-2, respectively, for the DB-5 column. An
aromagram was constructed by plotting average sniff intensity (average of sniff port peak
areas) against the calculated LRI’s.
A GC/MS (Perkin Elmer; Wellesley, MA) equipment with quadrupole-ionization
detector was used for identification of flavor compounds in coconut water. This
equipment used TurboMass 5.01 (Wellesley, MA) software for the integration and
analysis, and a NIST (MS Research 2.0) database as the library of the compounds for the
identification. The SPME extracts were injected and exposed through the injection port
for 5 min. GC-MS temperature programming conditions were; 40oC (initial) to 240oC
(final) at a 7oC/min ramp rate and with a 9.5 min holding time. Each peak on GC/MS
chromatogram was first integrated and then searched through the NIST database for the
identification by using the software. The software gave a list of compound names, that
matched the peak with the degree of match for each listed compound over 1000. An
example of this identification procedure including the chromatogram and the NIST
identification sheet is shown in Figure C-3. C5-C20 alkane standards were used to obtain
an equation relating retention times of compounds to the LRI’s.

64
Table 3-2. Temperature programming conditions used for GC/O runs with DB-5 and Carbowax columns.
Column Type
Initial Oven Temp. (oC)
Final Oven Temp. (oC)
Ramp rate
(oC/min)
Final holding
time (min)
Detector A
Temp. (oC)
Detector B
Temp. (oC)
Injector Temp. (oC)
DB-5 40 265 7 5 270 110 220
Carbowax 40 240 7 5 250 110 220
Data Analysis
Response surface regression analysis of Box-Behnken experimental data was
performed using SAS 9.1 software program (Cary, NC). A 3-D Response surface plot
was obtained using STATISTICA 6.0 (Tulsa, OK). The optimal conditions for pressure,
temperature and CO2 level were determined by considering the statistical significance (p
<0.10) of each variable on microbial reduction.
The significance of difference between treatment means for the storage study data
(pH, %TA, oBrix, color (L*, a*, b*), sensory attributes) was determined by analysis of
variance (ANOVA) using SAS 9.1 software (Cary, NC) at a significance level of α=0.05.
The means for each treatment were compared using Duncan’s multiple comparison test
(α=0.05) to determine statistically different samples. Effects of storage time and
interaction effects were also included in the ANOVA analysis.

65
CHAPTER 4 RESULTS AND DISCUSSION
Formulation of Coconut Water Beverage
Regulatory and consumer likeability aspects were considered in the formulation of
the coconut water based beverage. FDA regulations regarding low acid foods require that
action be taken to inhibit the growth of C.botulinum. Coconut water had a pH of around
5.0, and therefore, it must be lowered to below 4.6. Informal taste panels were conducted
to decide on the suitability of different organic acids and commercially available pH
lowering compounds. Malic acid was liked the most and was used to lower the pH to 4.3.
Splenda (McNeil-PPC, Fort Washington, PA) was also added as a sweetener at about 0.7
% (w/w) to compensate for the resulting sourness. Preliminary tasting studies also
showed that carbonated coconut water was preferred over non-carbonated. Therefore,
coconut water beverage was formulated as a carbonated, acidified and sweetened
beverage with a pH of 4.3 and oBrix of 6.0.
Objective 1: Quantification of Microbial Reduction in Coconut Water as a Function of Treatment Conditions
To quantify microbial reduction in coconut water as a function of DPCD treatment
conditions, response surface methodology (RSM) was used. The number of experimental
runs and the treatment conditions at each run were determined by using a 3-factor 3-level
Box-Behnken experimental design. This design is one of the response surface designs
that allows fitting of a quadratic model and has the advantage of requiring fewer number
of runs compared to other response surface designs when three factors are used. The Box-

66
Behnken design suggests a sphere in the cubic process space where the surface of the
sphere is tangential to the midpoints of the each edge of the cubic space (Figure 4-1).
Center point experiments were replicated three times.
Figure 4-1. Geometry of the 3-factor 3-level Box-Behnken design
Three factors of this design that represented independent variables in the RSM
model were X1:Temperature (coded), X2:Pressure (coded) and X3: CO2 level (coded).
The dependent variable was Y: log microbial reduction. Coconut water that was thawed
and formulated by acidification and sweetening was aged at room temperature (24oC) to
reach an initial load of 107cfu/mL. Next, 15 experimental runs that were determined by
Box-Behnken design were conducted at the three levels of temperature, pressure and CO2
levels (Table 3-1). Table 4.1 shows the experimental conditions of each run and the
measured log reduction in total numbers of aerobic bacteria. The log reductions were
calculated by subtracting final log numbers of bacteria from initial log numbers. Initial
and final numbers of bacteria were determined by taking average cfu/mL counts on
petrifilms with the cfu’s less than 200 cfu/mL. The average initial and final aerobic plate
counts (APC) ± standard deviations at each experimental condition are given in Table B-
1.

67
Table 4-1. Log microbial reductions at each experimental point determined by Box-Behnken design
RUN#
X1
X2
X3
T
(oC)
P
(MPa)
CO2 level(g/100g juice)
Log microbial reduction
experimental (A)
Log microbial reduction predicted
(B) Residual:
(A-B) 1 -1 -1 0 20 13.8 10 4.92 4.90 0.02 2 1 -1 0 40 13.8 10 5.03 5.15 -0.12 3 -1 1 0 20 34.5 10 4.90 4.90 0.00 4 1 1 0 40 34.5 10 5.61 5.15 0.46 5 -1 0 -1 20 24.1 7 4.47 4.25 0.22 6 1 0 -1 40 24.1 7 5.40 5.34 0.06 7 -1 0 1 20 24.1 13 5.42 5.66 -0.24 8 1 0 1 40 24.1 13 4.66 5.06 -0.40 9 0 -1 -1 30 13.8 7 5.30 5.15 0.15 10 0 1 -1 30 34.5 7 4.71 5.15 0.56 11 0 -1 1 30 13.8 13 5.90 5.72 0.18 12 0 1 1 30 34.5 13 6.18 5.72 0.46 13 0 0 0 30 24.1 10 5.58 5.38 0.20 14 0 0 0 30 24.1 10 4.99 5.38 -0.39 15 0 0 0 30 24.1 10 5.22 5.38 -0.16
X1: Coded variable for Temperature (T); X2: Coded variable for Pressure (P); X3: Coded variable for CO2 level
The RSM analysis of data was done using SAS 9.1 statistical software program
(Cary, NC). First, the following quadratic model that included three variables X1, X2 and
X3 was used and the RSM regression was conducted on the data:
Y= a+ b*X1 + c*X2 + d*X3 + e*X1*X1 + f*X2*X1+ g*X2*X2 + h*X3*X1 + i*X3*X2
+ j*X3*X3
where Y: log microbial reduction, X1: Temperature (coded), X2: Pressure (coded), X3:
CO2 level (coded) and the letters from a to j represent corresponding coefficients for each
parameter of this model. The SAS code and output of the analysis are given in Table B-2
and B-3, respectively. The regression coefficient R2 was 0.76 for this model. Significance
of each parameter was decided at α=0.1 level and the parameters with p value > 0.1 were

68
excluded from the model. Results showed that only the parameters X3 and X3*X1 were
significant, therefore any parameter with X2 (Pressure) variable were excluded from the
model. Similarly, Sims and Estigarribia (2002) reported that increasing CO2 pressure
from 7.5 to 15 MPa did not significantly increase microbial reduction.
Next, another RSM regression analysis was performed by using the modified
model that involves only the parameters with variables X1 and X3:
Y= a + b*X1 + c*X3 + d*X1*X3 + e*X1*X1 + f* X3*X3
The SAS output of this analysis is given in Table B-4. The regression coefficient
R2 was 0.63 for the model. The model with the estimated coefficients gives the prediction
of log microbial reduction (log red) as a function of temperature (coded) and CO2 level
(coded): log reduction = 5.381 + 0.124*Temp + 0.284*CO2 – 0.355*Temp2 -
0.423*CO2*Temp + 0.05*CO22
Coefficients were determined for the coded values of each variable. The log reductions
predicted at fifteen experimental runs using this equation are close to the experimental
log reductions (Table 4-1). Three-dimensional plots of the response surface for this
equation are given in Figure 4-2.
Apparently, there is not an optimum point on the surface plot at which ∂(log
reduction) /∂(Temp)= 0 and ∂(log reduction/∂(CO2)=0 gives the highest microbial
reduction. The surface plot shows that at lower- and mid-temperatures, microbial
reduction increases as CO2 level increases. However, at higher-temperatures this behavior
changes, and either CO2 level is not effective or causes a decrease in microbial reduction.
The amount of dissolved CO2 has a primary role in microbial reduction. CO2 solubility is
affected by temperature change and decreases as temperature increases (Dodds and others

69
1956). Therefore, increased CO2 does not cause increased microbial reduction at higher
temperatures due to its limited solubility. On the other hand, highest microbial reductions
were achieved at temperatures close to middle temperature (i.e. temperatures around 25-
30oC) and highest CO2 level (i.e. CO2 levels around 13%). Therefore, the optimal
conditions of DPCD treatment for microbial reduction in coconut water were selected to
be 25oC and 13% (g CO2/100 g juice). Predicted log microbial reduction at these
conditions is 5.77. Predicted log microbial reductions at different levels of temperature
and CO2 using the model can be found in CD file: “predicted log reductions.doc”.
4.38 4.52 4.66 4.80 4.94 5.08 5.22 5.36 5.50 5.64 above
4.92
5.03
4.90
5.61
4.47
5.40
5.42
4.66
5.30
4.71
5.90
6.18
5.58
4.99
5.22
Temperature, oC20
3040%CO
2
13
10
7
log
redu
ctio
n
6.6
6.2
5.8
5.4
5.0
4.6
4.38 4.52 4.66 4.80 4.94 5.08 5.22 5.36 5.50 5.64 above
4.92
5.03
4.90
5.61
4.467
5.40
5.42
4.66
5.30
4.71
5.906.18
5.58
4.995.22
% CO27
1013
log
redu
ctio
n
Temperature,oC
40
30
20
6.66.25.85.45.04.6
Figure 4-2. Plots of the response surface for the quadratic model with the variables X1: Temperature (coded) and X3: %CO2 level (coded)
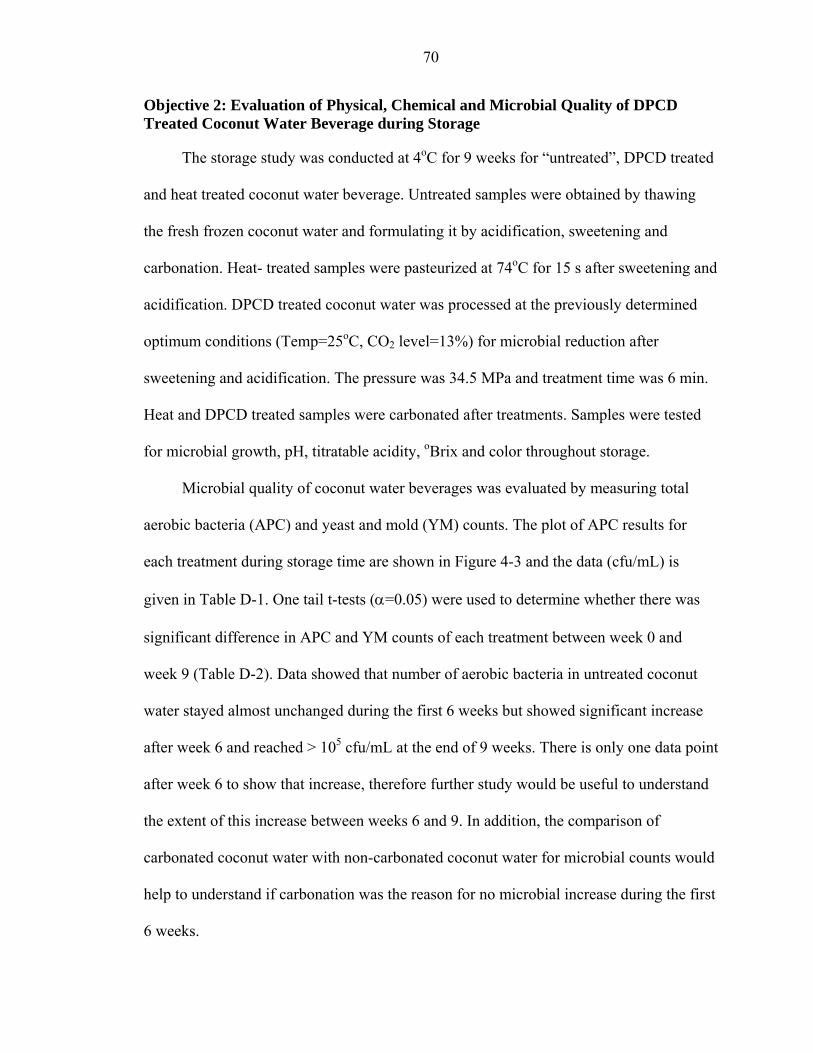
70
Objective 2: Evaluation of Physical, Chemical and Microbial Quality of DPCD Treated Coconut Water Beverage during Storage
The storage study was conducted at 4oC for 9 weeks for “untreated”, DPCD treated
and heat treated coconut water beverage. Untreated samples were obtained by thawing
the fresh frozen coconut water and formulating it by acidification, sweetening and
carbonation. Heat- treated samples were pasteurized at 74oC for 15 s after sweetening and
acidification. DPCD treated coconut water was processed at the previously determined
optimum conditions (Temp=25oC, CO2 level=13%) for microbial reduction after
sweetening and acidification. The pressure was 34.5 MPa and treatment time was 6 min.
Heat and DPCD treated samples were carbonated after treatments. Samples were tested
for microbial growth, pH, titratable acidity, oBrix and color throughout storage.
Microbial quality of coconut water beverages was evaluated by measuring total
aerobic bacteria (APC) and yeast and mold (YM) counts. The plot of APC results for
each treatment during storage time are shown in Figure 4-3 and the data (cfu/mL) is
given in Table D-1. One tail t-tests (α=0.05) were used to determine whether there was
significant difference in APC and YM counts of each treatment between week 0 and
week 9 (Table D-2). Data showed that number of aerobic bacteria in untreated coconut
water stayed almost unchanged during the first 6 weeks but showed significant increase
after week 6 and reached > 105 cfu/mL at the end of 9 weeks. There is only one data point
after week 6 to show that increase, therefore further study would be useful to understand
the extent of this increase between weeks 6 and 9. In addition, the comparison of
carbonated coconut water with non-carbonated coconut water for microbial counts would
help to understand if carbonation was the reason for no microbial increase during the first
6 weeks.

71
0.1
1
10
100
1000
10000
100000
1000000
0 2 4 6 8 10
Storage time (Weeks)
cfu/
mL Control
DPCD
Heat
Figure 4-3. Total aerobic plate counts (APC) of untreated control, DPCD and heat treated
coconut water during storage (DPCD treatment at 25oC, 34.5 MPa,13% CO2 for 6 min; Heat treatment at 74oC for 15 s)
-1.00
4.00
9.00
14.00
19.00
24.00
0 2 4 6 8 10Storage time (Weeks)
cfu/
mL Control
DPCD
Heat
Figure 4-4. Yeast counts of untreated control, DPCD and heat treated coconut water
during storage (DPCD treatment at 25oC, 34.5 MPa, 13% CO2 for 6 min; Heat treatment at 74oC for 15 s)
Numbers of aerobic bacteria decreased significantly in DPCD and heat treated
samples. The lack of oxygen in the bottles caused by carbonation might have caused the

72
decrease in the microbial growth. It is important to note that untreated coconut water had
initial microbial loads of around 3 logs, but DPCD or heat treatments unexpectedly did
not cause total inactivation that must be achieved by pasteurization. In order to
understand the real cause for the presence of microorganisms after treatments, every step
of the process was reevaluated for the possibility of contamination. The carbonation
process was a possible cause since this step is conducted in non-aseptic conditions. The
carbonation process was repeated by using sterile water under similar conditions to
coconut water, and the initial and final microbial counts of sterile distilled water showed
that carbonation might cause contamination by up to 3 logs. The APC counts for distilled
water before and after carbonation are given in Table D-3. Heat treated samples were
apparently less contaminated than DPCD treated samples. The decrease in the aerobic
bacteria growth from week 0 to 9 was 1 log in DPCD treated samples and approximately
2 logs in heat treated samples.
Yeast counts of all treatments were low throughout storage. There was no
detectable mold growth while yeast counts were only around 1 log initially and decreased
to no growth by the end of storage (Figure 4-4). Yeast counts for each treatment are given
in Table D-4.
Measured pH values of untreated, DPCD treated and heat treated coconut water are
given in Table D-5 and the plot of pH during storage is shown in Figure 4-5. Statistical
analysis of pH data by analysis of variance (ANOVA) suggests a significant storage time
and treatment interaction (Table D-6). DPCD treated samples had significantly lower pH
than other treatments (α=0.05). However, the pH means of treatments are 4.199, 4.197
and 4.190 for heat treated, control and DPCD treated samples, respectively. Although

73
these values are statistically significantly different, they are exactly the same values for
two significant figures, i.e. 4.20. It is suggested that the high accuracy of the pH meter in
the triplicate measurements lowers the sum of squares for errors and causes this result.
The pH of the samples did not change much during storage and was fluctuating around
4.20. Theoretically, a pH change was not expected during storage except for microbial
problems. However, microbial data do not support such a decrease. The slight
fluctuations in pH for the samples could be explained by sample-to-sample differences.
4.14.124.144.164.184.2
4.224.244.26
0 2 3 5 9Storage time (Weeks)
pH
Control
DPCDHeat
Figure 4-5. The pH of untreated, DPCD and heat treated coconut water during storage
(DPCD treatment at 25oC, 34.5 MPa, 13% CO2 for 6 min; Heat treatment at 74oC for 15 s)
oBrix values for treatments during storage were close, and the maximum change in
oBrix was 0.15 units. This could possibly be due to sample-to-sample variation. Mean
oBrix values of treatments were 6.04, 6.0 and 6.0 for control, DPCD and heat treated
coconut water, respectively. Theoretically, a change in oBrix of samples was not expected
during storage unless there is evaporation or fermentation of the samples. Samples were
tightly capped in glass champagne bottles and microbial data or pH data do not support
such changes. Standard errors for oBrix measurements are zero, which indicates the high

74
repeatability of the measurements. Statistical analysis of data showed significant weekly
changes and treatment differences since sum of squares of the error term is too low as a
result of high repeatability in the measurements. The data is given in Table D-7 and the
plot of the data during storage is given in Figure 4-6. The SAS output of ANOVA for
oBrix data is shown in Table D-8.
5.755.8
5.855.9
5.956
6.056.1
6.156.2
6.25
0 1 2 3 5 9
Storage time (Weeks)
Brix
ControlDPCDHeat
Figure 4-6. The oBrix of untreated, DPCD and heat treated coconut water during storage
(DPCD treatment at 25oC, 34.5 MPa, 13% CO2 for 6 min; Heat treatment at 74oC for 15 s)
Titratable acidity for untreated, DPCD and heat treated coconut water were
measured during storage and expressed as % malic acid (w/v) equivalents (Table D-9).
Statistical analysis of data by ANOVA showed that DPCD treated samples had
significantly higher titratable acidity (mean = 0.282 g malic acid / 100 mL coconut water)
whereas untreated and heat treated samples had mean values of 0.259 and 0.266 g malic
acid / 100 mL coconut water, respectively (Table D-10). The weekly mean % titratable
acidity values for each treatment are given in Figure 4-7. The reason for higher overall
titratable acidity of DPCD treated samples may be insufficient removal of CO2 during
vacuum treatment. DPCD treated samples were expected to have higher amounst of CO2

75
due to the residual dissolved CO2 after DPCD application. Increase in titratable acidity of
juices by DPCD was observed also by studies of Kincal D. (2000) for orange juice and
Lim and others (2006) for tangerine juice.
During storage, titratable acidity may change due to acid generation by microbial
growth. However, there was no increasing trend in % TA for the samples during storage.
The only treatment that shows a significant increase in microbial growth was the
untreated control sample, but it did not show an increase in titratable acidity during the
last week of storage. Although heat treated samples did not show a microbial increase,
titratable acidity showed some fluctuations during storage. These could be due to the
bottle-to-bottle variations during carbonation.
Color of coconut water samples was measured in CIE color scale as L*, a* and b*
values and the data is shown in Table D-11. Data from week 0 were omitted because of
measurement errors. The plots of L*, a* and b* values against storage weeks are
presented in Figure 4-8, 4-9 and 4-10, respectively. The data shows slight changes in
L*,a*,b* values for treatments during storage. L* values of the samples, representing
lightness, decreased from week 0 to 5 and then increased slightly at week 9. The a*
value, which represents redness on the positive scale and greenness on the negative scale,
increased from week 2 to 5, then decreased for heat treated sample, and increased up to
week 9 for the untreated control sample; whereas it increased from week 2 to 3 and then
decreased for the DPCD treated sample. These results need to be considered with caution
because some of the samples started pinking from the first day of storage. Color
measurements were done on randomly selected bottles at each storage week. Therefore,
there was large variation in redness for even the same treatment sample from one bottle

76
to another, depending on the initiation of pinking. From the preliminary experiments, it
was known that once the coconut water in a bottle starts pinking, the intensity of pinking
increased during storage. Normally, one would expect an increase in a* value for all
treatments because independent of the treatment, all bottles eventually showed pinking
during storage. The changes in L*, a* and b* values of the treatments could be due to
bottle to bottle variations and it is not possible to make a clear conclusion based on this
data.
0
0.05
0.1
0.15
0.2
0.25
0.3
0.35
0 2 3 5 9Storage time (Weeks)
% T
A (%
mal
ic a
cid
(w/v
))
ControlDPCDHeat
Figure 4-7. Titratable acidity (as % malic acid (w/v)) of untreated, DPCD treated and heat
pasteurized samples during storage (DPCD treatment at 25oC, 34.5 MPa, 13% CO2 for 6 min; Heat treatment at 74oC for 15 s)

77
08
162432404856647280
2 3 5 9Storage time (Weeks)
L* v
alue Control
DPCDHeat
Figure 4-8. Mean L* values of untreated control, DPCD and heat treated coconut water
during storage (DPCD treatment at 25oC, 34.5 MPa, 13% CO2 for 6 min; Heat treatment at 74oC for 15 s)
-3-2-101234567
2 3 5 9
Storage time (Weeks)
a* v
alue Control
DPCDHeat
Figure 4-9. Mean a* values of untreated control, DPCD and heat treated coconut water
during storage (DPCD treatment at 25oC, 34.5 MPa, 13% CO2 for 6 min; Heat treatment at 74oC for 15 s)

78
00.5
11.5
22.5
33.5
44.5
2 3 5 9
Storage time (Weeks)
b* v
alue Control
DPCDHeat
Figure 4-10. Mean b* values of untreated control, DPCD and heat treated coconut water
during storage (DPCD treatment at 25oC, 34.5 MPa, 13% CO2 for 6 min; Heat treatment at 74oC for 15 s)
Objective 3: Comparison of Untreated Control, DPCD and Heat Treated Coconut Water by Sensory Evaluation
Consumer panels of 50 untrained panelists were used to evaluate overall likeability,
aroma, taste and off flavor of untreated (control), DPCD and heat treated coconut water
beverage during storage at 4oC in glass champagne bottles. Panels were conducted at
weeks 0, 2, 3, 5 and 9. The taste panel data during storage is presented in Table E-1.
Overall likeability of samples was rated on a 9 point scale where the score 1=
dislike extremely, and 9= like extremely. ANOVA was conducted to see if there were
significant differences in overall likeability of samples due to treatment or storage time
effects. The SAS output of ANOVA is shown in Table E-2. The means of overall
likeability scores for each treatment for the overall storage time shows that untreated
control (mean=5.03a) and DPCD treated sample (mean=4.95a) were liked the most and
heat treated sample (4.58b) was liked significantly less than the other samples. Results
showed that there was significant storage time-treatment interaction at α=0.05, therefore,

79
overall likeability of treatments was changing at different rates during storage time. For
this reason, overall likeability of different treatments was compared separately at each
storage time by ANOVA. The mean overall likeability scores and standard errors are
given for treatments at each storage week in Table E-3. Figure 4-11 shows the
comparison of each treatment for overall likeability scores at different storage weeks.
Initially, DPCD treated and untreated samples were liked significantly more than heat
treated sample. However, starting from the 2nd week, overall likeability of samples
moved close to each other and this difference became insignificant. It is hard to explain
the reason for this change. There could be some flavor and aroma change in the samples
to cause a change in overall likeability scores. Since the samples were carbonated and
stored in glass bottles, flavor change due to oxidization is not expected. From the
previous studies, a change in the overall likeability due to storage time could be possible
since microbial growth during storage could affect flavor and aroma. Kincal and others
(2005) reported that microbial load increased in DPCD treated samples during storage.
However, the results of microbial tests showed that there was no increase in the microbial
counts of DPCD or heat treated samples. Therefore, the change in overall likeability
should not be due to microbial changes.

80
1= dislike extremely 9= like extremely
aaa
aa
aaaaa aaa
ab
0123456789
0 2 3 5 9
Storage time (Weeks)
Ove
rall
likea
bilit
y ControlDPCDHeat
Figure 4-11. Comparison of overall likeability of each treatment during storage
A difference from control test was conducted to evaluate the taste and aroma of
heat and DPCD treated samples. Fresh untreated coconut water was given to the panelists
as a reference control every week, and panelists were asked to rate the difference in taste
and aroma of three samples from this reference control. One of the samples was the same
as the reference control. Ideally, the difference from reference control for the control
sample should be rated as zero by the panelists since they are the same. Although most of
the panelists rated this as close to zero, some panelists rated this difference as high as 10.
The taste and aroma difference data for control samples were sorted from lowest to
highest scores at each week and the frequency of each score was plotted as histograms.
Figure 4-12 and Figure 4-13 show the histograms of aroma difference and taste
difference scores, respectively, for the control samples. Scores greater than 6 for taste
difference and greater than 5 for aroma difference from control were excluded from the

81
data, and the ANOVA was conducted on this new ‘corrected’ data. This correction was
needed to exclude the effect of outlying panelists from the statistical analysis results.
Statistical analysis of corrected aroma difference from control data by ANOVA
showed that DPCD and heat treated coconut water treatments were not significantly
different in the overall mean aroma scores (Table E-4). Storage was not significantly
affecting the aroma scores of the samples (α=0.05). The overall mean scores for aroma
difference were 2.12a, 1.92a and 1.15b for DPCD-treated, heat-treated and untreated
control samples. The weekly comparison of treatments for the aroma scores shows that
DPCD and heat treated samples were not rated significantly different for aroma (Figure
4-14). The mean aroma difference from control scores of the panelists at each week are
given in Table E-5.
The SAS output of the ANOVA of the taste difference-from control data is in Table
E-6. The overall mean values for taste difference scores were 2.08a, 3.67b and 4.17c for
the control, DPCD and heat treated coconut water, respectively. Treatments were
significantly different for the taste scores. On the other hand, weekly ANOVA results
showed that DPCD and heat treated samples were rated significantly different at week 0
only, and this difference was insignificant starting at week 2 until the end of storage
(Figure 4-15). The mean taste difference-from control scores for panelists at each week
are given in Table E-7. These results confirm the overall likeability of the samples
throughout storage. Heat treated samples were rated significantly higher for the taste
difference from control at week 0 and liked the least. The low intensity levels of flavor
and aroma in coconut water may cause larger relative errors where comparing differently

82
treated samples, and mask the protective effects of DPCD compared to thermal
treatments.
Figure 4-12.The frequency histograms of storage study aroma difference from control scores of untreated (control) samples
Week 0 aroma difference (control)
0
10
20
30
0 1 2 3 4 5 6 7 8 9 10
Score
Freq
uenc
y
Week 2 aroma difference (control)
05
1015202530
0 1 2 3 4 5 6 7 8 9 10
Score
Freq
uenc
y
Week 3 aroma difference (control)
0
10
20
30
0 1 2 3 4 5 6 7 8 9 10
Score
Freq
uenc
y
Week 5 aroma difference (control)
05
1015202530
0 1 2 3 4 5 6 7 8 9 10
Score
Freq
uenc
y
Week 9 aroma difference (control)
0
10
20
30
0 1 2 3 4 5 6 7 8 9 10
Score
Freq
uenc
y

83
Figure 4-13.The frequency histograms of storage study taste difference from control scores of untreated (control) samples
Week 0 taste difference (control)
0
5
10
15
0 1 2 3 4 5 6 7 8 9 10
Score
Freq
uenc
y
Week 2 taste difference (control)
0
5
10
15
0 1 2 3 4 5 6 7 8 9 10
Score
Freq
uenc
y
Week 3 taste difference (control)
0
5
10
15
0 1 2 3 4 5 6 7 8 9 10
Score
Freq
uenc
y
Week 5 taste difference (control)
02468
1012
0 1 2 3 4 5 6 7 8 9 10
Score
Freq
uenc
y
Week 9 taste difference (control)
0
5
10
15
0 1 2 3 4 5 6 7 8 9 10
Score
Freq
uenc
y

84
0= not different 15= very different
b a b b ba a a ba baba a a a a
0123456789
101112131415
0 2 3 5 9
Storage time (Weeks)
Aro
ma
diff
eren
ce sc
ore
ControlDPCDHeat
Figure 4-14. Comparison of treatments for aroma difference from control scores during
storage
0= not different 15= very different
c b b b bba a a aa a
a aa
0123456789
101112131415
0 2 3 5 9
Storage time (Weeks)
Taste
diff
eren
ce sc
ore
ControlDPCDHeat
Figure 4-15. Comparison of treatments for taste difference from control scores during
storage
Panelists were also asked to rate off flavor in the samples on a 6-point scale. The
ANOVA of the data suggested that heat treated samples had significantly higher overall
mean off-flavor scores (mean=2.99b) than untreated (mean=2.68a) and DPCD treated

85
(mean=2.66a) coconut water (Table E-8). Weekly comparison of the treatments for off
flavor formation showed that significant difference between treatments was only
occurring at weeks 0 and 2, and became insignificant starting from week 3 (Figure 4-16).
The weekly mean off-flavor scores are in Table E-9. These results also confirm the
overall likeability and taste scores for treatments. These results suggest that heat treated
samples had some off flavor at the beginning of storage which caused a significantly
higher rating for taste difference from untreated control and lowest rating for likeability
of heated samples initially. However, in later weeks either this off flavor was masked by
other flavors, or DPCD treated samples also developed off flavors and overall likeability
or taste difference scores for treatments became closer.
1= none 6= extremely intense
bab
a a ab
b a a aa aa a
a
1
2
3
4
5
6
0 2 3 5 9
Storage time (Weeks)
Off
flav
or sc
ore
ControlDPCDHeat
Figure 4-16. Comparison of treatments for off flavor scores during storage
Overall mean values and comparison of means for overall likeability, taste and
aroma differences from control and off flavor scores for each treatment are summarized
in Table 4-2.

86
Table 4-2. Comparison of overall mean values for sensory attributes from different treatments (α=0.05).
α=0.05 Overall Likeability*
Aroma difference from control*
Taste difference from control*
Off flavor*
Untreated 5.03a 1.15a 2.08a 2.68a DPCD 4.95a 1.92b 3.67b 2.66a Heat 4.58b 2.12b 4.17c 2.99b
*Different letters in a column mean no significant difference between means at �=0.05. (Mean values are averages of all weeks)
To evaluate purchasing potential of the DPCD treated coconut water beverage,
panelists were asked if they would buy the product. The percentages of panelists
answering “yes” to that question are given in Table 4-3 for each treatment at each storage
week. The overall percentages of panelists who would purchase the products were 32.8%
for untreated control, 34.8% for DPCD treated and 28% for heat pasteurized samples.
Panelists who answered “no” were asked if they would buy that product if they knew
about its rehydrating properties. Table 4-4 gives the percentages of the panelists who
were still saying “no” to purchasing the products. Panelists who answered “no” to the
first question and still answering “no” to the second question were 72.4% for control,
72.0% for DPCD and 76.4% for heat pasteurized coconut water. It seems that informing
the panelists about the health benefits of coconut water could only slightly change their
purchase intent.
Table 4-3. The percentages of panelists answering “yes” to the question: Would you buy that product?
Week Control (% of panelists) DPCD (% of panelists) Heat (% of panelists) 0 34 38 22 2 32 30 16 3 38 36 32 5 26 40 34 9 34 30 36

87
Table 4-4. The percentages of panelists answering “no” the first purchase intent question and answering still “no” the second purchase intent question: Would you buy this product if you knew coconut water had rehydrating properties?
Week Control (% of panelists) DPCD (% of panelists) Heat (% of panelists)0 76 68 85 2 91 69 76 3 71 72 76 5 57 80 70 9 67 71 75
Objective 4: To Identify Flavor Compounds in Coconut Water and Compare Flavor
Profile of DPCD and Heat Treated Coconut Water
Literature studies on coconut flavors are limited to fresh coconut meat, milk, or
roasted and grated coconut meat (Lin and Wilkens 1970, Jayalekshmy and others 1991,
Jirovetz and others 2003). Since there was no information on flavor compounds of young
green coconut water in the literature, it was necessary to identify flavor compounds in
untreated coconut water before comparison of flavor profiles in DPCD and heat treated
samples. Flavor compounds were identified in untreated coconut water using GC/MS
with the National Institute of Standards and Technology (NIST) library database and also
some compounds were tentatively identified by matching LRI’s obtained from GC/O
Carbowax and DB-5 columns with those obtained from the literature databases. The
flavor compounds that were identified in coconut water by GC/MS match and also by
tentative match using GC/O are listed in Table 4-5. Studies with coconut show that δ-
lactones give the characteristic coconut aroma, and also some esters, aldehydes and
alcohols are among the flavor compounds in coconut meat or milk (Lin and Wilkens
1970, Jirovetz and others 2003). Although none of the δ-lactones were identified in this
study from coconut water, some esters and aldehydes were identified. In order to have a
better confirmation, standard chemicals of some of these suspected compounds were
obtained and run in GC/MS. Corresponding GC/MS chromatograms are given in Figure

88
C-4. Each of the corresponding peaks were integrated and identified by the software, and
their retention times, GC/MS degree of match values and calculated LRI’s were recorded,
and are given in Table C-3. GC/MS identification outputs that were obtained by NIST
library match of each peak can be found in: CD file “feb2nd GCMS Standards 4
groups.xls”. Coconut water samples were run by GC/MS at the same conditions as
standards, and some flavor compounds were positively confirmed using a similar peak
integration and identification procedure. The compounds that were positively confirmed
in coconut water are shown in red color in Table 4-5 with the calculated LRI’s for those
observed in fresh coconut water (LRI Wax observed) and calculated LRI’s of the
standard chemicals (LRI Wax standard). Some of GC/MS chromatograms that were
obtained by running fresh coconut water samples are given in Figure C-5, and the peak
identification outputs obtained using NIST library matches can be found in: CD files
“March 9th GCMS CW identification of peaks.xls” and “Feb1st GCMS CW
identification of peaks.xls”. Some of the flavor compounds were tentatively determined
in fresh coconut water (Table 4-5). Two sniffers recorded the retention times and gave
the aroma descriptors for sniffed compounds using the olfactory port of GC/O. This
procedure was repeated twice in GC/O with Carbowax and DB-5 columns. LRI’s of the
sniffed compounds were calculated for each column. Literature flavor databases (Acree
and Arn 2005, CREC 2005) provide LRI’s of the chemical compounds in various GC/O
columns with aroma descriptors. 1-Octene-3-one and 2,6-nonadienal had LRI’s close to
literature values in both columns and expected aroma descriptors by the sniffers (Table 4-
5). Retention times, calculated LRI’s and aroma descriptors given by sniffers in GC/O
runs are given in Table C-4 for each column used. The raw data of FID and olfactory port

89
responses can be found in CD folders: “feb7th DB5 CW” and “feb 8th CW wax”.
Methional is tentatively identified in coconut water by matching its observed LRI in
Carbowax column with the literature LRI (Table 4-5), and because its boiled/cooked
potato aroma described by sniffers (Table 4-6) is typical of that compound.
Table 4-5. The list of flavor compounds that were identified in untreated fresh coconut water
Compound LRI Wax observed GC/MS / GC/O
LRI Wax standard/ literature
LRI DB-5 observed
LRI DB-5 literature
GC/MS degree of match (over 1000)
Tentative match
Ethyl butanoate 1049/1055 1048 797 800 826 1-Butanol 1163 1154/1145 ----- 675 893 Octanal 1308/1311 1313/1302 ----- 1002 864 Octene-3-one,1 1316 1315 980 980 ---------- Tentative6-methyl,5-heptene-2-one
1355 1362 ------ ------ atomic spectrum matched
Nonanal 1412 1419/1409 ------ 1107 873 Ethyl octanoate 1450/1456 1451/1444 1196 1195 917 Methional 1476 1478 ------ 913 ------ Tentative2,6-nonadienal 1575 1611 1152 1155 ------- TentativeUndecanal 1630/1631 1630 ------ 1306 881 Methyl dodecanoate
1819 1820 ------ 1509 873
Octanoic acid 2077 2077/2047 ------ 1279 849
Standard chemicals of GC/MS identified compounds were run in GC/O and sniffed
by the sniffers in order to understand whether these flavor compounds were aroma active
at certain concentrations, and also to be familiar with the possible aroma compounds in
coconut water. Tables 4-6 and 4-7 give a list of the standard chemicals that were sniffed
through GC/O with DB-5 and Carbowax columns, with the observed LRI’s, retention
times and the aroma descriptors given by the sniffers. Some of these compounds were not
aroma active at the given concentrations, but sniffers detected most of the standard

90
chemicals at 10 ppm and 100 ppm concentrations through DB-5 or Carbowax columns.
Table 4-7 shows the experiment with standard chemicals that were run through Carbowax
column. Coconut water was also run at the same experimental conditions and LRI’s were
calculated and aroma descriptors were recorded in order to see if any of the standards
could be detected. Among these compounds, 6-methyl-5-heptene-2-one and nonanal were
aroma active at 100 ppm and 10 ppm concentrations, respectively; however, they were
not detected by sniffers. Since these two compounds were detected in coconut water by
GC/MS identification, these results suggest that the concentrations of 6-methyl-5-
heptene-2-one and nonanal were lower than 100 ppm and 10 ppm, respectively. On the
other hand, methyl dodecanoate and octanoic acid were not aroma active at 100 ppm and
10 ppm concentrations, respectively, and were not detected by sniffers. Therefore,
although some flavor compounds were detected in coconut water, concentrations were
not high enough to be detected by sniffers. Table 4-8 summarizes the list of the detected
flavor compounds in coconut water and the aroma descriptors given to them. The raw
data with FID and olfactory responses corresponding to the Tables 4-6 and 4-7 can be
found in CD folders: “Table 4-6 raw data Jan 25th”, “Table 4-7 raw data March 18th”.
Aroma profiles of DPCD and heat treated carbonated coconut water beverages
were developed by sniffing each sample twice by two sniffers in GC/O olfactory port
using a polar Carbowax column. C5-C20 alkane standards were used to calculate LRI
values of the sniffed compounds. Aromagrams of the samples were constructed by taking
average peak areas of the sniffed compounds in the olfactory port and the corresponding
aroma descriptors given by sniffers. Only the compounds that were sniffed at least twice
during four sniffs were reported in the aromagrams. The retention times, calculated

91
LRI’s, peak areas of each olfactory response and average peak areas are given with the
corresponding aroma descriptors in Table C-5 and C-6 for DPCD (25oC ,34.5 MPa, 13%
CO2, 6 min) and heat (74oC, 15 s) treated samples, respectively. The raw data from GC-O
runs can be found in CD file: “March22nd GCO carbonated CW DPCD and heat.xls”.
Figure 4-17 gives the comparison of the aromagrams for DPCD (25oC, 34.5 MPa,
13%CO2, 6 min) and heat treated (74oC, 15 s) carbonated coconut water beverages
stored at 4oC for 2 weeks. Results showed that most of the aroma compounds were
common in DPCD and heat treated coconut water beverages. However, a few more
compounds were sniffed in heat treated samples. GC/MS chromatograms of coconut
water samples also show more peaks detected in heat treated samples compared to DPCD
treated coconut water (Figure C-6). Additional aroma compounds in heat treated samples
were described as fruity, green, nutty, rancid, unpleasant, fatty and burnt aromas. These
aromas were probably developed by decomposition of compounds due to heating.
Table 4-6. Standard chemicals (10 ppm of each in a mixture) that were run in GC/O with DB-5 column
Compound name DB-5 Literature LRI
LRI observed (DB-5)
Rt (min) (DB-5)
Aroma descriptor by sniffer
Aroma descriptor from literature
Propanol 536 ------ ------ Not sniffed Alcohol, pungent
Ethanol 668 ------ ------ Not sniffed Sweet Butanol 675 ------ ------ Not sniffed Medicine, fruit Octanal 1006 1004 11.30 Soapy, fruity Fat, soap,
lemon, green Nonanal 1107 1106 13.53 Butter,
chemical,soap Piney, floral, citrusy
Nonanol 1154 ------ ------ Not sniffed Fat, green Ethyl octanoate 1195 1196 15.44 Sweet, rose Fruity, fat, floralNonanoic acid 1275 1271 16.97 Liquid soap Green, fat Octanoic acid 1279 ------ ------ Not sniffed Sweat, cheese Undecanal 1291 1295 17.44 Old leather Oil, pungent,
sweet

92
Table 4-6. Continued Compound name DB-5
Literature LRI
LRI observed (DB-5)
Rt (min) (DB-5)
Aroma descriptor by sniffer
Aroma descriptor from literature
Gamma-nonalactone
1366 1358 18.66 Sweet, candy Coconut, peach
Delta-decalactone
1469 1463 20.62 Fruity, bubble-gum
Peach
Methyl dodecanoate
1509 ------ ------ Not sniffed Fat, coconut
Carvacrol ------ ------ ------ Not sniffed ------ 2-ethyl-1-hexanol ------ ------ ------ Not sniffed ------ Table 4-7. Standard chemicals (100 ppm each in a mixture) that were run in GC/O with
Carbowax column Chemical Name LRI
observed (Carbowax)
LRI literature (Carbowax)
Rt (min)
Aroma descriptor by sniffer
Methyl dodecanoate 1813 1795 20.98 No odor 6-methyl-5-heptene-2-one
1362 ----- 13.08 Green, chemical
Octanal 1311 1302 12.12 Fatty, green, rancid Ethyl butanoate 1058 1048 7.29 Fruity, sweet,
bubblegum Ethyl octanoate 1449 1444 14.73 Sweet Undecanal 1624 17.88 Green Table 4-8. The descriptors given by sniffers for the flavor compounds identified in coconut water Compound Descriptors from sniffers Ethyl butanoate Sweet, apple, candy, fruity Octanal Green, fatty, rancid Octene-3-one,1 Mushroom, dirt 6-methyl, 5-heptene-2-one
Aroma active at 100 ppm concentration, but not sniffed in coconut water
Nonanal Aroma active at 10 ppm concentration, but not sniffed in coconut water Ethyl octanoate Sweet, cotton-candy Methional Boiled/ cooked potato 2,6-nonadienal Green, almond, woody Undecanal Woody, rancid, soapy, nutty Methyl dodecanoate
Not aroma active at 100 ppm concentration, and not sniffed in coconut water
Octanoic acid Not aroma active at 10 ppm concentration, and not sniffed in coconut water

93
butte
rsco
tch,
spic
ysp
icy,
rose
chem
ical
,spi
cy
burn
t
unpl
easa
nt,ra
ncid
, nut
ty
ranc
id,d
irty
rubb
er, s
mok
ew
ood,
gree
n
gree
n,flo
ral
med
icin
al,e
arth
alco
hol,s
wee
t
swee
t,fru
ity
mus
hroo
m,d
irt
swee
t,fru
itybo
iled
pota
to
nutty
,ranc
id
swee
t, gr
een,
frui
ty
char
coal
,bur
nt,s
wee
t
soap
y,fa
tty
frui
ty,g
reen
unpl
easa
nt, r
anci
d oi
l
900 1100 1300 1500 1700 1900 2100 2300 2500
Linear Retention Index (Wax)
OLF
AC
TOR
Y R
ESPO
NSE
DPCDHEAT
Figure 4-17. Comparison of aromagrams of DPCD (25oC, 34.5 MPa, 13% CO2, 6 min)
and heat (74oC, 15 s) treated carbonated coconut water beverages obtained from olfactory port responses (2 weeks storage at 4oC).

94
CHAPTER 5 CONCLUSIONS
This study involved the formulation of a coconut water beverage, cold
pasteurization of this beverage with dense phase CO2 (DPCD) technology, evaluation of
physical, chemical, microbial and sensory quality of DPCD pasteurized coconut water
compared to fresh and heat pasteurized samples, and optimization of DPCD treatment
conditions for microbial reduction in coconut water.
By considering regulatory and sensory aspects, coconut water needed to be
acidified, sweetened and carbonated. It was acidified with malic acid to a pH around
4.30, sweetened by Splenda (McNeil-PPC, Fort Washington, PA) at a level of 0.7%
(w/w), having a oBrix of 6.0, and carbonated at 4oC and 184 KPa pressure.
The first objective was to quantify microbial reduction in coconut water as a
function of treatment conditions. The response surface methodology (RSM) analysis of
microbial reduction data showed that pressure did not have a significant effect in
microbial reduction and the microbial reduction was predicted as a function of
temperature and CO2 level by the quadratic equation:
log microbial reduction = 5.381 + 0.124*Temp + 0.284*CO2 – 0.355*Temp2 -
0.423*CO2*Temp + 0.05*CO22 (coefficients were calculated for coded values of CO2
level (CO2) and temperature (Temp)).
The response surface did not give an optimum point where the ∂(log
reduction)/∂(Temp)= 0 and ∂(log reduction/∂(CO2)=0 gives the highest microbial
reduction. The response surface plot suggested higher microbial reductions at mid-

95
temperatures and higher CO2 levels. Therefore, the optimum conditions of DPCD
treatment for microbial reduction were determined as 25oC, 34.5 MPa and 13% CO2 (g
CO2/100 g juice) with a 6 min treatment time, which causes 5.77 log reduction in total
aerobic bacterial count.
The second objective was to evaluate physical, chemical and microbial quality of
DPCD treated coconut water during storage. The quality attributes such as pH, oBrix,
titratable acidity, color, aerobic bacteria and yeast counts for DPCD treated coconut water
were measured during 9 weeks of refrigerated storage and compared to those of untreated
control and heat pasteurized samples. Aerobic bacteria and yeast counts for untreated
coconut water increased significantly at the end of 9 weeks, and the aerobic bacteria
count reached above 105cfu/mL, became cloudy, and developed off odors indicating end
of shelf-life. On the other hand, the aerobic bacteria counts and yeast counts for DPCD
and heat treated coconut water decreased significantly at the end of 9 weeks. Carbonation
process was shown to be a possible cause for contamination in DPCD and heat
pasteurized samples. The pH and oBrix of all samples stayed around 4.20 and 6.0,
respectively, throughout storage. Titratable acidity of DPCD treated samples was
significantly higher than fresh and heat pasteurized samples, possibly because of the
dissolved CO2 remaining in coconut water from DPCD treatment. All samples eventually
turned pink during refrigerated storage, independent of the type of treatment. The
preliminary studies on pinking suggested that heating and aeration might accelerate
pinking. Further studies are needed to elaborate the cause of pinking.
The third objective was to compare untreated control, DPCD and heat treated
coconut water by sensory evaluation. Untrained panelists evaluated coconut water

96
samples at weeks 0, 2, 3, 5 and 9 for overall likeability, taste, aroma, off flavor and
purchase intent. DPCD treated and fresh coconut water samples were liked similarly
whereas heat pasteurized coconut water was significantly less liked at the beginning of
storage. DPCD and heat pasteurized samples were not significantly different for aroma
difference from control scores. On the other hand, taste difference from control scores for
DPCD and heat pasteurized samples were significantly different initially and became
similar beginning from 2nd week. Heat pasteurized samples had significantly higher off
flavor scores than DPCD treated samples during the first two weeks.
The fourth objective was to identify flavor compounds in coconut water and
compare flavor profiles of DPCD and heat treated coconut water. Flavor compounds such
as esters (ethyl butanoate, ethyl octanoate), aldehydes (octanal, undecanal, 2,6-
nonadienal) and others were identified in young green coconut water. The aroma profiles
of DPCD and heat treated coconut water beverages showed that heat treated coconut
water had more aroma active compounds than the DPCD treated coconut water. These
were probably created by thermal decomposition during heat treatment and were
described as unpleasant, fatty, green and burnt aroma by sniffers.
This study showed that DPCD treatment extended shelf-life of coconut water
beverage that was acidified, sweetened and carbonated, and the sensory quality of DPCD
treated coconut water was better than heat pasteurized coconut water during the first two
weeks.
As a recommendation for future studies, it would be useful to investigate the
mechanisms and causes of pinking in coconut water so that the means of prevention
could be elaborated. Further studies on sensory evaluation with trained panelists are

97
recommended for better description of the aroma differences between different
treatments. Further studies on instrumental analysis of flavors are also recommended for
more detailed identification of the aroma active compounds.

98
APPENDIX A RESULTS OF PRELIMINARY TESTS WITH COCONUT WATER
Table A-1. Initial aerobic plate count (APC) and yeast and mold (YM) counts for coconut water from eight immature green coconuts
Coconut # 1 2 3 4 5 6 7 8 APC 0-4 51-63 TNTCa
TNTC TNTC TNTC
170-184
182-179
139-137
181-197
YMc NGb NG NG NG NG NG NG NG a too numerous to count ; b no growth; c numbers in red color indicate mold growth (if there is any) Table A-2. Day 9 aerobic plate count (APC) and yeast and mold (YM) counts for coconut
water from selected coconuts of eight immature green coconuts
a numbers in red color indicate mold growth (if there is any); btoo numerous to count
Dilution #
10-1 10-2 10-3 10-4 10-5 10-6
APC 74-60 69-65
7 0-2 1-1
0-0 0-0
0-0 0-1
0-0 0-1
Coconut # 1
YMa 9-8 2-10
1-0 3-3
0-0 0-0
0-0 0-0
0-0 0-0
APC TNTCb TNTC
TNTC TNTC
135-TNTC
46-56 58-59
1-3 5-0
Coconut # 3
YM 146-164 172-173
39-38 28-21
2-1 1-2
0-0 0-0
0-0 0-0
APC TNTC TNTC
186-175 245-175
20-27 27-47
4-5 2-1
0-0 0-0
0-0 0-0
Coconut # 5
YM 69-91 4-0 12-0
3-2 0-0
0-0 0-0
0-0 0-0

99
(Day 0) (Day 9) Figure A-1. Pictures of coconut water from eight immature green coconuts at day 0 (left)
and day 9 (right)
Table A-3. Preliminary pinking test 1: Visual observation of the color of coconut water after different treatments during storage at 4oC in glass tubes
Observation Time:
Control (1)**
Frozen/ Thawed
(2)**
Heated (open air)
(85oC; 5 min) (3)**
Heated (closed) (85oC;
5 min) (4)**
N2 bubbled for 15 min
(5)**
T1 T2 T3 T1 T2 T3 T1 T2 T3 T1 T2 T3 T1 T2 T3Day 0 C C C C C C C C C C C C C C C Day 4 C C C C C C P P P C C C P P C Day 7 * * * Day 9 P C C P C C P P P P C C P P C Day 12 P C C P C C P P P P C C P P C *On day 7, marked tubes were aerated for 15 min; **numbers in parentheses imply treatment numbers referring to the text; T1,T2,T3 indicates three tube replicates; C: Clear color; P: Pink color. Table A-4. Preliminary pinking test 2: Visual observation of the color of coconut water
after different treatments during storage at 4oC in opaque plastic cups Observation Time:
Control (1)*
Ascorbic acid added
(100ppm) (2)*
Potassium metabisulfite
added(40ppm) (3)*
pH=4.0 (by 0.1N HCl)
(4)*
pH=3.0 (by 0.1N HCl)
(5)*
C1 C2 C1 C2 C1 C2 C1 C2 C1 C2 Day 0 to 11 C C C C C C C C C C Day 12 P P C C C C C C C C 3 months P P C C C C P P P P C1: Cup 1; C2: Cup 2; C: Clear color; P: Pink color; *numbers in parentheses imply treatment numbers referring to the text

100
Table A-5. Preliminary pinking test 3: Visual color observation of untreated, heat treated or aerated coconut water during storage in glass tubes at 4oC.
Observation Time:
Control (1)*
Heated at 85oC for 5
min (2)*
Boiled for 5 min (3)*
Aerated for 15 min
(4)*
T1 T2 T3 T1 T2 T3 T1 T2 T3 T1 T2 T3 Day 0 C C C C C C C C C C C C Day 6 C C C P C C P P P P P C Day 10 C C C P P P P P P P P P *Numbers in parentheses imply treatment numbers referring to the text; T1, T2, T3 indicates three tube replicates; C: Clear color; P: Pink color Table A-6. The pH, oBrix and ingredients of commercially available coconut water
beverages Brand Name pH oBrix Ingredients (from Label) Conchita 5.15 9.5 Immature coconut juice, sugar, coconut meat,
potassium metabisulfite La Fe 5.16 8.9 80% immature coconut juice, water, coconut pulp,
sugar, citric acid, sodium metabisulfite Coco Rico 4.12 10.8 Carbonated water, HFCS, coconut extract, sodium
benzoate Goya 5.07 8.9 Immature coconut juice, sugar, coconut pulp,
water,citric acid, potassium metabisulfite KeroCoco 4.89 5.6 Natural coconut water, preservative INS 223 (Sodium
metabisulfite) Grace 4.85 5.9 Coconut water

101
Figure A-2. Pictures showing the steps of extraction of coconut water from coconuts

102
APPENDIX B BOX-BEHNKEN EXPERIMENTAL DESIGN, DATA AND ANALYSIS
Table B-1. The average initial and final aerobic plate counts (APC) ± standard deviations at 15 experimental runs from 3-factor, 3-level Box-Behnken experimental design
Temperature (oC)
Pressure (MPa)
CO2 level (g CO2 / 100 g juice)
Initial APC (cfu/mL)*
Final APC (cfu/mL)*
20 13.8 10 (1.26E+07)± (5.06E+05) 151±17 40 13.8 10 (1.83E+07)± (9.95E+05) 170±10 20 34.5 10 (1.26E+07)± (5.06E+05) 163±24 40 34.5 10 (1.83E+07)± (9.95E+05) 45±10 20 24.1 7 (1.26E+07)± (5.06E+05) 430±16 40 24.1 7 (1.83E+07)± (9.95E+05) 73±7 20 24.1 13 (1.26E+07)± (5.06E+05) 48±12 40 24.1 13 (1.83E+07)± (9.95E+05) 403±93 30 13.8 7 (4.80E+07)± (8.16E+06) 231±51 30 34.5 7 (4.80E+07)± (8.16E+06) 933±115 30 13.8 13 (4.80E+07)± (8.16E+06) 62±19 30 34.5 13 (4.80E+07)± (8.16E+06) 32±4 30 24.1 10 (4.80E+07)± (8.16E+06) 127±4 30 24.1 10 (1.26E+07)± (5.06E+05) 130±23 30 24.1 10 (1.83E+07)± (9.95E+05) 111±13
*Averages of the plates with APC counts lower than 200 colony forming units (cfu’s)

103
Table B-2. SAS software code used for the response surface methodology (RSM) analysis of 15 experimental runs determined by Box-Behnken experimental design
data coconut; input RUN X1 X2 X3 TEMP PRESSURE PCTCO2 LOGRED; datalines; 1 -1 -1 0 20 2000 10 4.924279286 2 1 -1 0 40 2000 10 5.032002168 3 -1 1 0 20 5000 10 4.896250562 4 1 1 0 40 5000 10 5.609238576 5 -1 0 -1 20 3500 7 4.46690209 6 1 0 -1 40 3500 7 5.39912823 7 -1 0 1 20 3500 13 5.419129308 8 1 0 1 40 3500 13 4.660391098 9 0 -1 -1 30 2000 7 5.297425871 10 0 1 -1 30 5000 7 4.712758289 11 0 -1 1 30 2000 13 5.895911402 12 0 1 1 30 5000 13 6.176091259 13 0 0 0 30 3500 10 5.577437516 14 0 0 0 30 3500 10 4.986427193 15 0 0 0 30 3500 10 5.221058405 ; proc print data=coconut; run; proc rsreg data=coconut; model logred = x1 x2 x3; run;
Table B-3. SAS software output of the response surface methodology (RSM) regression
analysis of 15 experimental-run data determined by Box-Behnken experimental design including variables X1 (coded variable for Temperature), X2 (coded variable for Pressure) and X3 (coded variable for %CO2 level)
The RSREG Procedure Coding Coefficients for the Independent Variables
Factor Subtracted off Divided by X1 0 1.000000 X2 0 1.000000 X3 0 1.000000
Response Surface for Variable LOGRED
Response Mean 5.218295 Root MSE 0.386683 R-Square 0.7625 Coefficient of Variation 7.4101
Type I Sum Regression DF of Squares R-Square F Value Pr > F Linear 3 0.778169 0.2472 1.73 0.2752 Quadratic 3 0.628499 0.1997 1.40 0.3452 Crossproduct 3 0.993417 0.3156 2.21 0.2045 Total Model 9 2.400085 0.7625 1.78 0.2716
Sum of Residual DF Squares Mean Square Total Error 5 0.747618 0.149524

104
Table B-3 Continued Parameter
Parameter DF Estimate Standard Error t Value Pr > |t| estimate Intercept 1 5.261641 0.223251 23.57 <.0001 5.261641 X1 1 0.124275 0.136713 0.91 0.4050 0.124275 X2 1 0.030590 0.136713 0.22 0.8318 0.030590 X3 1 0.284414 0.136713 2.08 0.0920 0.284414 X1*X1 1 -0.340179 0.201236 -1.69 0.1517 -0.340179 X2*X1 1 0.151316 0.193341 0.78 0.4693 0.151316 X2*X2 1 0.193980 0.201236 0.96 0.3793 0.193980 X3*X1 1 -0.422741 0.193341 -2.19 0.0805 -0.422741 X3*X2 1 0.216212 0.193341 1.12 0.3143 0.216212 X3*X3 1 0.064925 0.201236 0.32 0.7600 0.064925
Canonical Analysis of Response Surface Based on Coded Data
Critical Value Factor Coded Uncoded X1 0.517443 0.517443 X2 0.016346 0.016346 X3 -0.532945 -0.532945
Predicted value at stationary point: 5.218255 Eigenvectors
Eigenvalues X1 X2 X3 0.258999 -0.093844 0.822796 0.560535 0.109837 0.430314 0.541235 -0.722423 -0.450109 0.897788 -0.173411 0.404852
Stationary point is a saddle point.
Table B-4. SAS software output of the response surface methodology (RSM) regression
analysis of 15 experimental-run data determined by Box-Behnken experimental design including variables X1 (coded variable for Temperature) and X3 (coded variable for %CO2 level)
The RSREG Procedure Coding Coefficients for the Independent Variables
Factor Subtracted off Divided by X1 0 1.000000 X3 0 1.000000
Response Surface for Variable LOGRED
Response Mean 5.218295 Root MSE 0.360958 R-Square 0.6275 Coefficient of Variation 6.9172
Type I Sum
Regression DF of Squares R-Square F Value Pr > F Linear 2 0.770683 0.2448 2.96 0.1030 Quadratic 2 0.489564 0.1555 1.88 0.2080 Crossproduct 1 0.714840 0.2271 5.49 0.0439 Total Model 5 1.975087 0.6275 3.03 0.0707
Sum of Residual DF Squares Mean Square Total Error 9 1.172617 0.130291

105
Table B-4 Continued Parameter DF Estimate Standard Error t Value Pr > |t| parameter Intercept 1 5.381014 0.173399 31.03 <.0001 5.381014 X1 1 0.124275 0.127618 0.97 0.3556 0.124275 X3 1 0.284414 0.127618 2.23 0.0528 0.284414 X1*X1 1 -0.355100 0.187292 -1.90 0.0905 -0.355100 X3*X1 1 -0.422741 0.180479 -2.34 0.0439 -0.422741 X3*X3 1 0.050004 0.187292 0.27 0.7955 0.050004
Sum of Factor DF Squares Mean Square F Value Pr > F X1 3 1.306751 0.435584 3.34 0.0696 X3 3 1.371256 0.457085 3.51 0.0625
The RSREG Procedure Canonical Analysis of Response Surface Based on Coded Data
Critical Value Factor Coded Uncoded X1 0.531209 0.531209 X3 -0.598452 -0.598452
Predicted value at stationary point: 5.328918 Eigenvectors
Eigenvalues X1 X3 0.140206 -0.392502 0.919751 -0.445302 0.919751 0.392502
Stationary point is a saddle point.

106
APPENDIX C GC/O AND GC/MS FLAVOR ANALYSIS DATA AND RESULTS
Table C-1. Excel output of alkane standards’ linear retention index (LRI) calculations in GC/O with a Carbowax column
Standard alkane Retention time (min) LRI literature LRI calculated by formula C10 8.57 1000 1008 C11 10.05 1100 1089 C12 12.14 1200 1198 C13 14.17 1300 1302 C14 16.19 1400 1405 C15 18.03 1500 1502 C16 19.8 1600 1599 C17 21.49 1700 1697 C18 23.09 1800 1797 C19 24.61 1900 1899 C20 26.04 2000 2002
The formula relating alkane standards' LRI's to retention times in Carbowax column
y = 0.0563x3 - 2.3784x2 + 84.352x + 424.06R2 = 0.9998
0
500
1000
1500
2000
2500
0 5 10 15 20 25 30Retention time (min)
LRI
Figure C-1.Plot of the formula relating the LRI’s to the retention times for aroma
compounds in GC/O with a Carbowax column

107
Table C-2. Excel output of alkane standards’ linear retention index (LRI) calculations in GC/O with a DB-5 column
Standard alkane Retention time(min) LRI literature LRI's calculated by the formula C7 4.78 700 706 C8 6.68 800 794 C9 8.9 900 895 C10 11.27 1000 1002 C11 13.44 1100 1102 C12 15.57 1200 1203 C13 17.57 1300 1302 C14 19.47 1400 1400 C15 21.26 1500 1499 C16 22.96 1600 1598 C17 24.57 1700 1698 C18 26.09 1800 1798 C19 27.54 1900 1900 C20 28.91 2000 2002
The formula relating alkane standards' LRI's to retention times in DB-5 column
y = 0.0275x3 - 0.782x2 + 52.633x + 469R2 = 0.9999
0
500
1000
1500
2000
2500
0 5 10 15 20 25 30 35
Retention time (min)
LRI
Figure C-2. Plot of the formula relating the LRI’s to the retention times for aroma
compounds in GC/O with a DB-5 column

108
Figure C-3. An example of GC/MS peak identification using National Institute of Science and Technology (NIST) library database
Step 1. Integration of peaks on GC/MS chromatogram (Numbers above each peak represents retention time in minutes, peak height and peak area from top to bottom, respectively)
Coconut water FRESH2 SPME 09-Mar-2006 16:13:57, Coconut water +
2.26 4.26 6.26 8.26 10.26 12.26 14.26 16.26 18.26 20.26 22.26 24.26 26.26 28.26 30.26 32.26 34.26 36.26 38.26Time0
100
%
coconutl009 Scan EI+ TIC
4.11e8Area, Height
7.02;16671743.0;377321792
3.31189010224.0163870080
17.8613324507.0228001104
7.253838040.016505004
15.043802617.841520276
11.59469640.110770774
9.28383863.25514265
13.71663806.38763753
16.09878296.77956184
24.384471119.5113618136
19.256006361.078180440
21.184326834.569036632
21.89592941.914641322
25.372674308.066172440
39.27837940.17072264
35.641542995.312132749
31.59906248.415858109
30.38391579.26689500
26.83788452.115243993
34.45554234.76726085
Fresh untreated coconut water (45 min of extraction with Solid Phase Microextraction (SPME) at 40-45oC)

109
(Figure C-3 Continued)
Step 2. Identification of a selected peak (the peak with Rt= 17.86 min) using National Institute of Science and Technology (NIST) library database

110
Fi
(T
Mixed stardard group 1 02-Feb-2006 09:03:40, Mixed stardar +
0
100
%
0
100
%
0
100
%
0
100
%
cw01 Scan EI+ TIC30.81
8.6
cw02
8.7
cw03
8.58
cw04
8.6
Group 1 Standards (Standard-CW-1)
gu
he
1.96e8
21.1817.87
9
30.7329.79
27.1726.60
31.5735.30
34.4532.38 32.8836.72 37.50
Scan EI+ TIC
1.21e829.80
6
6
Group 2 Standards (Standard-CW-2)
11.62
9.50
28.4417.23
26.3920.64 21.11 24.8329.02
33.5831.8830.84
38.0534.5035.01
Scan EI+ TIC24.41
Group 3 Standards (Standard-CW-3)
1.25e821.90
15.099.54
28.33
26.86
35.6734.4932.9931.7430.7629.99
Scan EI+ TIC
1.57e830.57 31.24
Group 4 Standards (Standard-CW-4)
re C-4. GC/MS chromatograms of the four mixed groups of standard chemicals that were run in GC/MS for a possible confirmation
list of standards in each mixed group are given in C-5).
10.00 12.00 14.00 16.00 18.00 20.00 22.00 24.00 26.00 28.00 30.00 32.00 34.00 36.00 38.00Time
18.8029.98
28.4826.85
35.5934.4732.68

111
Table C-3. Retention times (RT), linear retention indices (Wax LRI) and GC/MS degree of match values of four mixed group of standard chemicals that were run in GC/MS for possible confirmation
Standard - CW-1 (Group 1 standards) RT (min) Wax LRI
GC/MS identified/degree
of match Ethyl caprylate (ethyl octanoate) 17.87 1451 890 Undecanal 21.18 1630 947 δ-Decalactone 30.81 2248 900 Standard - CW-2 (Group 2 standards) 1-Butanol 11.62 1154 906 Nonanal 17.23 1419 890 γ-Nonalactone 28.44 2084 883 Nonanoic acid 29.80 2178 934 Standard - CW-3 (Group 3 standards) Octanal 15.09 1313 883 Nonanol 21.90 1671 904 Methyl laurate (Methyl dodecanoate) 24.41 1820 905 Octanoic Acid 28.33 2077 912
Standard - CW-4 (Group 4 standards)
2-Ethyl-1-hexanol 18.80 1500 929 Carvacrol 30.57 2232 905 Decanoic acid 31.24 2278 889 GC/MS running conditions: Mass Spec Method Wax column: 40min run (solvent delay of 8 min) GC Method Wax column:40min run (40oC-240oC at ramp rate of 7oC- 9.5min hold) Injector temp - 240°C Injection volume - 0.5ul

112
Figure C-5. Sample GC/MS chromatograms obtained by running fresh coconut water samples.
*SPME: Solid phase microextraction
Coconut water FRESH2 SPME 09-Mar-2006 16:13:57, Coconut water +
2.26 4.26 6.26 8.26 10.26 12.26 14.26 16.26 18.26 20.26 22.26 24.26 26.26 28.26 30.26 32.26 34.26 36.26 38.26Time0
100
%
coconutl009 Scan EI+ TIC
4.11e8Area, Height
7.02;16671743.0;377321792
3.31189010224.0163870080
17.8613324507.0228001104
7.253838040.016505004
15.043802617.841520276
11.59469640.110770774
9.28383863.25514265
13.71663806.38763753
16.09878296.77956184
24.384471119.5113618136
19.256006361.078180440
21.184326834.569036632
21.89592941.914641322
25.372674308.066172440
39.27837940.17072264
35.641542995.312132749
31.59906248.415858109
30.38391579.26689500
26.83788452.115243993
34.45554234.76726085
Coconut water fresh SPME 09-Mar-2006 13:13:45, Coconut water +
3.04 5.04 7.04 9.04 11.04 13.04 15.04 17.04 19.04 21.04 23.04 25.04 27.04 29.04 31.04 33.04 35.04 37.04 39.04Time0
100
%
coconutl007 Scan EI+ TIC
5.11e8Area, Height
7.02;20764292.0;473780576
3.1415403422.0313220224
3.42219865360.0148331040
17.8712485538.0155771744
7.264580465.019347430 17.22
2307376.020214800
11.61571356.516191101
13.68675825.412907235
24.395286358.0137471264
19.273607212.539481708 21.20
993128.616562228
25.372645771.062618372 37.82
1997267.97577922
35.65627627.28408889
31.59641612.412703050
29.581287689.12358715226.84
433681.37352777
34.45505240.85594766
38.88995069.45974896
Fresh untreated coconut water sample 1 (45 min extraction with SPME* at 40-45oC)
Fresh untreated coconut water sample 2 (45 min extraction with SPME* at 40-45oC)

113
Table C-4. Flavor compounds identified in coconut water through GC/O runs: Retention times, calculated Linear Retention Indices (LRI’s) and aroma descriptors given by sniffers in GC/O runs with DB-5 and Carbowax columns
DB-5 Column Carbowax Column Retention time (min)
Linear Retention Index(LRI)
Aroma descriptors by sniffers
Retention time (min)
Linear Retention Index(LRI)
Aroma descriptor by sniffers
6.77 797 Fruity,apple,sweet 9.43 1055 Sweet,fruity, candy,flower
7.82 845 Sweet,fruity,candy 9.74 1072 Sweet, candy 10.81 980 Mushroom,medicinal,
earth 13.34 1260 Green, fruity
11.23 999 Fruity, sweet 14.83 1336 Mushroom, dirt
13.8 1117 Medicinal, chemical,pencil
17.17 1456 Sweet, coconut,candy
14.57 1152 Rancid, green, dirt
19.37 1575 Almond,green, rancid,wood, pencil
15.46 1196 Sweet,candy, rose,flower
24.25 1875 Old leather
15.87 1216 Green, fruity 16.95 1269 Pencil, wood 18.48 1347 Old leather (The same colored letters corresponds to the literature matched compounds based on the LRI’s at DB-5 and Carbowax columns : Ethyl butanoate, 1-octene-3-one, ethyl octanoate, 2,6-nonadienal).

114
Table C-5. Peak areas of the sniffed compounds (olfactory port responses) and the aroma descriptors given by sniffers for DPCD treated (25oC, 34.5 MPa, 13% CO2, 6 min) and carbonated coconut water samples in GC/O with Carbowax column
DPCD treated and Carbonated Coconut Water
RTa (min) LRIb AROMA DESCRIPTOR DPCD1c DPCD2 DPCD3 DPCD4
DPCD AVEd
2.05 951 ALCOHOL,SWEET, FRUTY 0 339374 624020 0 240849
3.05 1047 SWEET,FRUITY, ROSE 792069 206632 0 985164 495966
6.2 1250 0 0 0 0 0
7.45 1315 MUSHROOM,NUTTY, DIRT,RANCID 672647 413901 670617 694377 612886
8.87 1387 ALCOHOL,MEDICINAL, EARTH 708085 234793 0 0 235720
9.96 1443 SWEET,FRUITY, COTTONCANDY 971195 0 711411 0 420652
10.57 1476 BOILED POTATO 750623 0 735610 539867 506525
11.32 1516 GREEN,CHEMICAL, MEDICINAL,FLORAL 929356 0 803886 723693 614234
11.43 1522 BURNT, DIRTY, RANCID OIL,WOOD 882670 391418 671714 469414 603804
11.99 1553 PENCIL,WOOD, ALMOND,GREEN,NUTTY 792753 409736 774259 793723 692618
12.23 1567 0 0 0 0 0
12.9 1605 RUBBER,SMOKEY, BURNT,ROSE 339245 0 351643 513251 301035
13.36 1631 0 0 0 0 0
14.94 1724 DIRT,NUTTY,RANCID, BOILED NUT,EARTH 956838 0 437109 422308 454064
16.76 1833 0 0 0 0 0 17.4 1873 0 0 0 0 19.78 2025 ALCOHOL, BURNT 0 538833 0 421482 240079
21.54 2146 CHEMICAL,GLUE, MEDICINAL,SPICY 869299 0 834402 0 425925
22.3 2200 ROSE,OLD SPICE 294379 0 265553 0 139983
22.52 2217 BUTTERSCOTCH,SPICY, BURNT CARAMEL 1046072 575606 983842 698169 825922
a Retention time; bLinear retention index; c Peak areas of each of four replicates of DPCD treated samples; d Average peak areas of four replicates

115
Table C-6. Peak areas of the sniffed compounds (olfactory port responses) and the aroma descriptors given by sniffers for heat treated (74oC, 15 s) and carbonated coconut water in GC/O with Carbowax column
Heat treated and Carbonated Coconut Water
RTa LRIb AROMA DESCRIPTOR HEAT1c HEAT2 HEAT3 HEAT4 HEAT AVEd
2.05 951 ALCOHOL,SWEET, FRUTY 585587 467181 799533 0 463075
3.05 1047 SWEET,FRUITY,ROSE 658491 338353 720327 0 429293 6.2 1250 FRUITY,GREEN 797552 0 718493 0 379011
7.45 1315 MUSHROOM,NUTTY, DIRT, RANCID 863051 441346 686111 782807 693329
8.87 1387
ALCOHOL, MEDICINAL, EARTH 835683 0 535560 640610 502963
9.96 1443 SWEET, FRUITY, COTTONCANDY 705454 0 840408 327752 468404
10.57 1476 BOILED POTATO 731560 449456 1E+06 414806 686963
11.32 1516
GREEN,CHEMICAL, MEDICINAL, FLORAL 959563 0 624267 613652 549371
11.43 1522 WOODY, PENCIL 446908 731984 747628 0 481630
11.99 1553
PAPER, WOOD, ALMOND,GREEN, FLORAL 538844 979147 1E+06 697627 835177
12.23 1567
SWEET,FLORAL, FRUITY,CANDY, GREEN,BANANA 553982 587634 545965 517102 551171
12.9 1605 0 0 0 0 0
13.36 1631
WOODY,DIRT, RANCID,SOAPY, ALMOND, NUTTY 871909 566836 725192 610807 693686
14.94 1724 DIRT,NUTTY,RANCID, BOILED NUT,EARTH 666693 836192 778033 693411 743582
16.76 1833 NUTTY,RANCID,BAD, RANCID OIL 639297 739951 694090 0 518335
17.4 1873 SOAPY,FAT,ROSY, FLORAL 934488 0 698580 503850 534230
19.78 2025 METAL,COOKED, RANCID, BURNT 429039 0 485639 721339 409004
21.54 2146 0 0 0 0 0
22.3 2200 SPICY,FLORAL, SOAP 628453 0 792350 0 355201
22.52 2217 ROSE,OLD SPICE 688938 0 563572 0 313128
27.00 2557 BUTTERSCOTCH, SPICY, BURNT 970501 478469 1E+06 0 663632
a Retention time; bLinear retention index; c Peak areas of each of four replicates of heat treated samples; d Average peak areas of four replicates
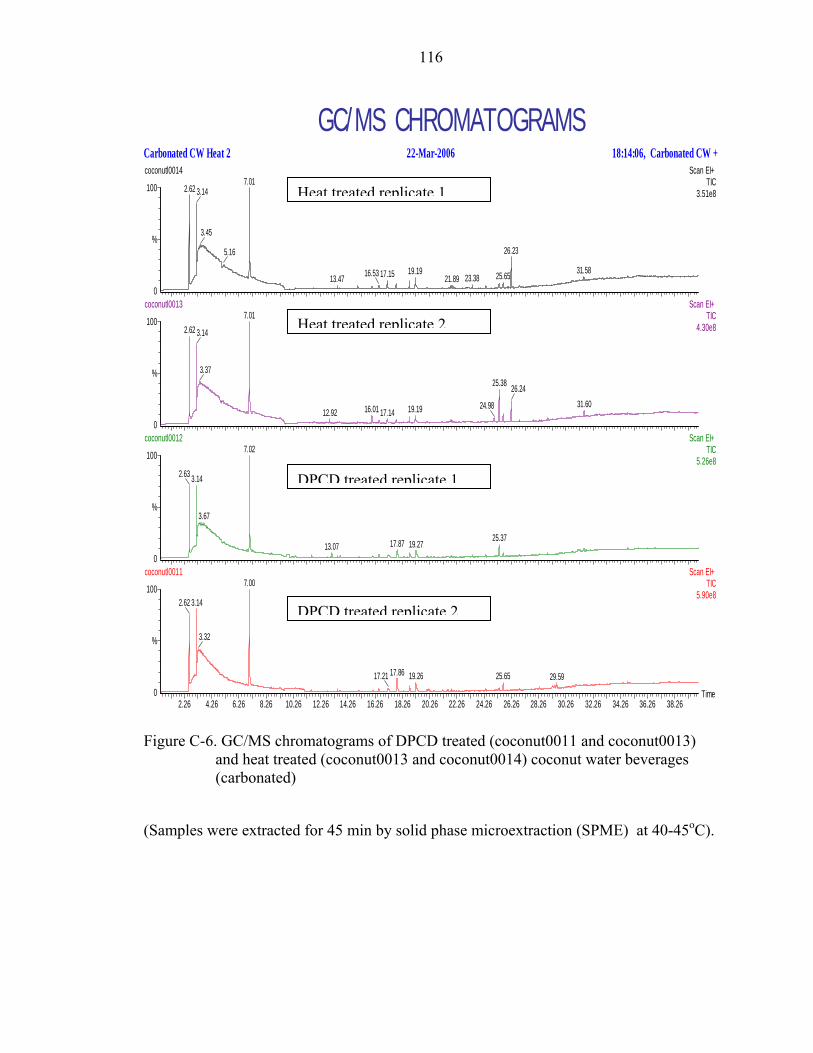
116
GC/MS CHROMATOGRAMSCarbonated CW Heat 2 22-Mar-2006 18:14:06, Carbonated CW +
2.26 4.26 6.26 8.26 10
100
%
0
100
%
0
100
%
0
100
%
coconutl0014 Scan EI+ TIC
3.51e87.01
2.62 3.14
3.45
5.16
coconutl00137.01
2.62 3.14
3.37
coconutl00127.02
3.142.63
3.67
coconutl00117.00
3.142.62
3.32
Figure C-6. GC/MS chand heat tre(carbonated
(Samples were extracte
1
Heat treated replicate26.23
19.1917.1516.5313.47 25.6523.3821.8931.58
Scan EI+ TIC
4.30e82
Heat treated replicate25.38
16.0112.92 19.1917.1424.98
26.2431.60
Scan EI+ TIC
5.26e8
1
DPCD treated replicate25.3717.8713.07 19.27
Scan EI+ TIC
5.90e8
2
DPCD treated replicate0.26 12.26 14.26 16.26 18.26 20.26 22.26 24.26 26.26 28.26 30.26 32.26 34.26 36.26 38.26Time
17.8617.21 25.6519.26 29.59
romatograms of DPCD treated (coconut0011 and coconut0013) ated (coconut0013 and coconut0014) coconut water beverages )
d for 45 min by solid phase microextraction (SPME) at 40-45oC).

117
APPENDIX D STORAGE STUDY: MICROBIAL, CHEMICAL AND PHYSICAL QUALITY DATA
Table D-1. Total aerobic plate counts (APC) of untreated, DPCD treated (34.5 MPa, 25oC, 13% CO2, 6 min) and heat treated (74oC, 15 s) coconut water during storage (4oC)
Storage time (Week)
Control (Untreated)* DPCD treated* Heat pasteurized*
0 1410 ± 46 1130 ± 43 76.33 ± 2 1 485 ± 28 260 ± 27 7.25 ± 2 2 278 ± 19 272 ± 23 3.50 ± 1 3 303 ± 28 1060 ± 25 3.75 ± 0 4 175 ± 18 103 ± 6 4.50± 0 5 242 ± 10 540 ± 28 3.0 ± 1 6 298 ± 22 98 ± 18 2.0 ± 1 9 107000 ± 7150 130 ± 16 1.0 ± 1
*Mean of number of colony forming units (cfu’s) on petrifilms with counts less than 200 ± Std Error (number of replicate petrifilms at each dilution is four) Table D-2. Excel outputs of one-tail t tests conducted for comparison of mean aerobic
plate counts (APC) and yeast and mold (YM) counts for week 0 and week 9 samples.
Control (untreated) coconut water samples’ APC: week0 vs week9 comparison t-Test: Two-Sample Assuming Unequal Variances Variable 1a Variable 2b Mean 1407.5 106500 Variance 8425 2.04E+08 Observations 4 4 Hypothesized Mean Difference 0 df 3 t Stat -14.70 P(T<=t) one-tail 0.0003 t Critical one-tail 2.35 P(T<=t) two-tail 0.0007 t Critical two-tail 3.18 t-Test: Two-Sample Assuming Unequal Variances

118
Table D-2 Continued DPCD treated coconut water samples’ APC: week0 vs week9 comparison Variable 1a Variable 2b Mean 1125 129.625 Variance 7500 1991.411 Observations 4 8 Hypothesized Mean Difference 0 df 4 t Stat 21.60 P(T<=t) one-tail 1.36E-05 t Critical one-tail 2.13 P(T<=t) two-tail 2.72E-05 t Critical two-tail 2.78 Heat treated coconut water samples’ APC: week0 vs week9 comparison t-Test: Two-Sample Assuming Unequal Variances Variable 1a Variable 2b Mean 76.33 1 Variance 16.33 1.33 Observations 3 4 Hypothesized Mean Difference 0 df 2 t Stat 31.34 P(T<=t) one-tail 0.0005 t Critical one-tail 2.92 P(T<=t) two-tail 0.001 t Critical two-tail 4.30 Control (untreated) coconut water samples’ YM: week0 vs week9 comparison t-Test: Two-Sample Assuming Unequal Variances Variable 1a Variable 2b Mean 14.67 1.25 Variance 6.33 0.25 Observations 3 4 Hypothesized Mean Difference 0 df 2 t Stat 9.10 P(T<=t) one-tail 0.006 t Critical one-tail 2.92 P(T<=t) two-tail 0.012 t Critical two-tail 4.30

119
Table D-2 Continued DPCD treated coconut water samples’ YM: week0 vs week9 comparison t-Test: Two-Sample Assuming Unequal Variances Variable 1a Variable 2b Mean 4.666667 0 Variance 4.333333 0 Observations 3 4 Hypothesized Mean Difference 0 df 2 t Stat 3.882901 P(T<=t) one-tail 0.030191 t Critical one-tail 2.919987 P(T<=t) two-tail 0.060382 t Critical two-tail 4.302656 Heat treated coconut water samples’ YM: week0 vs week9 comparison t-Test: Two-Sample Assuming Unequal Variances Variable 1a Variable 2b Mean 1.333333 0 Variance 0.333333 0 Observations 3 4 Hypothesized Mean Difference 0 df 2 t Stat 4 P(T<=t) one-tail 0.028595 t Critical one-tail 2.919987 P(T<=t) two-tail 0.057191 t Critical two-tail 4.302656 a(Variable 1) corresponds to Week 0; b(Variable 2) corresponds to Week 9

120
Table D-3. Aerobic plate counts (APC) and yeast and mold (YM) counts of sterile
distilled water before and after carbonation with the Zalhm carbonator APC counts bYM counts* Dilution: 0 10-1 10-2 0 10-1 Initial counts: 0-0
0-0 0-0 0-0
0-0 0-0
0-0 0
0-0 0-0
Final counts: aTNTC-TNTC
114-124 122-141
------ 231-230 186-179
26-20 17-24
a too numerous to count ; b numbers in red color indicate mold growth (if there is any) * Numbers in red color indicate mold growth (if there is any) Table D-4. Yeast and mold (YM) counts of untreated, heat treated (74oC, 15 s) and
DPCD treated (34.5 MPa, 25oC, 13% CO2, 6 min) coconut water beverages during storage
Storage time
(Week)
Control (Untreated)** DPCD treated** Heat pasteurized**
0 14.67± 1 4.67 ± 1 1.33 ± 0 1 6.00 ± 2 0.25 ± 0 0 ± 0 2 8.00 ± 1 0.25 ± 0 0 ± 0 3 18.75 ± 1 2.75 ± 0 0.25 ± 0 4 8.25 ± 0 2.75 ± 1 0.50± 0 5 10.00 ± 2 1.25± 1 0 ± 0 6 2.50 ± 0 0 ± 0 0 ± 0 9 1.25 ± 0.25 0 ± 0 0 ± 0
(Numbers in red color indicate mold growth (if there is any)) ; **Mean of number of colony forming units (cfu’s) on petrifilms with counts less than 200 ± Std Error (number of replicate petrifilms at each dilution is four) Table D-5. The pH of untreated, DPCD treated and heat pasteurized samples during
storage Storage time
(Week) Control
(Untreated)* aDPCD treated* bHeat pasteurized*
0 4.18 ± 3.44E-08 4.18 ± 0 4.18 ± 0 2 4.17 ± 0 4.16 ± 0 4.16 ± 0 3 4.19 ± 0 4.22 ± 0 4.24 ± 0 5 4.20 ± 0 4.19 ± 0 4.19 ± 0 9 4.24 ± 0 4.20 ± 0 4.22 ± 0
*Mean of three replicate measurements ± Std Error; Treatment conditions: a 34.5 MPa, 25oC, 13% CO2 ; b74oC, 15 s

121
Table D-6. SAS software output of analysis of variance (ANOVA) for the pH data of
different treatments from the storage study
The ANOVA Procedure Dependent Variable: pH
Sum of Source DF Squares Mean Square F Value Pr > F Model 14 0.03118667 0.00222762 38.55 <.0001 Error 30 0.00173333 0.00005778 Corrected Total 44 0.03292000
R-Square Coeff Var Root MSE pH Mean 0.947347 0.181182 0.007601 4.195333
Source DF Anova SS Mean Square F Value Pr > F treat 2 0.00069333 0.00034667 6.00 0.0064 week 4 0.02412000 0.00603000 104.37 <.0001 week*treat 8 0.00637333 0.00079667 13.79 <.0001
Duncan's Multiple Range Test for pH NOTE: This test controls the Type I comparisonwise error rate, not the experimentwise
error rate. Alpha 0.05 Error Degrees of Freedom 30 Error Mean Square 0.000058
Number of Means 2 3 Critical Range .005668 .005957
Means with the same letter are not significantly different Duncan Grouping Mean N treat
A 4.199333 15 heat A 4.196667 15 control B 4.190000 15 CO2
Duncan Grouping Mean N week A 4.223333 9 9 A 4.218889 9 3 B 4.192222 9 5 C 4.180000 9 0 D 4.162222 9 2
Table D-7. The oBrix of untreated, DPCD treated and heat pasteurized samples during
storage Storage time (Week)
Control (Untreated)*
aDPCD treated* bHeat pasteurized*
0 5.9 ± 0 5.9 ± 0 5.9 ± 0 1 6.0 ± 0 6.0 ± 0 6.0 ± 0 2 6.1 ± 0 6.0 ± 0 6.0 ± 0 3 6.0 ± 0 6.1 ± 0 6.0 ± 0 5 6.15 ± 0.05 6.0 ± 0 6.1 ± 0 9 6.1± 0 6.0 ± 0 6.0 ± 0
*Mean of two replicate measurements ± Std Error; Treatment conditions: a 34.5 MPa, 25oC, 13% CO2, 6 min; b74oC, 15 s

122
Table D-8. SAS software output of analysis of variance (ANOVA)for oBrix data of
different treatments from the storage study
The ANOVA Procedure Dependent Variable: Brix
Sum of Source DF Squares Mean Square F Value Pr > F Model 17 0.17805556 0.01047386 37.71 <.0001 Error 18 0.00500000 0.00027778 Corrected Total 35 0.18305556
R-Square Coeff Var Root MSE Brix Mean 0.972686 0.277136 0.016667 6.013889
Source DF Anova SS Mean Square F Value Pr > F
treat 2 0.01388889 0.00694444 25.00 <.0001 week 5 0.11472222 0.02294444 82.60 <.0001
week*treat 10 0.04944444 0.00494444 17.80 <.0001 Duncan's Multiple Range Test for Brix
NOTE: This test controls the Type I comparisonwise error rate, not the experimentwise error rate.
Alpha 0.05 Error Degrees of Freedom 18 Error Mean Square 0.000278 Number of Means 2 3
Critical Range .01429 .01500 Means with the same letter are not significantly different.
Duncan Grouping Mean N treat
A 6.041667 12 control B 6.000000 12 CO2 B 6.000000 12 heat
The ANOVA Procedure
Duncan's Multiple Range Test for Brix NOTE: This test controls the Type I comparisonwise error rate, not the experimentwise error rate.
Alpha 0.05 Error Degrees of Freedom 18 Error Mean Square 0.000278
Number of Means 2 3 4 5 6 Critical Range .02022 .02121 .02184 .02227 .02259
Means with the same letter are not significantly different. Duncan Grouping Mean N week
A 6.083333 6 5 B 6.033333 6 9 B 6.033333 6 2 B 6.033333 6 3 C 6.000000 6 1 D 5.900000 6 0

123
Table D-9. Titratable acidity (as % malic acid (w/v)) of untreated, DPCD treated and heat pasteurized coconut water beverages during storage
Storage time (Week)
Control (Untreated)*
aDPCD treated* bHeat pasteurized*
0 0.2156 ± 0.0192 0.2738 ± 0.0058 0.2291 ± 0.0057 2 0.2604 ± 0.0024 0.2674 ± 0.0065 0.2664 ± 0.0034 3 0.302 ± 0.0062 0.3002 ± 0.0016 0.2738 ± 0.0059 5 0.2512 ± 0.0029 0.2654 ± 0.0001 0.258 ± 0.0039 9 0.2656 ± 0.0176 0.3052 ± 0.0039 0.3033 ± 0.0055
*Mean of three replicate measurements ± Std Error; Treatment conditions: a 34.5 MPa, 25oC, 13% CO2, 6 min ;
b74oC, 15 s Table D-10. SAS software output of analysis of variance (ANOVA) for % titratable
acidity data of different treatments from storage study
The ANOVA Procedure Dependent Variable: %TA
Sum of
Source DF Squares Mean Square F Value Pr > F Model 14 0.02876390 0.00205456 10.81 <.0001
Error 30 0.00570096 0.00019003 Corrected Total 44 0.03446486 R-Square Coeff Var Root MSE %TA Mean 0.834586 5.121316 0.013785 0.269173
Source DF Anova SS Mean Square F Value Pr > F
treat 2 0.00433421 0.00216710 11.40 0.0002
week 4 0.01831396 0.00457849 24.09 <.0001
week*treat 8 0.00611573 0.00076447 4.02 0.0024
Duncan Grouping Mean N treat A 0.282426 15 CO2 B 0.266119 15 heat B 0.258976 15 control Duncan Grouping Mean N week
A 0.292022 9 3 A 0.291379 9 9 B 0.264763 9 2 B 0.258188 9 5 C 0.239515 9 0

124
Table D-11. The mean L*, a*, b* values of untreated, DPCD (34.5 MPa, 25oC, 13% CO2,
6 min) and heat treated (74oC, 15 s) coconut water beverages during storage L* values Week: *Control *DPCD treated *Heat treated
2 59.74±0.17 60.21±0.31 58.97±0.23 3 58.38±0.44 54.75±0.02 58.44±0.75 5 54.15±0.78 52.50±0.28 53.67±0.28 9 58.21±0.35 57.48±0.34 58.21±0.60
a* values Week: *Control *DPCD treated *Heat treated
2 -1.71±0.02 -1.50±0.01 -0.92±0.02 3 -0.60±0.04 4.90±0.10 1.72±0.12 5 3.55±0.17 4.73±0.19 3.27±0.29 9 6.08±0.30 2.37±0.08 1.71±0.01
b* values Week: *Control *DPCD treated *Heat treated
2 1.84±0.02 2.00±0.07 2.17±0.05 3 2.71±0.09 2.99±0.03 3.50±0.07 5 3.85±0.02 2.98±0.12 3.27±0.29 9 2.37±0.16 2.79±0.03 2.42±0.01
*Mean of three replicate measurements ± Std Error;

125
APPENDIX E STORAGE STUDY TASTE PANELS: DATA AND ANALYSIS
Table E-1. Taste panel data output obtained by Compusense software: Sensory evaluation scores of treatments during the storage study (Evaluation score scales: Overall likeability: 9 point scale; Aroma difference and taste difference from control: 15 cm line scale; Off flavor: 6 point scale; Purchase intent and ask again: 1=Yes and 2=No)
Storage time (Weeks) Judges*Treatment
Overall likeability
Aroma difference from control
Taste Difference from control Off-flavor
Purchasea Intent
Ask b
again 0 1 control 6 1 5 2 1 0 1 DPCD 8 0.1 5.4 1 1 0 1 heat 4 2.8 7.1 2 2 2 0 2 control 4 1 2 3 2 2 0 2 heat 1 2.7 5 5 2 2 0 2 DPCD 6 1.1 0.8 2 2 1 0 3 DPCD 6 0.6 3 3 2 2 0 3 control 7 5 1.5 3 2 2 0 3 heat 7 2 4 3 2 2 0 4 DPCD 2 6.6 2.5 5 2 2 0 4 heat 3 0.2 0.5 4 2 2 0 4 control 4 0.1 2.8 3 2 2 0 5 heat 3 0 1.6 3 2 2 0 5 control 7 0 0 1 1 0 5 DPCD 7 0 0 1 1 0 6 heat 9 0.2 0.1 3 1 0 6 DPCD 8 1.3 1.5 2 1 0 6 control 9 0.1 0.1 3 1 0 7 control 3 1.8 1.1 4 2 1 0 7 DPCD 6 0 0 4 1 0 7 heat 5 0 6.1 4 2 1 0 8 control 5 0.6 2.2 2 2 2 0 8 heat 6 0.1 0.8 1 2 2 0 8 DPCD 5 1.5 0.9 2 2 2 0 9 DPCD 3 1.5 2.7 2 2 2 0 9 control 3 1.2 0.2 2 2 2 0 9 heat 3 0.2 2.6 3 2 2 0 10 DPCD 2 0.1 0.5 3 2 2 0 10 heat 2 0 3.3 2 2 2 0 10 control 2 0.2 6.2 4 2 2

126
Table E-1 Continued
Storage time (Weeks) Judges Treatment
Overall likeability
Aroma difference from control
Taste Difference from control Off-flavor
Purchase Intent
Ask again
0 11 heat 5 3 2 3 2 2 0 11 control 5 0.5 4 3 2 2 0 11 DPCD 5 0.5 2 2 2 2 0 12 heat 8 8 2.6 1 1 0 12 DPCD 8 7.1 5.2 1 1 0 12 control 8 2.5 1.8 1 1 0 13 control 9 8.4 6.2 4 1 0 13 DPCD 8 0 8 4 1 0 13 heat 7 0 8 4 1 0 14 control 7 1.2 0.5 2 1 0 14 heat 4 3.3 6.6 1 2 2 0 14 DPCD 7 1.8 2.5 1 1 0 15 DPCD 7 9 5.5 1 1 0 15 control 9 0 0 3 1 0 15 heat 6 0 2 2 1 0 16 DPCD 6 3 4.7 5 1 0 16 heat 7 8.3 4.4 4 1 0 16 control 4 9.3 1 3 2 1 0 17 heat 5 0.1 0.3 3 2 2 0 17 control 5 0.2 0.3 3 2 2 0 17 DPCD 5 0.5 0.6 3 2 2 0 18 heat 7 0.2 0.2 1 1 0 18 DPCD 7 0.2 0.3 1 1 0 18 control 7 0.3 0.3 1 1 0 19 control 3 0.1 6.3 4 2 2 0 19 DPCD 3 0.1 5.6 4 2 2 0 19 heat 2 0.3 7.7 5 2 2 0 20 control 5 1.4 1.8 1 2 1 0 20 heat 6 3.3 4.3 2 2 1 0 20 DPCD 6 1.1 1.9 2 2 1 0 21 DPCD 2 5.4 4.8 5 2 2 0 21 control 2 6.1 5.6 5 2 2 0 21 heat 1 5.2 5.9 4 2 2 0 22 DPCD 6 8.5 1.5 1 2 2 0 22 heat 6 2.5 2 1 2 2 0 22 control 6 1 1.1 1 2 2 0 23 heat 2 1 4 2 2 2 0 23 control 3 0.1 0.2 1 2 2 0 23 DPCD 2 0.1 0.2 1 2 2 0 24 heat 4 0 2.8 2 2 1

127
Table E-1 Continued
Storage time (Weeks) Judges Treatment
Overall likeability
Aroma difference from control
Taste Difference from control Off-flavor
Purchase Intent
Ask again
0 24 DPCD 8 0.3 0.1 1 1 0 24 control 7 0.6 1 1 1 0 25 control 6 6.6 0.9 3 2 2 0 25 DPCD 5 9.4 1.9 3 1 0 25 heat 1 1.5 9.9 6 2 2 0 26 control 3 7.1 2.2 2 2 2 0 26 heat 1 1.9 10 5 2 2 0 26 DPCD 3 1 1 1 2 2 0 27 DPCD 7 1.4 1.5 1 1 0 27 control 5 1.6 1.6 1 2 2 0 27 heat 5 3 2.2 1 2 2 0 28 DPCD 7 0.6 4.3 2 1 0 28 heat 8 0.6 6.2 4 1 0 28 control 6 0.6 4.1 3 1 0 29 heat 2 2.2 8.7 6 2 2 0 29 control 3 1.6 6.7 5 2 2 0 29 DPCD 3 1.5 6.2 5 2 1 0 30 heat 1 0 8 4 2 2 0 30 DPCD 4 0.2 3.7 3 2 2 0 30 control 7 0.1 1.4 2 1 0 31 control 2 4.2 7.9 2 2 1 0 31 DPCD 5 2.8 3.5 1 2 1 0 31 heat 3 2.2 8.1 3 2 1 0 32 control 5 0.1 0.1 3 2 1 0 32 heat 3 0.4 4 3 2 2 0 32 DPCD 5 0.7 1.8 2 2 2 0 33 DPCD 3 0.3 3.8 4 2 2 0 33 control 4 3.4 1.4 3 2 2 0 33 heat 5 0.5 1.2 3 2 2 0 34 DPCD 4 4.7 4.8 3 2 2 0 34 heat 5 2.5 4.4 4 2 2 0 34 control 6 1.5 0.2 1 2 2 0 35 heat 3 5.6 8.9 4 2 2 0 35 control 4 6.7 1.5 1 2 2 0 35 DPCD 4 0.9 3.5 1 2 2 0 36 heat 6 0.7 4.8 4 1 0 36 DPCD 6 0.4 6.9 1 1 0 36 control 8 0.6 5.2 1 1 0 37 control 4 1 7.6 2 2 2 0 37 DPCD 6 2.8 8.4 2 2 1 0 37 heat 7 2.5 9.1 1 1

128
Table E-1 Continued
Storage time (Weeks) Judges Treatment
Overall likeability
Aroma difference from control
Taste Difference from control Off-flavor
Purchase Intent
Ask again
0 38 control 4 0.2 7.4 4 2 2 0 38 heat 6 0.2 1.4 2 2 1 0 38 DPCD 6 0.2 3.1 2 2 1 0 39 DPCD 5 0.2 6.8 4 1 0 39 control 5 0.3 6.1 4 2 1 0 39 heat 6 0.1 1.6 3 1 0 40 DPCD 7 6.2 2.2 2 2 2 0 40 heat 7 3.4 4 1 1 0 40 control 8 2.8 4.3 1 1 0 41 heat 2 2.2 7 5 2 2 0 41 control 3 0.8 5.2 4 2 1 0 41 DPCD 3 0.9 4.8 4 2 1 0 42 heat 4 0.2 6.6 3 2 2 0 42 DPCD 6 0.2 5.4 1 2 1 0 42 control 7 0 0 1 2 1 0 43 control 3 0.9 0.1 3 2 2 0 43 DPCD 5 6.6 4.8 2 2 2 0 43 heat 5 5.4 5.7 2 2 2 0 44 control 5 0 0 1 2 2 0 44 heat 5 0.2 0.3 1 2 2 0 44 DPCD 5 0.1 0.4 1 2 1 0 45 DPCD 3 1 7.8 6 2 2 0 45 control 6 0.1 3.6 1 1 0 45 heat 3 7 9.9 5 2 2 0 46 DPCD 6 7.1 1.6 3 2 1 0 46 heat 1 1.9 4.8 6 2 2 0 46 control 4 0 1 4 2 2 0 47 heat 5 0.8 3.3 2 2 1 0 47 control 7 1.5 2.7 1 1 0 47 DPCD 6 3.5 2.6 1 1 0 48 heat 6 7.6 3.8 5 2 2 0 48 DPCD 6 0.4 0.6 5 2 2 0 48 control 7 2.3 6.9 4 2 2 0 49 control 7 1 0 1 1 0 49 DPCD 7 1 0 1 1 0 49 heat 5 1 3 3 2 2 0 50 control 9 4 0 2 1 0 50 heat 1 5.6 9.9 6 2 2 0 50 DPCD 7 5.8 5.6 2 1 2 1 control 2 1 2 2 2 2 2 1 DPCD 6 0.5 1.5 1 1

129
Table E-1 Continued
Storage time (Weeks) Judges Treatment
Overall likeability
Aroma difference from control
Taste Difference from control Off-flavor
Purchase Intent
Ask again
2 1 heat 4 0.5 3.5 2 2 2 2 2 control 1 2 4.4 4 2 2 2 2 heat 2 0.6 6.6 4 2 2 2 2 DPCD 1 7.9 8.4 3 2 2 2 3 DPCD 7 4.8 2.5 2 2 1 2 3 control 4 4 4.1 2 2 2 2 3 heat 3 3.3 1 2 2 2 2 4 DPCD 6 2.5 4.7 3 1 2 4 heat 5 0.8 8.1 5 2 1 2 4 control 8 1.1 2 3 1 2 5 heat 6 0.6 6.9 3 1 2 5 control 7 0.6 0.7 3 1 2 5 DPCD 5 0.6 4.9 4 2 1 2 6 heat 4 1.5 5.2 3 2 1 2 6 DPCD 3 2.5 6.4 3 2 2 2 6 control 2 1.1 6.6 5 2 2 2 7 control 5 0.2 1.5 2 1 2 7 DPCD 4 0.1 3.8 3 2 1 2 7 heat 3 2.8 5.5 4 2 1 2 8 control 5 1.9 0.9 4 2 2 2 8 heat 7 0.8 4.3 2 1 2 8 DPCD 5 0.5 0.9 3 2 2 2 9 DPCD 5 2.5 0.3 1 1 2 9 control 5 2.2 4 2 1 2 9 heat 2 4.4 7.8 4 2 1 2 10 DPCD 3 4.7 6.8 4 2 2 2 10 heat 4 0.1 8.3 4 2 2 2 10 control 3 0.1 2.8 3 2 2 2 11 heat 6 0.5 1 1 1 2 11 control 7 8.4 0.2 1 1 2 11 DPCD 8 0.4 0.7 1 1 2 12 heat 6 0 2.3 3 2 2 2 12 DPCD 8 0.1 0.1 1 1 2 12 control 7 0.1 2.6 3 1 2 13 control 2 0.9 6.2 4 2 2 2 13 DPCD 5 0.8 6.3 3 2 1 2 13 heat 4 1.3 2 3 2 2 2 14 control 5 0.2 1.8 2 2 2 2 14 heat 5 0.2 0.1 1 2 2 2 14 DPCD 5 0.1 3 2 2 2 2 15 DPCD 5 0.2 6.1 4 1

130
Table E-1 Continued
Storage time (Weeks) Judges Treatment
Overall likeability
Aroma difference from control
Taste Difference from control Off-flavor
Purchase Intent
Ask again
2 15 control 7 1.1 7.7 4 1 2 15 heat 2 0.3 6.4 5 2 2 2 16 DPCD 5 1.8 0.9 3 1 2 16 heat 4 0.9 5.8 3 2 1 2 16 control 6 1 1.5 2 1 2 17 heat 3 1 4.3 5 2 2 2 17 control 2 0.5 0.2 5 2 2 2 17 DPCD 3 1.7 5.2 4 2 2 2 18 heat 3 6.6 1 4 2 2 2 18 DPCD 2 4.8 5.2 5 2 2 2 18 control 4 4.4 0.1 6 2 2 2 19 control 3 0.8 0.5 2 2 2 2 19 DPCD 3 0.8 3.2 3 2 2 2 19 heat 3 0.3 5.2 4 2 2 2 20 control 2 1.5 0.3 2 2 2 2 20 heat 9 6.1 9.4 5 1 2 20 DPCD 3 4.7 1.5 3 2 2 2 21 DPCD 3 0.9 2.2 3 2 2 2 21 control 2 0.7 4.2 4 2 2 2 21 heat 6 1 5.6 4 1 2 22 DPCD 7 0.1 3.6 2 1 2 22 heat 5 1.5 1.1 3 2 2 2 22 control 6 0 0.1 4 1 2 23 heat 3 5.7 7.4 5 2 2 2 23 control 5 0.4 4.1 4 2 2 2 23 DPCD 7 0.2 7.7 3 1 2 24 heat 7 4.1 5.8 3 1 2 24 DPCD 6 1.5 6 1 1 2 24 control 7 5.6 4.9 2 1 2 25 control 1 0.8 4.8 4 2 2 2 25 DPCD 1 0.4 9.1 5 2 2 2 25 heat 1 2.3 9.2 5 2 2 2 26 control 4 1.5 1.1 2 2 2 2 26 heat 5 0.1 1.9 3 2 2 2 26 DPCD 6 3.5 4.5 3 2 1 2 27 DPCD 6 0.6 8.8 4 2 2 2 27 control 3 6.8 1.9 5 2 2 2 27 heat 4 5.7 9.2 3 2 2 2 28 DPCD 5 0.7 0.9 1 2 2 2 28 heat 5 2.9 1.9 1 2 2 2 28 control 5 0.2 2 1 2 2

131
Table E-1 Continued
Storage time (Weeks) Judges Treatment
Overall likeability
Aroma difference from control
Taste Difference from control Off-flavor
Purchase Intent
Ask again
2 29 heat 4 0.6 2 3 2 2 2 29 control 4 0.5 1 2 2 2 2 29 DPCD 4 2.6 0.2 1 2 2 2 30 heat 4 1.5 6.7 3 2 2 2 30 DPCD 5 6.5 4.9 1 2 2 2 30 control 5 0.1 7.8 2 2 2 2 31 control 1 7.2 8.6 5 2 2 2 31 DPCD 3 0.2 8.1 4 2 2 2 31 heat 2 0.5 8.3 4 2 2 2 32 control 3 2 5.1 3 2 2 2 32 heat 5 0.2 4.2 3 2 2 2 32 DPCD 5 0.6 4.8 3 2 1 2 33 DPCD 6 6.1 5.9 3 1 2 33 control 6 0.9 5.4 2 1 2 33 heat 7 1.6 2.8 1 1 2 34 DPCD 5 0.6 1.8 1 2 1 2 34 heat 3 1.5 9.2 4 2 1 2 34 control 1 1.1 8.3 6 2 1 2 35 heat 4 3.1 6.6 3 2 2 2 35 control 4 4 6.3 3 2 2 2 35 DPCD 4 0.2 0.1 2 2 2 2 36 heat 5 0.4 3.7 2 2 2 2 36 DPCD 5 2.2 4.8 1 2 2 2 36 control 5 4.1 3.8 1 2 2 2 37 control 6 4 1.9 1 1 2 37 DPCD 5 3.5 4 2 1 2 37 heat 6 0 0.9 1 1 2 38 control 4 10 10 5 2 2 2 38 heat 4 10 10 4 2 2 2 38 DPCD 6 0.1 9.9 3 2 1 2 39 DPCD 5 1.2 1.7 2 2 2 2 39 control 6 0.6 3.4 1 2 2 2 39 heat 4 3.8 6.6 3 2 2 2 40 DPCD 6 6.5 6.2 2 2 1 2 40 heat 3 1.2 3.8 4 2 2 2 40 control 6 2.8 3.8 2 1 2 41 heat 1 3.9 6.7 4 2 2 2 41 control 6 0.2 1.1 1 2 2 2 41 DPCD 6 2.7 2.7 1 2 2 2 42 heat 3 5.3 7.6 4 2 1 2 42 DPCD 3 0.1 8.2 4 2 1

132
Table E-1 Continued
Storage time (Weeks) Judges Treatment
Overall likeability
Aroma difference from control
Taste Difference from control Off-flavor
Purchase Intent
Ask again
2 42 control 3 2.2 1 3 2 1 2 43 control 5 0.1 0.2 3 2 2 2 43 DPCD 4 2.5 1.2 3 2 2 2 43 heat 2 0.3 7 4 2 2 2 44 control 4 3.6 4 4 2 2 2 44 heat 4 3.5 5.4 5 2 2 2 44 DPCD 4 3 5.3 5 2 2 2 45 DPCD 6 0.9 3.5 1 1 2 45 control 7 0.3 0.9 1 1 2 45 heat 5 0.8 5.4 4 2 1 2 46 DPCD 6 6.9 6.2 4 1 2 46 heat 5 0.9 4.6 1 2 1 2 46 control 7 8.8 3.5 3 1 2 47 heat 4 0.7 2.8 3 2 2 2 47 control 4 0 3.2 4 2 2 2 47 DPCD 6 0 6.1 1 2 2 2 48 heat 3 1.7 6.5 4 2 2 2 48 DPCD 6 6.6 4.1 4 1 2 48 control 8 4 1.8 4 1 2 49 control 1 8.1 9.9 6 2 2 2 49 DPCD 1 3.8 7.1 6 2 2 2 49 heat 1 0.1 0.2 2 2 2 2 50 control 3 0.1 2.2 4 2 1 2 50 heat 4 0.4 2 4 2 1 2 50 DPCD 4 0.5 2.1 4 2 1 3 1 control 6 5 8.7 4 1 3 1 DPCD 3 0.1 1.6 3 2 2 3 1 heat 5 0.2 0.3 3 2 2 3 2 control 6 0.3 4.9 3 2 2 3 2 heat 7 0.1 8.9 3 2 2 3 2 DPCD 5 2.6 0 1 2 2 3 3 DPCD 5 1.5 1.4 4 2 2 3 3 control 6 4.1 2 4 2 2 3 3 heat 4 2 6.8 5 2 2 3 4 DPCD 7 10 0.1 2 1 3 4 heat 5 9.9 9.8 4 2 1 3 4 control 4 10 10 5 2 2 3 5 heat 1 0.1 0.4 2 2 2 3 5 control 1 0.1 0.9 2 2 2 3 5 DPCD 1 0.1 0.3 2 2 2 3 6 heat 1 5.2 1.6 4 2 2

133
Table E-1 Continued
Storage time (Weeks) Judges Treatment
Overall likeability
Aroma difference from control
Taste Difference from control Off-flavor
Purchase Intent
Ask again
3 6 DPCD 5 1 5.5 4 2 2 3 6 control 3 1.9 4 2 2 2 3 7 control 2 6.1 2.6 2 2 2 3 7 DPCD 3 0.1 6.2 1 2 2 3 7 heat 3 0.9 3.7 1 2 2 3 8 control 1 0.3 9.6 6 2 2 3 8 heat 4 4.6 1.1 4 2 2 3 8 DPCD 6 1.2 7.3 3 1 3 9 DPCD 1 5.3 0.6 1 2 2 3 9 control 6 0.3 8.4 1 2 2 3 9 heat 4 5.3 4.3 1 2 2 3 10 DPCD 7 3.5 4.3 3 1 3 10 heat 3 0.1 5.9 4 2 2 3 10 control 6 0.1 6.3 3 1 3 11 heat 4 3.8 1.7 4 2 2 3 11 control 6 0.8 0.2 1 2 1 3 11 DPCD 3 0.8 6.7 5 2 2 3 12 heat 2 0.7 0.9 4 2 2 3 12 DPCD 3 4.2 5.1 5 2 2 3 12 control 3 3.5 7.8 4 2 2 3 13 control 2 4 3 3 2 2 3 13 DPCD 5 0.4 5.5 4 1 3 13 heat 5 2.3 4.9 4 1 3 14 control 3 0.1 0.1 3 2 2 3 14 heat 3 0.6 2 4 2 2 3 14 DPCD 3 0.1 0.6 4 2 2 3 15 DPCD 5 5.3 4.1 4 2 2 3 15 control 5 4.2 7.3 3 2 2 3 15 heat 5 2.2 6.9 3 2 2 3 16 DPCD 2 7.6 7.2 4 2 1 3 16 heat 5 2.2 1.6 1 1 3 16 control 2 2.5 1.7 4 2 1 3 17 heat 5 0.6 1.9 2 2 2 3 17 control 7 0 0 1 1 3 17 DPCD 6 0.3 1 2 2 1 3 18 heat 4 1.1 1 1 2 1 3 18 DPCD 5 1 2 1 2 1 3 18 control 3 0.3 0.6 1 2 1 3 19 control 5 0.1 1 2 2 1 3 19 DPCD 4 0.2 2.7 3 2 2 3 19 heat 3 0.1 4.2 3 2 2

134
Table E-1 Continued
Storage time (Weeks) Judges Treatment
Overall likeability
Aroma difference from control
Taste Difference from control Off-flavor
Purchase Intent
Ask again
3 20 control 3 0.3 1.9 4 2 1 3 20 heat 5 1.7 4.5 4 2 1 3 20 DPCD 6 3.4 4.8 4 2 1 3 21 DPCD 6 1 3 3 1 3 21 control 6 1 4 4 1 3 21 heat 7 0 5 4 1 3 22 DPCD 5 0.1 5.9 5 2 1 3 22 heat 3 1 6.6 4 2 2 3 22 control 8 0.5 0.2 2 1 3 23 heat 5 2.6 0 4 2 1 3 23 control 5 1.7 0.9 4 2 1 3 23 DPCD 6 1.8 1 3 1 3 24 heat 6 2.5 4.5 3 1 3 24 DPCD 4 1.5 3.2 2 2 1 3 24 control 7 0.5 6 4 1 3 25 control 4 0.4 0.2 3 2 2 3 25 DPCD 3 4.8 6.3 4 2 2 3 25 heat 2 5.2 7.8 5 2 2 3 26 control 6 0.3 0.3 1 2 2 3 26 heat 3 5.2 6.2 4 2 2 3 26 DPCD 4 3.4 5.8 2 2 2 3 27 DPCD 5 1.2 5.3 4 2 2 3 27 control 7 0.8 0.1 2 1 3 27 heat 6 0.8 3 2 1 3 28 DPCD 6 3 6.7 2 1 3 28 heat 7 0.3 1.8 1 1 3 28 control 6 0.8 3 2 1 3 29 heat 7 0.5 5.5 2 1 3 29 control 6 0.1 4.3 3 2 2 3 29 DPCD 8 0.2 0 1 1 3 30 heat 2 9.9 8.3 3 2 1 3 30 DPCD 5 8.9 0.8 4 1 3 30 control 6 8.6 2.2 3 1 3 31 control 9 0 0 1 1 3 31 DPCD 7 0 0.4 2 2 1 3 31 heat 7 0 2.2 3 2 1 3 32 control 1 0.3 5.6 2 2 2 3 32 heat 1 6.4 1.2 2 2 2 3 32 DPCD 1 7.2 8.1 2 2 2 3 33 DPCD 6 1.2 2 1 2 1 3 33 control 6 0.6 2.2 1 2 1

135
Table E-1 Continued
Storage time (Weeks) Judges Treatment
Overall likeability
Aroma difference from control
Taste Difference from control Off-flavor
Purchase Intent
Ask again
3 33 heat 6 0.6 3.2 1 2 1 3 34 DPCD 6 4.7 2.2 2 1 3 34 heat 6 0.1 1.1 1 1 3 34 control 7 0.1 1.9 1 1 3 35 heat 6 0.3 4.7 3 1 3 35 control 5 0.1 5.4 2 1 3 35 DPCD 4 0.3 4.8 2 1 3 36 heat 6 7.2 2.5 1 2 1 3 36 DPCD 5 1.4 4.1 1 1 3 36 control 4 0.3 4.8 1 2 1 3 37 control 4 0 3.2 4 2 2 3 37 DPCD 6 4.9 1.9 1 2 2 3 37 heat 5 1.5 2.3 1 2 2 3 38 control 5 0.8 1.9 4 2 1 3 38 heat 4 4.9 6.9 3 2 2 3 38 DPCD 6 2.5 6.5 2 1 3 39 DPCD 7 6.4 6.7 2 1 3 39 control 8 1.1 4.9 1 1 3 39 heat 6 0.4 3 2 1 3 40 DPCD 5 0.8 4 2 2 2 3 40 heat 5 0 4.6 3 2 2 3 40 control 6 0 1.5 1 1 3 41 heat 7 4.7 0.1 2 1 3 41 control 6 0.1 1 2 1 3 41 DPCD 7 0.3 3.2 3 1 3 42 heat 7 0.8 5.2 2 1 3 42 DPCD 7 1.9 6.2 3 1 3 42 control 6 2.8 2.5 2 1 3 43 control 6 0.9 0.3 3 1 3 43 DPCD 6 0 0.2 4 1 3 43 heat 6 0.1 0.2 4 1 3 44 control 4 0 3.7 3 2 2 3 44 heat 3 0 6 4 2 2 3 44 DPCD 6 0 2 1 2 2 3 45 DPCD 5 0.2 4.7 2 2 2 3 45 control 6 0.2 8.1 3 2 2 3 45 heat 4 0.2 8.4 2 2 2 3 46 DPCD 7 0.6 5.9 1 1 3 46 heat 7 0.8 3.5 1 1 3 46 control 8 0.7 0.8 1 1 3 47 heat 7 10 6.1 3 1

136
Table E-1 Continued
Storage time (Weeks) Judges Treatment
Overall likeability
Aroma difference from control
Taste Difference from control Off-flavor
Purchase Intent
Ask again
3 47 control 7 10 5 3 1 3 47 DPCD 6 10 9.2 4 2 1 3 48 heat 5 2 6.1 3 1 3 48 DPCD 4 2 0.5 3 2 2 3 48 control 5 2 3.5 3 2 2 3 49 control 5 8.1 8.6 4 2 2 3 49 DPCD 2 2 9.9 2 2 2 3 49 heat 5 9.6 7.9 3 2 2 3 50 control 4 7 2 2 2 2 3 50 heat 5 4.5 2.5 2 2 2 3 50 DPCD 4 5.1 2 2 2 2 5 1 control 2 7.1 7.7 2 2 2 5 1 DPCD 1 7.7 7.3 2 2 2 5 1 heat 1 7.4 0.2 1 2 2 5 2 control 6 0.5 3 4 1 5 2 heat 8 4.2 3.8 3 1 5 2 DPCD 7 6 6.5 3 1 5 3 DPCD 4 2.5 7.9 5 2 1 5 3 control 5 0.8 4 4 2 1 5 3 heat 4 3 3.7 4 2 1 5 4 DPCD 6 0.1 0.3 1 1 5 4 heat 6 0.1 0.6 2 1 5 4 control 6 0.1 0.1 1 1 5 5 heat 4 0.2 7.2 4 2 2 5 5 control 2 0.3 7 4 2 2 5 5 DPCD 4 3 6.3 3 2 2 5 6 heat 4 1 1 3 2 2 5 6 DPCD 3 2 2 3 2 2 5 6 control 4 1.6 5.8 4 2 2 5 7 control 3 5.2 4.8 4 2 2 5 7 DPCD 5 0.2 5.8 4 2 2 5 7 heat 4 0 3.2 4 2 2 5 8 control 4 1.1 1.2 1 2 1 5 8 heat 3 1.1 3.5 1 2 1 5 8 DPCD 3 0.8 9.1 1 2 1 5 9 DPCD 4 1 3 2 2 2 5 9 control 6 0 0 1 2 1 5 9 heat 7 0 0 1 1 5 10 DPCD 1 0 3 5 2 2 5 10 heat 1 3.7 3.3 6 2 2 5 10 control 1 1.1 1.4 4 2 2

137
Table E-1 Continued
Storage time (Weeks) Judges Treatment
Overall likeability
Aroma difference from control
Taste Difference from control Off-flavor
Purchase Intent
Ask again
5 11 heat 5 2.2 3.2 2 2 2 5 11 control 5 3 1.5 1 2 2 5 11 DPCD 5 2.2 2.8 1 2 2 5 12 heat 7 0.9 1.5 2 1 5 12 DPCD 5 0.2 4 1 2 1 5 12 control 5 0.9 1.9 2 2 1 5 13 control 7 1 0.2 2 1 5 13 DPCD 6 0.6 3 2 1 5 13 heat 7 1.6 2.7 2 1 5 14 control 6 0.6 1 1 1 5 14 heat 7 1 1 1 1 5 14 DPCD 7 0.6 1.5 1 1 5 15 DPCD 4 1 7 5 2 2 5 15 control 5 0.6 0.5 3 2 1 5 15 heat 4 0.1 4 4 2 2 5 16 DPCD 8 9.9 1.1 1 1 5 16 heat 8 0.6 5.2 1 1 5 16 control 8 1.4 1.5 1 1 5 17 heat 6 0 0.9 2 2 1 5 17 control 7 0 0 1 2 1 5 17 DPCD 8 0 2.2 1 1 5 18 heat 5 3.7 4.6 5 2 2 5 18 DPCD 5 4.3 4.3 5 2 2 5 18 control 6 1.5 6.1 4 2 2 5 19 control 4 6.1 3.5 3 2 1 5 19 DPCD 5 1 3.5 3 2 1 5 19 heat 5 1.5 3 2 2 1 5 20 control 2 2.3 0.1 1 2 1 5 20 heat 1 0.2 0.1 1 2 1 5 20 DPCD 2 0.2 2.4 2 2 2 5 21 DPCD 5 7.8 6.9 3 2 2 5 21 control 5 4.4 4.7 3 2 2 5 21 heat 5 4.5 5.4 3 2 2 5 22 DPCD 6 9.7 5.8 2 1 5 22 heat 6 2.2 0.5 2 1 5 22 control 6 4.2 8 4 2 1 5 23 heat 8 9.9 3.5 1 1 5 23 control 8 0.5 0.8 1 1 5 23 DPCD 6 0.8 5.9 2 2 2 5 24 heat 4 0.3 8.9 2 2 1 5 24 DPCD 3 0.7 9.9 2 2 2

138
Table E-1 Continued
Storage time (Weeks) Judges Treatment
Overall likeability
Aroma difference from control
Taste Difference from control Off-flavor
Purchase Intent
Ask again
5 24 control 6 0.9 0.7 1 2 1 5 25 control 5 6.6 6.9 3 1 5 25 DPCD 7 0 3.5 3 1 5 25 heat 7 3.1 3.5 1 1 5 26 control 4 5 7.5 4 2 2 5 26 heat 6 5 6 4 2 2 5 26 DPCD 7 5 7 4 2 2 5 27 DPCD 2 0.1 5 6 2 2 5 27 control 1 0.2 5.4 6 2 2 5 27 heat 1 0.3 0.2 6 2 2 5 28 DPCD 1 0.6 0.9 1 2 2 5 28 heat 1 5.6 2.1 2 2 2 5 28 control 2 1.4 0.8 2 2 2 5 29 heat 3 2.9 6.6 3 2 2 5 29 control 6 4.6 1 1 2 2 5 29 DPCD 5 1.5 3.1 2 2 2 5 30 heat 1 0.9 5.8 2 2 2 5 30 DPCD 1 0.1 3.5 3 2 2 5 30 control 2 0.2 4.4 1 2 2 5 31 control 4 4.8 5.2 3 2 2 5 31 DPCD 5 1.5 3 2 2 2 5 31 heat 5 0.1 3.7 2 2 2 5 32 control 3 0.9 1.4 2 2 2 5 32 heat 3 1.5 4.6 3 2 2 5 32 DPCD 3 4.2 1.2 2 2 2 5 33 DPCD 6 1.5 1.2 1 1 5 33 control 5 0.5 3.6 3 2 1 5 33 heat 5 1.1 1.9 2 2 2 5 34 DPCD 4 0 4.2 4 2 2 5 34 heat 6 3.7 5.8 3 1 5 34 control 7 0 8.4 3 2 2 5 35 heat 9 1 6.5 1 1 5 35 control 6 0.7 1.6 3 1 5 35 DPCD 6 1.7 7.7 2 1 5 36 heat 3 0.4 1.4 4 2 2 5 36 DPCD 2 0.8 0.8 4 2 2 5 36 control 4 1 3.5 3 2 2 5 37 control 6 2.8 1.3 1 2 1 5 37 DPCD 2 1.1 6.9 3 1 5 37 heat 4 0.9 1.2 1 1 5 38 control 3 2.5 7.8 4 2 1
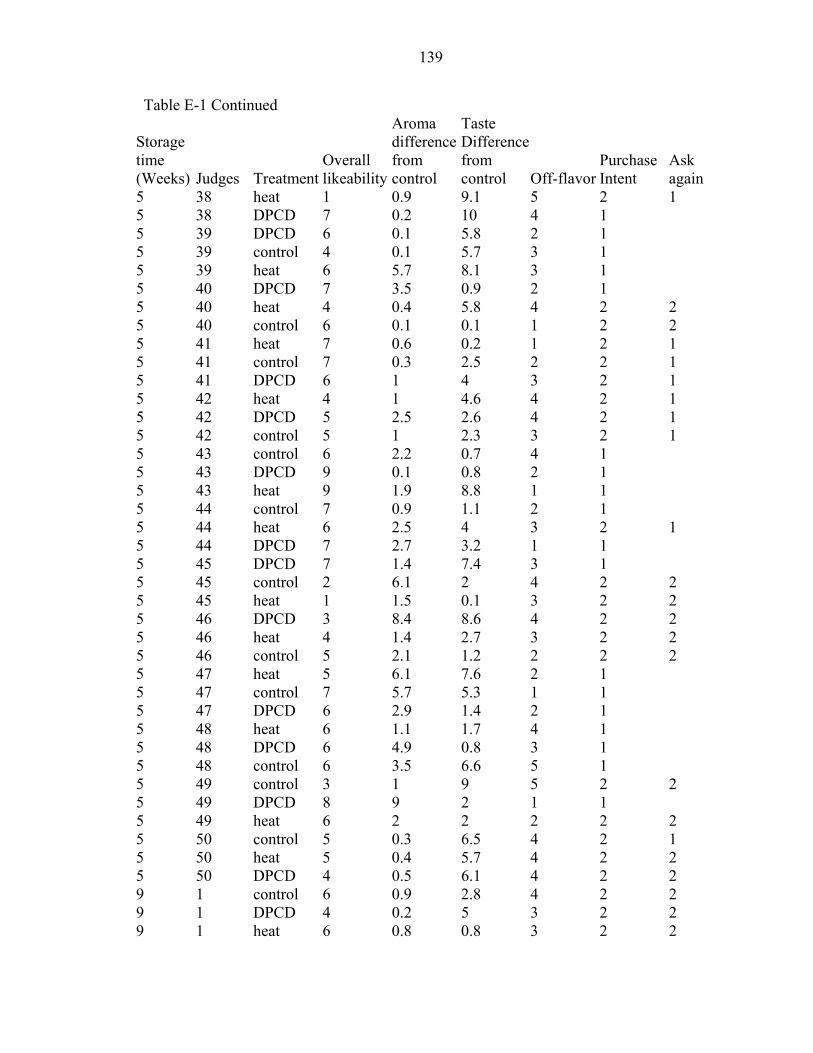
139
Table E-1 Continued
Storage time (Weeks) Judges Treatment
Overall likeability
Aroma difference from control
Taste Difference from control Off-flavor
Purchase Intent
Ask again
5 38 heat 1 0.9 9.1 5 2 1 5 38 DPCD 7 0.2 10 4 1 5 39 DPCD 6 0.1 5.8 2 1 5 39 control 4 0.1 5.7 3 1 5 39 heat 6 5.7 8.1 3 1 5 40 DPCD 7 3.5 0.9 2 1 5 40 heat 4 0.4 5.8 4 2 2 5 40 control 6 0.1 0.1 1 2 2 5 41 heat 7 0.6 0.2 1 2 1 5 41 control 7 0.3 2.5 2 2 1 5 41 DPCD 6 1 4 3 2 1 5 42 heat 4 1 4.6 4 2 1 5 42 DPCD 5 2.5 2.6 4 2 1 5 42 control 5 1 2.3 3 2 1 5 43 control 6 2.2 0.7 4 1 5 43 DPCD 9 0.1 0.8 2 1 5 43 heat 9 1.9 8.8 1 1 5 44 control 7 0.9 1.1 2 1 5 44 heat 6 2.5 4 3 2 1 5 44 DPCD 7 2.7 3.2 1 1 5 45 DPCD 7 1.4 7.4 3 1 5 45 control 2 6.1 2 4 2 2 5 45 heat 1 1.5 0.1 3 2 2 5 46 DPCD 3 8.4 8.6 4 2 2 5 46 heat 4 1.4 2.7 3 2 2 5 46 control 5 2.1 1.2 2 2 2 5 47 heat 5 6.1 7.6 2 1 5 47 control 7 5.7 5.3 1 1 5 47 DPCD 6 2.9 1.4 2 1 5 48 heat 6 1.1 1.7 4 1 5 48 DPCD 6 4.9 0.8 3 1 5 48 control 6 3.5 6.6 5 1 5 49 control 3 1 9 5 2 2 5 49 DPCD 8 9 2 1 1 5 49 heat 6 2 2 2 2 2 5 50 control 5 0.3 6.5 4 2 1 5 50 heat 5 0.4 5.7 4 2 2 5 50 DPCD 4 0.5 6.1 4 2 2 9 1 control 6 0.9 2.8 4 2 2 9 1 DPCD 4 0.2 5 3 2 2 9 1 heat 6 0.8 0.8 3 2 2

140
Table E-1 Continued
Storage time (Weeks) Judges Treatment
Overall likeability
Aroma difference from control
Taste Difference from control Off-flavor
Purchase Intent
Ask again
9 2 control 4 8 7.6 3 2 2 9 2 heat 5 5.7 8.1 3 2 2 9 2 DPCD 5 8.9 3.5 3 2 2 9 3 DPCD 3 0.6 6.6 5 2 2 9 3 control 5 0.4 1.9 3 1 9 3 heat 3 0.3 7.2 4 2 2 9 4 DPCD 2 1.1 1.9 4 2 2 9 4 heat 6 0.1 6.3 3 2 2 9 4 control 6 0.5 7.1 3 2 2 9 5 heat 5 0.5 4.9 3 2 2 9 5 control 4 0.2 0.6 2 2 2 9 5 DPCD 4 0.4 5 2 2 2 9 6 heat 3 0.4 7.5 4 2 2 9 6 DPCD 3 0.6 6.9 4 2 2 9 6 control 5 5.8 5.6 3 2 2 9 7 control 9 1 8 4 1 9 7 DPCD 5 0.1 0.2 3 2 2 9 7 heat 7 0 8 5 1 9 8 control 7 0.3 0.9 1 1 9 8 heat 7 0.3 1.4 3 1 9 8 DPCD 8 3.3 0.9 1 1 9 9 DPCD 6 2.2 3.8 1 1 9 9 control 7 1.8 0.3 1 1 9 9 heat 6 1 4.8 1 1 9 10 DPCD 7 0.4 2.2 1 2 2 9 10 heat 8 0.8 2.2 1 2 1 9 10 control 8 0 0 1 1 9 11 heat 7 3.2 2.3 1 1 9 11 control 7 0.1 0.1 1 1 9 11 DPCD 5 0.1 8.4 2 2 1 9 12 heat 7 5.7 4.4 3 1 9 12 DPCD 6 2.2 5.9 2 2 1 9 12 control 5 1 3.5 4 2 2 9 13 control 5 0.3 0.5 2 2 2 9 13 DPCD 5 0.2 0.5 1 2 2 9 13 heat 5 0.3 4.7 1 2 2 9 14 control 3 1.5 0 4 2 2 9 14 heat 2 2.5 2.5 5 2 2 9 14 DPCD 3 0.1 0.5 5 2 2 9 15 DPCD 5 0.1 0.8 2 2 1 9 15 control 5 0.1 0.1 2 2 1

141
Table E-1 Continued
Storage time (Weeks) Judges Treatment
Overall likeability
Aroma difference from control
Taste Difference from control Off-flavor
Purchase Intent
Ask again
9 15 heat 5 0.3 0.6 2 2 1 9 16 DPCD 7 4.5 1.9 3 1 9 16 heat 6 1.3 5.3 2 1 9 16 control 7 2.3 3.8 2 1 9 17 heat 8 0 0 2 1 9 17 control 8 0 0 2 1 9 17 DPCD 6 1.4 6.7 2 1 9 18 heat 7 0.6 0.3 1 1 9 18 DPCD 8 0.5 0.3 1 1 9 18 control 7 0.4 0.8 1 1 9 19 control 7 0.1 0 2 2 2 9 19 DPCD 7 2.5 2.8 1 1 9 19 heat 8 1.2 3 4 1 9 20 control 6 4.1 4.8 4 2 1 9 20 heat 5 5.8 3.8 3 2 2 9 20 DPCD 6 4.3 1.1 1 1 9 21 DPCD 3 7.6 0.6 5 2 2 9 21 control 7 9.6 8.8 3 1 9 21 heat 1 4.1 0.1 6 2 2 9 22 DPCD 2 6.4 7.1 5 2 2 9 22 heat 4 1.1 3.7 3 2 2 9 22 control 5 0.6 7 5 2 2 9 23 heat 3 1.3 4 4 2 2 9 23 control 5 0.3 3.5 2 2 2 9 23 DPCD 5 1.1 2.5 2 2 2 9 24 heat 1 9 10 6 2 2 9 24 DPCD 5 8 2 2 2 2 9 24 control 6 2 3.5 2 2 1 9 25 control 6 2.8 3.5 3 1 9 25 DPCD 2 0.1 9.2 5 2 2 9 25 heat 7 6.2 2.2 1 1 9 26 control 5 0.9 2.2 2 2 2 9 26 heat 4 3.8 3.2 3 2 2 9 26 DPCD 3 2 4.3 3 2 2 9 27 DPCD 3 3.5 2.7 5 2 1 9 27 control 4 3.9 6.1 4 2 1 9 27 heat 6 6.3 8.1 3 2 1 9 28 DPCD 6 9.1 4.9 2 2 1 9 28 heat 6 2 7.6 2 2 1 9 28 control 6 2 3 2 2 1 9 29 heat 4 4.8 2.2 4 2 1

142
Table E-1 Continued
Storage time (Weeks) Judges Treatment
Overall likeability
Aroma difference from control
Taste Difference from control Off-flavor
Purchase Intent
Ask again
9 29 control 2 0 8.7 5 2 2 9 29 DPCD 3 1.4 6.7 4 2 2 9 30 heat 8 0.2 1.4 1 1 9 30 DPCD 5 8.7 6.4 3 2 1 9 30 control 6 4 0.9 2 1 9 31 control 2 6.2 5.8 4 2 1 9 31 DPCD 6 5 7.8 3 1 9 31 heat 6 0 7.9 3 2 2 9 32 control 6 7.9 2.2 3 2 1 9 32 heat 6 0.6 7.6 3 2 1 9 32 DPCD 7 0.6 3.5 4 1 9 33 DPCD 6 1 3 3 1 9 33 control 4 0.5 6 4 2 2 9 33 heat 6 0.2 5 3 1 9 34 DPCD 5 0 0.3 1 2 2 9 34 heat 5 0.2 0.6 1 2 2 9 34 control 5 0 0.2 1 2 2 9 35 heat 8 8.4 5.3 4 1 9 35 control 6 4.9 6.3 6 2 1 9 35 DPCD 7 5 4.8 3 1 9 36 heat 3 4.8 5.9 4 2 2 9 36 DPCD 4 4.2 4.4 3 2 2 9 36 control 4 1.5 2.5 3 2 2 9 37 control 3 0.2 0.6 4 2 2 9 37 DPCD 2 2.3 3.8 5 2 2 9 37 heat 2 0.7 4.7 5 2 2 9 38 control 7 0.4 0.6 1 1 9 38 heat 4 0 5.3 4 1 9 38 DPCD 2 0 10 5 2 2 9 39 DPCD 7 3 2.8 2 2 1 9 39 control 6 7.9 7 4 2 1 9 39 heat 3 2 8 5 2 1 9 40 DPCD 4 0.3 3.3 3 2 1 9 40 heat 6 1.5 3.3 2 1 9 40 control 7 0.1 0.4 1 1 9 41 heat 8 1.5 4.5 1 1 9 41 control 8 2.4 4.2 1 1 9 41 DPCD 6 0.2 1.9 1 1 9 42 heat 3 0.2 9.6 5 2 2 9 42 DPCD 5 5.7 0.3 1 2 2 9 42 control 5 6.3 0.3 1 2 2

143
Table E-1 Continued
Storage time (Weeks) Judges Treatment
Overall likeability
Aroma difference from control
Taste Difference from control Off-flavor
Purchase Intent
Ask again
9 43 control 4 0.1 1.7 5 2 2 9 43 DPCD 3 2.2 9.2 6 2 2 9 43 heat 2 0.1 9.9 6 2 2 9 44 control 4 0.6 2 2 2 2 9 44 heat 5 0.6 2.8 1 2 2 9 44 DPCD 4 0.6 1 2 2 2 9 45 DPCD 5 0 2.6 4 2 2 9 45 control 7 0 7.8 4 2 2 9 45 heat 4 0 0 2 2 2 9 46 DPCD 7 1.1 0.7 4 1 9 46 heat 2 8.2 8.6 5 2 2 9 46 control 6 0.9 2.3 2 2 1 9 47 heat 5 6.5 4.2 3 2 1 9 47 control 6 2.8 1.1 3 1 9 47 DPCD 5 1.2 1.4 3 2 1 9 48 heat 6 8.2 3.8 2 1 9 48 DPCD 7 0.8 5 2 1 9 48 control 4 3.2 7.5 3 2 1 9 49 control 8 0.1 5 3 1 9 49 DPCD 3 0.1 9 4 2 1 9 49 heat 5 0.1 4.5 4 1 9 50 control 3 0.2 5.2 2 2 2 9 50 heat 1 0.2 9.8 5 2 2 9 50 DPCD 7 0.2 3.7 4 1
a Purchase intent: Panelists answering “Yes” to the “Would you buy this product?” question chose score “1” and those answering “No” to the same question chose score “2”. b Ask Again: Panelists choosing score “2” were asked a second question; ”Would you buy this product if you knew its rehydrating properties”. If their answer was “Yes”, they chose score “1” and if “No”, they chose the score “2”. This column is empty if the panelist was not asked the second question. *Control (untreated); Heat (heat treated at 74oC, 15 s); DPCD (DPCD treated at 34.5 MPa, 25oC, 13%CO2, 6 min); Storage at 4oC

144
Table E-2. SAS software output of analysis of variance (ANOVA) for “overall
likeability” data for untreated, DPCD and heat treated coconut water by panelists The ANOVA Procedure
Dependent Variable: likeability Sum of Source DF Squares Mean Square F Value Pr > F Model 259 1906.118667 7.359532 4.35 <.0001 Error 490 829.040000 1.691918 Corrected Total 749 2735.158667 R-Square Coeff Var Root MSE likeability Mean 0.696895 26.79355 1.300738 4.854667
Source DF Anova SS Mean Square F Value Pr > F week 4 47.565333 11.891333 7.03 <.0001 panelist(week) 245 1798.260000 7.339837 4.34 <.0001 treat 2 29.090667 14.545333 8.60 0.0002 week*treat 8 31.202667 3.900333 2.31 0.0197 The ANOVA Procedure Duncan's Multiple Range Test for likeability NOTE: This test controls the Type I comparisonwise error rate, not the experimentwise error rate. Alpha 0.05 Error Degrees of Freedom 490 Error Mean Square 1.691918 Number of Means 2 3 Critical Range .2286 .2407 Means with the same letter are not significantly different. Duncan Grouping Mean N treat A 5.0320 250 control A 4.9520 250 DPCD B 4.5800 250 heat
Table E-3. The weekly mean “overall likeability” scores for untreated, DPCD and heat
pasteurized samples during storage Storage time
(Week) Control
(Untreated)* DPCD* Heat* 0 5.36±0.29 5.34±0.25 4.38±0.31 2 4.38±0.29 4.76±0.24 4.08±0.24 3 5.06±0.27 4.88±0.25 4.68±0.25 5 4.80±0.26 4.90±0.30 4.76±0.32 9 5.56±0.23 4.88±0.25 5.00±0.29
*Mean weekly score ± Std error

145
Table E-4. SAS software output of analysis of variance (ANOVA) for “aroma difference
from control scores” (corrected data) of different treatments during storage study
The ANOVA Procedure
Dependent Variable: aroma
Sum of Source DF Squares Mean Square F Value Pr > F
Model 224 1449.077612 6.469096 2.08 <.0001
Error 420 1303.573488 3.103746
Corrected Total 644 2752.651101
R-Square Coeff Var Root MSE aroma Mean 0.526430 101.7484 1.761745 1.731473
Source DF Anova SS Mean Square F Value Pr > F week 4 4.652651 1.163163 0.37 0.8267 panelist(week) 210 1315.925116 6.266310 2.02 <.0001 treat 2 112.821054 56.410527 18.17 <.0001 week*treat 8 15.678791 1.959849 0.63 0.7514
Duncan's Multiple Range Test for aroma NOTE: This test controls the Type I comparisonwise error rate, not the experimentwise
error rate. Alpha 0.05 Error Degrees of Freedom 420 Error Mean Square 3.10374 Number of Means 2 3 Critical Range .3340 .3516
Means with the same letter are not significantly different.
Duncan Grouping Mean N treat A 2.1242 215 DPCD A 1.9181 215 heat B 1.1521 215 control
Table E-5. The weekly mean “aroma difference from control” scores for untreated,
DPCD treated (34.5 MPa, 25oC, 13% CO2, 6 min) and heat treated (74oC, 15 s) coconut water during storage (4oC)
Week Control* DPCD* Heat* 0 0.99±0.16 2.09±0.40 1.82±0.33 2 1.37±0.21 2.18±0.34 1.77±0.27 3 0.91±0.18 2.09±0.32 1.88±0.32 5 1.35±0.20 2.31±0.43 1.79±0.30 9 1.15±0.20 1.95±0.37 2.34±0.43
*Mean weekly score ± Std error

146
Table E-6. SAS software output for analysis of variance (ANOVA) for “taste difference
from control scores” (corrected data) of different treatments during the storage study
The ANOVA Procedure Class Level Information Class Levels Values week 5 0 2 3 5 9 panelist 50 1 2 3 4 5 6 7 8 9 10 11 12 13 14 15 16 17 18 19 20 21 22 23 24 25 26 27 28 29 30 31 32 33 34 35 36 37 38 39 40 41 42 43 44 45 46 47 48 49 50 treat 3 DPCD control heat Number of Observations Read 597 Number of Observations Used 597
The ANOVA Procedure Dependent Variable: tastediff
Sum of Source DF Squares Mean Square F Value Pr > F Model 208 2171.954631 10.442090 2.39 <.0001 Error 388 1698.488317 4.377547 Corrected Total 596 3870.442948
R-Square Coeff Var Root MSE tastediff Mean 0.561164 63.23168 2.092259 3.308878
Source DF Anova SS Mean Square F Value Pr > F week 4 40.635925 10.158981 2.32 0.0564 panelist(week) 194 1591.380356 8.202992 1.87 <.0001 treat 2 477.201642 238.600821 54.51 <.0001 week*treat 8 62.736708 7.842089 1.79 0.0772
Duncan's Multiple Range Test for tastediff NOTE: This test controls the Type I comparisonwise error rate, not the experimentwise
error Alpha 0.05 Error Degrees of Freedom 388 Error Mean Square 4.377547
Number of Means 2 3 Critical Range .4124 .4341
Means with the same letter are not significantly different.
Duncan Grouping Mean N treat A 4.1744 199 heat B 3.6744 199 DPCD C 2.0779 199 control
Table E-7. The weekly mean “taste difference from control” scores for untreated, DPCD
treated (34.5 MPa, 25oC, 13% CO2, 6 min) and heat treated (74oC, 15 s) coconut water during storage (4oC)
Week Control* DPCD* Heat* 0 1.66±0.26 2.79±0.33 4.37±0.46 2 2.32±0.25 3.99±0.40 4.76±0.41 3 2.21±0.27 3.72±0.42 3.72±0.38 5 2.20±0.29 3.99±0.43 3.45±0.40 9 2.01±0.29 3.92±0.48 4.56±0.47
*Mean weekly score ± Std error

147
Table E-8. SAS software output for analysis of variance (ANOVA) of “off flavor” scores of different treatments during storage study
The ANOVA Procedure Dependent Variable: offflavor
Sum of Source DF Squares Mean Square F Value Pr > F Model 259 953.312000 3.680741 4.23 <.0001 Error 490 425.946667 0.869279 Corrected Total 749 1379.258667
R-Square Coeff Var Root MSE offflavor Mean 0.691177 33.55391 0.932351 2.778667
Source DF Anova SS Mean Square F Value Pr > F week 4 18.6186667 4.6546667 5.35 0.0003 panelist(week) 245 903.9733333 3.6896871 4.24 <.0001 treat 2 16.4826667 8.2413333 9.48 <.0001 week*treat 8 14.2373333 1.7796667 2.05 0.0395
Duncan's Multiple Range Test for offflavor NOTE: This test controls the Type I comparisonwise error rate, not the experimentwise
error Alpha 0.05 Error Degrees of Freedom 490 Error Mean Square 0.869279 Number of Means 2 3 Critical Range .1639 .1725
Means with the same letter are not significantly different. Duncan Grouping Mean N treat
A 2.98800 250 heat B 2.68400 250 control B 2.66400 250 DPCD
Table E-9. The weekly mean “off flavor” scores for untreated, DPCD treated (34.5 MPa,
25oC, 13% CO2, 6 min) and heat treated (74oC, 15 s) coconut water during storage (4oC)
Storage time (Week)
Control (Untreated)* DPCD* Heat*
0 2.40±0.18 2.40±0.20 3.14±0.22 2 3.06±0.20 2.72±0.19 3.28±0.17 3 2.60±0.18 2.64±0.17 2.78±0.17 5 2.64±0.19 2.64±0.19 2.64±0.19 9 2.72±0.18 2.92±0.20 3.10±0.21
*Mean weekly score ± Std error

148
Table E-10. Sample ballots that were used in sensory panels throughout the storage study (Output obtained by Compusense software).
Carbonated Coconut Water
*NOTE: Today's samples contain an artificial sweetener (Sucralose, Brand Name: Splenda). If you are, or suspect you are, allergic, sensitive, or
otherwise not able to consume artificial sweeteners, please DO NOT taste today. Thank you.
Panelist Code: ________________________ Panelist Name: ________________________________________________ Question # 1. Please indicate your gender.
Male Female
Question # 2. Male: Please indicate your age range.
Under 18 18-29 30-44 45-65 Over 65
Question # 3. Female: Please indicate your age range.
Under 18 18-29 30-44 45-65 Over 65

149
Table E-10 Continued Question # 4 - Sample ______ Review Instructions Do not taste any of the samples at this time. The first test will be smelling
the samples. Please read the directions on the next screen. You are being presented with a reference sample marked 000. Please SMELL the reference sample. Then SMELL sample %01 and compare it to the reference sample. Please mark how different the sample SMELLS from the reference sample on the line scale. Sample Aroma Not Different Very At All Different
Question # 5 - Sample ______ Review Instructions
Take a bite of cracker and a sip of water to rinse your mouth.
The next 4 questions are related to your tasting experince.
Please make the sample last, we have limited source. Click on the 'Continue' button below.
You are being presented with a reference sample marked 000. Please TASTE this sample. Then TASTE sample %01 and compare it to the reference sample. Then mark how different the sample TASTES from the reference sample on the line scale. Taste Difference Not Different Very At All Different
Question # 6 - Sample ______ How much do you like the sample %01 OVERALL? Sample %01 dislike neither like extremely like nor extremely dislike
1 2 3 4 5 6 7 8 9 Question # 7 - Sample ______

150
Table E-10 Continued Please rate the intensity of the OFF FLAVOR, if any. Off-flavor None Just Slightly Moderately Very Extremely Detectable Detectable Intense Intense Intense
1 2 3 4 5 6 Question # 8 - Sample ______ Would you buy this product?
Yes No
Question # 9 - Sample ______ Would you buy this product if you knew coconut water had rehydrating properties?
Yes No

151
LIST OF REFERENCES
Acree T, Arn H. 2004. Falvornet and human odor space. http://www.flavornet.com. Accessed: May 2005.
Aitken A. 1990. Identification of protein consensus sequences. Chicester, Ellis Horwood, London. p 95.
Akdemir EG, Jin ZT, Ruhlman KT, Qiu X, Zhang QH, Richter ER. 2000. Microbial safety and shelf life of apple juice and cider processed by bench and pilot scale PEF systems. Innovative Food Science and Emerging Technologies, 1(1):77-86.
Arreola AG, Balaban MO, Marshall MR, Peplow AJ, Wei CI, Cornell JA.1991a. Supercritical carbon dioxide effects on some quality attributes of single strength orange juice. J of Food Science, 56(4):1030-1033.
Arreola AG, Balaban MO, Wei CI, Peplow A, Marshall MR. 1991b. Effect of supercritical carbon dioxide on microbial populations in single strength orange juice. J of Food Quality, 14: 275-284.
Ayhan Z, Zhang QH, Min DB. 2002. Effects of pulsed electric field processing and storage on the quality and stability of single-strength orange juice. J of Food Protection, 65(10):1623-1627.
Balaban MO, Arreola AG, Marshall MR, Peplow A, Wei CI, Cornell J. 1991a. Inactivation of pectinesterase in orange juice by supercritical carbon dioxide. J of Food Science, 56(3):743-750.
Balaban M, Pekyardimci S, Marshall MR, Arreola A, Chen JS, and Wei CI. 1991b. Effects of high pressure CO2 treatment on enzyme activity in model systems and orange juice. In: Proceedings of the 2nd International Symposium on Supercritical Fluids. Boston, MA. May 20-22. p 114-117.
Balaban MO, Pekyardimci S, Chen JS, Arreola A, Zemel G, Marshall MR. 1993. Enzyme inactivation by pressurized carbon dioxide. In : Science for the food industry of the 21st century. Yalpani M Ed ATL Press, Mount Prospect, IL. p 235-252.
Ballestra P, Silva AA, Cuq JL.1996. Inactivation of Escherichia coli by carbon dioxide under pressure. J of Food Science, 61(4):829-836.
Ballestra P, Cuq JL.1998. Influence of pressurized carbon dioxide on the thermal inactivation of bacterial and fungal spores. Lebensm-Wiss U-Technol, 31: 84-88.

152
Barbosa-Canovas GV. 1998. Nonthermal preservation of foods. Marcel Dekker, New York. 276 p.
Bell W, Rouseff R. 2004. Examination of volatiles in Florida grapefruit juice when heated on different contact surfaces [Abstract]. In: Fifty-Fifth Citrus Processor's Meeting, Lake Alfred, FL. October 21, 2004.
Campos CF, Souzo PEA, Coelho V, Beatriz M ,Gloria A. 1996. Chemical composition, enzyme activity and effect of enzyme inactivation on flavor quality of green coconut water. J of Food Processing and Preservation, 20:487-500.
Carpenter CC, Mondal A, Mitra PP. 1964. Green coconut water: a readily available source of K ion for cholera patients. Bull.Cal. School Trop. Med., 12:20.
Chen JS, Balaban MO, Wei CI, Marshall MR, Hsu WY. 1992. Inactivation of polyphenol oxidase by high pressure carbon dioxide. J of Agricultural and Food Chemistry, 40:2345-2349.
Chen JS, Balaban MO, Wei CI, Gleeson RA, Marshall MR. 1993. Effect of carbon dioxide on the inactivation of Florida spiny lobster polyphenol oxidase. J of Science and Food Agriculture, 61:253-259.
CREC (Citrus Research and Education Center), Univ. of Florida. 2002. Citrus Flavor Database. http://www.crec.ifas.ufl.edu/crec_websites/Rouseff/Website2002, Accessed: May 2005.
Damar S, Balaban MO. 2005. Cold pasteurization of coconut water with a continuous dense phase CO2 system[Abstract]. In IFT Annual Meeting Book of Abstracts; 2005 July 15-20; New Orleans LA. Chicago III:IFT Abstract nr 54F-3.
Daniels JA, Krishnamurti R, Rizvi SSH. 1985. A review of effects of carbon dioxide on microbial growth and food quality. J of Food Protection, 48:532-537.
David JRD, Graves RH, Carlson VR. 1996. Aseptic processing and packaging of food: a food industry perspective. CRC Press. Boca Raton, FL. 257 p.
Delpozo-Insfran D, Balaban MO, Talcott S. 2006. Inactivation of polyphenol oxidase in muscadine grape juice by dense phase-CO2 processing (Submitted for publication)
Dillow AK, Dehghani F, Hirkach JS, Foster NR, Langer R. 1999. Bacterial inactivation by using near- and supercritical carbon dioxide. Proc Natl Acad Sci USA 96:10344-10348.
Dodds WS, Stutzman LF, Sollami BJ. 1956. Carbon dioxide solubility in water. Industrial and Engineering Chemistry, 1(1):92-95.

153
Enomoto A, Nakamura K, Hakoda M, Amaya N.1997. Lethal effect of high-pressure carbon dioxide on a bacterial spore. J of Fermentation and Bioengineering, 83(3):305-307.
Erkmen O. 1997. Antimicrobial effect of pressurized carbon dioxide on Staphylococcus aureus in broth and milk. Food Sci Technol-Lebensmittel-Wissenschaft& Technologie, 30(8):826-829.
Erkmen O. 2000a. Effect of carbon dioxide pressure on Listeria monocytogenes in physiological saline and foods. Food Microbiology, 17:589-596.
Erkmen O. 2000b. Antimicrobial effects of pressurized carbon dioxide on Enterococcus faecalis in physiological saline and foods. J of Science and Food Agriculture, 80(4):465-470.
Erkmen O. 2000c. Antimicrobial effects of pressurized carbon dioxide on Brocothrix thermosphacta in physiological saline and foods. J of Science and Food Agriculture, 80(9):1365-1370.
Erkmen O, Karaman H. 2001. Kinetic studies on the high pressure carbon dioxide inactivation of Salmonella typhimurium. J of Food Engineering, 50:25-28.
Erkmen O. 2001. Effects of high pressure carbon dioxide on Escherichia coli in nutrient broth and milk. International J of Food Microbiology, 65:131-135.
Falck DC, Thomas T, Falck TM and Clem K. 2000. The intravenous use of coconut water. American J of Emergency Med.,18(1):108-111.
Food and Agricultural Organization [FAO]:AG21:Magazine. November, 2000. New sports drink: coconut water. Available from: http://www.fao.org/ag/magazine/9810/spot3.htm. Accessed: October 2005.
Farr D. 1990. High pressure technology in the food industry. Trends in Food Science and Technology, 1:14-16.
Fisher C, Scott TR. 1997. Food flavours; biology and chemistry. Royal Society of Chemistry, Information Services. Cambridge, UK. 165 p.
Folkes G. 2004. Pasteurization of beer by a continuous dense-phase CO2 system [Dphil thesis]. Gainesville, Fl.: University of Florida. 110 p. Available from: http://purl.fcla.edu/fcla/etd/UFE0006549 .
Fraser D. 1951. Bursting bacteria by release of gas pressure. Nature, 167:33-34.
Freier T. 2001. Use of the AMI Process Lethality Spreadsheet to Validate the Safety of Cooking Procedures. In: Proceedings of the 54th Reciprocal Meat Conference. RMC 2001. Available from: http://www.meatscience.org/meetings/RMC/2001. Accessed: July 2006.

154
Fries JH, Fries MW. 1983. Coconut: A review of its uses as they relate to the allergic individual. Annals of Allergy, October: 473-481.
Furukawa S, Watanabe T, Tai T, Hirata J, Narisawa N, Kawarai T, Ogihara H, Yamasaki M. 2004. Effect of high pressure carbon dioxide on the germination of bacterial spores. International J of Food Microbiology, 91:209-213.
Gomes JC, Coelho DT. 2005. Coconut water: a natural isotonic beverage. Florida, US: Sackel Co. Available from:www.sackel.com. Accessed: Oct 2005.
Haas GJ, Prescoudley EHE, Dick R, Hintlian C, Keane L. 1989. Inactivation of microorganisms by carbon dioxide under pressure. J of Food Safety, 9:253-265.
Hendrickx M, Ludikhuyze L, Van den Broeck I, Weemaes C. 1998. Effects of high pressure on enzymes related to food quality. Trends in Food Science & Technology, 9: 197-203.
Ho KLG. 2003.Dense phase carbon dioxide processing for juice. [Abstract]. In: IFT Annual Meeting Book of Abstracts; 2003 July 12-16; Chicago Il. Chicago III.: Institute of Food Technologists. Abstract nr 50-3.
Hong SI, Park WS, Pyun YR. 1997. Inactivation of Lactobacillus sp. from Kimchi by high pressure carbon dioxide. Lebensm-Wiss u-Technol, 30:681-685.
Hong SI, PyunYR.1999. Inactivation kinetics of Lactobacillus plantarum by high pressure carbon dioxide. J of Food Science, 64(4):728-733.
Hong SI, Park WS, PyunYR. 1999. Non-thermal inactivation of Lactobacillus plantarum as influenced by pressure and temperature of pressurized carbon dioxide. International J of Food Science and Technology, 34:125-130.
Hong SI, Pyun YR.2001. Membrane damage and enzyme inactivation of Lactobacillus plantarum by high pressure CO2 treatment. International J of Food Microbiology, 63:19-28.
Hye WY, Zhang QH, Streaker CB, Min DB. 2000. Effects of pulsed electric fields on the quality of orange juice and comparison with heat pasteurization. J of Agricultural and Food Chemistry, 48(10): 4597-4605.
Isenschmid A, Marison IW, Stockar UV.1995. The influence of temperature and pressure of compressed CO2 on the survival of yeast cells. J of Biotechnology, 39:229-237.
Ishikawa H, Shimoda M, Kawano T , OsajimaY.1995a. Inactivation of enzymes in an aqueous solution by micro-bubbles of supercritical carbon dioxide. Bioscience Biotechnology and Biochemistry, 59(4):628-631.

155
Ishikawa H, Shimoda M, Shiratsuchi H , OsajimaY.1995b. Sterilization of microorganisms by the supercritical carbon dioxide micro-bubble method. Bioscience Biotechnology and Biochemistry, 59(10):1949-1950.
Ishikawa H, Shimoda M, Tamaya K, Yonekura A, Kawano T , OsajimaY.1997. Inactivation of Bacillus spores by the supercritical carbon dioxide micro-bubble method. Bioscience Biotechnology and Biochemistry, 61(6):1022-1023.
Jayalekshmy A, Narayanan CS, Mathew AG. 1991. Identification of volatile flavor compounds in roasted coconut. J of AOCS, 66(11): 873-880.
Jia M, Zhang QH, Min DB. 1999. Pulsed electric field processing on flavor compounds and microorganisms of orange juice. Food Chemistry, 65:445-451.
Jirovetz L, Buchbauer G, Ngassoum MB. 2003. Solid phase microoextraction headspace aroma compounds of coconut (Cocos nucifera L.) milk and meat from Cameroon. Ernahrung/Nutrition, 27(7/8): 300-303.
Jones RP, Greenfield PF.1982. Effect of carbon dioxide on yeast and fermentation. Enzymes and Microbial Technology, 4:210-223.
Kamihira M, Taniguchi M, Kobayashi T. 1987. Sterilization of microorganisms with supercritical carbon dioxide. Agricultural and Biological Chemistry, 51(2):407-412.
Kincal D. 2000. Continuous cold pasteurization of orange juice with high pressure CO2. M.Sc. Thesis. University of Florida. Gainesville, FL.
Kincal D, Hill S, Balaban MO, Marshall MR, Wei C. 2005. A continuous high pressure carbon dioxide system for microbial reduction in orange juice. J of Food Science, 70(5):M249-254.
Kincal, D, Hill S, Balaban MO, Marshall MR, Wei C. 2006. A continuous high pressure carbon dioxide system for cloud and quality retention in orange juice. J of Food Science (Accepted).
Koltter R. 1993. The stationary phase of bacterial life cycle. Annual Revews in Microbioogy, l 47: 855-874.
Krishnankutty S. 2005. Coconut Development Board (CDB), India. Available from: http://coconutboard.nic.in/tendnutr.htm. Accessed: December 2005.
Kuberski T. 1980. Appropriate technology:coconut water for the oral rehydration of childhood diarrheas. New Zealand Medical J, 91:390.
Kumagai H, Hata C, Nakamura K. 1997. CO2 sorption by microbial cells and sterilization by high pressure CO2. Bioscience Biotechnology and Biochemistry, 61(6): 931-935.

156
Lawless HT, Heymann H. 1998. Sensory evaluation of food: principles and practices. Chapman & Hall, NY. 819 p.
Lecky M. 2005. Shelf life evaluation of watermelon juice after processing with a continuous high pressure carbon dioxide system [Abstract]. In: IFT Annual Meeting Book of Abstracts; 2005 July 15-20; New Orleans LA. Chicago III.: Institute of Food Technologists. Abstract nr 54F-5.
Lea RAW. 1998. Product formulation. In: Ashurst PR,editor. Chemistry and technology of soft drinks and fruit juices. CRC Press. Boca Raton, FL. p 85-95.
Liang Z, Mittal GS, Griffitthis MW. 2003. Pasteurization of unclarified apple juice using low energy pulsed electric field. Applied Biotechnology, Food Science and Policy, 1(1): 55-61.
Lim S, Yagiz Y, Balaban MO. 2006. Continuous high pressure carbon dioxide processing of mandarin juice. Food Science and Biotechnology. 15(1):13-18.
Lin FM, Wilkens WF. 1970. Volatile flavor components of coconut meat. J of Food Science, 35: 538-539.
Lin HM, Chan EC, Chen C, Chen LF.1991. Disintegration of yeast cells by pressurized carbon dioxide. Biotechnol Prog, 7:201-204.
Lin HM, Yang Z, Chen LF. 1992. Inactivation of Saccharomyces cerevisiae by supercritical and subcritical carbon dioxide. Biotechnol Prog, 8:458-461.
Lin H, Yang Z, Chen LF.1993. Inactivation of Leuconostoc dextranicum with carbon dioxide under pressure. The Chemical Engineering Journal, 52:B29-B34.
Lindsay RC.1976. Other desirable constituents of foods In “Food Chemistry” Fennema O R Editor. Marcel Dekker, New York. p:491.
Maciel MI, Oliveira SL and Silva IP.1992. Effects of different storage conditions on preservation of coconut (Cocos nucifera) water. J of Food Processing and Preservation, 16:13-22.
Mackey BM, Forestier K, Isaacs N.1995. Factors effecting resistance of Listeria monocytogenes to high hydrostatic pressure. Food Biotechnol Prog, 8:149-154.
Mantena SK, Badduri SR, Siripurapu KB, Unnikrishnan MK. 2003. In vitro evaluation of antioxidant properties of Cocos nucifera Linn. Water. Nahrung/Food, 47(2): 126-131.
Meyssami B, Balaban MO, Texeira AA. 1992. Prediction of pH in model systems pressurized with carbon dioxide. Biotechnol Prog, 8:149-154.

157
Miller J, Bendiak D, Kuester H, McLin C, Smith R, Casey G. 1998. Coordination of new and alternate methods of analysis. American Society of Brewing Chemists, Inc. Publication no. J-1998-1112-020.
Min S, Jin ZT, Zhang QH. 2003. Commercial scale Pulsed Electric Field processing of tomato juice. J Agric Food Chem, 51:3338-3344.
Mistry BS, Reineccius T, Olson LK. 1997. Gas Chromatography-Olfactometry for the determination of key odorants in foods. In:Marsili R, editor. Techniques for analyzing food aroma. Marcel Decker, New York. p 265-89.
Morris CE. 2000. US Developments in non-thermal juice processing. Food Engineering and Ingredients, December: 26-30.
Nakamura K, Enomoto A, Fukushima H, Nagai K, Hakoda M. 1994. Disruption of microbial cells by the flash discharge of high pressure carbon dioxide. Bioscience Biotechnology and Biochemistry, 58(7): 1297-1301.
Nordby HE, Nagy S. 1980. Processing of oranges and tangerines, In: Fruit and vegetable juice processing technology. Editor: Nelson PE, Tressler DK. AVI Publishing Co. Westport, CT. p 35-96.
Oliviera HJ, Ebreu CM, Jantos CD, Cardoso MG, Guimaray JC. 2003. Carbohydrate measurements of four brands of coconut water. Cienc.Agrotec.,Lavras, 27(5):1063-1067.
Park SJ, Lee JI, Park J. 2002. Effects of combined process of high pressure carbon dioxide and high hydrostatic pressure on the quality of carrot juice. J of Food Science:Food Enginering and Physical Properties 67(5):1827-1833.
Polydera AC, Stoforos NG, Taoukis PS. 2003. Comparative shelf life study and Vitamin C loss kinetics in pasteurized and high pressure processed reconstituted orange juice. J of Food Eng, 60:21-29.
Pradera ES, Fernandez E and Calderin O. 1942. Coconut water: a clinical and experimental study. Amer. J. Dis. Child., 64:977-995.
Punchihewa PG and Arancon RN. 2005. Coconut: Post-harvest operations. Inpho (Information Network on Post-harvest Operations), FAO. Available from: www.fao.org/inpho. Accessed: October 2005.
Reineccius GA. 1984. Determination of flavor components. In: Stewart KK, Whitaker JR. Modern methods of food analysis. AVI Publishing Co Inc. Westport, CT. p421.
Reynolds SG. 1988. Pastures and cattle under coconuts. Food and Agriculture Organization (FAO), Rome. p 321.

158
SDcoconut. 2005. Professor Rabindarjeet Singh. Brazil, Sococo Brand. Available from: www.sdcoconut.com. Accessed: January 2005.
Shaw PE. 1982. The flavor of non-alcoholic fruit beverages. In: Morton ID and Macleod AJ, editors. Food Flavours, Part B: The Flavor of Beverages. Elsevier Science Pub., New York. p 337-67.
Shimoda M, Castellanos JC, Kago H, Miyake M, Osajima Y, Hayakawa I. 2001. The influence of dissolved CO2 concentration of the death kinetics of Saccharomyces cerevisiae. J of Applied Microbiology, 91:306-311.
Shreirer P, Drawert F, Junker A, Mick W. 1977. The quantitative composition of natural and technologically changed aromas of plants. II. Aroma compounds in oranges and their changes during juice processing. Z Lebensm-Unters-Forsch, 164:188-193.
Sims M, Estigarribia E. 2002. Continuous sterilization of aqueous pumpable food using high pressure carbon dioxide. Proceedings; 4th International Symposium on High Pressure Proces Tech and Chem Eng AIDIC Chem Eng Trans, 2921-926.
Spilimbergo S, Elvassora N, Bertucco A. 2002. Microbial inactivation by high-pressure. J of Supercritical Fluids, 22:55-63.
Spilimbergo S, Bertucco A. 2003. Non-thermal bacterial inactivation with dense CO2. Biotechnology and Bioengineering, 84(6):627-638.
Spilimbergo S, Elvassore N, Bertucco A. 2003. Inactivation of microorganisms by supercritical CO2 in a semi-continuous process. Italian J of Food Science, 1(15):115-124.
Suzuki K, Taniguchi Y. 1972. Effect of pressure on biopolymers and model systems. In: The effects of Pressure on Organisms. Society for Experimental Biology(Ed.) Academic Press Inc Publishers, NY. p 103-124.
Taniguchi M, Kamihira M, Kobayashi T.1987. Effect of treatment with supercritical carbon dioxide on enzyme activity. Agricultural and Biological Chemistry, 51(2):593-594.
Tedjo W, Eshtiaghi MN, Knorr D. 2000. Impact of supercritical carbon dioxide and high pressure on lipoxygenase and peroxidase activity. J of Food Science, 65(8):1284-1287.
Tompsett A. 1998. Product formulation. In: Ashurst PR,editor. Chemistry and technology of soft drinks and fruit juices. CRC Press. Boca Raton, FL. p 55-59.
Wardencki W, Michulec M, Curylo J. 2004. A review of theoretical and practical aspects of solid-phase microextraction in food analysis. International J of Food Science and Technology, 39:703-717.

159
Watanabe T, Furukawa S, Tai T, Hirata J, Narisawa N, Kawarai T, Ogihara H, Yamasaki M. 2003a. High pressure carbon dioxide decreases the heat tolerance of the bacterial spores. Food Sci. Technol Res., 9(4):342-344.
Watanabe T, Furukawa S, Tai T, Hirata J, Koyama T, Kawarai T, Ogihara H, Yamasaki M. 2003b. Inactivation of Geobacillus stearothermophilus spores by high pressure carbon dioxide treatment. Applied and Environmental Microbiology, Dec 20037124-7129.
Weder JKP. 1990. Influence of supercritical carbon dioxide on proteins and amino acids- an overview. Café Cacao, 34:287-290.
Weder JKP, Bokor MW, Hegarty MP. 1992. Effect of supercritical carbon dioxide on arginine. Food Chemistry, 44:287-290.
Wei CI, Balaban MO, Fernando SY, Peplow AJ. 1991. Bacterial effect of high pressure CO2 treatment on foods spiked with Listeria and Salmonella. J of Food Protection, 54(3):189-193.
Woodroof JG. 1979. Coconuts: production, processing, products. 2nd edition. AVI Publishing Company,Inc. Westport, Connecticut, p 307.
Yang X, Peppard T. 1994. Solid-phase microextraction for flavor analysis. J of Agricultural and Food Chemistry, 42: 1925-1930.

160
BIOGRAPHICAL SKETCH
Sibel Damar was born in Ankara, Turkey. She scored in the highest 98% percentile
in the nationwide college entrance examination and entered M.E. Technical University,
one of the best universities in Turkey. After earning her B.S. and M.Sc. degrees from
Food Engineering Department, she was awarded the prestigious Graduate Alumni
Fellowship to begin her Ph.D. work in the food science program at the University of
Florida. Under Dr. Murat O. Balaban’s supervision, she is going to receive her Ph.D.
degree in 2006 and graduate with a GPA of 4.0.