PROCESSING - FWPA · • Establish the viability of vacuum drying for four high commercial volume...
135
` Evaluation of super-heated steam vacuum drying viability and development of a predictive drying model for four Australian hardwood species PROJECT NUMBER: PNB045-0809 AUGUST 2011 PROCESSING This report can also be viewed on the FWPA website www.fwpa.com.au FWPA Level 4, 10-16 Queen Street, Melbourne VIC 3000, Australia T +61 (0)3 9927 3200 F +61 (0)3 9927 3288 E [email protected] W www.fwpa.com.au
Transcript of PROCESSING - FWPA · • Establish the viability of vacuum drying for four high commercial volume...

`
Evaluation of super-heated steam vacuum drying viability and development of a predictive drying model for four Australian hardwood species
PROJECT NUMBER: PNB045-0809 AUGUST 2011
PROCESSING
This report can also be viewed on the FWPA website
www.fwpa.com.auFWPA Level 4, 10-16 Queen Street,
Melbourne VIC 3000, AustraliaT +61 (0)3 9927 3200 F +61 (0)3 9927 3288
E [email protected] W www.fwpa.com.au

Evaluation of super-heated steam vacuum drying viability and development of a predictive drying
model for four Australian hardwood species
Prepared for
Forest & Wood Products Australia
by
Adam Redman

Forest & Wood Products Australia Limited Level 4, 10-16 Queen St, Melbourne, Victoria, 3000 T +61 3 9927 3200 F +61 3 9927 3288 E [email protected] W www.fwpa.com.au
Publication: Evaluation of super-heated steam vacuum drying viability
and development of a predictive drying model for four Australian
hardwood species Project No: PNB045-0809 © 2011 Forest & Wood Products Australia Limited. All rights reserved. Forest & Wood Products Australia Limited (FWPA) makes no warranties or assurances with respect to this publication including merchantability, fitness for purpose or otherwise. FWPA and all persons associated with it exclude all liability (including liability for negligence) in relation to any opinion, advice or information contained in this publication or for any consequences arising from the use of such opinion, advice or information. This work is copyright and protected under the Copyright Act 1968 (Cth). All material except the FWPA logo may be reproduced in whole or in part, provided that it is not sold or used for commercial benefit and its source (Forest & Wood Products Australia Limited) is acknowledged. Reproduction or copying for other purposes, which is strictly reserved only for the owner or licensee of copyright under the Copyright Act, is prohibited without the prior written consent of Forest & Wood Products Australia Limited. ISBN: 978-1-921763-38-0 Researcher: A. Redman DEEDI Salisbury Research Centre 50 Evans Road Salisbury Final report received by FWPA in August, 2011
Grace_Davies
New Stamp

i
1 Executive Summary The primary objectives of this study were to:
• Establish the viability of vacuum drying for four high commercial volume Australian hardwood species in terms of drying quality, time and cost. The four species investigated were: Corymbia citriodora (spotted gum), blackbutt (Eucalyptus pilularis), messmate (Eucalyptus obliqua) and jarrah (Eucalyptus marginata)
• Develop an economic model to compare the drying costs of vacuum and conventional drying.
• Develop a predictive vacuum drying heat and mass transfer deterministic model using fundamental principles. Investigate the model limitations and sensitivities.
• Validate the drying model against data derived from applied drying trials. We investigated the viability of vacuum drying by conducting a series of four trials per species and developing an economic model application. For each trial 25 x 100 mm nominal cross-section dimension boards were kiln dried in a 2 m3 capacity vacuum kiln and compared with end-matched boards kiln dried in commercial conventional driers. We used the economic model to investigate the comparative costs of small (10 m3), medium (35 m3) and large (50 m3) vacuum and conventional operations using the best quality results from the drying trials as input data, and data provided by industry. The results of drying trials show that vacuum drying produces material of the same or better quality than is currently being produced by conventional methods within 41 to 66 % of the drying time, depending on the species. Economic analysis indicates positive or negative results depending on the species and the size of drying operation. Definite economic benefits exist by vacuum drying over conventional drying for all operation sizes, in terms of drying quality, time and economic viability, for E. marginata and E. pilularis. The same applies for vacuum drying C. citriodora and E. obliqua in larger drying operations (kiln capacity 50 m3 or above), but not for smaller operations at this stage. Further schedule refinement has the ability to reduce drying times further and may improve the vacuum drying viability of the latter species in smaller operations. A comprehensive heat and mass transfer drying model was developed with the ability to accurately simulate vacuum and conventional drying of Australian hardwood species. Measurement of essential wood drying properties required for the model revealed that water movement within these species occurs mostly by diffusion. Subsequently diffusion measurements were critical for refining the model accuracy. Validation of the model resulted in excellent simulated accuracy where the predicted drying times agreed with the kiln trial drying times by 91 to 98 %, depending on the species. This has the ability to greatly accelerate the time required for further vacuum and conventional drying research, and to quickly design new drying schedules. Overall, the outcomes of this research provide industry with the confidence to make informed decisions regarding their potential investment in vacuum drying technology. With the aid of the economic model application and the results of the drying trials, industry has the ability to investigate the viability of vacuum drying over conventional drying dependant in their own specific requirements.

Table of Contents 1 Executive Summary ............................................................................................................ i 2 Introduction ........................................................................................................................ 1
2.1 Applied drying – Experimental drying trials .............................................................. 2 2.2 Applied trials - Economic model ............................................................................... 2 2.3 Drying modelling - Measurement of kiln conditions and wood drying properties .... 2 2.4 Drying modelling - Measurement of essential wood properties ................................ 3 2.5 Drying modelling - Vacuum drying modelling .......................................................... 3
3 Methodology ...................................................................................................................... 4 3.1 Applied drying – Experimental drying trials .............................................................. 4
3.1.1 Sourcing material and preparation ..................................................................... 4 3.1.2 Drying properties and quality ............................................................................. 5 3.1.3 Kiln drying ......................................................................................................... 9 3.1.4 Explanation of statistical analysis and presentation techniques ....................... 12
3.2 Applied drying - Economic model ........................................................................... 13 3.2.1 How to use the model ....................................................................................... 13 3.2.2 Inputs ................................................................................................................ 13 3.2.3 Calculated outputs ............................................................................................ 14 3.2.4 Case studies ...................................................................................................... 17
3.3 Drying modelling - Measurement of kiln conditions and wood drying properties .. 20 3.3.1 Shrinkage and flying wood .............................................................................. 20 3.3.2 Load/moisture content ...................................................................................... 22 3.3.3 Airflow ............................................................................................................. 23 3.3.4 Board temperature ............................................................................................ 23
3.4 Drying modelling - Measurement of essential wood properties .............................. 24 3.4.1 Wood density and initial MC ........................................................................... 24 3.4.2 Fibre porosity ................................................................................................... 24 3.4.3 Gas permeability .............................................................................................. 28 3.4.4 Bound Water Diffusion (Db) ............................................................................ 31 3.4.5 Shrinkage .......................................................................................................... 33
3.5 Drying modelling - Vacuum drying modelling ........................................................ 38 3.5.1 Liquid conservation .......................................................................................... 38 3.5.2 Energy conservation ......................................................................................... 38 3.5.3 Air conservation ............................................................................................... 38 3.5.4 Closure conditions ............................................................................................ 39 3.5.5 Boundary Conditions ........................................................................................ 39 3.5.6 Numerical Solution Procedure ......................................................................... 40 3.5.7 Physical Properties ........................................................................................... 40
4 Results .............................................................................................................................. 46 4.1 Applied drying – Experimental drying trials ............................................................ 46
4.1.1 Corymbia citriodora – spotted gum ................................................................. 46 4.1.2 Eucalyptus marginata - jarrah .......................................................................... 57 4.1.3 Eucalyptus pilularis – blackbutt ....................................................................... 68 4.1.4 Eucalyptus obliqua - messmate ........................................................................ 80
4.2 Applied drying - Economic model ........................................................................... 93 4.3 Drying modelling - Measurement of kiln conditions and wood drying properties .. 95
4.3.1 Shrinkage and flying wood .............................................................................. 95 4.3.2 Load/moisture content ...................................................................................... 95 4.3.3 Airflow ............................................................................................................. 96 4.3.4 Board temperature ............................................................................................ 97
4.4 Drying modelling - Measurement of essential wood properties .............................. 98

4.4.1 Wood density and initial MC ........................................................................... 98 4.4.2 Fibre porosity ................................................................................................... 98 4.4.3 Gas permeability .............................................................................................. 99 4.4.4 Bound water diffusion .................................................................................... 100 4.4.5 Shrinkage ........................................................................................................ 102
4.5 Drying modelling - Vacuum drying modelling ...................................................... 106 4.5.1 Input parameters ............................................................................................. 106 4.5.2 Simulations ..................................................................................................... 108
5 Discussion and conclusions ............................................................................................ 115 5.1 Applied drying – Experimental drying trials .......................................................... 115 5.2 Applied drying - Economic model ......................................................................... 116 5.3 Drying modelling - Measurement of kiln conditions and wood drying properties 116 5.4 Drying modelling - Measurement of essential wood properties ............................ 116 5.5 Drying modelling - Vacuum drying modelling ...................................................... 117
6 Recommendations .......................................................................................................... 118 7 References ...................................................................................................................... 119 Acknowledgements ................................................................................................................ 123 8 Appendix1 – List of abbreviations ................................................................................. 124


1
2 Introduction Drying timber to produce material for high quality applications is an expensive and time-consuming operation. It is often referred to as the ‘bottleneck’ of the production process. The drying process consumes approximately 70% of the energy required to convert green logs into dried, value added products. Additionally, estimates suggest that up to 10% degrade occurs in dried wood due to the drying process because of checking, collapse, distortion, and moisture variation. Over the years the timber industry worldwide, in conjunction with researchers, engineers and manufacturers, have strived to dry quality timber as quickly and cheaply as possible to maximise profitability. Therefore, the timber industry pursues any technologies that can improve the quality and reduce timber drying times and costs. Conventional kiln drying with controlled heating, humidity and air-flow under atmospheric pressure conditions is the primary method for drying timber in Australia (Nolan et al., 2003). In recent years, with emerging technological advancements in construction, computer control and less expensive materials, vacuum drying of hardwood timber has been proven (particularly in Europe and USA) in many applications to be a more economical alternative to drying using conventional methods, with similar or better quality outcomes (Savard et al., 2004). For this reason, Queensland Government’s Department of Employment, Economic Development and Innovation (DEEDI) - Agri-Science Queensland expanded its seasoning research and development capacity through the purchase of a 2 m3 research vacuum kiln to investigate the viability of vacuum drying technology for drying Australian hardwood species. Initial kiln trials drying native forest Corymbia citriodora (spotted gum) and young plantation Eucalyptus cloeziana (Gympie messmate) have proven that these species can be vacuum dried approximately 60% faster than conventional drying, within acceptable grade quality limits (Redman, 2007). The results obtained from these preliminary vacuum drying trials generated much interest from the Australian hardwood timber industry. In response, Forest and Wood Products Australia (FWPA) in conjunction with various industry partners and DEEDI invested in this project to establish the viability of vacuum drying technology for drying four high commercial volume Australian hardwood species in terms of drying quality, time and cost. The first part of this work involved a series of applied drying trials and an applied economic model application to establish vacuum drying viability in terms of dried quality, time and cost. The industry partners involved in this part of the research were:
• Dale and Meyers (QLD) • Burnett Sawmilling (QLD) • Boral Timber (NSW) • J. Notaras and Sons (NSW) • Hurford Hardwood (NSW) • ITC Timber (TAS) • Gunns (TAS) • Gunns (WA) • Brunner-Hildebrand (Germany)
We recognised that a better knowledge of the material and associated drying behaviour was required to optimise the vacuum drying process in the future. Therefore, we chose to development a hardwood vacuum drying model. This required collaboration with a number of renowned experts in the field. The modelling collaborators and their areas of expertise were:

2
• Queensland University of Technology (QUT) – mathematical modelling and visualisation
• Wood Science at École Nationale du Génie Rural des Eaux et des Forêts (ENGREF) in Nancy, France – drying modelling, instrumentation and wood property measurement
• Queensland Cyber Infrastructure Foundation (QCIF) – High performance computing and model optimisation
Some of the wood property measurements, essential to develop an accurate model, required the use of specifically designed equipment only available in the ENGREF laboratory, France. With the aid of funding from an FWPA Denis Cullity fellowship, this author travelled to the ENGREF laboratory to perform the required tests. The results are reported by Redman (http://fwpa.com.au, 2008). For the modelling component, QCIF provided external funding to optimise the model convergence times and use of High Performance Computers (HPC). The results of which are reported by Redman (http://www.qcif.edu.au, 2010). Additionally, the vacuum drying model was developed and implemented as part of this authors PhD project offered by QUT. At the stage of writing Redman’s PhD is pending.
2.1 Applied drying – Experimental drying trials The following report presents the results of sixteen vacuum drying trials and corresponding end–matched conventional drying trials for C. citriodora, E. pilularis, E. marginata and E. obliqua (four trials per species). The structure of applied drying trials’ reporting is such that the materials and methods section is generic across all trials and species. Results and conclusions are reported separately for each species, allowing the reader to peruse their specific area (species) of interest.
2.2 Applied trials - Economic model For the hardwood sawn timber industry, drying is the single processing step that adds the greatest value. However, there is significant variation in this cost between processors and methods. Therefore, processors who operate with higher efficiency, have greater profitability than their competitors. This section of the report investigates economic comparisons between conventional and vacuum kiln drying from the green condition. This was facilitated via the creation and use of an economic model based on fundamental economic and wood drying principles. The objective of this work was to determine the economic viability of vacuum drying Australian hardwoods compared to current conventional methods. This was achieved by using the ‘best case scenario’ vacuum drying trial for each species studied. The best case for each species was chosen based on the best dried quality outcome (comparable to conventional trials) and fastest drying time. Comparisons were based on determining the vacuum drying time producing the same cost of drying as for conventional trials and comparing this to the vacuum drying times achieved for the best case trials per species. We present a number of case studies for different sized operations.
2.3 Drying modelling - Measurement of kiln conditions and wood drying properties
We used specialised instruments on test boards during vacuum drying trials to obtain, through continuous ‘real–time’ measurements, a greater understanding of the kiln conditions and

3
wood drying properties. This is essential to validate and provide actual kiln and wood property data for the modelling component of this project and hence optimise the process. As such the proposed model is ‘deterministic’, whereby actual wood property and kiln data are required to ‘feed’ the model to obtain the most accurate simulations possible. A deterministic model is one in which outcomes are determined through known relationships among states or events, without any room for random variation. In such models, a given input will always produce the same output. The wood drying properties measured were: internal wood temperature at various depths using thermocouples, global shrinkage and stress/strain characterisation using strain gauges and jig, mass/moisture content using load cells, and internal pressure using pressure gauges. The kiln conditions measured during vacuum drying were atmospheric pressure, temperature, relative humidity, and air velocity.
2.4 Drying modelling - Measurement of essential wood properties For each species, we measured a number of wood properties deemed essential input data for the model. They were deemed essential, based on previous modelling research relating to model sensitivities (Perré, 1996, Salin, 2010). We calculated other wood properties required for modelling, either from theory or inferred from essential measured wood properties. The essential wood properties measured to achieve accurate modelling results, were:
• wood density – from drying trials • initial wood moisture content – from drying trials • fibre and vessel porosity – from microscopy imaging • gas permeability (radial, tangential and longitudinal directions) – using specialised
equipment • diffusivity (radial, tangential and longitudinal directions) – using specialised
equipment • shrinkage (radial and tangential) and sorption isotherm – using specialised equipment.
2.5 Drying modelling - Vacuum drying modelling As the anatomical configuration of wood is complex, we must write transport equations at the macroscopic scale. This leads to the definition of empirical laws of migration that can be demonstrated to a large extent by averaging over representative volumes (Perré, 1996). At this level, we observe the porous medium as a fictitious, continuous medium. By using this approach, most fluxes can be written as the product of a coefficient times the driving force, both for the porous medium and the surrounding air. The conservation of liquid, water vapour, air and enthalpy enable a set of equations governing transfer in porous media to be derived (Whitaker, 1977). These equations have subsequently been used to model the softwood drying process (Perré, 1996, Perré and Turner, 1999b), where their ability to describe several different drying configurations has been proven. The most recent application of the model describes the heat and mass transfer drying of single boards applied to the growth rings of softwood (Perré and Turner, 2008). This model describes the drying process for both homogeneous and heterogeneous cross sections, where density and transport differences due to the presence of growth rings are accounted. As the species investigated in this study are relatively homogenous, the majority of the transport model equations are from the homogenous model reference. This softwood model, known as TransPore 2D was used as a basis for the hardwood model. MatLab was the predominant platform used to write the heat and mass transfer model code, with some components written in C++ to enable fast convergence (completion).

4
3 Methodology
3.1 Applied drying – Experimental drying trials The efficiency of vacuum drying emanates from the fact that operating at low pressures reduces the boiling point of water, enabling generation of an overpressure, maintained within the product throughout drying. This overpressure accelerates internal liquid and vapour migration, producing a very efficient drying rate. Despite the fact that the effectiveness of external heat transfer decreases at low pressure, it is still necessary to supply adequate supply to the material for the purposes of evaporation. The DEEDI kiln uses convective, superheated steam for this purpose. The kiln operates between 0.1-0.2 bar, whereby the boiling point of water is around 45oC. The convectively heated vacuum dryer uses a mixture of superheated steam and air between 40-80oC, with a relative humidity of 90%.
3.1.1 Sourcing material and preparation Table 1 summarises the species names (scientific and common), source (state, sawmill and forest type), conventional drying type and abbreviated notation for each trial. We will use this notation from this point forward to identify each trial. For each trial, we performed end-matched vacuum and conventional trials, where conventional trials consisted of either kiln drying from the green condition or a combination of air and final kiln drying. Table 1. Trial number, source, abbreviated notation and drying treatment results reported
ConventionalTrial number Scientific Common State Sawmill Forest type Drying Type Abbreviation
1 C. citriodora spotted gum QLD Dale and Myers, Maryborough native green SPG12 E. marginata jarrah WA Gunns Timber, Manjimup native green JAR13 E. pilularis blackbutt NSW Hurford Hardwood, Casino native air BBT14 E. obliqua messmate TAS ITC Timber, Huonville native air MES15 C. citriodora spotted gum QLD Burnett Sawmill, Bundaberg native air SPG26 E. marginata jarrah WA Gunns Timber, Manjimupp native green JAR27 E. pilularis blackbutt NSW Boral Timber, Murwillumbah native green BBT28 E. obliqua messmate TAS ITC Timber, Huonville native green MES29 C. citriodora spotted gum QLD Dale and Myers, Maryborough native green SPG3
10 E. marginata jarrah WA Gunns Timber, Manjimupp native green JAR311 E. pilularis blackbutt NSW Boral Timber, Murwillumbah native green BBT312 E. obliqua messmate TAS Gunns Timber, Launceston native green MES313 C. citriodora spotted gum QLD Dale and Myers, Maryborough native green SPG414 E. marginata jarrah WA Gunns Timber, Manjimupp native green JAR415 E. pilularis blackbutt NSW Boral Timber, Murwillumbah native green BBT416 E. obliqua messmate TAS Gunns Timber, Launceston native green MES4
Species name Source
The boards used for each trial came from mature native forest logs. Sawmills supplied 350 green–off–saw boards (heart free) of nominal dimension 25 x 100 x 4500 mm, except for trial BBT2 where board cross sections were 25 x 125 mm. We crosscut the boards in half using a chainsaw (Plate 1), labelled (identical label for each end–matched board, Plate 2) and end painted with a wax emulsion sealer.
5
Plate 1. Preparation of end matched boards
Plate 2. End coated and labelled boards
One-half of the end–matched boards remained on–site for industry standard conventional drying. The conventional drying treatment differed between trials depending on each site’s general practice (i.e. kiln drying from green or a combination of air and final kiln drying). We wrapped the other half of the boards in impermeable plastic to prevent drying during transportation and dispatched to the DEEDI Salisbury Research Centre (SRC) for vacuum drying. The conventionally dried material was transported to SRC for dried quality assessment upon the completion of drying. For each trial 100 end–matched sample boards were randomly1 chosen for detailed wood property and quality assessment. We chose this number of boards based on our experience to account for the natural variation of wood properties.
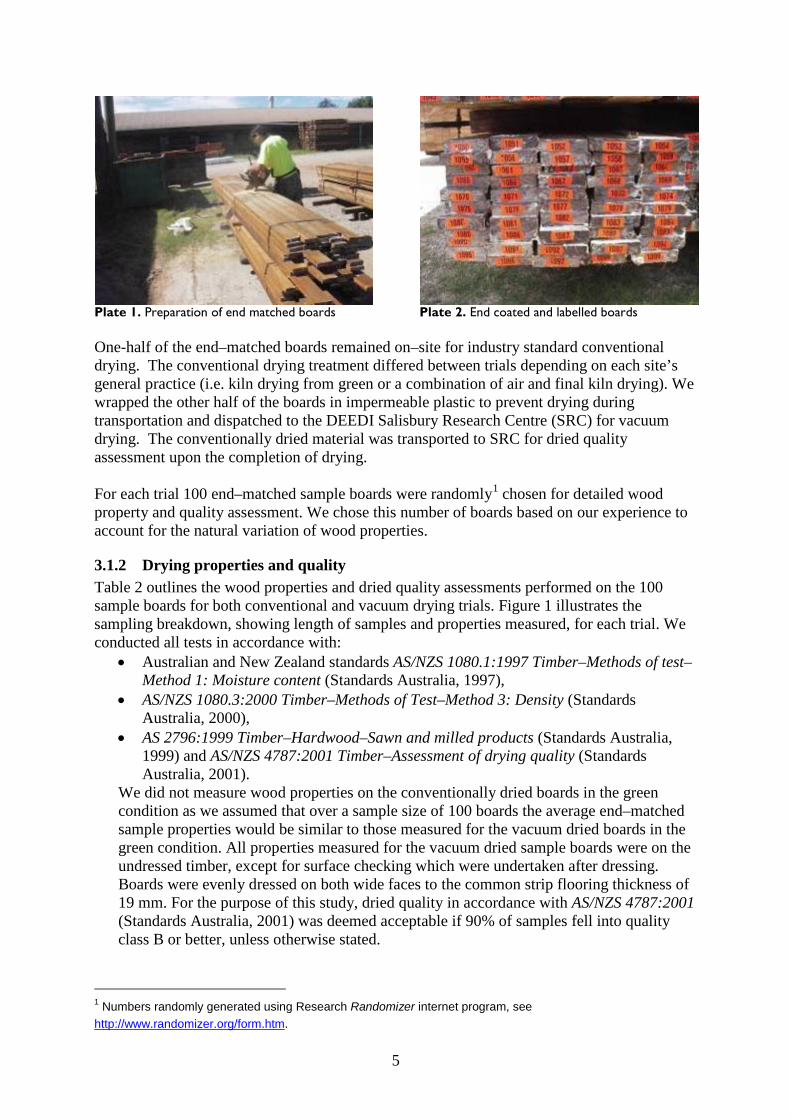
3.1.2 Drying properties and quality Table 2 outlines the wood properties and dried quality assessments performed on the 100 sample boards for both conventional and vacuum drying trials. Figure 1 illustrates the sampling breakdown, showing length of samples and properties measured, for each trial. We conducted all tests in accordance with:
• Australian and New Zealand standards AS/NZS 1080.1:1997 Timber–Methods of test–Method 1: Moisture content (Standards Australia, 1997),
• AS/NZS 1080.3:2000 Timber–Methods of Test–Method 3: Density (Standards Australia, 2000),
• AS 2796:1999 Timber–Hardwood–Sawn and milled products (Standards Australia, 1999) and AS/NZS 4787:2001 Timber–Assessment of drying quality (Standards Australia, 2001).
We did not measure wood properties on the conventionally dried boards in the green condition as we assumed that over a sample size of 100 boards the average end–matched sample properties would be similar to those measured for the vacuum dried boards in the green condition. All properties measured for the vacuum dried sample boards were on the undressed timber, except for surface checking which were undertaken after dressing. Boards were evenly dressed on both wide faces to the common strip flooring thickness of 19 mm. For the purpose of this study, dried quality in accordance with AS/NZS 4787:2001 (Standards Australia, 2001) was deemed acceptable if 90% of samples fell into quality class B or better, unless otherwise stated.
1 Numbers randomly generated using Research Randomizer internet program, see http://www.randomizer.org/form.htm.
6
Table 2. Wood properties and dried quality measurements for each trial
Figure 1. Schematic of sampling breakdown
Moisture content Before vacuum drying, we removed 25 mm long cross sections for initial green cross–sectional MC determination while docking sample boards to 1.9 m, the maximum board length governed by the vacuum kiln. Moisture content was determined using the oven-dry method in accordance with AS/NZS 1080.1:1997 (Standards Australia, 1997). Final dried cross–sectional MC was determined from sections removed from each board, no closer than 400 mm from the board end. Two 25 mm long sections per board enabled cross-
Conventional Green Dry Dry
Cross-sectional MC (AS/NZS 1080.1, AS/NZS 4787, AS 2796) MC gradient (AS/NZS 1080.1, AS/NZS 4787) Distortion (AS 2796) Surface checking (AS 2796) Internal checking (AS/NZS 4787) End split (AS/NZS 4787) Drying stress (AS/NZS 4787) Collapse (AS/NZS 4787)
Vacuum Properties measured (standard)

7
sectional MC and MC gradients to be calculated (by ripping into approximate 1/3 thickness pieces and calculating MC in accordance with AS/NZS 1080.1:1997 (Standards Australia, 1997). Both cross–sectional MC and MC gradient were assessed in accordance with AS/NZS 4787:2001 (Standards Australia, 2001). Final cross–sectional MC was also assessed in accordance with AS 2796:1999 (Standards Australia, 1999), which specifies all boards (for strip flooring) must have a MC between 9 and 14%, unless otherwise agreed. The target final cross-sectional MC was 11% for all trials.
Basic Density The green MC sections described above were also used to measure basic density in accordance with AS/NZS 1080.3:2000 (Standards Australia, 2000). Density was determined by measuring the MC of the test piece (in accordance with AS/NZS 1080.1:1997), and the volume of the test piece before oven drying.
Distortion Each sample board was graded for distortion (i.e. twist, spring, bow and cup) in accordance with Australian Standard AS 2796:1999 (Standards Australia, 1999).
Surface and internal checking When kiln drying was complete, each board was assessed for surface checking (on both wide faces) in accordance with Australian Standard AS2796.3:1999 (Standards Australia, 1999), whereby a board was deemed to make select (best) grade if no surface checks on either face were greater than 250 mm long or 1 mm wide. We assessed surface checking on boards in the dressed condition at a thickness of 19 mm. The presence of internal checking was determined on a present or absent basis by visually inspecting the freshly sawn end of each board (i.e. after we removed the 400 mm and MC sections). Internal checking was assessed in accordance with AS/NZS 4787:2001 (Standards Australia, 2001).
End split End splits were measured and assessed (both ends) in accordance with Australian and New Zealand Standard AS/NZS 4787:2001 (Standards Australia, 2001).
Drying stress When drying was complete, a 25 mm cross–section was removed (as adjacent to the MC sample location) and used to quantify residual drying stress in accordance with AS/NZS 4787:2001 (Standards Australia, 2001). We quantified drying stress by measuring the width of each cross section before ripping the section down the middle and measuring the gap between the freshly sawn concave/convex faces (Figure 2). The degree of drying stress is the ratio of gap width and section width expressed as a percentage as follows:
100)/( ×= WDD gapstress (1) where, Dstress = degree of residual stress as a percentage (%) Dgap = gap between concave / convex faces (mm) W = board width (mm)

8
Figure 2. Diagram of ripping method for assessing drying stress (image taken from AS/NZS 4787:2001)
Collapse Collapse observations occurred for each sample board at the completion of drying, on a present or absent basis, by inspecting the wide face surfaces. For the vacuum trial drying E. obliqua (MES1), a highly collapse prone species, scanned cross sections were analysed using MeshPore (Perré, 2005a), an image analysis software package developed to characterise the morphology and produce finite element meshes of wood anatomy. For the purpose of this study, we used MeshPore to determine the area of board cross sections as an aid to quantify collapse. In line with industry practice, we deemed collapse present in boards after dressing to be unacceptable.
Sawn orientation We classified sawn orientation into three groups: q (quarter sawn), t (transitionally sawn) and b (backsawn). Transitionally sawn boards are boards with a sawn orientation between quarter and backsawn.
Gross shrinkage We measured width and thickness at the centre of each of the sample board’s length before drying. This was repeated at the same position for the undressed dry boards. We used these measurements to calculate the gross percentage shrinkage from green to dry using equations 2 and 3.
Width shrinkage (%) = 100×
−
g
dg
WWW
(2)
Thickness shrinkage (%) = 100×
−
g
dg
TTT
(3)
Where, Wg = board width green Wd = board width dry Tg = board thickness green Td = board thickness dry.

9
Drying quality class descriptions Standard AS/NZS 4787:2001 (Standards Australia 2001) assigns drying quality classes for cross–sectional MC, MC gradient, drying stress, end split/check and internal check measurements. The standard bases quality classes on 90% of samples adhering to predetermined allowable limits dependent on the final target value for each property measured. It ranks classes from A to E as described below: Class A – caters for specific end uses and very specific requirements for drying quality Class B – applies where tight control over drying is required to limit ‘in service’ movement resulting from changes in equilibrium moisture content Class C – applies where higher drying quality is required and the final use environment is clearly defined Class D – applies when the final use environment is more clearly defined but the drying quality requirements are not considered high, and Class E – applies when the final use and drying quality requirements are not high. Table 3 shows the limits for the various quality classes as described within the standard. In accordance with general industry requirements, dried quality was deemed acceptable if 90% of sample populations fell into quality class B or better. The target final average cross–sectional MC was 11% for all trials. Table 3. Allowable limits for MC, drying stress, end split/check and internal check per quality class
Cro
ss-s
ectio
nal
MC
(11%
)
MC
Gra
dien
t (1
1%)
Dry
ing
stre
ss
(Dst
ress
)
End
che
ck/s
plit
leng
th (m
m)
Inte
rnal
che
ck
(% lo
ss o
f cro
ss-
sect
ion)
A 10 - 13 2.0 0.5 0 0B 9 - 14 3.0 1.0 50 0C 8 - 15 3.5 2.0 100 5D 7 - 16 4.0 3.0 200 10E 6 - 18 5.0 4.0 300 15
Qua
lity
clas
s
Allowable range for 90% of samples
3.1.3 Kiln drying We performed vacuum drying using a 2 m3 superheated steam vacuum drying kiln supplied by Brunner-Hildebrand, Germany. The kiln is powered entirely from electricity. This would generally not be the case for an industrial kiln that would use cheaper onsite energy alternatives (e.g. steam, hot oil or gas). Conventional drying was conducted by the company from which the material was sourced using standard industry practice Table 1.
Kiln charge preparation for vacuum drying Sample boards were stripped in the kiln between evenly spaced rows of non-sample boards using recommended 19 mm thick stickers (Nolan et al., 2003). Six test boards were selected to measure MC during drying using resistance probes inserted at varying depths. Two sets of probes were inserted into each test board (Plate 3). One set was inserted at a depth of 1/2 board thickness (core). For three of the boards the second set of probes was inserted at a depth of 5 mm (surface), and for the other three at a depth of 1/3 board thickness. The kiln was controlled using the average core MC of the six test boards to determine each change point.

10
Plate 3. MC resistance probes inserted into a test board The second set of probes was used to determine MC gradient of boards during drying. Plate 4 illustrates the stack preparation method implemented for this study. The 100 sample boards are those with end labels. Shown are the position and labelling of the six test boards where the test boards with the red arrows included specialised instrumentation, and the positioning of the flying wood test board (see section: 3.3.1 Shrinkage and flying wood).
Plate 4. Stack appearance prior to drying showing the position of sample boards (labelled), test boards (red arrows indicate test boards incorporating specialised instrumentation) and the ‘flying wood’ board For the E. obliqua MES1 vacuum drying trial, we stripped boards in two packs separated by bearers. When the average MC of the vacuum dried boards was approximately 15% we removed the top half of the stack from the kiln and reconditioned in a conventional research kiln at 97°C and 100% relative humidity for 6 hours. After reconditioning, the reconditioned and non-reconditioned boards re-entered the vacuum kiln to complete drying. This allowed observations of the effect of reconditioning on collapsed vacuum dried boards and compared with non-reconditioned boards. Specialised instrumentation including anemometers, strain gauges, thermocouples and load cells measured the kiln conditions and wood properties during vacuum drying to test the modelling component of this project. For all trials except SPG1, a 300 mm length section was sawn from the middle of a seventh test board to perform a flying wood test (Brandao and Perré, 1996).
Test board 1
Test board 5 Test board 2
Test board 4
Test board 6 Test board 3
Test board 7–flying wood

11
The methods and results recorded from these instruments are reported separately in this report. For trials SPG1, SPG2, JAR1, BBT1 and MES1 we placed a concrete weight of approximately 500 kg on bearers on the top of the stack to reduce distortion. Due to unacceptable twist distortion recorded on dried boards for trial JAR1, we used two concrete weights for all subsequent trials in an attempt to reduce distortion to within permissible limits, with an approximate combined weight of 1000 kg.
Drying schedules In keeping this methodology section generic between trials, we have reported the justification and presentation of the drying schedules separately in the results section of this report, for each species group.
12
3.1.4 Explanation of statistical analysis and presentation techniques
Scatter plots We use scattergrams to present much of the quantitative data in this report. Scattergrams are a visual representation of quantitative results and are particularly useful for visually comparing paired numerical data. Individual, disconnected symbols represent data on a scattergrams. The plot allows the reader to observe the distribution of quantitative data around the mean, represented by a red line.
Normality test Before statistical comparison of results between end-matched trials, normality tests were required and performed on much of the quantitative data. Normality tests show if a quantitative data set is normally distributed and hence determines the statistical method used to compare and analyse paired data. For instance, if both sets of paired data are normally distributed, parametric tests are required for statistical comparisons. Similarly, if one or both sets of paired data are not normally distributed, nonparametric tests are required. The normality test used in this report was the Shapiro–Wilk test, testing normality to a 95% confidence limit.
Parametric test Parametric tests compare normally distributed quantitative data. The parametric test used in this report is the Student t test. The test statistically compares if significant differences exist between the means of paired data of end-matched boards for both conventional and vacuum drying treatments.
Nonparametric test Nonparametric tests compare non-normally distributed quantitative data. We used two nonparametric tests in this report: the Wilcoxin signed–rank test and the Mann–Whitney test. The Wilcoxin signed–rank test statistically compares if significant differences exist between the paired data populations of end-matched boards for both conventional and vacuum drying treatments. The Mann–Whitney test statistically compares if significant differences exist between the unpaired data populations between trials of the same species.
Significance The standard 95% confidence limit applied to all paired comparisons. Therefore, significance is indicated by p<0.05.

13
3.2 Applied drying - Economic model The following method section describes how to use the economic model, and details the input and output variables and mechanisms that generate the output data.
3.2.1 How to use the model The following section is a user guide explaining how to use the economic model.
Running model To run the model, open (double click) the file ‘KilnCompare.exe’.
Opening files To open a previously saved data file select File/Open when running the model. Select the directory and file you wish to open. A default file called ‘Kiln data’ can be opened when the model is run. This is a read only file. This file provides sensible data and can be used as a starting point for further model manipulation.
Saving files To save a file under the same name you have previously opened select File/Save. You cannot save to the default file ‘Kiln data’ as it is a read only file. To save the file under a different filename select File/Save As and enter the new file name in the Filename box.
Entering data Data can be entered into the first four pages selected via the tabs labelled Finance, Capacity, Operations and Wood. Numerical data only are allowed.
Observing model outputs Model outputs can be observed by selecting the fifth tab labelled Calculation.
Information Input variable information can be observed by ‘double clicking’ the input variable headings.
3.2.2 Inputs Drying costs are analysed using a number of input variables allowing the total drying costs to be estimated. The model application consists of four input variable pages accessed by the tabs labelled: Finance, Capacity, Operations and Wood. The following provides an explanation of the input variables required.
Finance variables Project life – Depreciation period where the capital cost of the kiln is straight line depreciated over project life (years).
Kiln capital ($) – The capital cost of a single kiln
Interest rate (%) – The interest charged on stock holdings
Wood value ($/m3) – The value of a cubic metre of green-sawn stacked wood
Electrical($) - The price of electricity

14
Heat ($/MJ) - The price of a mega joule of heat energy
Thermal Efficiency (%) - An estimate of average operational heat loss from a kiln as percentage
Capacity No. of Kilns - The number of kilns you want to work with
Kiln Capacity (m3) - The maximum cubic metres of wood in a kiln
No. of Fans - The number of fans in a kiln
Fan Rating (kW) - The average power rating of a single fan
Vacuum Pump Rating (kW) - The average power rating of the vacuum pump
Vacuum Pump Usage (%) - An estimate of run time of the vacuum pump as a percentage
Condenser Fan Rating (kW) - The average power rating of the condenser fan
Condenser Fan Usage (%) - An estimate of run time of the condenser fan as a percentage
Operations Pre-Drying - Refers to an initial air-drying stage. This is used when drying time is greater than zero
Air Drying Time (weeks) - The air drying time
Initial Moisture Content (%) - The initial moisture content of wood entering this drying stage
Final Moisture Content (%) - The moisture content of wood at the end of this drying stage (%)
Final Drying - Refers to the kiln drying stage
Final Drying Time (hrs) - The time in kiln drying
Drying Max. Temp. (°C) - The highest temperature attained during kiln drying
Operational Year (days) - The days per year of operating time
Run Time (hrs) - The sum of air and kiln drying times
Wood Wood Basic Density (kg/m3) - The basic density of the wood resource to be dried
3.2.3 Calculated outputs The model application calculated outputs are presented in the ‘Calculation’ tab located at the bottom right corner of the program. The following section details the calculations used to determine the values presented on the ‘Calculation’ tab. As per the model output, the

15
calculations are split between the Capital calculations, Operational calculations and Total costs where any differences between conventional and vacuum drying calculations are noted.
Annual throughput We define the annual throughput as:
capacity kiln kilns of no. )(mcapacity otalt 3 ×= (4)
year per cycles kiln capacity otalt /yr)(m throughput annual 3 ×= (5) Where,
time run24 year loperationa year per cycles kiln ×= (6)
Capital calculations – depreciation We calculate the annual cost of plant capital or depreciation using:
life project
capital kiln kilns of no. ($/yr) capital plant cost ×= (7)
throuput annual($/yr) capital plant cost )($/m capital plant cost 3 = (8)
Capital calculations –stock interest cost If the air-drying time is set to a value greater than zero weeks, the following calculations are performed to determine the annual interest and interest per cubic metre on the dry yard stock:
time drying final 247 time drying ira capacity total )(m stockyarddry air volume 3 ××
×= (9)
1000rate interest value wood stockyarddry air volume ($/yr) interest dry stock air of cost ××= (10)
throughput annual($/yr) interest dry stock air of cost )($/m interest dry stock air of cost 3 = (11)
Similarly, the following calculations are performed to determine the annual interest and interest per cubic metre on the kiln stock:
1000
rate interest value woodcapacity total ($/yr) interest stockkiln of cost ××= (12)
throughput annual($/yr) interest stockkiln of cost )($/m interest stockkiln of cost 3 = (13)
Capital calculations – totals The total capital costs are calculated as follows:
interest stockkiln of cost interest dry stock air cost capital plant cost ($/yr) cost capital total ++= (14)

16
throughput annual ($/yr) cost capital total )($/m cost capital total 3 = (15)
Operations calculations – Air Flow The cost of running the kiln fans is calculated using:
costy electricittime drying kilnkilns of number rating fan fans of no. year per cycles kiln ($/yr) cost flow air
×××××= (16)
throughput annual ($/yr) cost flow air )($/m cost flow air 3 = (17)
Operations calculations – Heat The quantity of heat energy used per cubic metre for heating the wood, heating the water within the wood and vaporisation of water during kiln drying are calculated using:
T woodof heat specificdensity basic wood )(MJ/m woodheat toenergy 3 ∆××=1000
(18)
Where the specific heat of hardwood is 1.2 kJ/(kg°C) and ∆T is the maximum – minimum drying temperature (°C). For the purpose of this study the minimum drying temperature is assumed ambient temperature at 25°C.
T waterof heat specificdensity basic wood100
MCinitial )(MJ/m waterheat toenergy 3 ∆×××=1000
(19)
Where the specific heat of water is 4.186 kJ/(kg°C).
onvaporisati of heatdensity basic wood100
MCfinal- MCinitial )(MJ/m waterheat toenergy 3 ××= (20)
Where the heat of vaporisation of water is 2.25 MJ/kg (Serway, 1998).
onvaporisati of heatdensity basic wood100
MCfinal- MCinitial )(MJ/m watervaporise toenergy 3 ××= (21)
The total amount of heat per cubic meter, taking into account the thermal loss is calculated using:
( )
−
×
++=
100loss thermal1
watervaporise toenergy waterheat toenergy woodheat toenergy )(MJ/menergy heat total 3
(22)
The total cost of heat energy is calculated as follows
( ) heat of costenergy heat totalcapacity total year per cycles kiln ($/yr) cost heat ×××= (23)
throughput annual($/yr) cost heat )($/m cost heat 3 = (24)
17
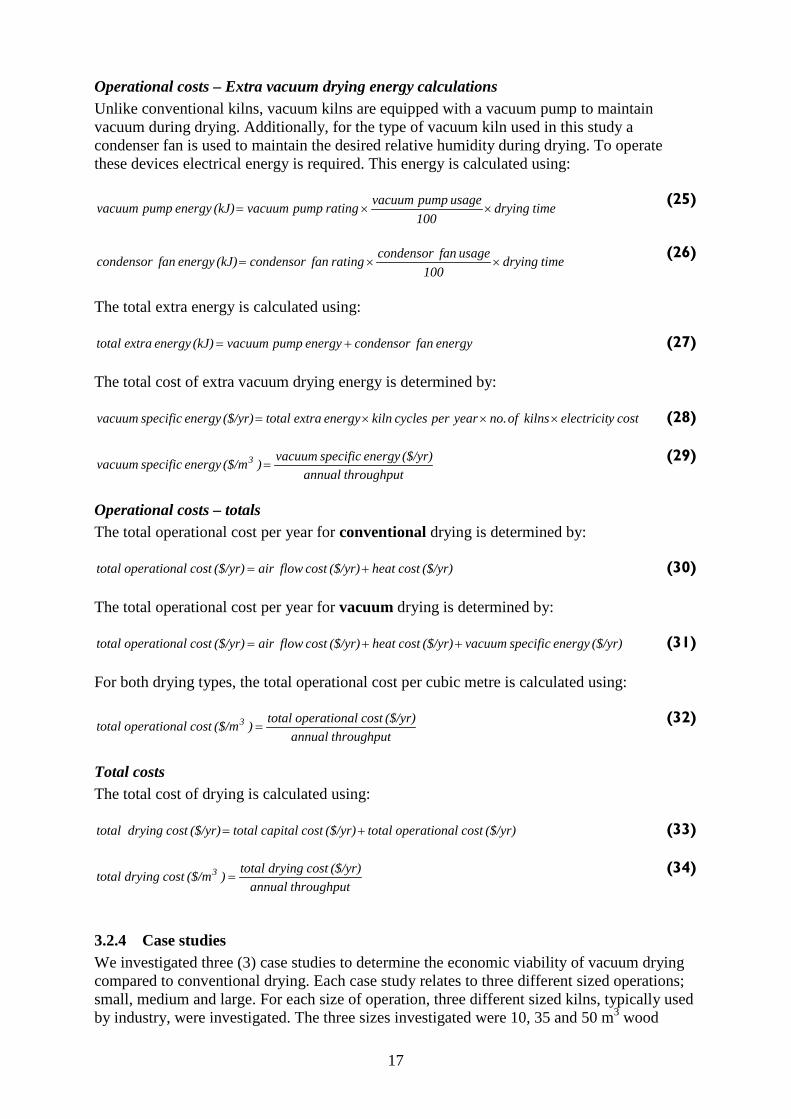
Operational costs – Extra vacuum drying energy calculations Unlike conventional kilns, vacuum kilns are equipped with a vacuum pump to maintain vacuum during drying. Additionally, for the type of vacuum kiln used in this study a condenser fan is used to maintain the desired relative humidity during drying. To operate these devices electrical energy is required. This energy is calculated using:
time drying100
usage pump vacuumrating pump vacuum (kJ)energy pump vacuum ××= (25)
time drying
100usage fan condensorrating fan condensor (kJ)energy fan condensor ××= (26)
The total extra energy is calculated using:
energy fan condensorenergy pump vacuum(kJ)energy extra total += (27) The total cost of extra vacuum drying energy is determined by:
costy electricitkilns of no.year per cycles kilnenergy extra total ($/yr)energy specificvacuum ×××= (28)
throughput annual($/yr)energy specificvacuum )($/menergy specificvacuum 3 = (29)
Operational costs – totals The total operational cost per year for conventional drying is determined by:
($/yr) cost heat ($/yr) cost flow air($/yr) cost loperationa total += (30) The total operational cost per year for vacuum drying is determined by:
($/yr)energy specificvacuum($/yr) cost heat ($/yr) cost flow air($/yr) cost loperationa total ++= (31) For both drying types, the total operational cost per cubic metre is calculated using:
throughput annual($/yr) cost loperationa total)($/m cost loperationa total 3 = (32)
Total costs The total cost of drying is calculated using:
($/yr) cost loperationa total ($/yr) cost capital total ($/yr) cost drying total += (33)
throughput annual($/yr) cost drying total)($/m cost drying total 3 = (34)
3.2.4 Case studies We investigated three (3) case studies to determine the economic viability of vacuum drying compared to conventional drying. Each case study relates to three different sized operations; small, medium and large. For each size of operation, three different sized kilns, typically used by industry, were investigated. The three sizes investigated were 10, 35 and 50 m3 wood

18
capacity kilns. Obviously many more scenarios exist, however these sizes were chosen based on typical sized hardwood operations in Australia. For each case study the following assumptions were made:
Throughput Throughput is calculated and used to normalise drying cost comparisons. For instance, if we compare a 50 m3 kiln for both conventional and vacuum drying operations, given the vacuum drying rate is faster, the vacuum drying operations will have a greater throughput. This is taken into account for all $/m3 calculations.
Cost of green-off-saw wood
The cost of green-off-saw wood was set at a constant value of $426 for all case studies. This figure was calculated from the most recent native sawlog price index of $149 / m3 (http://abare/publications_html/afwps, 2010) divided by the approximate average green-off-saw recovery for Australian hardwoods of 35% (Leggate et al., 2000).
Project life – depreciation time The capital depreciation time was fixed at a typical 20 years for each case study.
Interest on stock The stock interest was fixed at a typical 7% for each case study.
Energy costs Heat energy costs were fixed at 0.05 $/MJ, a typical average value of natural gas in Australia at the time of writing this report (Anon, 2011). Obviously, this figure will differ between different operations and can be adjusted to reflect other heating mediums such as steam, wood waste or heated oil etc. The heat energy costs are made up of a combination of heating required to heat the wood, heat the water within the wood and vaporise the water into steam at the wood surface. The total heat energy cost is also a function of the thermal loss undergone by a certain kiln type.
Electricity costs Electricity costs were fixed at 0.2 $/kWh, a typical average value in Australia at the time of writing this report (Anon, 2011).
Thermal efficiency The project collaborator Brunner-Hildebrand provided data for the thermal efficiency for each kiln type. The values used are detailed in the results section: 4.2 Applied drying - Economic model.
Kiln capacities For each case study three kiln capacity sizes were investigated: 10, 35 and 50 m3 of wood volume.
Fans, vacuum pump and condenser fan details The project collaborator Brunner-Hildebrand provided data for the number of fans, average fan ratings, vacuum pump and condenser fan usage and ratings for each case study. Please note that the fan, pump and condenser ratings are estimated average values over a single kiln run. The values used are detailed in the results section: 4.2 Applied drying - Economic model.

19
Kiln drying time and wood conditions Conventional and kiln drying times were based on the best case scenario vacuum drying trial per species, in terms of quality and drying time. For each scenario, we used the actual initial and final MC values, basic densities and maximum drying temperatures. The same values were used for a single species between each case study. The values used are detailed in the results section: 4.2 Applied drying - Economic model.
Operational year For each case study, the operational year was fixed at 328 days. This equates to a full year operation minus four weeks. We based this assumption on the fact that many sawmills shutdown over the Christmas and early New Year period.

20
3.3 Drying modelling - Measurement of kiln conditions and wood drying properties
We used specialised instruments on test boards during vacuum drying trials to obtain, through continuous ‘real–time’ measurements, a greater understanding of the kiln conditions and wood drying properties. This is essential to validate and provide actual kiln and wood property data for the modelling component of this project and hence optimise the process. As the proposed model is ‘deterministic’, actual wood property and kiln data are required to ‘feed’ the model to obtain the most accurate simulations possible. This section describes the specialised instrumentation used to measure both wood boundary condition properties and internal wood properties we used for model input. It should be noted that a certain level of ‘trial and error’ and ‘prototyping’ of these instruments occurred between drying trials, the account of which is presented in Milestone Report 2. This part of the experimental design is not included in this report as we deemed it unnecessary. Three test boards were selected for each trial to measure internal temperature using thermocouples, MC using load cells and shrinkage using strain gauges. Except for the first trial SPG1, one of the three test boards was modified to perform a ‘flying wood’ test, described later in this section. The flying wood test board utilised the specialised instrumentation in the same manner described below, as the other two test boards. Each test board was loaded onto two load cells, one at each end, to measure the MC of these boards based on board weight. We measured the overall shrinkage for the same three boards using specialised ‘omega’ shaped strain gauges attached to the board edges using a jig developed by DEEDI. Two strain gauges were used for each test board. Internal temperature was measured for the test boards using 1 mm diameter thermocouples. Measurements were made at 1/3 thickness and 1/2 thickness inserted 50 mm into the side of the boards, and at the centre of the board end at a depth of 50 mm. Inlet and outlet airflows were measured using two anemometers placed at approximately ½ the stack height on the second board in from the stack edge at each side of the stack. The output of these devices was obtained using DataTaker™ data acquisition equipment.
3.3.1 Shrinkage and flying wood Generally, drying stresses are assessed at stages or at the end of drying using prong or cup tests. However, it is very difficult to gather information on the stress field within boards during drying. The flying wood test was developed in the laboratory of Wood Science at École Nationale du Génie Rural des Eaux et des Forêts (ENGREF) in Nancy, France and is a well documented test method for gathering information on the stress field during drying and the phenomenon of stress reversal (Aguiar and Perré, 2000, Brandao and Perré, 1996). The data gathered from this test method, although not used in this report will be used for future modelling work incorporating a mechanical (degrade) component. The flying wood test consists of non-symmetrical drying of small boards. Five surfaces of the sample are sealed, so that the moisture migration occurs only in one direction. This strategy transforms a part of the drying stresses encountered during drying into a global deformation of the sample (Figure 3).

21
Three successive stages are observed: the first drying period with liquid water at the surface with no shrinkage and hence no deformation; the second period with shrinkage at the surface and positive curvature; and the final stage which starts when shrinkage occurs close to the impermeable face. Due to the memory effect of wood, which is responsive to stress reversal in normal boards, the curvature becomes negative in the case of non–symmetrical drying. Given the same external conditions, the response of each specimen to this test strongly depends on the species, the sawing pattern and the position in the tree (Perré, 2007a).
Figure 3. Principle of the flying wood test, diagram extracted from Perré & Passard (2008) To prepare the sample board for the flying wood test, we cut a 300 mm length section from the middle of the test board. The section was ripped down the centre along the narrow edge surface to produce two (2) boards of similar dimension (approximately 14 x 110 x 300 mm). One half was chosen for the ‘flying wood’ test and was coated on five surfaces with epoxy resin excluding the wide freshly ripped face. During drying, we used two strain gauges to measure the test board’s shrinkage/curvature. Additionally, we inserted three thermocouples into the board, as previously discussed, and the weight of the board was measured using two load cells. The flying wood test board was originally placed in the gap between the top of the stack and the concrete weight, but was later placed within the kiln stack and surrounded by boards to maintain more representative airflow (Plate 5).

22
Plate 5. Position of flying wood test board during drying We measured the gross shrinkage for each test board using Sokki Kenkyujo PI–2–50 specialised ‘omega’ shaped strain gauges fixed to the centre of the board edges. The strain gauges are usually used industrially to measure crack propagation in concrete. Thus, the potential for these strain gauges to measure surface checking was realised. We used two strain gauges for each test board, one on the top and another underneath. We developed the strain gauge assembly to allow flying wood test board distortion to be captured. This also has allowed the measurement of cup distortion on the full dimension test boards. They are attached to vertical aluminium plates screwed to the narrow sides of the board, via nylon extensions, eye hooks and split pins (Plate 6 and Plate 1). Even though no slack was evident between the hooks and pins, the assembly wasn’t so tight as to impede the movement of the strain gauge in the vertical direction so accurate curvature of the flying wood board could be captured (Plate 7). This assembly allows the strain gauges to move freely at the attached joint during both natural board shrinkage and cupping.
Plate 6. Strain gauge assembly–plan view
aluminium plate split pins
Plate 7. Strain gauge assembly–side view
3.3.2 Load/moisture content Each test board was loaded onto two load cells (20 kg capacity each, supplied by Scaime (model F60F), one at each end, to measure the MC of these boards based on initial board MC and subsequent weight reduction during drying. Due to the larger size of the load cells and associated weighing frames, the ends of the board below the test boards were removed to accommodate them (Plate 8). We removed the strippers and board above the test boards to allow a large degree of unrestrained distortion (Plate 9).
spring
strain gauge
nylon extension

23 Evaluation of super–heated steam vacuum drying viability and development of a predictive drying model for Australian hardwood species – Final report
Plate 8. Load cell placement
Plate 9. Test board/ load cell arrangement
3.3.3 Airflow We measured inlet and outlet airflows using two Schiltnecht MiniAir60 anemometers placed at ½ the stack height on the second board in from the stack edge at each side of the stack. The anemometers were attached to the boards using ‘u’ brackets (Plate 10).
Plate 10. Anemometer placement
3.3.4 Board temperature We used three thermocouples per test board for each trial. Thermocouples were placed at 1/3 and ½ thickness of boards, 50 mm in from the side and at the centre thickness inserted 50 mm in from the end (Plate 11).
Plate 11. Thermocouple inserted into the end of a test board

24 Evaluation of super–heated steam vacuum drying viability and development of a predictive drying model for Australian hardwood species – Final report
3.4 Drying modelling - Measurement of essential wood properties Drying is a complex operation combining intricate physical and mechanical processes that include external heat and mass flow, coupled heat and mass transfer within wood, shrinkage induced stress deformation, and the mechanical memory behaviour of wood. The model developed for this work represents the heat and mass transfer component only. Previous research (Salin, 2010, Perré, 1996) has shown that a number of wood properties exist that must be measured to have provide the necessary structure for developing an accurate drying model. A number of other wood properties that govern wood heat and mass transfer exist, but can be either inferred from essential wood properties or calculated via theory. The following describes the methods used to measure the essential wood properties for accurate heat and mass transfer modelling.
3.4.1 Wood density and initial MC
For the vacuum drying trials simulated, we used the average wood density and initial MC measured from the 100 sample boards. The method for which has been previously described in section 3.1 Applied drying – Experimental drying trials.
3.4.2 Fibre porosity Fibre porosity is essentially a measure of the ratio of fibre lumen area to woody tissue in the transverse (radial/tangential) plane. We determined fibre porosity by using specialised image analysis software on environmental scanning electron microscope scans of each species in the transverse direction. We also measured the density of scanned sections to investigate the relationship between fibre porosity and wood density. The following describes the methods used.
Environmental Scanning electron microscope An environmental scanning electron microscope (ESEM) is a type of electron microscope that images a sample surface by scanning it with a high-energy beam of electrons, usually under partial vacuum. The electrons interact with the atoms that make up the sample producing signals that contain information about the sample's surface topography, composition and other properties such as electrical conductivity. An ESEM can produce very high-resolution images of a sample surface revealing details about 1 to 5 nm in size. Due to the way these images are created, SEM micrographs have a very large depth of field yielding a characteristic three-dimensional appearance useful for understanding the surface structure of a sample. A wide range of magnifications is possible, from about x 25 (about equivalent to that of a powerful hand-lens) to about x 250,000, about 250 times the magnification limit of the best optical microscopes. The ESEM used for this research was a Quanta 200 3D manufactured by FEI2 (Plate 12). The microscope has a resolution of 3 nm and its main components consist of: a vacuum pump, electron emission column, sealed specimen chamber and image processing facilities.
2 See http://www.fei.com/products/families/quanta-family.aspx for more information.

25 Evaluation of super–heated steam vacuum drying viability and development of a predictive drying model for Australian hardwood species – Final report
Electron emission column
Vacuum pump
Specimen chamber Image processing PC
Plate 12. FEI Quanta 200 3D environmental electron scanning microscope.
Meshpore Meshpore (Perré, 2005b) is a powerful software package used to apply image-based meshing techniques to anisotropic and heterogeneous porous media. This application allows a comprehensive finite element mesh to be prepared from digital images and can be used to determine important morphological properties of porous media, such as average cell wall thickness and media porosity. Using a number of mathematical algorithms the application is able to automatically describe cell contours by segment chains, allowing additional chains to be added, deleted, and altered.
Sample preparation For each species, we cut small heartwood samples from unseasoned, median density sample boards used for the vacuum drying trials. One sample per species was cut using a laboratory bandsaw to the approximate dimensions: 4 mm (radial) x 4 mm (tangential) x 20 mm (longitudinal). The samples were cut in half lengthwise to produce two matched samples of dimension: 4 mm x 4 mm x 10 mm. One section was used for ESEM analysis while the other section was used to determine basic density. One image was analysed per species. The ESEM samples were soaked in water at room temperature for at least 24 hours, before further processing, to soften the wood tissue prior to image surface preparation. One of the radial/tangential surfaces was prepared for ESEM imaging using a precision MICROM HM 440™ sledge/sliding microtome (Plate 13). This process provides a flat, sharply sliced surface essential for producing high quality ESEM images. We loaded samples into the ESEM specimen chamber (Plate 14), levelled and scanned at 200X 400X and 800X magnifications. Images at 800X magnification were cropped to include only the wood fibres (not ray parenchyma or vessel cells).

26 Evaluation of super–heated steam vacuum drying viability and development of a predictive drying model for Australian hardwood species – Final report
Plate 13. Sample surface preparation using a MICROM HM 440™ sliding microtome
Plate 14. Sample placed in ESEM specimen chamber Using MeshPore, cell lumen contours were automatically generated (Figure 4) to determine the average fibre porosity. The fibre porosity (%) was calculated by MeshPore as the sum of the voids divided by the total image area, as follows:
1001 ×=∑=
i
n
ivj
p A
Af
(35)
Where fp is the fibre porosity (%), Avj is the void (lumen) area (m2) of lumen number j, n is the number of lumens in the image, and Ai is the area of the image (m2).
Sample
Sample Microtome blade

27 Evaluation of super–heated steam vacuum drying viability and development of a predictive drying model for Australian hardwood species – Final report
Figure 4. Automated Meshpore contour generated for Eucalyptus pilularis. We calculated basic density by determining a samples green volume and dry weight in accordance with Australian and New Zealand Standard AS/NZS 1080.3:2000 – Timber – Methods of Test – Method 3: Density (Standards Australia 2000). To ensure samples were fully saturated we placed them in a beaker of water, which we positioned in an airtight container surrounded by an ice/water mixture (Plate 15). The ice water was used to maintain the samples at low temperature to minimise leaching of extractives and provide accurate density measurements. We connected the container to a small vacuum pump and a vacuum pressure of 15 mbar was drawn. The samples remained in this state for approximately 1 hour before slow depressurisation. This was repeated 3 times to ensure the samples were fully saturated. The green volume of the samples was determined using the water immersion method. We dried the samples in a laboratory oven at 103 ± 2°C for 48 hours and weighed to determine the oven dry weight. We calculated sample basic density using:
g
db V
m=ρ
(36)
Where ρb is the basic density (kg/m3), md is the oven dry mass (kg), and Vg is the green volume (m3).
Water/ice mixture
Samples in beaker of water
Plate 15. Samples prepared for vacuum saturation (container uncovered for photo) Using the measured fibre porosities, density was calculated to determine if density can be predicted using only these parameters. The formula uses the oven dried density of wood

28 Evaluation of super–heated steam vacuum drying viability and development of a predictive drying model for Australian hardwood species – Final report
tissue, suggested to be constant for all wood species, the value of which is reported to be approximately 1500 kg/m3 (Siau, 1984). The following equation was used to calculate density:
( )fwtcalc φρρ −= 1 (37) Where ρcalc is the calculated density, ρwt is the density of wood tissue (1500 kg/m3) and φf is the fibre porosity.
3.4.3 Gas permeability Permeability is the property of a material that indicates how freely fluids flow in response to a pressure gradient. Permeability of wood to liquids and gases plays an important role in a number of technical processes such as wood treatment with preservative chemicals, the pulping process and wood drying. The more permeable the wood the more easily it can be processed or treated. Drying time and conditions are driven by the permeability making it a crucial factor for the resulting product quality (Hansmann et al., 2002). Wood permeability in hardwoods is affected mainly by anatomical features such as vessel size and obstructions (tyloses), pit aspiration, and the presence of extractives in heartwood.(Milota et al., 1995). For Australian eucalyptus species, as previous researchers suggest, water movement during conventional drying is restricted predominantly to diffusion, (Innes, 1996, Blakemore and Langrish, 2008).
Sampling procedure For each species, we prepared one quartersawn and one backsawn board with dimensions 300 x 100 x 8 mm using boards from the vacuum drying trials of this project. Three 74 mm diameter samples were cut using an 80 mm diameter hole-saw for each board producing three radial and three tangential (in thickness direction) samples per species. For each species, one 200 x 100 x 28 mm thick sample was prepared. From those boards we cut three 19 mm diameter, 40 mm long cylinders using a 24 mm hole-saw in the same longitudinal symmetry plane (Figure 5). We used these samples to determine longitudinal permeability. Due to the impermeability of these species, the longitudinal samples were cross-cut in half to produce 20 mm long samples. We coated the side surfaces of all specimens with epoxy resin to guarantee the air tightness of the lateral surfaces during measurement.
Figure 5. Sample preparation for permeability tests: Left – radial and tangential permeability sampling. Right – longitudinal permeability sampling

29 Evaluation of super–heated steam vacuum drying viability and development of a predictive drying model for Australian hardwood species – Final report
Test apparatus The need to carry out measurements of permeability to air of various species, along the three material directions and at different pressure levels requires an accurate and reliable device capable of measurement over a wide range of permeability values (from 10-10 down to 10-18 m2). For this purpose, the team at AgroParisTech-ENGREF developed a system called ALU-CHA at LERMAB. The originality of this medium lies in a high reliability of lateral air tightness, the rapid operation and the possibility to measure permeability with the same geometry, thus on the same samples as those employed for the diffusion measurement (Figure 6). This device allows us to apply an accurate and constant pressure difference between the two faces of the sample. We can determine the corresponding gas flux by the measurement of the thermal perturbation due to the air flux when it passes through a capillary tube.
Figure 6. Schematic of sample support with ALU-CHA system. Diagram courtesy of (Rousset et al., 2004) Note the presence of a rubber tube around the sample. Partial vacuum phase is applied in the chamber between the rubber tube and the aluminum tube to easily place or remove the sample. Then, during measurement, a typical pressure of 2–3 bar is applied in this chamber to press the rubber joint against the lateral face of the sample for air tightness. In addition, before placing the specimen in the ALU-CHA system, a silicone-based grease of high viscosity (vacuum grease) was applied on the specimen’s lateral surfaces to inhibit surface flow in the micro-porosity layer formed between the epoxy resin and rubber surfaces. The measurement was carried out by applying a controlled and constant pressure difference (ΔP) between two faces of the specimen, and then measuring the corresponding airflow (Q). All measurements were performed in a temperature-controlled room with minimum temperature fluctuations. Due to the effect of temperature on the air viscosity, the room temperature was also recorded for each measurement. The air flux permeating through the specimen was recorded when the flowmeter exhibited a nearly constant airflow. The air permeability of each sample was then calculated by Darcy’s law (Dullien, 1992):
PPAPeQK
..
...∆
=µ
(38)
Where K is intrinsic permeability (m2), Q is flux (m2
s-1), μ is dynamic viscosity of the air (Pa. s), e is sample thickness (m), P is pressure at the flux Q (Pa), A is sample area (m2), ΔP is

30 Evaluation of super–heated steam vacuum drying viability and development of a predictive drying model for Australian hardwood species – Final report
pressure difference (Pa), and P is average pressure (Pa). The validity of Darcy’s law was proved for all test samples by the linear correlation found between the pressure difference (ΔP) and air flux (Q). Two ALU-CHA systems were used to cater for the two diameter class of specimens. One system was used for the longitudinal samples (Figure 7) and another for the larger diameter transverse samples. (Figure 8).
Figure 7. ALU-CHA system for longitudinal samples
Figure 8. ALU-CHA system for transverse samples
For most species, permeability measurements in the radial and tangential directions could not be achieved using the regular experimental set-up as the permeability was too low, below the limitation of the flux-meter (10-18 m2). So instead the flux-meter was disconnected and a simple ‘venturi type’ tube was connected to the gas output of the ALU-CHA system. This entailed a flexible silicon hose connected to a glass tube with an internal radius of 2.87 mm. The radius of the tube was accurately calibrated using a laboratory pipette. The glass tube was placed in a beaker of water next to a 0.5 mm increment metal ruler (Figure 9). We could then measure permeability as before by measuring the volume of the displacement of water in the tube as a function of time (measured using a chronometer) at different pressures. Instead of measuring permeability over a matter of seconds, minutes or hours were required to obtain accurate measurements using this method. This method, although using relatively fundamental practices, was able to increase the range of permeability measurement 4 orders of magnitude, from 10-18 to 10-22.

31 Evaluation of super–heated steam vacuum drying viability and development of a predictive drying model for Australian hardwood species – Final report
Silicon tube
Glass tube
Ruler
Figure 9. Apparatus used to measure low permeability samples
3.4.4 Bound Water Diffusion (Db) Avrimidis (2007) suggests that unsteady-state diffusion coefficient values are of more interest for drying modelling. However, through personal communication with experts in this field, Rémond (2010), suggested that for thick specimens of high density hardwood, measured diffusion coefficients under steady-state conditions would be equal to those in unsteady-state conditions. Therefore, as the species tested are of high density relative to most commercial species and steady-state measurements require less complex and cheaper equipment, we chose the steady-state regime to calibrate and refine the theoretical values described in section 3.5.7. Physical Properties. We used the same specimens to determine diffusion co-efficient values as those used to measure permeabilities in each direction for each species (see sampling methodology above). Wood specimens were initially equalised in a constant humidity and temperature chamber at 75 ± 2% relative humidity and 35 ± 0.1 ºC to produce equilibrium conditions of 14% MC. The principle of measurement in the steady-state regime uses the technique of the vaporimeter (Plate 16). Specimens were placed onto similar diameter cylindrical glass vessels containing a saturated solution of deionised/purified water and chemical grade (>99.9%) NaCl. For a given temperature, the partial pressure of vapour relates directly to relative humidity. A saturated salt solution inside the vessel generates a relative humidity (RH2) of 75% at 35 ºC.
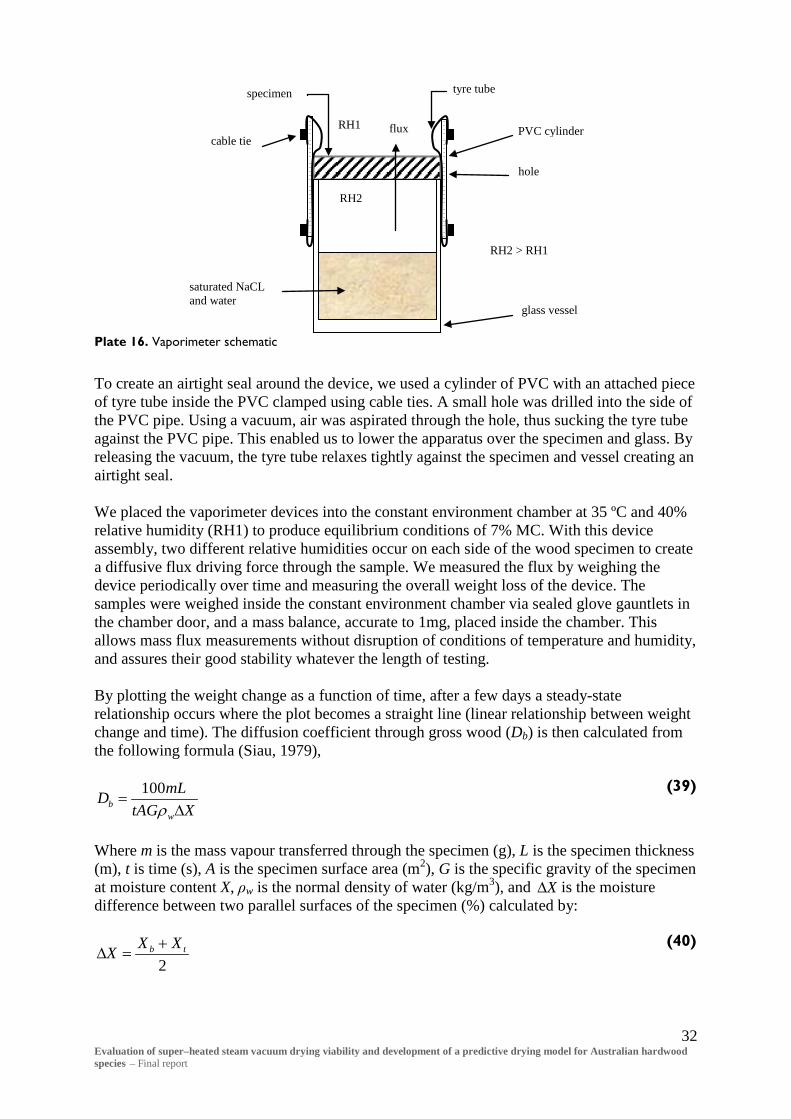
32 Evaluation of super–heated steam vacuum drying viability and development of a predictive drying model for Australian hardwood species – Final report
Plate 16. Vaporimeter schematic
To create an airtight seal around the device, we used a cylinder of PVC with an attached piece of tyre tube inside the PVC clamped using cable ties. A small hole was drilled into the side of the PVC pipe. Using a vacuum, air was aspirated through the hole, thus sucking the tyre tube against the PVC pipe. This enabled us to lower the apparatus over the specimen and glass. By releasing the vacuum, the tyre tube relaxes tightly against the specimen and vessel creating an airtight seal. We placed the vaporimeter devices into the constant environment chamber at 35 ºC and 40% relative humidity (RH1) to produce equilibrium conditions of 7% MC. With this device assembly, two different relative humidities occur on each side of the wood specimen to create a diffusive flux driving force through the sample. We measured the flux by weighing the device periodically over time and measuring the overall weight loss of the device. The samples were weighed inside the constant environment chamber via sealed glove gauntlets in the chamber door, and a mass balance, accurate to 1mg, placed inside the chamber. This allows mass flux measurements without disruption of conditions of temperature and humidity, and assures their good stability whatever the length of testing. By plotting the weight change as a function of time, after a few days a steady-state relationship occurs where the plot becomes a straight line (linear relationship between weight change and time). The diffusion coefficient through gross wood (Db) is then calculated from the following formula (Siau, 1979),
XtAGmLDw
b ∆=
ρ100
(39)
Where m is the mass vapour transferred through the specimen (g), L is the specimen thickness (m), t is time (s), A is the specimen surface area (m2), G is the specific gravity of the specimen at moisture content X, ρw is the normal density of water (kg/m3), and X∆ is the moisture difference between two parallel surfaces of the specimen (%) calculated by:
2tb XXX +
=∆ (40)
RH2
specimen tyre tube
RH1 flux PVC cylinder cable tie
glass vessel
saturated NaCL and water
hole
RH2 > RH1

33 Evaluation of super–heated steam vacuum drying viability and development of a predictive drying model for Australian hardwood species – Final report
Where Xb is the bottom specimen surface MC (%) and Xt is the top specimen surface MC (%).
3.4.5 Shrinkage The shrinkage of wood during drying is one of the most important properties as it is responsible for deformations during drying (twist, spring, bow and cupping), dimensional variations in situ, and is the driving force for stress. Shrinkage induced drying stress is one of the main reasons for poor quality of dried products. Due to this project’s timeframe and model complexities, a mechanical modelling component was not included; heat and mass transfer only. An accurate heat and mass transfer model is however necessary to develop an accurate drying mechanics model. Even though the shrinkage values derived were not required for the heat and mass transfer model, the measurements were necessary to determine sorption isotherms and hysteresis for each species for accurate board MC predictions. Salin (2010) proposes that traditional models that use an average MC sorption curve (derived across a range of species) are problematic because different species have different sorption isotherms of which drying models are very sensitive. The work presented in this section aims to characterise the wood-water relations of each in particular shrinkage and sorption isotherms. We performed tests on small micro-samples using specialised precision apparatus designed and built to determine the drying behaviour of small micro-samples. By using such small samples, the stress level during testing is not high enough to produce checks and, more importantly, the sample can be considered relatively homogeneous particularly in terms of moisture content variation. As far as the author is aware, there are no other methods available to continuously follow the evolution of wood samples as a function of external conditions. The highly accurate results produced by this method are imperative as input parameters for theoretical modelling.
Test apparatus The apparatus used for these tests was designed and built specifically to accurately determine the wood-water relations on micro-samples, by members of the ENGREF team. Plate 17 and Figure 10 present the experimental set-up. The dimensions of micro-samples are measured using a non-contact laser system while continuously measuring the MC of samples. The system incorporates a highly sensitive electronic microbalance (MC2, Sartorius) with a capacity of 2 g and typical sensitivity of 0.1 µg. Two high-speed laser micrometers (Keyance, LS-5000 series) are incorporated to measure changes in the width and height samples without contact. The laser micrometers can measure within a range of 0.2 – 40 mm at a scanning rate of 1200 scans/s, resolution of 0.05 µm and accuracy of 2 µm. The outputs from both devices are fed back to a PC.

34 Evaluation of super–heated steam vacuum drying viability and development of a predictive drying model for Australian hardwood species – Final report
Water bath
Laser-scan micrometersHeat exchanger
Micro-balance Infrared thermometer
Sample
Plate 17. Experimental set-up overview
Figure 10. Schematic diagram of scanning laser micrometers and sample positioning. Diagram extracted from Perré (2007b). The surface temperature of samples is measured using an infrared thermometer (pyrometer). It uses a germanium lens with a measurement spot size of 2 mm, and measures to an accuracy of 0.6 % of the measured value (in °C). The measurement system is placed in a climatic chamber where the dry-bulb temperature is held constant at 30°C by a proportional-integral-derivative (PID) controller. Relative humidity inside the chamber is controlled using a water bath maintained at the desired dew point temperature. A refrigerating circulator is used to maintain the bath temperature. A small fan ensures satisfactory airflow is maintained across the bath and provides even temperature and humidity conditions throughout the chamber. The dew point and water temperature are measured to an accuracy of 0.1°C using a dew point analyser.
Sampling Particular care was required when preparing samples for the apparatus. For each species, a small block of unseasoned material was initially prepared with the approximate dimensions: 13 mm in the tangential (T) direction, 10 mm in the radial (R) direction and 40 mm in the longitudinal direction (L). We sliced the block in the longitudinal direction using a diamond

35 Evaluation of super–heated steam vacuum drying viability and development of a predictive drying model for Australian hardwood species – Final report
wire saw (Plate 18) to obtain 1 mm thick samples. Due to collapse occurring in the 1mm thick E. obliqua micro-samples, further 2mm, 1mm and 0.5mm thick E. obliqua samples were prepared to investigate the effect of sample thickness on collapse during testing. As the name suggests, the diamond wire saw features a high tensile wire of 0.3 mm diameter in which diamonds, approximately 60 µm wide are impregnated. The wire unwinds and winds between two bobbins. Cutting is performed under a constant load and the wire is submerged in water to minimise heating and drying of the sample. We soaked the samples in water and stored in a refrigerator to avoid fungal attack. Immediately prior to testing, we inserted samples into a specially designed sample support (Plate 19). The sample support was designed so it does not interfere with the laser beams shrinkage measurements are made at the same material locations, and the sample is sufficiently restrained to avoid flexure while maintaining freedom to shrink.
Sample
Diamond wire
Plate 18. Sample preparation using a diamond wire saw
Sample
G-support
Needle counterweight
V-hook
Needle
Eye hook
Plate 19. Sample support

36 Evaluation of super–heated steam vacuum drying viability and development of a predictive drying model for Australian hardwood species – Final report
The support is made from soldered brass. Samples are hung from a G-shaped support via a 1 mm diameter hole drilled in the upper part. The upper branch of the G-support is curved to create a V shaped hook. The V-shaped hook inhibits sample movement in the direction of the support branch to which the V-hook is connected (sample thickness direction). Rotation around the V-hook (sample width direction) is inhibited by using a needle and attached counterweight. The needle is inserted in a second hole (0.8 mm diameter) drilled in the bottom of the sample. One end of the needle is held by an eye-hook at the bottom part of the G-support. The two holes are both offset from the central width of the sample, so that gravity forces the sample to rotate around the V-hook until the needle leans against the G-support. Due to friction, as a result of the needle counterweight, the sample is also blocked from rotating in the direction of the needle. Even though rotational movement of the sample is blocked in all directions, it is still free to shrink.
Experimental procedure We investigated radial and tangential shrinkage on two 1 mm samples for each species, except for Corymbia citriodora, where three samples were tested due to an unreliable test. An additional, two shrinkage samples per 0.5 mm, 1 mm and 2 mm thickness were investigated for Eucalyptus obliqua, due to collapse shrinkage compromising initial samples. We placed each sample on the support in the centre of the balance, ensuring that the vertical laser passed along the two holes. Drying of the sample before data acquisition was inhibited by regularly adding liquid water to the surfaces using atomised water spray during set-up. For each test, the water bath was initially set to a temperature of 27°C for 10 hours, then ramped to 9°C over 12 hours, held at these conditions for 3 hours, then returned to 27°C over a 6 hr ramp. The final conditions were held for at least 3 hours. The corresponding relative humidity values were 88% and 30% (Figure 11).
Figure 11. Climatic schedule used for shrinkage tests – dew point temperature and relative humidity are shown During each test, we recorded shrinkage, temperature and sample weights at regular intervals. At the end of the experiment, the sample was dried at 103 ± 2°C in accordance with AS/NZS 1080.1 (2001) to determine the current MC of the sample and previous MC evolution during the test. Investigations of sample MC versus external relative humidity were conducted to observe the sorption/desorption characteristics and hysteresis. The desorption phase is more applicable to wood drying. Therefore, the desorption RH and MC data were used to solve the

37 Evaluation of super–heated steam vacuum drying viability and development of a predictive drying model for Australian hardwood species – Final report
sorption isotherm equation (53) for constants c1 and c2. This provided the model with accurate desorption isotherms specific for each species.

38 Evaluation of super–heated steam vacuum drying viability and development of a predictive drying model for Australian hardwood species – Final report
3.5 Drying modelling - Vacuum drying modelling The vacuum drying model was developed and implemented as part of this authors PhD project offered by QUT. At the time of running model simulations, not all vacuum drying trials were completed. For model validation, one vacuum drying trial was chosen per species. We chose the trial that, to date, had produced the best-dried quality outcome in the quickest drying time (most optimised). The vacuum drying trials chosen were the E. obliqua trial MES8, C. citriodora trial SPG9, E. marginata trial JAR10 and E. pilularis trial BBT11. As the anatomical configuration of wood is complex, one must write transport equations at the macroscopic scale. This leads to the definition of empirical laws of migration that can be demonstrated to a large extent by averaging over representative volumes (Perré, 1996). At this level, we observe the porous medium as a fictitious, continuous medium. By using this approach, we can write most fluxes as the product of a coefficient times the driving force, both for the porous medium and the surrounding air. The conservation of liquid, water vapour, air and enthalpy enable a set of equations governing transfer in porous media to be derived (Whitaker, 1977). These equations have subsequently been used to model the softwood drying process (Perré, 1996, Perré and Turner, 1999b), where their ability to describe several different drying configurations has been proven. The most recent application of the model describes the drying of single boards applied to the growth rings of softwood (Perré and Turner, 2008). This model, known as TransPore 2D describes the drying process for both homogeneous and heterogeneous cross sections, where density and transport differences due to the presence of growth rings accounted for. As the species investigated in this study are relatively homogenous, the majority of the transport model equations derive from the homogenous model reference as summarised:
3.5.1 Liquid conservation
)()()( veffgbbggwwwvvwwtωρρρρρρερε ∇⋅∇=+⋅∇+++
∂∂ Dvvv
(41)
3.5.2 Energy conservation
Φ+∇+∇+∇⋅∇=
+++⋅∇+
−++++∂∂
)((
))((
))(( 0
Thh
ghhhh
Phhhhht
effaavveffg
bbbgaavvwww
ggsbbaavvgwww
KD
vvv
ωωρ
ρρρρ
ερρρρερε
(42)
3.5.3 Air conservation
)()()( aeffggaagtωρρρε ∇⋅∇=⋅∇+
∂∂ Dv
(43)
The Generalised Darcy’s Law gives the gas and liquid phase velocities:
ll
lll ϕ
µ∇−=
kKv ,χρϕ ∇−∇=∇ gP lll (44)
Where l = w, g

39 Evaluation of super–heated steam vacuum drying viability and development of a predictive drying model for Australian hardwood species – Final report
The quantities φ in equation (44) represents the phase potentials and χ is the depth scalar. The nomenclature section of this report defines all other symbols. This formulation accounts for the evolution of internal pressure through the air balance (equation (43)) and is thus able to deal with high temperature convective drying, vacuum drying and dielectric drying.
3.5.4 Closure conditions Wood is a highly hygroscopic porous medium; therefore, we must separate bound water from free water as defined by:
).,min( XXXXX fspo
wwbw +≡+=
ρρε
(45)
The volume fractions of the liquid and gaseous phases are defined as: ww Sφε = ,
)1( wg S−= φε , φεε =+ gw , where φ is the porosity. We define the intrinsic phase air density
as aga ρερ = and the gaseous phase is a binary mixture of air and vapour, which we assume to behave like an ideal gas. The saturation variable involved in the relative permeability functions is calculated according to the free water content only:
.maxw
ww X
XS = (46)
As both liquid and gaseous water phases are present during drying of wood, and because of the curvature of the interface that exists between the liquid and gas phases within the pores of the medium, the liquid pressure is less than the gas pressure. The capillary pressure represents the difference:
.cgw PPP −= (47) The values for fibre saturation point (Xfsp) are essential wood properties for the development of an accurate wood drying model and were therefore, measured as part of this study. The methodology for which is detailed in section 3.4 Drying modelling - Measurement of essential wood properties.
3.5.5 Boundary Conditions The boundary conditions for the external drying surfaces are assumed to be of the following form (Turner and Perré, 2004):
−−
=⋅+
+
=
∞=
00 |1
1lnˆxv
vvmxw x
xcMknJ (48)
−−
+−=⋅+
+
=
∞∞=
00 |1
1ln)(ˆxv
vvmvxe x
xcMkhTTqnJ (49)
,| 0 ∞=
=+ PP xg (50)

40 Evaluation of super–heated steam vacuum drying viability and development of a predictive drying model for Australian hardwood species – Final report
Where Jw and Je represent the fluxes of total moisture and total enthalpy at the boundary. The pressure P∞ and temperature T∞ at the external drying surfaces are fixed at the kiln vacuum pressure and operating temperature. As one of the primary variables used for the computations is the average air density, modification of the boundary pressure condition (50) is required to form an appropriate nonlinear equation for this primary variable:
.0)( =+− ∞a
avg M
RTPP ρε (51)
Equation (51) must be resolved, along with the conservation laws, during the nonlinear iterations for every external boundary control volume within the computational domain. Introducing symmetry planes into the model (i.e., a quadrant of a board) reduces the overall computational times. We assume all fluxes of liquid, vapour, air, and heat are zero at the symmetry planes. Initially the board has some prescribed moisture content, with the pressure and temperature being constant throughout the board at the initial kiln pressure and temperature. The values for external pressure and temperature are essential boundary condition parameters for the development of an accurate deterministic wood drying model and were therefore, measured as part of this study. The methodology for which is detailed in section 3.3 Drying modelling - Measurement of kiln conditions and wood drying properties.
3.5.6 Numerical Solution Procedure The numerical procedure used to resolve the drying model has been extensively published, and the reader is referred to the most relevant literature for the finer details (Perré and Turner, 1999a, Perré and Turner, 1999b). In summary, to discretise the conservation laws, we implement the finite volume method on a structured mesh. Triangular meshes were calculated over symmetry plane dimensions using the software application GMSH version 2.4.2. Thereafter, we used an efficient inexact Newton method to resolve in time the complicated and often large nonlinear system that describes the drying process. Flux limiting is used to determine the spatial weighting schemes for all advection/convection terms in the equations in order to reduce numerical dispersion of the drying fronts, and the introduction of the fixed phase ensures that full saturation Sw = 1 is never reached at the surface of the medium. These are important advancements in the computational model that can enhance convergence of the nonlinear iterations and ensure accurate resolution of the drying fronts on relatively coarse meshes and are particularly useful for simulating the vacuum drying process (Turner and Perré, 2004). For this project, we performed drying simulations in the radial-tangential (R-T) plane.
3.5.7 Physical Properties The following physical properties are necessary scalar or tensor input variables for the drying model computations. The expressions and/or values provided have been used to simulate homogenous modelling of softwoods (Turner and Perré, 2004, Perré and Turner, 1999b), and their adaptability to the proposed hardwood model will be tested and modified where necessary. Some of the properties discussed are specific to the wood direction (Plate 20) termed longitudinal (up the stem of the tree parallel to the wood fibres), radial (from the outside of the tree towards the centre) and tangential (perpendicular to the radial direction). A backsawn board has the tangential direction along the wide face of the board and a quartersawn board has the radial direction along the wide face of the board.

41 Evaluation of super–heated steam vacuum drying viability and development of a predictive drying model for Australian hardwood species – Final report
Plate 20. Three principal axes of wood direction with respect to grain direction and growth rings
Porosity (ϕ) Porosity values are essential wood properties for the development of an accurate wood drying model and were therefore, measured as part of this study. Porosity values were determined via image analysis of environmental scanning electron microscope (ESEM) images. The methodology for which is detailed in section 3.4 Drying modelling - Measurement of essential wood properties.
Wood Density (ρ) Density values are essential wood properties for the development of an accurate wood drying model and were therefore, measured as part of this study. The methodology for which is detailed in section 3.4 Drying modelling - Measurement of essential wood properties.
Heat Capacity ( pcρ )
The heat capacity is defined as (Perré and Turner, 2008):
.)418585.41113(p XTc w ++= ρρ (52)
Sorption Isotherm The sorption isotherm is defined as (Perré and Turner, 2008):
)exp(1 221 AcAc
PP
vs
v −−−= , where c1 and c2 are constants and ./ fspb XXA = (53)
The values c1 and c are essential species dependant constant properties for the development of an accurate wood drying model and were therefore, measured as part of this study. The methodology for which is detailed in section 3.4 Drying modelling - Measurement of essential wood properties.
Capillary Pressure (Pc) The capillary pressure is defined as (Perré and Turner, 2008):
)101()(1024.1 61.05 −×+×××= wc STP σ , where 310)185.05.77()( −×−= TTσ (54)
represents the surface tension.
Relative Permeability (kr) The relative liquid permeability is defined respectively in the tangential, radial and longitudinal directions as (Perré and Turner, 2008):

42 Evaluation of super–heated steam vacuum drying viability and development of a predictive drying model for Australian hardwood species – Final report
.)(,
,)(
8
3
wLrl
Trl
Rrl
wTrl
SkkkSk
===
(55)
The relative gas permeability is defined respectively in the tangential, radial and longitudinal directions as:
.))(54(1,
,))(32(1
4
2
wwLrg
Trg
Rrg
wwTrg
SSkkk
SSk
−+==
−+=
(56)
Intrinsic Permeability Intrinsic permeability values are essential wood properties for the development of an accurate wood drying model and were therefore, measured as part of this study. We measured the gas permeabilities for each species as detailed in section 3.4 Drying modelling - Measurement of essential wood properties. The liquid permeability values were given the same values as for the gas permeabilities as pit aspiration does not apply for hardwoods.
Gaseous Diffusion (Deff) The gaseous diffusion is defined respectively in the tangential, radial and longitudinal directions as (Perré and Turner, 2008):
Teff
Leff
Teff
Reff
vTrg
Teff
DDDD
DkD
×=×=
××= −
100,2
,10 3
, where Dv is the mass diffusivity of vapour in the air phase.
(57)
Diffusivity of vapour (Dv) The diffusivity of vapour in gas is defined as (Perré and Turner, 2008, Bird et al., 1960):
75.155
27310013.1102.2
××= − T
PDv
(58)
Bound Water Diffusion (Db) – Theory Initial simulations used theoretical bound liquid diffusivities, detailed by Perré and Turner (2008) and summarized below. In this section, we assume the gradient of bound water is the driving force. This allows two pseudo-diffusivities to be defined (bound water in the cell wall and air in the pores):
+−+−=
∂∂
=
=
15.27343008951601.108183993.12expˆ
,ˆ,ˆ
TXD
XPD
RTMD
DD
bsb
b
vv
vv
bsb
ρ
ρ
(59)
Using homogenisation results, we propose the following correlations:

43 Evaluation of super–heated steam vacuum drying viability and development of a predictive drying model for Australian hardwood species – Final report
( )
v
g
b
sseries
seriesTb
gseriesRb
DD
A
ADAD
ˆˆ
1 with
,*8.1~,6.11(~ 8.1
εε
ε
+=
=+=
(60)
A small percentage of ray cells have to be in parallel to the cell arrangement giving the final form of the radial macroscopic diffusivity as:
Rrayray
Rbray
Rb DDD ~~)1(0 ×+−= εερ (61)
Typical values for rayε and R
rayD~ are 0.05 and 0.1 x vD̂ respectively (Perré and Turner, 2008). To be consistent, the same amount of ray cells is put in series with tracheids in the tangential direction:
Tray
rayTb
ray
Tb
DD
D~~
11
0 εερ+
−=
(62)
Due to the considerable length of wood fibres, the longitudinal macroscopic diffusivity is derived using a parallel model of the form:
vgbsLb DDD ˆˆ
0 εερ += (63)
Thermal Conductivity (λeff) The thermal conductivity is defined using homogenisation in the R-T plane and using a parallel flow model in the longitudinal direction (Perré and Turner, 2008):
( ) ,ˆ2ˆ with ˆ
0.6n with ,ˆ~,54.046.0~
////0
1
0
0
⊥
⊥
×≈+==+=
×+×=
ssssairgL
nnss
nairg
T
parallelseriesR
λλλελελλελελ
λλλ
(64)
where .ˆ and
ˆ
1airgssparallel
air
g
s
sseries λελελ
λε
λε
λ +=+
= ⊥
⊥
Properties with a subscript of 0 denote thermal conductivities at a moisture content equal to zero. Constant values airλ = 0.023 W m-1 K-1 and ⊥sλ̂ = 0.5 W m-1 K-1. The effect of ray cells are into account such that:

44 Evaluation of super–heated steam vacuum drying viability and development of a predictive drying model for Australian hardwood species – Final report
( ) 0.6.n with
~~1
1,~~1
0
0
//00
=+
−=
×+−=
⊥ray
rayT
ray
T
rayrayR
rayR
λ
ε
λ
ελ
λελελ
(65)
⊥rayλ and //rayλ are evaluated using equations (64) respectively with a density of 500 kg m-3.
For any value of moisture content, the final expression for conductivity read:
( ) ( )( ) ( )( )( ) ( )( ) ( )( )( ) ( )( ) ( )( ) ,1,
0.6n with ,ˆ1,
,ˆ1,
1
//0
1
0
1
0
nnssairw
nLw
L
nnss
nairw
nRw
R
nnss
nairw
nTw
T
SSX
SSX
SSX
λεφλλρλ
λεφλλρλ
λεφλλρλ
++−=
=++−=
++−=
⊥
⊥
(66)
where n =0.6 for the three expressions.
Heat transfer coefficient (hh) The heat transfer coefficient is computed from classic boundary layer theory and is defined as (Bird et al., 1960):
,Pr023.08.0
3/1
=
RTXPv
Lh
g
gah µ
λ (67)
where the humid air viscosity is defined as (Bird et al., 1960):
,vvaa
vvvaaag MPMP
MPMP+
+=
µµµ
(68)
the dry air viscosity is (Bird et al., 1960):
,10 TAAa +=µ where ,102.41059.0
81
50
−
−
×=×=
AA
(69)
the water vapour viscosity is (Perré and Turner, 2008):
,2210 TATAAv ++=µ where ,
10272.810145.410189.3
132
81
60
−
−
−
×−=×=×−=
AA
A
(70)
and the Prandtl number is defined as:
.Prk
cpµ= (71)

45 Evaluation of super–heated steam vacuum drying viability and development of a predictive drying model for Australian hardwood species – Final report
Mass transfer coefficient (hm) The mass transfer coefficient is computed from classic boundary layer theory and is defined as (Bird et al., 1960):
.p
hm c
hhρ
= (72)
46 Evaluation of super–heated steam vacuum drying viability and development of a predictive drying model for Australian hardwood species – Final report
4 Results
4.1 Applied drying – Experimental drying trials The results of the vacuum and conventional drying trials are presented in this section. The results of each species are reported separately.
4.1.1 Corymbia citriodora – spotted gum
Drying schedules The vacuum kiln used for the study incorporates a standard software package that includes a number of pre-set schedules for various species (predominantly American and European species) of varying thickness. Only two pre-set schedules pertaining to native Australian eucalypts exist (E. regnans and E. globulus). The drying properties of these ash type species are very different from those for C. citriodora. For this reason, we judged existing vacuum drying schedules for Australian species unsuitable. The schedules used for each trial are shown (Table 4) including for each MC change point, the dry bulb temperature (DBT), wet bulb depression (WBD) and equilibrium moisture content (EMC). The schedule chosen for vacuum drying trial SPG1 was the same schedule reported by Redman (2006) to have successfully vacuum dried native forest Corymbia citriodora (spotted gum) during commissioning of the vacuum kiln. This schedule was a preset schedule provided for Hymenaea courbaril (courbaril) and we chose this on the understanding (supported by Simpson and Verill, 1997) that in general; timbers of similar densities often have similar drying characteristics. The average dried density (12% MC) of mature H. courbaril is 910 kg/m3 (Lincoln 1991), which is similar to 1010 kg/m3 reported for mature C. citriodora (http://www.dpi.qld.gov.au, 2008). Although presented as a conventional stepwise schedule, the dry and wet bulb temperatures were actually ramped between MC change points. We performed a 48-hour equalisation phase at the end of drying at an EMC of 12%. For the second C. citriodora vacuum drying trial (SPG2), we repeated the schedule used for the SPG1 vacuum drying trial as, although we achieved acceptable dried quality results, the drying rate for the first trial was compromised (slowed) due to a kiln vacuum leak. Therefore, it was deemed necessary to repeat the trial. Due to favourable dried quality resulting from the first two trials, we increased the DBT throughout for the SPG3 trial with the intention of reducing the drying time. As is generally the case when drying Australian hardwoods, the material was dried 1-2% below the target average MC and then re-wet during the equalisation phase to reach the target MC to minimise MC gradients and associated residual drying stresses. The fact that re-wetting timber (sorption) leads to lower values of MC at the same EMC than drying timber (desorption) is known as sorption hysteresis (Siau, 1984). For this reason, we increased the equalisation EMC for the SPG3 trial from 12% to 13%, to bring the final average MC closer to the target 11% and reduce unacceptable stress levels encountered in the first two trials. For the SPG4 vacuum trial we chose the same schedule used for the SPG3 trial except the equalisation time was increased from 48 to 72 hours. We made this change in an attempt to alleviate drying stress, which was not within acceptable limits for the SPG3 vacuum trial.

47 Evaluation of super–heated steam vacuum drying viability and development of a predictive drying model for Australian hardwood species – Final report
Dale and Meyers Sawmill (Maryborough, Queensland) supplied material for conventional trials SPG1, SPG3 and SPG4 and Burnett Sawmill (Bundaberg, Queensland supplied material for conventional trial SPG2. Commercial confidentiality prevents details of the conventional drying schedule used by either sawmill from being discussed. Table 4. Vacuum drying schedules – Corymbia citriodora
Trial
MC change points (%)
DBT (°C) WBD (°C) EMC (%) DBT (°C) WBD (°C) EMC (%) DBT (°C)WBD (°C)
EMC (%)
Heat-up 60 2.4 17.0 64 1.8 18.0 64 1.8 18.0Green - 70 60 5.0 12.0 64 5.0 12.0 64 5.0 12.0
70 - 60 61 5.4 12.0 65 5.4 12.0 65 5.4 12.060 - 50 63 6.0 11.0 66 5.8 11.0 66 5.8 11.050 - 40 64 6.2 11.0 66 6.2 11.0 66 6.2 11.040 - 30 65 7.1 10.0 67 7.1 10.0 67 7.1 10.030 - 25 67 9.1 9.1 69 8.9 9.1 69 8.9 9.125 - 20 69 12.0 7.4 71 12.0 7.4 71 12.0 7.420 - 15 72 18.0 5.4 75 18.0 5.5 75 18.0 5.5
15 - final 77 13.0 6.9 80 13.0 6.9 80 13.0 6.9Equalise (48 hrs) 70 4.8 12.0 80 4.7 13.0 80 4.5 13.5 (72 hrs)
SPG4SPG1 and SPG2 SPG3
Moisture content Initial MC results are shown in Table 5. For trial SPG1, initial MC populations are normally distributed, but are not normally distributed for the other trials, likely because of high MC outliers (Figure 12). Multiple pairwise comparisons produced no significant differences between sample populations of trials SPG1 and SPG4. All other pairwise comparison combinations produced significant differences between sample populations. This is evident by observation, where the initial cross-sectional MC average of trials SPG2 and SPG3 was approximately 3% lower for each successive trial compared with trials SPG1 and SPG4.
SPG4SPG3SPG2SPG1
20
25
30
35
40
45
50
55
60
Initi
al M
C (%
)
Figure 12. Scattergram of initial MC – C. citriodora
Table 5. Initial MC results – C. citriodora
Trial SPG1 SPG2 SPG3 SPG4Average 37.9 34.8 32.3 37.3Maximum 46.4 51.5 50.6 54.8Minimum 28.2 22.4 23.1 27.3Standard deviation 3.8 5.5 4.8 5.0
Initial MC (%)
The final cross-sectional MC results are presented in Figure 13 and Table 6. Except for trial SPG4, there are significant differences between the final cross-sectional MC means of end-matched conventional and vacuum trials. In accordance with AS/NZS: 4787 each vacuum trial, and SPG2 conventional trial achieved acceptable grade quality B results for final cross-sectional MC (target = 11%). Both conventional SPG1 and SPG3 trials achieved unacceptable grade quality C due to,
• under-drying in the case of the SPG1 trial (average 13.6%) and • over-drying in the case of the SPG3 trial (average 7.9%).
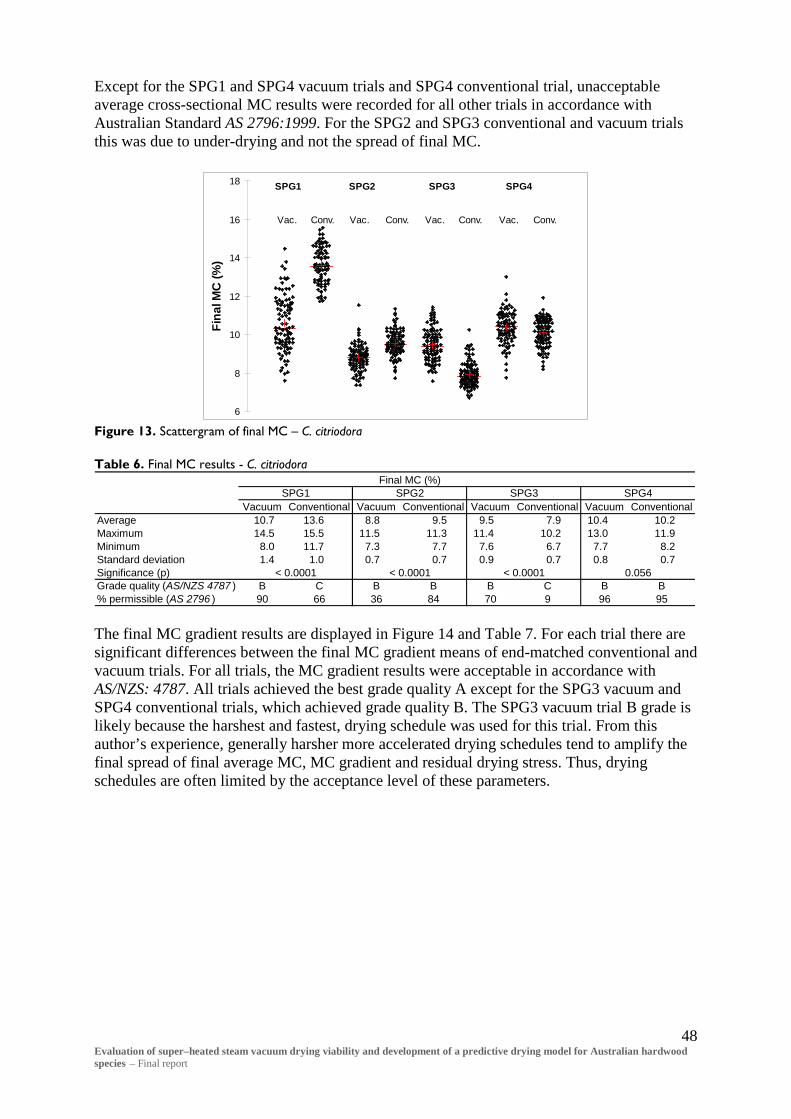
48 Evaluation of super–heated steam vacuum drying viability and development of a predictive drying model for Australian hardwood species – Final report
Except for the SPG1 and SPG4 vacuum trials and SPG4 conventional trial, unacceptable average cross-sectional MC results were recorded for all other trials in accordance with Australian Standard AS 2796:1999. For the SPG2 and SPG3 conventional and vacuum trials this was due to under-drying and not the spread of final MC.
SPG1 SPG2 SPG3 SPG4
Vac. Conv. Vac. Conv. Vac. Conv. Vac. Conv.
6
8
10
12
14
16
18
Fina
l MC
(%)
Figure 13. Scattergram of final MC – C. citriodora Table 6. Final MC results - C. citriodora
Vacuum Conventional Vacuum Conventional Vacuum Conventional Vacuum ConventionalAverage 10.7 13.6 8.8 9.5 9.5 7.9 10.4 10.2Maximum 14.5 15.5 11.5 11.3 11.4 10.2 13.0 11.9Minimum 8.0 11.7 7.3 7.7 7.6 6.7 7.7 8.2Standard deviation 1.4 1.0 0.7 0.7 0.9 0.7 0.8 0.7Significance (p)Grade quality (AS/NZS 4787 ) B C B B B C B B% permissible (AS 2796 ) 90 66 36 84 70 9 96 95
SPG4
0.056< 0.0001 < 0.0001 < 0.0001
SPG3Final MC (%)
SPG1 SPG2
The final MC gradient results are displayed in Figure 14 and Table 7. For each trial there are significant differences between the final MC gradient means of end-matched conventional and vacuum trials. For all trials, the MC gradient results were acceptable in accordance with AS/NZS: 4787. All trials achieved the best grade quality A except for the SPG3 vacuum and SPG4 conventional trials, which achieved grade quality B. The SPG3 vacuum trial B grade is likely because the harshest and fastest, drying schedule was used for this trial. From this author’s experience, generally harsher more accelerated drying schedules tend to amplify the final spread of final average MC, MC gradient and residual drying stress. Thus, drying schedules are often limited by the acceptance level of these parameters.

49 Evaluation of super–heated steam vacuum drying viability and development of a predictive drying model for Australian hardwood species – Final report
SPG1 SPG2 SPG3 SPG4
Vac. Conv. Vac. Conv. Vac. Conv. Vac. Conv.
-2
-1
0
1
2
3
4
5
MC
gra
dien
t (%
)
Figure 14. Scattergram of MC gradient – C. citriodora Table 7. MC gradient results – C. citriodora
Vacuum Conventional Vacuum Conventional Vacuum Conventional Vacuum Conventional
Average 1.0 1.3 0.7 1.0 1.4 0.6 0.7 1.5Maximum 2.1 2.2 3.6 2.3 3.5 3.0 2.0 -0.6Minimum -0.8 0.0 -2.2 -0.1 -0.7 -1.0 -1.0 3.0Standard deviation 0.6 0.5 0.8 0.5 0.9 0.7 0.7 0.8Significance (p)Grade quality (AS/NZS 4787 ) A A A A B A A B
< 0.0001 0.0002 < 0.0001
SPG4
< 0.0001
Final MC gradient (%)SPG1 SPG3SPG2
Basic density The basic density results are displayed in Figure 15 and Table 8. Multiple pairwise comparisons produced no significant differences between basic density populations of trials SPG1 and SPG2, and SPG2 and SPG3. All other pairwise comparison combinations produced significant differences between sample populations. The average basic density of trial SPG4 is significantly lower than the other trials. The average basic density recorded for each trial is similar to the value recorded (http://www.fwpa.com.au, 2003) of 865 kg/m3 for mature native forest C. citriodora.
SPG4SPG3SPG2SPG1
700
750
800
850
900
950
1000
1050
Bas
ic d
ensi
ty (k
g/m
3 )
Figure 15. Scattergram of basic density – C. citriodora
Table 8. Basic density results – C. citriodora
Trial SPG1 SPG2 SPG3 SPG4Average 887.4 891.7 904.8 852.2Maximum 963.4 1002.7 981.2 1036.5Minimum 805.0 780.1 768.2 735.7Standard deviation 34.4 44.3 42.2 53.3
Basic density (kg/m3)

50 Evaluation of super–heated steam vacuum drying viability and development of a predictive drying model for Australian hardwood species – Final report
Distortion We measured distortion on undressed boards before and after drying. For all trials, cupping was not included in the total percentage of boards within acceptable limits as all cupping was removed after dressing. Significant differences do not exist between paired conventional and vacuum population means of bow, twist and cup for trial SPG1, bow for trial SPG2, cup for trial SPG3, and bow and cup for trial SPG4 (Table 9). All other comparisons exhibited significant differences. Distortion results were acceptable (total > 90%) after drying for all trials except for the SPG3 and SPG4 conventional trials. Twist was the predominant type of distortion for boards failing to meet the standard (Table 10). Table 9. Distortion results after drying – C. citriodora
TrialSpring Bow Twist Cup Spring Bow Twist Cup
Average 3.0 3.6 1.8 0.0 2.4 3.5 1.7 0.0Maximum 10.0 13.0 9.0 0.0 12.0 10.0 8.0 0.0Minimum 0.0 1.0 0.0 0.0 0.0 0.0 0.0 0.0Standard deviation 1.9 2.2 1.4 0.0 2.2 2.7 1.8 0.0Significance (p) 0.013 0.640 0.747 1.000Average 1.9 5.4 2.0 0.0 2.5 5.4 3.3 0.2Maximum 8.0 15.0 8.0 0.0 10.0 16.0 11.0 2.0Minimum 0.0 0.0 0.0 0.0 0.0 0.0 0.0 0.0Standard deviation 1.9 2.6 2.0 0.0 2.3 3.3 2.5 0.5Significance (p) 0.024 0.961 0.001 < 0.0001Average 2.2 2.2 1.5 0.8 4.3 5.0 5.1 0.8Maximum 12.0 10.0 8.0 2.0 21.0 21.0 35.0 6.0Minimum 0.0 0.0 0.0 0.0 0.0 0.0 0.0 0.0Standard deviation 1.8 1.9 1.4 0.7 3.5 3.9 5.4 0.9Significance (p) < 0.0001 < 0.0001 < 0.0001 0.878Average 2.7 5.2 1.3 0.4 3.3 4.8 2.8 0.3Maximum 11.0 16.0 11.0 3.0 12.0 17.0 15.0 7.0Minimum 0.0 0.0 0.0 0.0 0.0 0.0 0.0 0.0Standard deviation 2.6 2.8 2.0 0.7 2.7 3.9 3.2 1.0Significance (p) 0.049 0.146 < 0.0001 0.171
SPG4
SPG2
SPG3
SPG1
Distortion (mm)Vacuum Conventional
Table 10. Distortion grade results – C. citriodora
TrialSpring Bow Twist Cup Total Spring Bow Twist Cup Total
Before drying 100 100 100 100 100 NA NA NA NA NAAfter drying 100 99 99 100 99 100 100 98 100 98Before drying 100 99 95 100 94 NA NA NA NA NAAfter drying 100 98 96 100 94 100 97 97 97 93Before drying 100 99 100 100 99 NA NA NA NA NAAfter drying 100 100 98 90 98 99 98 87 81 86Before drying 100 95 100 100 95 NA NA NA NA NAAfter drying 100 98 97 91 96 99 93 84 97 83
SPG4
Distortion - % In gradeVacuum Conventional
SPG1
SPG2
SPG3
Surface and internal checking Significant differences do not exist between the surface checking populations of the SPG1 and SPG3 conventional and vacuum trials (Table 11). For every vacuum drying trial and the SPG3 conventional trial, an acceptable (> 90%) number of boards achieved select grade for surface checking in accordance with AS 2796:1999 (Table 12). For the SPG2 conventional trial only 8% of boards achieved this grade. This result may be due to this trial being pre-air dried in an uncontrolled environment prior to final kiln drying. The other conventional trials were kiln dried from the green condition. In most cases, we achieved better surface checking grade recovery through vacuum drying than conventional drying.

51 Evaluation of super–heated steam vacuum drying viability and development of a predictive drying model for Australian hardwood species – Final report
All of the boards from each trial were free of internal checking. Table 11. Surface checking results – C. citriodora
Vacuum Conventional Vacuum Conventional Vacuum Conventional Vacuum ConventionalAverage 10.9 14.1 2.9 973.9 44.5 47.6 34.8 60.4Maximum 1055.0 800.0 240.0 1980.0 1850.0 1370.0 839.0 1011.0Minimum 0.0 0.0 0.0 0.0 0.0 0.0 0.0 0.0Standard deviation 85.0 72.2 24.0 646.7 182.7 160.4 126.9 185.8Significance (p) 0.571< 0.0001
SPG4Surface checking (mm)
0.019
SPG1 SPG3SPG2
0.0560 Table 12. Surface checking grade results – C. citriodora
Grade Vacuum ConventionalVacuum ConventionalVacuum ConventionalVacuum ConventionalSelect (%) 99 89 100 8 92 93 93 87Medium feature (%) 0 10 0 0 0 0 0 0High feature (%) 1 1 0 92 8 7 7 13Surface check free boards (%) 93 84 96 3 85 83 86 72Internal check free boards (%) 100 100 100 100 100 100 100 100
SPG4SPG3SPG2SPG1
End splits Significant differences exist between vacuum and conventional drying end split populations for trials SPG3 and SPG4 Table 13. All trials achieved acceptable grade quality results for end-split. In all cases significantly less end split was recorded for the vacuum drying trials than the conventional trials (no end split for vacuum trials SPG1 and SPG2). It may be due to extra internal overpressure caused by the vacuum itself, more end drying is present during vacuum drying compared to conventional methods. This theory is reinforced by the test board thermocouple results presented in section 4.3.4 Board temperature. The thermocouple results show noticeably lower temperatures at the board ends than the centres indicating a higher degree of free water at the ends of the boards. This would certainly reduce the level of shrinkage variation at the board ends and hence reduce the incidence and severity of end-splitting. Table 13. End split results – C. citriodora
Vacuum Conventional Vacuum Conventional Vacuum Conventional Vacuum ConventionalAverage 0.0 2.0 0.0 18.8 1.0 2.2 8.2 7.8Maximum 0.0 200.0 0.0 170.0 41.0 68.0 904.0 258.0Minimum 0.0 0.0 0.0 0.0 0.0 0.0 0.0 0.0Standard deviation 0.0 16.4 0.0 33.2 5.1 8.7 66.5 30.6Significance (p)Grade quality (AS/NZS 4787 ) A A A A A B A B
SPG4
0.014< 0.0001 < 0.0001 0.043
SPG2End splits (mm)
SPG1 SPG3
Drying stress Significant differences exist between the drying stress population means of all conventional and vacuum end-matched trials (Table 14). Both conventional and vacuum SPG1 trials and the SPG2 and SPG4 vacuum trials achieved the acceptable grade quality B for average drying stress. All other trials achieved the unacceptable grade quality C. It is not possible to determine if the harsher drying schedule used for the SPG3 vacuum trial contributed to the unacceptable grade quality as we obtained similar results for the corresponding conventional trial. However, we used the same schedule for the SPG4 trial but with a longer equalisation period (72 hrs instead of 48 hrs). This resulted in improved, and acceptable drying stress results for the SPG4 vacuum trial. Improvements due to schedule manipulation are visually evident in Figure 16.

52 Evaluation of super–heated steam vacuum drying viability and development of a predictive drying model for Australian hardwood species – Final report
SPG1 SPG2 SPG3 SPG4Conv.Vac.Conv.Vac.Conv.Vac.Conv.Vac.
0
0.5
1
1.5
2
2.5
3
Dst
ress
Figure 16. Scattergram of drying stress – C. citriodora Table 14. Drying stress results – C. citriodora
Vacuum Conventional Vacuum Conventional Vacuum Conventional Vacuum ConventionalAverage 0.9 0.6 0.7 1.4 1.5 1.6 0.5 1.3Maximum 1.4 1.0 1.7 2.2 2.7 2.2 1.9 2.4Minimum 0.4 0.1 0.0 0.6 0.2 0.3 0.0 0.0Standard deviation 0.2 0.2 0.3 0.3 0.4 0.3 0.4 0.4Significance (p)Grade quality (AS/NZS 4787 ) B B B C C C B C
SPG1
< 0.0001 < 0.0001
SPG2
< 0.0001
SPG3 SPG4
< 0.0001
Drying stress (Dstress)
Collapse No signs of collapse were present for any boards from any trial.
Sawn orientation The majority of boards were a combination of back sawn and transitionally sawn Table 15. Backsawing is the desired cutting pattern for this species as it usually provides a higher green off-saw (GOS) recovery than quartersawing, and better aesthetics because of growth ring orientation. Table 15. Sawn orientation results – C. citriodora
SPG1 SPG2 SPG3 SPG4Quartersawn 9 2 3 2Backsawn 41 71 73 78Transitional 50 27 24 20
Sawn orientation (%)
Gross shrinkage There is no difference between the width and thickness gross shrinkage means for the SPG1 and SPG3 vacuum trials but do exist for the SPG2 and SPG4 vacuum trials (Table 16). This suggests that in terms of shrinkage in the radial and a tangential direction; C. citriodora has less transverse anisotropy compared with the other species reported. The results are in agreement with published tangential (6.1%) and radial (4.3%) shrinkages (http://www.dpi.qld.gov.au, 2008).

53 Evaluation of super–heated steam vacuum drying viability and development of a predictive drying model for Australian hardwood species – Final report
SPG1 SPG2 SPG3 SPG4ThicknessWidthThicknessWidthThicknessWidthThicknessWidth
0
2
4
6
8
10
12
14
Shrin
kage
(%)
Figure 17. Scattergram of gross shrinkage – C. citriodora Table 16. Gross shrinkage results – C. citriodora
Width Thickness Width Thickness Width Thickness Width ThicknessAverage 6.4 6.1 6.2 4.7 6.6 6.3 5.8 5.2Maximum 8.4 10.4 9.9 9.2 9.3 12.1 8.4 9.5Minimum 4.1 2.3 0.9 0.7 4.4 2.2 3.6 1.2Significance (p)Standard deviation 1.0 1.8 1.4 1.9 1.1 1.7 0.9 1.9
SPG4
0.0020
Gross shrinkage (mm)SPG3SPG1 SPG2
0.15500.1670 < 0.0001
Drying times and vacuum kiln output For the conventional SPG1, SPG3 and SPG4 trials the total kiln drying time from the green condition was 21 days. The total drying times, including equalisation for the vacuum trials SPG1, SPG2, SPG3 and SPG4 were 14.0, 17.2, 12.0 and 13.8 days respectively. The drying rate for the first six days of the SPG1 vacuum trial was potentially slowed due to a kiln vacuum leak. This is evident by observing the pressure and core MC curves (Figure 18). By inspection of the slope of the MC core curve after the leak was repaired (day 6), we estimate that the drying time for SPG1 vacuum trial may have been shortened by at least 2 days using the same schedule. This did not seem to hold true for the SPG2 vacuum trial using the same schedule (Figure 19), however the final average cross-sectional MC for vacuum trial SPG2 was lower (8.8%) compared with that of vacuum trial SPG1 (10.7%). Average core MC resulting from the resistance probes shows a period of 2.5 days was required to reduce the SPG2 MC from 10.7% to 8.8% during the final stages of drying. Thus, the SPG2 vacuum drying time is comparable to trial SPG1 (14 days). The SPG3 vacuum drying schedule was the harshest in terms of DBT and subsequently had the fastest drying rate, drying 57% faster than the end-matched conventional boards from the green condition (Figure 20). We used the same schedule for the SPG4 trial except the equalisation time was extended by 24 hours (Figure 21). This trial produced the best dried quality than any other vacuum or conventional trial.

54 Evaluation of super–heated steam vacuum drying viability and development of a predictive drying model for Australian hardwood species – Final report
0
10
20
30
40
50
60
70
80
90
0 5 10 15 20Time (days)
MC
(%),
Tem
pera
ture
(°C)
0
100
200
300
400
500
600
700
800
900
1000
Pres
sure
(mba
r)MC core MC gradient EMC Temperature Pressure
Figure 18. Vacuum drying chart – SPG1 trial
0
10
20
30
40
50
60
70
80
90
0 5 10 15 20
Time (days)
MC
(%),
Tem
pera
ture
(°C)
0
100
200
300
400
500
600
700
800
900
1000
Pres
sure
(mba
r)
MC core MC gradient EMC Temperature Pressure
Figure 19. Vacuum drying chart – SPG2 trial
0
10
20
30
40
50
60
70
80
90
0 5 10 15 20
Time (days)
MC
(%),
Tem
pera
ture
(°C)
0
100
200
300
400
500
600
700
800
900
1000
Pres
sure
(mba
r)
MC core MC gradient EMC Temperature Pressure
Figure 20. Vacuum drying chart – SPG3 trial
0
10
20
30
40
50
60
70
80
90
0 5 10 15 20
Time (days)
MC
(%),
Tem
pera
ture
(°C)
0
100
200
300
400
500
600
700
800
900
1000
Pres
sure
(mba
r)
MC core MC gradient EMC Temperature Pressure
Figure 21. Vacuum drying chart – SPG4 trial
55 Evaluation of super–heated steam vacuum drying viability and development of a predictive drying model for Australian hardwood species – Final report
Summary – C. citriodora A summary of the results for the C. citriodora trials is provided in Table 17, where unacceptable results are highlighted. The total drying time for the SPG1 vacuum drying trial was 14 days, 66% of the conventional kiln drying time from the green condition (21 days). The average final cross–sectional MC, MC gradient, drying stress, distortion, collapse, surface check, and end split results were all within permissible grade limits for the SPG1 vacuum trial. Similar results for the SPG1 conventional trial were obtained, with the exception of the final cross–sectional MC variation. The unacceptable final cross–sectional MC results for the SPG1 conventional trial were due to under–drying. Due to a fan failure during the SPG1 vacuum drying trial, we repeated the same vacuum drying schedule for the SPG2 vacuum drying trial. The total drying time for the SPG2 vacuum drying trial was 17.2 days (82% of the SPG1 conventional drying from green trial) and was longer than the previous trial due to over–drying. The total SPG2 conventional air-drying time was 144 days. Over–drying resulted in both vacuum and conventionally dried SPG2 boards achieving unacceptable final cross-sectional MC limits in accordance with AS 2796:1999; however the acceptable grade quality B was achieved for both SPG2 runs in accordance with the more recent AS/NZS 4787:2001. This seems to highlight a discrepancy between the standards. All other wood and dried quality properties were within permissible limits for the SPG2 vacuum drying trial, however only 8% of SPG2 conventionally dried boards achieved select grade for surface checking and unacceptable grade quality resulted for drying stress. Due to favourable dried quality resulting from the first two vacuum trials, we increased the DBT throughout the schedule for the SPG3 vacuum trial, with the aim of reducing the drying time. Also, the final equalisation EMC was increased to bring the final MC closer to the target (11%) and reduce drying stresses. The total drying time for the SPG3 vacuum trial was 12 days, 57% of the conventional kiln drying time from the green condition. Dried quality results for the SPG3 vacuum trial were all acceptable except for drying stress. However, the end-matched conventionally dried boards also achieved unacceptable drying stress quality results, suggesting this batch of C. citriodora was particularly prone to this form of drying defect. Additionally, under-drying resulted in unacceptable final cross-sectional MC grade quality for the conventional SPG3 trial. For the SPG4 vacuum trial, we chose the same schedule used for the SPG3 trial except we increased the equalisation time from 48 to 72 hours in an attempt to alleviate unacceptable drying stress recorded in the previous two trials. The total drying time for this trial was 13.6 days, 66% of the conventional drying time. For the vacuum trial all grade quality results were within acceptable limits. For the end-matched conventionally dried boards unacceptable twist and surface checking were recorded. Overall, the results show vacuum drying C.citriodora was significantly faster, producing better dried quality, than for conventional kiln drying. We recommend using the SPG4 vacuum drying schedule for this species based on the dried quality outcomes.

56 Evaluation of super–heated steam vacuum drying viability and development of a predictive drying model for Australian hardwood species – Final report
Table 17. C. citriodora results summary
Species Trial ID.
Drying method
Days drying [% of conventional kiln drying time ]
Initial basic density (kg/m3)
[stdev.]Initial MC
(%) [stdev.]
Final MC (%) average [stdev.]
{grade}*
Final MC % select
grade (%)**
MC gradient (%) [stdev.]
{grade}*
Drying stress grade quality
[stdev.] {grade}*
Distortion % in
grade** [major type]
Collapse (%
affected)
Surface check % select** [%check
free]
Internal check %
check free End split grade*
C. citriodora 1 (SPG1)vacuum 14.0 [66] 10.7 [1.4] {B} 90 1.0 [0.6] {A} 0.9 [0.2] {B} 99 [twist] 0 99 [93] 100 Aconventional (kiln) 21 13.6 [1.0] {C} 66 1.3 [0.5] {A} 0.6 [0.2] {B} 98 [twist] 0 89 [84] 100 Asignificance (p) <0.0001 <0.0001 <0.0001 0.56 0.0635 (SPG2)vacuum 17.2 [82] 8.8 [0.7] {B} 36 0.7 [0.8] {A} 0.7 [0.3] {B} 94 [twist] 0 100 [96] 100 Aconventional (air) 159 9.5 [0.7] {B} 84 1.0 [0.5] {A} 1.4 [0.3] {C} 93 [twist] 0 8 [3] 100 Asignificance (p) <0.0001 <0.0001 <0.0001 <0.0001 <0.00019 (SPG3)vacuum 12.0 [57] 9.5 [0.9] {B} 70 1.4 [0.9] {B} 1.5 [0.4] {C} 98 [twist] 0 92 [85] 100 Aconventional (kiln) 21 7.9 [0.7] {C} 9 0.6 [0.7] {A} 1.6 [0.3] {C} 86 [twist] 0 93 [83] 100} Bsignificance (p) <0.0001 <0.0001 <0.0001 0.571 0.05313 (SPG4)vacuum 13.8 [66] 10.2 [0.8] {B} 96 0.7 [0.7] {B} 0.5 [0.4] {B} 96 [twist] 0 93 [86] 100 Aconventional (kiln) 21 10.2 [0.7] {B} 95 -1.5 [0.8] {B} 1.3 [0.4] {C} 83 [twist] 0 87 [72] 100 Bsignificance (p) 0.056 <0.0001 <0.0001 0.019 0.014* AS/NZS 4787:2001 Timber-Assessment of drying quality.
** AS 2796: 1999 Hardwood-Sawn and milled products.
852.2 [53.3] 37.3 [5.0]
37.9 [3.8]
891.7 [44.3] 34.8 [5.5]
904.8 [42.2] 32.3 [4.8]
887.4 [34.4]

57 Evaluation of super–heated steam vacuum drying viability and development of a predictive drying model for Australian hardwood species – Final report
4.1.2 Eucalyptus marginata - jarrah
Drying schedules The vacuum kiln used for the study was supplied with a standard software package that includes a number of pre-set schedules for various species (predominantly American and European species) of varying thickness. Only two pre-set schedules pertaining to native Australian eucalypts exist (Eucalyptus regnans and Eucalyptus globulus). The drying properties of these ‘ash’ type species are very different from those for E. marginata. For this reason, we judged existing vacuum drying schedules for Australian species unsuitable. The schedules used for each trial are shown (Table 18) including for each MC change point, the dry bulb temperature (DBT), wet bulb depression (WBD) and equilibrium moisture content (EMC). The initial schedule chosen for vacuum drying trial JAR1 was the preset schedule provided for Quercus alba (white oak) and was chosen on the understanding (supported by Simpson and Verill, 1997) that in general, timbers of similar densities often have similar drying characteristics. The average dried density (12% MC) of mature Q. alba is 760 kg/m3 (Lincoln 1991), which is similar to 820 kg/m3 reported for mature E. marginata (http://www.dpi.qld.gov.au, 2008). Although presented as a conventional stepwise schedule, the dry and wet bulb temperatures were actually ramped between MC change points. A 48 hour equalisation phase was performed at the end of drying at an EMC of 11%. After approximately 11.5 days of drying, the average MC of the test boards had only fallen to 43% and we decided that the drying rate had become too slow. We changed the schedule to the values shown in brackets (Table 18) in association with Brunner-Hildebrand, the kiln manufacturer. We developed the JAR2 vacuum drying schedule to reduce the unacceptable amount of surface checking resulting from the JAR1 vacuum trial. Changes to the schedule include higher EMCs from green to 50% MC, to slow down drying during the early surface check prone drying stage, and lower dry-bulb temperature thereafter and a higher final equilibrium MC (12% compared with 11%). Similarly for the JAR3 vacuum trial the EMC was further increased during the early stages of drying up to 40% MC due to undesirable checking results from the JAR2 trial. Lower DBTs during the latter stages of drying and we employed a further increased equalisation EMC (13%) to reduce MC gradients and associated drying stresses after drying. For the JAR4 vacuum trial we chose the same schedule used for the JAR3 trial except the equalisation time was increased from 48 to 72 hours. We made this change in an attempt to alleviate drying stress, which was not within acceptable limits for the JAR3 vacuum trial. As is generally the case when drying Australian hardwoods, the material was dried 1-2% below the target average MC and then re-wet during the equalisation phase to reach the target MC to minimise MC gradients and associated residual drying stresses. The fact that re-wetting timber (sorption) leads to lower values of MC at the same EMC than drying timber (desorption) is known as sorption hysteresis (Siau, 1984). For this reason, we increased the equalisation EMC for the JAR2 and JAR3 trials by 1% MC between subsequent trials to bring the final average MC closer to the target 11% and reduce unacceptable stress levels encountered in the first two trials. Gunns Timber (Manjimup, Western Australia) supplied material for all four trials. Commercial confidentiality prevents us from discussing details of their conventional drying schedules.

58 Evaluation of super–heated steam vacuum drying viability and development of a predictive drying model for Australian hardwood species – Final report
Table 18. Vacuum drying schedules - Eucalyptus marginata
Trial
MC change points (%)
DBT (°C) WBD (°C) EMC (%) DBT (°C) WBD (°C) EMC (%) DBT (°C) WBD (°C) EMC (%) DBT (°C) WBD (°C) EMC (%)
Heat-up 44 2.0 18.0 44 2.1 18.0 44 2.0 18.0 44 2.0 18.0Green - 70 44 3.0 16.0 44 2.8 16.0 44 3.0 16.0 44 3.0 16.0
70 - 60 44 3.5 15.0 44 2.8 16.0 44 3.0 16.0 44 3.0 16.060 - 50 45 4.0 14.0 45 3.6 14.5 45 3.5 14.5 45 3.5 14.550 - 40 45 (54) 4.8 13.0 48 4.8 13.0 45 4.2 13.5 45 4.2 13.540 - 30 45 (59) 5.4 12.0 53 5.6 12.0 45 5.4 12.0 45 5.4 12.030 - 25 48 (64) 7.7 (6.5) 10 (11.0) 58 7.1 10.5 48 7.7 10.0 48 7.7 10.025 - 20 53 (69) 9.4 (9.0) 9.0 63 9.3 9.0 53 9.4 9.0 53 9.4 9.020 - 15 60 (73) 14 (13.0) 6.7 (7.0) 67 13.0 6.9 60 14.0 6.7 60 14.0 6.7
15 - final 67 (76) 13.8 (14.0) 6.9 70 13.0 6.9 67 13.8 6.9 67 13.8 6.9Equalise (48 hrs) 70 4.8 11.0 70 4.8 12.0 70 4.0 13.0 70 4.0 13 (72 hrs)
JAR4JAR2 JAR3JAR1
Moisture content The initial MC results are shown (Table 19). For each trial, initial MC populations were not normally distributed, likely because of high MC outliers (Figure 22). Multiple pairwise comparisons produced no significant differences between sample populations of any trial.
JAR1 JAR2 JAR3 JAR4
40
50
60
70
80
90
100
110
120
Initi
al M
C(%
)
Figure 22. Scattergram of initial MC – E. marginata
Table 19. Initial MC results – E. marginata
Trial JAR1 JAR2 JAR3 JAR4Average 72.0 73.5 74.2 72.5Maximum 105.3 95.9 100.4 110.3Minimum 51.5 55.4 56.7 59.6Standard deviation 10.7 8.2 8.7 9.3
Initial MC (%)
For each trial, we recorded significant differences between the final cross-sectional MC population means of end-matched conventional and vacuum trials (Figure 23 and Table 20). In accordance with both AS/NZS 4787:2001 and AS 2796:1999 trials JAR1 vacuum, JAR2 conventional and both JAR4 trials did not achieve acceptable grade quality in terms of average final cross-sectional MC. All other trials achieved acceptable grade quality. By observing the scattergrams and output results it can be surmised that the JAR2 conventional trial did not meet acceptable standards for final cross-sectional MC due to under-drying (average 14.4), and the JAR1 vacuum trial did not meet grade due to a large proportion of ‘wet’ boards occurring after drying. The ‘wet boards are evident in Figure 23 as the top thin section of the vacuum scattergram (i.e. boards vastly wetter than the average). The most likely cause of this phenomenon is due to ‘tension set’ caused by too harsh drying during early drying periods. This well known phenomena is commonly known as ‘case hardening’ (McMillen, 1963). It can be observed that by reducing the DBT and increasing the WBD between subsequent trials the number of ‘wet’ boards is reduced (and standard deviation) so that for the JAR3 vacuum trial the final cross-sectional MC spread is more uniformly distributed practically eliminating the under-dried boards.

59 Evaluation of super–heated steam vacuum drying viability and development of a predictive drying model for Australian hardwood species – Final report
We used the same vacuum drying schedule for trial JAR4 as for JAR3 except we added 24 hrs to the equalisation phase with the intention of improving drying stress quality (the only unacceptable drying defect for the JAR3 vacuum trial). Unfortunately, a PLC circuit board malfunction cut short the JAR4 trial; consequently, we cannot directly compare the results with the other trials. The result of this is evident by the high final MC for vacuum trial JAR4 (16.2 %) and subsequent failure to meet the standards.
JAR1 JAR2 JAR3 JAR4Conv.Vac.Conv.Vac.Conv.Vac.Conv.Vac.
7
9
11
13
15
17
19
21
23
25
Fina
l MC
(%)
Figure 23. Scattergram of final MC – E. marginata Table 20. Final MC results – E. marginata
Vacuum Conventional Vacuum Conventional Vacuum Conventional Vacuum ConventionalAverage 12.2 10.9 11.6 14.4 12.2 10.6 16.2 12.9Maximum 19.7 12.9 18.8 16.7 14.8 11.7 23.5 15.3Minimum 8.1 9.3 9.6 12.5 9.9 9.5 12.9 11.3Standard deviation 2.4 0.9 2.0 0.9 1.1 0.5 2.1 0.7Significance (p)Grade quality (AS/NZS 4787 ) D B B D B B Fail C% permissible (AS 2796 ) 83 100 91 41 94 100 12 89
Final MC (%)JAR3JAR1 JAR2
< 0.0001 < 0.0001
JAR4
< 0.0001< 0.0001
Except for trial JAR4, we recorded significant differences between the final MC gradient means of end-matched conventional and vacuum trials (Figure 24 and Table 21). All trials achieved acceptable grade qualities (B or A) for final MC gradient except for vacuum trial JAR4. JAR1, JAR2 and JAR4 vacuum drying trials produced boards with unacceptably high MC gradients as observed in the scattergrams and higher standard deviations. As for the final average cross-sectional MC, we improved the MC gradient from vacuum drying trials JAR1 to JAR3 by progressively reducing the DBT, increasing the WBD, and increasing the final equalisation MC. Unfortunately, a PLC circuit board malfunction cut short the JAR4 trial; consequently, we cannot directly compare the results with the other trials. The majority of MC gradient results for the JAR1 and JAR3 conventional trial were negative indicating that these boards were dried below the target MC and equalised for a period of time sufficient to rewet the board outer shell above that of the dried core. The conventionally dried equalisation phase could be shortened to target an average MC gradient of 0%, thus reducing the cost of the process.

60 Evaluation of super–heated steam vacuum drying viability and development of a predictive drying model for Australian hardwood species – Final report
JAR1 JAR2 JAR3 JAR4Conv.Vac.Conv.Vac.Conv.Vac.Conv.Vac.
-4
-2
0
2
4
6
8
10
MC
gra
dien
t (%
)
Figure 24. Scattergram of MC gradient – E. marginata Table 21. MC gradient results – E. marginata
Vacuum Conventional Vacuum Conventional Vacuum Conventional Vacuum Conventional
Average 1.3 -1.4 0.4 0.9 0.3 -0.6 1.0 0.9Maximum 4.3 0.3 8.9 2.0 1.5 0.7 7.7 2.8Minimum -1.0 -3.0 -0.9 0.0 -0.8 -1.5 -0.2 -0.4Standard deviation 1.2 0.6 1.7 0.3 0.5 0.5 1.5 0.6Significance (p)Grade quality (AS/NZS 4787 ) B A B A A A D A
JAR4
0.106
Final MC gradient (%)
< 0.0001 0.0002
JAR2JAR1 JAR3
< 0.0001
Basic density The basic density results are displayed in Figure 25 and Table 22. Multiple pairwise comparisons produced no significant differences between basic density populations of any trial. The average basic density recorded for each trial is similar to the value recorded by the Forest Products Commission Western Australia (http://www.fpc.wa.gov.au, 2009) of 670 kg/m3 for mature native forest E. marginata.
JAR1 JAR2 JAR3 JAR4
500
550
600
650
700
750
800
850
Bas
ic d
ensi
ty (k
g/m
3 )
Figure 25. Scattergram of basic density – E. marginata
Table 22. Initial basic density results – E. marginata
Trial JAR1 JAR2 JAR3 JAR4Average 671.5 663.0 654.6 661.8Maximum 765.0 800.8 728.1 779.9Minimum 590.2 565.4 536.2 525.8Standard deviation 41.5 39.5 43.6 42.3
Basic density (kg/m3)

61 Evaluation of super–heated steam vacuum drying viability and development of a predictive drying model for Australian hardwood species – Final report
Distortion We measured distortion on undressed boards before and after drying. For all trials, cupping was not included in the total percentage of boards within acceptable limits as all cupping was removed after dressing. Significant differences do not exist between conventional and vacuum end-matched trials for spring and bow of trial JAR1, cup of trial JAR2, spring, twist and cup of trial JAR3, and bow, twist and cup of trial JAR4. All other comparisons exhibited significant differences. Total distortion results were unacceptable (< 90%) after drying for JAR1 conventional and vacuum trials but was acceptable for all other trials. A significant reduction in distortion to within acceptable limits between vacuum trial JAR1 and subsequent vacuum trials can be attributed to doubling the stack weighting from 500 kg to 1000 kg between trials. For all trials, twist was the predominant type of distortion for boards failing to meet the standard. Table 23. Distortion results after drying – E. marginata
TrialSpring Bow Twist Cup Total Spring Bow Twist Cup Total
Before drying 100 100 100 100 100 NA NA NA NA NAAfter drying 98 98 61 79 61 99 100 79 94 79Before drying 100 100 100 100 100 NA NA NA NA NAAfter drying 0 0 96 81 96 100 100 92 81 92Before drying 100 99 96 100 95 NA NA NA NA NAAfter drying 100 99 97 82 96 100 100 91 78 91Before drying 100 100 100 100 100 NA NA NA NA NAAfter drying 100 100 94 97 94 100 100 94 97 94
JAR1
JAR2
JAR3
JAR4
Distortion - % In gradeVacuum Conventional
Table 24. Distortion grade results – E.marginata
TrialSpring Bow Twist Cup Spring Bow Twist Cup
Average 3.7 3.4 6.3 0.6 3.6 2.6 4.0 0.2Maximum 15.0 16.0 28.0 5.5 17.0 9.0 22.0 4.0Minimum 0.0 0.0 0.0 0.0 0.0 0.0 0.0 0.0Standard deviation 2.9 3.2 5.8 1.2 2.6 2.1 4.0 0.7Significance (p) 0.826 0.121 0.002 0.0002Average 3.6 2.9 2.2 0.9 4.8 4.3 3.6 0.7Maximum 11.0 8.0 10.0 5.5 15.0 19.0 24.0 3.0Minimum 0.0 0.0 0.0 0.0 0.0 0.0 0.0 0.0Standard deviation 2.2 1.7 1.9 1.1 2.8 2.7 3.6 0.8Significance (p) 0.0004 < 0.0001 < 0.0001 0.325Average 3.5 2.8 2.4 0.6 4.0 3.9 3.1 0.9Maximum 10.0 12.0 28.0 5.0 13.0 14.0 16.0 3.0Minimum 0.0 0.0 0.0 0.0 0.0 0.0 0.0 0.0Standard deviation 2.2 2.0 3.1 1.0 2.9 3.0 3.1 0.9Significance (p) 0.286 0.002 0.074 0.028Average 1.7 1.5 2.0 0.2 3.0 1.7 2.1 0.2Maximum 11.0 9.0 32.0 2.0 11.0 10.0 12.0 5.0Minimum 0.0 0.0 0.0 0.0 0.0 0.0 0.0 0.0Standard deviation 2.0 1.7 3.6 0.4 2.4 2.1 2.4 0.6Significance (p) < 0.0001 0.688 0.274 0.243
JAR4
JAR3
Distortion (mm)Vacuum Conventional
JAR1
JAR2
Surface and internal checking Significant differences exist between the surface checking population means of all conventional and vacuum end-matched trials (Table 25). Unacceptable surface checking grade qualities resulted for the first two vacuum trials, JAR1 and JAR2 (Table 26). For the JAR3 and JAR4 vacuum trials acceptable surface checking grade quality resulted. We can attribute the improvement of surface check results for these vacuum these trials to reducing the DBT and increasing the WBD during the early stages of drying compared with previous trials.

62 Evaluation of super–heated steam vacuum drying viability and development of a predictive drying model for Australian hardwood species – Final report
Unfortunately, a PLC circuit board malfunction cut short the JAR4 trial; consequently, we cannot directly compare the results with the other trials. All of the boards from each trial were free of internal checking. Table 25. Surface checking results – E. marginata
Vacuum Conventional Vacuum Conventional Vacuum Conventional Vacuum ConventionalAverage 43.1 19.4 71.4 21.0 14.6 8.2 44.0 6.1Maximum 670.0 550.0 1900.0 1920.0 1000.0 573.0 1065.0 279.0Minimum 0.0 0.0 0.0 0.0 0.0 0.0 0.0 0.0Standard deviation 89.8 73.4 182.7 149.8 93.2 49.1 138.3 33.1Significance (p) < 0.0001 < 0.0001 0.0300
JAR1 JAR2Surface checking (mm)
JAR4
< 0.0001
JAR3
Table 26. Surface checking grade results – E. marginataa
Grade Vacuum Conventional Vacuum Conventional Vacuum Conventional Vacuum ConventionalSelect (%) 89 94 83 97 97 99 93 100Medium feature (%) 8 2 7 0 0 0 0 0High feature (%) 3 3 10 3 3 1 7 0Surface check free boards (%) 69 86 40 91 93 84 57 95Internal check free boards (%) 100 100 100 100 100 100 100 100
JAR2JAR1 JAR3 JAR4
End splits Significant differences exists between the end split population means of JAR1 and JAR2 conventional and vacuum end-matched trials, but not for the JAR3 and JAR4 trials (Table 27). End splitting was more prevalent in the JAR1 conventionally dried boards (29% of boards affected), which achieved the unacceptable grade quality C. All other trials achieved acceptable grade quality A. Unfortunately, a PLC circuit board malfunction cut short the JAR4 trial; consequently, we cannot directly compare the results with the other trials. It may be that due to extra internal overpressure caused by the vacuum itself, more end drying is present during vacuum drying compared to conventional methods. This theory is reinforced by the test board thermocouple results presented in section 4.3.4 Board temperature of this report. The thermocouple results show noticeably lower temperatures at the board ends than the centres indicating a higher degree of free water at the ends of the boards. This would certainly reduce the level of shrinkage variation at the board ends and hence reduce the incidence and severity of end-splitting. Table 27. End split results – E. marginata
Vacuum Conventional Vacuum Conventional Vacuum Conventional Vacuum ConventionalAverage 3.9 9.4 0.0 3.0 1.9 1.7 1.0 1.2Maximum 140.0 205.0 0.0 175.0 122.0 153.0 71.0 242.0Minimum 0.0 0.0 0.0 0.0 0.0 0.0 0.0 0.0Standard deviation 18.7 38.6 0.0 18.2 12.3 13.0 7.9 17.1Significance (p)Grade quality (AS/NZS 4787 ) A C A A A A A A
0.955
End splits (mm)
0.008 0.7740.003
JAR2JAR1 JAR3 JAR4
Drying stress Significant differences exist between the drying stress population means of JAR2 and JAR3 but not for the other conventional and vacuum end-matched trials (Table 28). Only the JAR3 conventional trial achieved an acceptable grade quality for drying stress. These results suggest improvements to the vacuum drying schedule, particularly the equalisation phase, are still required to reduce drying stress to within acceptable limits for this species. Unfortunately, a PLC circuit board malfunction cut short the JAR4 trial; consequently, we cannot directly compare the results with the other trials.

63 Evaluation of super–heated steam vacuum drying viability and development of a predictive drying model for Australian hardwood species – Final report
JAR1 JAR2 JAR3 JAR4Conv.Vac.Conv.Vac.Conv.Vac.Conv.Vac.
-2
-1
0
1
2
3
4
Dst
ress
Figure 26. Scattergram of drying stress – E. marginata Table 28. Drying stress results – E. marginata
Vacuum Conventional Vacuum Conventional Vacuum Conventional Vacuum ConventionalAverage 1.5 1.4 0.6 1.2 0.8 -0.5 0.8 0.8Maximum 3.1 2.7 3.0 2.4 2.6 1.0 2.4 1.3Minimum 0.0 0.1 0.0 0.5 0.0 -1.4 0.0 0.0Standard deviation 0.8 0.5 0.7 0.3 0.7 0.4 0.6 0.3Significance (p)Grade quality (AS/NZS 4787 ) D C C C C A C C
JAR4
0.606
Drying stress (Dstress)
0.13
JAR1 JAR2
< 0.0001 < 0.0001
JAR3
Collapse No signs of collapse were present for any boards from any trial.
Sawn orientation The majority of boards were a combination of back sawn and transitionally sawn (Table 29). Backsawing is the desired cutting pattern for this species as it usually provides a higher green off-saw (GOS) recovery than quartersawing, and better aesthetics because of growth ring orientation. Table 29. Sawn orientation results – E. marginata
SPG1 SPG2 SPG3 SPG4Quartersawn 9 2 3 2Backsawn 41 71 73 78Transitional 50 27 24 20
Sawn orientation (%)
Gross shrinkage Significant differences exist between the width and thickness gross shrinkage means for all trials suggesting that, in terms of shrinkage in the radial and tangential directions, E. marginata is not isotropic. The results are considerably higher than published tangential (7.4%) and radial (4.9%) shrinkages (http://www.dpi.qld.gov.au, 2008). The results may be somewhat skewed however, as the outlying high shrinkage samples correspond to those boards that were cupped. Unfortunately, a PLC circuit board malfunction cut short the JAR4 trial; consequently, we cannot directly compare the results with the other trials.

64 Evaluation of super–heated steam vacuum drying viability and development of a predictive drying model for Australian hardwood species – Final report
JAR1 JAR2 JAR3 JAR4ThicknessWidthThicknessWidthThicknessWidthThicknessWidth
0
5
10
15
20
25
Shrin
kage
(%)
Figure 27. Scattergram of gross shrinkage – E. marginata Table 30. Gross shrinkage results – E. marginata
Width Thickness Width Thickness Width Thickness Width ThicknessAverage 11.6 9.6 10.2 8.0 8.5 6.8 7.8 5.6Maximum 19.6 20.1 16.9 12.8 15.3 14.3 13.1 14.5Minimum 5.1 4.2 3.2 3.0 4.2 2.7 3.0 1.3Standard deviation 2.8 3.2 3.1 2.3 2.5 2.5 2.4 2.4Significance (p)
JAR4Gross shrinkage (mm)
JAR3JAR1 JAR2
< 0.0001< 0.0001 < 0.0001 < 0.0001
Drying times and vacuum kiln output For each conventional trial the total kiln drying time was 61 days. The total drying times, including equalisation for the vacuum trials JAR1, JAR2 ,JAR3 and JAR4 were 25.6, 19.5, 24.9 and 25.4 days, respectively (Figure 28 to Figure 31). Unfortunately, a PLC circuit board malfunction cut short the JAR4 trial; consequently, we cannot directly compare the results with the other trials.

65 Evaluation of super–heated steam vacuum drying viability and development of a predictive drying model for Australian hardwood species – Final report
-10
0
10
20
30
40
50
60
70
80
90
0 5 10 15 20 25 30
Time (days)
MC
(%),
Tem
pera
ture
(°C)
-100
0
100
200
300
400
500
600
700
800
900
Pres
sure
(mba
r)
MC core MC gradient EMC Temperature Pressure Figure 28. Vacuum drying chart – JAR1 trial
-10
0
10
20
30
40
50
60
70
80
90
0 5 10 15 20 25 30
Time (days)
MC
(%),
Tem
pera
ture
(°C)
-100
0
100
200
300
400
500
600
700
800
900Pr
essu
re (m
bar)
MC core MC gradient EMC Temperature Pressure Figure 29. Vacuum drying chart – JAR2 trial
-10
0
10
20
30
40
50
60
70
80
90
0 5 10 15 20 25 30
Time (days)
MC
(%),
Tem
pera
ture
(°C)
-100
0
100
200
300
400
500
600
700
800
900
Pres
sure
(mba
r)
MC core MC gradient EMC Temperature Pressure Figure 30. Vacuum drying chart – JAR3 trial
-10
0
10
20
30
40
50
60
70
80
90
0 5 10 15 20 25 30
Time (days)
MC
(%),
Tem
pera
ture
(°C)
-100
0
100
200
300
400
500
600
700
800
900
Pres
sure
(mba
r)
MC core MC gradient EMC Temperature Pressure Figure 31. Vacuum drying chart – JAR4 trial
66 Evaluation of super–heated steam vacuum drying viability and development of a predictive drying model for Australian hardwood species – Final report
Summary – E. marginata A summary of the results for the E. marginata trials is provided in Table 31where unacceptable results are highlighted. The total drying time for the JAR1 vacuum drying trial was 25.6 days, 42% of the conventional drying time from the green condition. For both vacuum and conventional JAR1 trials, we recorded unacceptable levels of twist distortion and drying stress. For both JAR1 trials, collapse internal checking and final MC gradient were within permissible limits. The final cross–sectional MC variation for the JAR1 vacuum trial was outside the permissible limits due to five under–dried ‘wet’ outlying boards, possibly caused by case-hardening. Unacceptable surface checking results were recorded for the JAR1 vacuum drying trial. Unacceptable end–splitting resulted from the JAR1 conventional trial. Due to results from the first trial, we implemented a milder schedule for the JAR2 vacuum drying trial. The total drying time for the JAR2 vacuum drying trial 19.5 days 32% of the conventional kiln drying time from the green condition. Schedule refinements resulted in acceptable final cross–sectional MC variation. Due to under-drying, the final cross-sectional MC results for the JAR2 conventional trial were unacceptable. Residual drying stress was improved between vacuum drying trials; but although still unacceptable, it was comparable to the conventional trial. We greatly reduced twist distortion to within acceptable limits for the JAR2 vacuum drying trial by doubling the concrete stack weighting between trials. For the JAR2 vacuum drying trial, surface checking results were still unacceptable but were acceptable for the JAR2 conventional trial. Similar to the previous trial, the JAR3 vacuum schedule was adjusted to give milder conditions. The total drying time for the JAR3 vacuum drying trial was 27.9 days, 41% of the conventional kiln drying time from the green condition. Apart from unacceptable drying stress (a problematic form of degrade even when conventionally dried) all other dried quality results were acceptable for the JAR3 vacuum trial. All dried quality results were acceptable for the JAR3 conventional trial. For the JAR4 vacuum trial we chose the same schedule used for the JAR3 trial except the equalisation time was increased from 48 to 72 hours in an attempt to alleviate drying stress. Unfortunately, a PLC circuit board malfunction cut short the JAR4 trial; consequently, we cannot directly compare the results with the other trials. Thus, the results of this trial are highlighted grey in Table 31. Overall, the results show vacuum drying E. marginata was significantly faster producing the same dried quality as for conventional kiln drying. We recommend using the JAR4 vacuum drying schedule for this species based on the dried quality outcomes of trial JAR3 that used the same schedule but with a shorter equalisation period. We believe an extended equalisation period for this species should improve drying stress grade quality results. Results show that drying stress seems to be an endemic form of degrade for this species independent of drying method.

67 Evaluation of super–heated steam vacuum drying viability and development of a predictive drying model for Australian hardwood species – Final report
Table 31. E. marginata results summary
Species Trial ID.
Drying method
Days drying [% of conventional kiln drying time ]
Initial basic density (kg/m3)
[stdev.]Initial MC
(%) [stdev.]
Final MC (%) average [stdev.]
{grade}*
Final MC % select
grade (%)**
MC gradient (%) [stdev.]
{grade}*
Drying stress grade quality
[stdev.] {grade}*
Distortion % in
grade** [major type]
Collapse (%
affected)
Surface check % select** [%check
free]
Internal check %
check free End split grade*
E. marginata2 (JAR1)vacuum 25.6 [42] 72.0 [10.7] 12.2 [2.4] {D} 83 1.3 [1.2] {B} 1.5 [0.8] {D} 61 [twist] 0 89 [69] 100 Aconventional (kiln) 61 10.9 [0.9] {B} 100 -1.4 [0.6] {A} 1.4 [0.5] {C} 79 [twist] 0 94 [86] 100 Csignificance (p) <0.0001 <0.0001 0.13 <0.0001 0.00026 (JAR2)vacuum 19.5 [32] 663.0 [39.5] 73.5 [8.2] 11.6 [2.0] {B} 91 0.4 [1.7] {B} 0.6 [0.7] {C} 96 [twist] 0 83 [40] 100 Aconventional (kiln) 61 14.4 [0.9] {D} 41 0.9 [0.3] {A} 1.2 [0.3] {C} 92 [twist] 0 97 [91] 100 Asignificance (p) <0.0001 <0.0001 <0.0001 <0.0001 0.000810 (JAR3)vacuum 24.9 [41] 654.6 [43.6] 74.2 [8.7] 12.2 [1.1] {B} 94 0.3 [1.5] {A} 0.8 [0.7] {C} 96 [twist] 0 97 [93] 100 Aconventional (kiln) 61 10.6 [0.5] {B} 100 -0.6 [0.5] {A} -0.5 [0.4] {A} 91 [twist] 0 99 [84] 100 Asignificance (p) <0.0001 <0.0001 <0.0001 0.03 0.0514 (JAR4)vacuum 25.4 [42] 661.8 [42.3] 72.5 [9.3] 16.2 [2.1] {F} 12 1.0 [1.5] {D} 0.8 [0.6] {C} 94 [twist] 0 93 [57] 100 Aconventional (kiln) 61 12.9 [0.7] {C} 89 0.9 [0.6] {A} 0.8 [0.3] {C} 94 [twist] 0 100 [95] 100 Asignificance (p) <0.0001 0.106 0.606 <0.0001 0.955* AS/NZS 4787:2001 Timber-Assessment of drying quality.** AS 2796: 1999 Hardwood-Sawn and milled products.
667.8 [48.5]

68 Evaluation of super–heated steam vacuum drying viability and development of a predictive drying model for Australian hardwood species – Final report
4.1.3 Eucalyptus pilularis – blackbutt
Drying schedules The vacuum kiln used for the study was supplied with a standard software package that includes a number of pre-set schedules for various species (predominantly American and European species) of varying thickness. Only two pre-set schedules pertaining to native Australian eucalypts exist (Eucalyptus regnans and Eucalyptus globulus). The drying properties of these ‘ash’ type species are very different from those for E. pilularis. For this reason, we judged existing vacuum drying schedules for Australian species unsuitable. The schedules used for each trial are shown (Table 32) including for each MC change point, the dry bulb temperature (DBT), wet bulb depression (WBD) and equilibrium moisture content (EMC). The initial schedule chosen for vacuum drying trial BBT1 was the preset schedule provided for Quercus rubra (red oak) and was chosen on the understanding (supported by Simpson and Verill, 1997) that in general, timbers of similar densities often have similar drying characteristics. The average dried density (12% MC) of mature Q. rubra is 890 kg/m3 (Lincoln 1991), which is similar to 930 kg/m3 reported for mature E. pilularis (http://www.fpc.wa.gov.au, 2009). Also, Q. rubra and E. pilularis are similarly constrained by surface checking as the primary drying defect. Although presented as a conventional stepwise schedule, the dry and wet bulb temperatures were actually ramped between MC change points. We performed a 48 hour equalisation phase at the end of drying at an 11% EMC. We developed the BBT2 vacuum drying schedule to reduce the unacceptable amount of surface checking resulting from the BBT1 vacuum trial. Changes to the schedule include higher EMCs from green to 50% MC, to slow down drying during the early surface check prone drying stage. Additionally, we used a higher final equilibrium MC (12% compared with 11%) to improve residual drying stress resulting from the first vacuum trial. Similarly, for the BBT3 and BBT4 vacuum trials, we increased the EMC further during the early stages of drying up to 30% MC due to undesirable checking resulting from the respective BBT2 and BBT3 vacuum trials. Hurford Hardwood sawmill (Casino, New South Wales) supplied material for conventional trial BBT1 and Boral Timber (Murwillumbah) for conventional trials BBT2 and BBT3. Due to time constraints, conventional trial BBT4 did not occur. The conventionally dried end–matched boards of trial BBT1 were air dried from green to approximately 15% MC before final kiln drying. Conventional trials BBT2 and BBT3 were kiln dried from the green condition. Commercial confidentiality prevents details of the conventional drying schedule used by Hurford Hardwood and Boral Timber from being discussed.

69 Evaluation of super–heated steam vacuum drying viability and development of a predictive drying model for Australian hardwood species – Final report
Table 32. Vacuum drying schedules - Eucalyptus pilularis
Trial
MC change points (%)
DBT (°C) WBD (°C) EMC (%) DBT (°C) WBD (°C) EMC (%) DBT (°C) WBD (°C) EMC (%) DBT (°C) WBD (°C) EMC (%)
Heat-up 44 2.1 18.0 44 2.1 18.0 44 2.1 18.0 44 2.1 18.0Green - 70 44 3.0 15.0 44 2.6 16.0 44 2.8 16.0 44 2.4 17.0
70 - 60 44 3.4 14.0 44 3.2 15.0 44 2.8 16.0 44 2.4 17.060 - 50 45 4.0 13.0 45 3.8 14.0 45 2.8 16.0 45 2.4 17.050 - 40 45 4.4 13.0 45 4.4 13.0 45 3.4 15.0 45 3.2 15.540 - 30 45 5.2 12.0 45 5.2 12.0 45 4.6 13.0 45 4.4 13.530 - 25 48 6.7 10.0 48 7.7 10.0 48 7.7 10.0 48 7.7 10.025 - 20 53 9.5 9.0 53 9.5 9.0 53 9.5 9.0 53 9.5 9.020 - 15 60 14.0 6.7 60 14.0 6.7 60 14.0 6.7 60 14.0 6.7
15 - final 67 13.0 6.9 67 13.0 6.9 67 13.0 6.9 67 13.0 6.9Equalise (48 hrs) 70 6.5 11.0 67 5.4 12.0 67 5.4 12.0 67 5.4 12.0
BBT1 BBT2 BBT3 BBT4
Moisture content The initial MC results are shown (Table 33). For each trial, initial MC populations were not normally distributed, likely because of high MC outliers (Figure 32). Multiple pairwise comparisons produced no significant differences between sample population trials BBT1 and BBT2, and BBT1 and BBT3. All other pairwise comparisons produced significant differences.
BBT4BBT3BBT2BBT1
20
30
40
50
60
70
80
90
100
110
Initi
al M
C (%
)
Figure 32. Scattergram of initial MC – E. pilularis
Table 33. Initial MC results – E. pilularis
Trial BBT1 BBT2 BBT3 BBT4Average 53.8 54.6 51.3 44.2Maximum 85.6 96.9 103.0 85.8Minimum 33.8 30.1 36.3 23.4Standard deviation 9.0 11.7 11.6 11.8
Initial MC (%)
For trials BBT2 and BBT3, we recorded significant differences between the final cross-sectional MC population means of end-matched conventional and vacuum trials (Figure 23 and Table 20). No significant difference was recorded for the BBT1 trials. In accordance with both AS/NZS 4787:2001 and AS 2796:1999 BBT2 and BBT3 conventional trials did not achieve acceptable grade quality in terms of average final cross-sectional MC because of over-drying. All other trials achieved acceptable grade quality. It can be observed that by increasing the equalisation EMC from 11% to 12% between the first BBT1 vacuum trial and subsequent vacuum trials, the spread (standard deviation) of final cross-sectional MC was reduced. Personal communications with Hurford Hardwood management (Engwirda, 2009), reveal tougher limitations are imposed on final cross-sectional MC variation for E. pilularis than those specified by AS 2796:1999 (Standards Australia 1999) and AS/NZS 4787:2001 (Standards Australia 1999). This is particularly true for strip flooring where a final cross–sectional variation of ± 1% is imposed for a target final MC of 10.5%. With respect to these specifications, the variation of final cross–sectional MC for all trials except for the BBT1 conventional trial is unacceptable.

70 Evaluation of super–heated steam vacuum drying viability and development of a predictive drying model for Australian hardwood species – Final report
BBT1 BBT2 BBT3 BBT4
Vac.Conv.Vac.Conv.Vac.Conv.Vac.
4
6
8
10
12
14
16
18
Fina
l MC
(%)
Figure 33. Scattergram of final MC – E. pilularis Table 34. Final MC results – E. pilularis
BBT4Vacuum Conventional Vacuum Conventional Vacuum Conventional Vacuum
Average 10.8 10.5 12.0 7.8 11.4 8.7 11.8Maximum 15.2 11.1 16.8 8.8 14.8 9.9 15.5Minimum 8.8 10.0 10.2 5.4 10.0 7.2 10.2Standard deviation 1.3 0.2 1.4 0.6 1.0 0.6 1.0Significance (p) NAGrade quality (AS/NZS 4787 ) B A B D A D A% permissible (AS 2796 ) 94 100 93 0 97 38 96
< 0.0001
BBT1 BBT3
0.1620 < 0.0001
Final MC (%)BBT2
For each trial, we recorded significant differences between the final MC gradient means of end-matched conventional and vacuum trials (Figure 34 and Table 35). All trials achieved acceptable grade qualities (B or A) for final MC gradient. However, vacuum trials BBT1, BBT2 and BBT3 produced boards with high outlying MC gradients as observed via the scattergrams.
BBT1 BBT2 BBT3 BBT4
Vac.Conv.Vac.Conv.Vac.Conv.Vac.
-2
-1
0
1
2
3
4
5
MC
gra
dine
t (%
)
Figure 34. Scattergram of MC gradient – E. pilularis
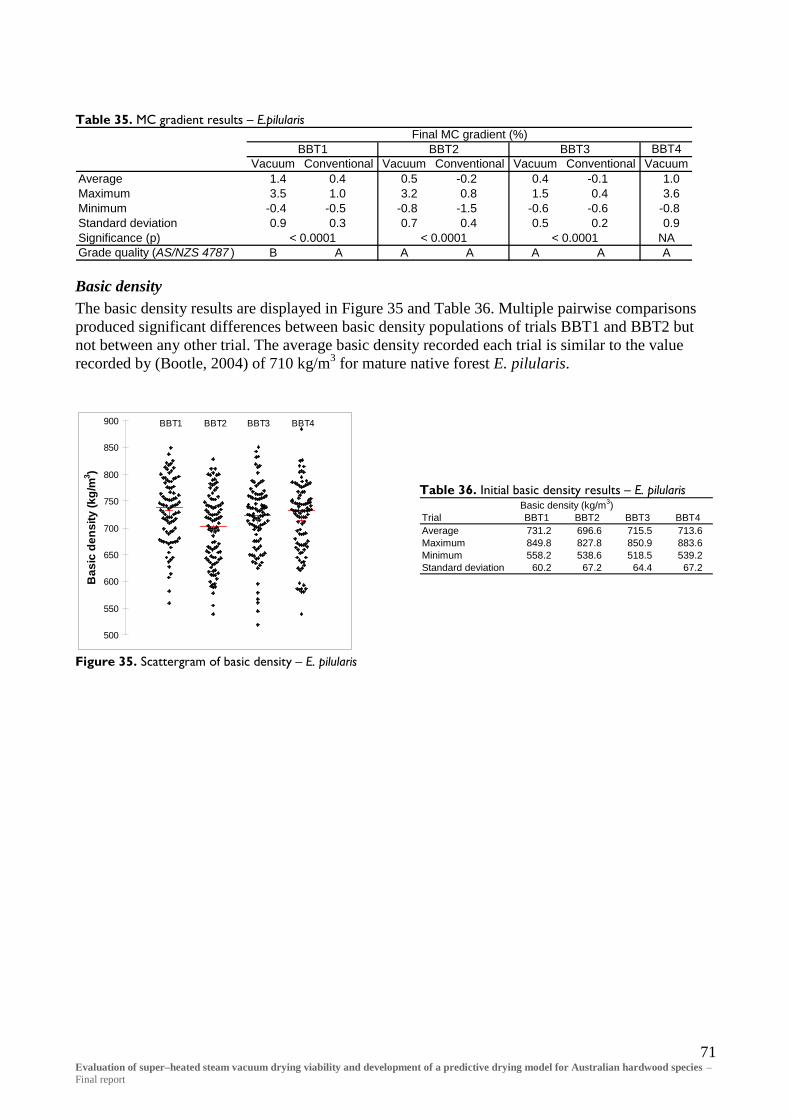
71 Evaluation of super–heated steam vacuum drying viability and development of a predictive drying model for Australian hardwood species – Final report
Table 35. MC gradient results – E.pilularis
BBT4Vacuum Conventional Vacuum Conventional Vacuum Conventional Vacuum
Average 1.4 0.4 0.5 -0.2 0.4 -0.1 1.0Maximum 3.5 1.0 3.2 0.8 1.5 0.4 3.6Minimum -0.4 -0.5 -0.8 -1.5 -0.6 -0.6 -0.8Standard deviation 0.9 0.3 0.7 0.4 0.5 0.2 0.9Significance (p) NAGrade quality (AS/NZS 4787 ) B A A A A A A
< 0.0001 < 0.0001 < 0.0001
BBT3BBT2BBT1Final MC gradient (%)
Basic density The basic density results are displayed in Figure 35 and Table 36. Multiple pairwise comparisons produced significant differences between basic density populations of trials BBT1 and BBT2 but not between any other trial. The average basic density recorded each trial is similar to the value recorded by (Bootle, 2004) of 710 kg/m3 for mature native forest E. pilularis.
BBT1 BBT2 BBT3 BBT4
500
550
600
650
700
750
800
850
900
Bas
ic d
ensi
ty (k
g/m
3 )
Figure 35. Scattergram of basic density – E. pilularis
Table 36. Initial basic density results – E. pilularis
Trial BBT1 BBT2 BBT3 BBT4Average 731.2 696.6 715.5 713.6Maximum 849.8 827.8 850.9 883.6Minimum 558.2 538.6 518.5 539.2Standard deviation 60.2 67.2 64.4 67.2
Basic density (kg/m3)

72 Evaluation of super–heated steam vacuum drying viability and development of a predictive drying model for Australian hardwood species – Final report
Distortion We measured distortion on undressed boards before and after drying. For all trials, cupping was not included in the total percentage of boards within acceptable limits as all cupping was removed after dressing. Significant differences do not exist between conventional and vacuum end-matched trials for cup of trial BBT2 and spring and bow of trial BBT3. All other comparisons exhibited significant differences. All other comparisons exhibited significant differences. Total distortion results were unacceptable (< 90%) after drying for BBT1 vacuum trial but was acceptable for all other trials. A significant reduction in distortion to within acceptable limits between vacuum trial BBT1 and subsequent vacuum trials can be attributed to doubling the stack weighting from 500 kg to 1000 kg between trials. For all trials, twist was the predominant type of distortion for boards failing to meet the standard. Table 37. Distortion results after drying – E. pilularis Trial
Spring Bow Twist Cup Total Spring Bow Twist Cup TotalBefore drying 100 100 100 100 100 NA NA NA NA NAAfter drying 100 98 78 90 78 100 100 96 92 96Before drying 100 98 100 100 98 NA NA NA NA NAAfter drying 100 100 93 80 93 100 100 93 99 93Before drying 100 85 98 100 83 NA NA NA NA NAAfter drying 100 99 93 77 92 100 100 91 90 91Before drying 100 100 99 100 99After drying 100 100 96 77 96
BBT1
BBT2
BBT3
BBT4
Distortion - % In gradeVacuum Conventional
Table 38. Distortion grade results – E.pilularis
TrialSpring Bow Twist Cup Spring Bow Twist Cup
Average 2.7 1.9 3.5 0.3 3.5 2.8 2.1 0.4Maximum 10.0 15.0 15.0 4.0 11.0 9.0 17.0 4.0Minimum 0.0 0.0 0.0 0.0 0.0 0.0 0.0 0.0Standard deviation 2.1 2.9 3.8 0.8 2.4 2.2 2.6 0.8Significance (p) 0.011 0.001 0.004 0.011 NA NA NA NAAverage 2.4 3.3 2.3 0.6 3.7 4.2 3.6 0.3Maximum 12.0 9.0 12.0 5.0 11.0 15.0 25.0 4.0Minimum 0.0 0.0 0.0 0.0 0.0 1.0 0.0 0.0Standard deviation 2.2 2.1 2.4 1.2 2.6 2.7 3.7 0.6Significance (p) 0.0001 0.008 0.004 0.130 NA NA NA NAAverage 2.5 2.2 1.9 0.8 2.7 2.2 2.9 0.5Maximum 9.0 17.0 9.0 5.0 10.0 8.0 23.0 4.0Minimum 0.0 0.0 0.0 0.0 0.0 0.0 0.0 0.0Standard deviation 2.1 2.2 2.1 1.1 2.3 2.0 3.4 0.8Significance (p) 0.529 0.925 0.003 0.029 NA NA NA NAAverage 2.3 2.0 1.7 1.1Maximum 11.0 11.0 10.0 9.0Minimum 0.0 0.0 0.0 0.0Standard deviation 2.3 1.9 2.0 1.6Significance (p) NA NA NA NA
BBT3
Distortion (mm)Vacuum Conventional
BBT2
BBT4
BBT1
Surface and internal checking Significant differences exist between the surface checking population means of the BBT1 and BBT3conventional and vacuum end-matched trials (Table 39). This was not the case for the BBT2 trial indicating comparable results. Unacceptable surface checking grade quality resulted for all trials. The BBT3 vacuum trial produced the best grade quality results (82% select, 70% check free) compared with all other trials. This can be attributed to schedule

73 Evaluation of super–heated steam vacuum drying viability and development of a predictive drying model for Australian hardwood species – Final report
manipulation between vacuum drying trials, where the WBD was increased during the early stages of drying, thus creating a milder schedule. Except for the BBT2 trial, vacuum drying trials produced a higher percentage of select boards than conventional trials for surface checking. Surface checking generally occurs during the early stages of drying when MC gradients and surface tension are at their highest (McMillen, 1963). For future vacuum drying E. pilularis trials, we need to reconsider early vacuum drying schedule conditions to reduce the severity of surface checking within acceptable grade quality. Internal checking was present in boards for all vacuum and conventional trials. Unacceptable internal check grade quality resulted for the BBT1 vacuum, BBT2 vacuum and conventional and the BBT3 conventional trials. Again, we can attribute the improvement of internal checking to within acceptable limits for the BBT3 and BBT4 vacuum trials to using a milder schedule. Table 39. Surface checking results – E. pilularis
BBT4Vacuum Conventional Vacuum Conventional Vacuum Conventional Vacuum
Average 119 627 119 627 148 1181 85Maximum 1260 1900 1260 1900 1370 1900 1061Minimum 0 0 0 0 0 0 0Standard deviation 224 662 224 662 320 770 204Significance (p) NA
BBT3Surface checking (mm)
BBT1 BBT2
< 0.00010.250< 0.0001 Table 40. Surface checking grade results – E. pilularis
BBT4Grade Vacuum Conventional Vacuum Conventional Vacuum Conventional VacuumSelect (%) 79 33 54 62 82 35 78Medium feature (%) 2 0 0 0 0 0 0High feature (%) 19 67 46 38 18 65 22Surface check free boards (%) 51 17 39 51 70 17 65Internal check free boards (%) 87 93 84 79 93 88 98
BBT3BBT1 BBT2
End splits Significant differences exist between the end split population means of all conventional and vacuum end-matched trials (Table 41). End splitting was more prevalent in the conventionally dried boards, which achieved the unacceptable grade quality D. All vacuum trials achieved acceptable grade quality A. It may be that due to extra internal overpressure caused by the vacuum itself, more end drying is present during vacuum drying compared to conventional methods. This theory is reinforced by the test board thermocouple results presented in section 4.3.4 Board temperature of this report. The thermocouple results show noticeably lower temperatures at the board ends than the centres indicating a higher degree of free water at the ends of the boards. This would certainly reduce the level of shrinkage variation at the board ends and hence reduce the incidence and severity of end-splitting. Table 41. End split results – E. pilularis

74 Evaluation of super–heated steam vacuum drying viability and development of a predictive drying model for Australian hardwood species – Final report
BBT4Vacuum Conventional Vacuum Conventional Vacuum Conventional Vacuum
Average 2.1 28.5 10.1 49.8 1.3 34.3 2.4Maximum 125.0 600.0 1070.0 615.0 110.0 270.0 480.0Minimum 0.0 0.0 0.0 0.0 0.0 0.0 0.0Standard deviation 13.3 84.8 83.6 67.7 9.5 50.6 34.1Significance (p) NAGrade quality (AS/NZS 4787 ) A D A D A D A
< 0.0001
BBT3End splits (mm)
< 0.0001
BBT1 BBT2
< 0.0001
Drying stress Significant differences exist between the drying stress population means of all trials (Table 42). Both vacuum BBT1 and vacuum BBT2 drying trials achieved unacceptable grade quality results for drying stress (quality C). All other trials achieved acceptable grade quality B or better. Using a milder schedule (higher early WBD) and a higher final equalisation EMC, the BBT3 and BBT4 vacuum trials achieved the acceptable grade quality for drying stress, comparable to the conventional drying trials.
BBT1 BBT2 BBT3 BBT4
Vac. Conv. Vac. Conv. Vac. Conv. Vac.
-1
-0.5
0
0.5
1
1.5
2
2.5
3
Dst
ress
Figure 36. Scattergram of drying stress – E. pilularis Table 42. Drying stress results – E. pilularis
BBT4Vacuum Conventional Vacuum Conventional Vacuum Conventional Vacuum
Average 1.2 0.4 1.0 0.4 0.5 -0.1 0.4Maximum 2.1 1.1 1.8 1.1 1.8 0.4 0.7Minimum 0.0 0.0 0.0 0.0 0.0 -1.0 0.0Standard deviation 0.4 0.4 0.4 0.3 0.4 0.2 0.2Significance (p) NAGrade quality (AS/NZS 4787 ) C B C B B A B
Drying stress (Dstress)BBT3
< 0.0001< 0.0001 < 0.0001
BBT1 BBT2
Collapse No signs of collapse were present for any boards from any trial.
Sawn orientation The majority of boards were a combination of back sawn and transitionally sawn (Table 43). Backsawing is the desired cutting pattern for this species as it usually provides a higher green off-saw (GOS) recovery than quartersawing, and better aesthetics because of growth ring orientation.

75 Evaluation of super–heated steam vacuum drying viability and development of a predictive drying model for Australian hardwood species – Final report
Table 43. Sawn orientation results – E. pilularis
BBT1 BBT2 BBT3 BBT4Quartersawn 12 7 1 24Backsawn 58 67 46 40Transitional 30 26 53 36
Sawn orientation (%)
Gross shrinkage Significant differences exist between the width and thickness gross shrinkage means for all trials suggesting that, in terms of shrinkage in the tangential and radial directions, E. pilularis is not isotropic. The results are higher than published tangential (7.3%) and radial (4.3%) shrinkages (http://www.dpi.qld.gov.au, 2008). The results may be somewhat skewed however, as the outlying high shrinkage samples correspond to those boards that were cupped.
BBT1 BBT2 BBT3 BBT4ThicknessWidthThicknessWidthThicknessWidthThicknessWidth
0
2
4
6
8
10
12
14
16
18
20
Shrin
kage
(%)
Figure 37. Scattergram of gross shrinkage – E. pilularis Table 44. Gross shrinkage results – E. pilularis
Width Thickness Width Thickness Width Thickness Width ThicknessAverage 9.1 7.8 8.6 7.1 8.9 7.1 8.0 5.5Maximum 16.2 18.0 13.3 14.3 13.9 15.9 15.9 14.3Minimum 3.9 1.0 4.9 0.7 4.9 3.0 3.0 0.9Standard deviation 2.8 3.0 2.0 2.9 2.0 2.4 2.5 2.5Significance (p) < 0.00010.0370< 0.0001
BBT3BBT1 BBT2 BBT4
< 0.0001
Gross shrinkage (mm)
Drying times and vacuum kiln output For conventional trial BBT1, the total kiln drying time was 144 days as it was pre-air dried before final kiln drying. The remaining conventional trials were kiln dried from green, whereby the total drying time was 58 days.

76 Evaluation of super–heated steam vacuum drying viability and development of a predictive drying model for Australian hardwood species – Final report
As evident from the Figure 38 MC core curve, the drying rate after the fifth day of the vacuum drying trial BBT1 was compromised due to a kiln fan/variable speed drive (VSD) failure, whereby practically no drying occurred until approximately day 20 when the VSD was repaired. Through observation of the slope of the MC core curve, we estimate that the drying time should have been in the order of 25 days. The indicative conventional drying time from the green condition is 58 days for this species (Pearn, 2007). The total drying times, including equalisation for the vacuum trials BBT1to BBT4 were 25.0, 21.6, 27.9 and 24.8 days, respectively.
0
10
20
30
40
50
60
70
80
90
0 10 20 30 40 50
Time (days)
MC
(%),
Tem
pera
ture
(°C)
-100
0
100
200
300
400
500
600
700
800
900
Pres
sure
(mba
r)
MC core MC gradient EMC Temperature Pressure Figure 38. Vacuum drying chart – BBT1 trial
0
10
20
30
40
50
60
70
80
0 5 10 15 20 25 30
Time (days)
MC
(%),
Tem
pera
ture
(°C)
-100
0
100
200
300
400
500
600
700
800
900
Pres
sure
(mba
r)
MC core MC gradient EMC Temperature Pressure Figure 39. Vacuum drying chart – BBT2 trial
-10
0
10
20
30
40
50
60
70
80
0 5 10 15 20 25 30
Time (days)
MC
(%),
Tem
pera
ture
(°C)
-100
0
100
200
300
400
500
600
700
800
900
Pres
sure
(mba
r)
MC core MC gradient EMC Temperature Pressure Figure 40. Vacuum drying chart – BBT3 trial
0
10
20
30
40
50
60
70
80
0 5 10 15 20 25 30
Time (days)
MC
(%),
Tem
pera
ture
(°C)
-100
0
100
200
300
400
500
600
700
800
900
Pres
sure
(mba
r)
MC core MC gradient EMC Temperature Pressure Figure 41. Vacuum drying chart – BBT4 trial

77 Evaluation of super–heated steam vacuum drying viability and development of a predictive drying model for Australian hardwood species – Final report
Summary – E. pilularis A summary of the results for the E. pilularis trials are provided in Table 45 where unacceptable results are highlighted. The total drying time for the BBT1 vacuum drying was 25 days, 43% of reported (Pearn, 2007) conventional drying time from the green condition. The combined air/kiln drying time for the conventional trial was 144 days. Final cross–sectional MC, MC gradient, and collapse were within acceptable limits, according to the appropriate standards, for both the BBT1 vacuum and conventional drying trials. However, personal communications with Hurford Hardwood management (Engwirda, 2009), reveal tougher limitations are imposed on final cross-sectional MC variation for E. pilularis than those specified by AS 2796:1999 (Standards Australia 1999) and AS/NZS 4787:2001 (Standards Australia 1999). This is particularly true for strip flooring where a final cross–sectional variation of ± 1% is imposed for a target final MC of 10.5%. Therefore, the variation of final cross–sectional MC for the BBT1 vacuum trial is considered unacceptable by Hurford Hardwood. Using the same limitations, the BBT1 conventional trial final MC variation was acceptable. Drying stress results for the BBT1 vacuum trial were outside the acceptable limitations Surface checking results were not within acceptable limits for either the vacuum or conventional drying trials. Only 33% of the conventionally dried boards made select grade for surface checking compared with 78% for the vacuum drying trial. Internal checking was not within permissible limits for the BBT1 vacuum drying .Unacceptable end–splitting resulted from the BBT1 conventional trial Unacceptable twist distortion was recorded for the BBT1 vacuum drying trial. Unacceptable end splitting resulted from the BBT1 conventional trial. For the second BBT2 vacuum drying trial the drying schedule was adjusted to provide milder humidity conditions The total drying time for the BBT2 vacuum drying trial was 21.5 days, 37% of the conventional drying time (58 days) from the green condition. Final cross–sectional MC, MC gradient, collapse, and internal checking were within acceptable limits, according to the appropriate standards, for the BBT2 vacuum drying trial. Drying stress results for the BBT2 vacuum trial were still outside the acceptable limitations indicating again, surface checking results were not within acceptable limits for the vacuum trial Surface checking was also outside acceptable limits for the conventional BBT2 trial, so the results are comparable. Comparable results were also obtained for internal checking where unacceptable results were obtained for both trials. Twist distortion was greatly reduced to within acceptable limits for the BBT2 vacuum drying trial by doubling the concrete stack weighting between trials. An even milder schedule was used for the BBT3 vacuum where the total drying time for the BBT3 vacuum drying trial was 27.9 days, 48% of the conventional drying time (58 days) from the green condition. At the stage of writing this report the BBT3 conventional trial was still drying. Drying stress and internal check dried quality were improved to within acceptable limits for the BBT3 vacuum trial compared to previous trials due to careful schedule manipulation. All other BBT3 vacuum trial dried quality parameters were within acceptable limits except surface checking where 82% of boards made select grade. However, this is higher than any previous BBT vacuum or conventional drying trial to date. For the BBT4 vacuum trial we increased the EMC further during the early stages of drying up to 30% MC due to undesirable checking resulting from the BBT3 vacuum trial. Due to time constraints, conventional trial BBT4 did not occur. The total drying time for the BBT4 vacuum drying trial was 24.8 days, 43% of the previous conventional drying time (58 days) from the green

78 Evaluation of super–heated steam vacuum drying viability and development of a predictive drying model for Australian hardwood species – Final report
condition. Apart from unacceptable surface checking (a problematic form of degrade even when conventionally dried) all other dried quality results were acceptable for the BBT4 vacuum trial. Overall, the results show vacuum drying E.pilularis was significantly faster producing the same dried quality as for conventional kiln drying. We recommend using the BBT4 vacuum drying schedule for this species based on the dried quality outcomes of this trial We believe a milder initial vacuum drying schedule for this species should improve surface checking grade quality results. Results show that drying surface checking seems to be an endemic form of degrade for this species independent of drying method.

79 Evaluation of super–heated steam vacuum drying viability and development of a predictive drying model for Australian hardwood species – Final report
Table 45. E. pilularis results summary
Species Trial ID.
Drying method
Days drying [% of conventional kiln drying time ]
Initial basic density (kg/m3)
[stdev.]Initial MC
(%) [stdev.]
Final MC (%) average [stdev.]
{grade}*
Final MC % select
grade (%)**
MC gradient (%) [stdev.]
{grade}*
Drying stress grade quality
[stdev.] {grade}*
Distortion % in
grade** [major type]
Collapse (%
affected)
Surface check % select** [%check
free]
Internal check %
check free End split grade*
E. pilularis3 (BBT1)vacuum 25 [43]† 10.8 [1.3] {B} 94 1.4 [0.9] {B} 1.2 [0.4] {C} 78 [twist] 0 79 [51] 87 Aconventional (air) 144 10.5 [0.2] {A} 100 0.4 [0.3] {A} 0.4 [0.4] {B} 96 [twist] 0 33 [17] 93 Dsignificance (p) <0.0001 <0.0001 <0.0001 <0.00017 (BBT2)vacuum 21.5 [37]† 12.0 [1.4] {B} 93 0.5 [0.7] {A} 1.0 [0.4] {C} 93 [twist] 0 54 [39] 84 Aconventional (kiln) 58 7.8 [0.6] {D} 0 -0.2 [0.4] {A} 0.4 [0.3] {B} 93 [twist] 62 [51] 79 Dsignificance (p) <0.0001 <0.0001 <0.0001 0.25 <0.000111 (BBT3)vacuum 27.9 [48]† 11.4 [1.0] {A} 97 0.4 [0.5] {A} 0.5 [0.4] {B} 92 [twist] 0 82 [70] 92 Aconventional (kiln) 58 8.7 [0.6] {D} 38 -0.1 [0.2] {A} -0.1 [0.2] {A} 91 [twist] 35 [17] 88 Dsignificance (p) <0.0001 <0.0001 <0.0001 <0.0001 <0.000115 (BBT4)vacuum 24.8 [43]† 713.6 [11.8] 44.2 [11.8] 11.8 [1] {A} 96 1.0 [0.9] {A} 0.4 [0.2] {A} 96 [twist] 0 78 [65] 98 Aconventional (kiln) Incomplete --------------------------------------------------------------------------------------- ----------------------------------------------- --------------- -------------- ---------------* AS/NZS 4787:2001 Timber-Assessment of drying quality.** AS 2796: 1999 Hardwood-Sawn and milled products.† Based on indicative conventional drying time of 58 days from green (Pearn 2007).
53.8 [9.0]
54.6 [11.7]
51.3 [11.6]
731.2 [60.2]
696.6 [67.2]
715.5 [64.4]

80 Evaluation of super–heated steam vacuum drying viability and development of a predictive drying model for Australian hardwood species – Final report
4.1.4 Eucalyptus obliqua - messmate
Drying schedules The vacuum kiln used for the study was supplied with a standard software package that includes a number of pre-set schedules for various species (predominantly American and European species) of varying thickness. Only two pre-set schedules pertaining to native Australian eucalypts exist (Eucalyptus regnans and Eucalyptus globulus). The schedules used for each trial are shown (Table 46) including for each MC change point, the dry bulb temperature (DBT), wet bulb depression (WBD) and equilibrium moisture content (EMC). The initial schedule chosen for vacuum drying trial MES1 was the preset schedule provided for E. globulus and was chosen because E. globulus and E. obliqua share the same recommended quartersawn conventional drying schedule (Rozsa and Mills, 1997). They also have similar drying defect limitations, particularly surface and internal checking, and collapse. Although presented as a conventional stepwise schedule, the dry and wet bulb temperatures were actually ramped between MC change points. A 48-hour equalisation phase was performed at the end of drying at a 12% EMC. We developed the MES2 vacuum drying schedule to reduce the unacceptable amount of internal checking resulting from the MES1 vacuum trial. Changes to the schedule include higher initial relative humidities down to 30% MC. Due to favourable dried quality resulting from the MES2 vacuum trial, we increased the DBT during the latter stages of the MES3 schedule, from 30% MC to final dry, to increase the drying rate and improve overall drying time. Unfortunately, although instructed to completely wrap these boards block packed with impermeable plastic after sawing, the MES3 pack was presented unwrapped and exposed to the weather before tagging. The pack had been exposed for approximately 3-4 weeks during December/January; Tasmanian summer. As these boards were partially dried before testing, the results of this trial have been compromised and do not represent a complete drying trial and thus cannot directly be compared with other trials. For this reason, we repeated the MES3 vacuum drying schedule for the MES4 vacuum trial. Integrated Tree Cropping (ITC) Timber (Huonville, Tasmania) (now Gunns Timber) supplied material for conventional trials MES1 and MES2, and Gunns Timber (Launceston, Tasmania – sourced from Huonville) for conventional trial MES3. The conventionally dried end–matched boards of trial MES1 were air dried from green to approximately 15% MC before final kiln drying. Material for the conventional MES2 and MES3 were kiln dried from the green condition. Commercial confidentiality prevents us discussing the details of the conventional drying schedules used by these mills.

81 Evaluation of super–heated steam vacuum drying viability and development of a predictive drying model for Australian hardwood species – Final report
Table 46. Vacuum drying schedules – E. obliqua
TrialMC change points
(%)DBT (°C) WBD (°C) EMC (%) DBT (°C) WBD (°C) EMC (%) DBT (°C) WBD (°C) EMC (%)
Heat-up 44 2.4 18.0 44 2.4 18.0 44 2.4 18.0Green - 70 44 2.6 16.0 44 2.8 16.0 44 2.8 16.0
70 - 60 44 3.2 15.0 44 2.8 16.0 44 2.8 16.060 - 50 45 3.8 14.0 45 3.4 15.0 45 3.4 15.050 - 40 45 4.4 13.0 45 4.8 13.5 45 4.8 13.540 - 30 45 5.2 12.0 45 5.0 12.5 45 5.0 12.530 - 25 48 6.7 10.0 48 7.1 10.0 58 7.5 10.025 - 20 53 9.5 9.0 53 9.5 9.0 64 10.0 8.420 - 15 60 14.0 6.7 60 14.0 6.7 72 16.0 6.1
15 - final 67 13.0 6.9 67 13.0 6.9 80 13.0 6.9Equalise (48 hrs) 67 5.4 12.0 67 5.4 12.0 72 5.5 12.5
MES1 MES2 MES3 and MES4
Moisture content The initial MC results are shown (Table 47). Multiple pairwise comparisons produced significant differences between sample populations of all trials indicating a high variability in initial MC for this species. The average MC for trial MES3 is almost half of the other two trials (Table 47). As the MES3 vacuum boards were partially dried before testing the results cannot be directly compared with other trials.
MES4MES3MES2MES1
20
40
60
80
100
120
140
160
180
Initi
al M
C (%
)
Figure 42. Scattergram of initial MC – E. obliqua
Table 47. Initial MC results – E. obliqua
Trial MES1 MES2 MES3 MES4Average 122.0 112.5 65.3 98.0Maximum 170.7 178.3 97.7 144.4Minimum 76.5 73.2 20.5 69.2Standard deviation 20.0 22.7 19.8 20.5
Initial MC (%)
Except for trial MES2, we recorded significant differences between the final cross-sectional MC population means of end-matched conventional and vacuum trials (Figure 43 and Table 48). In accordance with both AS/NZS 4787:2001 and AS 2796:1999 all trial achieved acceptable grade quality in terms of average final cross-sectional MC. Vacuum trial MES2 and conventional trial MES 4 resulted in some outlying boards with higher than normal final cross-sectional MC. As the MES3 vacuum boards were partially dried before testing the results cannot be directly compared with other trials.

82 Evaluation of super–heated steam vacuum drying viability and development of a predictive drying model for Australian hardwood species – Final report
MES1 MES2 MES3 MES4
Vac. Conv. Vac. Conv. Vac. Conv. Vac. Conv.
8
9
10
11
12
13
14
15
16
17
18
Fina
l MC
(%)
Figure 43. Scattergram of final MC – E. obliqua Table 48. Final MC results – E. obliqua
Vacuum Conventional Vacuum Conventional Vacuum Conventional Vacuum ConventionalAverage 10.5 9.7 10.5 10.5 9.6 9.8 10.0 10.5Maximum 12.4 10.5 15.4 11.6 11.1 11.0 11.6 14.7Minimum 9.6 8.9 9.3 9.4 8.5 8.3 8.7 9.3Standard deviation 0.6 0.3 0.9 0.5 0.5 0.6 0.6 0.9Significance (p)Grade quality (AS/NZS 4787 ) A A B B B B B B% permissible (AS 2796 ) 100 98 98 100 91 96 98 99
MES1Final MC (%)
0.725 0.0040 < 0.0001
MES2 MES3 MES4
< 0.0001
For each trial, we recorded significant differences between the final MC gradient means of end-matched conventional and vacuum trials (Figure 44 and Table 49). All trials achieved acceptable grade qualities (A) for final MC gradient. As the MES3 vacuum boards were partially dried before testing the results cannot be directly compared with other trials.
MES1 MES2 MES3 MES4Conv.Vac.Conv.Vac.Conv.Vac.Conv.Vac.
-3
-2
-1
0
1
2
3
4
MC
gra
dien
t (%
)
Figure 44. Scattergram of MC gradient – E. obliqua Table 49. MC gradient results – E.obliqua

83 Evaluation of super–heated steam vacuum drying viability and development of a predictive drying model for Australian hardwood species – Final report
Vacuum Conventional Vacuum Conventional Vacuum Conventional Vacuum ConventionalAverage 0.1 -0.2 -0.2 0.8 0.3 0.0 -0.4 0.4Maximum 1.8 1.1 2.6 2.8 1.7 1.3 1.2 3.1Minimum -0.7 -0.9 -0.9 -1.3 -0.7 -1.1 -2.1 -2.3Standard deviation 0.5 0.4 0.6 0.8 0.5 0.6 0.4 0.9Significance (p)Grade quality (AS/NZS 4787 ) A A A A A A A A
MES1
< 0.0001< 0.0001 < 0.0001 0.0002
MES2 MES3 MES4Final MC gradient (%)
Basic density The basic density results are displayed in Figure 45 and Table 50. Multiple pairwise comparisons produced no significant differences between basic density populations of trials MES1 and MES2, and MES3 and MES4. The average basic density recorded for each trial is considerably lower than the value reported by (Bootle, 2004) of 630 kg/m3 for mature native forest E. obliqua. As the MES3 vacuum boards were partially dried before testing the basic density results for this trial may be erroneous as some of the sections tested were not fully saturated and cannot be directly compared with other trials.
MES4MES3MES2MES1
350
400
450
500
550
600
650
700
750
Bas
ic d
ensi
ty (k
g/m
3 )
Figure 45. Scattergram of basic density – E. obliqua
Table 50. Initial basic density results – E. obliqua
Trial MES1 MES2 MES3 MES4Average 476.1 491.2 569.5 544.7Maximum 621.1 618.5 829.9 696.2Minimum 388.2 375.5 451.3 419.2Standard deviation 58.7 54.6 67.7 64.1
Basic density (kg/m3)

84 Evaluation of super–heated steam vacuum drying viability and development of a predictive drying model for Australian hardwood species – Final report
Distortion We measured distortion on undressed boards before and after drying. For all trials, cupping was not included in the total percentage of boards within acceptable limits as all cupping was removed after dressing. Significant differences do not exist between conventional and vacuum end-matched trials for spring and bow of trials MES2 andMES3, and spring and twist for trial MES4. All other comparisons exhibited significant differences. Total distortion results were acceptable after drying for all trials. As the MES3 vacuum boards were partially dried before testing the results cannot be directly compared with other trials. Table 51. Distortion results after drying – E. obliqua Trial
Spring Bow Twist Cup Total Spring Bow Twist Cup TotalBefore drying 100 100 100 100 100 NA NA NA NA NAAfter drying 99 100 97 100 96 100 100 100 100 96Before drying 100 100 100 100 100 NA NA NA NA NAAfter drying 98 100 99 100 97 98 99 100 98 97Before drying 100 100 100 100 100 NA NA NA NA NAAfter drying 100 100 99 100 99 99 100 97 100 96Before drying 100 100 100 100 100 NA NA NA NA NAAfter drying 99 100 95 100 95 100 100 97 98 97
MES2
MES3
Vacuum Conventional
MES1
MES4
Distortion - % In grade
Table 52. Distortion grade results – E.obliqua
TrialSpring Bow Twist Cup Spring Bow Twist Cup
Average 2.3 2.0 1.7 0.2 3.9 2.9 2.3 0.3Maximum 14.0 7.0 6.0 1.0 21.0 15.0 8.0 2.0Minimum 0.0 0.0 0.0 0.0 0.0 0.0 0.0 0.0Standard deviation 2.2 1.7 1.7 0.4 3.4 2.6 1.8 0.6Significance (p) < 0.0001 0.009 0.014 NA NA NA NA NAAverage 3.8 2.5 1.6 0.3 4.2 2.3 1.1 0.1Maximum 21.0 9.0 6.0 1.2 24.0 30.0 5.0 2.0Minimum 0.0 0.0 0.0 0.0 0.0 0.0 0.0 0.0Standard deviation 3.2 1.6 1.6 0.4 3.6 3.2 1.3 0.4Significance (p) 0.327 0.021 0.033 NA NA NA NA NAAverage 2.4 2.5 1.6 0.4 3.2 2.3 1.2 0.1Maximum 9.0 7.0 10.0 1.3 14.0 11.0 12.0 2.0Minimum 0.0 0.0 0.0 0.0 0.0 0.0 0.0 0.0Standard deviation 2.4 1.5 1.5 0.5 2.9 2.5 1.9 0.3Significance (p) 0.105 0.157 0.003 NA NA NA NA NAAverage 3.7 3.6 2.0 1.0 3.6 2.1 1.7 0.2Maximum 25.0 10.0 10.0 4.0 11.0 7.0 7.0 2.0Minimum 0.0 0.0 0.0 0.0 0.0 0.0 0.0 0.0Standard deviation 3.6 2.4 2.1 0.9 2.6 1.4 1.7 0.4Significance (p) 0.632 < 0.0001 0.537 NA NA NA NA NA
MES1
Distortion (mm)Vacuum Conventional
MES2
MES3
MES4
Surface and internal checking Significant differences exist between the surface checking population means of MES2 and MES3 conventional and vacuum end-matched trials (Table 53). Unacceptable surface checking grade qualities resulted for conventional trial MES2 and both MES3 trials (Table 54). As the MES3 vacuum boards were partially dried before testing the results cannot be directly compared with other trials. The remaining vacuum trials all achieved acceptable surface checking results. Internal checking was present in boards for all vacuum and conventional trials. Unacceptable internal check grade quality resulted for both MES1 trials and MES2 vacuum trial. The milder

85 Evaluation of super–heated steam vacuum drying viability and development of a predictive drying model for Australian hardwood species – Final report
schedule used for vacuum trial MES2 compared with vacuum trial MES1, greatly improved the number of boards free of internal checks (89% cf. 78%) to a level comparable with the conventionally dried boards of the MES1 trial (88%). Further schedule manipulations reduced the incidence of surface checking to within acceptable limits for the final MES4 vacuum trial. Table 53. Surface checking results – E. obliqua
Vacuum Conventional Vacuum Conventional Vacuum Conventional Vacuum ConventionalAverage 14.4 33.7 26.2 84.2 41.2 148.9 7.0 5.9Maximum 1070.0 2719.0 1400.0 1900.0 810.0 1900.0 600.0 452.0Minimum 0.0 0.0 0.0 0.0 0.0 0.0 0.0 0.0Standard deviation 104.7 247.4 157.6 292.8 138.9 438.3 56.8 45.8Significance (p)
Surface checking (mm)
0.009 0.031 0.859
MES2 MES3 MES4MES1
0.075 Table 54. Surface checking grade results – E.obliqua
Grade Vacuum Conventional Vacuum Conventional Vacuum Conventional Vacuum ConventionalSelect (%) 97 95 96 84 91 78 98 98Medium feature (%) 0 0 0 0 1 0 0 0High feature (%) 3 5 4 16 8 21 2 2Surface check free boards (%) 96 94 94 71 80 72 98 94Internal check free boards (%) 78 88 89 96 95 85 96 97
MES1 MES2 MES3 MES4
End splits Significant differences exist between the end split population means of all conventional and vacuum end-matched trials, except the MES4 trials (Table 55). End splitting was more prevalent in the MES1-3 conventionally dried boards, failing to meet even the lowest grade quality E. As the MES3 vacuum boards were partially dried before testing the results cannot be directly compared with other trials. It may be that due to extra internal overpressure caused by the vacuum itself, more end drying is present during vacuum drying compared to conventional methods. This theory is reinforced by the test board thermocouple results presented in section section4.3.4 Board temperature of this report. The thermocouple results show noticeably lower temperatures at the board ends than the centres indicating a higher degree of free water at the ends of the boards. This would certainly reduce the level of shrinkage at the board ends and hence reduce the incidence and severity of end-splitting. Table 55. End split results – E.obliqua
End splits (mm)MES1 MES2 MES3 MES4
Vacuum Conventional Vacuum Conventional Vacuum Conventional Vacuum Conventional6.6 53.7 20.5 77.9 0.0 61.9 6.4 0.3
Maximum 300.0 980.0 1082.0 989.0 0.0 947.0 390.0 50.0Minimum 0.0 0.0 0.0 0.0 0.0 0.0 0.0 0.0Standard deviation 39.2 147.7 107.4 151.5 0.0 136.8 40.0 3.6Significance (p)Grade quality (AS/NZS 4787 ) A Fail A Fail A Fail A A
< 0.0001 0..932< 0.0001< 0.0001
Drying stress Significant differences exist between the drying stress population means of MES1 and MES4 but not for the other conventional and vacuum end-matched trials (Table 56). All trials achieved acceptable grade quality B results for drying stress, except for conventional trial MES4. As the MES3 vacuum boards were partially dried before testing the results cannot be directly compared with other trials.
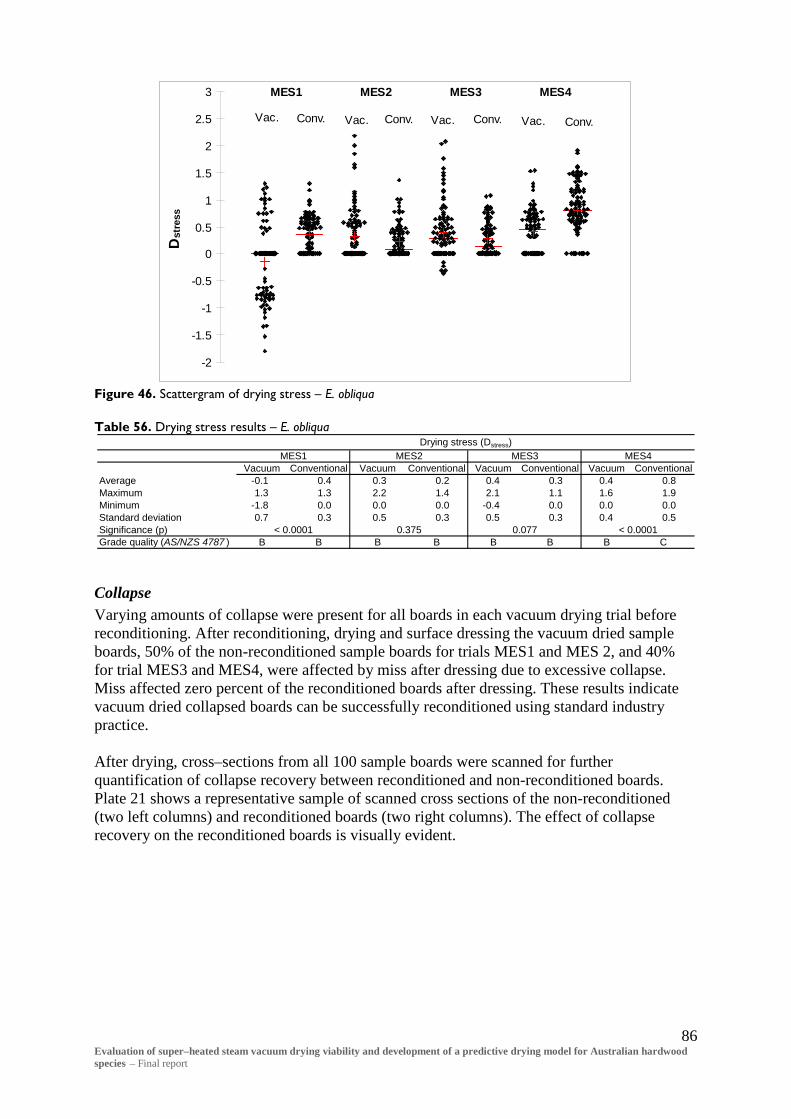
86 Evaluation of super–heated steam vacuum drying viability and development of a predictive drying model for Australian hardwood species – Final report
MES1 MES2 MES3 MES4
Conv.Vac.Conv.Vac.Conv.Vac.Conv.Vac.
-2
-1.5
-1
-0.5
0
0.5
1
1.5
2
2.5
3
Dst
ress
Figure 46. Scattergram of drying stress – E. obliqua Table 56. Drying stress results – E. obliqua
Vacuum Conventional Vacuum Conventional Vacuum Conventional Vacuum ConventionalAverage -0.1 0.4 0.3 0.2 0.4 0.3 0.4 0.8Maximum 1.3 1.3 2.2 1.4 2.1 1.1 1.6 1.9Minimum -1.8 0.0 0.0 0.0 -0.4 0.0 0.0 0.0Standard deviation 0.7 0.3 0.5 0.3 0.5 0.3 0.4 0.5Significance (p)Grade quality (AS/NZS 4787 ) B B B B B B B C
MES2 MES3 MES4Drying stress (Dstress)
MES1
0.375< 0.0001 0.077 < 0.0001
Collapse Varying amounts of collapse were present for all boards in each vacuum drying trial before reconditioning. After reconditioning, drying and surface dressing the vacuum dried sample boards, 50% of the non-reconditioned sample boards for trials MES1 and MES 2, and 40% for trial MES3 and MES4, were affected by miss after dressing due to excessive collapse. Miss affected zero percent of the reconditioned boards after dressing. These results indicate vacuum dried collapsed boards can be successfully reconditioned using standard industry practice. After drying, cross–sections from all 100 sample boards were scanned for further quantification of collapse recovery between reconditioned and non-reconditioned boards. Plate 21 shows a representative sample of scanned cross sections of the non-reconditioned (two left columns) and reconditioned boards (two right columns). The effect of collapse recovery on the reconditioned boards is visually evident.
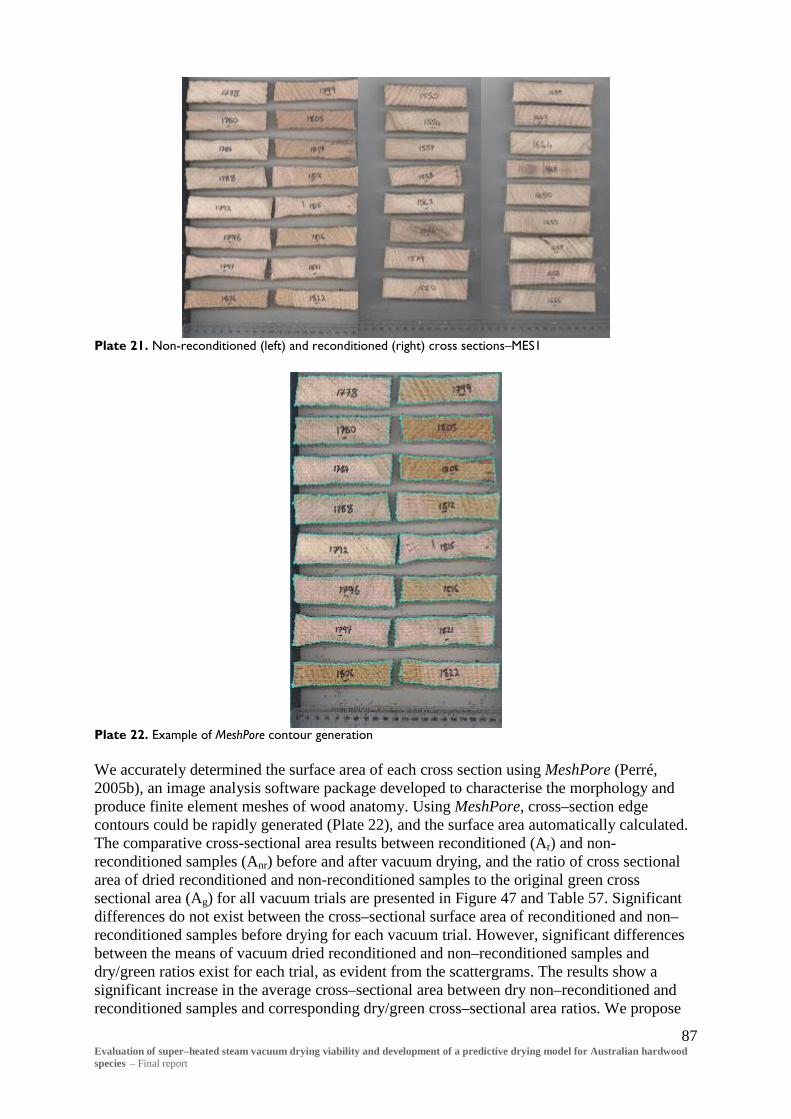
87 Evaluation of super–heated steam vacuum drying viability and development of a predictive drying model for Australian hardwood species – Final report
Plate 21. Non-reconditioned (left) and reconditioned (right) cross sections–MES1
Plate 22. Example of MeshPore contour generation We accurately determined the surface area of each cross section using MeshPore (Perré, 2005b), an image analysis software package developed to characterise the morphology and produce finite element meshes of wood anatomy. Using MeshPore, cross–section edge contours could be rapidly generated (Plate 22), and the surface area automatically calculated. The comparative cross-sectional area results between reconditioned (Ar) and non-reconditioned samples (Anr) before and after vacuum drying, and the ratio of cross sectional area of dried reconditioned and non-reconditioned samples to the original green cross sectional area (Ag) for all vacuum trials are presented in Figure 47 and Table 57. Significant differences do not exist between the cross–sectional surface area of reconditioned and non–reconditioned samples before drying for each vacuum trial. However, significant differences between the means of vacuum dried reconditioned and non–reconditioned samples and dry/green ratios exist for each trial, as evident from the scattergrams. The results show a significant increase in the average cross–sectional area between dry non–reconditioned and reconditioned samples and corresponding dry/green cross–sectional area ratios. We propose

88 Evaluation of super–heated steam vacuum drying viability and development of a predictive drying model for Australian hardwood species – Final report
that the normalised ratio of dry/green surface area has potential to be used as a quantitative and comparative method (between/within species and treatments) to characterise collapse and the effectiveness of the reconditioning process.
MES1 MES2 MES3 MES4
Reco.Non reco.Reco.Non reco.Reco.Non reco.Reco.Non reco.
0.5
0.55
0.6
0.65
0.7
0.75
0.8
0.85
0.9
0.95
1D
ry/g
reen
are
a ra
tio
Figure 47. Ratio of dry versus green non-reconditioned and reconditioned cross-sectional area – E. obliqua Table 57. Reconditioned and non-reconditioned cross-sectional area results – E. obliqua
Anr Ar Anr/Ag Ar/Ag
non-reco. reco. non-reco. reco. non-reco. reco.MES1
Average 33.09 33.43 23.06 26.96 0.70 0.81Stdev. 1.56 1.21 2.04 1.64 0.061 0.046Sig. (p)
MES2Average 33.26 33.55 24.21 26.36 0.73 0.79Stdev. 1.30 1.95 2.34 1.77 0.063 0.044Sig. (p)
MES3Average 33.40 33.24 27.57 28.77 0.83 0.87Stdev. 1.17 1.53 2.13 1.44 0.059 0.038Sig. (p)
MES4Average 26.46 26.03 20.11 21.08 0.75 0.81Stdev. 1.09 1.35 2.00 1.77 0.120 0.048Sig. (p)
Dry area (cm2) Dry/green area ratio
< 0.0001
0.15
0.002
Green area (cm2)
0.717
Ag
0.85
0.242 0.016 < 0.0001
< 0.0001
< 0.0001 < 0.0001
< 0.0001
Sawn orientation The majority of boards were a combination of quartersawn and transitionally sawn (Table 29). Quartersawing is the desired cutting pattern for this species as it generally produces boards with less surface checking and collapse induced degrade than backsawing. Table 58. Sawn orientation results – E. obliqua
MES1 MES2 MES3 MES4Quartersawn 50 62 50 48Backsawn 5 0 1 0Transitional 45 38 49 52
Sawn orientation (%)
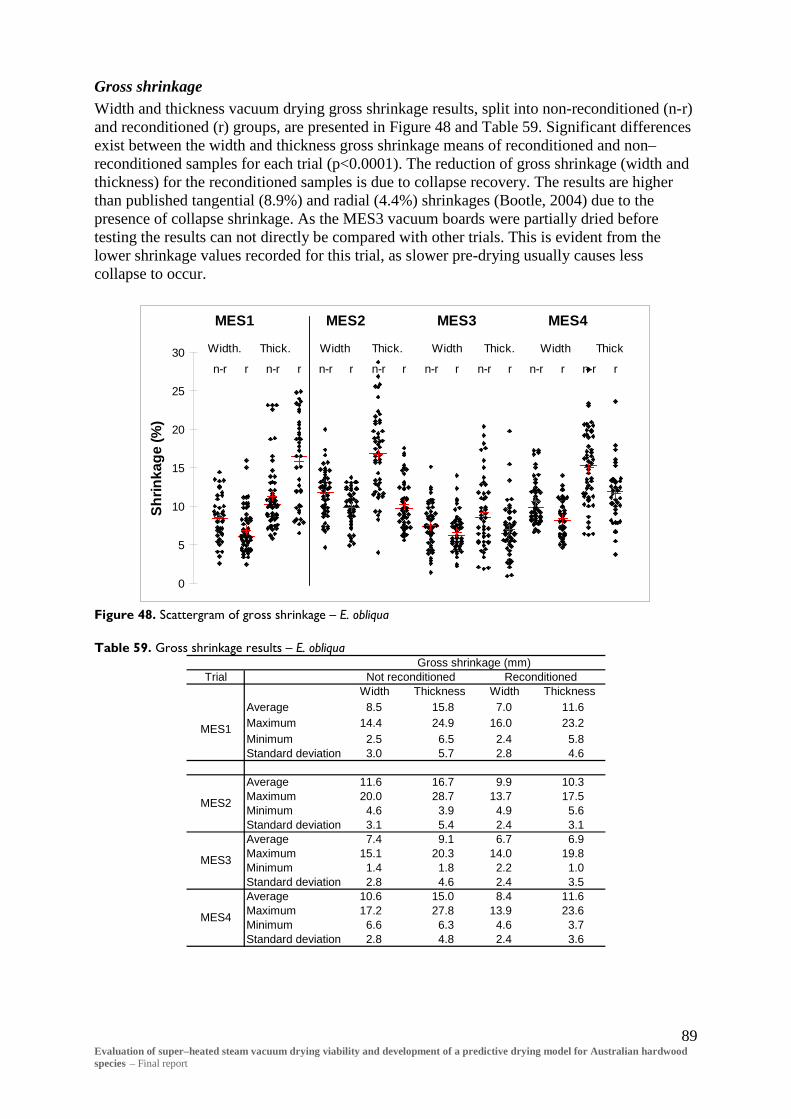
89 Evaluation of super–heated steam vacuum drying viability and development of a predictive drying model for Australian hardwood species – Final report
Gross shrinkage Width and thickness vacuum drying gross shrinkage results, split into non-reconditioned (n-r) and reconditioned (r) groups, are presented in Figure 48 and Table 59. Significant differences exist between the width and thickness gross shrinkage means of reconditioned and non–reconditioned samples for each trial (p<0.0001). The reduction of gross shrinkage (width and thickness) for the reconditioned samples is due to collapse recovery. The results are higher than published tangential (8.9%) and radial (4.4%) shrinkages (Bootle, 2004) due to the presence of collapse shrinkage. As the MES3 vacuum boards were partially dried before testing the results can not directly be compared with other trials. This is evident from the lower shrinkage values recorded for this trial, as slower pre-drying usually causes less collapse to occur.
MES1 MES2 MES3 MES4
rn-rrn-rrn-rrn-rrn-rrn-rrn-rrn-r
0
5
10
15
20
25
30
Shrin
kage
(%)
Width. Thick. Width Thick. Width Thick. Width Thick
Figure 48. Scattergram of gross shrinkage – E. obliqua Table 59. Gross shrinkage results – E. obliqua
TrialWidth Thickness Width Thickness
Average 8.5 15.8 7.0 11.6Maximum 14.4 24.9 16.0 23.2Minimum 2.5 6.5 2.4 5.8Standard deviation 3.0 5.7 2.8 4.6
Average 11.6 16.7 9.9 10.3Maximum 20.0 28.7 13.7 17.5Minimum 4.6 3.9 4.9 5.6Standard deviation 3.1 5.4 2.4 3.1Average 7.4 9.1 6.7 6.9Maximum 15.1 20.3 14.0 19.8Minimum 1.4 1.8 2.2 1.0Standard deviation 2.8 4.6 2.4 3.5Average 10.6 15.0 8.4 11.6Maximum 17.2 27.8 13.9 23.6Minimum 6.6 6.3 4.6 3.7Standard deviation 2.8 4.8 2.4 3.6
MES4
ReconditionedGross shrinkage (mm)
Not reconditioned
MES1
MES2
MES3

90 Evaluation of super–heated steam vacuum drying viability and development of a predictive drying model for Australian hardwood species – Final report
Drying times and vacuum kiln output Conventional drying time for this species from the green condition is reported to take approximately 59 days (Innes et al., 2008). The total drying times, including equalisation for the vacuum trials MES1, MES2, MES3 and MES4 were 36.3, 37.0, 38.4 and 36.7 days, respectively (Figure 49 to Figure 52). As the MES3 vacuum boards were partially dried before testing the results cannot be directly compared with other trials. Electrical interference caused the distorted output presented for trial MES4 in Figure 52. We have since remedied this.
-10
0
10
20
30
40
50
60
70
80
0 10 20 30 40
Time (days)
MC
(%),
Tem
pera
ture
(°C)
-100
0
100
200
300
400
500
600
700
800
900
Pres
sure
(mba
r)
MC core MC gradient EMC Temperature Pressure Figure 49. Vacuum drying chart – MES1 trial
0
10
20
30
40
50
60
70
80
0 10 20 30 40
Time (days)
MC
(%),
Tem
pera
ture
(°C)
0
100
200
300
400
500
600
700
800
900
1000
Pres
sure
(mba
r)
MC core MC gradient EMC Temperature Pressure Figure 50. Vacuum drying chart – MES2 trial
0
10
20
30
40
50
60
70
80
90
0 10 20 30 40
Time (days)
MC
(%),
Tem
pera
ture
(°C)
-100
0
100
200
300
400
500
600
700
800
900
Pres
sure
(mba
r)
MC core MC gradient EMC Temperature Pressure
Figure 51. Vacuum drying chart – MES3 trial
0
10
20
30
40
50
60
70
80
90
0 5 10 15 20 25 30 35 40
Time (days)
MC
(%),
Tem
pera
ture
(°C)
0
100
200
300
400
500
600
700
800
900
Pres
sure
(mba
r)
MC core MC gradient EMC Temperature Pressure
Figure 52. Vacuum drying chart – MES4 trial

91 Evaluation of super–heated steam vacuum drying viability and development of a predictive drying model for Australian hardwood species – Final report
Summary – E. obliqua A summary of the results for the E. obliqua trials is provided in Table 60 where unacceptable results are highlighted. The total drying time for the MES1 vacuum drying trial was 36.3 days, 61% of reported conventional drying time from the green condition. Final cross–sectional MC variation, MC gradient, residual drying stress, distortion, and surface checking were within acceptable limits, for both the MES 1 conventional and vacuum drying trials. An unacceptable number of MES1 vacuum and conventionally dried boards contained internal checking. E. obliqua is particularly prone to this type of degrade. Unacceptable end–splitting resulted from the MES1 conventional trial which failed to make the lowest quality grade, but was minimal for the MES1 vacuum drying trial. We used a milder schedule for the second MES2 vacuum drying trial in an attempt to alleviate internal checking. The total drying time for the MES2 vacuum drying trial was 39 days, 63% of reported conventional drying time from the green condition. Final cross–sectional MC, MC gradient, residual drying stress, distortion, and surface checking were within acceptable limits for the MES2 vacuum drying trial. Internal checking results for the MES2 vacuum trial were still outside the acceptable limitations, but were an improvement on the first MES1 vacuum drying trial. For the MES2 conventional trial, all forms of degrade were within acceptable limits except for surface checking and end-splitting. As material provided for the MES3 trials were partially air-dried through exposure prior to testing the results are considered to be compromised and cannot be compared with previous trials. Although the results are presented in this report they are not discussed in this summary. Due to favourable dried quality resulting from the MES2 vacuum trial, we increased the DBT during the latter stages of the MES4 schedule, from 30% MC to final dry, to increase the drying rate and improve overall drying time. The total drying time for the MES4 vacuum drying trial was 36.7 days, 62% of reported conventional drying time. For the MES4 vacuum drying trial all forms of degrade were within acceptable limits. For the corresponding conventional trial, all forms of degrade were acceptable except for drying stress. Collapse was present for all vacuum dried boards before reconditioning. No noticeable collapse was present on the MES1 conventional trial boards as they had been reconditioned by the sawmill prior to analysis. Using MeshPore, we generated cross–section edge contours and calculated the surface area. The results show a significant increase in the average cross–sectional area between dry non–reconditioned and reconditioned samples and corresponding dry/green cross–sectional area ratios. Successful recovery of collapse after reconditioning was evident as 100% of reconditioned boards, when dressed to a thickness of 19 mm, were free of collapse-induced ‘miss’. Between 40 and 50% of non–reconditioned boards were free of collapse-induced ‘miss’ or ‘skip’ after dressing for all trials. The author proposes that the normalised ratio of dry/green surface area has potential to be used as a quantitative and comparative method (between/within species and treatments) to characterise collapse and the effectiveness of the reconditioning process. Overall, the results show vacuum drying E. obliqua was significantly faster producing the same or better dried quality than for conventional kiln drying. We recommend using the MES4 vacuum drying schedule for this species based on the dried quality outcomes and drying time.
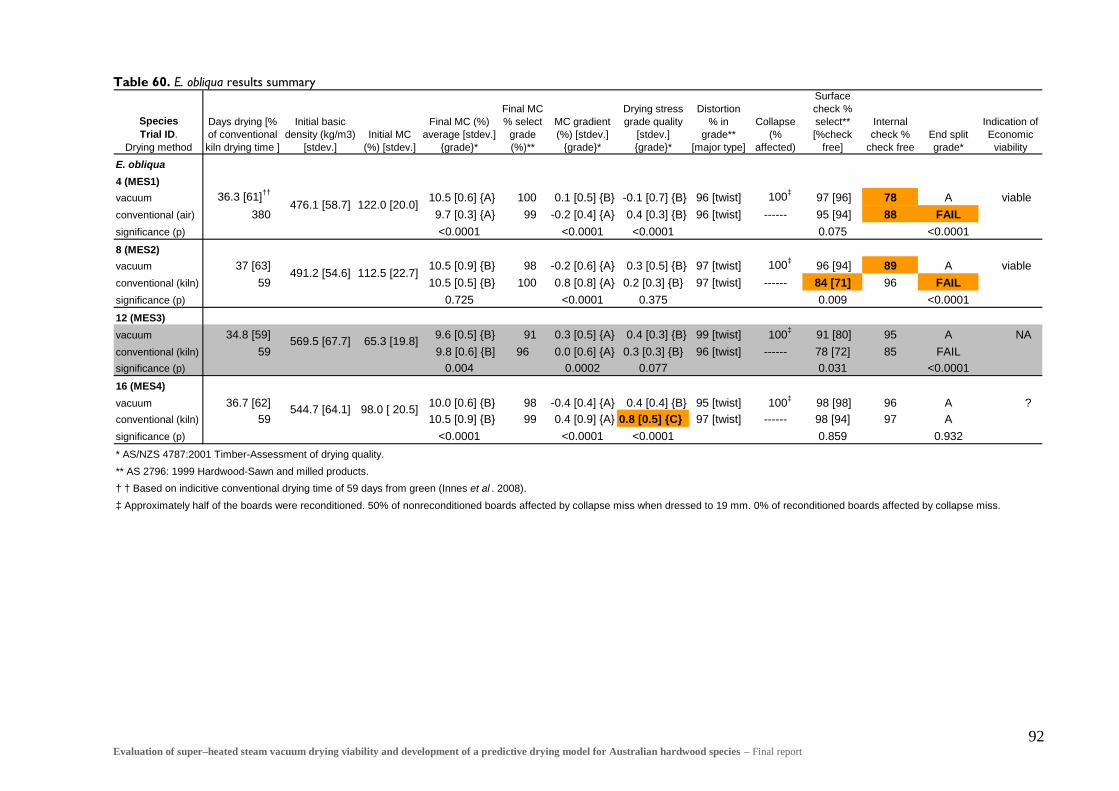
92 Evaluation of super–heated steam vacuum drying viability and development of a predictive drying model for Australian hardwood species – Final report
Table 60. E. obliqua results summary
Species Trial ID.
Drying method
Days drying [% of conventional kiln drying time ]
Initial basic density (kg/m3)
[stdev.]Initial MC
(%) [stdev.]
Final MC (%) average [stdev.]
{grade}*
Final MC % select
grade (%)**
MC gradient (%) [stdev.]
{grade}*
Drying stress grade quality
[stdev.] {grade}*
Distortion % in
grade** [major type]
Collapse (%
affected)
Surface check % select** [%check
free]
Internal check %
check free End split grade*
Indication of Economic
viability
E. obliqua4 (MES1)vacuum 36.3 [61]†† 10.5 [0.6] {A} 100 0.1 [0.5] {B} -0.1 [0.7] {B} 96 [twist] 100‡ 97 [96] 78 A viableconventional (air) 380 9.7 [0.3] {A} 99 -0.2 [0.4] {A} 0.4 [0.3] {B} 96 [twist] ------ 95 [94] 88 FAILsignificance (p) <0.0001 <0.0001 <0.0001 0.075 <0.00018 (MES2)vacuum 37 [63] 10.5 [0.9] {B} 98 -0.2 [0.6] {A} 0.3 [0.5] {B} 97 [twist] 100‡ 96 [94] 89 A viableconventional (kiln) 59 10.5 [0.5] {B} 100 0.8 [0.8] {A} 0.2 [0.3] {B} 97 [twist] ------ 84 [71] 96 FAILsignificance (p) 0.725 <0.0001 0.375 0.009 <0.000112 (MES3)vacuum 34.8 [59] 9.6 [0.5] {B} 91 0.3 [0.5] {A} 0.4 [0.3] {B} 99 [twist] 100‡ 91 [80] 95 A NAconventional (kiln) 59 9.8 [0.6] {B] 96 0.0 [0.6] {A} 0.3 [0.3] {B} 96 [twist] ------ 78 [72] 85 FAILsignificance (p) 0.004 0.0002 0.077 0.031 <0.000116 (MES4)vacuum 36.7 [62] 10.0 [0.6] {B} 98 -0.4 [0.4] {A} 0.4 [0.4] {B} 95 [twist] 100‡ 98 [98] 96 A ?conventional (kiln) 59 10.5 [0.9] {B} 99 0.4 [0.9] {A} 0.8 [0.5] {C} 97 [twist] ------ 98 [94] 97 Asignificance (p) <0.0001 <0.0001 <0.0001 0.859 0.932* AS/NZS 4787:2001 Timber-Assessment of drying quality.** AS 2796: 1999 Hardwood-Sawn and milled products.† † Based on indicitive conventional drying time of 59 days from green (Innes et al . 2008).‡ Approximately half of the boards were reconditioned. 50% of nonreconditioned boards affected by collapse miss when dressed to 19 mm. 0% of reconditioned boards affected by collapse miss.
544.7 [64.1] 98.0 [ 20.5]
569.5 [67.7] 65.3 [19.8]
476.1 [58.7] 122.0 [20.0]
491.2 [54.6] 112.5 [22.7]

93 Evaluation of super–heated steam vacuum drying viability and development of a predictive drying model for Australian hardwood species – Final report
4.2 Applied drying - Economic model We performed three (3) case studies to examine the economic viability of vacuum drying compared to conventional drying for each species. The different case studies relate to three different sized operations, namely: small, medium and large relating to wood capacities of 10, 35 and 50 m3, respectively. For each of the case studies, we used the same constant input values shown in Table 61. The justification for these values is provided in section 3.2.2 Inputs. Table 61. Constant input values used for each case study
Constant input Conventional drying Vacuum dryingproject life (yrs) 20 20interest rate (%) 7 7wood value ($) 426 426Electrical cost ($/kWh) 0.2 0.2Heat cost ($/MJ) 0.05 0.05Thermal loss (%) 65 30Average fan load (kW) 2 1.5Vacuum pump rating (kW) NA 3Vacuum pump usage (%) NA 20Condensor fan rating (kW) NA 11Condensor fan usage (%) NA 25Operational year (days) 328 328
The species specific, and drying condition data used in the case studies for each species are the same values generated from the best quality and fastest drying outcome applied drying trials. For each species this related to the last or fourth drying trial conducted. Kiln related data was provided by the project collaborator, Brunner-Hildebrand. The kiln costs do not take into account the cost of the heat plant or installation of the kilns. Installation values are assumed the same for installing the same sized kiln, either vacuum or conventional. The results of the case studies are shown in Table 62 where non-viable vacuum drying (loss) is highlighted. From the drying trials, the reduction in vacuum drying time compared to conventional for C. citriodora and E. obliqua was similar at 66 and 62% respectively. For E.marginata and E. pilularis the reduction was also similar at 43 and 41% respectively. Results of the case studies indicate that in terms of the cost/m3, for the small and medium sized operations, vacuum drying of C. citriodora and E.obliqua is not economically viable. However, for both species vacuum drying is economically viable (2.7 % gain for C. citriodora and 1.3 % for E.obliqua) for the large operation, primarily due to a reduction in the capital growth of larger capacity vacuum drying kilns. For all sized operations, vacuum drying was found to be economically viable for E.marginata and E. pilularis. We encountered the same trend for each species where economic viability in terms of gain (%) increased with increasing operation size. For these two species, at the largest operation size tested (case study 3) the gain results indicate an increase of 15.7 and 18.9 % respectively for E. marginata and E. pilularis when comparing vacuum drying to conventional. Results indicate that for small and medium sized operations, for vacuum drying to be economically viable, the vacuum drying time needs to be less than approximately 60% of the conventional drying time.

94 Evaluation of super–heated steam vacuum drying viability and development of a predictive drying model for Australian hardwood species – Final report
Table 62. Economic case study viability results
Case study No. Species Kiln type
Kiln capacity (m3)
Kiln capital ($) No. Kilns No. Fans
Kiln drying time (hrs)
Max. Temp. (°C)
Initial MC (%)
Final MC (%)
Basic density (kg/m3)
Throughput (m3/Yr)
Cost ($/m3)
Gain/Loss (%)
Conventional 10 47000 1 2 504 75 37.3 10.2 852 156.2 109.84Vacuum 10 134000 1 4 336 75 37.3 10.2 852 234.29 134.11Conventional 10 47000 1 2 1464 67 74.2 12.2 662 53.77 252.44Vacuum 10 134000 1 4 622 67 74.2 10.6 662 126.56 240.97Conventional 10 47000 1 2 1392 67 51.3 8.7 715 56.55 223.92Vacuum 10 134000 1 4 595 67 51.3 11.8 715 132.3 211.99Conventional 10 47000 1 2 1416 75 98 10 545 55.59 261.86Vacuum 10 134000 1 4 881 75 98 10.5 545 89.35 322.2Conventional 35 60000 1 3 504 75 37.3 10.2 852 546.67 77.24Vacuum 35 241000 1 6 336 75 37.3 10.2 852 820 81.09Conventional 35 60000 1 3 1464 67 74.2 12.2 662 188.2 157.74Vacuum 35 241000 1 6 622 67 74.2 10.6 662 442.96 142.82Conventional 35 60000 1 3 1392 67 51.3 8.7 715 197.93 133.9Vacuum 35 241000 1 6 595 67 51.3 11.8 715 463.06 118.1Conventional 35 60000 1 3 1416 75 98 10 545 194.58 170.28Vacuum 35 241000 1 6 881 75 98 10.5 545 312.74 183.18Conventional 50 74000 1 4 504 75 37.3 10.2 852 780.95 75.34Vacuum 50 281000 1 7 336 75 37.3 10.2 852 1171.43 73.28Conventional 50 74000 1 4 1464 67 74.2 12.2 662 268.85 152.23Vacuum 50 281000 1 7 622 67 74.2 10.6 662 632.8 128.37Conventional 50 74000 1 4 1392 67 51.3 8.7 715 282.76 128.64Vacuum 50 281000 1 7 595 67 51.3 11.8 715 661.51 104.29Conventional 50 74000 1 4 1416 75 98 10 545 227.97 164.93Vacuum 50 281000 1 7 881 75 98 10.5 545 446.77 162.73
1. S
mal
l sca
le -s
ame
volu
me
kiln
Input variables Output variables
C. citriodora
E. marginata
2. M
ediu
m s
cale
-sa
me
volu
me
kiln
C. citriodora
E. marginata
E. pilularis
E. obliqua
E. pilularis
E. obliqua
3. L
arge
sca
le -s
ame
volu
me
kiln
C. citriodora
E. marginata
E. pilularis
E. obliqua
-22.1
4.5
5.3
-23.0
-5.0
9.5
11.8
-7.6
2.7
15.7
18.9
1.3

95 Evaluation of super–heated steam vacuum drying viability and development of a predictive drying model for Australian hardwood species – Final report
4.3 Drying modelling - Measurement of kiln conditions and wood drying properties
As the specialised instrumentation outputs were used for modelling purposes, and due to the large number of outputs over the 16 vacuum trials, only an example of each device output is provided.
4.3.1 Shrinkage and flying wood An example of the strain gauge output for the JAR10 vacuum trial test and flying wood boards is presented in Figure 53. Classical shrinkage curves are presented for the test boards and flying wood board. The strain gauge pairs for the two test boards can be seen to follow similar shrinkage paths. The curves for the flying wood board show stress reversal as expected.
Figure 53. Strain gauge output example for trial JAR10 – E. marginata
4.3.2 Load/moisture content An example of the load cell output for the BBT11 vacuum trial test and flying wood boards is presented in Figure 54. The curves follow the expected reduction due to drying, however there appears to be some noise in the output signal which may be electrical or caused by vibration of the boards due to airflow. Further analysis involved smoothing these curves using the ‘sliding window’ algorithm in Matlab. Once smoothed we converted the curve output from mass to MC. These curves were used for model verification and comparisons as detailed in section 4.5 Drying modelling - Vacuum drying modelling.
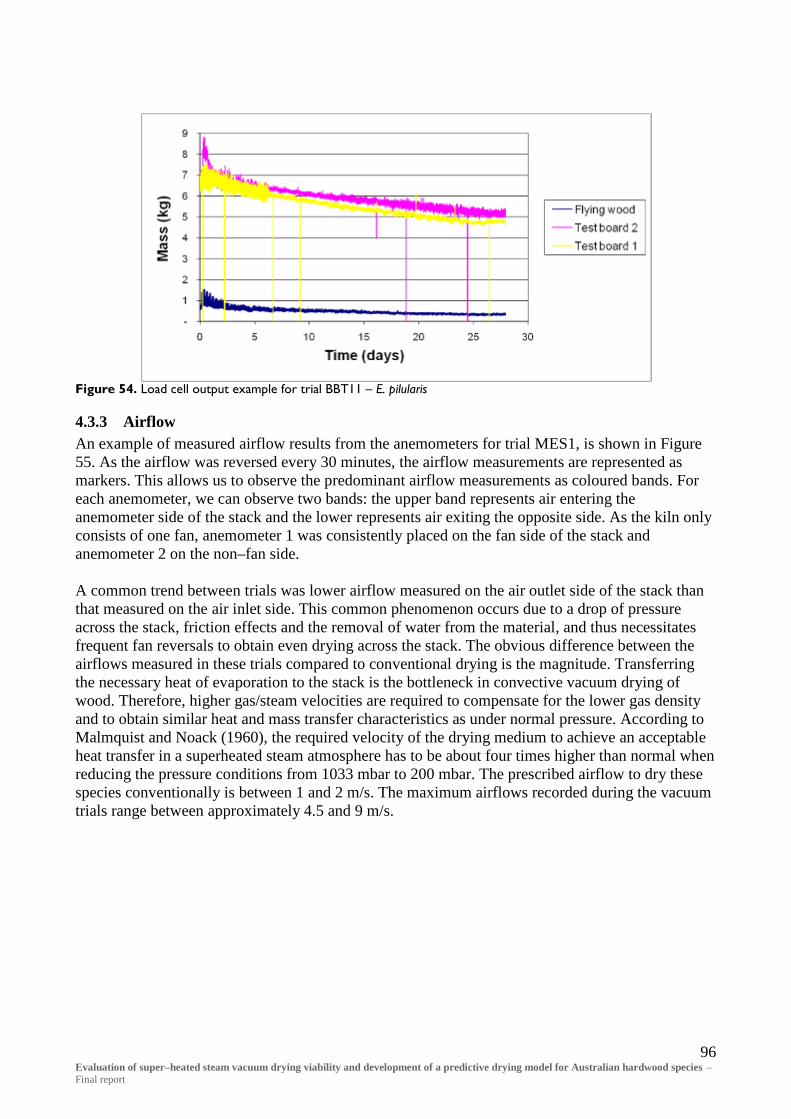
96 Evaluation of super–heated steam vacuum drying viability and development of a predictive drying model for Australian hardwood species – Final report
Figure 54. Load cell output example for trial BBT11 – E. pilularis
4.3.3 Airflow An example of measured airflow results from the anemometers for trial MES1, is shown in Figure 55. As the airflow was reversed every 30 minutes, the airflow measurements are represented as markers. This allows us to observe the predominant airflow measurements as coloured bands. For each anemometer, we can observe two bands: the upper band represents air entering the anemometer side of the stack and the lower represents air exiting the opposite side. As the kiln only consists of one fan, anemometer 1 was consistently placed on the fan side of the stack and anemometer 2 on the non–fan side. A common trend between trials was lower airflow measured on the air outlet side of the stack than that measured on the air inlet side. This common phenomenon occurs due to a drop of pressure across the stack, friction effects and the removal of water from the material, and thus necessitates frequent fan reversals to obtain even drying across the stack. The obvious difference between the airflows measured in these trials compared to conventional drying is the magnitude. Transferring the necessary heat of evaporation to the stack is the bottleneck in convective vacuum drying of wood. Therefore, higher gas/steam velocities are required to compensate for the lower gas density and to obtain similar heat and mass transfer characteristics as under normal pressure. According to Malmquist and Noack (1960), the required velocity of the drying medium to achieve an acceptable heat transfer in a superheated steam atmosphere has to be about four times higher than normal when reducing the pressure conditions from 1033 mbar to 200 mbar. The prescribed airflow to dry these species conventionally is between 1 and 2 m/s. The maximum airflows recorded during the vacuum trials range between approximately 4.5 and 9 m/s.

97 Evaluation of super–heated steam vacuum drying viability and development of a predictive drying model for Australian hardwood species – Final report
Figure 55. Airflow output example for trial MES1 – E. obliqua
4.3.4 Board temperature An example of measured thermocouple output is provided in Figure 56. The kiln temperature and EMC conditions are also shown, as the internal board temperature is dependent on both properties. It is interesting that in most cases the end temperature was noticeably lower than the 1/2 and 1/3 depth temperatures, suggesting that the ends of the boards were wetter than the centre. This seems to indicate a high degree of end drying when under vacuum and requires further investigation.
Figure 56. Thermocouple output example for trial JAR2 – E. marginata

98 Evaluation of super–heated steam vacuum drying viability and development of a predictive drying model for Australian hardwood species – Final report
4.4 Drying modelling - Measurement of essential wood properties
4.4.1 Wood density and initial MC The wood density and initial MC values used in the drying model are derived from the kiln drying trials described in section 4.1 Applied drying – Experimental drying trials.
4.4.2 Fibre porosity Plate 23 to Plate 26 show the ESEM images captured for each species at 700X magnification. We cropped the ESEM images taken at this magnification to contain only wood fibre cells excluding ray parenchyma and vessel cells, for fibre porosity measurements using Meshpore.
Plate 23. E. obliqua ESEM fibre image (700 X mag.)
Plate 24. E. marginata ESEM fibre image (700 X mag.)
Plate 25. E. pilularis ESEM fibre image (700 X mag.)
Plate 26. C. citriodora ESEM fibre image (700 X mag.)

99 Evaluation of super–heated steam vacuum drying viability and development of a predictive drying model for Australian hardwood species – Final report
A clear difference in fibre porosity, size, wall thickness and orientation is evident between species. For instance Corymbia citriodora is made up of fibres with very thick cell walls, and hence low porosity or lumen/wood tissue ratio, compared with Eucalyptus obliqua whose fibres have large lumens and thin cell walls. The cropped images were loaded into the Meshpore software and contours of the cell lumens were automatically generated for fibre porosity determination. Table 63 contains the fibre porosities and, measured, and calculated densities for each species sample. We measured distinct fibre porosity between species, as can be visually observed from ESEM images. Calculated density values were higher than the basic density values measured because the density calculation uses the published oven dry density of wood tissue and other voids were not taken into consideration such as vessels. Additionally, intra-wall voids could also contribute to a lesser extent. However, a strong correlation was observed between measured and calculated density (R2 = 0.973) as shown in Figure 57. Table 63 Average fibre porosity, measured and calculated density for each species
Species
Measured basic
density (kg/m3)
Calc density -
fibre (kg/m3)
Fibre porosity
E. obliqua 489.0 945 0.37E. marginata 635.9 1110 0.26E. pilularis 674.0 1080 0.28C. citriodora 921.0 1395 0.07
y = 1.040x + 425.496R2 = 0.973
600700800900
100011001200130014001500
400 500 600 700 800 900 1000
Measured density (kg/m3)
Calc
ulat
ed d
ensi
ty (k
g/m
3 )
Figure 57. Calculated versus basic density correlation
4.4.3 Gas permeability The average permeability results measured for each species in the longitudinal, radial and tangential directions are given in Table 64. The results highlight the dramatic anisotropy ratios of these species and the vast difference between species. As stated by Perré (2007a), “wood has dramatic anisotropy ratios: the longitudinal permeability can be 1000 times greater than the transverse permeability for softwoods, and more than 106 for hardwoods”. This is certainly the case for the species measured where the longitudinal to transverse anisotropy ratio was in the order of 107 for some species. No permeability values were measured for C. citriodora in the radial direction as, even after 24 hours, no noticeable measurement could be made indicating this species is highly impermeable in this direction (>10-23 m2). C. citriodora was the lowest permeability species measured, with the permeability order of the other species changing depending on wood direction.

100 Evaluation of super–heated steam vacuum drying viability and development of a predictive drying model for Australian hardwood species – Final report
After extensive literature review, very little work measuring gas permeability in all three directions has been conducted. For comparative purposes, Table 64 includes permeability data for the softwood Pinus taeda (Milota et al., 1995) and the hardwood Quercus falcata (Perré, 2007a). The gas permeability data for Quercus falcata was the lowest gas permeability for a hardwood species this author could find. The four species measured in this report were still at least a factor of 10 less permeable than the lowest published figure, demonstrating the high impermeability of Australian hardwoods. Table 64. L-R-T average permeability results for each species
Species E. obliqua E. marginata E. pilularis C. citriodoraPinus taeda
(Milota,1995)Quercus falcata
(Perré,2007)
Diameter (mm) 19.3 19.6 19.6 19.7
Length (mm) 17.6 17.3 16.8 17.0
Permeability (m2) 5.55E-14 6.74E-14 3.50E-14 7.65E-17 1.01E-05 6.90E-13
Diameter (mm) 74.4 73.9 74.6 74.3
Length (mm) 7.8 7.9 7.8 7.9
Permeability (m2) 8.60E-18 4.68E-20 1.44E-20 N/A 2.00E-07 N/A
Diameter (mm) 74.5 74.1 74.2 74.1
Length (mm) 8.0 8.0 7.8 8.0
Permeability (m2) 2.95E-19 4.41E-16 1.70E-20 3.44E-21 7.30E-08 N/A
L/R 6400 1440000 2440000 N/A 50 110000
L/T 189000 150.0 2060000 22000 140 143000
R/T 29.2 0.0001 0.846 N/A 2.74 1.3Aniso
trop
y ra
tios
Long
itudi
nal
Radi
alTa
ngen
tial
4.4.4 Bound water diffusion Figure 58 to Figure 61 show the evolution of mass loss per unit volume over time of radial, tangential and longitudinal disc samples for each species. As radial and tangential sample diameters were much larger than those in the longitudinal direction, and because the samples were of slight varying thickness the mass loss was ‘normalised’ by dividing by the mass loss per unit volume. Both figures show two distinctive groups of curves, one of small slopes and one of extensive bigger slopes. The big slope represents fluxes of water vapour in the longitudinal direction, and the small slopes through the radial and tangential directions. The vapour flux in all directions is markedly lower for C. citriodora than for E. obliqua, with the other species falling in between. This may be attributed to the vast anatomical and chemical differences between these species. We specifically chose these species for this research based on their highly diverse wood property, chemistry, anatomical and drying capabilities. Table 65 contains the measured diffusion coefficient results in the radial, tangential and longitudinal directions for each species. Average values are shown along with the direction ratios. Because three samples were used per species direction (labelled R1..R3, T1..T3 and L1.. L3 for the radial, tangential and longitudinal directions, respectively), standard deviation values are not included. C. citriodora diffusion coefficients were much lower in all directions compared with the other species, where E. obliqua was the highest. The R/T ratio of diffusion coefficient for C. citriodora was approximately 1:1 indicating low diffusion isotropy in this plane. This is evident in many other wood property ratios measured for this species in this report, such as

101 Evaluation of super–heated steam vacuum drying viability and development of a predictive drying model for Australian hardwood species – Final report
shrinkage and permeability. The converse is true for the other species where relatively higher isotropy has been encountered for the same parameters compared with C. citriodora. Again this is reflective of other wood properties measured for these species. The ratio of longitudinal diffusion to both radial and tangential directions is much greater for E. obliqua than C. citriodora, indicating E. obliqua’s greater propensity for drying in the longitudinal direction which may be advantageous during vacuum drying. Further work is planned to test this hypothesis by simulating drying in the longitudinal direction using Transpore 2-D.
0
50
100
150
0 5 10 15 20 25
L3L2L1T3T2T1R3R2R1
Time (days)
Mas
s lo
ss/v
olum
e (k
g/m
3 )
Figure 58. Evolution of bound water flux per unit volume with time in the R, T and L directions for E. obliqua
0
50
100
150
0 5 10 15 20 25
L3L2L1T3T2T1R3R2R1
Time (days)
Mas
s lo
ss/v
olum
e (k
g/m
3 )
Figure 59. Evolution of bound water flux per unit volume with time in the R, T and L directions for E. marginata
0
50
100
150
0 5 10 15 20
L3L2L1T3T2T1R3R2R1
Time (days)
Mas
s lo
ss/v
olum
e (k
g/m
3 )
Figure 60. Evolution of bound water flux per unit volume with time in the R, T and L directions for E.pilularis
0
50
100
150
0 5 10 15 20 25
L3L2L1T3T2T1R3R2R1
Time (days)
Mas
s lo
ss/v
olum
e (k
g/m
3 )
Figure 61. Evolution of bound water flux per unit volume with time in the R, T and L directions for C. citriodora
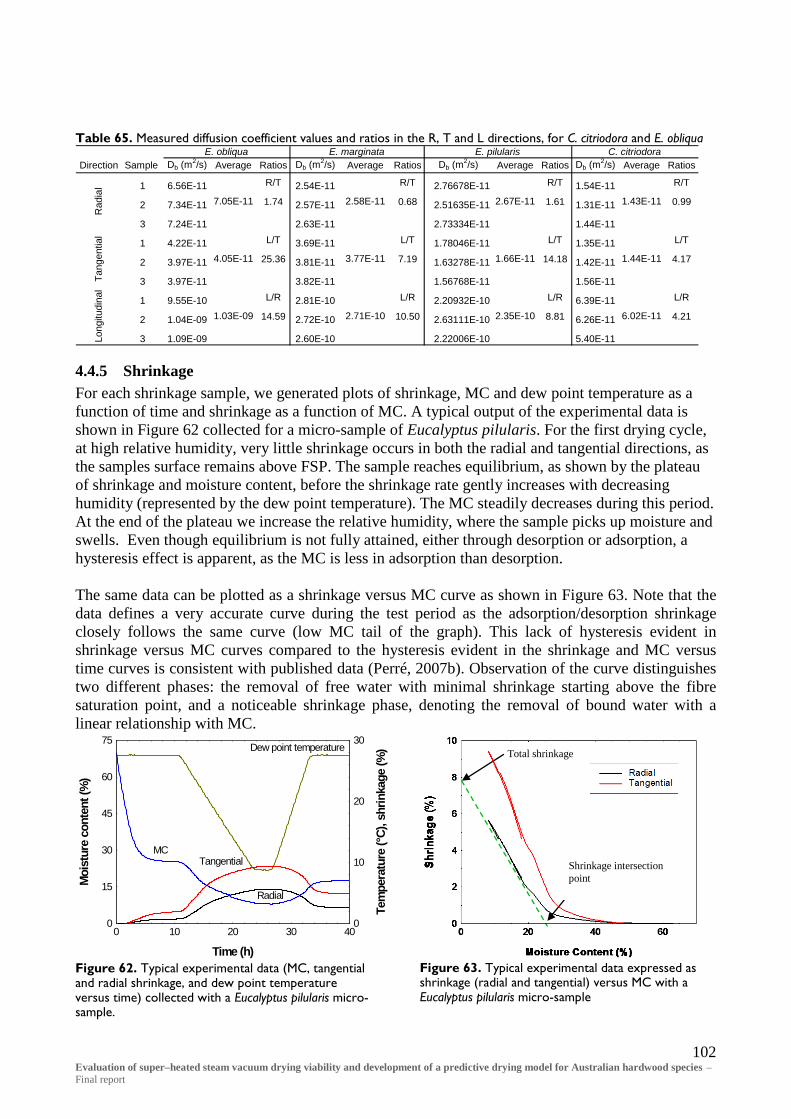
102 Evaluation of super–heated steam vacuum drying viability and development of a predictive drying model for Australian hardwood species – Final report
Table 65. Measured diffusion coefficient values and ratios in the R, T and L directions, for C. citriodora and E. obliqua
Direction Sample Db (m2/s) Average Ratios Db (m
2/s) Average Ratios Db (m2/s) Average Ratios Db (m
2/s) Average Ratios
1 6.56E-11 R/T 2.54E-11 R/T 2.76678E-11 R/T 1.54E-11 R/T
2 7.34E-11 1.74 2.57E-11 0.68 2.51635E-11 1.61 1.31E-11 0.99
3 7.24E-11 2.63E-11 2.73334E-11 1.44E-11
1 4.22E-11 L/T 3.69E-11 L/T 1.78046E-11 L/T 1.35E-11 L/T
2 3.97E-11 25.36 3.81E-11 7.19 1.63278E-11 14.18 1.42E-11 4.17
3 3.97E-11 3.82E-11 1.56768E-11 1.56E-11
1 9.55E-10 L/R 2.81E-10 L/R 2.20932E-10 L/R 6.39E-11 L/R
2 1.04E-09 14.59 2.72E-10 10.50 2.63111E-10 8.81 6.26E-11 4.21
3 1.09E-09 2.60E-10 2.22006E-10 5.40E-11
E. pilularis C. citriodora
1.43E-11
1.44E-11
2.67E-11
1.66E-11
E. marginataE. obliqua
1.03E-09 6.02E-112.35E-10
2.58E-11
3.77E-11
7.05E-11
Rad
ial
Tang
entia
lLo
ngitu
dina
l
2.71E-10
4.05E-11
4.4.5 Shrinkage For each shrinkage sample, we generated plots of shrinkage, MC and dew point temperature as a function of time and shrinkage as a function of MC. A typical output of the experimental data is shown in Figure 62 collected for a micro-sample of Eucalyptus pilularis. For the first drying cycle, at high relative humidity, very little shrinkage occurs in both the radial and tangential directions, as the samples surface remains above FSP. The sample reaches equilibrium, as shown by the plateau of shrinkage and moisture content, before the shrinkage rate gently increases with decreasing humidity (represented by the dew point temperature). The MC steadily decreases during this period. At the end of the plateau we increase the relative humidity, where the sample picks up moisture and swells. Even though equilibrium is not fully attained, either through desorption or adsorption, a hysteresis effect is apparent, as the MC is less in adsorption than desorption. The same data can be plotted as a shrinkage versus MC curve as shown in Figure 63. Note that the data defines a very accurate curve during the test period as the adsorption/desorption shrinkage closely follows the same curve (low MC tail of the graph). This lack of hysteresis evident in shrinkage versus MC curves compared to the hysteresis evident in the shrinkage and MC versus time curves is consistent with published data (Perré, 2007b). Observation of the curve distinguishes two different phases: the removal of free water with minimal shrinkage starting above the fibre saturation point, and a noticeable shrinkage phase, denoting the removal of bound water with a linear relationship with MC.
0
15
30
45
60
75
0 10 20 30 400
10
20
30
Tangential
Radial
MC
Dew point temperature
Time (h)
Moi
stur
e co
nten
t (%
)
Tem
pera
ture
(°C)
, shr
inka
ge (%
)
Figure 62. Typical experimental data (MC, tangential and radial shrinkage, and dew point temperature versus time) collected with a Eucalyptus pilularis micro-sample.
Total shrinkage
Shrinkage intersection point
Figure 63. Typical experimental data expressed as shrinkage (radial and tangential) versus MC with a Eucalyptus pilularis micro-sample

103 Evaluation of super–heated steam vacuum drying viability and development of a predictive drying model for Australian hardwood species – Final report
Similar plots resulted for all species, except original 1 mm thick micro-samples of E. obliqua, which showed abnormal shrinkage occurring at high MC due to cell collapse during free water removal (Figure 64). E obliqua is a renowned collapse prone species (Bootle, 2004). The radial and tangential shrinkage begins very soon after drying commences and increases abnormally down to 20-40 % MC. At this point the collapse shrinkage slows down as the sample reaches the bound water domain. In the domain of bound water, normal shrinkage takes place (< 20 % MC). Only this part of the shrinkage is recovered when the sample re-absorbs water. The E. obliqua collapse results observed are consistent with results observed by Perré (2007b) for E. gundal (E. gunnii x dalrympleana). This author theorised that it may be possible to avoid collapse shrinkage during shrinkage tests for this species by cutting thinner R-T sections in the longitudinal direction. Dadswell (1972), observed the range of fibre length of E. obliqua is between 1.04-1.27 mm Thus, by reducing the dimension of samples to less than 0.6 mm thickness, the majority of wood fibres will be severed. A cut fibre will not collapse as tension of the cell wall will not be set up if the ends of the fibres are not whole (Redman, 2001).
0
5
10
15
20
0 20 40 60 80 100 120 140
RadialTangential
Moisture Content (%)
Shrin
kage
(%)
Collapse
Figure 64. Excessive shrinkage caused by collapse Tangential and radial shrinkage versus MC – E. obliqua original 1 mm thick sample
0
4
8
12
0 20 40 60 80 100 120 140 160
TangentialRadial
Moisture Content (%)
Shrin
kage
(%)
Figure 65. Tangential and radial shrinkage versus MC – E. obliqua 2 mm thick sample
0
4
8
12
0 20 40 60 80 100 120 140 160
TangentialRadial
Moisture Content (%)
Shrin
kage
(%)
Figure 66. Tangential and radial shrinkage versus MC – E. obliqua 1 mm thick sample
0
2
4
6
8
10
0 20 40 60 80 100 120 140 160
TangentialRadial
Moisture Content (%)
Shrin
kage
(%)
Figure 67. Tangential and radial shrinkage versus MC – E. 0.5 mm thick sample

104 Evaluation of super–heated steam vacuum drying viability and development of a predictive drying model for Australian hardwood species – Final report
To test this theory, 2, 1 and 0.5 mm thick R-T sections were prepared and retested. The results can be observed in Figure 65 to Figure 67. By observation, collapse shrinkage during testing is reduced with decreasing sample thickness so that no obvious collapse shrinkage is present for the 0.5 mm sample. The shrinkage intersection point (also referred to as the fibre saturation point) and total shrinkage can be calculated from the shrinkage versus MC curve by subtending the linear portion of the curve, in the bound water/shrinkage phase, until it intersects the x and y axis (Figure 63). We calculated the shrinkage at 12 %, a common published quantification of shrinkage, from the equation of the subtended line. Calculations occurred on the 1 mm thick samples for species C. citriodora, E. marginata and E. pilularis, and to avoid collapse shrinkage, on the 0.5 mm E. obliqua samples. Table 66 provides the total shrinkage, intersection point and shrinkage at 12% for each species. Published intersection point and 12% MC shrinkage values are also included, where the published intersection point data is from Budgen (1981) and the shrinkage values at 12 % MC are from Bootle (2005). No published intersection point values were available for Eucalyptus marginata or Eucalyptus obliqua. Radial and tangential shrinkage curves for all species can be observed in Figure 68 and Figure 69. Measured intersection point, total shrinkage and 12% MC shrinkage are consistent within species providing good repeatability. Published intersection point and 12% MC shrinkage values are consistent with measured data. Shrinkage values vary greatly between the tangential and radial directions as expected. Moreover, shrinkage values between species differ due to variations in physical and chemical properties. This seems particularly true for C. citriodora where the R/T shrinkage ratio at 12% MC is almost 1:1, significantly different from other species. Thus, in terms of shrinkage this species is more isotropic compared with the others tested.
0
2
4
6
8
10
0 20 40 60 80 100
E. obliquaE. pilularisE. marginataC. citriodora
Moisture content (%)
Shrin
kage
(%)
Figure 68. Radial shrinkage versus MC – all species
0
2
4
6
8
10
0 20 40 60 80 100
E. obliquaE. pilularisE. marginataC. citriodora
Moisture content (%)
Shrin
kage
(%)
Figure 69. Tangential shrinkage versus MC – all species
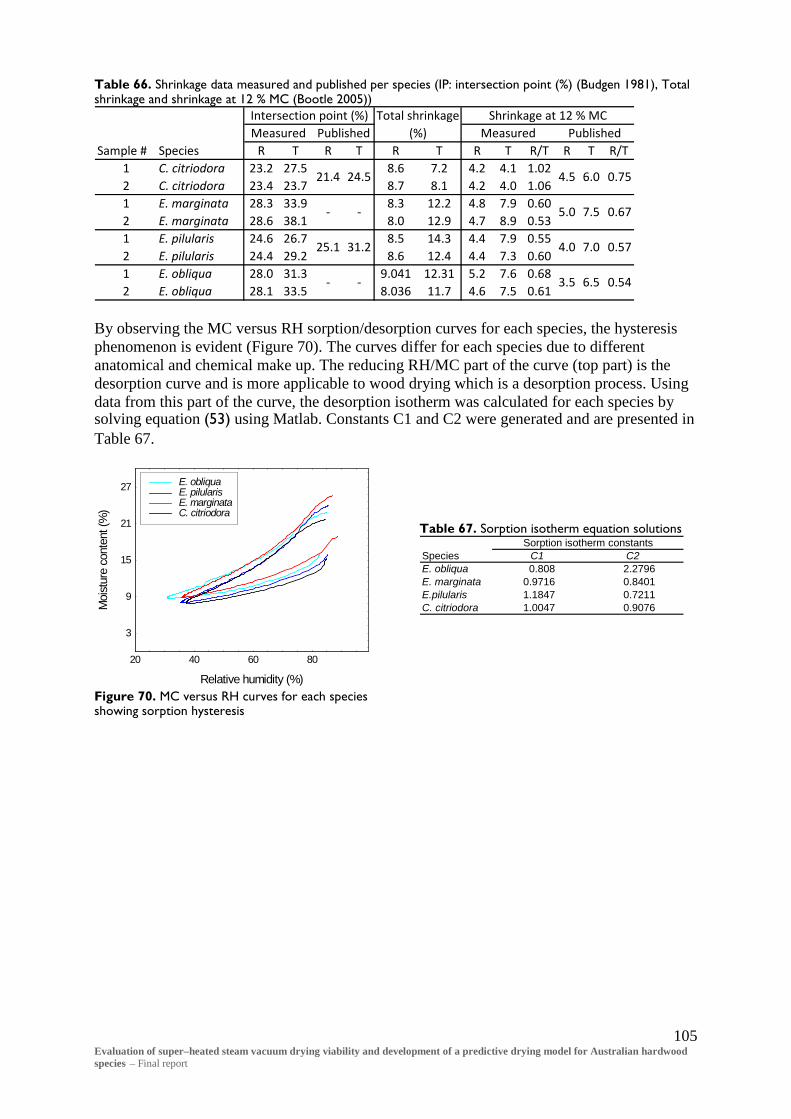
105 Evaluation of super–heated steam vacuum drying viability and development of a predictive drying model for Australian hardwood species – Final report
Table 66. Shrinkage data measured and published per species (IP: intersection point (%) (Budgen 1981), Total shrinkage and shrinkage at 12 % MC (Bootle 2005))
Sample # Species R T R T R T R T R/T R T R/T1 C. citriodora 23.2 27.5 8.6 7.2 4.2 4.1 1.022 C. citriodora 23.4 23.7 8.7 8.1 4.2 4.0 1.061 E. marginata 28.3 33.9 8.3 12.2 4.8 7.9 0.602 E. marginata 28.6 38.1 8.0 12.9 4.7 8.9 0.531 E. pilularis 24.6 26.7 8.5 14.3 4.4 7.9 0.552 E. pilularis 24.4 29.2 8.6 12.4 4.4 7.3 0.601 E. obliqua 28.0 31.3 9.041 12.31 5.2 7.6 0.682 E. obliqua 28.1 33.5 8.036 11.7 4.6 7.5 0.61
31.2 4.0
3.5 6.5
7.0
7.5
- -
- -
25.1
6.021.4 24.5
Measured Published
5.0
0.75
0.67
0.57
0.54
Intersection point (%) Total shrinkage (%) Measured Published
Shrinkage at 12 % MC
4.5
By observing the MC versus RH sorption/desorption curves for each species, the hysteresis phenomenon is evident (Figure 70). The curves differ for each species due to different anatomical and chemical make up. The reducing RH/MC part of the curve (top part) is the desorption curve and is more applicable to wood drying which is a desorption process. Using data from this part of the curve, the desorption isotherm was calculated for each species by solving equation (53) using Matlab. Constants C1 and C2 were generated and are presented in Table 67.
3
9
15
21
27
20 40 60 80
E. obliquaE. pilularisE. marginataC. citriodora
Relative humidity (%)
Moi
stur
e co
nten
t (%
)
Figure 70. MC versus RH curves for each species showing sorption hysteresis
Table 67. Sorption isotherm equation solutions
Species C1 C2E. obliqua 0.808 2.2796E. marginata 0.9716 0.8401E.pilularis 1.1847 0.7211C. citriodora 1.0047 0.9076
Sorption isotherm constants

4.5 Drying modelling - Vacuum drying modelling At the time of running model simulations, not all vacuum drying trials were completed. For model validation, one vacuum drying trial was chosen per species. We chose the trial that, to date, had produced the best-dried quality outcome in the quickest drying time (most optimised). The vacuum drying trials chosen were the E. obliqua trial MES8, C. citriodora trial SPG9, E. marginata trial JAR10 and E. pilularis trial BBT11.
4.5.1 Input parameters The static (scalar) input simulation parameters are presented in Table 68. Most input parameters have been measured as part of this project and are reported here in sections 4.1 Applied drying – Experimental drying trials and 4.3 Drying modelling - Measurement of kiln conditions and wood drying properties. We have calculated some parameters via theory as discussed in section 3.5 Drying modelling - Vacuum drying modelling. The liquid phase absolute permeabilities were calculated the same as measured gas phase absolute permeabilites, due to the lack of pit aspiration in hardwoods. We presumed the initial wood temperature based on average Queensland climatic conditions prior to drying. Table 68. Measured and calculated model input static wood property and drying condition data
Corymbia citriodora Eucalyptus marginata Eucalyptus pilularis Eucalyptus obliqua Measured Static Wood Properties and Drying Conditions (spotted gum) (jarrah) (blabkbutt) (messmate) Calculated Wood density 859 kg m3 695 833 576 Porosity 0.07 0.26 0.28 0.37 Radial direction Absolute PermeabilitiesGas phase 1.0 x 10⁻²² m2 4.9 x 10⁻²⁰ m2 1.4 x 10⁻²⁰ m2 8.6 x 10⁻¹⁸ m2
Liquid phase 1.0 x 10⁻²² m2 4.9 x 10⁻²⁰ m2 1.4 x 10⁻²⁰ m2 8.6 x 10⁻¹⁸ m2 Tangential direction Absolute permeabilitesGas phase 3.4 x 10⁻²¹ m2 4.4 x 10⁻¹⁶ m2 1.7 x 10⁻²⁰ m2 2.9 x 10⁻¹⁹ m2
Liquid phase 3.4 x 10⁻²¹ m2 4.4 x 10⁻¹⁶ m2 1.7 x 10⁻²⁰ m2 2.9 x 10⁻¹⁹ m2 Initial moisture content 31.9 % 62.1% 51.1% 84.9 % Fibre saturation point 23.3 % 24.5% 24.5% 31.4 % Initial temperature 25 °C 25 °C 25 °C 25 °C Wood cross-section 100 mm x 28 mm 113 mm x 31 mm 113 mm x 28 mm 110 mm x 30 mm Direction Width (T) x Thickness (R) Width (T) x Thickness (R) Width (T) x Thickness (R) Width (R) x Thickness (T)Sorption isotherm parameters (equation 22) C1 = 1.0047 C2 = 0.9076 C1 = 0.9716 C2 = 0.8401 C1 = 1.1847 C2 = 0.7211 C1 = 0.808 C2 = 2.2796 Dynamic drying condition and wood property data, expressed as equations and associated polynomial parameters are shown in Table 69. We derived these equations by fitting curves to measured kiln and wood property data using TableCurve 2-D curve fitting software. We measured wood properties from single board samples during kiln drying trials where global kiln drying conditions were also measured. Drying trials and associated wood property measurements are detailed previously in this report.

107 Evaluation of super–heated steam vacuum drying viability and development of a predictive drying model for Australian hardwood species – Final report
Table 69. Dynamic model input drying condition and wood property equations and parameters
Species Equation (x = time (days)) a b c d e f g h i j kKiln Drying Conditions (y)Kiln dry-bulb temperature (°C) y = (a+cx+ex2+gx3+ix4)/(1+bx+dx2+fx3+hx4+jx5) 25.09824 1.050118 175.7577 -13.11334 -942.8711 25.64237 1686.637 -1.759628 -96.41856 0.00939
Kiln wet-bulb termperature (°C) y = (a+cx+ex2+gx3+ix4+kx5)/(1+bx+dx2+fx3+hx4+jx5) 24.10899 -1.946256 2.446867 2.480538 16.63163 2.134097 186.7808 -0.437323 -36.75123 0.022864 1.989112
Kiln pressure (mbar) y = (a+cx+ex2+gx3+ix4+kx5)/(1+bx+dx2+fx3+hx4+jx5) 72.0981 -0.336344 96.36251 -1.488453 -311.5401 3.155001 437.9089 -0.977339 -128.7287 0.083329 10.78346
Vapour pressure (mbar) y = (a+bx0.5+cx+dx1.5+ex2+fx2.5+gx3+hx3.5+ix4+jx4.5+kx5) 9.291708 734.1874 -7577.285 29998.4 -57435.44 62529.5 -41624.61 17303.38 -4390.019 622.497 -37.83447Air velocity (m s-1) y = (a+cx+ex2+gx3+ix4+kx5)/(1+bx+dx2+fx3+hx4+jx5) 3.430585 -2.789865 -9.835245 3.049291 11.4533 -0.724218 -2.273578 0.149094 0.355187 -0.009667 -0.021258Measured wood properties (y)Moisture content (%) y = (a+cx+ex2+gx3+ix4+kx5)/(1+bx+dx2+fx3+hx4+jx5) 31.80614 28.49166 840.0826 -33.69939 -898.1737 36.94318 996.4027 -2.050704 -114.6033 0.179011 5.265619
Core temperature (°C) y = (a+cx+ex2+gx3+ix4)/(1+bx+dx2+fx3+hx4+jx5) 19.73979 -1.0289 83.06063 -4.447864 -470.0424 15.39768 1046.283 -0.800037 -48.7236 -0.006134
1/3 thickness temperature (°C) y = (a+cx+ex2+gx3+ix4)/(1+bx+dx2+fx3+hx4+jx5) 19.46381 -0.977005 86.03428 -4.700255 -484.8206 16.01669 1082.206 -0.879266 -52.83295 -0.004908
End temperature (°C) y = (a+cx+ex2+gx3+ix4)/(1+bx+dx2+fx3+hx4+jx5) 19.40364 -1.843058 53.78382 -2.239272 -369.3902 11.1985 792.8363 -0.722616 -52.35535 -0.008219Kiln Drying Conditions (y)Kiln dry-bulb temperature (°C) y = (a+c0.5x+ex+gx1.5+ix2)/(1+bx0.5+dx+fx1.5+hx2+jx2.5) 24.98261 -2.162479 -50.09957 2.82762 84.94561 -1.127095 -32.67566 0.161873 3.593319 -0.006482Kiln wet-bulb termperature (°C) y = (a+c0.5x+ex+gx1.5+ix2)/(1+bx0.5+dx+fx1.5+hx2) 18.70169 -1.987647 -41.70276 3.713938 130.4141 -1.387433 -52.36977 0.145114 5.652007Kiln pressure (mbar) y = (a+cx+ex2+gx3)/(1+bx+dx2+fx3) 801.1691 412.2433 67964.77 1506.816 160194.6 -56.76526 -5748.158Vapour pressure (mbar) y = (a+c0.5x+ex+gx1.5+ix2)/(1+bx0.5+dx+fx1.5+hx2) 13.86692 -2.442183 -52.47841 3.611502 148.8812 -1.284182 -59.51057 0.131855 6.448573Air velocity (m s-1) y = (a+bx+cx2+dx3+ex4+fx5+gx6+hx7+ix8+jx9+kx10) 2.378729 1.908323 -1.59325 0.654172 -0.156185 0.022924 -0.002135 0.000127 -4.63E-06 9.51E-08 -8.41E-10Measured wood properties (y)Moisture content (%) y = (a+c0.5x+ex+gx1.5+ix2+kx2.5)/(1+bx0.5+dx+fx1.5+hx2+jx2.5) 63.92859 -0.03847 -29.30539 1.235045 198.1811 0.453928 -87.11208 -0.385634 12.64633 0.073612 -0.343617Core temperature (°C) y = (a+c0.5x+ex+gx1.5+ix2)/(1+bx0.5+dx+fx1.5+hx2+jx2.5) 20.29554 -2.492598 -51.82349 3.34581 91.78403 -1.335406 -35.07264 0.193227 3.819816 -0.0080321/3 thickness temperature (°C) y = (a+c0.5x+ex+gx1.5+ix2)/(1+bx0.5+dx+fx1.5+hx2+jx2.5) 20.35059 -2.410237 -48.64503 3.128427 83.19301 -1.248507 -31.72462 0.182967 3.461281 -0.007872End temperature (°C) y = (a+c0.5x+ex+gx1.5+ix2)/(1+bx0.5+dx+fx1.5+hx2+jx2.5) 21.44466 -2.405978 -51.38488 3.035166 82.31327 -1.196646 -30.92135 0.173356 3.347669 -0.007307Kiln Drying Conditions (y)Kiln dry-bulb temperature (°C) y = (a+bx0.5+cx+dx1.5+ex2+fx2.5+gx3+hx3.5+ix4+jx4.5+kx5) 21.05758 13.30673 152.2667 -331.9183 307.6886 -155.0254 44.49284 -6.818755 0.37742 0.025953 -0.003153Kiln wet-bulb termperature (°C) y = (a+bx0.5+cx+dx1.5+ex2+fx2.5+gx3+hx3.5+ix4+jx4.5) 16.15641 -1.905191 201.0087 -389.146 347.0033 -175.4021 53.21503 -9.605924 0.951297 -0.039785Kiln pressure (mbar) y = (a+c0.5x+ex+gx1.5+ix2+kx2.5)/(1+bx0.5+dx+fx1.5+hx2+jx2.5) 839.991 -8.177421 12372.89 575.2753 45762.35 -202.9122 -12942.22 -8.184022 -3217.716 5.906387 864.4798Vapour pressure (mbar) y = (a+bx0.5+cx+dx1.5+ex2+fx2.5+gx3+hx3.5+ix4+jx4.5+kx5) 9.128715 -57.66021 714.3979 -1404.159 1335.73 -737.0472 250.8548 -53.20044 6.802226 -0.474981 0.013692Air velocity (m s-1) y = (a+bx0.5+cx+dx1.5+ex2+fx2.5+gx3+hx3.5+ix4+jx4.5+kx5) 0.845786 12.90853 -37.63956 56.49159 -49.91481 27.71855 -9.937955 2.292074 -0.32757 0.026332 -0.000908Measured wood properties (y)Moisture content (%) y = (a+cx+ex2+gx3+ix4+kx5)/(1+bx+dx2+fx3+hx4+jx5) 45.97011 -1.319588 12.28071 3.357489 53.76897 -3.411007 -115.7957 1.347183 61.24097 0.005839 -1.545558Core temperature (°C) y = (a+bx0.5+cx+dx1.5+ex2+fx2.5+gx3+hx3.5+ix4+jx4.5+kx5) 15.13088 -0.24611 208.9832 -410.1061 366.1623 -182.6865 53.44872 -8.865936 0.698079 -0.004702 -0.0018291/3 thickness temperature (°C) y = (a+bx0.5+cx+dx1.5+ex2+fx2.5+gx3+hx3.5+ix4+jx4.5+kx5) 15.27078 0.265127 208.696 -413.0716 372.1457 -187.8926 55.97127 -9.593253 0.822149 -0.016266 -0.001375End temperature (°C) y = (a+c0.5x+ex+gx1.5+ix2+kx2.5)/(1+bx0.5+dx+fx1.5+hx2+jx2.5) 23.20409 -4.90975 -133.9207 11.98187 410.3478 -12.84521 -496.0257 -0.935833 -48.31736 7.634354 325.9037Kiln Drying Conditions (y)Kiln dry-bulb temperature (°C) y = (a+cx+ex2+gx3+ix4+kx5)/(1+bx+dx2+fx3+hx4+jx5) 21.47429 1.745346 106.8552 0.222473 -1.564722 0.185306 9.793311 -0.012064 -0.612716 0.000191 0.009712
Kiln wet-bulb termperature (°C) y = (a+bx0.5+cx+dx1.5+ex2+fx2.5+gx3+hx3.5+ix4+jx4.5+kx5) 9.389815 62.96826 -58.88654 73.61364 -94.45603 72.77886 -32.49599 8.636393 -1.352226 0.115275 -0.004128
Kiln pressure (mbar) y = (a+cx+ex2+gx3+ix4)/(1+bx+dx2+fx3+hx4) 968.4289 64.32669 -379.3608 439.0992 64716.55 703.9622 77553.55 -19.82232 -2167.794
Vapour pressure (mbar) y = (a+bx0.5+cx+dx1.5+ex2+fx2.5+gx3+hx3.5+ix4+jx4.5+kx5) 5.704617 2.930675 220.143 -304.7634 165.8306 -31.71577 -6.737982 4.710827 -0.993972 0.097387 -0.003748Air velocity (m s-1) y = (a+bx0.5+cx+dx1.5+ex2+fx2.5+gx3+hx3.5+ix4+jx4.5+kx5) -0.329015 6.056036 0.105299 -5.694899 4.888553 -2.295708 0.755026 -0.180409 0.028826 -0.002653 0.000104Measured wood properties (y)Moisture content (%) y = (a+cx+ex2+gx3+ix4+kx5)/(1+bx+dx2+fx3+hx4+jx5) 83.61987 -0.332453 -27.52798 0.061815 4.363248 -0.007955 -0.490151 0.00052 0.034693 -3.81E-06 -0.000612
Core temperature (°C) y = (a+bx0.5+cx+dx1.5+ex2+fx2.5+gx3+hx3.5+ix4+jx4.5+kx5) 19.63436 -48.68867 271.4879 -395.8346 289.4552 -122.624 31.45223 -4.826372 0.40935 -0.015044 3.57E-05
1/3 thickness temperature (°C) y = (a+bx0.5+cx+dx1.5+ex2+fx2.5+gx3+hx3.5+ix4+jx4.5+kx5) 19.05202 -45.41257 263.9339 -386.259 281.9648 -118.5271 29.84978 -4.402655 0.339555 -0.008674 -0.000209
End temperature (°C) y = (a+bx0.5+cx+dx1.5+ex2+fx2.5+gx3+hx3.5+ix4+jx4.5+kx5) 21.43497 -46.60472 242.7319 -334.966 227.0317 -85.32288 17.60166 -1.588135 -0.053979 0.021981 -0.001229
Euca
lypt
us o
bliq
ua (m
essm
ate)
Equation parameters
Euca
lypt
us m
argi
nata
(jar
rah)
Cory
mbi
a ci
trio
dora
(spo
tted
gum
)Eu
caly
ptus
pilu
laris
(bla
ckbu
tt)

108 Evaluation of super–heated steam vacuum drying viability and development of a predictive drying model for Australian hardwood species – Final report
4.5.2 Simulations
Mesh generation We conducted drying simulations using symmetrical, structured, triangular meshes (Figure 71). For each species we used actual board dimensions to generate the mesh circumferential geometry. To provide rapid throughput when optimising the vacuum drying schedules, the code was run on the Queensland University of Technology (QUT) High Performance Computer (HPC) system. The model was optimised to enable efficient simulations via funds obtained from QCIF. The Matlab code has been optimised/ ported by the HPC group at QUT to ensure peak performance on the HPC system. Code profiling identified a core function (the finite volume wood physics function) that when recoded in a high level language to take advantage of the Intel Compiler led to approximately a 15-fold speedup in computation time. We performed simulations using an Intel Dual Core T7300 processor using Matlab version 2008a. CPU convergence (completion) times for each species after optimisation are shown in Table 70. Simulation convergences are considered fast for this type of modelling, where simulations converged within at most a short number of minutes.
Width
Thickness
Figure 71. 516 element symmetrical, triangular, structured mesh used for simulations. Table 70. CPU convergence times (after optimisation)
Species CPU convergence time (s)C. citriodora 39E. marginata 242E. pilularis 58E. obliqua 146
Vacuum drying simulation results Due to the large number of simulation outputs and similar results achieved between species, the model optimisation discussed below uses C. citriodora as an example for visual representation. A summary of important model outputs (figures and tables) is provided for all species towards the end of this section. An example of the moisture content (MC), pressure and temperature field’s visual simulations computed using Transpore-2D at 0, 16, 50, 100 and 225 hours is shown for C. citriodora (spotted gum) in Figure 72. As permeability values measured for each species are very low, drying is predominately driven by diffusion, hence the steep moisture gradients set-up during drying. The pressure gradient for C. citriodora was more pronounced than the other species as

109 Evaluation of super–heated steam vacuum drying viability and development of a predictive drying model for Australian hardwood species – Final report
C. citriodora is dried at much higher temperatures and has the lowest permeability and diffusivity.

110 Evaluation of super–heated steam vacuum drying viability and development of a predictive drying model for Australian hardwood species – Final report
0 hrs
16 hrs
50 hrs
100 hrs
225 hrs
Figure 72. Transpore 2-D moisture content, temperature and pressure fields calculated at 0, 16, 50, 100 and 225 hrs for C. citriodora

111 Evaluation of super–heated steam vacuum drying viability and development of a predictive drying model for Australian hardwood species – Final report
Figure 73 shows a simulation result example for C. citriodora, using the input parameters provided in Table 68 and Table 69. For initial simulations, we used calculated diffusion coefficients for each species (equations (59) to (63)), because we had not yet measured diffusion coefficients we can observe that the simulated MC core results approach the final target MC much earlier than for the experimental results. Additionally, it appears that a rapid drop in simulated core MC is evident during the early stage of drying, up to approximately 16 hours, which is not replicated by experimental results. It can be observed from the simulated MC fields that, after 16 hours, a steep moisture gradient has been achieved affecting the first few millimetres into the thickness of the boards (Figure 73).
0
0.1
0.2
0.3
0.4
0 50 100 150 200 250
Model - surfaceModel - coreExperiment - core
Time (hrs)
Moi
stur
e co
nten
t (%
/%)
Figure 73. Transpore 2-D moisture content simulation results for C. citriodora using theoretical diffusion coefficient and unadjusted MC It was postulated, that the experimental boards may already have suffered a level of surface drying during the sawing, transportation, grading and kiln stacking processes, thus not entering the kiln in a saturated condition (at least at the surface). We confirmed this from the most recent C. citriodora drying trial (SPG3), where, just prior to the boards entering the kiln, a sample board section was sliced into approximately 1 mm sections through the thickness and MC gradient measured, the results of which are shown in Figure 74. Figure 75 shows the simulated MC gradient for C. citriodora after 16 hours drying. After this period, the simulated MC gradient is similar to that shown in Figure 74.
0
5
10
15
20
25
30
35
40
0 2 4 6 8 10 12 14 16 18 20 22 24 26 28 30
Moi
stur
e co
nten
t (%
)
Thickness (mm)
Figure 74. Measured initial moisture content gradient of spotted gum sample board immediately prior to vacuum kiln drying
Figure 75. Simulated moisture content gradient for C. citriodora after 16 hours drying
To allow for this discrepancy, the initial MC for each species was increased for the second round of simulations, so that after 16 hours, the simulated and experimental core MC values were the same. Although not shown here, the final simulated core MC values for each species still approached the target final MC earlier than the experimental result. After testing the

112 Evaluation of super–heated steam vacuum drying viability and development of a predictive drying model for Australian hardwood species – Final report
sensitivity of all the drying ‘driving force’ parameters (porosity, permeability etc.) we concluded that the diffusion coefficient was by far the most sensitive in regards to the moisture content and pressure simulated outputs. This conclusion led to the comparison of the measured diffusion coefficients with those calculated during the simulations. We did this by calculating the radial and tangential diffusion coefficients under the same temperature and humidity conditions that we measured diffusion coefficients. Table 71 shows the measured and calculated diffusion coefficient results and measured/calculated ratios for each species. Due to differing cutting patterns for each species only the radial diffusion coefficients for C. citriodora, E. marginata, and E. pilularis and tangential coefficients for E. obliqua were analysed, where the direction for each species pertains to perpendicular drying to the wide board face; the predominant drying direction. The results indicate that, except for E. pilularis a discrepancy exists between the measured and calculated diffusion coefficients, where the measured values are approximately 50 to 70% lower than the calculated values depending on the species. The reason for this discrepancy requires further investigation, however personal communication with Perrè (2010) suggests that extractive content could be a significant factor. Table 71. Measured and calculated diffusion coefficient results under the same environmental conditions
Measured Calculated RatioC. citriodora 1.43E-11 2.63E-11 0.54E. marginata 2.58E-11 4.78E-11 0.54E. pilularis 2.67E-11 2.62E-11 1.02E. obliqua 4.08E-11 6.96E-11 0.59
Diffusion Coefficient (m2/s)
We established that by correcting the diffusion coefficient calculations, using the ratios shown in Table 71, simulated and experimental core MC outputs more closely matched for each species. The correction factor was achieved by simply multiplying the tangential and radial macroscopic diffusivities described in the model by the corresponding correction ratio for each species, effectively correcting the calculated values. Figure 76 shows an example of the MC simulation results for C. citriodora after the MC correction and using the diffusion coefficient corrections. A close match of MC core simulated and experimental outputs resulted.
0
0.1
0.2
0.3
0.4
0 50 100 150 200 250
Model - surfaceModel - coreExperiment - core
Time (hrs)
Moi
stur
e co
nten
t (%
/%)
Figure 76. Transpore 2-D moisture content simulation results for C. citriodora using measured diffusion coefficient and adjusted MC

113 Evaluation of super–heated steam vacuum drying viability and development of a predictive drying model for Australian hardwood species – Final report
For subsequent simulations a pre-drying phase was introduced to accommodate the initial MC gradient set-up before drying, as previously described. Essentially, the pre-drying phase begins with cross-sections with no initial gradient, but with the previously established shifted initial average core MC. The simulation is then run under constant, mild drying conditions until the average cross-sectional MC reaches the experimental initial average MC, thus setting up a gradient in the cross-section reflecting the condition of material immediately prior to drying. The pre-drying conditions used were: 25 °C dry-bulb temperature, 20 °C wet-bulb temperature, 2 m/s airflow and ambient pressure (1 bar). After the pre-drying phase, the simulation automatically ‘restarts’ using the experimental drying conditions and the MC field established at the finalisation of the pre-drying phase. The MC simulation results validated against the actual trial drying curves are presented in Figure 77 to Figure 80 and Table 72 for each species. The use of the pre-drying phase on matching the MC core simulated and experimental results shows a higher degree of accuracy than previous simulations. Additionally, the incorporation of a pre-drying phase reflects the actual situation during the start of industrial wood drying whereby a degree of MC gradient exists in board cross-sections.
0
0.1
0.2
0.3
0.4
0 50 100 150 200 250
Model - surfaceModel - coreExperiment - core
Time (hrs)
Moi
stur
e co
nten
t (%
/%)
Figure 77. Transpore 2-D moisture content simulation results for C. citriodora using measured diffusion coefficient and pre-drying phase
0
0.2
0.4
0.6
0.8
0 200 400 600
Model - surfaceModel - coreExperiment - core
Time (hrs)
Moi
stur
e co
nten
t (%
/%)
Figure 78. Transpore 2-D moisture content simulation results for E. marginata using measured diffusion coefficient and pre-drying phase
0
0.2
0.4
0.6
0.8
0 200 400 600
Model - surfaceModel - coreExperiment - core
Time (hrs)
Moi
stur
e co
nten
t (%
/%)
Figure 79. Transpore 2-D moisture content simulation results for E.pilularis using measured diffusion coefficient and pre-drying phase
0
0.2
0.4
0.6
0.8
1.0
0 200 400 600 800 1000
Model - surfaceModel - coreExperiment - core
Time (hrs)
Moi
stur
e co
nten
t (%
/%)
Figure 80. Transpore 2-D moisture content simulation results for E.obliqua using measured diffusion coefficient and pre-drying phase

114 Evaluation of super–heated steam vacuum drying viability and development of a predictive drying model for Australian hardwood species – Final report
Table 72. Simulation and experimental time comparisons versus MC
MC (%) Model Experiment Model Experiment Model Experiment Model Experiment50 ------- ------- 104 87 32 39 297 20330 15 14 230 247 264 239 570 53820 75 78 326 405 459 419 717 72615 132 139 410 461 558 536 787 79011 197 216 548 535 610 588 815 831
Drying time (hrs)C. citriodora E. marginata E. pilularis E. obliqua
Conventional drying simulation results Using adjusted (measured) diffusion coefficient values, a simulation of conventionally drying C. citriodora was undertaken. The kiln drying schedule (dry and wet-bulb temperatures) was provided by Dale and Meyers sawmill, Queensland and is not published in this report due to commercial confidentiality. The air velocity was held at 2 m/s, common for this species, and the pressure held at ambient; 1000 mbar. All other simulation parameters were the same as those used to simulate vacuum drying for this species. The target final MC for this species is 11%, achieved after 504 hrs (21 days). We did not investigate conventional schedule simulations for the other species due to time constraints. Figure 81 depicts the simulation results for MC. After 504 hours the final simulated MC was 11.1%, very close to the target. This signifies that the model, although developed for vacuum drying, can be readily used for conventional drying, the predominant drying method currently used by industry.
0
0.1
0.2
0.3
0.4
0.5
0 200 400 600
Model - surfaceModel - core
Time (hrs)
Moi
stur
e co
nten
t (%
/%)
Figure 81. Transpore 2-D conventional drying moisture content simulation results for C. citriodora using measured diffusion coefficient and pre-drying phase

115 Evaluation of super–heated steam vacuum drying viability and development of a predictive drying model for Australian hardwood species – Final report
5 Discussion and conclusions The principal objectives of this research were to:
• establish the viability of vacuum kiln drying Australian hardwood species compared with current conventional kiln drying methods,
• design a predictive drying model to accurately predict heat and mass transfer, and • validate the drying model.
We achieved this through a series of end-matched conventional and vacuum drying trials, where a number of relevant wood, kiln and drying properties were measured for viability and model validation. Four trials for four species were conducted. We chose the species based on their wide ranging proximity, high commercial volume and vastly different wood properties and drying capabilities. The species were, C. citriodora (spotted gum), E. marginata (jarrah) E. pilularis (blackbutt) and E. obliqua (messmate). In addition, to establish the economic viability of vacuum drying we prepared an economic model that provided a number of comparative case studies. Alongside this report, the economic model is also available as a useful tool for industry. In keeping with the structure of this report, the following project conclusions are presented under appropriate sub-headings.
5.1 Applied drying – Experimental drying trials From the series of vacuum and conventional end-matched drying trials, we can form the following conclusions:
• The vacuum drying time was greatly reduced compared with end-matched conventional drying, where the best quality outcome vacuum drying times ranged between 41% and 66% of conventional kiln drying from green, depending on the species.
• For the most viable vacuum drying trials, the vacuum dried quality was either the same or better than the end-matched conventional drying counterpart, depending on the species.
• Unacceptable surface checking results were obtained for E. pilularis for every vacuum and conventional drying trial. However the percentage of boards making select grade for surface checking from the vacuum drying trials was considerably higher than for the conventional drying trials. We believe with further schedule adjustment acceptable surface checking resulting from vacuum drying can be obtained.
• Schedule adjustments greatly improved the dried quality between vacuum drying trials of the same species, resulting in us recommending the final vacuum drying schedule used for each species as a starting point for further vacuum drying.
• Twist was the major form of unacceptable distortion encountered for both vacuum and conventional trials across all species. Twist distortion was greatly reduced to within acceptable limits for vacuum drying trials by doubling the concrete stack weighting to 1000kg / m3 between trials.
• A simple and efficient method was used to quantify the effect of reconditioning on collapse recovery using the image analysis software MeshPore. The reconditioning process was proved to effectively recover collapse eliminating ‘miss’ or ‘skip’ after dressing.
• For all trials, end splitting was significantly more prevalent in conventionally dried boards than vacuum dried boards. Reduction of end splitting could be a principal advantage over conventional drying. It is theorised that, due to overpressure, more longitudinal water flow occurs during vacuum drying, reducing MC gradients and associated stress at the board ends. This is a topic for further investigation.

116 Evaluation of super–heated steam vacuum drying viability and development of a predictive drying model for Australian hardwood species – Final report
5.2 Applied drying - Economic model Using fundamental drying economics, we made and economic application with the ability to compare vacuum and conventional kiln drying from the green condition. We used this model to determine the economic viability of vacuum drying for each species over three different sized operations. We labelled the different sizes small, medium and large relating to wood capacities of 10, 35 and 50m3. Kiln input data was provided by Brunner-Hildebrand, a project collaborator, and drying trial data were provided from the ‘best outcome’ applied drying trial for each species, based on a combination of the best drying quality and fastest drying time encountered. From the analysis the following conclusions can be made:
• For all sized operations, we found vacuum drying E. marginata and E. pilularis to be more economically viable than using current conventional methods.
• For large drying operations, we found vacuum drying C. citriodora and E.obliqua to be more economically viable than current conventional methods. This was not the case for the medium and small drying operations.
• The larger the drying operation the more economically viable vacuum drying becomes compared to conventional drying.
• The model is based on a number of assumptions and the case studies provided may not apply to all operations. The provision of the model as an application allows industry to tailor their own case studies to more closely simulate their own operation.
5.3 Drying modelling - Measurement of kiln conditions and wood drying properties
A number of specialised instruments were used on test and flying wood boards to measure wood shrinkage, moisture content and temperature, and kiln airflow during vacuum drying trials. Through continuous ‘real–time’ measurements, a greater understanding of the kiln conditions and wood properties during vacuum drying were obtained. The data produced is essential to input into and validate the modelling component of this project.
5.4 Drying modelling - Measurement of essential wood properties We measured a number of wood properties that are essential provide the necessary structure for developing an accurate heat and mass transfer drying model. They were wood density, initial MC, fibre porosity, gas permeability, bound water diffusion and shrinkage. For many of these measurements sophisticated equipment was required. As a result of these measurements the following conclusions were made:
• Shrinkage data varied between species and was consistent with published data. • Shrinkage values varied greatly between the tangential and radial directions, except
for C. citriodora, and shrinkage values between species differ due to variations in physical and chemical properties. In terms of shrinkage, C. citriodora is more isotropic compared with the other species tested.
• Collapse shrinkage was clearly evident for Eucalyptus obliqua, but not with other species, consistent with industrial seasoning experience. The wood-water relations of this species, free of collapse, was characterised by using thinner sample sections (in the radial-tangential plane) as theorised.
• A clear difference in fibre porosity, size, fibre cell wall thickness and orientation is evident between these species.
• A strong correlation was found between measured and calculated wood density, based on fibre porosity.
• C. citriodora diffusion coefficients were much lower in all directions compared with the other species, where E. obliqua was the highest. The radial/tangential ratio of

117 Evaluation of super–heated steam vacuum drying viability and development of a predictive drying model for Australian hardwood species – Final report
diffusion coefficient for C. citriodora was approximately 1:1 indicating low diffusion isotropy in this plane. This is evident in many other wood property ratios measured for this species such as shrinkage and permeability.
• The ratio of longitudinal diffusion to both radial and tangential directions is much greater for E. obliqua than C. citriodora, indicating E. obliqua’s greater propensity for drying in the longitudinal direction.
• The species investigated are highly impermeable compared to published data of exotic hardwood species and were at least a factor of 10 less permeable than the lowest published figure
• C. citriodora was the lowest permeability species measured, with the permeability order of the other species changing depending on wood direction.
• A fundamental technique was developed to increase the range of gas permeability measurements 4 orders of magnitude than previously measured using the same device.
5.5 Drying modelling - Vacuum drying modelling Using the existing softwood drying model Transpore 2D, the model was re-coded and optimised in the Matlab environment, allowing peak performance with rapid convergence. The model is able to accurately simulate the heat and mass (water) transfer or flux in the radial and tangential wood directions. We conducted vacuum drying simulations for each species tested using the kiln drying and wood property parameters measured as part of this project. Additionally, we used the model to compare the conventional drying rate of C. citriodora using a known conventional schedule for this species. This was outside the proposed scope of this work. As a result of this modelling research the following conclusions can be made:
• The drying of these species is primarily limited by diffusion in the radial-tangential plane.
• Diffusion coefficient parameters seemed the most sensitive in regards to accurate heat and mass transfer modelling.
• Initial, uncorrected, simulations resulted in faster drying rates than experimental results.
• Accurate diffusion coefficient values have been characterised for each species in the radial, tangential and longitudinal directions. They were found to differ from theoretical calculations and have been successfully used to refine the model accuracy.
• Experimental material was found to be entering the kiln with moisture gradients due to manipulation of the boards prior to kiln drying. This seems to coincide with simulation results after approximately the first 16 hours of drying.
• The introduction of a pre-drying phase to simulate the initial setup of MC gradients prior to drying, and corrected radial and tangential macroscopic calculated diffusion coefficients resulted in a good agreement of simulated and experimental drying curves.
• Depending on the species, the model accurately predicted drying time form green to 11% MC within 91 to 98% of the actual drying trials.
• Using the model, including corrected diffusion coefficients, conventional kiln drying simulations of C. citriodora produced accurate determination of end-point MC after the same drying time as reported by industry.

118 Evaluation of super–heated steam vacuum drying viability and development of a predictive drying model for Australian hardwood species – Final report
6 Recommendations The results of drying trials show that vacuum drying produces material of the same or better quality than is currently being produced by conventional methods in a much faster timeframe. Economic analysis indicates positive or negative results depending on the species and the size of drying operation. We recommend vacuum drying over conventional drying for all operation sizes, in terms of drying quality, time and economic viability, for E. marginata and E. pilularis. We also recommend vacuum drying over conventional drying for the same reasons for drying C. citriodora and E. obliqua in larger drying operations (kiln capacity 50 m3 or above), but not for smaller operations at this stage. Further schedule refinement has the ability to reduce drying times further and may improve the vacuum drying viability of the latter species in smaller operations. Anecdotal evidence suggests that vacuum drying viability is strengthened when drying thicker dimension timber as the difference in vacuum and conventional drying times is magnified. We recommend this topic for further investigation. A comprehensive heat and mass transfer drying model has been developed with the ability to accurately simulate vacuum and conventional drying of Australian hardwood species. This has the ability to significantly reduce the time required for this type of research. We recommend developing the model to include a mechanical component with the ability to simulate drying shrinkage stress/strain to predict drying degrade such as checking, distortion and residual drying stress.

119 Evaluation of super–heated steam vacuum drying viability and development of a predictive drying model for Australian hardwood species – Final report
7 References Blakemore, P. (2003), 'The use of handheld electrical moisture meters with commercially important Austrlian hardwoods.', Project no. PN01.1316, CSIRO report prepared for Forest and Wood Products Australia, viewed 11 March 2009, <http://www.fwpa.com.au> Department of Primary Industries and Fisheries. (2008), viewed 7 March 2009, <http://www.dpi.qld.gov.au> Forest Product Commission Western Ausrtalia. (2009), viewed 10 March 2009, <http://www.fpc.wa.gov.au> ABARE. (2010), 'Australian forest and wood products statistics', viewed 23 May 2011, <http://abare/publications_html/afwps> Aguiar, O. & Perré, P. (2000) The “flying wood” test used to study the variability of drying behaviour of oak. Cost Action E15. 2nd Workshop: Advances in drying of wood, Sopron. Anon. (2011) Comparison of 2011 Australian Standing Offer Energy Prices. Office of the Tasmanian Economic Regulator. 30. Avramidis, S. (2007) Chapter 6 - Bound water migration in wood. In: Perré, P. (Ed.) Fundamentals of wood drying, A.R.BO.LOR, Nancy. pp. 105-124. Bird, R.B., Stewart, W.E. & Lightfoot, E.N. (1960) Transport Phenomena. John Wiley and Sons, Inc., New York. Blakemore, P.A. & Langrish, A.G. (2008) Effect of collapse on fitted diffusion co-efficients for Victorian ash eucalypts. Wood Sci. Technol., 42(535-549. Bootle, K.R. (2004) Wood in Australia - Types, properties and uses. McGraw Hill, Sydney. 452. Brandao, A. & Perré, P. (1996) The "Flying Wood" - A quick test to characterise the drying behaviour of tropical woods. In: 5th International IUFRO Wood Drying Conference. Quebec, Canada, Dadswell, H.E. (1972) The anatomy of eucalypt woods. 66. Commonwealth Scientific and Industrial Research Organisation. 1-40. Dullien, F.A.L. (1992) Porous media: Fluid transport and pore structure. Academic Press Inc., New York. Engwirda, R. (2009) Manager, Hurford Hardwood. Lismore, New South Wales. April 2009. Hansmann, C., Wimmer, W.G. & Teischinger, A. (2002) Permeability of wood - A review. Wood Research, 47(4): 1-16. Innes, T.C. (1996) Improving seasoned hardwood timber quality with particular reference to collapse. Engineering. Hobart, University of Tasmania.

120 Evaluation of super–heated steam vacuum drying viability and development of a predictive drying model for Australian hardwood species – Final report
Innes, T.C., Bennet, P.J. & Lee, M.W. (2008) Processing backsawn Tasmanian regrowth Eucalyptus obliqua. Tasforests, 17(75-94): Leggate, W., Palmer, G., Mcgavin, R. & Muneri, A. (2000) Productivity, sawn recovery and potential rates of return from eucalypt plantations in queensland. In: The future of eucalypts for wood products. Launceston, Tasmania, Malmquist, L. & Noack, D. (1960) Untersuchungen über die Trocknung empfindlicher Laubhölzer in reinemHeißdampf (ungesättigter Wasserdampf) bei Unterdruck. Holz als Roh -und Werkstoff, 18(5): 171-180. Mcmillen, J.M. (1963) Stresses in wood during drying. 1652. U.S. Department of Agriculture, Forest Service, Forest Products Laboratory. Milota, M.R., Tschernitz, J.L., Verril, S.P. & Mianowski, T. (1995) Gas permeability of plantation loblolly pine. Wood and Fibre Science, 27(1): 34-40. Nolan, G., Innes, T.C., Redman, A.L. & Mcgavin, R. (2003) Australian hardwood drying best practice manual. Forest and Wood Products Research and Development Corporation, Melbourne. Pearn, G. (2007) Personal communication, New South Wales, Boral Timber. Perré, P. (1996) The Numerical Modelling of Physical and Mechanical Phenomena Involved in Wood Drying: an Excellent Tool for Assisting with the Study of New Processes. In: 5th Int. IUFRO Wood Drying Conference. Quebec, Canada, Perré, P. (2005a) Meshpore: A software able to apply image-based meshing techniques to anisotropic and heterogeneous porous media. Drying Technology, 23(1993-2006. Perré, P. (2005b) MeshPore: a software able to apply image-based meshing techniques to anisotropic and heterogeneous porous media. Drying Technology, 23(9-11): 1993-2006. Perré, P. (2007a) Chapter 7 - Fluid Migration in Wood. In: Perré, P. (Ed.) Fundamentals of Wood Drying, A.R.BO.LOR, Nancy. pp. 125-156. Perré, P. (2007b) Experimantal device for the accurate determination of wood-water relations on micro-samples. Holzforschung, 61(4): 419-429. Perré, P. (2010) Personal communication, Brisbane, Perré, P. & Turner, J.W. (1999a) Transpore: A generic heat and mass transfer computational model for understanding and visualising the drying of porous media. Drying Technology, 17(7): 1273-1289. Perré, P. & Turner, J.W. (2008) A mesoscopic drying model applied to the growth rings of softwood: Mesh generation and simulation results. Maderas, Ciencia y technologia, 10(3): 251-274.

121 Evaluation of super–heated steam vacuum drying viability and development of a predictive drying model for Australian hardwood species – Final report
Perré, P. & Turner, W. (1999b) A 3-D version of TransPore: a comprehensive heat and mass transfer computational model for simulating the drying of porous media. Int. J. of Heat and Mass Transfer, 42(4501-4521. Redman, A.L. (2001) Improving quality of seasoned Tasmanian eucalypt species. Faculty of Engineering. Launceston, University of Tasmania. Redman, A.L. (2007) Accelerated seasoning of plantaion grown Eucalyptus cloeziana and Eucalyptus pellita sawn timber. PN 07.3022. Forest and Wood Prupucts Australia. 1-30. Redman, A.L. (2008) Charaterisation of wood properties and tranverse anatomy for vacuum drying modelling of commercially important Australian hardwood species. PG08.5097. Forest and Wood Products Australia. 1-82. http://fwpa.com.au. Redman, A.L. (2010) Computational modelling of the vacuum drying of Austrlalian Hardwoods. Queensland Cyber Infrastructure Foundation. 1-43. http://www.qcif.edu.au. Remond, R. (2010) Personal communication, Brisbane, Rousset, P., Perre, P. & Girard, P. (2004) Modification of mass transfer properties in poplar wood (P. robusta) by a thermal treatment at high temperature. Holz als Roh -und Workstoff, 62(113-119. Rozsa, A. & Mills, R.G. (1997) Index of kiln seasoning schedules. In: Waterson, G. C. (Ed.) Australian Timber Seasoning Manual, Third ed, Australian Furniture Research and Development Institute, Launceston. pp. 167-175. Salin, J.G. (2010) Problems and solutions in wood drying modelling: history and future. Wood Material Science and Engineering, 5(123-134. Savard, M., Lavoie, V. & Trembala, C. (2004) Technical and Economical Assessment of Superheated Steam Vacuum Drying of Northern Red Oak. In: N.A.G.R.E.F. COST E15 Conference. Forintel Canada Corp., Athens, Greece, 22-24 April. Serway, R.A. (1998) Principles of physics. Saunders College Publishing, Florida. Siau, J.F. (1979) The Effect of Temperature and Moisture Content on Physical Changes in Wood. In: Rosen, H. N.; Simpson, W.; Wengert, E. M.; (Chairmen): Symposium on wood moisture content temperature and humidity relationships, Virginia Polytechnic Institute and State University, Blacksburg, Virginia, Oct. 29, 1979. 1979, 4 11; 31 ref. Forest Products Laboratory, USDA Forest Service.; Madison, Wisconsin; USA, Siau, J.F. (1984) Transport processes in wood. Germany, Springer-Verlag. Standards Australia. (1997) AS/NZS 1080.1: 1997 Timber-Methods of Test - Method 1: Moisture content Australian and New Zealand Standard, distributed by SAI Global Limited. Standards Australia. (1999) AS 2796: 1999 Hardwood-Sawn and milled products, Australian Standard, distributed by SAI Global Limited.

122 Evaluation of super–heated steam vacuum drying viability and development of a predictive drying model for Australian hardwood species – Final report
Standards Australia. (2000) AS/NZS 1080.3:2000 Timber-Methods of test-Method 3: Density, Australian and New Zealand Standard, distributed by SAI Global Limited. Standards Australia. (2001) AS/NZS 4787:2001 Timber-Assessment of drying quality, Australian and New Zealand Standard, distributed by SAI Global Limited. Turner, I.W. & Perré, P. (2004) Vacuum Drying of Wood with Radiative Heating: II. Comparison between Theory and Experiment. AIChE Journal, 50(1): 108-118. Whitaker, S. (1977) Simultaneous heat, mass and momentum transfer in porous media: A theory of drying. Advances in Heat Transfer, 13(119-203.
123 Evaluation of super–heated steam vacuum drying viability and development of a predictive drying model for Australian hardwood species – Final report
Acknowledgements I would like to thank the following people and companies who, with their support, this research project was made possible. Dr Henri Bailleres, Research Scientist Innovative Forest Products, DEEDI Queensland. Robert McGavin, Research Scientist Innovative Forest Products, DEEDI Queensland. Martin Davies, Research Scientist Innovative Forest Products, DEEDI Queensland. Eric Littee, Research Technician Innovative Forest Products, DEEDI Queensland. Daniel Field, Research Technician Innovative Forest Products, DEEDI Queensland. Dr Patrick Perré, Professor, Head of LERMAB (Integrated research unit on wood science), AgroParisTech – ENGREF France. Dr Ian Turner, Professor, School of Mathematical Sciences QUT, Queensland. HPC Research Support, QUT, Queensland. Queensland Cyber Infrastructure Foundation (QCIF), Queensland. Ingo Wollocha, Sales Manager Brunner-Hildebrand, Germany. Dale and Meyers management and staff, Maryborough, Queensland. Burnett Sawmill management and staff, Bundaberg, Queensland. Boral Timber management and staff, New South Wales. Hurford Hardwood management and staff, Casino and Lismore, New South Wales. Notaras and Sons management and staff, Grafton, New South Wales. Gunns Timber management and staff, Manjimup, Western Australia. Gunns Timber management and staff, Launceston, Tasmania. ITC Limited management and staff, Huonville and Launceston, Tasmania. FWPA management and staff, Australia.
124 Evaluation of super–heated steam vacuum drying viability and development of a predictive drying model for Australian hardwood species – Final report
8 Appendix1 – List of abbreviations Latin letters 2D two-dimensional
3D three-dimensional
A area m2
AE acoustic emission
Ag green cross–sectional area mm2
Ai image area mm2
𝐴k activation energy J
Anr non–reconditioned cross–sectional area mm2
Ar reconditioned sample cross–sectional area mm2
Avj lumen area μm2
Aw wood tissue area μm2
DMA dynamic mechanical analysis
AS Australian Standard
AS/NZS Australian and New Zealand Standard
BBT1..BBT4 blackbutt (Eucalyptus pilularis) end–matched drying trials 1 to 4
cp specific heat J kg-1 K-1
CL amount of liquid tension collapse %
𝑐 molar concentration mol m-3
CF collapse factor
D diffusivity tensor m2 s-1
D area of cross section less internal check area m3
DBT dry bulb temperature °C
DEEDI Department of Employment, Economic Development and Innovation
Dgap gap between concave or convex faces mm
Dstress degree of residual drying stress
E modulus of elasticity Pa
E* complex modulus Pa
E’ storage modulus Pa
E” loss modulus Pa
EMC equilibrium moisture content %
ENGREF l’École Nationale du Génie Rural des Eaux des Forêts
ESEM environmental scanning electron microscope
e sample thickness m
FSP fibre saturation point

125 Evaluation of super–heated steam vacuum drying viability and development of a predictive drying model for Australian hardwood species – Final report
FWPA Forest and Wood Products Australia
G area of green cross section m3
g gravitational acceleration m s-2
HPC High Performance Computing
Hz frequency Hz
h specific enthalpy J kg-1
h heat transfer coefficient (W m-2 K-1) IP intersection point
lfi fibre lumen contour length μm
llj manually drawn contour length μm
L sample length m
J flux expression
JAR1..JAR4 jarrah (Eucalyptus marginata) end–matched drying trials 1 to 4
K intrinsic permeability m2
K absolute permeability tensor m2
k relative permeability tensor
k Boltzmann’s constant
ka air permeability m2
Lk deformation constant
mk mass transfer coefficient m s-1
kr relative permeability
L Longitudinal
L sample thickness m
l length m
𝑀 molecular weight kg mol-1
MC moisture content
m mass vapour transferred
MES1..MES4 messmate (Eucalyptus obliqua) end–matched drying trials 1 to 4
n unit normal
ΔP pressure difference Pa
P average pressure Pa
𝑃 pressure Pa
PC personal computer
𝑃 total liquid tension N m-2
𝑃I pressure of the metastable liquid phase Pa
𝑃K pressure inside bubble Pa
Q flux m2 s-1
Q the limit of plastic flow N m-2

126 Evaluation of super–heated steam vacuum drying viability and development of a predictive drying model for Australian hardwood species – Final report
QUT Queensland University of Technology
r principle radii of curved surface m
𝑅 gas constant J mol-1 K-1
R radial
R&D research and development
S volume saturation
So collapse free shrinkage %
SPG1..SPG4 spotted gum (Corymbia citriodora) end–matched drying trials 1 to 4
SRC Salisbury Research Centre
𝑡 time s
𝑇 temperature K
tave average cell wall thickness μm
Td board thickness dry m
Tg board thickness green m
TG glass transition temperature °C
v mass velocity vector m s-1
v air velocity m s-1
ν Poisson’s ratio
Vg green volume m3
VS volumetric shrinkage m3 m-3
VSD variable speed drive
VOC volatile organic compounds
W board width m
WBD Wet bulb depression °C
Wd board width dry m
Wg board width green m
x rectangular coordinate m
x molar fraction (mol/mol) X magnification
X moisture content (dry basis) kg kg-1
Z1 molecules per cm3 cm-3
Greek symbols ε volume fraction
ε strain m m-1
δ phase angle
δ amplitude of deformation
λ molecular latent heat of evaporation kJ kg-1

127 Evaluation of super–heated steam vacuum drying viability and development of a predictive drying model for Australian hardwood species – Final report
λ thermal conductivity W m-1 K-1
ρ intrinsic averaged density kg m-2
ρ0 wood density kg m-2
σ surface tension N m-1
)(Tσ surface tension at temperature T N m-1
σx stress Pa σ* complex stress Pa σ’ elastic stress Pa σ” viscous stress Pa
τ relaxation time of collapse process s
μ dynamic viscosity of air Pa. s
φ phase potential
ϕ porosity m3 m-3
χ depth scalar m
𝜔 mass fraction
Superscripts and subscripts 𝑎 air
𝑏 bound water
c capillary
calc calculated
crit critical
e enthalpy
𝑒𝑓𝑓 effective property
f fibres
𝑓sp fibre saturation point
g gas phase
𝑖,j structural direction of wood
L longitudinal direction
l liquid
r relative
R radial direction
𝑠 solid phase
t top
T tangential direction
𝑣 vapour phase
𝑣∞ vapour phase at boundary
v vessels

128 Evaluation of super–heated steam vacuum drying viability and development of a predictive drying model for Australian hardwood species – Final report
𝑤 liquid phase
wt wood tissue
∞ value outside the boundary layer in the free stream


![COMPUTATIONAL ANALYSIS OF HEAT AND MASS ... OnLine-First...for the kiln drying of hardwood lumber. Hukka [18] studied a two-dimensional model for the stress analysis of drying wood.](https://static.fdocuments.in/doc/165x107/60d51f2e8e23c84e48153245/computational-analysis-of-heat-and-mass-online-first-for-the-kiln-drying.jpg)