PROCESSING AND CHARACTERISATION OF ARAMID…studentsrepo.um.edu.my/4913/1/M_Sc_Thesis_Final.pdf ·...
144
i PROCESSING AND CHARACTERISATION OF ARAMID/CARBON HYBRID FIBRE REINFORCED POLYPROPYLENE COMPOSITES MUHAMMAD RAFIQ BIN MOHD ISA DISSERTATION SUBMITTED IN FULFILLMENT OF THE REQUIREMENTS FOR THE DEGREE OF MASTER OF SCIENCE DEPARTMENT OF CHEMISTRY FACULTY OF SCIENCE UNIVERSITY OF MALAYA KUALA LUMPUR 2014
Transcript of PROCESSING AND CHARACTERISATION OF ARAMID…studentsrepo.um.edu.my/4913/1/M_Sc_Thesis_Final.pdf ·...
i
PROCESSING AND CHARACTERISATION OF ARAMID/CARBON HYBRID FIBRE REINFORCED
POLYPROPYLENE COMPOSITES
MUHAMMAD RAFIQ BIN MOHD ISA
DISSERTATION SUBMITTED IN FULFILLMENT OF THE REQUIREMENTS FOR THE DEGREE OF
MASTER OF SCIENCE
DEPARTMENT OF CHEMISTRY FACULTY OF SCIENCE
UNIVERSITY OF MALAYA KUALA LUMPUR
2014

ii
ii. LITERARY WORK DECLARATION
iii
iii. ABSTRAK
Komposit hibrid gentian aramid/karbon /polipropilena (PP) dengan tiga peratusan gentian
keseluruhan (Vf) berbeza dan lima campuran gentian (100:0, 75:25, 50:50, 25:75 dan
0:100 V:V% ) telah disediakan melalui penyemperitan dan mesin suntikan acuan. Spesimen
komposit dibentuk telah dicirikan untuk sifat-sifat mekanikal, mekanikal dinamik dan sifat
termal. Analisis telah diperkukuhkan dengan imej dari imbasan mikroskop elektron.
Analisis termogravimetri (TGA) mendedahkan bahawa penghibridan gentian menghasilkan
komposit hibrid dengan sifat haba yang lebih baik berbanding dengan komposit gentian
tunggal. Analisa kalorimeter imbasan perbezaan (DSC) menunjukkan bahawa penambahan
gentian tidak mengubah takat lebur komposit dengan ketara. Penghabluran matriks telah
didapati sangat dipengaruhi oleh jumlah Vf. Analisis mekanikal dinamik (DMA)
menunjukkan peningkatan dalam modulus penyimpanan (E'). Ini menunjukkan bahawa
komposit hibrid mempunyai ketegaran yang lebih tinggi berbanding dengan komposit
gentian aramid. Kandungan gentian karbon menunjukkan pengaruh yang kuat pada
magnitud E'. Sifat tegangan beberapa komposit hibrid melebihi sifat-sifat komposit gentian
tunggal. Walau bagaimanapun, berdasarkan imej SEM permukaan patah, didapati bahawa
interaksi antara matriks dan gentian adalah lemah. Sebaliknya, penghibridan mengurangkan
sifat lenturan komposit berbanding dengan komposit gentian tunggal. Sifat lenturan
didapati lebih sensitif kepada jumlah Vf, di mana komposit dengan jumlah Vf yang lebih
tinggi akan mempunyai modulus lenturan yang lebih tinggi. Untuk semua komposit yang
telah diuji, beban puncak (P) dan faktor intensiti tekanan kritikal (Kc) meningkat dengan
kandungan gentian karbon. Sebaliknya, tenaga kegagalan (W) dan kadar lepas tenaga
kritikal (Gc) telah menurun dengan peningkatan kandungan serat karbon di dalam komposit
hibrid. Komposit hibrid menunjukkan sifat yang lebih baik apabila dibandingkan dengan
komposit gentian tunggal. Secara ringkas, penghibridan gentian meningkatkan daya tahan
komposit terhadap hentaman.

iv
iv. ABSTRACT
Hybrid composites of aramid fibre/carbon fibre/polypropylene (PP) with three total fibre
volume fraction (Vf) and five fibre proportions (100:0, 75:25, 50:50, 25:75 and 0:100 V:V
%) were prepared by extrusion and injection moulding. The moulded composite specimens
were characterised for thermal, dynamic mechanical and mechanical properties. The results
from the analysis were supported by scanning electron microscope images.
Thermogravimetric analysis (TGA) revealed that the hybridisation of fibres produces
hybrid composites with better thermal properties compared to the single fibre composites.
Differential scanning calorimetric (DSC) study showed that the incorporation of the fibres
did not significantly alter the melting behaviour of the composites. The crystallinity of the
matrix was found to be greatly affected by the total Vf. Dynamic mechanical analysis
(DMA) showed an increase in the storage modulus (E’) indicating higher stiffness in the
hybrid composites as compared to the aramid fibre composites. Carbon fibre content
showed a strong influence on the magnitude of E’. The tensile properties of some hybrid
composites exceed the properties of the single fibre composites. However, based on the
SEM image of the fractured surface, it was found that the interfacial interaction between
the matrix and fibres is weak. On the other hand, hybridisation reduced the flexural
properties of the composites compared to its single fibre counterpart. Flexural properties
were found to be more sensitive to total Vf, where composites with higher total Vf would
have better flexural modulus. For all composites tested, the peak load (P) and critical stress
intensity factor (Kc) increased with increasing carbon fibre contents. By contrast, the
fracture energy (W) and critical strain energy release rate (Gc) were decreased with
increasing carbon fibre content in hybrid composites. The hybrid composite showed
superior impact properties when compared to its non-hybrid counterpart. In a nutshell,
hybridisation of the fibres improved the impact properties of the composites.

v
v. ACKNOWLEDGEMENT
In the name of Allah, Most Gracious, Most Merciful.
I would like to express my sincere appreciation and gratitude to my supervisor, Prof. Dr.
Aziz Hassan, for his patience and guidance during the research and writing of this thesis.
Thanks were forwarded to all lecturers especially to Prof. Rosiyah Yahya who have
indirectly assisted me in this work.
I would also like to convey my appreciation to the technical and support staff,
especially to Mr. Zulkifli Abu Hasan, Miss Ho Wei Ling and Miss Nisrin Norranis, for
their continuous help during the research. I am also grateful to all the members of the
polymer and composite material research group which in many ways have indirectly
contributed to the completion of this study.
I am thankful to the University of Malaya for funding this research through grants
PV073-2012A and RG150/11AFR.
Last but not least, I owe special gratitude to my family, especially my parents, for their
continuous and unconditional support throughout the duration of this program.
vi
vi. LIST OF FIGURES
Figure 2.1: Molecular structure of Twaron®
........................................................................ 11
Figure 2.2: Schematic of PAN and pitch based carbon fibre manufacturing procedure ..... 13
Figure 2.3: Graphite layers................................................................................................... 14
Figure 2.4: Schematic diagram of hybrid construction. ....................................................... 17
Figure 2.5: Distributive and dispersive mixing aspects ....................................................... 19
Figure 2.6: Stress and strain in dynamic mechanical analysis ............................................. 25
Figure 4.1: TGA thermogram of composites with 5% total Vf at different fibre
proportions ........................................................................................................................... 42
Figure 4.2: TGA thermogram of composites with 10% total Vf at different fibre
proportions ........................................................................................................................... 43
Figure 4.3: TGA thermogram of composites with 20% total Vf at different fibre
proportions ........................................................................................................................... 44
Figure 4.4: SEM micrographs taken from impact fracture surface of 10(5.00:5.00) .......... 46
Figure 4.5: The presence of undispersed aramid fibre bundles in specimen with 20% aramid
fibre content. ........................................................................................................................ 51
Figure 4.6: DSC curves of composites with 5% total Vf at different fibre proportion ........ 58
Figure 4.7: DSC curves of composites with 10% total Vf at different fibre proportion ...... 59
Figure 4.8: DSC curves of composites with 20% total Vf at different fibre proportion ...... 60
Figure 4.9: Tan delta-temperature behaviour for composites with 5% total Vf at different
fibre proportions ................................................................................................................... 64
Figure 4.10: Tan delta-temperature behaviour for composites with 10% total Vf at different
fibre proportions ................................................................................................................... 65

vii
Figure 4.11: Tan delta-temperature behaviour for composites with 20% total Vf at different
fibre proportions ................................................................................................................... 66
Figure 4.12: Storage modulus-temperature behaviour for composites with 5% total Vf at
different fibre proportions .................................................................................................... 73
Figure 4.13: Storage modulus-temperature behaviour for composites with 10% total Vf at
different fibre proportions .................................................................................................... 74
Figure 4.14: Storage modulus-temperature behaviour for composites with 20% total Vf at
different fibre proportions .................................................................................................... 75
Figure 4.15: Young’s modulus of all composite at different total Vf .................................. 78
Figure 4.16: Tensile strength of all composites at different total Vf.................................... 78
Figure 4.17: Tensile strain of all composites at different total Vf........................................ 79
Figure 4.18: Tensile fracture surface for 5(0.00:5.00) ......................................................... 83
Figure 4.19: Tensile fracture surface for 5(5.00:0.00) ......................................................... 84
Figure 4.20: Tensile fracture surface for 5(2.50:2.50) ......................................................... 84
Figure 4.21: Tensile fracture surface of 20(10.00:10.00) .................................................... 85
Figure 4.22: Experimental and calculated Young’s modulus and tensile strength for
composite with 5% total Vf .................................................................................................. 86
Figure 4.23: Experimental and calculated Young’s modulus and tensile strength for
composite with 10% total Vf ................................................................................................ 87
Figure 4.24: Experimental and calculated Young’s modulus and tensile strength for
composite with 20% total Vf ................................................................................................ 87
Figure 4.25: Flexural modulus of all composites at different total Vf ................................. 92
Figure 4.26: Flexural strength of all composites at different total Vf .................................. 92
Figure 4.27: Flexural displacement of all composites at different total Vf .......................... 93

viii
Figure 4.28: Experimental and calculated flexural modulus and flexural strength for
composite with 5% total Vf .................................................................................................. 95
Figure 4.29: Experimental and calculated flexural modulus and flexural strength for
composite with 10% total Vf ................................................................................................ 95
Figure 4.30: Experimental and calculated flexural modulus and flexural strength for
composite with 20% total Vf ................................................................................................ 96
Figure 4.31: Different crack loading modes. ..................................................................... 100
Figure 4.32: Fracture energy for aramid fibre reinforced composite at different Vf ......... 101
Figure 4.33: Fracture energy for carbon fibre reinforced composite at different Vf ......... 101
Figure 4.34: Fracture energy for hybrid fibre reinforced composite at different Vf and
different fibre proportions. ................................................................................................. 102
Figure 4.35: Impact fracture surface of 20(20.00:0.00) ..................................................... 104
Figure 4.36: Impact fracture surface of 20(0.00:20.00) ..................................................... 104
Figure 4.37: Impact fracture surface of 20(10.00:10.00) ................................................... 105
Figure 4.38: W against BDΦ plot for ARFC and CFRC at 5% Vf .................................... 107
Figure 4.39: Peak load for aramid fibre reinforced composite at different Vf ................... 110
Figure 4.40: Peak load for carbon fibre reinforced composite at different Vf ................... 110
Figure 4.41: Peak load for hybrid fibre reinforced composite at different Vf ................... 111
Figure 4.42: σY against a-0.5
plot for ARFC and CFRC at 5% Vf ..................................... 112
Figure 4.43: Experimental and calculated Gc and Kc for composite with 5% total Vf ...... 116
Figure 4.44: Experimental and calculated Gc and Kc for composite with 10% total Vf .... 117
Figure 4.45: Experimental and calculated Gc and Kc for composite with 20% total Vf .... 117
Figure 4.46: Kc and Gc values for all composites .............................................................. 119

ix
vii. LIST OF TABLES
Table 3.1: List of composites produced during experiment................................................. 35
Table 3.2: Parameter for injection moulding ....................................................................... 37
Table 4.1: Calculated and experimental weight fraction for all composites. ....................... 45
Table 4.2: Tonset, DTp and T50% for all composites. .............................................................. 48
Table 4.3: Thermal properties from DSC for all composites ............................................... 57
Table 4.4: Thermomechanical data for all composites ........................................................ 67
Table 4.5: Tensile properties for all composites .................................................................. 77
Table 4.6: Gc and Kc for all composites ............................................................................. 108

x
viii. LIST OF SYMBOLS
Å Angstrom
a/D Notch to depth ratio
AFRC Aramid fibre reinforced composite
ASTM American Society for Testing and Materials
CFRC Carbon fibre reinforced composite
DMA Dynamic mechanical analysis
DSC Differential scanning calorimetry
DTp Derivative peak temperature
E Young’s modulus
E’ Storage modulus
E” Loss modulus
FRPC Fibre reinforced plastic composite
FRTC Fibre reinforced thermoplastic composite
GFRC Glass fibre reinforced composite
Gc Critical strain energy release rate
GPa Giga Pascal
HDPE High density polyethylene
Kc Critical stress intensity factor
LDPE Low density polyethylene
MAPP Maleic anhydride grafted polypropylene
MPa Mega Pascal
P Peak load
PAN Polyacrylonitrile

xi
PP Polypropylene
RPM Revolutions per minute
S/D Span to depth ratio
SEM Scanning electron microscopy
SEN Single edge notch
T50% Temperature at 50% degradation
Tan δ Tan delta
Tc Crystallisation temperature
TGA Thermogravimetric analysis
Tm Melting temperature
Tonset Onset temperature
UV Ultra violet
Vf Fibre volume fraction
W Energy to failure
Wf Weight fraction
wt% Weight percent
Xc Degree of crystallinity
ΔHc Enthalpy of crystallisation
ΔHm Enthalpy of fusion/melting
1

xii
2 TABLE OF CONTENTS
TITLE PAGE .......................................................................................................................... i
ORIGINAL LITERARY WORK DECLARATION ............................................................. ii
ABSTRAK ............................................................................................................................ iii
ABSTRACT .......................................................................................................................... iv
ACKNOWLEDGEMENT ..................................................................................................... v
LIST OF FIGURES .............................................................................................................. vi
LIST OF TABLES ................................................................................................................ ix
LIST OF SYMBOLS ............................................................................................................. x
TABLE OF CONTENTS ..................................................................................................... xii
CHAPTER 1 .......................................................................................................................... 1
1.1 Polymer composites ................................................................................................ 1
1.2 Research Background .............................................................................................. 4
1.3 Research Objectives ................................................................................................ 5
1.4 Research Scope ....................................................................................................... 5
1.5 Thesis Outline` ........................................................................................................ 6
CHAPTER 2 .......................................................................................................................... 7
2.1 Fibre Reinforced Polymer Composites ................................................................... 7
2.1.1 Matrix ............................................................................................................... 7
2.1.2 Fibre ............................................................................................................... 10
xiii
2.1.2.1 Aramid Fibres ......................................................................................... 10
2.1.2.2 Carbon Fibres.......................................................................................... 12
2.2 Fibre Reinforced Thermoplastic Composite ......................................................... 14
2.3 Hybrid Fibre Reinforced Thermoplastic Composite ............................................. 15
2.4 Processing .............................................................................................................. 18
2.4.1 Compounding/Extrusion ................................................................................ 18
2.4.2 Moulding ........................................................................................................ 21
2.5 Properties ............................................................................................................... 22
2.5.1 Thermal properties ......................................................................................... 22
2.5.1.1 Differential scanning calorimetry ........................................................... 22
2.5.1.2 Thermogravimetric analysis ................................................................... 23
2.5.2 Dynamic mechanical analysis ........................................................................ 24
2.5.3 Mechanical Analysis ...................................................................................... 27
2.5.3.1 Tensile properties.................................................................................... 27
2.5.3.2 Interfacial adhesion and compatibility between fibre and matrix .......... 29
2.5.3.3 Flexural properties .................................................................................. 31
2.5.3.4 Impact Properties .................................................................................... 32
CHAPTER 3 ........................................................................................................................ 34
3.1 Material ................................................................................................................. 34
3.2 Processing .............................................................................................................. 36
3.2.1 Compounding ................................................................................................. 36
xiv
3.2.2 Injection moulding ......................................................................................... 36
3.3 Characterisation ..................................................................................................... 37
3.3.1 Thermal properties ......................................................................................... 37
3.3.1.1 Thermogravimetric analysis ................................................................... 37
3.3.1.2 Differential Scanning Calorimetry ......................................................... 37
3.3.2 Mechanical properties .................................................................................... 38
3.3.2.1 Tensile test .............................................................................................. 38
3.3.2.2 Flexural test ............................................................................................ 38
3.3.2.3 Impact test ............................................................................................... 39
3.3.3 Dynamic mechanical analysis (DMA) ........................................................... 40
3.3.4 Fracture surface analysis ................................................................................ 40
CHAPTER 4 ........................................................................................................................ 41
4.1 Thermogravimetric analysis (TGA) ...................................................................... 41
4.1.1 The effect of total fibre volume fraction, Vf .................................................. 47
4.1.2 The effect of fibre proportion ........................................................................ 52
4.2 Differential scanning calorimetry (DSC) .............................................................. 54
4.2.1 The effect of total Vf ...................................................................................... 55
4.2.2 The effect of fibre proportions ....................................................................... 62
4.3 Dynamic mechanical analysis (DMA) .................................................................. 63
4.3.1 The effect of total Vf ...................................................................................... 68
4.3.2 The effect of fibre proportion ........................................................................ 71

xv
4.4 Tensile properties .................................................................................................. 76
4.4.1 The effect of total Vf ...................................................................................... 76
4.4.2 The effect of fibre proportion ........................................................................ 82
4.5 Flexural properties ................................................................................................. 90
4.5.1 The effect of total Vf ...................................................................................... 90
4.5.2 The effect of fibre proportion ........................................................................ 93
4.6 Impact properties ................................................................................................... 97
4.6.1 The effect of total Vf .................................................................................... 100
4.6.2 The effect of fibre proportion ...................................................................... 114
CHAPTER 5 ...................................................................................................................... 120
5.1 Conclusion ........................................................................................................... 120
5.2 Suggestions for Future Works ............................................................................. 121
REFERENCES .................................................................................................................. 122

1
1 CHAPTER 1
INTRODUCTION
1.1 Polymer composites
Tracing the history of composite materials is like taking a fascinating look at the very
development of civilized life itself. Technical advancement in the ancient world is
generally agreed to have depended on several main factors; one of it is the presence of
suitable materials, in which the progress in composite materials have greatly contributed.
This statement still holds true, even now. For example, the development of carbon fibre
reinforced polymer composites has allowed significant weight reduction of turbine blades
employed in wind turbines due to the excellent strength to weight ratio of the composite
[1]. The maximum blade-length of a turbine is limited by both the strength and stiffness of
its material. Since the strength and stiffness to weight ratio of the composite is relatively
higher when compared to conventional materials, bigger and lighter blades were able to be
manufactured thus improving its efficiency.
A composite is an article or substrate made up of two or more distinct phases of
different substance [2]. In the plastic industry, the term broadly applies to structures of
reinforcing members (dispersed phase) incorporated in compatible resinous binders
(continuous phase). Such composites are subdivided into classes on the basis of the
reinforcing constituents; particulate (dispersed phase consist of small particles), fibrous
(dispersed phase consist of unlayered fibres), flake (flat flakes forming the dispersed phase)
and skeletal (composed of a continuous skeletal matrix filled by a resin). The components
remain distinct molecularly and can be separated via mechanical means. Composites
display properties which none of its constituents exhibit when in isolation.

2
Fibre reinforced polymer composite is a specific group of materials which uses
fibres with high modulus and strength embedded or bonded to a matrix with distinct
interfaces (boundaries) between them [3]. Both components interact and complement each
other to produce superior properties. The fibres function as load bearer where most of the
load is carried by the fibres. It also provide stiffness, thermal stability, strength and, in
some rare cases, electrical conductivity to the composite. Aramid, carbon, and glass fibres
are some of the more common fibre reinforcements employed. On the other hand, the
matrix fulfils several roles which are vital to the performance of the composite. The matrix
binds the fibres together and transfers the load to the fibres. It provides the composite with
rigidity, shape and also isolates the fibres so that each one can function separately. The
isolation would improve the crack resistance of the composite by either stopping or slowing
the crack propagation process. The matrix also protects the fibres from chemical attack,
elevated temperature, humidity and mechanical wear. Depending on the materials selected
as the matrix, the impact strength and ductility of the composite can be improved. Adhesion
and compatibility between fibres and the matrix is very important in order to produce
strong composites [4]. Higher compatibility between the fibre and matrix would
significantly improves the interfacial interaction between the two components resulting in
better composites.
Polymer composites offer several advantages over conventional materials. It
provides the capability for parts integration. The composite also have high specific stiffness
(stiffness-to-density ratio) and specific strength (strength to density ratio). Polymer
composites offer the same stiffness as steel at one fifth the weight and the same stiffness as
aluminium at only half the weight [5]. Typically, any component made with polymer
composite is lighter when compared to its traditional counterpart. Due to this, vehicles and
3
airplanes made with the composite parts can travel faster and have better fuel efficiency. In
addition, polymer composites are highly resistant to corrosion and have high endurance
(resistant to fatigue). The coefficient of thermal expansion for polymer composites are
smaller compared to metallic material granting them better dimensional stability. Apart
from its superior properties, using polymer composite also offer several advantages during
processing. Complex parts, special appearances and contours, some impossible to be done
with metals, can be fabricated using polymer composites without the need to weld or rivet
separate pieces. Net-shape or near net-shape components can also be produced which
would reduce several steps of machining and assembly, therefore reducing the cycle time
and cost. The cost of tooling for polymer composites is much lower than for metals due to
lower pressure and temperature involved in the processing step [6].
Polymer composites also suffer from a few disadvantages. On a weight basis, the
cost of materials needed to produce polymer composite is usually five to twenty times the
price of aluminium or steel. In addition, most of the popular processing method for
composite such as hand lay-up is not suitable for high volume production. The automotive
industry for example would require between 100 – 20,000 parts per day for its
manufacturing activities. Manufacturing sporting goods such as golf shafts are done on the
order of 10,000 per day. Designing using polymer composite is also a challenge due to the
lack of data available; unlike materials such as steel which has abundance of design and
data handbooks. Temperature resistance of the polymer composite is also dependent on the
thermal property of the matrix. Most of the polymer composites are not suitable for service
in elevated temperature for a prolonged period of time. Polymer composites also absorb
moisture which can affect its dimensional stability and mechanical strength significantly.

4
1.2 Research Background
Carbon fibre reinforced composites (CFRC) are increasingly employed for a variety of high
performance applications especially in aeronautic and aerospace industry due to their
excellent specific mechanical properties. However, the anisotropic nature of CFRC make
them sensitive to accidental damages, of which low-energy impact is considered the most
dangerous [7]. The internal damage (defects) caused by low-energy impact is often barely
visible to the naked eye and was found to cause substantial degradation in important
mechanical properties, including strength and stiffness. These defects, if disregarded, could
keep growing and cause premature failure.
The complex energy absorption mechanism during the impact process includes
matrix cracking, delamination and fibre kinking and fracture. Various approaches have
been taken to improve the damage resistance and damage tolerance of fibre composites.
One of the more popular approaches is to introduce second fibre reinforcement into the
system. Pejis et. al. have investigated the effect of the addition of high performance PE
fibres on the impact resistance of hybrid PE/carbon/epoxy structures [8]. The researchers
reported that the hybrid composite exhibited significantly better resistance to impact
damage when compared to all-carbon laminates due to a change in energy absorption
mode. It was suggested that more energy is stored in the PE component and consequently
less energy is available for damage in the structural carbon component, resulting in a
reduction in impact damage and improved post-impact properties.
For the purpose of this study, aramid/carbon hybrid fibre reinforced polypropylene
was prepared. Aramid fibres are introduced into the system with the main aim of improving
its impact properties.

5
1.3 Research Objectives
The objectives of this work are:
i. To prepare the aramid/carbon hybrid fibre composite via extrusion and injection
moulding.
ii. To study the thermal properties of the specimens by thermogravimetric analysis
(TGA) and differential scanning calorimetry (DSC).
iii. To study the dynamic mechanical properties of the composites through the
Dynamic Mechanical Analyser (DMA).
iv. To study the mechanical properties of the specimens through tensile, flexural and
impact tests.
v. To study the fractured surface of the specimens in order to establish the failure
mechanism (either fibre pull-out or fibre fracture) of the composites.
1.4 Research Scope
This study covers the effect of fibre reinforcement on composite performance and the effect
of hybridization at different total fibre loading and fibre proportions on their mechanical,
thermal as well as morphological properties. The intimately mixed hybrid fibre composites
were prepared with three different total fibre volume fraction, Vf (5%, 10% and 20%) and
five different fibre proportions (100:0, 75:25, 50:50, 25:75 and 0:100 V:V %).

6
1.5 Thesis Outline`
The main essence of this dissertation is to study the effect of fibre hybridisation on the
properties of fibre reinforced polypropylene composites. It is divided into the following
chapters:
Chapter one presents a general introduction to composites; advantages and
applications. Research background, objectives and scope of work are also presented.
Chapter two provides a review of literature on the basic concepts of hybrid
composites and examples of some of the hybrid composites developed by other researchers
and its properties.
Chapter three highlights the materials and methods employed. Details of the testing
method were also provided.
Chapter four focuses on the presentation of results and its discussion on the influence
of hybridisation on the properties of the composite. Properties of single fibre composites
were also presented.
Finally, chapter five presents the general conclusions and recommendations for
future work.

7
2 CHAPTER 2
LITERATURE REVIEW
2.1 Fibre Reinforced Polymer Composites
Fibre reinforced composites can be divided to three main components. The components are
the matrix (continuous phase), the fibres (dispersed phase) and the interface (region
between the fibre and the matrix).
2.1.1 Matrix
In fibre reinforced polymer composites, the matrix consists of polymers. The polymers are
divided into two main groups; thermoplastic and thermoset. The functions of the matrix are
to bind the reinforcing fibres to form a coherent structure and to provide a medium by
which to transfer applied stress from one filament to another. The nature of the matrix
depends on which class of polymers are used. Thermosets tend to be brittle while
thermoplastics are more ductile. Thermosets are used in applications where the composites
will be exposed to extremely high temperature as the thermosets have very high thermal
resistance and won’t melt. In this study, the thermoplastic polypropylene was chosen as the
matrix.
Polypropylene (PP) is used in various applications, both in industry and in
consumer goods, and it can be used both as a structural plastic and as a fibre. PP is a highly
crystalline, easily processed on conventional processing machines and an important
commodity polymer. It, also, has a low processing temperature and low cost but poor

8
toughness, average modulus and thermal-resistant properties [9]. This plastic is often used
for food containers, particularly those that need to be dishwasher safe.
PP was synthesised as early as 1869 by Berthelot using concentrated sulphuric acid
[10]. The resulting viscous oil at room temperature did not exhibit interesting properties for
industrial application. Its industrial importance stems from the appearance of crystalline
high molecular weight PP which was first polymerised in 1955 by Natta et al. using
organo-metallic catalysts based on titanium and aluminium [11]. Most commercial
polypropylene is isotactic and has an intermediate level of crystallinity between that of
low-density polyethylene (LDPE) and high-density polyethylene (HDPE). Polypropylene is
normally tough and flexible, especially when copolymerised with ethylene. This allows
polypropylene to be used as an engineering plastic, competing with materials such as ABS.
PP’s strength and versatility stem from a matrix of interlocking crystallites that allow
formation of rigid and tough articles. Highly isotactic polymer, with its regular structure,
forms a helical coil having three monomer units per turn. These coils stack together into
thin lamellar crystallites which force the chains to fold several times as they emerge and re-
enter lamellae [10].
The melting point of PP, at 160°C, is relatively very high compared to many other
plastics [12]. This contrasts with polyethylene (PE), another popular plastic for containers,
which has a much lower melting point. Three crystalline forms of PP are known, of which
the α-form is the most stable. Rapid quenching yields the β-form with lower density and
melting point of 150°C. Polymers of lower stereoregularity and random copolymers usually
contain γ-crystallites in addition to the α-form [13].

9
Because it is composed of only carbon and hydrogen atoms, and not polar atoms
such as oxygen and nitrogen, PP is a nonpolar material. PP is resistance to attack by polar
chemicals such as soap, alcohols and wetting agents. However, it can swell, soften or
undergo crazing in the presence of liquid hydrocarbon or chlorinated solvents. Strong
oxidizing agents such as fuming nitric acid or hot, concentrated sulphuric acid can cause
swelling and degradation [12].
PP is also very easy to dye and it is often used as a fibre in carpeting that needs to
be rugged and durable, such as that for use around swimming pools or on miniature golf
courses. Unlike nylon, which is also often used as a fibre for rugged carpeting, it doesn't
soak up water, making it ideal for uses where it will be constantly subject to moisture.
PP is not as sturdy as PE, but in some situations, it can be the better choice. One of
these situations is creating hinges from a plastic, such as a plastic lid on a travel mug. Over
time, plastics wear out from the repetitive stress of being opened and shut, and eventually
will break due to fatigue. PP is very resistant to this sort of stress, and it is the plastic most
often used for lids and caps that require a hinging mechanism.
The uses of PP are numerous because of how versatile this product is. According to
some reports, the global market for this plastic is 45.1 million tons, which equates to a
consumer market use of about 65 billion US Dollars. It is used in products such as plastic
parts for toys and automobile, carpeting, upholstery, reusable containers, laboratory
equipment and many more. Like many plastics, PP has virtually endless uses, and its
development has not slowed since its discovery. It is one of a handful of materials the
world is literally built around.

10
2.1.2 Fibre
The fundamental role of fibres in a composite material is to improve the mechanical
properties of the neat resin system. Fibrous fillers offer improvement in strength and
stiffness of the materials. All of the different fibres used in composites have different
properties and so affect the properties of the composite in different ways. The fibres chosen
for this work are aramid and carbon fibres.
2.1.2.1 Aramid Fibres
Aramid fibres are highly crystalline aromatic polyamide fibres that have the lowest density
and one of the highest tensile strength-to-weight ratios among the reinforcing fibres.
Aramid fibres are used as reinforcement in marine and aerospace applications where
lightweight, high tensile strength and resistance to impact damage (a famous example is
dropping a heavy hammer on the composite component) are important. They have negative
coefficient of thermal expansion in the longitudinal direction, similar to carbon fibres. The
major disadvantages of aramid fibres are their low compressive strength and difficulty in
cutting or machining. Aramid is difficult to dye by nature, but it is now possible to produce
black threads of the same quality. Twaron®
is five times stronger than steel at the same
weight and is often used in bullet-proof vests, ropes and cables, sails and fire fighter suits.
The molecular structure of Twaron® (aramid fibre used in this work) is illustrated in Figure
2.1. The repeating unit in its molecule contains an amide group and an aromatic ring. The
aromatic ring gives it a higher chain stiffness as well as better chemical and thermal
stability over other commercial organic fibres such as nylon.

11
Production of Twaron® fibres is divided into three main stages; polymerisation,
filament yarn spinning and conversion. Twaron® is a p-phenylene terephtalamide (PpPTA),
the simplest form of the AABB para polyaramide. PpPTA is a product of p-phenylene
diamine (PPD) and terephtaloyl dichloride (TDC). N-methyl pyrrolidone (NMP) and
calcium chloride (CaCl2) were used as co-solvent in the process. At this stage, it has yet to
acquire the reinforcing properties of yarn or pulp.
Figure 2.1: Molecular structure of Twaron®
The second stage involves dissolving the polymer in sulphuric acid to produce a
liquid crystalline solution. This solution is then spun into fine, natural yellow or dope-dyed
black filament yarn (the diameter of each filament is as small as 12µm). The structure of
the yarn is virtually 100% para-crystalline, with molecular chains running parallel to the
axis of the fiber. It is this high degree of orientation that contributes to the extraordinary
properties of Twaron® filament yarns. Studies done by Young and Andrews [14], and
Zwaag et. al [15] has confirmed the presence of chain stretching in aramid molecules when
mechanical stress were applied.

12
However, aramid fibres are quite susceptible to environmental degradation.
Prolonged exposure to moisture and ultraviolet (UV) rays may cause the mechanical
properties of the fibres to significantly decrease. The effect of UV rays on the mechanical
properties of aramid fibres (Twaron® 2000) was studied by Zhang et al. [16]. Exposure to
UV rays causes a photo induced chain scission and end group oxidation in air to occur. The
crystalline structure remained unchanged but some local rearrangement of the crystalline
area might occur. With irradiation, the tenacity, tensile strain and work to break of the
filaments decrease rapidly and almost linearly, and the work to break drops more quickly
than the tenacity and tensile strain of the filaments. The modulus of the filaments decreases
slightly with irradiation. Similar results were also reported by several other researchers
with different aramid fibres (Kevlar®
149 and Technora® by Dobb et al. [17] and Kevlar 49
by Brown et al. [18] ). It was also noted that the tensile failure mode of the fibres changed
from fibril splitting to brittle fracture after UV ray exposure.
Tanaka et al. studied the effect of moisture on the interfacial interaction between
aramid fibre and epoxy [19]. They found that moisture would weaken the interaction and
decreases the strength of the composite. Several other researchers also have studied the
detrimental impact of moisture on the performance of aramid fibres [20-23].
2.1.2.2 Carbon Fibres
Carbon fibre is any fibre consisting mainly of elemental carbon and is widely used in
reinforced polymer composites [24]. Among the advantages of carbon fibres are their
exceptionally high tensile strength-weight ratios as well as tensile modulus-weight ratios,
very low coefficient of linear thermal expansion (provides dimensional stability), high
13
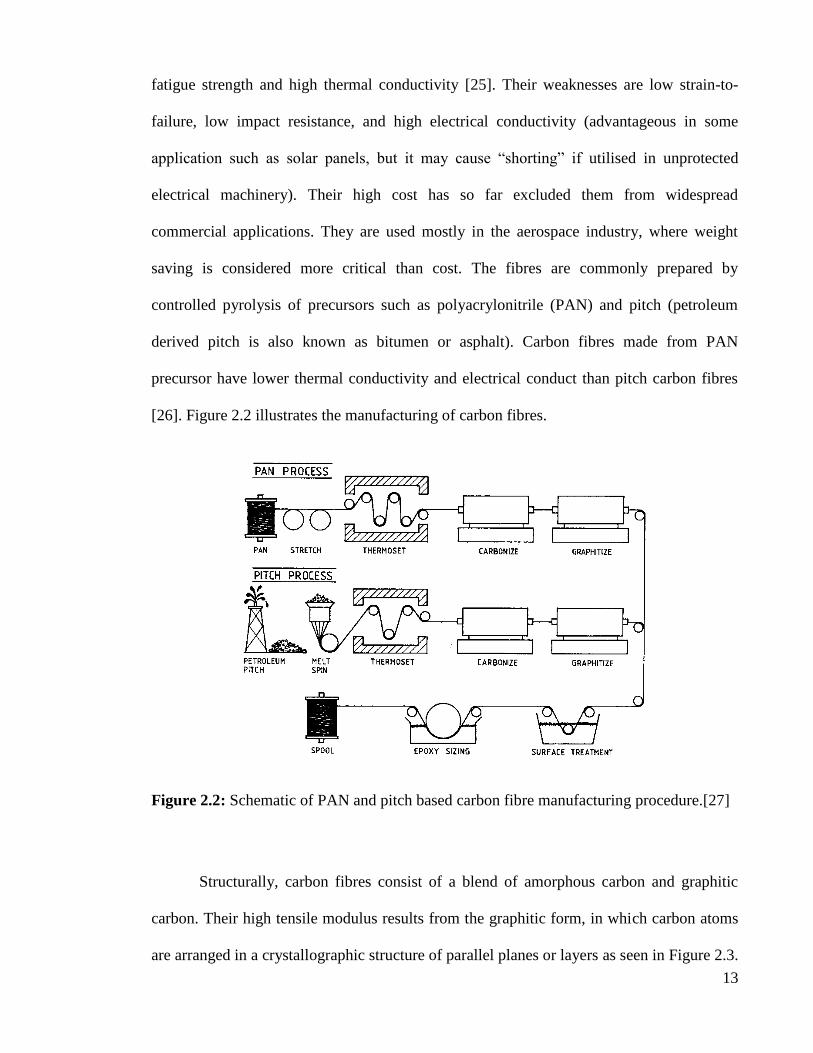
fatigue strength and high thermal conductivity [25]. Their weaknesses are low strain-to-
failure, low impact resistance, and high electrical conductivity (advantageous in some
application such as solar panels, but it may cause “shorting” if utilised in unprotected
electrical machinery). Their high cost has so far excluded them from widespread
commercial applications. They are used mostly in the aerospace industry, where weight
saving is considered more critical than cost. The fibres are commonly prepared by
controlled pyrolysis of precursors such as polyacrylonitrile (PAN) and pitch (petroleum
derived pitch is also known as bitumen or asphalt). Carbon fibres made from PAN
precursor have lower thermal conductivity and electrical conduct than pitch carbon fibres
[26]. Figure 2.2 illustrates the manufacturing of carbon fibres.
Figure 2.2: Schematic of PAN and pitch based carbon fibre manufacturing procedure.[27]
Structurally, carbon fibres consist of a blend of amorphous carbon and graphitic
carbon. Their high tensile modulus results from the graphitic form, in which carbon atoms
are arranged in a crystallographic structure of parallel planes or layers as seen in Figure 2.3.

14
The carbon atoms in each plane are arranged at the corners of interconnecting regular
hexagons. The distance between the planes (3.4 Å) is larger than that between the adjacent
atoms in each plane (1.42 Å). Strong covalent bond exist between carbon atoms in each
plane, but the bond between the planes is due to van der Waals-type forces, which is much
weaker. This results in highly anisotropic physical and mechanical properties for the carbon
fibre.
Figure 2.3: Graphite layers
2.2 Fibre Reinforced Thermoplastic Composite
Fibre reinforced thermoplastic composite (FRTC) are composites that consist of
thermoplastic polymer as its matrix. There are several advantages of using thermoplastics
as the matrix. Thermoplastics can be repeatedly softened by heating and can be shaped by
flow into articles by moulding and extrusion in its softened state. It can be hardened simply
through cooling, in opposed to the curing process required by thermosets. FRTC are also
more resistant to impact damage due to its toughness.
15
Strength of FRTC is dependent on several factors such as the strength and modulus
of the fibre, strength and chemical stability of the matrix and also the interfacial interaction
between these two phases. The interfacial interaction is an important control factor which
can determine the mechanical properties of the composite. Generally, composites with
better interfacial interaction would have better mechanical properties. The strength of the
interfacial bonding is usually governed by the affinity of the two components. Hence, the
interfacial bonding can be improved either through surface treatment or introduction of a
coupling agent.
FRTC can be divided into subgroups depending on the type of fibres employed.
There are two main subgroups which were classified based on the fibre used. There are
continuous FRTC, where the reinforcing fibres are continuous, from one end to the other
end of the finished article. On the other hand, there are discontinuous FRTC, where the
fibres used are in the form of discontinuous fibres. In this type of composite, tens, hundreds
or even thousands of fibres were introduced into the composite as needed.
FRTC can be further classified into single fibre composites and hybrid composites.
Single fibre composites are composite reinforced with only one type of fibre whereas
hybrid composites may contain two or more different type of fibres.
2.3 Hybrid Fibre Reinforced Thermoplastic Composite
The incorporation of two or more types of reinforcements into a single matrix has led to the
development of hybrid composites. The reinforcement can be of the same type (fibre with
fibre) or it can be different (fibre with particulates). In some cases, the hybrid would
contain a mixture of polymers as its matrix. The behaviour of the hybrid composite is the

16
weighed sum of its components in which there is more balance between its inherent
advantages and disadvantages [28]. Using a hybrid composite with two fibres, the
advantage of one fibre may complement with what was lacking in the other fibre. As a
consequence, balance of cost and performance may be achieved with proper material
design. The properties of a hybrid composite mainly depend upon several factors such as
fibre content, length of individual fibres, fibre orientation, extent of intermingling of fibres,
fibre to matrix bonding and arrangement of both fibres. The strength of hybrid composite is
also dependent on the failure strain of individual fibres. Maximum hybrid results are
obtained when the fibres fails at similar tensile strain.
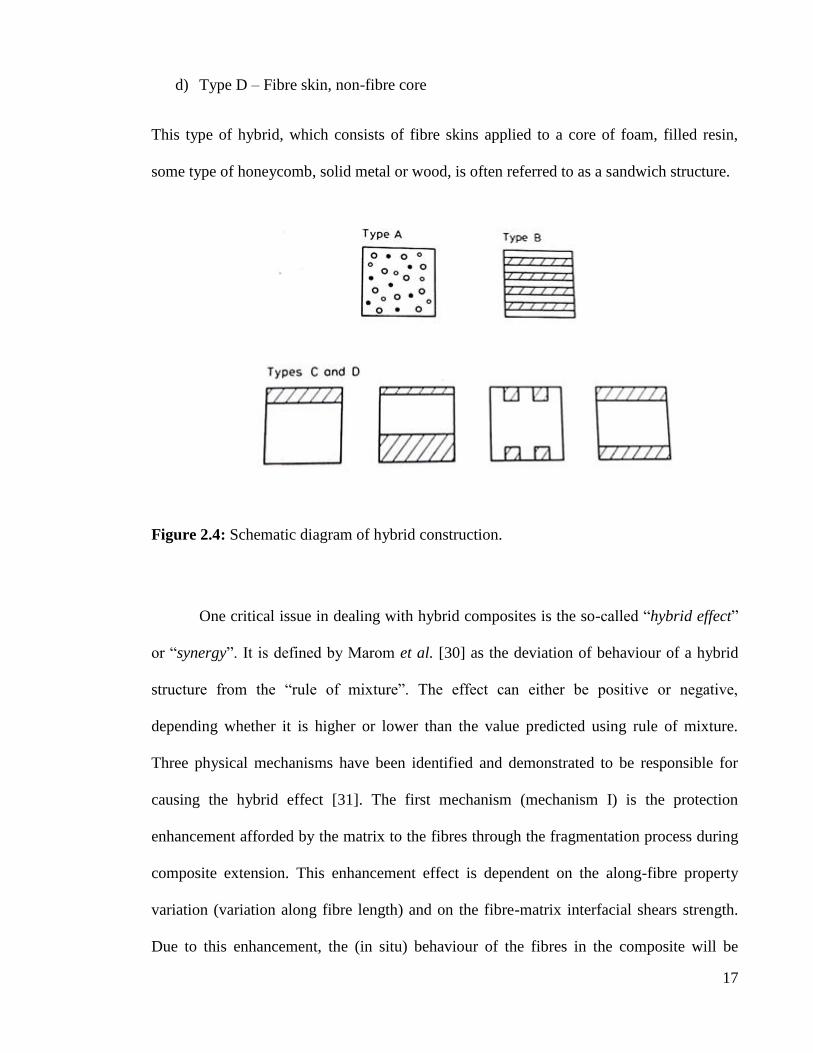
Hybrid fibre composites can be classified into four general types according to its
construction [29]. Schematic diagram of the hybrid types is provided in Figure 2.4.
a) Type A – Dispersed fibre
This consists of intimate mixture of two or more types of continuous fibres aligned, but
randomly dispersed throughout a common resin matrix.
b) Type B – Dispersed fibre ply
Basically this consists of random or alternating mixture of two or more types of fibre ply.
c) Type C – Fibre skin and core
This type consists of outer skins of one or more sorts of fibre laminate applied to a core
made of another fibre laminate. Both skins and core may be made of unidirectional or angle
ply material or type A or B hybrids. It is common to have the stiffer fibre (such as carbon
fibre) in the skins.
17
d) Type D – Fibre skin, non-fibre core
This type of hybrid, which consists of fibre skins applied to a core of foam, filled resin,
some type of honeycomb, solid metal or wood, is often referred to as a sandwich structure.
Figure 2.4: Schematic diagram of hybrid construction.
One critical issue in dealing with hybrid composites is the so-called “hybrid effect”
or “synergy”. It is defined by Marom et al. [30] as the deviation of behaviour of a hybrid
structure from the “rule of mixture”. The effect can either be positive or negative,
depending whether it is higher or lower than the value predicted using rule of mixture.
Three physical mechanisms have been identified and demonstrated to be responsible for
causing the hybrid effect [31]. The first mechanism (mechanism I) is the protection
enhancement afforded by the matrix to the fibres through the fragmentation process during
composite extension. This enhancement effect is dependent on the along-fibre property
variation (variation along fibre length) and on the fibre-matrix interfacial shears strength.
Due to this enhancement, the (in situ) behaviour of the fibres in the composite will be
18
different from the original (ex situ) fibre behaviour determined before the fibres being
embedded into the matrix. The second mechanism is related to the between-fibre property
variation, i.e. variation of breaking strains between fibres of the same type. Because of this
variation, the composite will break gradually according to the statistical distribution of their
breaking strength or strain, eventually reducing the values of strength and breaking
elongation of the composite due to the fibre-fibre interaction of the same type. These two
mechanisms can also be seen in non-hybrid composites. The third mechanism is the cross
coupling effects between the LE (fibre with lower breaking elongation) fibres and HE
(fibre with higher breaking elongation) fibres.
2.4 Processing
Processing can be defined as the engineering activity concerned with operations carried out
on polymeric materials/filler system to increase their utility. It deals with the conversion of
raw materials into finished product involving compounding and shaping which leads to
morphology stabilisation, and thus, value added products [32].
2.4.1 Compounding/Extrusion
In compounding, a base polymer resin in a molten form is combined in a batch or
continuous mixers with fillers, reinforcements, other polymers, pigments, modifiers, and
miscellaneous additives to improve properties, reduce costs, or improve processabilty. It
involves dispersion of the fillers and additives in the molten polymer. Compounding may
be defined as the production of a more useful and uniform product, in a more usable form
[33].

19
There are two principal mixing mechanisms that dictate the type of equipment and
mixing configuration. Dispersive mixing involves the reduction of the size of a component
having cohesive character, within a continuous liquid phase. The cohesive character is due
to Van der Waals forces between particles of the agglomerates or to the surface tension and
elastic properties of the liquid droplets. The second mechanism is distributive mixing of
components lacking a cohesive character, which results in their distribution throughout the
volume. Distributive mixing depends on frequency of reorientation of flow elements under
strain. Schematic diagram of the individual mixing mechanisms and their effect are are
shown in Figure 2.5.
Figure 2.5: Distributive and dispersive mixing aspects
Primary mixing mechanisms for polymer blends, filled polymers or formulations
are determined by the characteristics of the components. For high aspect ratio fibres (e.g.,

20
carbon), a distributive mixing configuration is mostly required. A combination of
distributive and dispersing mechanisms is operative for compounds containing
agglomerated low aspect ratio fillers such as talc.
Compounding is the first step towards the establishment for a microstructure that
would control the desired properties of the finished product. For multiphase polymer
systems containing a rigid dispersed phase (fibre), the melt compounding step controls the
degree of dispersion and distribution of the fibres in the compounded pellets. The generated
microstructure needs to remain stable in the subsequent fabrication (shaping) step.
The extruder is one of the most important pieces of machinery in polymer
processing. Extrusion is defined as a plastic shaping process in which melted plastic resin is
forced through an opening to produce a product that maintains relatively consistent size and
shape [34]. Extrusion is highly suitable for mixing thermoplastic because the basic
chemical nature of a thermoplastic usually does not change significantly as a result of the
process [35]. Processing thermosets through extrusion is cumbersome. There is risk of the
thermoset hardening in the barrel (due to crosslinking) which will damage the machine.
In this work, the extruder employed is an intermeshing co-rotating twin screw
extruder. The rotation action of two intermeshing screws has additional capabilities that
cannot be achieved by single screw extruders. The advantages are better melting and
mixing, fast pressure build-up along the screw channel, narrow residence time distribution
and positive conveying of polymer solid and melt along the screw channel. The
intermeshing co-rotating twin screw extruder has been established as the most popular
continuous mixing device [36].
21
2.4.2 Moulding
Moulding of plastics can be defined as the confinement of a mass of molten plastic in a
cavity of defined dimensions, called a mould, while it hardens to the desired shape or
finished article. There are several moulding processes such as compression moulding,
thermoforming and injection moulding.
Compression moulding is widely used to manufacture products from thermosetting
plastics. In compression moulding, the material is introduced directly into a heated metal
hold, softened by heat and forced to conform to the shape of the mould cavity as the mould
closes. A calculated amount of the material, either powder, preforms or granular form is
positioned in the heated female mould cavity. The mould is then closed and the part is
formed by heat and pressure. After a set amount of time, the mould is opened and ejector
pin pushes the part out of the mould. Compression moulding is more widely used in the
plastic industry for thermosetting polymer is due to the fact that the mould does not need to
cool down prior to removing the finished article. Thermosetting polymer would cure inside
the mould and harden while thermoplastic would need to cool down for it to harden. In
addition, the process is not suitable for producing intricate parts or parts with fragile
features.
In injection moulding, the polymer is softened and conveyed with a screw (similar to
extrusion), and the molten polymer is pushed through a system of runners into cavities in
the mould. The mould is cooled and after a set amount of time, the mould separates and the
finished article is ejected [37]. Injection moulding has supplanted compression moulding as
the premier choice of manufacturing some polymer products due to its advantages in
material handling and automation. However, injection moulding is more suited to produce
products in high volume due to its higher initial start-up cost (more expensive machinery).

22
2.5 Properties
2.5.1 Thermal properties
Thermal analysis represents a broad spectrum of analytical techniques designed to assess
the response of materials to thermal stimuli, typically temperature change. Various
techniques evaluate changes in enthalpy, specific heat, thermal conductivity and diffusivity,
linear and volumetric expansion, mechanical and viscoelastic properties with temperature.
2.5.1.1 Differential scanning calorimetry
The differential scanning calorimeter (DSC) is the instrument that has dominated the field
of thermal analysis. It measures heat flows and temperatures associated with exothermic
and endothermic transitions. The ease with which important characteristics such as
transitions, heat capacity, reaction, and crystallisation kinetics are characterised has made
the DSC widely used in the plastics laboratory.
The DSC can operate in one of two ways: with a power-compensated design in
which energy absorbed or evolved by the sample is compensated by adding or subtracting
an equivalent amount electrical energy to a heater located in the sample holder.
Alternatively, it can operate based on a heat flux design by which it measures the
differential heat flow between a sample and an inert reference. Modulated DSC is an
extension of conventional DSC in which the material is exposed to cyclic, rather than
linear, heating profile. Deconvolution of the heat flow results obtained provides unique
benefits, including improved resolution of closely occurring or overlapped transitions,
increased sensitivity for subtle transitions, and separation or reversing and non-reversing
thermal phenomena [38].

23
DSC is routinely used for investigation, selection, comparison and end-use
performance of materials. Material properties that are routinely measured are glass
transition temperature, freezing point, melting point, boiling point, decomposition
temperature, crystallisation, phase changes, melting crystallisation, product stability, cure
and cure kinetics, and oxidative stability.
Hartikainen et al. studied the thermal properties of PP composites reinforced with
long glass fibre and CaCO3 particulates [39]. In this study, DSC was mainly used to study
the crystalllinity of the composite. However, due to the small size of the CaCO3 and the
surface treatment of the particulates, no significant changes were observed in the
crystallinity of the composites.
Li Yu et al. reported that in a clay/glass fibre/epoxy hybrid nanocomposite,
increasing the clay content would increase the Tg of the composite [40]. The introduction of
clay would restrict the mobility of the epoxy molecules resulting in the increase.
2.5.1.2 Thermogravimetric analysis
Thermogravimetric analysis (TGA) is the second most used thermal technique. It measures
weight changes in a material as a function of temperature or time under a controlled
atmosphere. As the material degrades due to the temperature, it releases volatile
compounds into the atmosphere, thus reducing the weight of the sample on balance. TGA is
usually done either in temperature sweep mode or isothermal mode. The mode selected is
based on which properties are currently being studied. The main uses include measurement
of a materials thermal stability and composition. It can also be used to determine the

24
amount of bound and free water in polymer products and magnetic properties of composite
materials.
TGA was used by Li Yu et al. to study the thermal stability of clay/glass
fibre/epoxy composite [40]. The researchers reported that the thermal stability of the
composite improved with increasing clay content. The results suggested that the increase of
decomposition at the onset of decomposition is due to the improvement of barrier
properties by the intercalated composites, in which clay act as barriers to decrease the
permeability of degradation compounds.
2.5.2 Dynamic mechanical analysis
A dynamic mechanical analyser (DMA) is a controlled-stress or controlled-strain
instrument that provides information on mechanical properties such as modulus, energy
dissipation, and material stability. DMA is a powerful technique for developing a
fundamental understanding of materials behaviour. A vast amount of research has led to the
development of mathematically rigorous science that allows for the characterisation of
polymers as well as the extrapolation of properties [38].
There are several modes of operation of DMAs. The most common is the
rotational/torsional type instrument, although a number of linear tensile-compressive types
are now available. These may operate either in a constant-strain or constant-stress mode. In
the former, the specimen is always deflected to a defined strain while the stress is
measured. Constant-stress mode is the converse. Constant stress modes are preferred for
creep mode type experiment while the constant-strain mode lends themselves better to
stress-relaxation studies.

25
Consider applying a sinusoidal strain to an ideal elastic solid as shown in Figure 2.6;
( ) ( ) (2.1)
where ε is the strain and ω is the angular frequency.
Figure 2.6: Stress and strain in dynamic mechanical analysis
At any point in time, the stress will be proportional to the strain according to Hooke’s law;
( ) ( ) ( ) ( ) (2.2)
where σ is the applied stress.

26
Thus, for an ideal solid, the stress will be sinusoidal function in-phase with the strain and
the ratio of the amplitude of stress and strain will be storage modulus of the material.
( )
(2.3)
where δ is the phase angle.
Now consider what happens if a sinusoidal force is applied to an ideal liquid;
( ) (2.4)
At any point in time, the stress will be proportional to the strain rate in accordance with
Newton’s law of velocity;
( ) ( ) ( )
( ) (
) (2.5)
Thus, for an ideal liquid, the stress will be a sinusoidal function of 90° out of phase with
the strain. This 90° phase difference between the sinusoidal stress and strain in liquids is
the key to the use of DMA as a tool for characterising visco-elastic materials. A visco-
elastic material has properties intermediate between those of an ideal solid and an ideal
liquid, therefore it exhibits a phase lag somewhere between 0° (ideal solid) and 90° (ideal
liquid). The phase lag is a measure of the relative degree of viscous character to elastic
character [41].
The importance of DMA as a tool in the study of the behaviour of composite
structures is paramount. It has been proved to be an effective method to study the
relaxations in polymers and thereby the behaviour of materials under various conditions of

27
stress, temperature and phase composition of fibre composites and its role in determining
the mechanical properties.
Idicula et al. produced an intimately mixed short banana/sisal hybrid fibre
reinforced polyester composite and studied its dynamic mechanical behaviour [42]. The
researchers found that at 3:1 fibre ratio with total volume fraction of 0.40, the composite
produces the best stress transfer between the fibres. The composite has the lowest tan δ and
highest storage modulus (E’) value at glass transition temperature (Tg). Using Arrhenius
equation, it was found that the composite at that formulation has the highest activation
energy for glass transition. The results were confirmed by SEM images.
2.5.3 Mechanical Properties
2.5.3.1 Tensile properties
Tensile test is the most commonly performed test. Dumb-bell shaped specimens were used
to prevent any artefacts in the measurement which were caused by deformation of the
material in the grip region. Truly accurate measurements require extensometers, which can
be either contact or non-contact.
Stress-strain behaviour represents the response of a material to loading. Tests are
performed on a universal testing machine (UTM), sometimes referred to as a tensile tester
because of the primary mode of deformation used to characterise this form of behaviour.
Specimens are typically deformed at a constant cross-head speed. Due to the viscoelastic
effect, the stress-strain relationship of a plastic composite is rate dependent. Performing
tensile measurement at higher cross-head speeds results in stiffer response (higher modulus
value). In addition, the properties may also vary significantly at different temperature. Tests

28
can be done within an environmental chamber to obtain data at elevated and sub-ambient
temperatures. Several modes of deformation have been devised along the lines of the
principal mode of deformation seen in the material: tension, compression, shear and
flexure.
The modulus is the slope of the initial portion of the stress-strain curve. It
measurement is complicated due to the fact that most plastics, unlike metals, do not have a
linear relationship between stress and strain. This means that the modulus decreases with
increasing strain, and the measured value depends on the strain region used as well as
whether the slope is taken as a secant, a chord, or a tangent to this region [38]. There is
justification for each of these methods and is chosen based on the intended application of
the data. In order to ensure comparability, standards are used to define criteria for modulus
measurement.
Tensile strength is the maximum stress that the material can withstand before
failure. It suffers from variability in cases where the material is brittle, where the failure
may be dictated by microscopic defect in the specimen. In contrast, ductile materials
exhibit well defined maxima that results in repeatable tensile strength measurement.
Fu et al. studied the tensile properties of injection moulded carbon fibre reinforced
polypropylene composite and the effect of mean fibre length [43]. The researchers found
that with increase in fibre loading, the mean fibre length was decreased due to increased
fibre breakage during processing. It was suggested that the combined effect of fibre volume
fraction and mean fibre length determines the final tensile property of the composite.
Carbon fibre reinforced polypropylene composites were shown to have higher tensile
modulus when compare to polypropylene composites reinforced with glass fibre.
29
Composites with higher mean fibre length tend to have higher tensile strength. Modulus
however is more dependent on the fibre volume fraction.
Jacob et al. prepared a sisal/oil palm hybrid fibre reinforced natural rubber
composite and studied its mechanical properties [44]. The researchers report that increasing
the total fibre loading in the composite would decrease the tensile strength and tear
strength. However, the modulus of the composite increased with increase in total fibre
loading. The researchers also studied the effect of fibre surface modification (alkali
treatment) and bonding agent on the composite and found that the alkali treatment
improved the adhesion between the matrix and the fibre thus improving its mechanical
properties.
Velmurugan and Manikandan studied the mechanical properties of palmyra/glass
fibre hybrid composites [45]. The researchers produced two types of hybrid composite
where in one composite the palmyra fibre and glass fibre were mixed together. In the other
hybrid composite, palmyra fibre reinforced composite were sandwiched by glass fibre
reinforced mats. The mechanical properties such as impact, tensile, shear and bending
properties were improved with introduction of glass fibre along the palmyra fibres. The
sandwiched hybrid composite shown better properties when compared to the intimately
mixed hybrid. In addition, the introduction of glass fibres reduced the moisture absorption
of the composite.
2.5.3.2 Interfacial adhesion and compatibility between fibre and matrix
The importance of good interfacial interaction between components in a composite is well
documented. The interface plays a major part during the stress transfer from the matrix to

30
the fibre during loading. A good adhesion would result in an efficient stress transfer thus
producing a stronger and stiffer material. However, if the interfacial interaction is too
strong, the material would be very brittle and notch sensitive [46]. A sufficiently strong
(but not too strong) interfacial interaction is desirable especially for materials exposed to
possible impact damage.
The interfacial interaction can be modified through several methods such as
introduction of coupling agent or the surface modification of the fibres. For example,
maleic anhydride grafted polypropylene (MAPP), a coupling agent, can be introduced into
the matrix to improve the adhesion between the fibre and the matrix. Tjong et al. studied
the effect of MAPP on the mechanical strength of short glass fibre/styrene-ethylene-
butylene-styrene (SEBS) / polypropylene hybrid [47]. The researchers found that the
introduction of the coupling agent improved the stiffness of the composite, indicating an
improvement to the interfacial adhesion. However, improved interfacial adhesion caused
the fracture toughness of the material to decrease. Rijsdijk et al. found that MAPP
improves the flexural strength of continuous glass fibre reinforced polypropylene
composites [48]. They found that both longitudinal and transverse flexural strength were
improved up to 10 wt% MAPP content. When the MAPP content was further increased, the
flexural properties were decreased.
The effect of moisture on the mechanical strength of composites has been widely
reported and is especially notorious in composites made from hygroscopic materials such
as nylon and natural fibre composites [47, 49-51]. The presence of moisture could reduce
the mechanical strength of a composite by weakening its interfacial interaction. Almgren et
al. [52] states that the interfacial stress transfer is less efficient when moisture is present is
adsorbed into the interface. With a less efficient stress transfer, most of the load was carried

31
by the matrix instead of the fibre. Bradley et al. also reported that the moisture would
reduce the tensile strength and interfacial shear strength of 7 different composite by up to
22% [53]. In order to counter this problem, the specimens are thoroughly dried and stored
with silica gels prior to testing.
2.5.3.3 Flexural properties
Flexural analysis is the study of a material’s resistance to bending. Studying the flexural
properties of a composite is important because in its real life application, most of the
components will be subjected to a mixture of loading which may include bending, either
accidentally or intentionally. Flexural stress-strain curve are obtained by monitoring the
force required to flex a material and the displacement that the material undergoes as a result
of the applied force at a constant deformation rate.
Flexural modulus, an intensive property, is defined as the ratio of stress to strain in
flexural deformation. It can also be defined as the tendency for the material to bend. Higher
flexural modulus value indicates that the material is resistant to bending.
The flexural strength is the highest stress experienced within the material at its point
of failure. When an object formed of a single material, like a wooden beam or a steel rod,
is bent, it experiences a range of stresses across its depth. At the edge of the object on the
inside of the bend (concave face) the stress will be at its maximum compressive stress
value. At the outside of the bend (convex face) the stress will be at its maximum tensile
value. These inner and outer edges of the beam or rod are known as the 'extreme fibres'.
Most materials fail under tensile stress before they fail under compressive stress, so the

32
maximum tensile stress value that can be sustained before the beam or rod fails is its
flexural strength.
Rozman et al. studied the flexural properties of oil palm empty fruit bunch
(OPEFB)-glass fibre polypropylene composite [54]. The researchers found that increasing
the amount of OPEFB in the hybrid causes the flexural strength to decrease. Natural fibres
tend to be irregularly shaped, unlike man-made fibres which have uniform cross-section.
The ability to support stress for non-uniform fillers such as the OPEFB is rather poor,
resulting in a weaker composite. Similar observation was reported by Mishra et al. [55].
2.5.3.4 Impact Properties
Impact is a catastrophic event that has become very important for plastic composites. The
impact properties of a material represent its ability to absorb and dissipate energies under
impact or shock loading. In practice, the impact condition may range from accidental
dropping of hand tools to high-speed collisions, and the response of structure may range
from localized damage to total disintegration. If a material is strain rate sensitive, its static
mechanical properties cannot be used in designing against impact failure. Furthermore, the
fracture modes in impact conditions can be quite different than those observed in static
tests.
While measurements of impact performance have always been made in the past,
new applications in the aeronautics, automotive, electronics and consumer appliance
industries have placed considerable importance on the quantification of this behaviour. A
variety of standard impact test methods are available for metals (ASTM E23) and
unreinforced polymers (ASTM D256). Some of these tests have also been adopted for fibre

33
reinforced composites. However, as in the case of metals and unreinforced polymers, the
impact tests do not yield basic material property data that can be used for design purposes.
They are useful in comparing the failure modes and energy absorption capabilities of two
different materials under identical impact conditions.
Historically, Izod test has been used routinely to characterize impact. A notched
rectangular bar is clamped in a vice and broken by a sharp impact from a hammer attached
to a moving pendulum. Izod test have been widely criticized for being unsuitable for
plastics, but it remains the most common test for impact and failure characterisation [38].
The Charpy test, widely used in Europe, has seen better acceptance by the scientific
community. Here the test specimen, similarly notched, is held in a flexural mode while it is
subjected to the impact. Typically, Izod impact energies are lower than Charpy impact
energies.
Razaei et. al developed a short carbon fibre reinforced polypropylene composite for
car bonnet [56]. The composite was prepared by melt blending and were moulded into the
finished article using a hot press. They found that the composite has higher strength,
stiffness, Izod impact energy and thermal stability when compared to neat polypropylene.
They also found that composites with 10% fibre loading has comparable properties to
traditional steel bonnet, with added advantage of lower weight. However, their study into
the impact behaviour is not thorough as they only studied the Izod impact energy of the
composite.
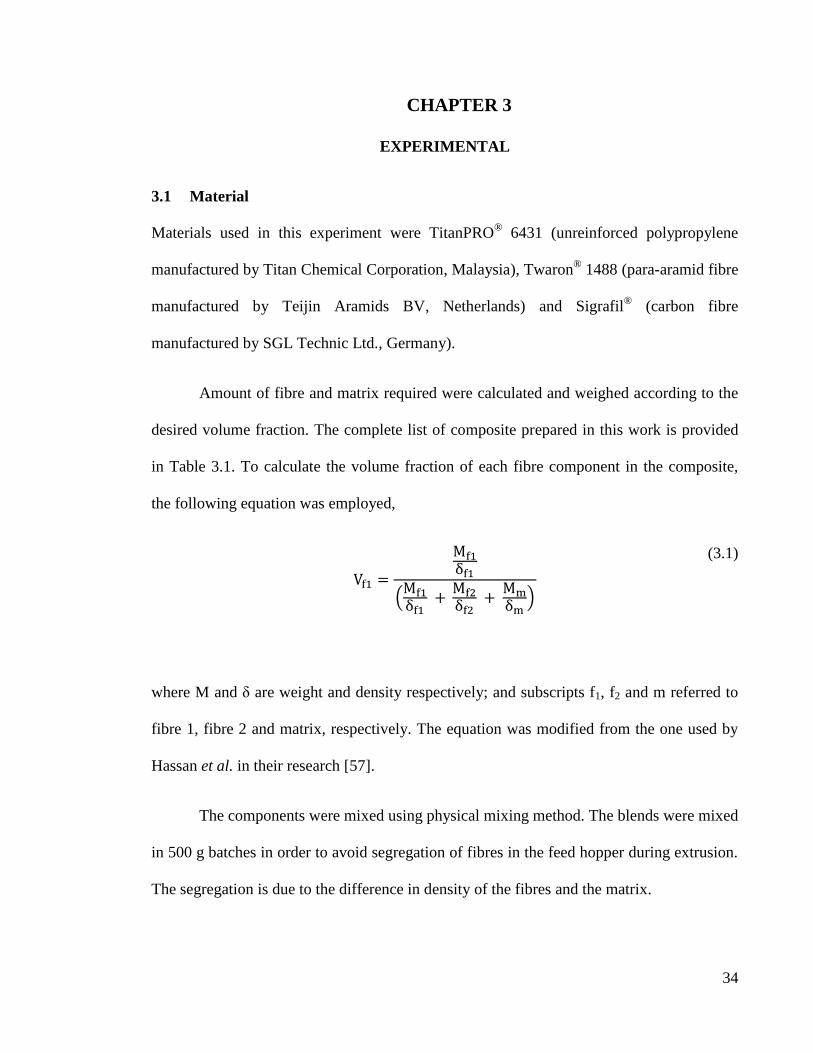
34
3 CHAPTER 3
EXPERIMENTAL
3.1 Material
Materials used in this experiment were TitanPRO® 6431 (unreinforced polypropylene
manufactured by Titan Chemical Corporation, Malaysia), Twaron® 1488 (para-aramid fibre
manufactured by Teijin Aramids BV, Netherlands) and Sigrafil®
(carbon fibre
manufactured by SGL Technic Ltd., Germany).
Amount of fibre and matrix required were calculated and weighed according to the
desired volume fraction. The complete list of composite prepared in this work is provided
in Table 3.1. To calculate the volume fraction of each fibre component in the composite,
the following equation was employed,
(
)
(3.1)
where M and δ are weight and density respectively; and subscripts f1, f2 and m referred to
fibre 1, fibre 2 and matrix, respectively. The equation was modified from the one used by
Hassan et al. in their research [57].
The components were mixed using physical mixing method. The blends were mixed
in 500 g batches in order to avoid segregation of fibres in the feed hopper during extrusion.
The segregation is due to the difference in density of the fibres and the matrix.

35
Table 3.1: List of composites produced during experiment
Designated
Name
Polyproylene
(v/v %)
Aramid fibre
(v/v %)
Carbon fibre
(v/v %)
5(5.00:0.00) 95 5 0
5(3.75:1.25) 95 3.75 1.25
5(2.50/2.50) 95 2.5 2.5
5(1.25/3.75) 95 1.25 3.75
5(0.00/5.00) 95 0 5
10(10.00:0.00) 90 10 0
10(7.50:2.50) 90 7.5 2.5
10(5.00:5.00) 90 5 5
10(2.50:7.50) 90 2.5 7.5
10(0.00:10.00) 90 0 10
20(20.00:0.00) 80 20 0
20(15.00:5.00) 80 15 5
20(10.00:10.00) 80 10 10
20(5.00:15.00) 80 5 15
20(0.00:20.00) 80 0 20
Specimens were designated according to their composition; for example, A(B:C)
refers to specimen with total fibre volume fraction of A% where B is the Vf of aramid fibre
and C is the Vf of carbon fibres.

36
3.2 Processing
3.2.1 Compounding
The materials were dried in a vacuum oven at 90°C for at least 8 hours prior to processing
to remove moisture. The presence of moisture during processing would cause voids to form
which could significantly affect the mechanical properties of the composites. This step is
very important especially with hygroscopic materials such as aramid fibres. In addition, the
presence of steam in the barrel could possibly cause some degradation to occur. The
materials were compounded using a twin screw extruder (BRABENDER® KETSE 20/40
Lab Compounder, Germany). The extrusion was done at screw speed 80 RPM with the
heaters set from 185°C to 195°C. The nozzle temperature was set at 200°C. The screw
speed was chosen so that that fibre degradation could be kept at a minimum. The extrudate
was quenched in an icy water bath and air dried prior to palletisation.
3.2.2 Injection moulding
Impact and tensile specimens were moulded using a 55 tonne BOY®
55M injection
moulding machine (BOY®, Germany). The parameter for injection moulding is provided in
Table 3.2. A single gated eight cavities bar shaped mould was used for the impact
specimens while for the tensile specimens, a single gated four cavities bar shaped mould
were used.
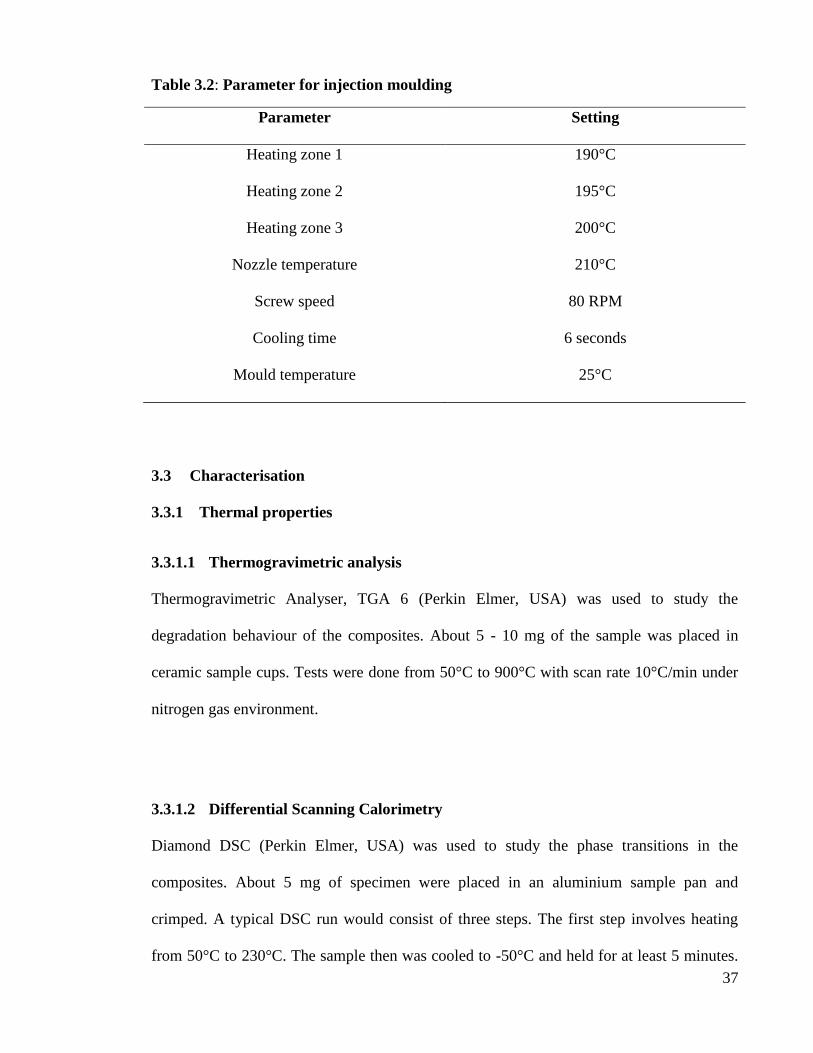
37
Table 3.2: Parameter for injection moulding
Parameter Setting
Heating zone 1 190°C
Heating zone 2 195°C
Heating zone 3 200°C
Nozzle temperature 210°C
Screw speed 80 RPM
Cooling time 6 seconds
Mould temperature 25°C
3.3 Characterisation
3.3.1 Thermal properties
3.3.1.1 Thermogravimetric analysis
Thermogravimetric Analyser, TGA 6 (Perkin Elmer, USA) was used to study the
degradation behaviour of the composites. About 5 - 10 mg of the sample was placed in
ceramic sample cups. Tests were done from 50°C to 900°C with scan rate 10°C/min under
nitrogen gas environment.
3.3.1.2 Differential Scanning Calorimetry
Diamond DSC (Perkin Elmer, USA) was used to study the phase transitions in the
composites. About 5 mg of specimen were placed in an aluminium sample pan and
crimped. A typical DSC run would consist of three steps. The first step involves heating
from 50°C to 230°C. The sample then was cooled to -50°C and held for at least 5 minutes.

38
The final step involves heating from -50°C to 230°C. All these steps were done under
controlled condition, with heating and cooling rate of 10°C/min. The first step was taken as
precaution to remove the thermal history of the materials. The melting temperature (Tm),
crystallisation temperature (Tc), melting enthalpy (ΔHm), and crystalline enthalpy (ΔHc)
were determined from the last two steps.
3.3.2 Mechanical properties
3.3.2.1 Tensile test
Tensile tests were performed using a universal testing machine (Instron 5569, USA)
equipped with a 50 kN load cell and a mechanical extensometer at a cross-head speed of 10
mm.min-1
. The specimen dimension and shape is in accordance with ASTM D638 [58].
The tests were done at room temperature and the extensometer jaw grip was set at 50 mm.
Minimum of seven specimens per batch were tested to get the best reproducible results. For
each batch of specimen, the average values of Young's modulus (E), tensile strength and
tensile strain were calculated by the software from the stress over strain curve obtained. E
was calculated at 0.5% strain.
3.3.2.2 Flexural test
Flexural tests were performed using a universal testing machine (Instron 5569, USA). The
distance between the supports spans (L) were 50 mm, the cross-head speed of 1.33
mm/min. The speed of cross-head motion (R), was calculated by using the equation:
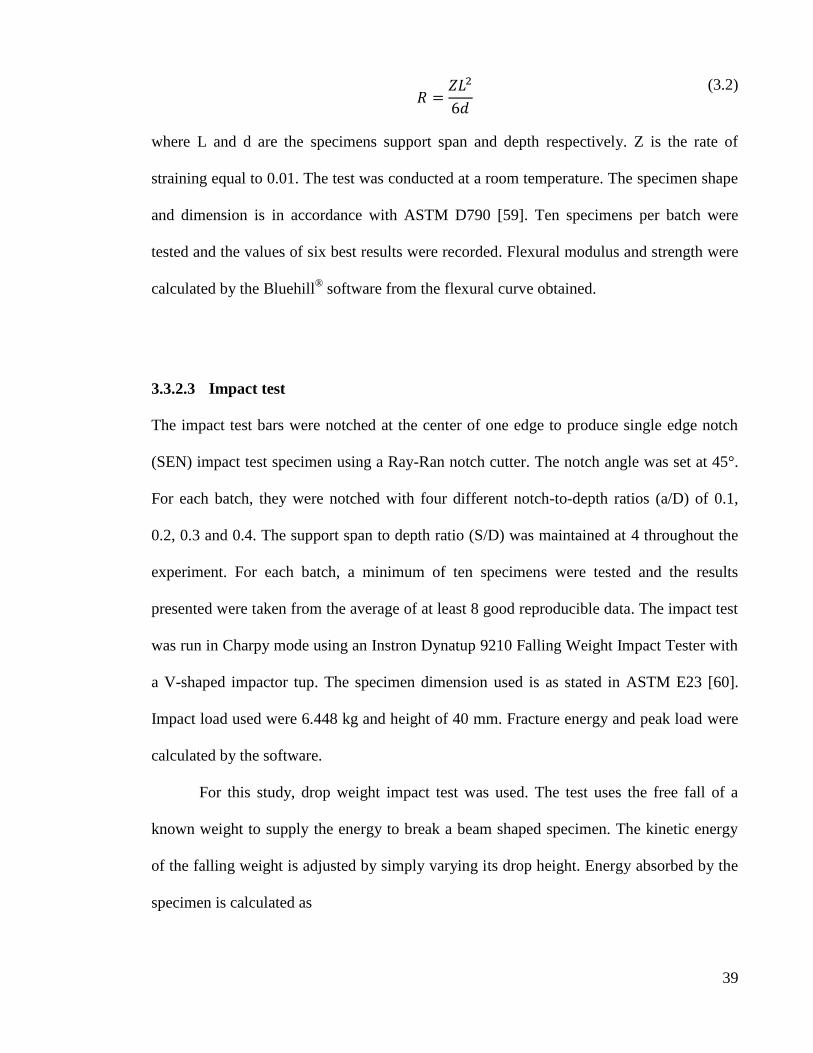
39
(3.2)
where L and d are the specimens support span and depth respectively. Z is the rate of
straining equal to 0.01. The test was conducted at a room temperature. The specimen shape
and dimension is in accordance with ASTM D790 [59]. Ten specimens per batch were
tested and the values of six best results were recorded. Flexural modulus and strength were
calculated by the Bluehill® software from the flexural curve obtained.
3.3.2.3 Impact test
The impact test bars were notched at the center of one edge to produce single edge notch
(SEN) impact test specimen using a Ray-Ran notch cutter. The notch angle was set at 45°.
For each batch, they were notched with four different notch-to-depth ratios (a/D) of 0.1,
0.2, 0.3 and 0.4. The support span to depth ratio (S/D) was maintained at 4 throughout the
experiment. For each batch, a minimum of ten specimens were tested and the results
presented were taken from the average of at least 8 good reproducible data. The impact test
was run in Charpy mode using an Instron Dynatup 9210 Falling Weight Impact Tester with
a V-shaped impactor tup. The specimen dimension used is as stated in ASTM E23 [60].
Impact load used were 6.448 kg and height of 40 mm. Fracture energy and peak load were
calculated by the software.
For this study, drop weight impact test was used. The test uses the free fall of a
known weight to supply the energy to break a beam shaped specimen. The kinetic energy
of the falling weight is adjusted by simply varying its drop height. Energy absorbed by the
specimen is calculated as
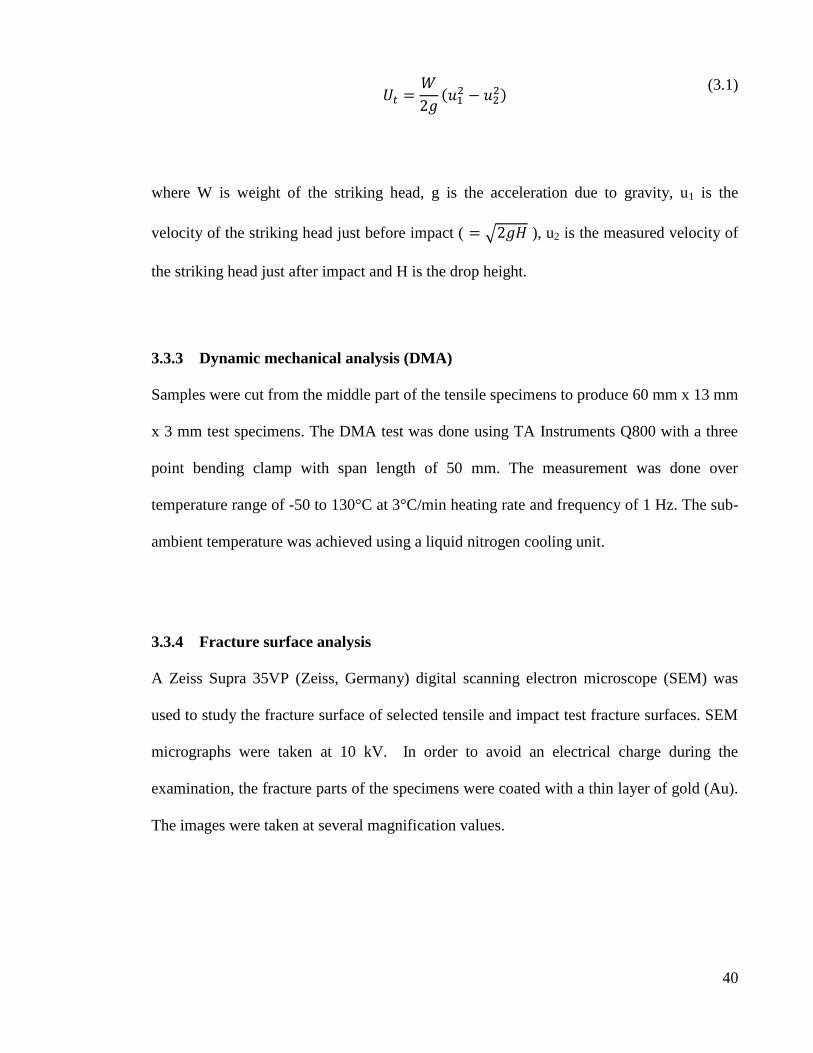
40
(
)
(3.1)
where W is weight of the striking head, g is the acceleration due to gravity, u1 is the
velocity of the striking head just before impact ( √ ), u2 is the measured velocity of
the striking head just after impact and H is the drop height.
3.3.3 Dynamic mechanical analysis (DMA)
Samples were cut from the middle part of the tensile specimens to produce 60 mm x 13 mm
x 3 mm test specimens. The DMA test was done using TA Instruments Q800 with a three
point bending clamp with span length of 50 mm. The measurement was done over
temperature range of -50 to 130°C at 3°C/min heating rate and frequency of 1 Hz. The sub-
ambient temperature was achieved using a liquid nitrogen cooling unit.
3.3.4 Fracture surface analysis
A Zeiss Supra 35VP (Zeiss, Germany) digital scanning electron microscope (SEM) was
used to study the fracture surface of selected tensile and impact test fracture surfaces. SEM
micrographs were taken at 10 kV. In order to avoid an electrical charge during the
examination, the fracture parts of the specimens were coated with a thin layer of gold (Au).
The images were taken at several magnification values.

41
4 CHAPTER 4
RESULTS AND DISCUSSION
4.1 Thermogravimetric analysis (TGA)
TGA is a method studying the effect of temperature on the physical and chemical
properties of a sample. When a sample decomposes or degrades after prolonged exposure
to high temperature, the products would normally evaporate into the atmosphere, resulting
in loss of weight. TGA can be done either by using constant temperature for a certain time
(isothermal run) or by using a temperature sweep (scanning run). Understanding the
thermal stability of a material is very important as it allows us to determine a safe service
temperature range for the material. In addition, it can provide vital information that can be
used by the engineers during material selection and product design. In this study, the
samples were subjected to a temperature sweep from 50 to 900°C with heating rate of
10°C.min-1
. The resulting TGA curves are shown in Figures 4.1 – 4.3. `
From the curves, important information such as the thermal stability and weight
fraction of the composite components can be obtained. The weight fractions of the
components in the composite are important because it indicates the success of the mixing
step. There were several precautionary steps taken during the processing step as suggested
by Hassan et al. [61]. Prior to compounding the individual components in the extruder, the
polypropylene pellets and the fibres were weighed carefully and premixed in 500 g batches.
If this step is not taken, there is high probability that the component with higher density
would settle down in the hopper. The weight fractions for the matrix and fibre were
compared with the calculated values in Table 4.1.

42
Figure 4.1: TGA thermogram of composites with 5% total Vf at different fibre proportions
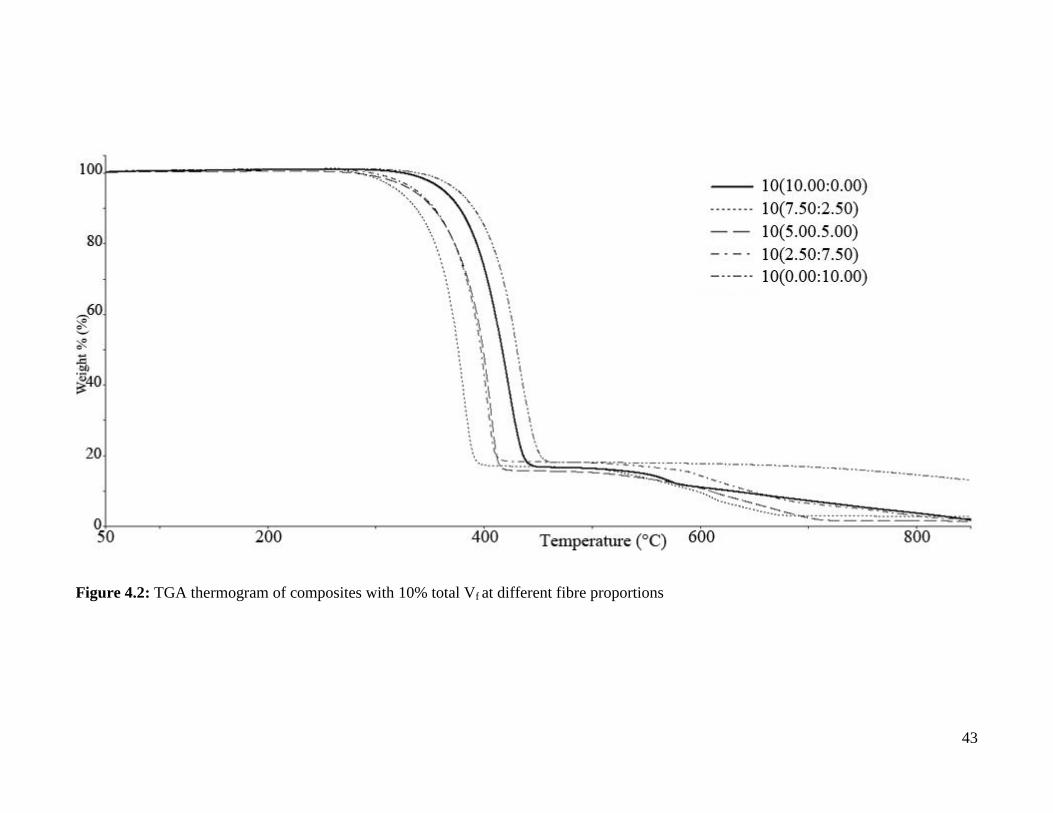
43
Figure 4.2: TGA thermogram of composites with 10% total Vf at different fibre proportions

44
Figure 4.3: TGA thermogram of composites with 20% total Vf at different fibre proportions

45
Table 4.1: Calculated and experimental weight fraction for all composites.
Composite Wm
(Experimental)
Wm
(Calculated)
Total Wf
(Experimental)
Total Wf
(Calculated)
5(5.00:0.00) 91.21 92.39 8.79 7.61
5(3.75:1.25) 91.40 92.01 8.60 7.99
5(2.50:2.50) 92.19 91.64 7.81 8.36
5(1.25:3.75) 91.30 91.27 8.70 8.73
5(0.00:5.00) 90.92 90.90 9.08 9.10
10(10.00:0.00) 83.50 85.18 16.50 14.82
10(7.50:2.50) 81.86 84.51 18.14 15.49
10(5.00:5.00) 84.28 83.85 15.72 16.15
10(2.50:7.50) 83.03 83.20 16.97 16.80
10(0.00:10.00) 82.22 82.55 17.78 17.45
20(20.00:0.00) 72.36 71.88 27.64 28.13
20(15.00:5.00) 69.46 70.80 30.54 29.20
20(10.00:10.00) 71.08 69.76 28.92 30.24
20(5.00:15.00) 72.19 68.75 27.81 31.25
20(0.00:20.00) 69.85 67.77 30.15 32.23
From Table 4.1, it can be observed that the difference between the experimental
weight fraction value for the matrix and fibre components and its calculated value is small.
For example, the experimental Wm for 20(0.00:20.00) is 69.85% while the calculated value
is 67.77%. The difference is relatively small and it can be concluded that the mixing
process produced composites with desired formulation. It is impossible to differentiate
between aramid and carbon fibre in the hybrid composite using TGA. Therefore, the
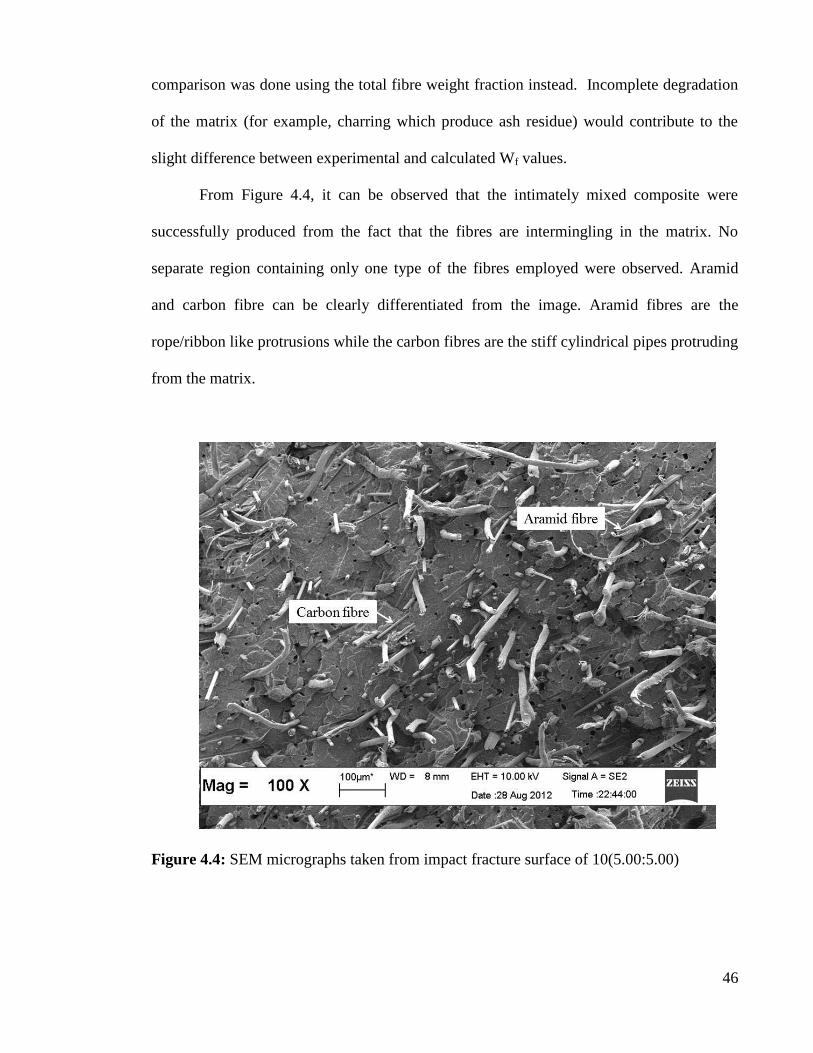
46
comparison was done using the total fibre weight fraction instead. Incomplete degradation
of the matrix (for example, charring which produce ash residue) would contribute to the
slight difference between experimental and calculated Wf values.
From Figure 4.4, it can be observed that the intimately mixed composite were
successfully produced from the fact that the fibres are intermingling in the matrix. No
separate region containing only one type of the fibres employed were observed. Aramid
and carbon fibre can be clearly differentiated from the image. Aramid fibres are the
rope/ribbon like protrusions while the carbon fibres are the stiff cylindrical pipes protruding
from the matrix.
Figure 4.4: SEM micrographs taken from impact fracture surface of 10(5.00:5.00)

47
4.1.1 The effect of total fibre volume fraction, Vf
The thermal stability of a composite can be characterized by the onset temperature, the
derivative peak temperature and the temperature at 50% weight loss, which are referred as
Tonset, DTp and T50% respectively, as tabulated in Table 4.2. As heating occurs in an inert
environment, a non-oxidative degradation occurs. T50% is widely accepted as the
temperature where the material will start to fail. Tonset indicates the temperature in which
the material begins to degrade. The derivative peak temperature indicates the point of
greatest rate of change on the weight loss curve.
The TGA curves for carbon fibre reinforced composite (CFRC) show a single step
degradation process. The degradation of the polypropylene matrix occurred between 300°C
to 450°C. Residues were present after the test. This is because under nitrogen gas
environment and in the temperature range tested, carbon fibre would not degrade. In
addition, some ash from the degradation of polypropylene could be present.
Increasing the amount of carbon fibre in the CFRC has affected the thermal stability
of the composite. For example, as the fibre content increased from 5 to 10%, the Tonset
increases from 360.0°C to 396.3°C. However, as the fibre content were further increased to
20%, Tonset value decreased to 367.0°C. The same trend was also observed in T50% and DTp
values. T50% values for CFRC with 5, 10 and 20% Vf are 396.4, 430.4 and 405.5°C,
respectively. DTp values for CFRC with 5, 10 and 20% Vf are 410.9, 430.5 and 412.0°C,
respectively. Rezaei et. al. have reported that increasing the carbon fibre content increased
the degradation temperature of the composites [62]. Carbon fibre has higher heat
absorption capacity compared to polypropylene. As more fibres are introduced into the
system, more heat was absorbed by the fibres and higher temperature was needed to
achieve the threshold energy for commencement of degradation.

48
Table 4.2: Tonset, DTp and T50% for all composites.
Composition Tonset (°C)
T50% (°C)
DTp (°C)
5(5.00:0.00) 346.8 379.6 390.8
5(3.75:1.25) 372.0 397.8 413.0
5(2.50:2.50) 378.0 406.7 381.7
5(1.25:3.75) 361.3 398.1 369.5
5(0.00:5.00) 360.0 396.4 410.9
10(10.00:0.00) 383.4 417.4 422.8
10(7.50:2.50) 349.6 375.6 427.2
10(5.00:5.00) 376.8 398.9 406.9
10(2.50:7.50) 372.9 397.0 415.9
10(0.00:10.00) 396.3 430.4 430.5
20(20.00:0.00) 298.9 349.5 347.9
20(15.00:5.00) 319.0 369.5 423.8
20(10.00:10.00) 373.1 414.2 403.4
20(5.00:15.00) 359.5 397.5 400.8
20(0.00:20.00) 367.0 405.5 412.0
The degradation temperature increased because as the amount of carbon fibre in the
composite increased, the fibres in the composite would absorb more heat, thus higher
temperature was needed to achieve the threshold energy for commencement of the
degradation process, as explained by Rezaei et al. [62, 63]. Incorporation of fillers reduced
the chain mobility in the absorption and boundary layers, which caused the decrease to the
tension induced to the carbon-carbon chain by thermal excitation. Majority of the bond

49
breaking that occurred during thermal degradation is due to this induced tension and since
the tension was reduced, the degradation was also reduced. In addition, it was also found
that the fibre length plays an important role in the thermal properties of fibre reinforced
composites. The researchers found that longer carbon fibres produce composites with better
thermal properties. This explains the drop in thermal stability of carbon reinforced
composites with 20% total Vf. At higher fibre content, the probability of fibre-fibre
interaction during processing will increase. Increased fibre-fibre collision would cause fibre
breakage to occur during processing and produce shorter carbon fibre fragments.
For aramid fibre reinforced composites (AFRC), the TGA curves showed a
multistep degradation process. The first step, starting at 250°C, was due to degradation of
the polypropylene matrix while the second step, starting around 400°C, was due to
degradation of the aramid fibre. Bourbigot et al. studied the degradation of para-aramid
fibres (Kevlar® 29 knitted fabric) using TGA and FTIR [64]. The researchers found that p-
aramid fibres would start to degrade at around 550°C and formed a 38 wt. % residue at
1200°C. However, in the presence of oxygen, the fibre starts to degrade at 450°C and
formed a 3 wt. % residue. This indicates that oxygen plays a big role in the degradation
process. Major degradation products are C, CO, CO2 and H2O. HCN and ethylene species
are the minor degradation products and at higher temperature, the HCN evolved reacts to
produce NO through mechanism proposed by the authors. The solid residue were analysed
and found to be char composed of polyaromatic compounds partially oxidised. Maity et al.
reported that polypropylene composites reinforced with Twaron®
fibres have higher
degradation temperature when compared to pure PP [65]. The effect is more pronounced
when the fibres were fluorinated (to improve interfacial interaction) which indicates that

50
better interfacial interaction between the fibre and the matrix would also improve the
thermal stability of the composite.
The effect of fibre loading on the thermal stability of AFRC showed a similar trend
to CFRC. For AFRC, the Tonset and T50% increase when the aramid reinforcement increased
from 5% to 10%. However, further increase in aramid content (10% to 20%) causes both
parameters to decrease which indicates lower thermal stability. The Tonset values for AFRC
with 5, 10 and 20% Vf are 346.8, 383.4 and 298.9°C, respectively. T50% values for AFRC
with 5, 10 and 20% Vf are 379.6, 417.4 and 349.5°C, respectively. DTp values for AFRC
with 5, 10 and 20% Vf are 390.8, 422.8 and 347.9°C, respectively.
The initial increase in the thermal stability of the composites is due to the increase
in fibre content in the composite, as discussed earlier. The decrease in thermal stability as
the fibre content was further increased is believed to be due to the fibre dispersion. The
SEM image of composites reinforced with 20% Vf aramid has shown that there are fibre
bundles in the composite, which indicates poor dispersion. The presence of undispersed
aramid fibre bundles can be seen in Figure 4.5. The poor dispersion would cause the
shielding effect to be less effective, hence reducing the thermal stability of the composite.
The presence of fibre bundles are due to wetting problem. This is due to the inability of the
viscous molten matrix to reach in between the fibres during mixing and in this case might
be due to the high amount of aramid fibres. This is an interesting discovery that can serve
as a guideline for future research.

51
Figure 4.5: The presence of undispersed aramid fibre bundles in specimen with 20%
aramid fibre content.
The effect of total Vf on the thermal stability of the hybrid composites showed
mixed effect. For hybrid composite with 75:25 V:V% fibre proportions, Tonset and T50%
decreased as the total Vf was increased which indicates that the thermal stability of the
hybrid decreased with higher Vf. Tonset for the hybrid decreased from 372.0°C to 349.6°C
when total Vf was increased from 5 to 10%. It would further decrease to 319.0°C as the
total Vf increased to 20%. For T50%, the value decreased from 397.8°C (Vf 5%) to 375.6°C
(Vf 10%) and 369.5°C (Vf 20%). On the other hand, DTp value showed increase when total
Vf was increased from 5 to 10% and slightly lowered when the total Vf was further
increased to 20%. DTp values for the hybrid composites at 5, 10 and 20% total Vf are
413.0, 427.2 and 423.8°C, respectively.
52
Hybrid composites with 50:50 V:V% fibre proportions showed slight decrease in
Tonset value with increasing total Vf. Tonset values for the composites are 378.0°C (Vf 5%),
376.8°C (Vf 10%) and 373.1°C (Vf 20%). T50% showed initial decrease, from 406.7 to
398.9°C, when total Vf was increased from 5 to 10%. Increasing the total Vf further to 20%
would cause the T50% value to increase to 414.2°C. DTp values for the hybrid composites at
total Vf 5, 10 and 20% are 381.7, 406.9 and 403.4°C, respectively.
Tonset and DTp values for hybrid composites with 25:75 V:V% fibre proportions
showed similar trend. Tonset values initially increased from 361.3 to 372.9°C as the total Vf
was increased from 5 to 10%. Further increasing the total Vf to 20% would cause the Tonset
value to decrease to 359.5°C. DTp values for the hybrid composites at 5, 10 and 20% total
Vf are 369.5, 415.9 and 400.8°C, respectively. For hybrid with 25:75 V:V% fibre
proportions, T50% was not significantly affected by the increase in total Vf.
4.1.2 The effect of fibre proportion
In general, the effect of fibre proportions did not show any clear trends with regards to
thermal stability. No significant increase or decrease in the thermal stability can be
attributed to change in fibre proportions. Please refer to Table 4.2.
However, some of the hybrid composites were found to possess better thermal
stability in certain aspects when compared to the non-hybrid composites. For example, the
hybrid composite 20(10.00:10:00) starts to deteriorate significantly at 373°C and half of the
composite weight was lost at 414.0°C. This is significantly higher than AFRC
(20(20.00:0.00)) and CFRC (20(0.00:20.00)) with similar total volume fraction. Another
hybrid, 5(2.50:2.50) starts to degrade at 378.0°C and is more thermally stable compared to
its non-hybrid counterparts, 5(5.00:0.00) and 5(0.00:5.00), which starts to deteriorate at

53
346.8°C and 360.0°C, respectively. This indicates the presence of synergy where
hybridisation of both fibres produces composites with higher thermal stability compared to
its single fibre counterpart.
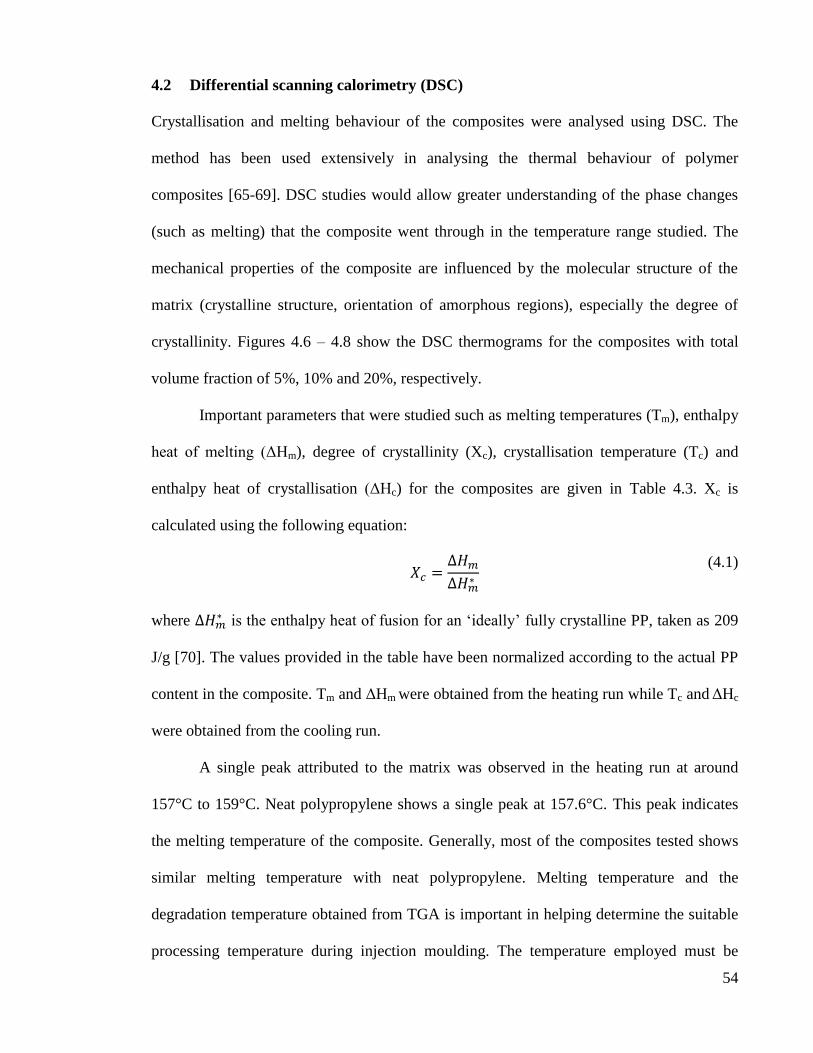
54
4.2 Differential scanning calorimetry (DSC)
Crystallisation and melting behaviour of the composites were analysed using DSC. The
method has been used extensively in analysing the thermal behaviour of polymer
composites [65-69]. DSC studies would allow greater understanding of the phase changes
(such as melting) that the composite went through in the temperature range studied. The
mechanical properties of the composite are influenced by the molecular structure of the
matrix (crystalline structure, orientation of amorphous regions), especially the degree of
crystallinity. Figures 4.6 – 4.8 show the DSC thermograms for the composites with total
volume fraction of 5%, 10% and 20%, respectively.
Important parameters that were studied such as melting temperatures (Tm), enthalpy
heat of melting (ΔHm), degree of crystallinity (Xc), crystallisation temperature (Tc) and
enthalpy heat of crystallisation (ΔHc) for the composites are given in Table 4.3. Xc is
calculated using the following equation:
(4.1)
where is the enthalpy heat of fusion for an ‘ideally’ fully crystalline PP, taken as 209
J/g [70]. The values provided in the table have been normalized according to the actual PP
content in the composite. Tm and ΔHm were obtained from the heating run while Tc and ΔHc
were obtained from the cooling run.
A single peak attributed to the matrix was observed in the heating run at around
157°C to 159°C. Neat polypropylene shows a single peak at 157.6°C. This peak indicates
the melting temperature of the composite. Generally, most of the composites tested shows
similar melting temperature with neat polypropylene. Melting temperature and the
degradation temperature obtained from TGA is important in helping determine the suitable
processing temperature during injection moulding. The temperature employed must be

55
above the melting temperature of the composite but not so high as to cause the material to
degrade inside the barrel. Several studies have also found that fibre content does not
significantly affect the melting temperature of the composites [71]. However, fillers such as
carbon nanotube that would change the crystal structure (for example, α crystal to β crystal)
of the matrix would cause the Tm to change accordingly [72].
4.2.1 The effect of total Vf
Melting behaviour
In general, the introduction of the reinforcing fibres did not significantly alter the melting
temperature of the composites, as evident in Table 4.3. For AFRC, Tm for the composites at
5, 10 and 20% Vf are 158.9, 157.6 and 157.3°C, respectively. For CFRC, Tm for the
composites at 5, 10 and 20% Vf are 159.1, 157.6 and 157.6°C, respectively.
Most of the hybrid composites also showed similar trend as observed above. Refer
to Table 4.3. For example, for hybrid composites with 25:75 V:V% fibre proportions, the
Tm for composites with total Vf of 5, 10 and 20% are 159.5, 157.4 and 156.0°C,
respectively. However, hybrid composite 5(2.50:2.50) showed slightly lower Tm value
compared to the other specimens (154.8°C). The reduction in Tm may be due to degradation
that might occur when the composites were being processed. The presence of hot spots
during processing might cause the polymer chains to degrade and produce polymer chains
with lower molecular weight. This will cause the melting temperature to decrease [73].
Both hybrids, 5(3.75:1.25) and 5(1.25:3.75), show higher Tm value at 159.6°C and
159.5°C, respectively. There is no clear cause for the anomaly since there was no
discernible trend observed.

56
ΔHm is very important because its magnitude is directly proportional to the Xc of
the composite. From the data, it was discovered that for AFRC, increasing the fibre content
would reduce the ΔHm of the composite. The enthalpy reduced from 93.0 J/g to 87.3 J/g
when the fibre content was increased from 5% to 10%. The value went down further to
55.6 J/g when the fibre content was increased to 20%. It is possible that the presence of
aramid fibres inhibits the rearrangement of the polypropylene chain during crystallisation
making it more amorphous. Cao et al. in their study found that the addition of Kevlar
fibres would promote α crystallisation of the polypropylene matrix, especially near the fibre
surface [74]. However, it is worth noting that the fibres used in their work were surface
treated to improve the interaction between the fibre and the matrix while the aramid fibres
employed in our study were used as provided.
On the other hand, initially increasing the amount of carbon fibre increases the ΔHm
of CFRC. However, as the Vf was increased to 20%, ΔHm decreased. ΔHm for the
composites at 5, 10 and 20% Vf are 72.9, 81.4 and 45.2 J/g, respectively. Tan et al. in their
study found the presence of carbon fibre content accelerated the crystallisation process of
polypropylene [75]. They found that most crystallite would initially appear near the
crossing point of fibres. An increase in the amount of fibres would increase the number of
crossing points, which would explain the initial increase in crystallinity.

57
Table 4.3: Thermal properties from DSC for all composites
Specimen Tm (°C) ΔHm (J/g) Xc (%) Tc (°C) ΔHc (J/g)
5(5.00:0.00) 158.9 93.0 44.5 120.5 103.0
5(3.75:1.25) 159.6 103.6 49.6 120.6 101.4
5(2.50:2.50) 154.8 90.0 43.1. 114.8 95.9
5(1.25:3.75) 159.5 82.9 31.7 120.9 101.1
5(0.00:5.00) 159.1 72.9 38.4 125.6 103.0
10(10.00:0.00) 157.6 87.3 41.8 128.0 92.2
10(7.50:2.50) 157.9 71.4 34.1 127.9 102.7
10(5.00:5.00) 157.8 86.7 41.5 127.8 105.1
10(2.50:7.50) 157.4 80.3 38.4 127.7 104.6
10(0.00:10.00) 157.6 81.4 47.2 116.0 92.2
20(20.00:0.00) 157.3 55.6 26.6 121.0 95.5
20(15.00:5.00) 157.1 55.7 26.7 116.6 84.5
20(10.00:10.00) 157.3 65.8 31.5 119.7 92.5
20(5.00:15.00) 156.0 67.8 32.4 117.4 94.5
20(0.00:20.00) 157.6 45.2 32.0 116.6 95.5

58
Figure 4.6: DSC curves of composites with 5% total Vf at different fibre proportion

59
Figure 4.7: DSC curves of composites with 10% total Vf at different fibre proportion
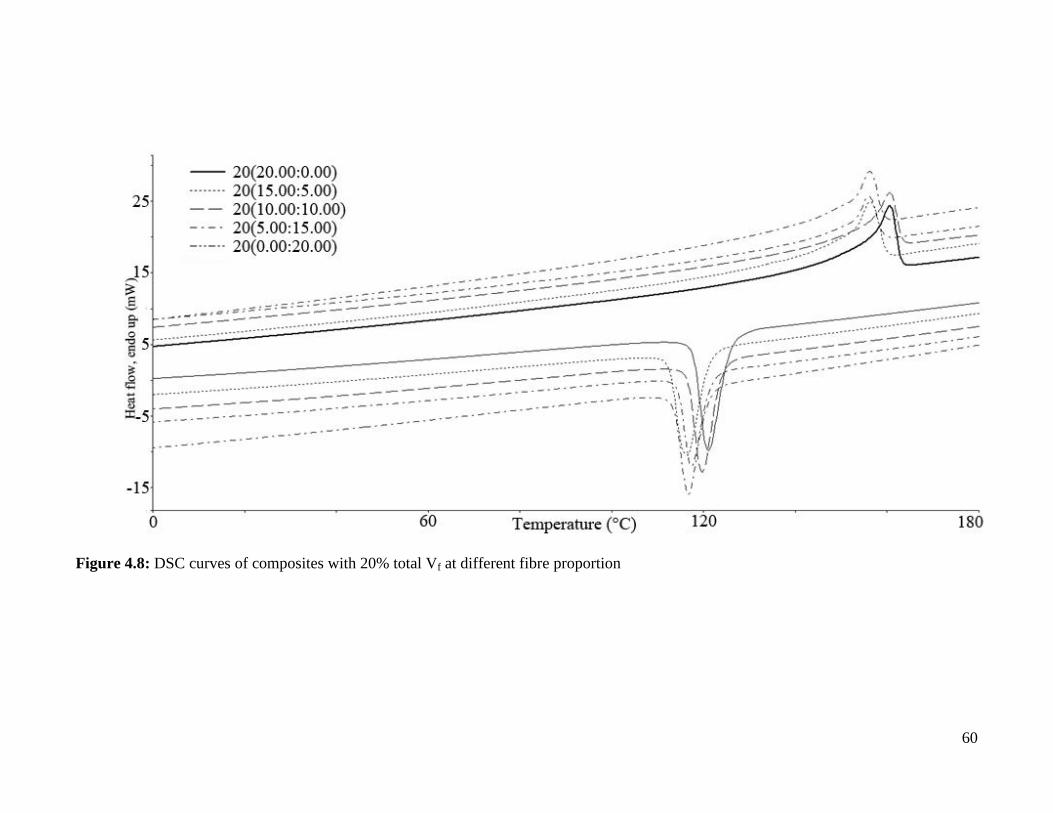
60
Figure 4.8: DSC curves of composites with 20% total Vf at different fibre proportion

61
For the hybrid composites, increasing the total Vf decreases the ΔHm values
(provided in Table 4.3). For hybrid composites with 75:25 V:V% fibre proportions, ΔHm
for the composites with total Vf 5, 10 and 20% are 103.6, 71.4 and 55.7 J/g, respectively.
Similar trend was observed for hybrid composite with 50:50 V:V% and 25:75 V:V% fibre
proportion. For hybrid composites with 50:50 V:V% fibre proportions, ΔHm for the
composites with total Vf 5, 10 and 20% are 90.0, 86.7 and 65.8 J/g, respectively. For hybrid
composites with 25:75 V:V% fibre proportions, ΔHm for the composites with total Vf 5, 10
and 20% are 82.9, 80.3 and 67.8 J/g, respectively.
Crystallisation behaviour
From Table 4.3, it was found that the degree of crystallinity (Xc) of AFRC would decrease
with increasing fibre content. Xc for AFRC decreases from 44.5% to 41.8% as Vf increases
from 5% to 10% and decreased further to 26.6% as Vf increased to 20%. Increasing the
amount of aramid fibres in the composite system hinders the rearrangement of the polymers
crystals, hence causing Xc to decrease. For CFRC, a mixed effect was observed. Xc
increases from 38.4% to 47.2% when carbon fibre content was increased from 5% to 10%.
When the fibre content was further increased to 20%, Xc reduced to 32.0%. Tan et. al.
reported that increasing the amount of carbon fibre in the composite would increase the rate
of crystallisation [76]. The researchers found that the nucleation of polypropylene started at
the crossing point of two or more carbon fibres. However, at 20% fibre loading, the
hindrance by the high amount of fibre could have caused crystallinity to be reduced.
For the hybrids, mixed effect was observed. For hybrid composites with 75:25 and
50:50 V:V% fibre proportions, Xc would decrease with increasing total Vf. Xc for hybrids

62
with 75:25 V:V% at 5, 10 and 20% total Vf are 49.6, 34.1 and 26.7%, respectively. For
hybrids with 50:50 V:V% fibre composition, Xc for hybrids with total Vf 5, 10 and 20% are
43.1, 41.5 and 31.5%, respectively. However, hybrid composites with 25:75 V:V % fibre
proportions exhibits a different trend. Xc would initially increase, from 31.7% to 38.4%, as
total Vf increases from 5 to 10%. As the total Vf was increased to 20%, Xc decreased to
32.4%. The mixed effect could be due to the contrasting effect of aramid and carbon fibres
on the crystalisation behaviour of the matrix. Nayak et. al. investigated the influence of
bamboo/glass fibre on the thermal properties of polypropylene hybrid composites [69]. The
researchers found that the addition of fibres increased Xc due to the formation of nucleation
sites on the fibres.
4.2.2 The effect of fibre proportions
Varying the fibre proportions did not show any clear effect with respect to Tm, ΔHm and Xc
of the composites. Tm, ΔHm and Xc values are provided in Table 4.3. No clear trend was
observed. It can be inferred that the properties mentioned in the above statement are more
sensitive towards the total Vf rather than the fibre proportions. However, improvement on
the interfacial interaction between the fibre and the matrix could change this. It has been
reported that improvement on the fibre-matrix interaction cause the fibres to have
significant effect on the crystallisation behaviour of polypropylene [74].
In conclusion, the hybridisation of the fibres did not produce any significant effect
on the melting temperature of the composite. This could be an advantage since that the
hybrid can be processed using similar temperature as the single fibre composites.

63
4.3 Dynamic mechanical analysis (DMA)
Dynamic mechanical analysis is a technique used to study material viscoelastic properties.
It is most useful for studying the viscoelastic properties of plastics and its composites.
Researchers have harnessed the technique to evaluate material properties such the glass
transition temperature (Tg), cross-linking effect, fatigue and other time-dependent
properties [77-81]. The results presented here are the tan δ and storage modulus against
temperature. The effect of fibre loading and hybridisation were investigated.
Figures 4.9 - 4.11 show the variation of tan δ of the composite as a function of
temperature at different total fibre content. The curves were shifted vertically for clarity.
Tan δ is expressed as the ratio of loss modulus to the storage modulus. Over the
temperature range tested, only one clear transition region, indicated by a single damping
maxima, was recorded. The temperature at which this peak is observed is generally known
as the glass transition temperature (Tg). A material would behave glass-like (brittle) below
Tg and rubber-like (ductile) above the threshold. As a simple guideline, materials with
higher Tg will be more brittle at room temperature. The glass transition temperature data
measured through dynamic mechanical analysis allows intelligent decisions to be made
concerning the maximum use temperatures for composite [82]. Important information from
the curves are recorded in Table 4.4.
McCrum et al. reported that the tan δ spectrum of pure PP shows three relaxation
peaks at −80 °C (γ), 8 °C (β) and 100 °C (α) [83]. The γ peak is considered to be associated
with the relaxation of small chain groups like methyl and methylene. The dominant β-
relaxation is assigned to the Tg. The small α-relaxation peak can be attributed to lamellar
slip.
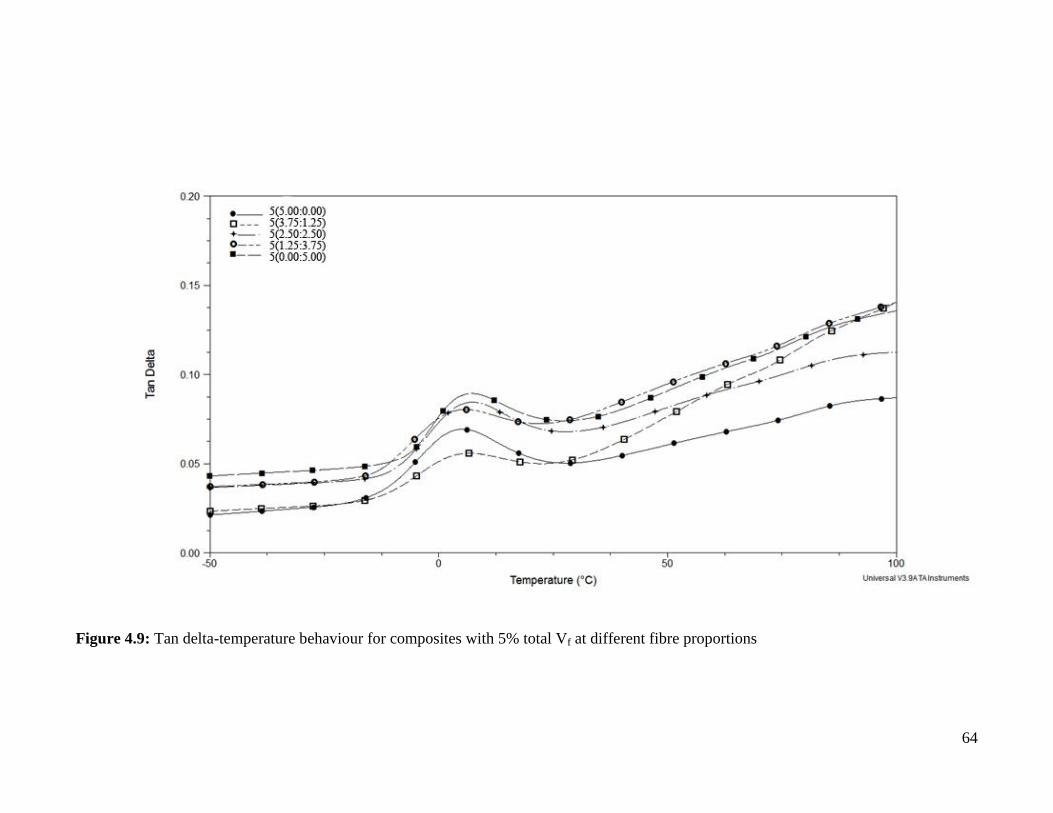
64
Figure 4.9: Tan delta-temperature behaviour for composites with 5% total Vf at different fibre proportions
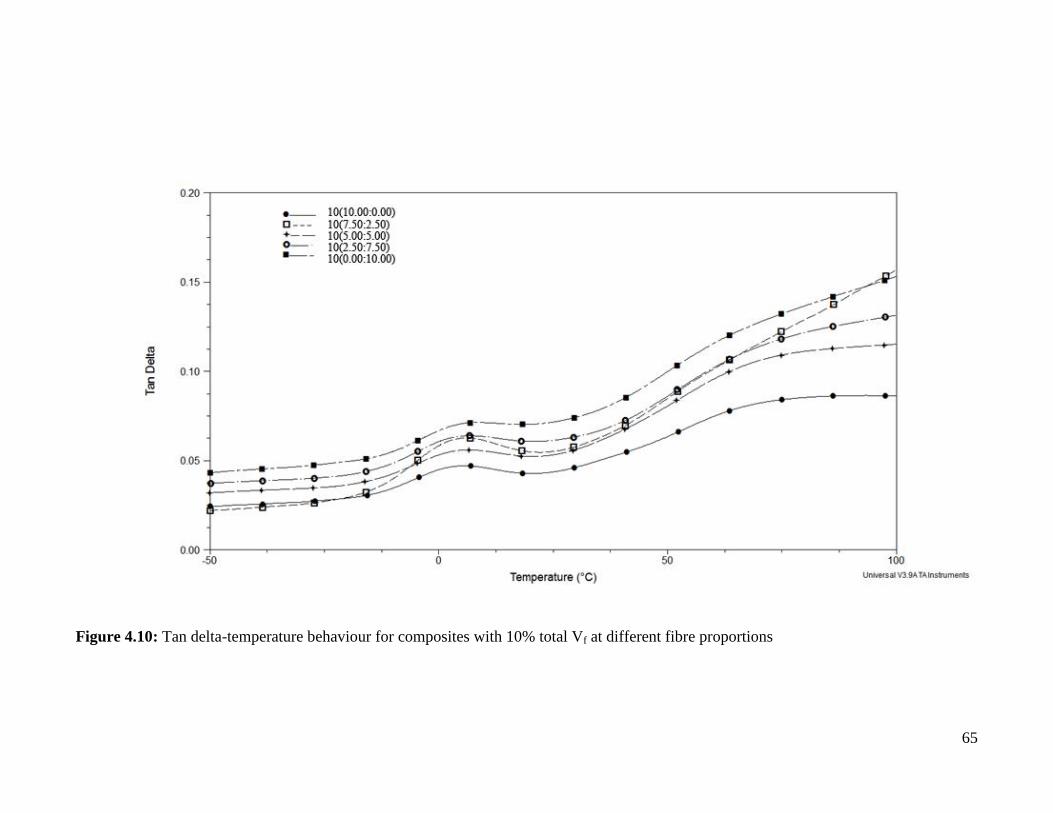
65
Figure 4.10: Tan delta-temperature behaviour for composites with 10% total Vf at different fibre proportions

66
Figure 4.11: Tan delta-temperature behaviour for composites with 20% total Vf at different fibre proportions

67
Table 4.4: Thermomechanical data for all composites
Specimen At 25°C Tan δmax
(x10-2
)
Tg (°C)
E’ (GPa) E” (MPa) Tan δ (x10-2
)
5(5.00:0.00) 2.3 108.2 4.8 5.2 6.1
5(3.75:1.25) 2.2 121.8 5.6 7.2 7.1
5(2.50:2.50) 2.5 135.3 5.4 6.2 5.2
5(1.25:3.75) 3.0 150.1 4.9 6.4 7.1
5(0.00:5.00) 4.0 176.8 4.4 5.0 6.6
10(10.00:0.00) 2.8 121.7 4.4 4.7 5.4
10(7.50:2.50) 3.4 139.7 4.1 4.4 6.2
10(5.00:5.00) 4.0 171.4 4.3 4.5 5.8
10(2.50:7.50) 4.6 214.4 4.7 4.6 7.3
10(0.00:10.00) 4.5 218.4 4.9 5.7 5.5
20(20.00:0.00) 4.2 169.9 4.1 5.3 4.7
20(15.00:5.00) 5.3 217.5 4.1 5.1 3.0
20(10.00:10.00) 5.5 264.5 4.8 6.0 4.3
20(5.00:15.00) 6.7 350.0 5.2 5.7 6.4
20(0.00:20.00) 8.9 456.9 5.2 5.3 5.8

68
4.3.1 The effect of total Vf
Glass transition temperature, Tg
For AFRC, Tg of the composites decreased with increasing aramid fibre content. Tg
decreases from 6.1 °C to 5.4 °C and 4.7 °C as Vf was increased from 5% to 10% and 20%,
respectively. Lower Tg may indicate that the amorphous region in the composite is more
mobile. For CFRC, Tg decreases from 6.6 °C to 5.5 °C when the fibre content was
increased from 5% to 10%. However, when the carbon content was further increased to
20%, the Tg rose slightly to 5.8 °C. For hybrid composites, the same trend was also
observed. For example, Tg for hybrid with 75:25 V:V% at 5, 10 and 20% total Vf are 7.1
°C, 6.2 °C and 3.0 °C, respectively.
Storage modulus, E’
Storage modulus (E’) values at 25 °C was also recorded. It is of interest due to the fact that
most of the mechanical tests done to the specimens were done at room temperature. Figures
4.12 – 4.14 show the storage modulus curve of the composite as a function of temperature.
The values at 25 °C are recorded in Table 4.4. Storage modulus is closely related to the
load bearing capacity of a material and is linked to the flexural modulus. It is a measure of
the energy stored in the material during a cycle and describes the elastic character or the
solid-like nature of the material.
For AFRC, E’25 increases with increasing aramid content, from 2.3 GPa to 2.8 GPa
and 4.2 GPa, when fibre loading was increased from 5% to 10% and 20%, respectively.
This indicates that energy absorption increased with increasing fibre content. The storage

69
modulus always increase with addition of stiff fillers [84]. An even higher value can be
obtained with aramid fibres which were surface treated.
For CFRC, similar trend was observed. E’25 increased from 4.0 GPa to 4.5 GPa and
8.9 GPa, as the carbon content increased from 5% to 10% and 20%, respectively. It can be
seen that carbon fibre is stiffer than aramid fibre, hence the storage modulus for composites
reinforced with carbon fibre is higher when compared to its counterpart.
For hybrid composite, increasing the total fibre content would result in the same
trend as observed previously. For example, E’ values for hybrid composite with fibre
proportion 75:25 V:V% at 5, 10 and 20% Vf are 2.2 GPa, 3.4 GPa and 5.3 GPa,
respectively.
Loss modulus, E”
Loss modulus is also referred as the imaginary (out-of-phase) modulus and is a measure of
the viscous character or liquid-like nature of the material. It relates to the ability of the
material to dissipate energy. Values for E’’25 are provided in Table 4.4.
Increasing the fibre content in AFRC causes the E”25 value to increase. E”25
increases from 108.2 MPa to 121.7 MPa and 169.9 MPa as Vf was increased from 5% to
10% and 20%, respectively. For CFRC, similar trend was observed. E”25 increases from
176.8 MPa to 218.4 MPa and 456.9 MPa as Vf was increased from 5% to 10% and 20%,
respectively.
For the hybrid fibre composite, increasing Vf will increase the magnitude of E”25.
For example, E”25 values for hybrid fibre composite with 50:50 V:V% fibre proportion at 5,

70
10 and 20% total Vf are 135.3 MPa, 171.4 MPa and 264.5 MPa. At a glance, it can be
concluded that increasing the amount of fibre in the composite would improve the energy
dissipation in the system.
Tan delta, tan δ
Tan δ, a mechanical loss factor, is the ratio of the loss modulus to the storage modulus. It
represents the ratio of energy dissipated to energy stored per cycle of deformation and
indicates the damping characteristics of the material.Values of tan δ at 25 °C were recorded
in Table 4.4.
Increasing the fibre content in AFRC causes the tan δ25 value to decrease. Tan δ25
decreases from 4.8 to 4.4 and 4.1 as Vf was increased from 5% to 10% and 20%,
respectively. For CFRC, the opposite was observed. Tan δ25 increases from 4.4 to 4.9 and
5.9 as Vf was increased from 5% to 10% and 20%, respectively.
For the hybrid fibre composite, mixed effect was observed. Hybrid fibre composite
with 75:25 V:V% fibre proportions exhibit decreasing tan δ25 with increasing fibre content.
Increasing the fibre content from 5% to 10% would cause the tan δ25 values to decrease
from 5.6 to 4.1. However, increasing the Vf further to 20% did not change the tan δ25
values. Hybrid fibre composites with 50:50 and 25:75 V:V% showed similar trend.
Increasing Vf from 5% to 10% would cause the tan δ25 to decrease. When Vf is further
increased to 20%, tan δ25 value increased. For example, the tan δ25 values for hybrid
composite with 25:75 V:V% at 5, 10 and 20% Vf are 4.9, 4.7 and 5.2, respectively.

71
4.3.2 The effect of fibre proportion
Storage modulus, E’
When materials with similar Vf were compared alongside, composites reinforced with
carbon fibres tends to have higher Tg than composites reinforced with aramid fibres. For
example, E’ for CFRC at 10% Vf is 4.5 GPa while for AFRC the value is 2.8 GPa. This
indicates that at room temperature, carbon reinforced composite is more brittle than aramid
reinforced composites.
It was found that E’25 would increase with increasing amount of carbon fibre in the
composite. From Table 4.4, it can be observed that the E’25 for 10(7.50:2.50), 10(5.00:5.00)
and 10(2.50:7.50) (ascending carbon fibre content) are 3.4 GPa, 4.0 GPa and 4.6 GPa,
respectively. Similar trend was observed in composites with 5% and 20% total Vf. It can be
concluded that increasing the ratio of carbon fibre in the composite would increase the
stiffness hence higher E’25.
Loss modulus, E”
The effect of fibre proportions on the loss modulus of the composites are similar to the
effect observed in storage modulus. Increasing the amount of carbon fibre in the composite
would increase E”25. For example, E”25 values for composite with 20% total Vf are 169.9
MPa (20(20.00:0.00)), 217.5 MPa (20(15.00:5.00)), 264.5 MPa (20(10.00:10.00)), 350.5
MPa (20(5.00:15.00)) and 456.9 MPa (20(0.00:20.00)). Similar trend was observed for
composites with total Vf 5% and 10%. From these observations, it could be deduced that
increasing the amount of carbon fibre in the hybrid composite improves its energy
dissipation, hence higher loss modulus values.

72
There were no discernable trends regarding the effect of fibre proportions in the hybrid
composite towards Tg and tan δ.
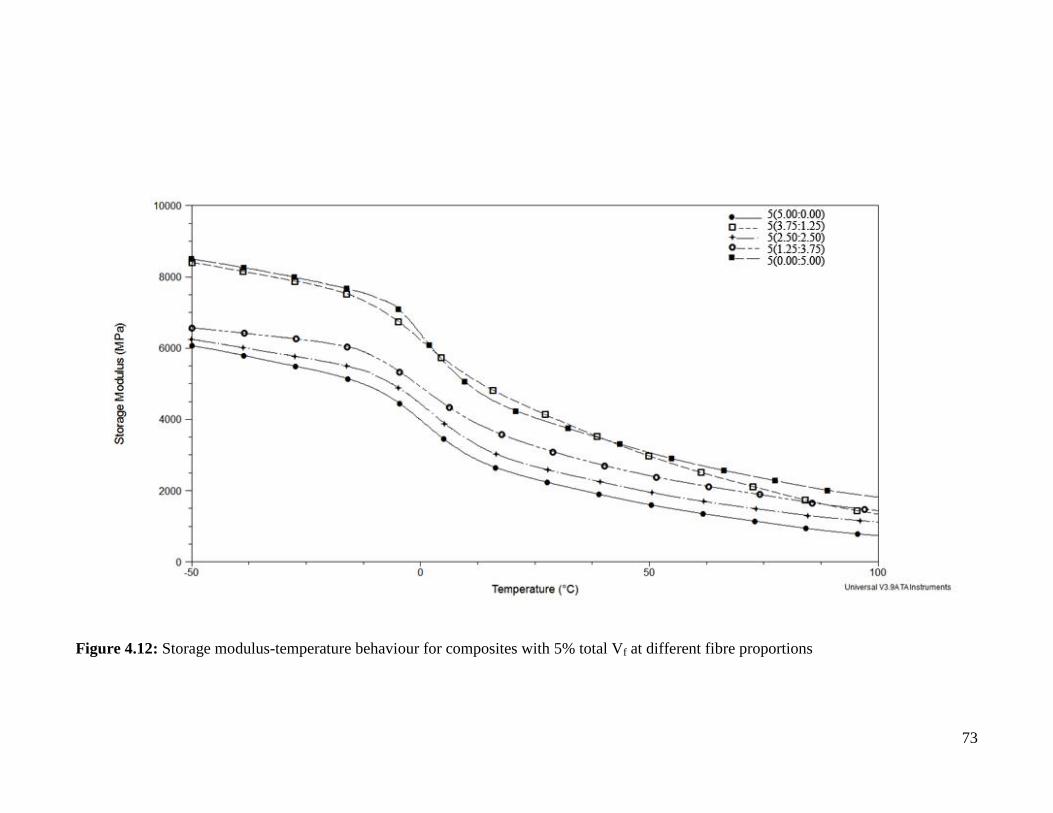
73
Figure 4.12: Storage modulus-temperature behaviour for composites with 5% total Vf at different fibre proportions

74
Figure 4.13: Storage modulus-temperature behaviour for composites with 10% total Vf at different fibre proportions
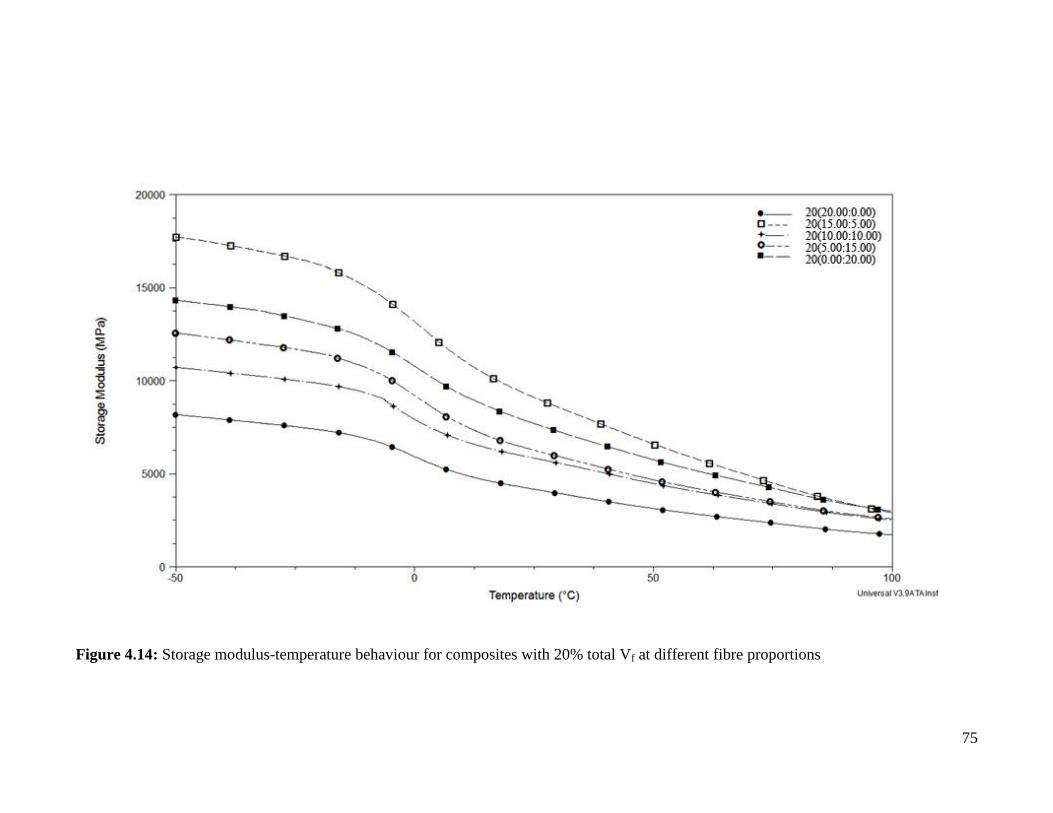
75
Figure 4.14: Storage modulus-temperature behaviour for composites with 20% total Vf at different fibre proportions

76
4.4 Tensile properties
Mechanical properties of a material are heavily influenced by both the tensile properties of
the reinforcement fibres and the properties of the matrix. Depending on the intended
application, reinforcing fibres are added to plastics to improve their mechanical properties.
Plastic composite has the advantage of lower weight and production cost when compared to
traditional materials such as steel. In this study, the effect of fibre volume fraction (Vf) and
hybridisation on the tensile properties was studied. The Young’s modulus, tensile strength
and tensile strain of the composites are provided in Table 4.5.
4.4.1 The effect of total Vf
Young’s Modulus, E
To better illustrate the effect of Vf on the tensile properties of the composite, histogram of
Young’s modulus, tensile strength and tensile strain against the Vf of the composites are
provided in Figure 4.15 - 4.17. From the figures, it can be derived that for all the
composites, increasing the total Vf would increase the modulus. Young’s modulus for the
AFRC increased from 3.26 GPa to 3.48 GPa as the fibre loading was increased from 5% to
10%. The modulus further increased to 3.93 GPa as the fibre loading was further increased
to 20%. For CFRC, the modulus increased from 3.03 GPa to 3.63 GPa as the fibre loading
was increased from 5% to 10%. The modulus further increased to 4.65 GPa as the fibre
loading was further increased to 20%. For hybrid fibre composite with 50:50 V:V% fibre
proportion, modulus increased from 2.98 GPa to 3.67 GPa as the total volume fraction was
increased from 5% to 10%. When the total Vf was increased further to 20%, the modulus

77
increased to 4.38 GPa. CFRC with 20% Vf exhibit the highest modulus (4.65 GPa). Tensile
properties of the composites are provided in Table 4.5.
Table 4.5: Tensile properties for all composites
Specimen Young’s modulus (GPa) Tensile strength (MPa) Tensile strain (%)
5(5.00:0.00) 3.26 38.51 7.71
5(3.75:1.25) 3.11 35.47 8.69
5(2.50/2.50) 2.98 32.19 8.96
5(1.25/3.75) 3.08 34.09 8.42
5(0.00/5.00) 3.03 34.43 7.71
10(10.00:0.00) 3.48 43.33 6.71
10(7.50:2.50) 3.63 37.82 6.67
10(5.00:5.00) 3.67 35.00 6.49
10(2.50:7.50) 3.44 33.06 6.20
10(0.00:10.00) 3.63 30.84 7.00
20(20.00:0.00) 4.65 30.56 5.42
20(15.00:5.00) 4.82 48.04 4.55
20(10.00:10.00) 4.38 40.38 5.75
20(5.00:15.00) 4.53 32.87 5.46
20(0.00:20.00) 3.93 50.53 5.17

78
Figure 4.15: Young’s modulus of all composite at different total Vf
Figure 4.16: Tensile strength of all composites at different total Vf
0
2
4
6
5% 10% 20%
You
ng's
mod
ulu
s (G
Pa)
Volume fraction, Vf (%)
(100:0) (0:100)
(75:25) (50:50)
(25:75)
0
20
40
60
5% 10% 20%
Ten
sile
str
ength
(M
Pa)
Volume fraction, Vf (%)
(100:0) (0:100)
(75:25) (50:50)
(25:75)

79
Figure 4.17: Tensile strain of all composites at different total Vf
The main factors affecting the Young’s modulus are the fibre content, stiffness and
orientation, and matrix stiffness [85]. Thomason and Vlug have reported similar trends in
glass reinforced polypropylene [86]. The researchers found that the modulus of the
composite would increase when the fibre concentration was increased. Further increasing
the fibre concentration beyond the optimal level (40% w/w) would negatively impact the
modulus of the material by introducing voids and undispersed fibre bundles which could
act as stress concentrators.
0
2
4
6
8
10
5% 10% 20%
Ten
sile
str
ain
(%
)
Volume fraction, Vf (%)
(100:0) (0:100)
(75:25) (50:50)
(25:75)

80
Tensile strength
The tensile strength for AFRC decreases with increasing fibre content. The tensile strength
for aramid reinforced composite with 5%, 10% and 20% Vf are 38.51, 43.33 MPa and
30.56 MPa, respectively. Arroyo et. al. reported that addition of aramid fibres increases the
modulus but decreases the tensile strength of the composite [87]. The researchers suggested
that a good contact between the fibres and the matrix exists due to a strong mechanical
adhesion created by the different expansion coefficients of both materials. However, once
the material starts to flow in a tensile test, the fibres begin to slide smoothly at the interface
due to an increment of the temperature caused by the interfacial shear. So, a great effort is
needed to unstick the fibres from the matrix, but once the fibres are debonded, they slide
very smooth at the interface giving rise to voids in the polymer matrix which in turn
decreases the tensile strength and elongation at break in the presence of aramid fibres.
For CFRC, the tensile strength increases with increasing fibre content. The tensile
strength for CFRC at 5%, 10% and 20% Vf are 34.43, 30.84 and 50.53 MPa, respectively.
The increase in tensile strength is due to the reinforcement effect by the fibres. Similar
observation was reported by Fu et. al. [43]. For hybrid composite, two different trends
were observed. For hybrid with fibre proportion of 75:25 and 50:50 V:V%, the tensile
strength increases with increasing total fibre volume fraction. For example, the tensile
strength for hybrid fibre composite with 75:25 V:V% fibre proportion at 5%, 10% and 20%
Vf are 35.5, 37.8 and 48.0 MPa, respectively. However, for hybrid with 25:75 V:V% fibre
proportion, the tensile strength was not significantly affected by Vf. The tensile strength for
hybrid fibre composite with 25:75 V:V% fibre proportion at 5%, 10% and 20% Vf are 34.1,
33.1 and 32.9 MPa, respectively. AFRC with 20% Vf exhibit the highest strength (50.53
MPa).

81
The modulus of carbon fibre is comparatively higher than that of the aramid fibre,
whereas the extensibility of carbon is low compared to the aramid fibre. This results in an
early carbon fibre failure which transfers a high stress to the aramid fibres. A sufficient
amount of aramid fibre needs to be present in the composite for it to successfully withstand
the sudden stress transfer. Without sufficient fibres, the aramid fibres will fail almost at the
same time of the carbon fibre, hence no improvement to the tensile strength of the
composite. This is the reason why the hybrid composite with 75:25 and 50:50 V:V% fibre
proportion showed improvement in tensile strength while hybrid with 25:75 V:V% fibre
proportion did not.
In another study by Thomason et al., they found that the tensile strength of
polypropylene laminates increases with increase in fibre content up to 60% w/w [88].
Another important factor which affects the tensile strength of a composite is the
compatibility between the fibre sizing and the matrix. Excellent compatibility between
these two components would produce strong interfacial adhesion. The interfacial
interaction is very important because it determines the efficiency of load transfer from the
matrix to the fibres [88].
Tensile strain
Generally, tensile fracture strain would decrease with increasing fibre content. The fracture
strain of AFRC decreases from 7.71% to 6.71% and 5.17% as the fibre content increased
from 5% to 10% and 20%, respectively. Similar trend was observed for CFRC and the
hybrids. Similar trend was observed in CFRC and the hybrid fibre composites. The fracture
strain of CFRC decreases from 7.71% to 7.00% and 5.42% as the fibre content increased
from 5% to 10% and 20%, respectively. For hybrid with 25:75 V:V%, the tensile strain

82
decreases from 8.42% to 6.20% and 5.46% as the fibre content increased from 5% to 10%
and 20%, respectively.
The reduction in the fracture strain value is expected. As the modulus of the
material increases, it becomes stiffer and less ductile. Stiffer material would resist any
changes to its shape, in this case, elongation. The molecular structure needs to be able to
rearrange effectively in order to have high fracture strain value. In fibre reinforced
composites, the matrix is constrained by the fibres and thus matrix flow is minimal,
especially with high fibre content. Increasing the fibre content would increase the
constraint on the matrix thus limiting chain mobility [68]. Thomason has reported similar
observation in his study of glass fibre reinforced polyamide 6,6. He stated that the fracture
strain value of the composite is significantly dependent on the residual fibre length, fibre
diameter and fibre concentration [89].
4.4.2 The effect of fibre proportion
Through SEM, the effect of the fibre proportion on the failure mechanism was observed.
SEM micrograph of the tensile fracture surface for CFRC is provided in Figure 4.18. It can
be seen in the image shows flat fracture surface which indicates that the composite failed in
a brittle manner. Materials that fails in brittle mode is very rigid, which explains its high
tensile modulus values. However, the crack propagation occurs almost instantly, evident by
the lack of plastic deformation observed on the fracture surface. This corresponds to the
sudden drop in its stress against strain curve provided by the instrument.

83
Figure 4.18: Tensile fracture surface for 5(0.00:5.00)
The fracture surface of AFRC and hybrid fibre reinforced composites on the other
hand showed a mix of ductile and brittle failure. SEM images of the tensile fracture surface
for AFRC and hybrid composite are provided in Figures 4.19 and 4.20. As carbon fibres are
replaced by aramid fibres in the composite, the failure mode of the composite was also
affected from fully brittle (Figure 4.18) to a mix of brittle and ductile failures (Figures
4.19-4.20). In addition, the differences between the failure mechanisms of the fibres
themselves are apparent in the micrograph. Figure 4.21 reveals that both these fibres
behave differently during failure. The fracture surface on the ends of the carbon fibre is
clean and flat, displaying the classical Griffiths brittle fracture [90]. This type of failure
usually occurs in three-dimensionally bonded materials with no yield mechanism. The
fibrillar nature of the aramid fibre failure is also clearly observed in this image.

84
Figure 4.19: Tensile fracture surface for 5(5.00:0.00)
Figure 4.20: Tensile fracture surface for 5(2.50:2.50)
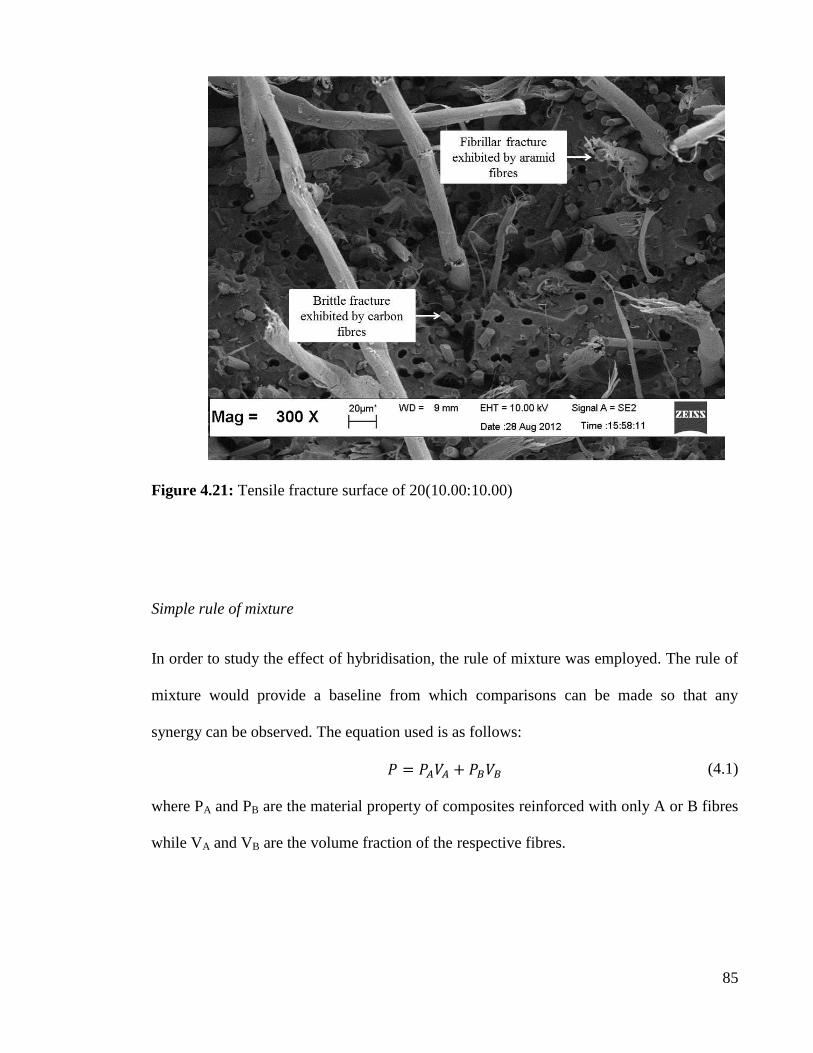
85
Figure 4.21: Tensile fracture surface of 20(10.00:10.00)
Simple rule of mixture
In order to study the effect of hybridisation, the rule of mixture was employed. The rule of
mixture would provide a baseline from which comparisons can be made so that any
synergy can be observed. The equation used is as follows:
(4.1)
where PA and PB are the material property of composites reinforced with only A or B fibres
while VA and VB are the volume fraction of the respective fibres.
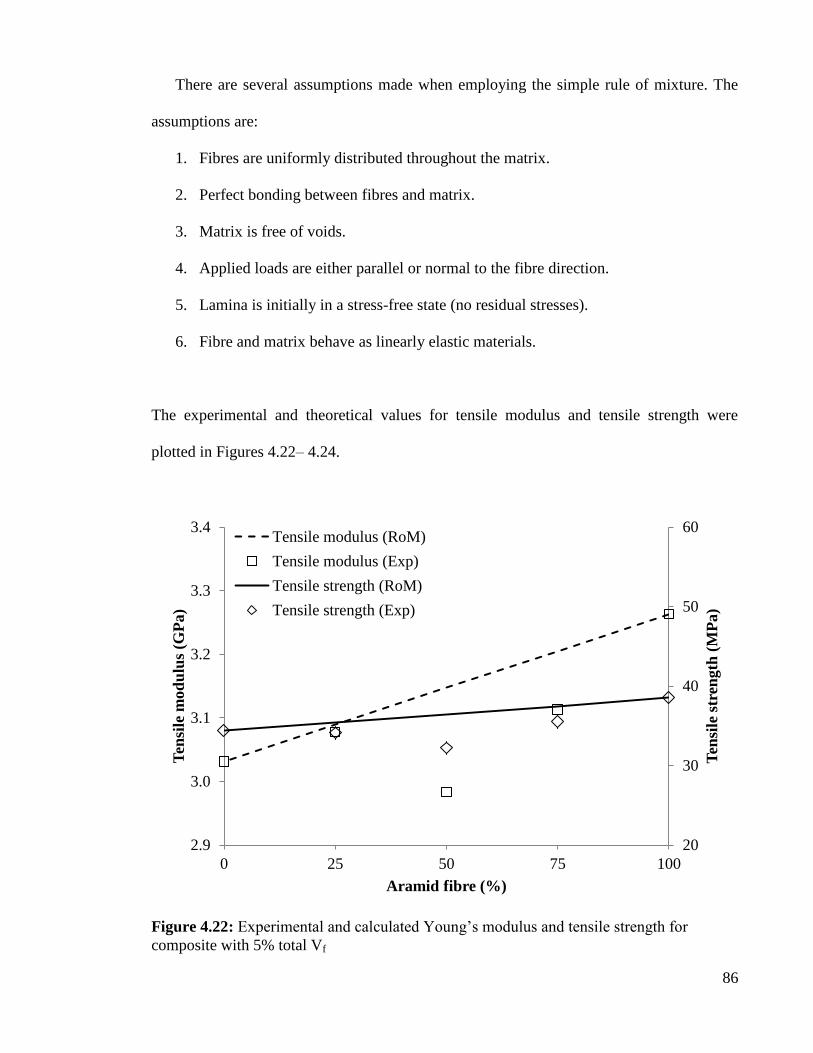
86
There are several assumptions made when employing the simple rule of mixture. The
assumptions are:
1. Fibres are uniformly distributed throughout the matrix.
2. Perfect bonding between fibres and matrix.
3. Matrix is free of voids.
4. Applied loads are either parallel or normal to the fibre direction.
5. Lamina is initially in a stress-free state (no residual stresses).
6. Fibre and matrix behave as linearly elastic materials.
The experimental and theoretical values for tensile modulus and tensile strength were
plotted in Figures 4.22– 4.24.
Figure 4.22: Experimental and calculated Young’s modulus and tensile strength for
composite with 5% total Vf
20
30
40
50
60
2.9
3.0
3.1
3.2
3.3
3.4
0 25 50 75 100
Ten
sile
str
ength
(M
Pa)
Ten
sile
mod
ulu
s (G
Pa)
Aramid fibre (%)
Tensile modulus (RoM)
Tensile modulus (Exp)
Tensile strength (RoM)
Tensile strength (Exp)

87
Figure 4.23: Experimental and calculated Young’s modulus and tensile strength for
composite with 10% total Vf
Figure 4.24: Experimental and calculated Young’s modulus and tensile strength for
composite with 20% total Vf
20
30
40
50
60
3.00
3.25
3.50
3.75
4.00
0 25 50 75 100
Ten
sile
str
ength
(M
Pa)
Ten
sile
mod
ulu
s (G
Pa)
Aramid fibre (%)
Tensile modulus (RoM)
Tensile modulus (Exp)
Tensile strength (RoM)
Tensile strength (Exp)
0
20
40
60
3.5
4.0
4.5
5.0
5.5
6.0
0 25 50 75 100
Ten
sile
str
ength
(M
Pa)
Ten
sile
mod
ulu
s (G
Pa)
Aramid fibre (%)
Tensile modulus (RoM)
Tensile modulus (Exp)
Tensile strength (RoM)
Tensile strength (Exp)

88
A positive or negative synergy effect in hybrid composite is defined as a positive or
negative deviation of a certain mechanical properties from the rule-of-mixtures behaviour
[30]. Positive synergy is highly preferable since it produces a composite with better
properties than the sum of its components.
Young’s modulus, E
At 5% total Vf, all the hybrids showed negative synergy effect for both the Young’s
modulus. At 10% total Vf, hybrids with 75:25 and 50:50 V:V% showed positive synergy
for Young’s modulus. However, hybrid with 25:75 V:V% shows lower negative synergy
effect. At 20% Vf, all the hybrids showed positive synergy for their Young’s modulus,
especially hybrid with 75:25 V:V% which exhibited the highest Young’s modulus value
(4.82 GPa) among all the composites tested.
Young’s modulus defines the linear part of the stress-strain curve where no
deformation or crack propagation has yet to occur. It is less sensitive to flaws in the
composite than the tensile strength. However, improvement in interfacial bonding [91] and
intermingling of fibres would definitely improve the tensile properties of a hybrid
composite. Sreekala et al. have reported that for their phenol-formaldehyde-glass fibre-
OPEFB fibre hybrid composite, the high tensile modulus observed in their hybrid
reinforced with 0.96 OPEFB Vf was due to excellent fibres intermingling [92]. You et al.
have also reported similar results [93]. One of their hybrid, designated E-VE, which
consists of randomly dispersed carbon and glass fibres, showed the highest hybrid effect
when compared to their skin-core hybrids. These studies further emphasize the importance
of fibre dispersion and mixing in the composite.
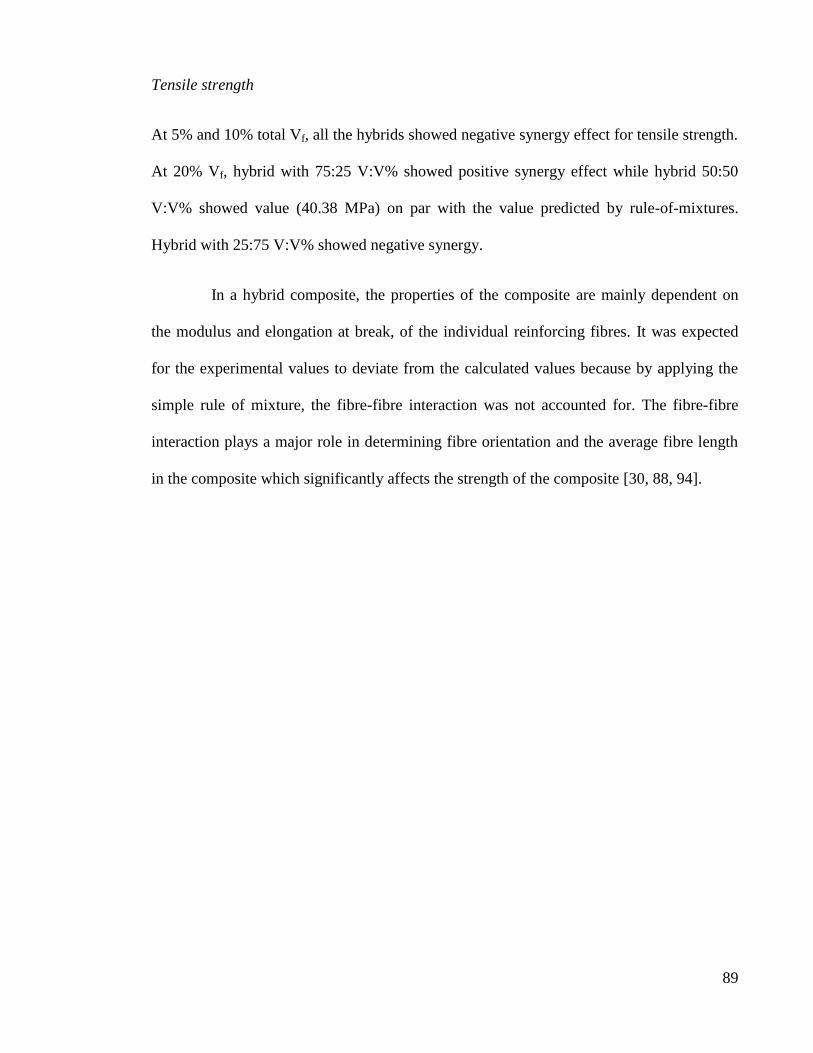
89
Tensile strength
At 5% and 10% total Vf, all the hybrids showed negative synergy effect for tensile strength.
At 20% Vf, hybrid with 75:25 V:V% showed positive synergy effect while hybrid 50:50
V:V% showed value (40.38 MPa) on par with the value predicted by rule-of-mixtures.
Hybrid with 25:75 V:V% showed negative synergy.
In a hybrid composite, the properties of the composite are mainly dependent on
the modulus and elongation at break, of the individual reinforcing fibres. It was expected
for the experimental values to deviate from the calculated values because by applying the
simple rule of mixture, the fibre-fibre interaction was not accounted for. The fibre-fibre
interaction plays a major role in determining fibre orientation and the average fibre length
in the composite which significantly affects the strength of the composite [30, 88, 94].

90
4.5 Flexural properties
Flexural testing studies the bending behaviour of a material. In flexural tests, most of the
specimens fail in ductile mode. Flexure testing is often done on relatively flexible materials
such as polymers, wood and composites. Specimens under flexural test underwent a range
of stresses across its depth. At the edge of the object on the inside of the bend (concave
face) the stress will be at its maximum compressive value. At the convex face, the stress
will be at its maximum tensile values. Flexural strength is defined as the maximum stress in
the outermost fibre. This is calculated at the surface of the specimen on the convex or
tension side. Flexural modulus is calculated from the slope of the stress vs. deflection
curve. Specimen deflection is usually measured by the cross-head position. The value for
flexural modulus, flexural strength and flexural displacement are illustrated in Figure 4.25 -
4.27.
4.5.1 The effect of total Vf
Flexural modulus
For single fibre reinforced composites, increasing the total Vf will increase the flexural
modulus value. For AFRC, the flexural modulus initially did not change when Vf was
increased from 5 to 10%. However, as Vf was further increased to 20%, the modulus
increased from 1.89 GPa to 2.93 GPa. For CFRC, flexural modulus increases from 2.09
GPa (5% Vf) to 2.30 GPa (10% Vf) and 3.61 GPa (20% Vf). Carbon fibre reinforced
composites are shown to have higher flexural modulus compared to its aramid fibre
reinforced counterparts. This is due to the higher modulus and also rigidity of the carbon
fibre itself whereas aramid fibre is easily bendable.

91
For all hybrid composites, increasing the total Vf also produces similar trend. For
example, for hybrid composite with 50:50 V:V% fibre composition, flexural modulus
increases from 1.70 GPa (5% Vf) to 2.00 GPa (10% Vf) and 3.10 GPa (20% Vf).
Flexural strength
The flexural strength for aramid fibre reinforced composite increases with increasing Vf.
The flexural strength for composites reinforced with 5%, 10% and 20% aramid fibre are
56.94 MPa, 55.68 MPa and 72.66 MPa, respectively. For carbon fibre reinforced
composites, it showed that the flexural strength decreases with increasing Vf. The flexural
strength for composites reinforced with 5%, 10% and 20% carbon fibre are 53.78 MPa,
49.12 MPa and 49.15 MPa, respectively. Hybrid composites showed similar trend to
aramid reinforced composites where the increase of total Vf increases the flexural strength
of the composite. For example, the flexural strength for hybrid composites with 50:50
V:V% at 5, 10 and 20% Vf are 43.85 MPa, 50.87 MPa and 64.77 MPa, respectively.
Flexural displacement
The flexural displacement for all composites was independent of total Vf. The value did not
change significantly with increasing Vf.

92
Figure 4.25: Flexural modulus of all composites at different total Vf
Figure 4.26: Flexural strength of all composites at different total Vf
0
1
2
3
4
5% 10% 20%
Fle
xu
ral
mod
ulu
s (G
Pa)
Volume fraction, Vf (%)
(100:0) (0:100)
(75:25) (50:50)
(25:75)
0
20
40
60
80
5% 10% 20%
Fle
xu
ral
stre
ngth
(M
Pa)
Volume fraction, Vf (%)
(100:0) (0:100)
(75:25) (50:50)
(25:75)

93
Figure 4.27: Flexural displacement of all composites at different total Vf
4.5.2 The effect of fibre proportion
Flexural modulus
There were no significant trends observed with regard to the effect of fibre proportion on
the flexural modulus of the composites.
Flexural strength
There were no significant trends observed with regard to the effect of fibre proportion on
the flexural modulus of the composites at 5% and 10% Vf. However, at 20% Vf, increasing
the carbon fibre proportion causes the flexural strength to decrease. The flexural strength
0.00
0.02
0.04
0.06
0.08
0.10
5% 10% 20%
Fle
xu
ral
dis
pla
cem
ent
(mm
/mm
)
Volume fraction, Vf (%)
(100:0) (0:100)
(75:25) (50:50)
(25:75)

94
for hybrid fibre composites at 20% Vf are 73.40 MPa (75:25 V:V%), 64.77 MPa (50:50
V:V%) and 56.08 MPa (25:75 V:V%).
Carbon fibre is very brittle and will easily break when bent. Its ability to strongly
resist bending contributes to the excellent flexural modulus values exhibited by carbon
fibre reinforced composites unlike aramid fibres which are rope-like in nature. However,
once the bending threshold for the fibre is exceeded, the carbon would fail in a brittle
manner. Carbon fibre is anisotropic, where it is very strong when the tensile stress applied
is along its fibre length. In flexural tests, both compression and tensile forces acts upon the
specimen. Aramid fibre on the other is not as stiff as carbon fibre but is more difficult to
break. The aramid fibres were held into place by the matrix and the stresses acting upon the
matrix were transferred to the fibres. More energy is needed to break aramid fibres due to
its molecular arrangement and its failure mechanism.
Simple rule of mixture
Simple rule of mixture equation was also applied to study the synergistic effect of
hybridization on the flexural properties of the composite. The calculated and experimental
values for the composites are illustrated in Figures 4.28 – 4.30.
Flexural modulus
For hybrid fibre composites with 5% and 10% total Vf, flexural modulus showed negative synergy.
For example, the flexural modulus for 5(2.50:2.50) is 1.70 GPa much lower than the calculated
values, 2.00 GPa. However, for hybrid composites with 20% total Vf, positive synergy was
observed. For example, the flexural modulus for 20(15.00:5.00) is 3.60 GPa, higher than the
calculated value, 3.10 GPa.

95
Figure 4.28: Experimental and calculated flexural modulus and flexural strength for
composite with 5% total Vf
Figure 4.29: Experimental and calculated flexural modulus and flexural strength for
composite with 10% total Vf
40
50
60
70
80
1.0
1.5
2.0
2.5
3.0
0 25 50 75 100
Fle
xu
ral
stre
ngth
(M
Pa)
Fle
xu
ral
mod
ulu
s (G
Pa)
Aramid fibre (%)
Flexural modulus (RoM)
Flexural modulus (Exp)
Flexural strength (RoM)
Flexural strength (Exp)
45
50
55
60
1.0
1.5
2.0
2.5
3.0
0 25 50 75 100
Fle
xu
ral
stre
ngth
(M
Pa)
Fle
xu
ral
mod
ulu
s (G
Pa)
Aramid fibre (%)
Flexural modulus (RoM)
Flexural modulus (Exp)
Flexural strength (RoM)
Flexural strength (Exp)
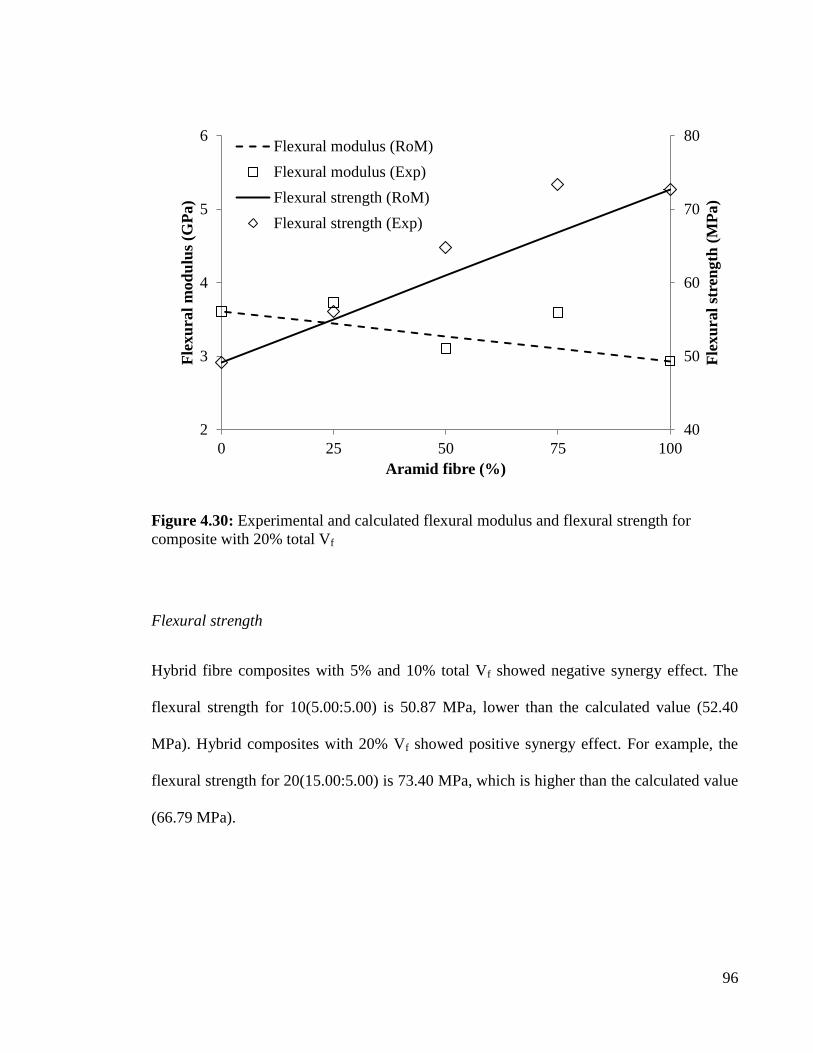
96
Figure 4.30: Experimental and calculated flexural modulus and flexural strength for
composite with 20% total Vf
Flexural strength
Hybrid fibre composites with 5% and 10% total Vf showed negative synergy effect. The
flexural strength for 10(5.00:5.00) is 50.87 MPa, lower than the calculated value (52.40
MPa). Hybrid composites with 20% Vf showed positive synergy effect. For example, the
flexural strength for 20(15.00:5.00) is 73.40 MPa, which is higher than the calculated value
(66.79 MPa).
40
50
60
70
80
2
3
4
5
6
0 25 50 75 100
Fle
xu
ral
stre
ngth
(M
Pa)
Fle
xu
ral
mod
ulu
s (G
Pa)
Aramid fibre (%)
Flexural modulus (RoM)
Flexural modulus (Exp)
Flexural strength (RoM)
Flexural strength (Exp)

97
4.6 Impact properties
Information on the impact behaviour of material is very important. Scientists have sought
to improve the impact resistance of polymeric materials. Impact resistance or toughness is
defined as the ability of a material to withstand sudden impact without fracturing [95]. A
material with high impact resistance is able to absorb more energy and disperse the energy
efficiently. In order to produce material with outstanding impact toughness, balance
between strength and ductility is required.
Impact energy of a material is the amount of energy required to fracture in a given
volume of the material. Impact strength is the energy needed to propagate the crack through
the material. The crack propagation energy is related to the toughness of the material and
the distance travelled by the crack tip during failure. Brittle material typically have low
impact energy due to the lower amount of energy needed for the crack to propagate during
fracture [96].
Impact tests produced energy vs. time graphs for each tested specimens. There are
two important parameters that were extracted from these graphs, fracture energy (W) and
peak load (P). Fracture energy or work of fracture can be defined as total work required to
fracture the sample, per unit area of new surface produced or the total amount of energy
dissipated during crack growth [97]. Fracture energy is obtained by calculating the area
under the graph prior to sample fracture. Peak load was obtained from the highest point in
the graph prior to fracture.
Various energy dissipating mechanism operate when a discontinuous fibre-
reinforced composite fractures from an existing notch. Deformation and fracture of the
matrix takes place in an area in front of the crack tip. At the same time the applied load,

98
transferred by shear to the fibres, may exceed the strength of the fibre-matrix interface and
fibre debonding may occur. Transfer of stress may still be possible to a debonded fibre via
frictional forces along the interface. Fibres may fracture if the fibre stress level exceeds the
local fibre strength. Fibres which have fractured away from the crack interface will be
pulled-out of the matrix which may also involve energy dissipation [98].
The relationship between W and the critical strain energy release rate (Gc) and
specimen geometry function (BDΦ) is given by,
BDGW c (4.2)
where B and D are the width and depth of the specimen, respectively. A correction factor,
Φ is given by,
D
a
1
D
S
18
1 +
D
a
2
1 =
(4.3)
where a and S are notch depth (crack length) and the specimens support span respectively.
A plot of W against BDΦ produced a straight line, where its slope is equal to the Gc
of the materials. Gc is the total energy absorbed by test specimen divided by its net cross
section area and is used to measure the energy necessary for crack initiation.
The resistance to crack propagation or fracture toughness of the aramid, carbon and
hybrid composites is characterized by measuring the critical strain energy release rate (Gc)
and the critical stress intensity factor (Kc) of single edge notched (SEN) specimens in three
point bending mode according to ASTM E23 [60].
Critical stress intensity factor (Kc) is a function of loading, crack size, and structural
geometry. Kc indicates the resistance of the material to unstable crack growth [99]. The

99
relationship between the critical stress intensity factor (Kc) with nominal fracture stress (σ),
geometry correction factor (Y) and notch or crack length (a) is given by,
a
KY c
(4.4)
In three-point bend test, σ is given by simple bending theory as,
2DB4
SP6
(4.5)
For the three-point bend test specimen, where S/D is equal to 4, Y is given by,
D
a 14.53 +
D
a 3.07 - 1.93 = Y
2
D
a 25.80 +
D
a 25.11 -
4 3
(4.6)
A plot of σY against 5.0a produced a straight line, where its slope is equal to the Kc of the
materials. There are three types of K depending on their mode of fracture. Refer to Figure
4.31. In this work, mode I (crack opening) is of interest.

100
Figure 4.31: Different crack loading modes.
4.6.1 The effect of total Vf
Fracture energy, W
It was observed that increasing the notch to depth ratio (a/D) would cause the fracture
energy to lower. The fracture energy for composite 5% (100/0) at 0.1 a/D is 332.8 mJ. W
lowers to 127.5 mJ, 75.1 mJ and 59.9 mJ as the a/D increases to 0.2, 0.3 and 0.4,
respectively. Refer to Figure 4.32. Similar observation was made for carbon fibre
reinforced composites and the hybrid composite (Figure 4.33 and Figure 4.34). As stated
before, fracture energy is related to the distance where the crack needs to travel during
failure. Higher a/D ratio means that the crack is longer, hence shorter distance for the crack
to propagate (smaller fracture area) resulting in lower fracture energy value [100].

101
Figure 4.32: Fracture energy for aramid fibre reinforced composite at different Vf
Figure 4.33: Fracture energy for carbon fibre reinforced composite at different Vf
0.4
0.3
0.2
0.1
0
200
400
600
5(100:0)10(100:0)
20(100:0)
a/D
Fra
ctu
re e
ner
gy (
mJ)
Specimen
0.4
0.3
0.2
0.1
0
100
200
300
5(0:100)10(0:100)
20(0:100)
a/D
Fra
ctu
re e
ner
gy (
mJ)
Specimen

102
Figure 4.34: Fracture energy for hybrid fibre reinforced composite at different Vf and different fibre proportions.
0.4
0.3
0.2
0.10
200
400
600
a/D
Fra
ctu
re e
ner
gy (
mJ)
Specimen
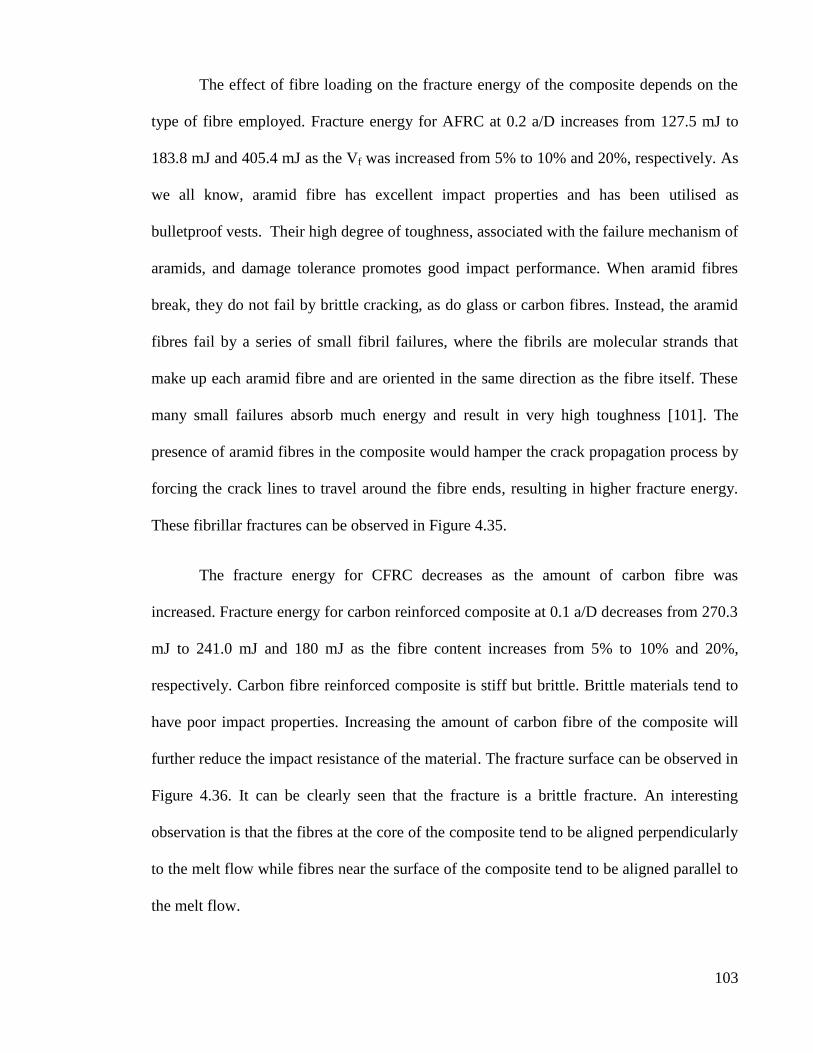
103
The effect of fibre loading on the fracture energy of the composite depends on the
type of fibre employed. Fracture energy for AFRC at 0.2 a/D increases from 127.5 mJ to
183.8 mJ and 405.4 mJ as the Vf was increased from 5% to 10% and 20%, respectively. As
we all know, aramid fibre has excellent impact properties and has been utilised as
bulletproof vests. Their high degree of toughness, associated with the failure mechanism of
aramids, and damage tolerance promotes good impact performance. When aramid fibres
break, they do not fail by brittle cracking, as do glass or carbon fibres. Instead, the aramid
fibres fail by a series of small fibril failures, where the fibrils are molecular strands that
make up each aramid fibre and are oriented in the same direction as the fibre itself. These
many small failures absorb much energy and result in very high toughness [101]. The
presence of aramid fibres in the composite would hamper the crack propagation process by
forcing the crack lines to travel around the fibre ends, resulting in higher fracture energy.
These fibrillar fractures can be observed in Figure 4.35.
The fracture energy for CFRC decreases as the amount of carbon fibre was
increased. Fracture energy for carbon reinforced composite at 0.1 a/D decreases from 270.3
mJ to 241.0 mJ and 180 mJ as the fibre content increases from 5% to 10% and 20%,
respectively. Carbon fibre reinforced composite is stiff but brittle. Brittle materials tend to
have poor impact properties. Increasing the amount of carbon fibre of the composite will
further reduce the impact resistance of the material. The fracture surface can be observed in
Figure 4.36. It can be clearly seen that the fracture is a brittle fracture. An interesting
observation is that the fibres at the core of the composite tend to be aligned perpendicularly
to the melt flow while fibres near the surface of the composite tend to be aligned parallel to
the melt flow.
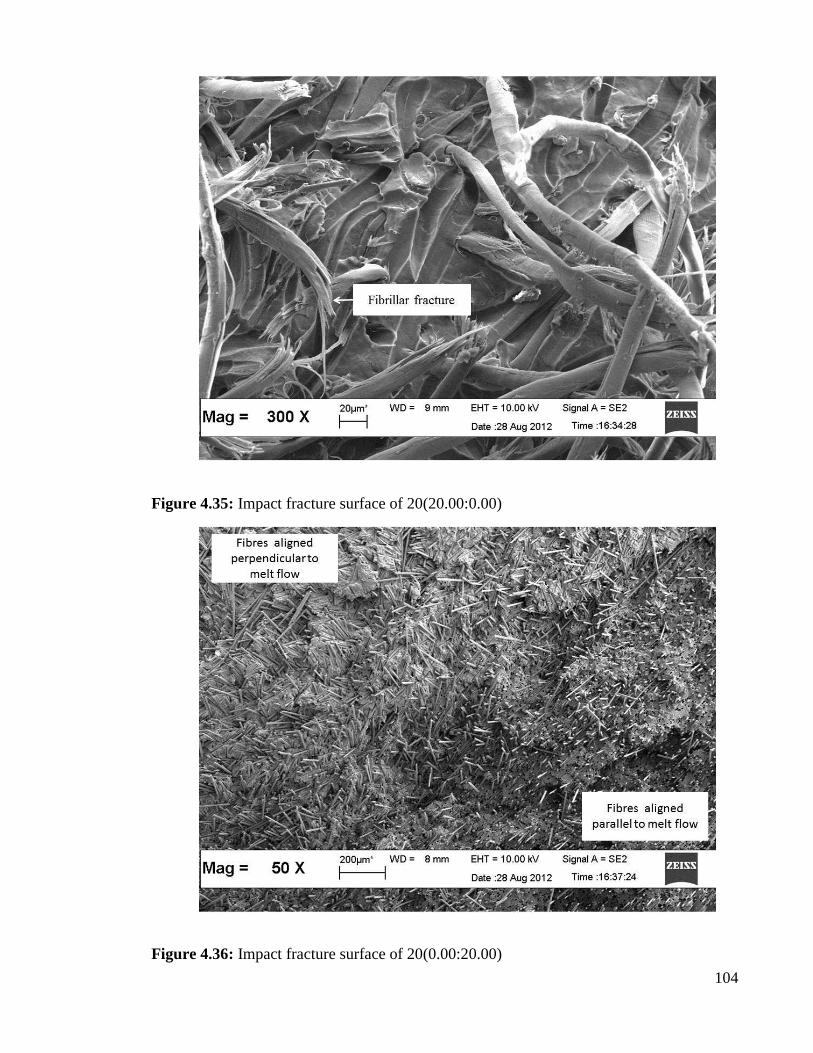
104
Figure 4.35: Impact fracture surface of 20(20.00:0.00)
Figure 4.36: Impact fracture surface of 20(0.00:20.00)
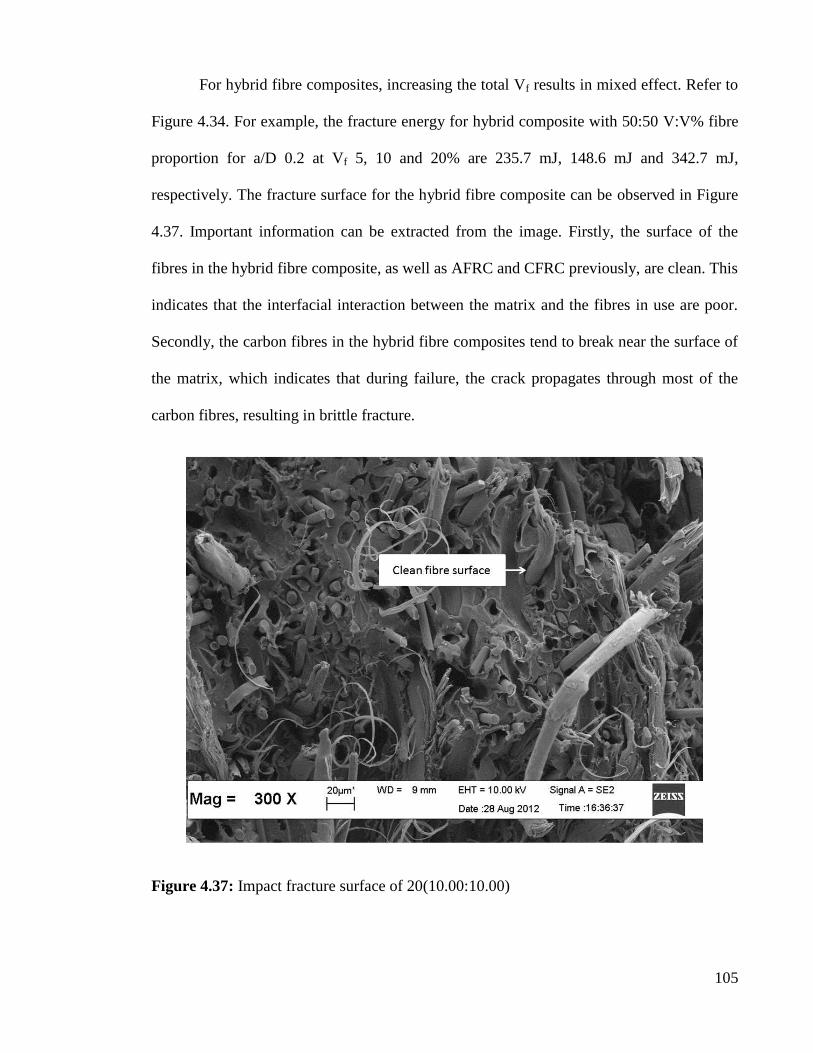
105
For hybrid fibre composites, increasing the total Vf results in mixed effect. Refer to
Figure 4.34. For example, the fracture energy for hybrid composite with 50:50 V:V% fibre
proportion for a/D 0.2 at Vf 5, 10 and 20% are 235.7 mJ, 148.6 mJ and 342.7 mJ,
respectively. The fracture surface for the hybrid fibre composite can be observed in Figure
4.37. Important information can be extracted from the image. Firstly, the surface of the
fibres in the hybrid fibre composite, as well as AFRC and CFRC previously, are clean. This
indicates that the interfacial interaction between the matrix and the fibres in use are poor.
Secondly, the carbon fibres in the hybrid fibre composites tend to break near the surface of
the matrix, which indicates that during failure, the crack propagates through most of the
carbon fibres, resulting in brittle fracture.
Figure 4.37: Impact fracture surface of 20(10.00:10.00)
106
Critical energy release rate, Gc
An example of the W against BDΦ plot is given in Figure 4.38. Similar graphs were plotted
for all the composites and their Gc values were tabulated in Table 4.6.
Strain energy release rate (G) defines the energy dissipated during fracture per unit
of newly formed surface and only when G exceed the critical value, Gc, would the crack
grow and failure occurs. Generally, the trend observed with regard to Gc is in agreement
with the trends earlier observed in W.
The trend observed for Gc of the AFRC is the same as observed for W. Gc values for
AFRC at 5, 10 and 20% Vf are 4.76, 6.41 and 10.51 kJ.m-2
, respectively. Gc increases with
increasing Vf due to more energy needed to form new surface. The fibres would hinder
crack propagation by forcing it around the fibre ends. Aramid fibre is very strong and the
fibre itself doesn’t fail in a brittle manner.
Gc value for CFRC decreases with increase in carbon fibre content. Gc values for
CFRC at 5, 10 and 20% Vf are 5.46, 4.51 and 3.96 kJ.m-2
, respectively. This is due to
increase in brittleness of the composite caused by increased presence of carbon fibres.
Brittle materials generally have low Gc. Various researchers have reported similar
observation [102].
For hybrid fibre composites, mixed effect was observed. For example, for hybrid
fibre composites with 50:50 V:V% fibre proportion, Gc values at 5, 10 and 20% Vf are
6.82, 4.17 and 10.26 kJ.m-2
, respectively. Similar trend was observed for hybrid fibre
composites with fibre proportion of 75:25 and 25:75 V:V%. Hybrid fibre composites with
75:25 V:V% fibre proportion, Gc values at 5, 10 and 20% Vf are 8.77, 5.84 and 10.01
kJ.m-2
, respectively. AFRC with 20% Vf exhibited the highest Gc value at 10.51 kJ.m-2

107
Figure 4.38: W against BDΦ plot for ARFC and CFRC at 5% Vf
Gc of the composite can be further enhanced by improving the interfacial interaction
of the fibres and the matrix especially for composites reinforced with aramid fibres.
Polypropylene is non-polar while aramid fibre is polar. Therefore, it is highly unlikely that
there is any significantly strong interaction between these two components. Enhancement
can be made via surface treatment of the aramid fibres or introducing compatibiliser into
the system.
0
100
200
300
400
500
600
0 10 20 30 40 50 60
W (
mJ
)
BDΦ (x 10-6 m2)
Aramid
Carbon
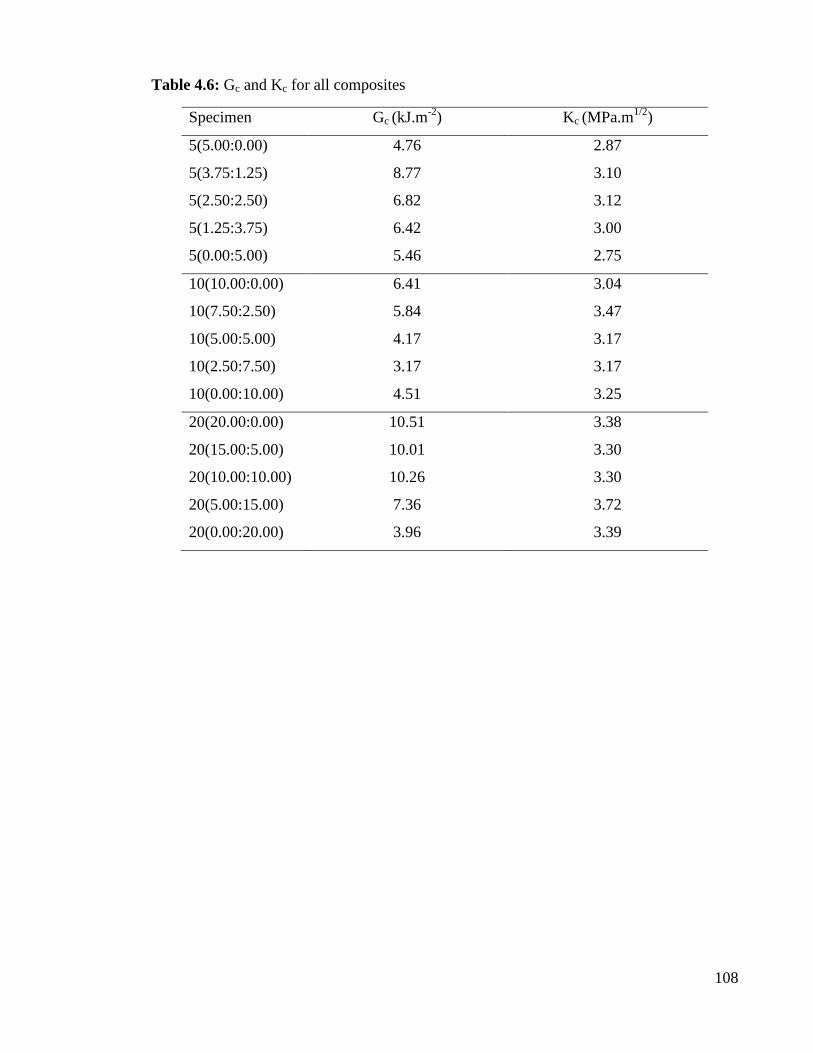
108
Table 4.6: Gc and Kc for all composites
Specimen Gc (kJ.m-2
) Kc (MPa.m1/2
)
5(5.00:0.00) 4.76 2.87
5(3.75:1.25) 8.77 3.10
5(2.50:2.50) 6.82 3.12
5(1.25:3.75) 6.42 3.00
5(0.00:5.00) 5.46 2.75
10(10.00:0.00) 6.41 3.04
10(7.50:2.50) 5.84 3.47
10(5.00:5.00) 4.17 3.17
10(2.50:7.50) 3.17 3.17
10(0.00:10.00) 4.51 3.25
20(20.00:0.00) 10.51 3.38
20(15.00:5.00) 10.01 3.30
20(10.00:10.00) 10.26 3.30
20(5.00:15.00) 7.36 3.72
20(0.00:20.00) 3.96 3.39
109
Peak load, P
Peak load is the maximum force needed to cause the fracture of the sample. It depicts the
highest point on the load-deflection curve and is a function of the damage resistance of a
material. The peak load values for all the composites are illustrated in Figure 4.39 – 4.41.
For AFRC, peak load increases when Vf is increased from 5% to 10% and then
decreased when the Vf is further increased to 20%. P values for AFRC with 0.2 a/D at 5, 10
and 20% Vf are 381.5, 432.0 and 479.5 N, respectively. For carbon fibre reinforced
composites, the peak load of the composite improves with increase in carbon fibre content.
P values for CFRC with 0.2 a/D at 5, 10 and 20% Vf are 421.4, 465.1 and 496.8 N,
respectively. The increase is due to an increase in the stiffness of the material. The presence
of fibres restricts the movement of the polymer chains resulting in increased stiffness,
improving its resistance to deformation. When a notched specimen is subjected to impact
loading in 3 point bending mode, there are several steps involved prior to crack
propagation. One of the steps involves deformation of the matrix at the crack tip, resulting
in crack opening (mode I). For stiffer materials, more energy is needed to initiate
deformation, hence higher P. With regard to the hybrid fibre composite, varying the total Vf
did not affect the P of the composite significantly.

110
Figure 4.39: Peak load for aramid fibre reinforced composite at different Vf
Figure 4.40: Peak load for carbon fibre reinforced composite at different Vf
0.4
0.3
0.2
0.1
0
200
400
600
800
5(100:0)10(100:0)
20(100:0)
a/D
Pea
k l
oad
(N
)
Specimen
0.4
0.3
0.2
0.1
0
200
400
600
800
5(0:100)10(0:100)
20(0:100)
a/D
Pea
k l
oad
(N
)
Specimen

111
Figure 4.41: Peak load for hybrid fibre reinforced composite at different Vf
0.4
0.3
0.2
0.10
100
200
300
400
500
600
700
800
a/D
Pea
k l
oad
(N
)
Specimen

112
Critical stress intensity factor, Kc
An example of σY against 5.0a plot is illustrated in Figure 4.42. Kc values for all the
composites are extracted from their respective figures of σY against 5.0a and tabulated in
Table 4.6.
Figure 4.42: σY against a-0.5
plot for ARFC and CFRC at 5% Vf
The trend observed for Kc are in agreement with the trend observed in P. Kc for
AFRC and CFRC increases with increase in fibre loading. Kc for AFRC at 5, 10 and 20%
Vf are 2.87, 3.04 and 3.38 MPa.m1/2
. Kc for CFRC at 5, 10 and 20% Vf are 2.75, 3.25 and
3.39 MPa.m1/2
. Kc is more sensitive towards the rigidity of the material and describes the
initial process of failure (crack initiation at the notch tip). Hassan et al. has reported that the
0
20
40
60
80
100
120
0 5 10 15 20 25 30 35
σY
(M
Pa)
a-0.5 (m-0.5)
Aramid
Carbon
113
increment in Gc and Kc values with increase in Vf is an expected observation [103]. Fibres
will control the fracture behaviour of the composite with increasing fibre loading.
At a glance, it would seem that increasing the Vf would improve the impact
resistance for both composites. However, this conclusion is incorrect. It is important that
we study the impact behaviour of a material through more than one parameter or there will
be a risk of misunderstanding the actual impact behaviour of the composite. Although Kc
for both aramid and carbon fibre reinforced composites both increased with increasing Vf,
one must note that the Gc for aramid reinforced composites increased while Gc for carbon
reinforced composites decreased.
Taking into account both values, it is understood that for CFRC, increasing Vf
would improve the ability of the composite to resist crack initiation. However, due to the
brittle nature of the composite, there is little resistance towards crack propagation, which is
reflected by Gc. CFRC, especially at high Vf, will fail catastrophically once crack is
initiated. The composite would fail in a brittle manner, almost instantaneously due to the
unimpeded crack growth. On the other hand, for AFRC, increasing the amount of aramid
fibres improves the ability of the composite to resist crack initiation and also requires more
energy to propagate the fracture. The increase in energy would mean that total failure of the
composite would require more time, which could be the difference in a life or death
situation.
For hybrid composites, varying the total Vf did not affect Kc significantly. For
example, Kc for hybrid fibre composite with 50:50 V:V% fibre proportion at 5, 10 and 20%
Vf are 3.12, 3.17 and 3.30 MPa.m1/2
, respectively. However, it is worth noting that all
114
hybrid composites tested have higher Kc value than its non-hybrid counterpart. Refer to
Table 4.6. Hybrid 20(5.00:15.00) exhibited the highest Kc (3.76 MPa.m1/2).
4.6.2 The effect of fibre proportion
Fracture energy, W
For hybrid fibre composites with the same total Vf, increasing the proportion of carbon
fibre in the mixture resulted in decreasing fracture energy. Refer to Figure 4.34. For
example, the fracture energy for hybrid composite 10(7.50:2.50), 10(5.00:5.00) and
10(2.50:7.50) at a/D 0.1 are 361.4, 242.8 and 200.1 mJ, respectively. Similar trend is
observed for hybrid with total Vf 5% and 20%. For example, the fracture energy for hybrid
fibre composites at 5% Vf with 0.1 a/D are 656.8, 625.4 and 606.1 mJ, respectively. The
reduction in fracture energy is due to the increasing amount of brittle carbon fibre into the
system.
Critical strain energy release rate, Gc
Rule of mixture (RoM) was employed to study the synergistic effect of hybridization on Gc
for the hybrid composites. The calculated and experimental Gc values for the composites
are illustrated in Figure 4.43 – 4.45. It can be seen that there is positive synergy effect on
Gc for for hybrid fibre composites with 5 and 20% total Vf. For example, Gc for
5(2.50:2.50) is 6.82 kJ.m-2
, higher than the calculated value via RoM (5.11 kJ.m-2
).
However, negative synergy was observed for hybrid fibre composites with 10% Vf. Gc for
10(5.00:5.00) is 4.17 kJ.m-2
, lower than the calculated value via RoM (5.46 kJ.m-2
)
115
There are several factors that can contribute to the deviation between the
experimental and calculated values. Negative synergy can be due to the presence of flaws
in the system, such as voids, undispersed fibre bundles and poor interfacial interaction.
These flaws act as a stress concentrator and weaken the composite causing it to fail
prematurely. On the other hand, theoretical predictions through RoM would assume that the
composite system is without flaws.
It is well documented that the reinforcing effect of fibres in a composite will
increase with increase in fibre loading up to an optimum level. When the fibre content
exceeds the optimum level, the improvement in the mechanical properties would start to
level off and even decrease as the content is further increased. This observation is caused
by the wetting problem faced by the composite. Interfacial interaction between fibre and
matrix is one of the most important components in a composite. Good interfacial
interaction would allow stress to be transferred from the matrix to the fibre in an efficient
manner, producing superior composite. However, when fibre content is too high, the fibres
and matrix do not mix well. As a result, various defects such as voids and undispersed fibre
bundles are present in the mix. These flaws act as a stress concentrator and weaken the
composite causing it to fail prematurely.
Critical stress intensity factor, Kc
No direct relationship between Kc and the fibre proportions was observed. The rule of
mixture was applied to study the effect of hybridization on Kc. Rule of mixture would
provide a baseline in which the effect of hybridization can be referred to. The expected
values calculated via rule of mixture ignore any fibre-fibre interaction or any flaws (voids
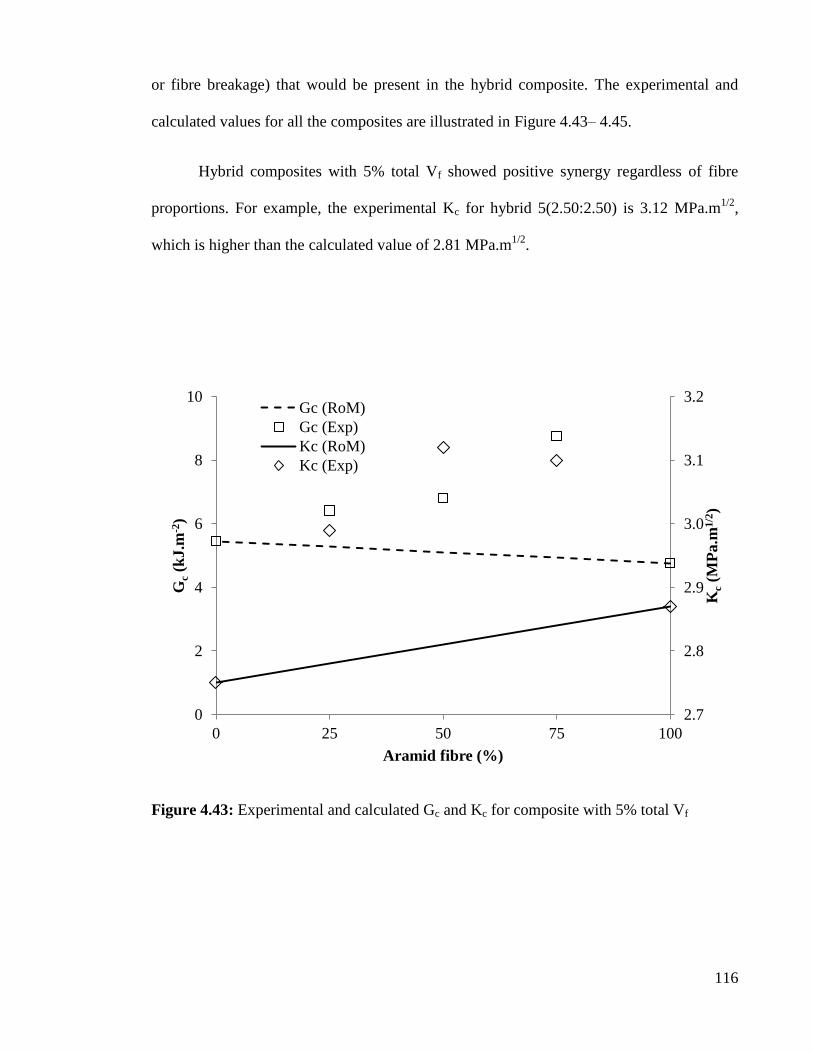
116
or fibre breakage) that would be present in the hybrid composite. The experimental and
calculated values for all the composites are illustrated in Figure 4.43– 4.45.
Hybrid composites with 5% total Vf showed positive synergy regardless of fibre
proportions. For example, the experimental Kc for hybrid 5(2.50:2.50) is 3.12 MPa.m1/2
,
which is higher than the calculated value of 2.81 MPa.m1/2
.
Figure 4.43: Experimental and calculated Gc and Kc for composite with 5% total Vf
2.7
2.8
2.9
3.0
3.1
3.2
0
2
4
6
8
10
0 25 50 75 100
Kc (
MP
a.m
1/2
)
Gc (
kJ.m
-2)
Aramid fibre (%)
Gc (RoM)
Gc (Exp)
Kc (RoM)
Kc (Exp)

117
Figure 4.44: Experimental and calculated Gc and Kc for composite with 10% total Vf
Figure 4.45: Experimental and calculated Gc and Kc for composite with 20% total Vf
3.0
3.1
3.2
3.3
3.4
3.5
0
2
4
6
8
0 25 50 75 100
Kc (
MP
a.m
1/2
)
Gc (
kJ.m
-2)
Aramid fibre (%)
Gc (RoM)Gc (Exp)Kc (RoM)Kc (Exp)
3.2
3.4
3.6
3.8
4.0
0
4
8
12
0 25 50 75 100
Kc (
MP
a.m
1/2
)
Gc (
kJ.m
-2)
Aramid fibre (%)
Gc (RoM)Gc (Exp)Kc (RoM)Kc (Exp)

118
For hybrid with 10% total Vf, mixed effect was observed. Both composite,
10(7.50:2.50) and 10(5.00:5.00), showed positive synergy while hybrid 10(2.50:7.50)
showed negative synergy. The experimental Kc for hybrid 10(7.50:2.50) is 3.47 MPa.m1/2
,
which is higher than the calculated value of 3.09 MPa.m1/2
. On the other hand,
experimental Kc for hybrid 10(2.50:7.50) is 3.17 MPa.m1/2
, which is slightly lower than the
calculated value of 3.20 MPa.m1/2
.
For hybrid composites with 20% total Vf, only 20(5.00:15.00) showed positive
synergy. The experimental Kc for hybrid 20(5.00:15.00) is 3.72 MPa.m1/2
, which is higher
than the calculated value of 3.39 MPa.m1/2
.
Figure 4.46 plots Gc and Kc for all the composite tested for comparison. From the
plot, composite 20(20.00:0.00) is determined to have the highest Gc value. For Kc, hybrid
composite 20(5.00:15.00) has the highest value. Among the hybrid composite,
20(15.00:5.00) and 20(10.00:10.00) showed the most promise since its Gc value is almost
as high as 20(20.00:0.00) and its Kc is comparatively higher than the others. In general, the
objective of improving the impact properties of the composite through hybridization was
achieved.

119
Figure 4.46: Kc and Gc values for all composites
2.0
2.5
3.0
3.5
4.0
0 2 4 6 8 10 12
Kc (
MP
a.m
1/2
)
Gc (kJ.m-2)
5(5.00:0.00)
5(3.75:1.25)
5(2.50/2.50)
5(1.25/3.75)
5(0.00/5.00)
10(10.00:0.00)
10(7.50:2.50)
10(5.00:5.00)
10(2.50:7.50)
10(0.00:10.00)
20(20.00:0.00)
20(15.00:5.00)
20(10.00:10.00)
20(5.00:15.00)
20(0.00:20.00)

120
5 CHAPTER 5
CONCLUSION AND SUGGESTION FOR FUTURE WORKS
5.1 Conclusion
From the determination of thermal and mechanical properties of the composites and the
effect of hybridisation, the following conclusions have been made:
i. Intimately mixed hybrid aramid/carbon fibre reinforced polypropylene composites
were successfully prepared and moulded via extrusion and injection moulding.
ii. From TGA, it was found that hybridisation improved the thermal stability of the
composites. The hybrid composites possess better thermal stability than its single
fibre reinforced counterparts. From DSC, it was found that the melting temperature
and the degree of crystallinity of the composites were not significantly affected by
hybridisation. This means that the hybrid can be processed using the same
temperature as the single fibre composites.
iii. Hybridisation improves the tensile modulus and strength of the composites.
Fracture strain on the other hand is more sensitive towards the total Vf regardless of
the fibre proportions. Flexural modulus increases with increasing total Vf,
regardless of fibre proportions. Flexural strength was negatively affected by
hybridisation. Flexural displacement on the other hand did not show any significant
trend. The impact properties of the composite were significantly improved with
hybridisation. Hybridisation produced composites with relatively high Gc and Kc
values
iv. From the SEM micrographs, it was found that the interfacial bonding between the
fibres and the matrix was weak, based on the clean fibre surface during fracture. It

121
was an expected observation since no surface treatment or compatibilisers were
used in the preparation of the composites.
5.2 Suggestions for Future Works
i. The interfacial interaction between the fibre and the matrix can be improved by
introducing coupling agents such maleic anhydride or through fibre surface
treatment.
ii. The effect of temperature on the mechanical properties of the composites can be
tested.
iii. The composites could also be subjected to weathering studies. This is especially
important since aramid fibres are hygroscopic and sensitive to UV.
iv. The fibre length distribution in the hybrid composite could be studied to further
understand the fibre-fibre interaction that occurs during processing.
122
REFERENCES
1. Zangenberg, J., P. Brøndsted, and M. Koefoed, Design of a fibrous composite
preform for wind turbine rotor blades. Materials & Design, 2014. 56(0): p. 635-
641.
2. Carley, J.F., Whittington's dictionary of plastics: edited by James F. Carley. 1993:
CRC PressINC.
3. Mallick, P.K., Fibre Reinforced Composites: Materials, Manufacturing and Design.
2008, Boca Raton, Florida: CRC Press.
4. De, S.K. and J.R. White, Short Fibre: Polymer Composites. 1996: Woodhead Pub.
5. Ahmad, J., Machining of Polymer Composites. 2008: Springer.
6. Mazumdar, S.K., Composite Manufacturing: Materials, Product and Process
Engineering. 2002, Boca Raton, Florida: CRC Press.
7. de Freitas, M. and L. Reis, Failure mechanisms on composite specimens subjected
to compression after impact. Composite Structures, 1998. 42(4): p. 365-373.
8. Peijs, A.A.J.M., R.W. Venderbosch, and P.J. Lemstra, Hybrid composites based on
polyethylene and carbon fibres Part 3: Impact resistant structural composites
through damage management. Composites, 1990. 21(6): p. 522-530.
9. Cao, Y., J. Feng, and P. Wu, Simultaneously improving the toughness, flexural
modulus and thermal performance of isotactic polypropylene by α-β crystalline
transition and inorganic whisker reinforcement. Polymer Engineering & Science,
2010. 50(2): p. 222-231.
10. Karger-Kocsis, J., Polypropylene Structure, Blends and Composites V.1: Structure
and Morphology. 1995: Chapman & Hall.
11. Natta, G. and P. Corradini, Structure and properties of isotactic polypropylene. Il
Nuovo Cimento Series 10, 1960. 15(1): p. 40-51.
12. Maier, C. and T. Calafut, Polypropylene: The Definitive Users Guide. 1998: Plastics
Design Library.
13. Ullmann's Encyclopedia of Industrial Chemistry. 2003: John Wiley & Sons.
14. Andrews, M.C. and R.J. Young, Analysis of the deformation of aramid fibres and
composites using Raman spectroscopy. Journal of Raman Spectroscopy, 1993.
24(8): p. 539-544.
15. S van der Zwaag, et al., Chain stretching in aramid fibres. Polymer
Communications, 1987. 28: p. 276-277.

123
16. Zhang, H., et al., Effects of solar UV irradiation on the tensile properties and
structure of PPTA fiber. Polymer Degradation and Stability, 2006. 91(11): p. 2761-
2767.
17. Dobb, M.G., R.M. Robson, and A.H. Roberts, The ultraviolet sensitivity of Kevlar
149 and Technora fibres. Journal of Materials Science, 1993. 28(3): p. 785-788.
18. Brown, J.R., et al., Photochemical Ageing of Kevlar® 49. Textile Research Journal,
1983. 53(4): p. 214-219.
19. Tanaka, K., et al., Characterization of the aramid/epoxy interfacial properties by
means of pull-out test and influence of water absorption. Composites Science and
Technology, 2002. 62(16): p. 2169-2177.
20. Komai, K., S. Shiroshita, and K. Okamoto, Effects of Water Absorption and
Cryogenic Temperature on Strength of ArFRP. Journal of the Society of Materials
Science, Japan, 1997. 46(2): p. 157-162.
21. Cervenka, A.J., D.J. Bannister, and R.J. Young, Moisture absorption and interfacial
failure in aramid/epoxy composites. Composites Part A: Applied Science and
Manufacturing, 1998. 29(9–10): p. 1137-1144.
22. Komai, K., K. Minoshima, and K. Tanaka, Delamination induced by low-velocity
impact and influence of water absorption on delamination and CAI of FRPs.
Nippon Kikai Gakkai Ronbunshu, A Hen/Transactions of the Japan Society of
Mechanical Engineers, Part A, 1997. 63(610): p. 1198-1204.
23. Komai, K., et al., Effects of stress waveform and water absorption on the fatigue
strength of angle-ply aramid fiber/epoxy composites. International Journal of
Fatigue, 2002. 24(2–4): p. 339-348.
24. Fitzer, E., Carbon fibres and their composites. 1985: Springer-Verlag.
25. Chand, S., Review Carbon fibers for composites. journal of materials science, 2000.
35(6): p. 1303-1313.
26. Minus, M. and S. Kumar, The processing, properties, and structure of carbon
fibers. JOM, 2005. 57(2): p. 52-58.
27. White, J.R., Fibre reinforcements for composite materials (Composite materials
series, volume 2) Edited by A. R. Bunsell (Series Editor: R. B. Pipes), Elsevier
Science Publishers, Amsterdam, 1988, pp. ix + 537, price US£171.00, Dfl 325.00.
ISBN 0–444–42801-1 (Series: ISBN 0–444–42525-X). Journal of Chemical
Technology & Biotechnology, 1990. 48(3): p. 388-388.
28. Thomas, S. and L.A. Pothan, Natural Fibre Reinforced Polymer Composites: From
Macro to Nanoscale. 2009: Éd. des Archives contemporaines.
124
29. Hancox, N.L., Fibre composite hybrid materials. 1981: Applied Science.
30. Marom, G., et al., Hybrid effects in composites: conditions for positive or negative
effects versus rule-of-mixtures behaviour. journal of materials science, 1978. 13(7):
p. 1419-1426.
31. Pan, N. and R. Postle, The Tensile Strength of Hybrid Fibre Composites: A
Probabilistic Analysis of the Hybrid Effects. Philosophical Transactions of the
Royal Society of London. Series A: Mathematical, Physical and Engineering
Sciences, 1996. 354(1714): p. 1875-1897.
32. Tadmor, Z. and C.G. Gogos, Principles of Polymer Processing. 2006: Wiley.
33. Manas-Zloczower, I., Mixing and Compounding of Polymers: Theory and Practice.
2009: Hanser.
34. Chung, C.I., Extrusion of Polymers: Theory and Practice. 2000: Hanser Gardner
Publications.
35. Rauwendaal, C., Polymer Extrusion. 2001: Hanser Gardner Publications.
36. Osswald, T.A., Polymer processing fundamentals. 2006: Hanser.
37. Handbook of Polypropylene and Polypropylene Composites. 2003: Marcel Dekker
Incorporated.
38. Lobo, H. and J.V. Bonilla, Handbook of Plastics Analysis. 2003: Marcel Dekker.
39. Hartikainen, J., et al., Polypropylene hybrid composites reinforced with long glass
fibres and particulate filler. Composites Science and Technology, 2005. 65(2): p.
257-267.
40. Lin, L.-Y., et al., Preparation and characterization of layered silicate/glass
fiber/epoxy hybrid nanocomposites via vacuum-assisted resin transfer molding
(VARTM). Composites Science and Technology, 2006. 66(13): p. 2116-2125.
41. Mingzhu Pan, S.Y. Zhang, and Dingguo Zhou, Preparation and Properties of
Wheat Straw Fiber-polypropylene Composites. Part II. Investigation of Surface
Treatments on the Thermo-mechanical and Rheological Properties of the
Composites. Journal of Composite Materials, 2010. 44(9): p. 1061-1073.
42. Idicula, M., et al., Dynamic mechanical analysis of randomly oriented intimately
mixed short banana/sisal hybrid fibre reinforced polyester composites. Composites
Science and Technology, 2005. 65(7-8): p. 1077-1087.
43. Fu, S.Y., et al., Tensile properties of short-glass-fiber- and short-carbon-fiber-
reinforced polypropylene composites. Composites Part A: Applied Science and
Manufacturing, 2000. 31(10): p. 1117-1125.

125
44. Jacob, M., S. Thomas, and K.T. Varughese, Mechanical properties of sisal/oil palm
hybrid fiber reinforced natural rubber composites. Composites Science and
Technology, 2004. 64(7-8): p. 955-965.
45. Velmurugan, R. and V. Manikandan, Mechanical properties of palmyra/glass fiber
hybrid composites. Composites Part A: Applied Science and Manufacturing, 2007.
38(10): p. 2216-2226.
46. Deng, S., et al., Evaluation of fibre tensile strength and fibre/matrix adhesion using
single fibre fragmentation tests. Composites Part A: Applied Science and
Manufacturing, 1998. 29(4): p. 423-434.
47. Tjong, S.C., et al., Short glass fiber-reinforced polyamide 6,6 composites toughened
with maleated SEBS. Composites Science and Technology, 2002. 62(15): p. 2017-
2027.
48. Rijsdijk, H.A., M. Contant, and A.A.J.M. Peijs, Continuous-glass-fibre-reinforced
polypropylene composites: I. Influence of maleic-anhydride-modified polypropylene
on mechanical properties. Composites Science and Technology, 1993. 48(1–4): p.
161-172.
49. Chow, C.P.L., X.S. Xing, and R.K.Y. Li, Moisture absorption studies of sisal fibre
reinforced polypropylene composites. Composites Science and Technology, 2007.
67(2): p. 306-313.
50. Dhakal, H.N., Z.Y. Zhang, and M.O.W. Richardson, Effect of water absorption on
the mechanical properties of hemp fibre reinforced unsaturated polyester
composites. Composites Science and Technology, 2007. 67(7–8): p. 1674-1683.
51. Chen, H., M. Miao, and X. Ding, Influence of moisture absorption on the interfacial
strength of bamboo/vinyl ester composites. Composites Part A: Applied Science and
Manufacturing, 2009. 40(12): p. 2013-2019.
52. Almgren, K.M., et al., Effects of Moisture on Dynamic Mechanical Properties of
Wood Fiber Composites Studied by Dynamic FT-IR Spectroscopy. Journal of
Reinforced Plastics and Composites, 2008. 27(16-17): p. 1709-1721.
53. Bradley, W.L. and T.S. Grant, The effect of the moisture absorption on the
interfacial strength of polymeric matrix composites. journal of materials science,
1995. 30(21): p. 5537-5542.
54. Rozman, H.D., et al., Polypropylene–oil palm empty fruit bunch–glass fibre hybrid
composites: a preliminary study on the flexural and tensile properties. European
Polymer Journal, 2001. 37(6): p. 1283-1291.
55. Mishra, S., et al., Studies on mechanical performance of biofibre/glass reinforced
polyester hybrid composites. Composites Science and Technology, 2003. 63(10): p.
1377-1385.

126
56. Rezaei, F., et al., Development of Short-Carbon-Fiber-Reinforced Polypropylene
Composite for Car Bonnet. Polymer-Plastics Technology and Engineering, 2008.
47(4): p. 351-357.
57. Hassan, A., et al., Interfacial shear strength and tensile properties of injection-
molded, short- and long-glass fiber-reinforced polyamide 6,6 composites. Journal of
Reinforced Plastics and Composites, 2011. 30(14): p. 1233-1242.
58. ASTM, ASTM Standard D638 Standard test method for tensile properties of
plastics, 2010, ASTM International.
59. ASTM, ASTM Standard D760 Standard test methods for flexural properties of
unreinforced and reinforced plastics and electrical insulating materials, 2010,
ASTM International.
60. ASTM, ASTM Standard E23 Standard test methods for notched bar impact testing
of metallic materials, 2012, ASTM International.
61. Hassan, A., et al., Tensile, Impact and Fiber Length Properties of Injection-Molded
Short and Long Glass Fiber-Reinforced Polyamide 6,6 Composites. Journal of
Reinforced Plastics and Composites, 2004. 23(9): p. 969-986.
62. Rezaei, F., R. Yunus, and N.A. Ibrahim, Effect of fiber length on thermomechanical
properties of short carbon fiber reinforced polypropylene composites. Materials &
Design, 2009. 30(2): p. 260-263.
63. Rezaei, F., et al., Effect of fiber loading and fiber length on mechanical and thermal
properties of short carbon fiber reinforced polypropylene composite. The
Malaysian Journal of Analytical Sciences, 2007. 11(1): p. 181-188.
64. Bourbigot, S., X. Flambard, and F. Poutch, Study of the thermal degradation of high
performance fibres—application to polybenzazole and p-aramid fibres. Polymer
Degradation and Stability, 2001. 74(2): p. 283-290.
65. Maity, J., et al., Direct fluorination of Twaron fiber and the mechanical, thermal
and crystallization behaviour of short Twaron fiber reinforced polypropylene
composites. Composites Part A: Applied Science and Manufacturing, 2008. 39(5):
p. 825-833.
66. Golebiewski, J. and A. Galeski, Thermal stability of nanoclay polypropylene
composites by simultaneous DSC and TGA. Composites Science and Technology,
2007. 67(15–16): p. 3442-3447.
67. Abu-Sharkh, B.F. and H. Hamid, Degradation study of date palm
fibre/polypropylene composites in natural and artificial weathering: mechanical
and thermal analysis. Polymer Degradation and Stability, 2004. 85(3): p. 967-973.

127
68. Karsli, N.G. and A. Aytac, Effects of maleated polypropylene on the morphology,
thermal and mechanical properties of short carbon fiber reinforced polypropylene
composites. Materials & Design, 2011. 32(7): p. 4069-4073.
69. Nayak, S.K., S. Mohanty, and S.K. Samal, Influence of short bamboo/glass fiber on
the thermal, dynamic mechanical and rheological properties of polypropylene
hybrid composites. Materials Science and Engineering: A, 2009. 523(1–2): p. 32-
38.
70. Cui, Y.-H., et al., Fabrication and properties of nano-ZnO/glass-fiber-reinforced
polypropylene composites. Journal of Vinyl and Additive Technology, 2010. 16(3):
p. 189-194.
71. Abdelmouleh, M., et al., Short natural-fibre reinforced polyethylene and natural
rubber composites: Effect of silane coupling agents and fibres loading. Composites
Science and Technology, 2007. 67(7–8): p. 1627-1639.
72. Bhattacharyya, A.R., et al., Crystallization and orientation studies in
polypropylene/single wall carbon nanotube composite. Polymer, 2003. 44(8): p.
2373-2377.
73. Yamada, K., et al., Molecular Weight Dependence of Equilibrium Melting
Temperature and Lamellar Thickening of Isotactic Polypropylene with High
Tacticity. Journal of Macromolecular Science, Part B, 2003. 42(3-4): p. 733-752.
74. Cao, Y., J. Feng, and P. Wu, DSC and morphological studies on the crystallization
behavior of β-nucleated isotactic polypropylene composites filled with Kevlar
fibers. Journal of Thermal Analysis and Calorimetry, 2010. 103(1): p. 339-345.
75. Tan, J.K., T. Kitano, and T. Hatakeyama, Crystallization of carbon fibre reinforced
polypropylene. Journal of Materials Science, 1990. 25(7): p. 3380-3384.
76. Tan, J., T. Kitano, and T. Hatakeyama, Crystallization of carbon fibre reinforced
polypropylene. journal of materials science, 1990. 25(7): p. 3380-3384.
77. Afaghi-Khatibi, A. and Y.-W. Mai, Characterisation of fibre/matrix interfacial
degradation under cyclic fatigue loading using dynamic mechanical analysis.
Composites Part A: Applied Science and Manufacturing, 2002. 33(11): p. 1585-
1592.
78. Kanny, K., et al., Dynamic mechanical analyses and flexural fatigue of PVC foams.
Composite Structures, 2002. 58(2): p. 175-183.
79. Rooj, S., et al., Influence of “expanded clay” on the microstructure and fatigue
crack growth behavior of carbon black filled NR composites. Composites Science
and Technology, 2013. 76(0): p. 61-68.

128
80. Papadimitriou, K.D., et al., Covalent cross-linking in phosphoric acid of pyridine
based aromatic polyethers bearing side double bonds for use in high temperature
polymer electrolyte membrane fuelcells. Journal of Membrane Science, 2013.
433(0): p. 1-9.
81. Sakurai, K., T. Maegawa, and T. Takahashi, Glass transition temperature of
chitosan and miscibility of chitosan/poly(N-vinyl pyrrolidone) blends. Polymer,
2000. 41(19): p. 7051-7056.
82. Goertzen, W.K. and M.R. Kessler, Dynamic mechanical analysis of carbon/epoxy
composites for structural pipeline repair. Composites Part B: Engineering, 2007.
38(1): p. 1-9.
83. MacCrum, N.G., B.E. Read, and G. Williams, Anelastic and dielectric effects in
polymeric solids. 1967: Dover Publications, Incorporated.
84. D e -Gutiérrez, S., et al., Dynamic mechanical analysis of injection-moulded discs
of polypropylene and untreated and silane-treated talc-filled polypropylene
composites. Polymer, 1999. 40(19): p. 5345-5353.
85. Thomason, J.L., The influence of fibre length, diameter and concentration on the
modulus of glass fibre reinforced polyamide 6,6. Composites Part A: Applied
Science and Manufacturing, 2008. 39(11): p. 1732-1738.
86. Thomason, J.L. and M.A. Vlug, Influence of fibre length and concentration on the
properties of glass fibre-reinforced polypropylene: 1. Tensile and flexural modulus.
Composites Part A: Applied Science and Manufacturing, 1996. 27(6): p. 477-484.
87. Arroyo, M., R. Zitzumbo, and F. Avalos, Composites based on PP/EPDM blends
and aramid short fibres. Morphology/behaviour relationship. Polymer, 2000.
41(16): p. 6351-6359.
88. Thomason, J.L., et al., Influence of fibre length and concentration on the properties
of glass fibre-reinforced polypropylene: Part 3. Strength and strain at failure.
Composites Part A: Applied Science and Manufacturing, 1996. 27(11): p. 1075-
1084.
89. Thomason, J.L., The influence of fibre length, diameter and concentration on the
strength and strain to failure of glass fibre-reinforced polyamide 6,6. Composites
Part A: Applied Science and Manufacturing, 2008. 39(10): p. 1618-1624.
90. Llorca, J., Fiber fracture 2002: Elsevier Science & Technology Books.
91. Mittal, R.K. and V.B. Gupta, The strength of the fibre-polymer interface in short
glass fibre-reinforced polypropylene. journal of materials science, 1982. 17(11): p.
3179-3188.

129
92. Sreekala, M.S., et al., The mechanical performance of hybrid phenol-formaldehyde-
based composites reinforced with glass and oil palm fibres. Composites Science
and Technology, 2002. 62(3): p. 339-353.
93. You, Y.-J., et al., Hybrid effect on tensile properties of FRP rods with various
material compositions. Composite Structures, 2007. 80(1): p. 117-122.
94. Thomason, J.L., Micromechanical parameters from macromechanical
measurements on glass reinforced polypropylene. Composites Science and
Technology, 2002. 62(10–11): p. 1455-1468.
95. Nicholson, The Chemistry of Polymers. 2011: Royal Society of Chemistry.
96. Ku, H., et al., Drop Weight Impact Test Fracture of Vinyl Ester Composites:
Micrographs of Pilot Study. Journal of Composite Materials, 2005. 39(18): p. 1607-
1620.
97. Richardson, O.W., Polymer engineering composites. 1977: Applied Science
Publishers.
98. Thomason, J.L. and M.A. Vlug, Influence of fibre length and concentration on the
properties of glass fibre-reinforced polypropylene: 4. Impact properties.
Composites Part A: Applied Science and Manufacturing, 1997. 28(3): p. 277-288.
99. Masud, A., A.K.B. Zaman, and A. Al-Khaled, Effects of environment on fracture
toughness of glass fiber/polyester composite. Journal of Mechanical Engineering,
2007. 38: p. 38-44.
100. Hassan, A., A.A. Hassan, and M.I. Mohd Rafiq, Impact properties of injection
molded glass fiber/polyamide-6 composites: effect of testing parameters. Journal of
Reinforced Plastics and Composites, 2011. 30(10): p. 889-898.
101. Reis, P.N.B., et al., Impact response of Kevlar composites with filled epoxy matrix.
Composite Structures, 2012. 94(12): p. 3520-3528.
102. Iqbal, K., et al., Impact damage resistance of CFRP with nanoclay-filled epoxy
matrix. Composites Science and Technology, 2009. 69(11–12): p. 1949-1957.
103. Hassan, A., et al., Extrusion and pultrusion compounded carbon fibre reinforced PA
6,6 composites: impact properties of injection moulded specimens. Malaysian
Journal of Science, 2003. 22: p. 105-110.