![Bis[chloridobis(1,10-phenanthroline)copper(II ... · + cations (phen is 1,10-phenanthroline), [Fe(CN) 5 NO] 2 anions and one di-methylformamide (DMF) solvent molecule of crystallization](https://static.fdocuments.in/doc/165x107/603d32ed89872c77881dd664/bischloridobis110-phenanthrolinecopperii-cations-phen-is-110-phenanthroline.jpg)
Process Intensified Anti-Solvent Crystallization of O ...
28
Journal Pre-proof Process Intensified Anti-Solvent Crystallization of O-Aminobenzoic Acid via Sonication and Flow Mohammed Noorul Hussain, Stijn Baeten, Jeroen Jordens, Leen Braeken, Tom Van Gerven PII: S0255-2701(19)31441-2 DOI: https://doi.org/10.1016/j.cep.2020.107823 Reference: CEP 107823 To appear in: Chemical Engineering and Processing - Process Intensification Received Date: 14 November 2019 Revised Date: 15 January 2020 Accepted Date: 15 January 2020 Please cite this article as: Hussain MN, Baeten S, Jordens J, Braeken L, Van Gerven T, Process Intensified Anti-Solvent Crystallization of O-Aminobenzoic Acid via Sonication and Flow, Chemical Engineering and Processing - Process Intensification (2020), doi: https://doi.org/10.1016/j.cep.2020.107823 This is a PDF file of an article that has undergone enhancements after acceptance, such as the addition of a cover page and metadata, and formatting for readability, but it is not yet the definitive version of record. This version will undergo additional copyediting, typesetting and review before it is published in its final form, but we are providing this version to give early visibility of the article. Please note that, during the production process, errors may be discovered which could affect the content, and all legal disclaimers that apply to the journal pertain. © 2019 Published by Elsevier.
Transcript of Process Intensified Anti-Solvent Crystallization of O ...

Journal Pre-proof
Process Intensified Anti-Solvent Crystallization of O-Aminobenzoic Acidvia Sonication and Flow
Mohammed Noorul Hussain, Stijn Baeten, Jeroen Jordens, LeenBraeken, Tom Van Gerven
PII: S0255-2701(19)31441-2
DOI: https://doi.org/10.1016/j.cep.2020.107823
Reference: CEP 107823
To appear in: Chemical Engineering and Processing - Process Intensification
Received Date: 14 November 2019
Revised Date: 15 January 2020
Accepted Date: 15 January 2020
Please cite this article as: Hussain MN, Baeten S, Jordens J, Braeken L, Van Gerven T,Process Intensified Anti-Solvent Crystallization of O-Aminobenzoic Acid via Sonication andFlow, Chemical Engineering and Processing - Process Intensification (2020),doi: https://doi.org/10.1016/j.cep.2020.107823
This is a PDF file of an article that has undergone enhancements after acceptance, such asthe addition of a cover page and metadata, and formatting for readability, but it is not yet thedefinitive version of record. This version will undergo additional copyediting, typesetting andreview before it is published in its final form, but we are providing this version to give earlyvisibility of the article. Please note that, during the production process, errors may bediscovered which could affect the content, and all legal disclaimers that apply to the journalpertain.
© 2019 Published by Elsevier.

Process Intensified Anti-Solvent Crystallization of
O-Aminobenzoic Acid via Sonication and Flow
Mohammed Noorul Hussain 1, Stijn Baeten 1, Jeroen Jordens 1, Leen Braeken 1, Tom Van Gerven 1*
1Department of Chemical Engineering, KU Leuven, Belgium
Graphical abstract
Highlights
Batch and flow anti-solvent crystallization experiments were conducted in silent and sonicated
conditions.
In batch experiments, form – I nucleated at low anti-solvent volume and form – II at high anti-solvent
volume.
A significant change in the polymorphic yield is observed in flow experiments where concomitant
nucleation of form – II and III was observed for all cases.
Ultrasound in flow provided a yield of nearly 50 % at a residence time of mere 2.5 s.
Ultrasound can be considered as a useful technique for continuous production of metastable
polymorphs.
Jour
nal P
re-p
roof

Abstract:
Process intensification via flow and ultrasound can make crystallization much more efficient, economic,
reproducible and safe. However, successful application requires obtaining substantial knowledge on the effect of
these techniques on process parameters and product properties. Investigation of such effects on polymorphism is
still limited. In this work, batch and flow anti-solvent crystallization of o-aminobenzoic acid (o-ABA – 3
polymorphs) was conducted in silent and sonicated conditions. A new type of continuous flow sono-crystallizer
was also demonstrated. In batch experiments, form – I nucleated at low anti-solvent volume and form – II at
high anti-solvent volume. However, differences in mixing led to a significant change in the nucleated
polymorph in flow experiments where concomitant nucleation of form – II and III was observed for all cases.
Ultrasound did not affect the polymorph in either systems but did enhance the process by reducing induction
time and increasing yield. Ultrasound in flow with a residence time of mere 2.5 s, provided a yield of nearly 50
%, which was 2.4 times more than silent conditions. Ultrasound can be considered as a useful technique for
continuous production of metastable polymorphs as it provides high yield at low residence time thus, alleviating
risk of solvent-mediated transformation.
Keywords: Polymorphism, o–aminobenzoic acid, ultrasound, flow crystallization, process intensification.
Introduction
In the pharmaceutical industry crystalline organic compounds are refined via (re)crystallization to obtain final
desired product properties such as particle size, shape, chirality and polymorphism. Application of process
intensification techniques in crystallization can improve efficiency, product quality and process safety, and
reduce cost and wastage [1]. Process intensification can bring down the scale of production systems and reduce
product time to market [1]. Continuous crystallization is an intensification technique that has seen a rise in
application in the industry due to advantages like elimination of batch-to-batch variation, smaller inventories
and reduced costs [2] [3] [4]. Tubular flow crystallizers provide benefits like faster supersaturation achievement,
constant properties at steady state, narrow residence time distribution and miniaturization of the control volume
Jour
nal P
re-p
roof

[5]. Although several benefits are expected by using a flow system, the actual implementation is not simple nor
straightforward. Several factors such as mixing, residence time, temperature, etc. must be optimized to achieve
high yield and quality. Continuous flow crystallization is growing in the pharmaceutical industry but there is
still a dearth of knowledge on its use for crystallizing products exhibiting properties like polymorphism [6].
Several crystalline pharmaceutical solids exhibit polymorphism, that is, they can exist in multiple crystalline
forms with the same chemical composition but different physical and chemical properties. Differences in
bioavailability, solubility, dissolution rate, flow behavior, etc. among polymorphs of pharmaceutical compounds
can cause several problems for medical use [7]. Among the polymorphs of a compound only one of them is
thermodynamically stable under a certain temperature and pressure [8]. This form is usually selected for
commercial purposes from a manufacturability point of view. However, the metastable polymorphs may
sometimes have multiple advantageous physical and chemical properties over the stable form (e.g. better
tabletability of the metastable form – II of Paracetamol) [8]. Polymorph control is an important issue for the
chemical industry but is even more crucial for the pharmaceutical industry [7]. Polymorph control during
crystallization is challenging because varying supersaturation, solvent-mediated transformation, temperature
changes, impurities, etc. can affect the final product. Thorough understanding of the changes that new
technologies bring in polymorph nucleation is a first step towards enabling them for controlled polymorph
production.
The effectiveness of flow crystallization with respect to the anti-solvent method depends a lot on the mixing in
the channels. Ultrasound is a technique that can be applied to improve mixing in flow crystallizers. Ultrasound
has been shown to reduce induction times, meta-stable zone widths and increase nucleation rates. Coupling
ultrasound with tubular flow crystallizers provides the benefit of better mixing and positive effects from
cavitation (like reduced induction time) that can make continuous crystallization even more viable. Ultrasound
is also known to reduce clogging [9]. A few works have shown that ultrasound can also influence the nucleation
of polymorphs. Gracin et al. [10] showed that applying ultrasound at 20 kHz nucleates the metastable
polymorph at the nucleation temperature of the stable polymorph. Bhangu et al. [11] showed that applying
ultrasound at higher power or frequency up to 98 kHz can enhance the production of the metastable form – II of
paracetamol instead of stable form - I. Louhi-Kultanen et al. [12] also demonstrated that ultrasound increased
the nucleation of form of Glycine over other polymorphic forms. Works investigating the effect of ultrasound
on polymorph are still limited, therefore more experimental studies are needed that compare silent to sonicated
processes and batch to flow processes from a polymorph control point of view [7].
Jour
nal P
re-p
roof

Ortho-aminobenzoic acid (o-ABA) is a basic component in the derivation of a lot of non-steroidal anti-
inflammatory drugs like mefenamic acid, tolfenamic acid, flufenamic acid, etc. [13]. o-ABA crystallizes in three
polymorphic forms. Below 81 0C form – I is the most stable form. Form – I is enantiotropically related to form –
II and III while form – II and III are monotropically related to each other [14]. Polymorph control of o-ABA was
carried out in batch anti-solvent crystallization by Jiang et al. [15] [16]. Ethanol was used as solvent and water
was used as anti-solvent. It was shown that low anti solvent vol.% or low supersaturation levels (< 1.4) lead to
nucleation of form-I, whereas a high anti-solvent vol.% level (supersaturation > 1.8) supports form-II.
Intermediate anti-solvent vol.% levels lead to concomitant polymorphism. Form – III was not obtained in anti-
solvent crystallization. Solvent-based transformation of form-II to form-I is known to be quite quick (already
starts in 5 minutes) [15]. A microfluidic-scale screening device developed by Coliaie et al. [17] also confirmed
the presence of form - I at low supersaturation and form - II at high supersaturation. They also mentioned that at
such scales, form - II can be transformed to form - I within 3 minutes of staying in solution where the
supersaturation level has reduced due to nucleation. This implies that in a flow system the residence time would
play a very important role. To the best of authors’ knowledge ultrasound was not applied so far in crystallization
of o-ABA.
In this work, o-ABA is used as a model compound for batch and flow anti-solvent crystallization. Ultrasound is
applied for the first time in the crystallization of the polymorphic compound - o-ABA. Effects of ultrasound on
polymorphic systems may differ from compound to compound. In addition, antisolvent, tubular flow
crystallization is investigated and a newly designed, interval-contact, tubular crystallizer is used. This work also
compares silent and sonicated, flow and batch crystallization. The aim of the study is to analyze the effect of
process intensification techniques on polymorph nucleation, induction time and yield. It is important to know of
the existence and extent of the effects of process intensification techniques so that production facilities aiming
to use ultrasound and/or flow can then take in to account these observations related to polymorph. Polymorph
control in flow is not attempted in this work, however, some strategies are suggested based on the behavior of
the flow system.
Materials and Methods
Anti-solvent crystallization of o-ABA is carried out in flow and batch crystallizers. 98% pure o-ABA is used
from Alfa-Aesar which was confirmed as form - I via ATR-FTIR and PXRD. 99.9 % pure absolute ethanol from
Fischer-Scientific was used as solvent and distilled water was used as anti-solvent. The solubility of form – I
Jour
nal P
re-p
roof

and II at 25 0C was obtained from the work of Jiang et al. [15]. Relation of solubility of form – III with other
forms at different temperatures is provided in the supplementary information. Supersaturation was calculated as
the ratio of concentration of o-ABA at a certain volume fraction (VF) and the solubility concentration at 25 0C at
that volume fraction. Fig. 1 shows the chemical structure and the crystal structure of the 3 polymorphs. Fig. 2
shows the solubility curve for different VF. Measured amount of o-ABA was added to the solvent and allowed
to dissolve at 25 0C for at least 2 h for a starting concentration of 1.2 mol/l-solution. The solution was filtered in
a vacuum filtration setup with 0.22 m filter to remove impurities. The solution was then stirred for at least 30
min at 25 0C. Water is stirred and heated simultaneously at 25 0C. Heating and stirring were carried out on IKA®
RCT heating and stirring plates. For flow experiments, solution and anti-solvent were pumped using two
BUCHI piston pumps (C601 with C615 controller) which have a flow rate range from 2.5 ml/min to 250
ml/min. The pumps are capable of maintaining flow rates up to 10 bar of back-pressure. Both solution and anti-
solvent are passed through solvent filters to remove any impurities during pumping. The crystallizer used for
flow experiments was designed specifically for these experiments. The crystallizer is based on the interval-
contact design as in the work of John et al. [18]. It is made up of a hollow aluminum shell of dimensions 106 x
106 x 2.4 mm. The base, which supports PFA tubing, is designed in a way to allow tubing of varying lengths to
be placed if desired. The hollow part allows circulation of water for temperature control in the PFA tubes. A
Julabo HE Lab thermostat, with internal PT100 control, pumping water at 22 L/min, is used for temperature
control in the crystallizer. The top side of the aluminum block is covered with a transparent plexi-glass plate.
The assembly is bolted to an ultrasonic transducer. Fig. 3 shows the experimental schematic for flow
experiments and the flow crystallizer. In flow experiments, the PFA tube is 17 cm long from the inlet of anti-
solvent to the outlet. The PFA tube is of 2 mm inner diameter and 3 mm outer diameter from Bohlender GmbH.
For the inlet of the anti-solvent from one end of this main tube an annular type setup is used. A secondary PFA
tube with 1 mm internal diameter and 1.6 mm outer diameter from IDEX – HS is used for adding the anti-
solvent. The anti-solvent is added right at the place where the tube is supported in the crystallizer. Fig. 3(c)
shows an illustration of the inlet. To reach a desired VF of anti-solvent the solution flow rate is kept constant
and the anti-solvent flow rate is varied suitably. Crystallization is detected by visual means in all cases. The
transducer used in this work is a Langevin type transducer from Ultrasonics world (MPI-7850D-20_40_60H). Jo
urna
l Pre
-pro
of

The frequency is kept constant at 20.75 kHz (resonance frequency). An EI 1020L amplifier with a Picotest
G5100A signal generator was used to control the transducer.
Figure 2: Phase diagram of o-ABA at 25 0C. Solid curves show the solubility of form – I and II at different volume fraction of anti-
solvent, solid line represents the working concentration line for starting concentration of 1.2 mol/L-sol. Dotted lines show the
supersaturation (SS) for different volume fractions, crosses represent the conditions experimentally tested.
Figure 1: (left) Chemical structure of o-ABA (right) Crystal structures of the three polymorphs of o-ABA.
Jour
nal P
re-p
roof

In flow experiments, solution and anti-solvent are simultaneously pumped at specific flow rates. Care is taken
to have solution and anti-solvent enter the channel at the same time so that there is no excess of any reagent in
the system. In sonicated experiments ultrasound is applied at this point. The system is then constantly observed
and at the first identification of crystals the induction time is recorded. The experiment is continued to collect
sample for polymorph and yield analysis. For all experiments the crystals are collected at the outlet in a vacuum
filtration setup. The slurry is filtered with a 0.22 m filter and dried with compressed air as extra precaution
against solvent-mediated transformation. For yield analysis, collected crystals are further allowed to dry in air
for at least 36 h and then weighed. The yield is calculated in percentage of the dissolved mass of crystals as per
Eq. 1.
𝑌𝑖𝑒𝑙𝑑 % = 𝑀𝑎𝑠𝑠 𝑜𝑓 𝑐𝑜𝑙𝑙𝑒𝑐𝑡𝑒𝑑 𝑐𝑟𝑦𝑠𝑡𝑎𝑙𝑠 (𝑔𝑟𝑎𝑚𝑠) ∗ 100
𝐷𝑖𝑠𝑠𝑜𝑙𝑣𝑒𝑑 𝑚𝑎𝑠𝑠 𝑜𝑓 𝑐𝑟𝑦𝑠𝑡𝑎𝑙𝑠 𝑖𝑛 𝑡ℎ𝑎𝑡 𝑣𝑜𝑙𝑢𝑚𝑒 (𝑔𝑟𝑎𝑚𝑠) 1
Polymorphic form (either form – I, II or III) of the crystals obtained in each experiment was analyzed via
Attenuated Total Reflection - Fourier Transform Infrared (ATR-FTIR) spectroscopy and Scanning Electron
Microscopy as used in the work of Simone et al. [14]. The ATR-FTIR device used was a Perkin – Elmer
Spectrum 100 with UATR accessory. ATR-FTIR allowed much quicker analysis compared to Powder X – Ray
Figure 3: Experimental setup for batch and flow experiments (a) schematic of the flow experiments (b) flow crystallizer designed and
used for flow experiments (c) illustration of the inlet of the solution and anti-solvent (water) (d) experimental setup for batch
experiments – the ultrasonic horn is not present in the silent experiments.
Jour
nal P
re-p
roof

Diffraction (PXRD) and of much smaller quantities ( ≈ 100 mg). The PXRD equipment used was a Bruker D2
phaser. SEM was used for low yield samples. The SEM device used was JEOL JSM – 6010LV. The samples
were coated with a gold/palladium coating using a JEOL JFC 1300 sputter coater (20 mA for 40 s). Images were
taken with a 18 kV gun voltage.
For batch experiments a jacketed glass vessel of 200 ml volume is used which is connected to the thermostatic
bath for maintaining temperature at 25 0C. A volume of 50 ml of premade solution of o-ABA, which was
filtered via 0.22 m filter is added in the vessel and allowed to stabilize again at 25 0C. The solution is stirred at
350 RPM. A measured amount of anti-solvent to reach the desired VF is added to the stirring solution at once.
For sonicated experiments a UP 50H ultrasonic horn is used, which operates at a frequency of 30 kHz; a
constant power of 10 W was applied. The solution is sonicated first which results in a temperature rise. The
solution is again allowed to stabilize to 25 0C before adding any anti-solvent. Induction time and polymorph are
analyzed in the batch experiments. In all experiments adding anti-solvent resulted in a temperature rise of 3-4 0C
due to mixing enthalpy of ethanol and water which was cooled down by the bath [19]. For VF of 0.45 and
above, nucleation occurred before the temperature could stabilize. For these cases some extra experiments were
conducted in which the solution was maintained 2 – 4 0C lower to compensate for the temperature rise. There
was no difference between the induction time or the nucleated polymorph. Typical temperature plots for flow
and batch are provided in supplementary information. All batch experiments were stopped within 5 min of
induction time to avoid solvent-mediated transformation considering the time frame specified in literature [15].
The slurry was quickly filtered with a 0.22 m filter in a vacuum filtration setup. A small quantity of yield was
dried and analyzed (within 10 min of induction time) by ATR-FTIR to determine the polymorph.
Calorimetric powers are measured for both flow and batch experiments. For flow experiments calorimetric
power is measured by flowing water through the channel and measuring the inlet and outlet temperature. The
difference in temperature and the flow rate were used to calculate the calorimetric power through Eq. 2. During
this time the thermal bath was still kept running, therefore the net calorimetric power is calculated here. For
batch experiments the calorimetric power was measured by sonicating volumes of 81 ml and 125 ml of water
(corresponding to the total volume at 0.38 and 0.60 VF) and measuring the initial and final temperature. The
formula used is given in Eq. 3. The measured calorimetric powers are given in Table 1.
𝑄 =�̇� ∗ 𝑐𝑝 ∗ ∆𝑇
𝑅𝑒𝑎𝑐𝑡𝑜𝑟 𝑣𝑜𝑙𝑢𝑚𝑒 (𝐿) 2
Jour
nal P
re-p
roof

𝑄 =𝑚 ∗ 𝑐𝑝 ∗
∆𝑇𝑡
𝑇𝑜𝑡𝑎𝑙 𝑣𝑜𝑙𝑢𝑚𝑒 (𝐿) 3
Q is the calorimetric power (W/L), �̇� is the mass flow rate (kg/s), m (kg) is the mass, cp is the specific heat
(J/kg.K), ∆𝑇 (K) is the difference in temperature and t is the time (s).
Results and Discussion
S.no
Anti-sol.
volume
fraction
(VF)
SS
Form
- I
SS
Form
- II
Solution
flow
rate
(ml/min)
Anti-sol.
flow
rate
(ml/min)
Residence
time
(s)
US net
Power
(±2
W)*
Collection
time
silent exp.*
(min)
Collection
time
sonicated
exp.*
(min)
1 0.38 1.29 1.08 5.0 3.1 4.0 4 9.75, 7.5,
1.2 3.2, 0.5, 8.5
2 0.40 1.37 1.14 5.0 3.3 4.0 4 1.5, 1.0, 1.0 5.0, 3.4, 5.0
3 0.47 1.69 1.41 5.0 4.4 3.5 4 1.0 1.0
4 0.51 1.94 1.61 5.0 5.2 3.0 10 1.0 1.3
5 0.56 2.33 1.94 5.0 6.4 3.0 18 1.0 1.0
6 0.60 2.73 2.28 5.0 7.5 2.5 20 1.0 1.0
7 0.38 1.29 1.08 15.5 9.5 1.3 12 - - *See supplementary information for more details about US net power. * Collection time accuracy is ± 5 s.
Experiments in flow – silent
Experiments in the flow crystallizer remarkably highlighted the difference between a batch and a flow system.
Although changes in behavior of induction time were noticed, the main difference appeared in the nucleated
polymorphs. Contrary to the behavior in batch seen in the work of Jiang et al. [15] , where low VF (0.38) always
yielded form - I and high VF (0.60) always yielded form - II, the polymorph yielded in the flow crystallizer was
always a concomitant mixture of form - II and form – III, irrespective of the VF (ranging from 0.36 to 0.60).
FLOW
Flow rate [ml/min] 8.1 12.5
Calorimetric power (input power 3W) [W/L] 431 318
Calorimetric power (input power 21W) [W/L] 468 412
BATCH
Total volume [ml] 81 125
Calorimetric power (input power 10W) [W/L] 29 19
Table 1: Calorimetric measurements for flow and batch experiments
Table 2: Experiment list for flow experiments with details. SS = supersaturation level.
Jour
nal P
re-p
roof

Occurrence of form - III (see Fig. 4 and 5 for SEM images and ATR-FTIR spectra) makes this outcome
especially peculiar since form - III was never seen in anti-solvent crystallization of o-ABA [15] [20]. In fact,
some works mention the difficulty of nucleating form - III in solution crystallization and suggest sublimation or
transformation as the best methods to obtain form - III [15] [14]. In other works, form - III was nucleated via
cooling crystallization with the help of specially designed additives [14] [21]. The closest comparison can be
found in the work of Simone et al. [21] where form - III was noticed in cooling crystallization wherein the
solvent was a mixture of Iso-propyl alcohol (20 % w/w) and water. Further investigations of polymorph
nucleation are carried out in a batch system and details are given in the following sections.
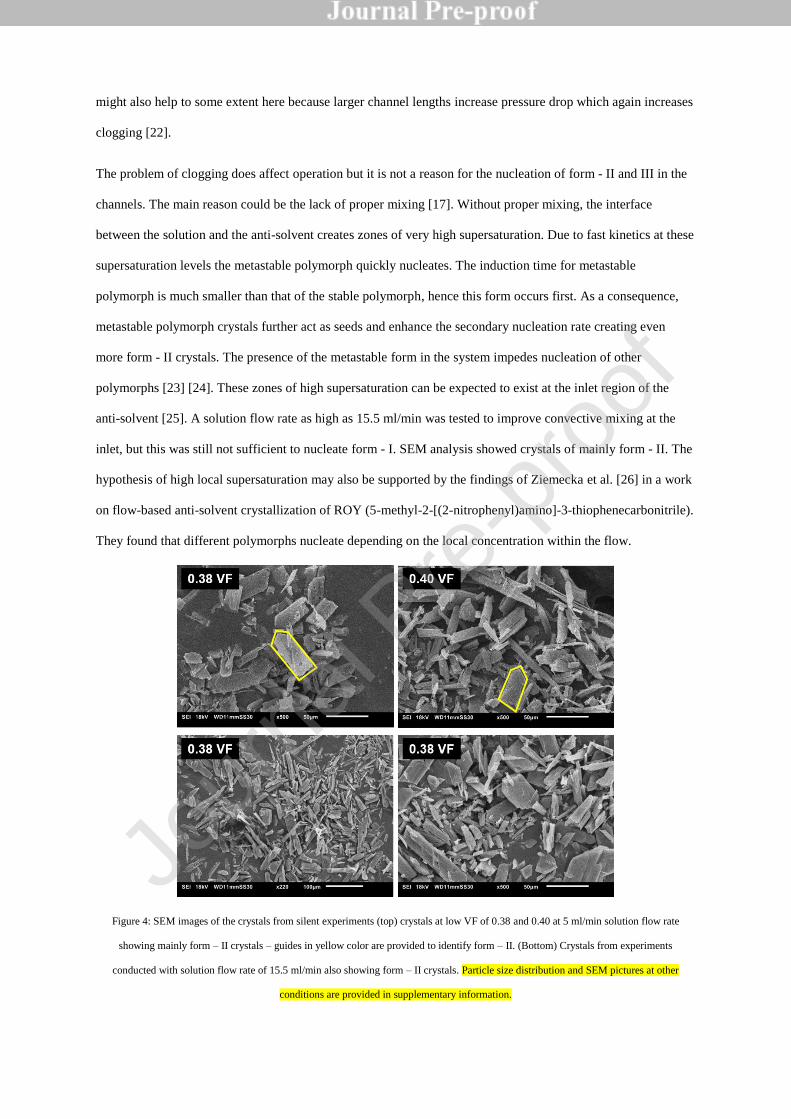
Crystallization in flow was more challenging compared to batch crystallization. The main issues were low yield
and clogging. At low VF, the yield was insufficient for analysis with ATR-FTIR. The product crystals for VF of
0.38 and 0.40 were observed through SEM imaging. Fig. 4 shows these SEM images where form – II can be
clearly identified. Fig. 5 shows the ATR-FTIR spectra of the product from experiments above 0.4 VF. In these
spectra two strong peaks can be seen between 3360 cm-1 and 3480 cm-1 which represent form – II. A small peak
can be seen between 3480 cm-1 and 3510 cm-1 which corresponds to form – III [14]. Standard spectra for all
three forms are provided in the figure for better understanding. Below 0.38, either there was no yield or there
was re-dissolution within the channels due to the low supersaturation. One may argue that an increase in
residence time might have provided a better yield. The reason for not choosing a higher residence time was the
extremely fast solvent-mediated transformation kinetics of form - II to form - I . Solvent-mediated
transformation for larger volumes could be as low as 5 min but for small scale transformation was already seen
within a time frame of 3 min [15] [17]. A longer residence time may transform some or all form - II crystals to
form – I, thus corrupting the outcome. This leads to difficulties in precisely judging the nucleation phenomena
in the crystallizer. The residence time in this work is chosen to avoid any solvent-mediated transformation, not
just in the reactor but also during sampling and collection. Table 2 gives the details of the flow rates and
residence times. The lowest residence time was 2.5 s and the highest was 4.0 s.
The problem with silent flow crystallization at higher VF of anti-solvent was clogging. In the absence of any
external control clogging was difficult to avoid and occurred within 2 min of induction time. The longitudinal
morphology of nucleated crystals might also increase clogging. Crystals of form - II and III are of longitudinal
shape as compared to the crystals of form - I which are of a more prismatic shape. Due to high supersaturation
the nuclei also tend to crystallize into needles which further increases clogging. Selecting a short residence time
Jour
nal P
re-p
roof
might also help to some extent here because larger channel lengths increase pressure drop which again increases
clogging [22].
The problem of clogging does affect operation but it is not a reason for the nucleation of form - II and III in the
channels. The main reason could be the lack of proper mixing [17]. Without proper mixing, the interface
between the solution and the anti-solvent creates zones of very high supersaturation. Due to fast kinetics at these
supersaturation levels the metastable polymorph quickly nucleates. The induction time for metastable
polymorph is much smaller than that of the stable polymorph, hence this form occurs first. As a consequence,
metastable polymorph crystals further act as seeds and enhance the secondary nucleation rate creating even
more form - II crystals. The presence of the metastable form in the system impedes nucleation of other
polymorphs [23] [24]. These zones of high supersaturation can be expected to exist at the inlet region of the
anti-solvent [25]. A solution flow rate as high as 15.5 ml/min was tested to improve convective mixing at the
inlet, but this was still not sufficient to nucleate form - I. SEM analysis showed crystals of mainly form - II. The
hypothesis of high local supersaturation may also be supported by the findings of Ziemecka et al. [26] in a work
on flow-based anti-solvent crystallization of ROY (5-methyl-2-[(2-nitrophenyl)amino]-3-thiophenecarbonitrile).
They found that different polymorphs nucleate depending on the local concentration within the flow.
Figure 4: SEM images of the crystals from silent experiments (top) crystals at low VF of 0.38 and 0.40 at 5 ml/min solution flow rate
showing mainly form – II crystals – guides in yellow color are provided to identify form – II. (Bottom) Crystals from experiments
conducted with solution flow rate of 15.5 ml/min also showing form – II crystals. Particle size distribution and SEM pictures at other
conditions are provided in supplementary information.
Jour
nal P
re-p
roof

Analysis of induction times shows a general decreasing trend with increase in anti-solvent VF. The average
induction time recorded for 0.38 VF is 8.5 min before any crystals appear in the channel. The average induction
times for 0.40, 0.47, 0.51, 0.56 and 0.60 VFs are 5.30, 2.11, 1.92, 2.05 and 2.00 min, respectively. The induction
time seems to stabilize after a VF of 0.47. Since increasing the flow rates changes the residence time slightly
(4.0 s at 0.38 VF to 2.5 s at 0.60 VF), a normalized induction time presents a better comparison. This is simply
obtained by dividing the induction time by the residence time to obtain the number of residence times taken for
crystals to appear. It was observed that for 0.38 VF, crystals are first noticed after an average of 127 residence
times. This value reduces to 83 for 0.40 VF and then to 37 for 0.47 VF, after which it stays more or less the
same. The high induction time at 0.38 can occur due to a relatively low supersaturation and small volume in the
channels. The probability of nucleation events is much lower in such conditions, therefore it takes much more
time to nucleate crystals [27]. The standard deviation among identical experiments is also higher for 0.38 VF.
As supersaturation is increased with anti-solvent, homogenous nucleation might dominate and therefore the
probability of nucleation increases as well [28]. Fig. 6 provides the induction time for different anti-solvent
fractions.
Figure 5: ATR-FTIR spectra for silent (left) and sonicated (right) flow experiments at different VFs. Dotted lines show standard
spectra for Form – I, II, III and concomitant mixture of I and II. The dotted arrow points towards the small peak representing
form – III Jour
nal P
re-p
roof
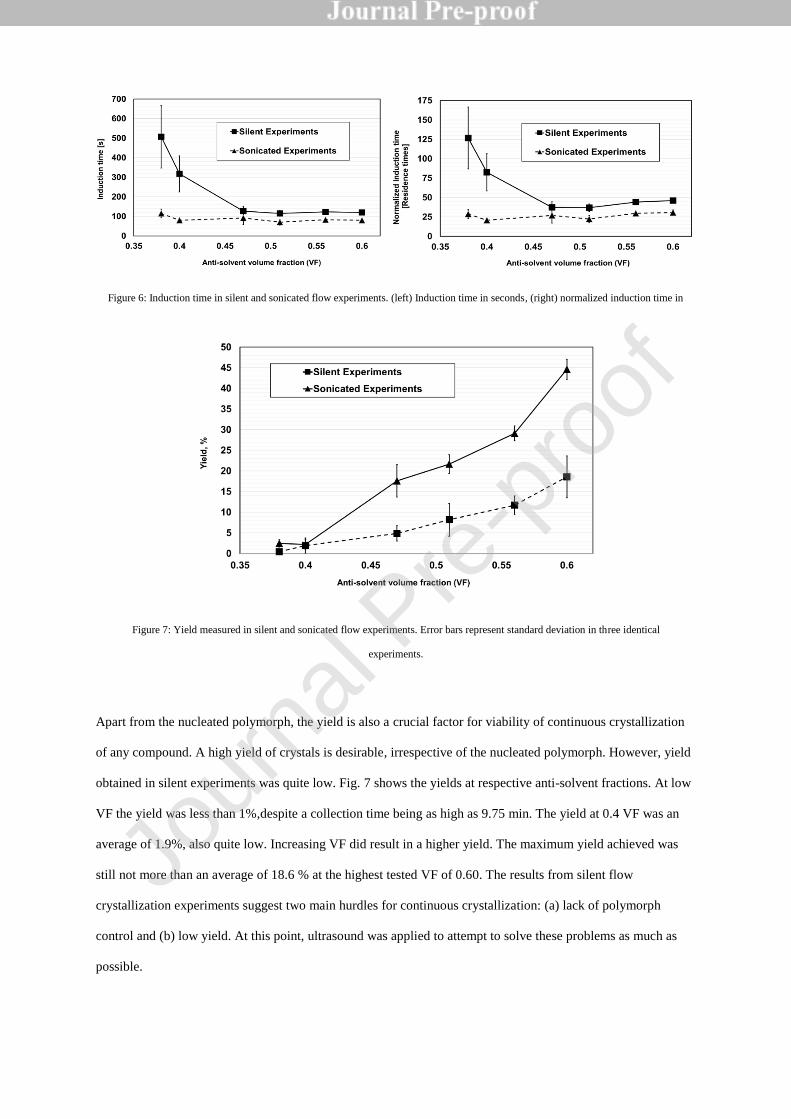
Apart from the nucleated polymorph, the yield is also a crucial factor for viability of continuous crystallization
of any compound. A high yield of crystals is desirable, irrespective of the nucleated polymorph. However, yield
obtained in silent experiments was quite low. Fig. 7 shows the yields at respective anti-solvent fractions. At low
VF the yield was less than 1%,despite a collection time being as high as 9.75 min. The yield at 0.4 VF was an
average of 1.9%, also quite low. Increasing VF did result in a higher yield. The maximum yield achieved was
still not more than an average of 18.6 % at the highest tested VF of 0.60. The results from silent flow
crystallization experiments suggest two main hurdles for continuous crystallization: (a) lack of polymorph
control and (b) low yield. At this point, ultrasound was applied to attempt to solve these problems as much as
possible.
Figure 6: Induction time in silent and sonicated flow experiments. (left) Induction time in seconds, (right) normalized induction time in
number of residence times. Error bars represent standard deviation in three identical experiments.
Figure 7: Yield measured in silent and sonicated flow experiments. Error bars represent standard deviation in three identical
experiments.
Jour
nal P
re-p
roof

Experiments in flow – sonicated
Ultrasound, with the applied conditions, was not able to improve the polymorph nucleation behavior, but it did
make flow crystallization much more viable. Ultrasound reduced induction time and increased the yield of
crystals for all applied VF of anti-solvent. In general, sonicated experiments were less likely to exhibit clogging
as compared to silent experiments. It was realized during experiments that different VF of anti-solvent require
different ultrasonic operating powers to avoid re-dissolution and clogging. The US powers applied in this work
range from 4 W for 0.38 VF to 20 W for 0.60 VF but the calorimetric powers (see Table 1) are balanced because
of the higher flow rate at 0.60 VF compared to 0.38 VF. The calorimetric power in W/L for 3 W US power at
8.1 ml/min (0.38 VF) flow rate is 431 and at 12.5 ml/min (0.60 VF) this is 318 At a US power of 21 W the
calorimetric power for 12.5 ml/min (0.60 VF) is raised to 412 W/L. At low VF a higher power (> 4W) of
ultrasound leads to re-dissolution and low yield due to a temperature rise above 4 0C. But at higher VF where
the mass of crystals yielded is much larger, then low power of 4 W easily led to clogging. Therefore the power
chosen for each anti-solvent VF is one which provided smooth operation with minimal loss in yield. The
temperature rise, measured with a thermocouple at the outlet, was contained to a maximum of 4 0C with the
thermal bath in the crystallizer. The main aspect of comparison here is between crystallization in silent versus
Figure 8: SEM images of the crystals from sonicated experiments (top) crystals at low VF of 0.38 and 0.40 at 5 ml/min solution flow
rate showing mainly form – II crystals. (Bottom) Crystals from experiments conducted with solution flow rate of 15.5 ml/min also
showing form – II. Particle size distribution and SEM pictures at other conditions are provided in supplementary information.
Jour
nal P
re-p
roof

sonicated conditions at each individual VF. Here the change in power between different VF does not play a role
because the comparison is at the same VF but between silent and sonicated conditions.
The polymorphic yield for various water fractions was again a mixture of form - II and III. Form - I was also
never noticed in these experiments. This implies that the mixing in the system was still poor. To further improve
mixing by enhancing convection, the solution flow rate was raised to 15.5 ml/min from 5 ml/min in combination
with sonication. The result was still elusive of form - I. The nucleated polymorph, even at this condition, was
mainly form – II. ATR-FTIR spectra are provided in Fig.5 SEM images are provided in Fig. 8. One can see
from the spectra that form – III (small peak between 3480 and 3510 cm-1) nucleates even for VF of 0.38 or 0.4
VF. It must be acknowledged that the ultrasonic frequency of 20.75 kHz applied here is in the starting range of
the ultrasonic regime. At this applied frequency cavitation phenomena dominate over acoustic streaming [29]
[30]. Presence of acoustic streaming is known for improving mixing [31]. Based on the selected frequency it
may be hypothesized that the system is still poorly mixed which then supports form - II nucleation. However,
one must consider at this point how much benefit does an improved mixed state provide with respect to yield.
Even if mixing is improved at 0.38 VF the low yield might make the system unviable for producing a
compound. The high supersaturation at the inlet can be cleverly used for quick nucleation [25]. Once a high
yield is ensured, form – I can then be obtained via two alternate strategies. The first one would be to obtain it by
allowing solvent-based transformation from form - II produced in the crystallizer. As part of this strategy further
tubing can be added to the crystallizer which provides the sufficient residence time for the metastable crystals to
completely transform into form - I. This strategy suits very well for compounds like o-ABA which have very
fast transformation kinetics. Since the metastable form (form - II) has been shown to transform in order of
minutes, a transformation section with a similar residence time can be used to obtain form - I [15] [16]. The
second strategy could be seeding with form - I crystals at high supersaturation so that nucleation can be steered
towards form - I [7] [5]. The high supersaturation zone at the inlet can be effectively used for this purpose [25].
This second strategy provides better control over other properties (like crystal size) and can be performed
without long residence times. The second strategy will be demonstrated in a future article.
The importance of yield in these cases is not just limited to process efficiency, but also to product quality. This
is especially important for the metastable polymorph since a high yield must be achieved in short residence time
to avoid transformation. Ultrasound has shown to be directly beneficial in this aspect. Applying ultrasound
primarily reduces the induction time, thus allowing more nucleation events in a short time [32]. This allows the
multiple nuclei to then grow and result as increased yield in the system. Observing the induction times first, the
Jour
nal P
re-p
roof

average induction time recorded for 0.38 VF is 1.91 min. This is 4.5 times less than the average induction time
of 8.5 min without ultrasound. When normalized, this amounts to 29 residence times. For the VF of 0.40 the
average induction time was 1.3 min which is 21 residence times. For higher VF of 0.47, 0.51, 0.56 and 0.60 the
induction times remain in the same range of 1.5 to 1.2 min. Since ultrasound reduces the induction time for 0.38
VF there is not a large difference between the induction time of VF of 0.38 and 0.60, unlike the silent
experiments. Fig. 6 shows the induction times. Yield measurements showed that ultrasound significantly
increased the yield for all VFs tested. Fig. 7 shows the yields for various water fractions and Table 2 shows the
collection times for each volume fraction. At VF of 0.38 and 0.40 , due to the low supersaturation, the collection
time required for achieving substantial yield for analysis was much higher than the collection time for VFs of
0.47 and above. The collection time was also quite variable. The collection time in silent experiments for VF of
0.38 and 0.40 was as high as 9.75 min and for sonicated experiments it was 8.5 min. For VF above 0.47 a
collection time of 1 min was sufficient. For a VF of 0.38, ultrasound increased the yield from 0.44 % to 2.5 %,
which is a 6 times increase. The best yield was collected at a VF of 0.60, where, ultrasound provided 2.4 times
more yield of 45 % compared to silent experiments. This implies that with ultrasound one can produce nearly 50
% yield in a residence time of mere 2.5 s. This is a huge benefit for the continuous production of metastable
polymorphs as it alleviates the risk of solvent-mediated transformation during production. In addition to that,
filtering of the product from the solvent was carried out continuously and simultaneously with the crystallization
process. This is much better than a batch system where the crystals would have to be filtered in bulk volumes
after crystallization. The main reasons behind increase in yield (2.5 times more at 0.60 VF) and reduction in
induction time (4.5 times at 0.38 VF) [33] with ultrasound may be cavitation and more mixing. The cavitation in
this regime of frequency is predominantly transient which means stronger interaction between the bubble and
the surrounding liquid [34] [35]. Solvent evaporation during collapse, localized cooling due to expansion and
bubble as heterogeneous particle are among the multiple effects at the interfacial level that influence nucleation
but are difficult to be pinpointed without deep analysis [36]. Perhaps, it may not just be a single effect but a
combination of them.
Batch experiments
Batch experiments in silent conditions are conducted to establish a baseline of induction time and polymorph
product with the experimental conditions in this work. This enables a proper comparison between silent and
sonicated batch experiments. The VF of anti-solvent is varied from 0.38 to 0.75. The supersaturation with
respect to form – I and II are provided in Table 3. Observing induction times first shows, at 0.38 VF the average
Jour
nal P
re-p
roof

induction time recorded is 22 min. With increasing VF this value reduces to as low as 5 s for a VF of 0.60.
Significant reduction in induction time is noticed with ultrasound. For the VF of 0.38 the average induction time
reduces by 65 % to 7.5 min. The standard deviation of induction time is also lower in case of sonicated
experiments. However, from a VF of 0.45 the difference in induction times minimizes due to the already fast
kinetics at these supersaturation levels. Fig. 9 shows the induction times.
The polymorphic form that nucleated at the lower VF levels of 0.38 and 0.40 is form – I, both in silent and
sonicated experiments. As the VF increases to 0.60 the polymorph nucleated in silent conditions changes to
form - II. This behavior also does not change for the sonicated experiments. There is no change in the nucleated
polymorphs for silent and sonicated experiments at any of the tested anti-solvent VF. The only difference,
therefore, that ultrasound makes, under the applied parameters, is to reduce the induction time. To investigate
nucleation of form - III experiments were conducted with a higher VF of 0.75. Induction time for these
experiments was in range of 2 to 3 s. The analysis of polymorphs showed smalls peaks of form – III, which was
S.no
Anti-solvent
volume
fraction (VF)
Supersaturation
Form - I
Supersaturation
Form - II
Solution
volume
(ml)
Anti-solvent
volume
(ml)
US Power
(W)
1 0.38 1.29 1.08 50 31 10
2 0.41 1.40 1.17 50 35 10
3 0.45 1.58 1.32 50 41 10
4 0.51 1.94 1.61 50 52 10
5 0.60 2.73 2.28 50 75 10
6 0.75 4.40 3.67 50 150 10
Figure 9: Induction time in silent and sonicated batch experiments. Error bars represent standard deviation in three identical
experiments.
Table 3 Experiment list for batch experiments with details. SS = supersaturation level.
Jour
nal P
re-p
roof

not seen for lower VF. It was clear with these experiments that form - III nucleated as a result of a solvent
mixture where the anti-solvent VF was clearly above 0.6. This can be related to the nucleation conditions in
flow experiments. The occurrence of form - III there shows that nucleation happens in zones where the anti-
solvent is much in excess and this further governs the nucleation in the channels. Fig. 10 shows the ATR-FTIR
spectra for batch experiments and Fig. 11 shows the SEM pictures.
Figure 10: ATR-FTIR spectra for silent (left) and sonicated (right) batch experiments at different VFs. Dotted lines show standard
spectra for Form – I, II, III and concomitant mixture of I and II. Dotted arrow points towards the peak that represents form – III.
Figure 11: SEM images of the crystals from silent and sonicated batch experiments for different VF.
Jour
nal P
re-p
roof

Conclusions
In this work anti-solvent crystallization of o-ABA was carried out in both flow crystallization and batch
crystallization setups. Additionally, the effect of ultrasound is also tested in both cases. The main points of
analysis are the induction time, polymorph and yield. A flow crystallizer based on the interval contact design is
developed and demonstrated. The flow experiments were conducted with a very small residence time so as to
avoid solvent mediated transformation of form - II to form - I and clogging. By keeping the residence time short,
mix up of nucleation and transformation can be avoided and nucleation can be analyzed reliably. Solvent-
mediated transformation resulting from high residence times also hinders continuous production of the
metastable polymorph. Batch experiments were conducted to test the effect of ultrasound in a batch system.
Results from flow experiments deviate from the expected outcome for the volume fraction of the anti-solvent.
For low volume fractions (0.38) of anti-solvent the nucleated polymorph was expected to be form - I, however,
the analysis showed concomitant nucleation of form – II and III with mainly form - II. The same result was
observed for higher volume fractions. These results indicated the strong effect of inhomogeneous
supersaturation in the channels. Zones with abundant anti-solvent quickly nucleated the metastable form - II
which then influenced further nucleation by acting as seeds. Batch experiments showed that form - III nucleates
above 0.60 volume fraction of anti-solvent. Based on this it was again clear that the abundance of anti-solvent in
the inlet region in the flow crystallizer was leading to nucleation of form - II and III and hindering nucleation of
form - I.
When ultrasound was applied, the polymorphic behavior of either the batch or the flow crystallization system
remained the same, although a typical reduction in induction was observed. Application of ultrasound and the
reduction of induction time thereby provided a special benefit towards production of the metastable form.
Ultrasound increased the yield from 18.6 % to as much as 45 % in the flow crystallization experiments with the
same residence time of mere 2.5 seconds. Due to the fear of solvent-mediated transformation of form - II to
form – I, an ideal continuous-flow production system for metastable polymorphs would require a high yield
within very short residence times. Ultrasound made this possible and thus can be characterized as a technique
that is particularly beneficial towards continuous production of metastable polymorphs. A higher yield of
metastable polymorph is eventually also a benefit for the production of the stable polymorph, since production
of the stable form can then be achieved by allowing solvent-mediated transformation. Production of stable
polymorph at low volume fraction does not seem to be a good strategy due to the extremely low yields. The
Jour
nal P
re-p
roof

yield analyzed at low volume fraction of 0.38 is as low as 0.44 % without ultrasound and 2.5 % with ultrasound.
Therefore, the main conclusion that can be drawn from these results is that for continuous production of either
polymorph a high yield is required in a short residence time which was achieved by using ultrasound.
Declaration of interests
The authors declare that they have no known competing financial interests or personal relationships
that could have appeared to influence the work reported in this paper.
Acknowledgements
The research leading to these results has received funding from the European Community’s Horizon 2020
Programme [(H2020/2016 – 2020) under Grant Agreement no. 721290 (MSCA-ETN COSMIC)]. This
publication reflects only the author’s view, exempting the community from any liability. Project website:
https://cosmic-etn.eu.
Jour
nal P
re-p
roof

References
[1] R. Peña, J. A. Oliva, C. L. Burcham, D. J. Jarmer and Z. K. Nagy, "Process Intensification through
Continuous Spherical Crystallization Using an Oscillatory Flow Baffled Crystallizer," Cryst. Growth Des., vol.
17, no. 9, pp. 4776-4784, 2017.
[2] S. Mascia, P. L. Heider, H. Zhang, R. Lakerveld, B. Benyahia, P. I. Barton, R. D. Braatz, C. L. Cooney
and T. F. J. J Evans, "End-to-end continuous manufacturing of pharmaceuticals: integrated synthesis,
purification, and final dosage formation," Angew. Chem. Int. Ed., vol. 52, pp. 12359-12363, 2013.
[3] A. Adamo, R. L. Beingessner, M. Behnam, J. Chen, T. F. Jamison, K. F. Jensen, J.-C. M. Monbaliu, A.
S. Myerson, E. M. Revalor, D. R. Snead, T. Stelzer, N. Weeranoppanant, S. Y. Wong and P. Zhang, "On-
demand continuous-flow production of pharmaceuticals in a compact, reconfigurable system," Science, vol.
352, no. 6281, pp. 61-67, 2016.
[4] H. Leuenberger, "New trends in the production of pharmaceutical granules: batch versus continuous
processing," European Journal of Pharmaceutics and Biopharmaceutics, vol. 52, no. 3, pp. 289-296, 2001.
[5] DejiangZhang, ShijieXu, S. Du, J. Wang and JunboGong, "Progress of Pharmaceutical Continuous
Crystallization," Engineering, vol. 3, no. 3, pp. 354-364, 2017.
[6] T.-T. C. Lai, J. Cornevin, S. Ferguson, N. Li, B. L. Trout and A. S. Myerson, "Control of
Polymorphism in Continuous Crystallization via Mixed Suspension Mixed Product Removal Systems Cascade
Design," Crystal Growth & Design, vol. 15, no. 7, 2015.
[7] A. Llinàs and J. M. Goodman, "Polymorph control: past, present and future," Drug Discovery Today,
vol. 13, no. 5-6, pp. 198-210, 2008.
[8] A. Kwokal, "Preparation, Stabilisation and Advantages of Metastable Polymorphs," in Engineering
Crystallography: From Molecule to Crystal to Functional Form, Springer, 2017, pp. 247-260.
[9] J. R. G. Sander, B. W. Zeiger and K. S. Suslick, "Sonocrystallization and sonofragmentation,"
Ultrasonics Sonochemistry, vol. 21, no. 6, pp. 1908-1915, 2014.
Jour
nal P
re-p
roof

[10] S. Gracin, M. Uusi-Penttilä and Å. C. Rasmuson, "Influence of ultrasound on the nucleation of
polymorphs of p-aminobenzoic acid," Cryst. Growth Des., vol. 5, pp. 1787-1794, 2005.
[11] S. K. Bhangu, M. Ashokkumar and J. Lee, "Ultrasound assisted crystallization of paracetamol: crystal
size distribution and polymorph control," Cryst. Growth Des., vol. 16, pp. 1934-1941, 2016.
[12] M. Louhi-Kultanen, M. Karjalainen, J. Rantanen, M. Huhtanen and J. Kallas, "Crystallization of
glycine with ultrasound," Int. J. Pharm., vol. 320, pp. 23-29, 2006.
[13] A. A. El-Azzouny, Y. A. Maklad, H. Bartsch, W. A. Zaghary, W. M. Ibrahim and M. S. Mohamed,
"Synthesis and Pharmacological Evaluation of Fenamate Analogues: 1,3,4-Oxadiazol-2-ones and 1,3,4-
Oxadiazole-2-thiones," Sci. Pharm., vol. 71, no. 4, pp. 331-356, 2003.
[14] E. Simone and G. Steele, "Tailoring crystal shape and polymorphism using combinations of solvents
and a structurally related additive," CrystEngComm, vol. 17, pp. 9370-9379, 2015.
[15] S. Jiang, J. H. t. Horst and P. J. Jansens, "Concomitant Polymorphism of o-Aminobenzoic Acid in
Antisolvent Crystallization," Cryst. Growth Des., vol. 8, no. 1, pp. 37-43, 2008.
[16] S. Jiang, P. J. Jansens and J. H. t. Horst, "Control over Polymorph Formation of o-Aminobenzoic
Acid," Crystal Growth & Design, vol. 10, no. 6, pp. 2541-2547, 2010.
[17] P. Coliaie, M. S. Kelkar, N. K. Nere and M. R. Singh, "Continuous-flow, well-mixed, microfluidic
crystallization device for screening of polymorphs, morphology, and crystallization kinetics at controlled
supersaturation," Lab on a chip, vol. 19, no. 14, pp. 2373-2382, 2019.
[18] J. J. John, S. Kuhn, L. Braeken and T. VanGerven, "Temperature controlled interval contact design for
ultrasound assisted liquid–liquid extraction," Chemical Engineering Research and Design, vol. 125, pp. 146-
155, 2017.
[19] J. A. Boyne and A. G. Williamson, "Enthalpies of mixture of ethanol and water at 25.degree.C," J.
Chem. Eng. Data, vol. 12, no. 3, p. 318, 1967.
[20] E. Simone, A. N. Saleemi, N. Tonnon and Z. K. Nagy, "Active Polymorphic Feedback Control of
Crystallization Processes Using a Combined Raman and ATR-UV/Vis Spectroscopy Approach," Cryst. Growth
Des., vol. 14, no. 4, pp. 1839-1850, 2014.
Jour
nal P
re-p
roof

[21] E. Simone, J. McVeigh, N. M. Reis and Z. K. Nagy, "A high-throughput multi-microfluidic crystal
generator (MMicroCryGen) platform for facile screening of polymorphism and crystal morphology for
pharmaceutical compounds," Lab on a Chip, vol. 18, p. 2235, 2018.
[22] G. Giri, L. Yang, Y. Mo and K. F. Jensen, "Adding Crystals To Minimize Clogging in Continuous
Flow Synthesis," Cryst. Growth Des., vol. 19, pp. 98-105, 2019.
[23] S. S. Kadam, H. J. M. Kramer and J. H. t. Horst, "Combination of a Single Primary Nucleation Event
and Secondary Nucleation in Crystallization Processes," Cryst. Growth Des., vol. 11, no. 4, pp. 1271-1277,
2011.
[24] S. A. Kulkarni, H. Meekes and J. H. t. Horst, "Polymorphism Control through a Single Nucleation
Event," Cryst. Growth Des., vol. 14, no. 3, pp. 1493-1499, 2014.
[25] P. Neugebauer and J. G. Khinast, "Continuous Crystallization of Proteins in a Tubular Plug-Flow
Crystallizer," Cryst. Growth Des., vol. 15, no. 3, pp. 1089-1095, 2015.
[26] I. Ziemecka, S. Gokalp, S. Stroobants, F. Brau, D. Maes and A. D. Wit, "Polymorph Selection of ROY
by Flow-Driven Crystallization," Crystals, vol. 9, p. 351, 2019.
[27] G. M. Maggioni and M. Mazzotti, "Modelling the stochastic behaviour of primary nucleation," Faraday
Discussions, vol. 179, 2015.
[28] S. D. Bachchhav, S. Roy and M. Mukhopadhyay, "Parametric analysis of homogeneous and
heterogeneous nucleation in subcritical CO2-mediated antisolvent crystallization," Chemical Engineering
Research and Design, vol. 106, pp. 283-297, 2016.
[29] J. Eisener, A. Lippert, T. Nowak, C. Cairós, F. Reuter and R. Mettin, "Characterization of acoustic
streaming beyond 100 MHz," Physics Procedia , vol. 70, pp. 151-154, 2015.
[30] D. F. Rivas, P. Cintas and H. J. G. E. Gardeniers, "Merging microfluidics and sonochemistry: towards
greener and more efficient micro-sono-reactors," Chem. Commun., vol. 48, pp. 10935-10947, 2012.
[31] G. G. Yaralioglu, I. O. Wygant, T. C. Marentis and B. T. K. Yakub, "Ultrasonic Mixing in Microfluidic
Channels Using Integrated Transducers," Anal. Chem., vol. 76, pp. 3694-3698, 2004.
[32] Z. Guo, H. L. M Zhang, J. Wang and E. Kougoulos, "Effect of ultrasound on anti-solvent
crystallization process," Journal of Crystal Growth, vol. 273, pp. 555-563, 2005.
Jour
nal P
re-p
roof

[33] J. Lee and S. Yang, "Antisolvent Sonocrystallisation of Sodium Chloride and the Evaluation of the
Ultrasound Energy Using Modified Classical Nucleation Theory," Crystals, vol. 8, no. 320, 2018.
[34] R. Jamshidi, D. Rossi, N. Saffari, A. Gavriilidis and L. Mazzei, "Investigation of the Effect of
Ultrasound Parameters on Continuous Sonocrystallization in a Millifluidic Device," Crystal Growth & Design,
Vols. 4607-4619, p. 16, 2016.
[35] D. Rossi, R. Jamshidi, N. Saffari, S. Kuhn, A. Gavriilidis and L. Mazzei, "Continuous-Flow
Sonocrystallization in Droplet-Based Microfluidics," Crystal Growth & Design, vol. 15, no. 11, pp. 5519-5529,
2015.
[36] L. H. Stanley, "The effect of ultrasonic vibrations on crystallization processes," Ultrasonics, 1967.
Supplementary Information
Jour
nal P
re-p
roof

Figure A: Solubility relationship between the three polymorphic forms of o-ABA at different temperatures. The data is obtained from the
work of Jiang et al. [16].
Figure B: Typical temperature plots in flow and batch experiments (left) Solution and anti-solvent inlet temperatures and outlet temperature
during sonication (right) Temperature inside the jacketed vessel showing the temperature rise at the point of anti-solvent addition which is
gradually stabilized with the thermal bath.
Table A: Details of net power obtained at different voltages
Voltage (mVpp) Forward power, W Return power, W Net Power, W
300 24 20 4
450 54 44 10
550 81 63 18
600 91 71 20
Figure C: Particle size distribution of crystal yield at 0.60 VF from silent and sonicated, batch and flow experiments.
Jour
nal P
re-p
roof

Table B: Particle sizes measured for different conditions.
Dx (10) Dx (50) Dx (90)
0.60 VF Silent - Flow 46.2 101 198
0.60 VF Sonicated - Flow 8.01 32.8 70.4
0.60 VF Silent - Batch 51.5 146 307
0.60 VF Sonicated - Batch 31.4 118 254
Particle sizes were analyzed in a Malvern Laser Diffractometer with Hydro SV measurement cell. The
dispersant used was toluene. 7 ml of dispersant was added in the cell and after background measurement the
sample was added until an obscuration greater than 1 % was achieved. A set of 5 consecutive measurements
were conducted to have an average particle size distribution presented in Fig. C. The relative standard deviation
(RSD) limits for Dx10, Dx50 and Dx90 were 5 % , 3% and 3%, respectively. The set of 5 measurements were
repeated until RSD limits were reached. The cell was cleaned at least 5 times with acetone and dried and flushed
with toluene before analyzing new samples.
One may see in Table B that the crystal sizes are much smaller for the sonicated flow experiment as compared
to the silent one. The PSD for sonicated batch experiment is only slightly smaller than the silent case unlike the
observation in flow experiments. The PSD in silent flow is comparable to that of the batch experiments which
Jour
nal P
re-p
roof

shows that the low residence time in the flow reactor (2.5 s) is sufficient enough for crystal growth. The smaller
particle sizes for sonicated flow experiments are primarily a result of increased nucleation rate (and nuclei).
Figure D: SEM images of the crystals from silent and sonicated flow experiments for various VFs.
Jour
nal P
re-p
roof