
Process Flow Diagram Tutorial: High Level, Detailed & Swim Lane
27
OPQC Fall Learning Session QI Skills Lab Map Your Process Moira Crowley, MD and Susan Ford, RN
Transcript of Process Flow Diagram Tutorial: High Level, Detailed & Swim Lane

OPQC Fall Learning Session QI Skills Lab
Map Your Process Moira Crowley, MD and Susan Ford, RN

Objective: Dr. Myron Tribus, an American organizational theorist has said, “You don’t learn to Process Map, you Process Map to learn.” In order to improve a process, you need to have a clear understanding of how it actually works. This session will examine the skills necessary to drill down into the steps of a process in order to improve

Process Flow Diagrams
• “ A flow diagram is one of the basic tools for improvement that gives a visual picture of a process being studied.” p. 410 *
* Langley, Gerald J., et al. The Improvement Guide: A Practical Approach to Enhancing Organizational Performance. 2nd ed. San Francisco: Jossey-Bass, 2009. Print.

Process Maps are used to:
• Document processes – Provide a reference to discuss how things get done. – Describe and understand the work we do.
• Analyze and improve on processes.
– Identify of areas of complexity and re-work. – To generate ideas for improvement. – Illustrate process improvements.
Source: National Network of Public Health Institutes; http://nnphi.org/CMSuploads/MI-ProcessMappingOverview.pdf

Key Points A process is a series of steps or actions performed to
achieve a specific purpose.
A process can describe the way things get done. Process Map in the manner it currently is, not what you
would like the process to be.
Process Mapping is dynamic. Use Post-it notes, dry erase markers, pencil, etc.
All Process Maps must have start and stop points.
Source: National Network of Public Health Institutes; http://nnphi.org/CMSuploads/MI-ProcessMappingOverview.pdf

Usage for Process Maps
• There is no single right way to Process Map. It is a tool to learn about your organization and work.
• Process Maps can be used in a variety of settings outside Quality
Improvement, such as: – Orienting new employees – In-service presentations – Brainstorming possible process changes – Creating or revising policies and procedures that support the process – Creating measures – Identifying logical outcomes of a process
Source: National Network of Public Health Institutes; http://nnphi.org/CMSuploads/MI-ProcessMappingOverview.pdf

Steps to creating a flow map
1. Set boundaries on the process – Where does the process
start and stop?
2. Map the process – Who does the work?
• Who does what? • When? Where?
Why? How? – What type of process map
is most useful? • High level • Detailed • Swim lane
3. Check results – Get reactions of others – View the process in action
and compare to the process map
4. Take action – Are there obvious changes
that would improve the process?
– Fix obvious problems immediately
– Monitor any solutions to be certain they work
– Watch for side effects and unintended consequences

Commonly Used Shapes


Process Map for making a morning cup
of coffee • Let’s take a moment now to construct a
Process Map of the method that is used to make your morning cup of coffee…

Snapshot of Flow Diagram Tools

Step or Activity
Start/End points in the
process
Cloudy or Unclear Step or Activity
High-level flow diagrams. These are simple and facilitate understanding of the basic process. Three fundamental symbols work in any type of flow diagram: oval, cloud, and rectangle (see meaning below).They are joined using connectors, to illustrate the flow of activities through the process.

High Level Process Flow Diagrams
• Include: – 4-5 major “boxes” that summarize the main steps, inputs and
outputs. • Very Useful for:
– Understanding the process and determining team membership. Gaining quick group consensus about the process.
– Developing areas or indicators to be monitored for process information.
• Often Useful for: – Identifying who provides what to whom.
• Sometimes Useful for: – Searching for specific problem areas or steps that must often be
redone. – Redundant or unclear steps in a process.

Example: High Level Process Flow Diagram
Sometimes, the easiest way to get familiar with using a new tool is to practice with a process that is very common in your daily life. This simple, high level, diagram was created in about 1 minute, using “getting to work” as the process. This is a birds-eye-view of the major steps taken from wake up to arrival at the office.

Detailed Flow Diagrams are more time consuming and offer a more complex and comprehensive look at a process. In addition to the three fundamental shapes (ovals, clouds, rectangles), you can use the following to further organize steps:
Decision or
Branch point
Yes
No
Information into
Database
Wait or Bottleneck
Connector to another process

Detailed Process Flow Diagrams
• Include: – Decision points, waiting periods, tasks that must
be redone (rework), and feedback loops. • Very Useful for:
– Gaining group consensus about the process. – Finding areas where efficiencies can be gained. – Searching for specific problem areas or steps
that must often be redone. • Often Useful for:
– Developing areas or indicators to monitor for process information.
– Identifying who provides what to whom.

17
Example: Detailed Process Flow Diagram Using the familiar process of “getting to work”, this
diagram details the more specific steps and
decisions that make up the process.

High Level Process Map
• Process map (high level) of how to obtain approval for a conference at a certain institution
Source: National Network of Public Health Institutes; http://nnphi.org/CMSuploads/MI-ProcessMappingOverview.pdf

Detailed Process Map
• Process map (detailed) of how to obtain approval for a conference at a certain institution
Source: National Network of Public Health Institutes; http://nnphi.org/CMSuploads/MI-ProcessMappingOverview.pdf
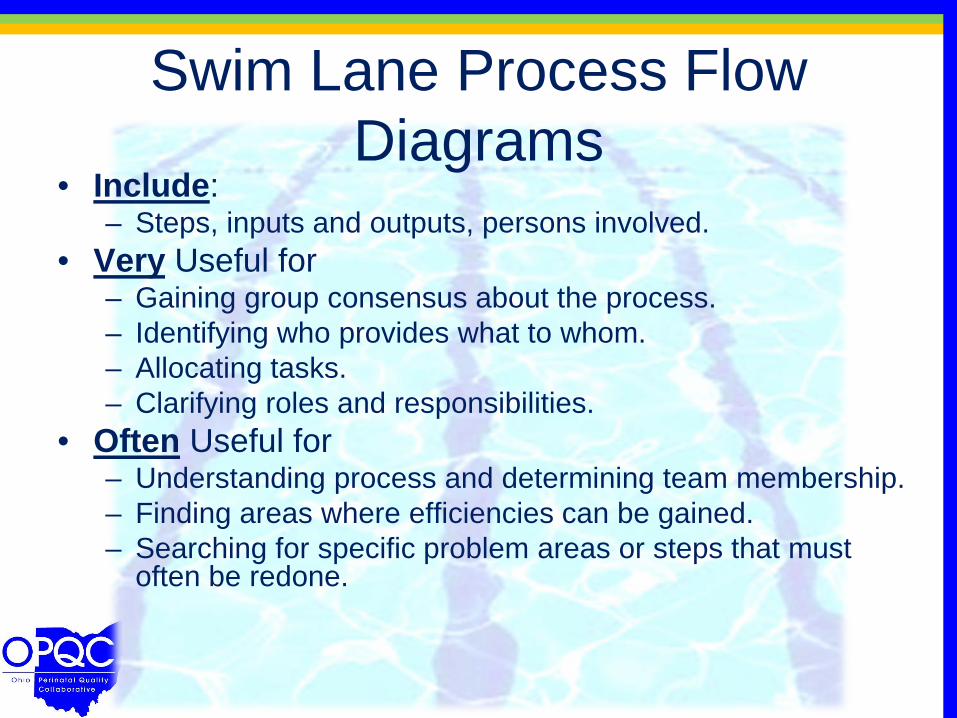
Swim Lane Process Flow Diagrams
• Include: – Steps, inputs and outputs, persons involved.
• Very Useful for – Gaining group consensus about the process. – Identifying who provides what to whom. – Allocating tasks. – Clarifying roles and responsibilities.
• Often Useful for – Understanding process and determining team membership. – Finding areas where efficiencies can be gained. – Searching for specific problem areas or steps that must
often be redone.

Example: Swim Lane Process Flow Diagram

Pre-visit Planning and Communication Process Flowchart –
PVP
Team
PVP
Co-o
rdPr
ovid
erFe
llow
IDs JIA patients
from schedule
Presents and treatment plan is determined
Review PVP prior to visit consider changes in plan;
initial
Request eye exam
PRNStarts PVP
Form
Completes assigned PVP Form using EHR data
Eye exam updated?
Return PVP Form to PVP
Coordinator
Completes eye exam request
form
Give PVP Form to Fellow
PGA > 4?
Complete second level review and
return PVP form to Coordinator
Take PVP form to weekly division
meeting
Give PVP form to provider
NO
YES
File PVP form making ready for
clinic dayNO
YES
Place PVP form in folder on clinic
day
Give PVP form to PVP Coord for filing

Questions to think about… • Are these the right Start/Stop steps?
• Based on this process map, could a new
person successfully perform this process?
• Where should more detail be included?
• What happens if this this person is gone or step is not successfully conducted ….? (anticipate variation)
• Is any “position” missing?

Once the process is mapped out… • Observe the process and edits map as necessary.
• Quickly get every position’s input until the map is
sufficiently accurate for improvement work .
• Use the process map to identify improvement opportunities (load leveling, gaps, redundancies, rework loops, waste, excess variation).
• Use final version of process map to support sustainment.

Time to map out YOUR process • Using a process would you like to improve in your
workplace, select one type of flow map.
• Write out EACH step of the process - as it currently exists - on the Post-It Notes.
• Arrange the steps in the correct order.
• Where are the areas where improvement could be made?

Thank you! Break from 2:15 – 2:25pm Snacks available in the Atrium Please return to the Ballroom for OB and Neonatal Specific Presentations starting at 2:25pm