Process energetics for the hydrothermal carbonisation … · hydrothermal carbonisation of human...
32
•
Transcript of Process energetics for the hydrothermal carbonisation … · hydrothermal carbonisation of human...

Loughborough UniversityInstitutional Repository
Process energetics for thehydrothermal carbonisationof human faecal wastes
This item was submitted to Loughborough University's Institutional Repositoryby the/an author.
Citation: DANSO-BOATENG, E. ...et al., 2015. Process energetics for thehydrothermal carbonisation of human faecal wastes. Energy Conversion andManagement, 105, pp. 1115-1124
Additional Information:
• This paper was accepted for publication in the journal Energy Conver-sion and Management and the definitive published version is available athttp://dx.doi.org/10.1016/j.enconman.2015.08.064.
Metadata Record: https://dspace.lboro.ac.uk/2134/19057
Version: Accepted for publication
Publisher: c© Elsevier
Rights: This work is made available according to the conditions of the Cre-ative Commons Attribution-NonCommercial-NoDerivatives 4.0 International(CC BY-NC-ND 4.0) licence. Full details of this licence are available at:https://creativecommons.org/licenses/by-nc-nd/4.0/
Please cite the published version.

1
Process Energetics for the Hydrothermal Carbonisation of Human Faecal 1
Wastes 2
3
E. Danso-Boatenga,*, R.G. Holdicha, S.J. Martinb, G. Shamaa, A.D. Wheatleyc 4 a Department of Chemical Engineering, Loughborough University, Loughborough, LE11 5
3TU, UK 6 b School of Civil and Building Engineering, Loughborough University, Loughborough, LE11 7
3TU, UK 8 c Department of Materials, Loughborough University, Loughborough, LE11 3TU, UK 9
*Tel: +44 (0)1509 222528; Fax: +44 (0)1509 223923 10
*Email: [email protected] 11
12 Abstract 13
Hydrothermal carbonisation (HTC) has the capability to convert wet biomass such as sewage 14
sludge to a lignite-like renewable solid fuel of high calorific value. However, to date 15
assessment of the energy efficiency of the HTC process has not been fully investigated. In 16
this work, mass and energy balances of semi-continuous HTC of faecal waste conducted at 17
200oC and at a reaction time of 30 min are presented. This analysis is based on recovering 18
steam from the process as well energy from the solid fuel (hydrochar) and methane from 19
digestion of the liquid product. The effect of the feedstock solids content and the quantity of 20
feed on the mass and energy balance were investigated. The heat of reaction was measured at 21
200oC for 4 h with the wet faecal sludge, and the higher heating value was determined for the 22
hydrochar. The results indicated that preheating the feed to 100oC using heat recovered from 23
the process would significantly reduce the energy input to the reactor by about 59%, and 24
decreased the heat loss from the reactor by between 50–60%. For feedstocks containing 15–25
25% solids (for all feed rates), after the process is in operation, energy recycled from the 26
flashing off of steam and combustion of the hydrochar and would be sufficient for preheating 27
the feed, operating the reactor and drying the wet hydrochar without the need for any external 28

2
sources of energy. Alternatively, for a feedstock containing 25% solids for all feed rates, 29
energy recycled from the flashing off of steam and combustion of the methane provides 30
sufficient energy to operate the entire process with an excess energy of about 19–21% which 31
could be used for other purposes. 32
33 Keywords: Bio-energy; Biomass; Hydrochar; Renewable energy; Sewage sludge 34 35 36 37 1. Introduction 38
It is reported that about 1 billion tons of human faeces are generated each year [1], a 39
figure which will increase in line with the projected growth in population. It is estimated that 40
globally over 90% of sewage is discharged untreated [2] and that faecal contamination of 41
water sources causes almost 4 billion cases of diarrhoea each year, killing nearly 2.2 million 42
children under the age of five [3]. Even in those parts of the world where faecal waste 43
routinely undergoes treatment management of sewage sludge continues to present 44
environmental and health challenges. Management of faecal wastes, therefore, remains a 45
critical problem requiring proper mitigation techniques. 46
Hydrothermal carbonisation (HTC) is an effective method for converting wet biomass at 47
relatively mild reaction temperatures into a coal-like material commonly referred to as 48
‘hydrochar’ along with aqueous products and gases - primarily CO2 [4-6]. HTC has been 49
shown to produce substantial energy yields from various types of waste biomass of 50
agricultural origin [6-8]. However, attention has recently turned towards the HTC of sewage 51
sludges for energy generation [9-12]. One added benefit of this is that the process 52
temperatures typically employed in HTC result in the destruction of any pathogens present in 53
the sludge [13]. Most of the investigations cited above have concentrated on producing 54
renewable solid fuels and analysing the combustion properties of such fuels [8-10,14,15]. In 55

3
addition, some of these studies have focused on evaluating the energy efficiency of the 56
production of solid fuel by considering mechanical dewatering, drying and biofuel recovery 57
ratios [11,12]. Furthermore, the prospects for recovering energy from the liquid by-products 58
and the gas/vapour phase have also received considerable attention. The energy input of HTC 59
could be improved by combining HTC with anaerobic digestion of water-soluble by-products 60
[16-18] or their (and that of combustible gases and certain fractions of the hydrochar) wet air 61
oxidation [19-22]. The latter has been reported to improve subsequent anaerobic 62
biodegradability of the liquid products for enhance biogas yields. 63
HTC of biomass is widely reported [4,5,23] to be an exothermic process. In early reports 64
[23,24], it was stated that about 20–30% of the energy stored in the biomass is released as 65
heat during the HTC process, whilst between 60–90% of the heating value of the feedstock 66
remains in the hydrochar [24]. Heating values of hydrochars following HTC of sewage and 67
wastewater sludge range between 15–29 MJ kg–1 [9-12,25] i.e. similar to that of lignite or 68
sub-bituminous coal [26,27]. In order to maximise energy yield after the process is in 69
operation, it is essential that the energy released during the process be recovered and utilised. 70
The hydrochar can be directly combusted to provide additional energy, or as recommended in 71
some studies, be blended with coal to improve the devolatilisation and ignition properties of 72
coal [14,15]. Erlach and Tsatsaronis [28] reported that flashing off steam from hot slurry 73
remaining in the reactor following treatment can improve the energy efficiency of the HTC 74
process. Stemann and Ziegler [29] proposed recovering heat from the hot compressed water 75
following the mechanical dewatering of the hydrochar to further improve the energy 76
efficiency. However, the amount of energy recovered from the process by such strategies 77
may not be sufficient to sustain the process, as energy is required to heat the faecal waste, 78
which typically contains about 90% water, to the reaction temperature, and also to dry the 79
hydrochar. Moreover, heat may be lost due to release of pressure at the end of the process 80

4
(particularly in batch HTC plants) and mixing of the material in the reactor following 81
treatment with the incoming cold feed (for semi-continuous and continuous plants). Heat 82
losses from the HTC reactor will occur as a result of radiation and convection but there is no 83
consensus as to their impact. Thorsness [30] reported significant heat losses during HTC of 84
municipal solid waste, whereas Namioka et al. [31] claimed that only insignificant heat losses 85
occurred during the HTC of sewage sludge. These conflicting claims emphasise the need for 86
a thorough investigation of the energetics of HTC processes. 87
The work presented here provides a framework for estimating energy utilisation, losses 88
and recovery within the HTC process for faecal waste treatment. Furthermore, consideration 89
is given to optimisation of the feed rate and the solids content in the faeces to determine the 90
best scale of operation for sustainability. 91
92 2. Materials and Methods 93
2.1. Materials 94
Primary sewage sludge (faecal sludge), was collected from Wanlip Sewage Treatment 95
Works (Leicestershire, UK). The faecal sludge contained 4.3% (wt.) solids as received. The 96
physical and chemical characteristics of the faecal sludge feedstock are shown in Table 1. 97
2.2. Experimental procedures 98
Triplicate batch HTC experiments were conducted using a 250 mL stainless steel reactor 99
(BS1506-845B, BTL Ltd, England, UK) immersed in an oil bath (B7 Phoenix II, Thermo 100
Scientific, UK) containing “THERMINOL ® 66” heating oil. HTC of primary sewage sludge 101
containing about 5% solids were carried out at 200oC for 30 min. The time taken for the 102
reactor to reach the reaction temperature was about 15 min. Further details of carbonisation 103
experiments are described in a previous work [16]. 104
105 106 107

5
Table 1 Proximate and ultimate analysis of feedstock and hydrochar generated
Parameter Basis Feedstock (dried) Hydrochar Liquid product
Proximate analysis a
Moisture % 8.17 ± 0.25 4.58 ± 0.21 Ash % db 27.54 ± 0.63 36.29 ± 0.30 Volatile Matter % db 68.56 ± 0.83 62.30 ± 0.86 Fixed Carbon b % db 3.90 ± 0.05 1.42 ± 0.56 HHV MJ kg–1(db) 17.79 ± 0.09 18.49 ± 0.56
Ultimate analysis c
C % 37.63 ± 1.60 37.85 ± 0.25 H % 5.79 ± 0.26 5.39 ± 0.15 O d % 51.30 ± 1.69 53.72 ± 0.18 N % 5.29 ± 0.17 3.04 ± 0.06 Hydrochar yield % 66.83 ± 1.00 Carbon recovery e % 57.05 ± 0.37 Fixed carbon recovery f % 24.65 ± 9.81 Energy recovery g % 70.64 ± 2.25 COD g L–1 21.30 ± 2.52 a ASTM D7582-10. b100 – (Moisture + ash + volatile matter). c ASTM D5373-08. d Calculated as difference between 100 and total C/H/N. e (%C in hydrochar * hydrochar mass / %C in feedstock * dry feedstock mass) * 100 [16]. f (%fixed carbon in hydrochar * hydrochar mass / %fixed carbon in feedstock * dry feedstock mass) * 100 [32]. g HHV of hydrochar * hydrochar mass / HHV of feedstock * dry feedstock mass) * 100 [32]. db = dry basis
108
2.2. Experimental procedures 109
Triplicate batch HTC experiments were conducted using a 250 mL stainless steel reactor 110
(BS1506-845B, BTL Ltd, England, UK) immersed in an oil bath (B7 Phoenix II, Thermo 111
Scientific, UK) containing “THERMINOL ® 66” heating oil. HTC of primary sewage sludge 112
containing about 5% solids were carried out at 200oC for 30 min. The time taken for the 113
reactor to reach the reaction temperature was about 15 min. Further details of carbonisation 114
experiments are described in a previous work [16]. 115
2.2.1. Feedstock and product analysis 116
Proximate and ultimate analyses were conducted to characterise both the feedstock and 117
hydrochar. Residual moisture, ash and volatile matter were analysed using a 118

6
thermogravimetric analyser (TA Instruments Q5000IR, Elstree, UK), according to ASTM 119
method D7582-10 [33]. Carbon (C), hydrogen (H) and nitrogen (N) contents were analysed 120
using a CHN Analyser (CE-440 Elemental Analyser, Exeter Analytical Inc., Coventry, UK), 121
according to ASTM D5373-08 [34]. Energy content of the PSS feedstock and hydrochars was 122
determined using a bomb calorimeter (CAL2K, Digital Data Systems, Randburg, South 123
Africa). The specific heat capacity of dry sewage sludge was determined theoretically by the 124
method of Namioka et al. [31] and that of the hydrochar was the value used by Stemann and 125
Ziegler [29]. Chemical oxygen demand (COD) in the liquid product was measured using a 126
COD analyser (Palintest 8000, Palintest Ltd, UK) at a wavelength of 570 nm, in accordance 127
with Standard Methods 5220 D – Closed Reflux Colorimetric Method [35]. All 128
determinations were conducted in triplicate. 129
2.2.2. Heat of reaction measurement 130
The heat of reaction was measured in triplicate using a heat flux differential scanning 131
calorimeter (DSC-Q10, TA Instruments, Crawley, UK) at 200oC for a reaction time of 4 h, 132
being the reported time for a complete reaction [36]. Approximately 8 mg of faecal sludge 133
(4.3% solids content) was heated in stainless steel high pressure capsules (TA Instruments, 134
USA). Empty sealed pans were use as the reference capsules. The experiments and evaluation 135
of the results followed ISO11357-5:1999 and ISO11357-1:2009 using the isothermal method 136
[37,38]. For comparison, additional measurements were conducted at reaction temperatures 137
of 160 and 180oC for 4 h. Before the heat of reaction measurements, the DSC was calibrated 138
using 10 mg of standard grade indium metal (LGC, Teddington, Middlesex, UK). The 139
nitrogen purge gas flow was set at 0.5 ml/min. The cooler temperature was held at 40oC by 140
DSC re-generated cooling system (TA Instruments). 141
As described by ISO 11357-1:2009, the sample and reference capsules were reweighed 142
after each run to determine if there were changes in mass that could have disturbed the 143

7
instrument baseline or created additional thermal effects [38]. The heat of reaction during the 144
isothermal stage was estimated by integrating the area between the peak and the baseline. The 145
results were evaluated using the method proposed by Funke and Ziegler [39], by defining the 146
interval of integration in order to reduce uncertainties in determining the virtual baseline. 147
2.3. Modelling 148
The model developed here was based on a semi-continuous HTC plant comprising eight 149
components; a feed tank (and pre-heater), a reactor, a flash vessel, a pressure filter, a solids 150
dryer, an anaerobic digester (AD), and two combustion units. The plant capacity was varied 151
between 4.00–400.00 kg/day of wet faecal waste, representing faeces generated by between 152
10 and1000 people per day. The model assumed solids content in the faecal waste to vary 153
between 5%, 15% and 25%. The faecal waste was heated to 200oC for 30 min (via a heating 154
unit) for sterilisation. The treatment time used here was selected on the basis of results from 155
previous study [16], which indicated that HTC at 200oC for 30 min produced hydrochars 156
having optimal characteristics; with the HHV of the hydrochar at those conditions similar to 157
the HHV of sub-bituminous coal. Although batch or continuous systems are typically applied 158
in a HTC plant, continuous or semi-continuous systems promote efficient utilisation of the 159
heat of reactions well as effective application of adjacent equipment, and also pressure 160
changes in the reactor are prevented [29]. 161
2.3.1 Heat recovery routes 162
The two processes that require energy inputs are: (1) heating of the faecal waste to the 163
reaction temperature of 200oC; (2) drying of the wet hydrochar to less than 5% moisture 164
before combustion to generate energy to power the plant. A previous study on filterability of 165
slurry following HTC showed that for slurry from carbonisation conducted at 200oC for 30 166
min, hot-filtering the slurry at about 100oC resulted in hydrochars having water contents of 167

8
about 50% [40]; such hydrochars would require drying before combustion. No additional or 168
external source of energy was required for dewatering the hydrochar. 169
After the HTC process has been initiated, energy can be recovered from three 170
mechanisms: (1) steam from the flash tank; (2) combustion of the hydrochar; (3) combustion 171
of biogas produced from anaerobic digestion (AD) of the liquid product. Estimated methane 172
yields from previous work showed that a yield of 52% was attainable from such liquid 173
products following HTC at 200oC for 30 min [16]. The overall energy recycled will be used 174
to preheat the feedstock, dry the hydrochar, and heat the reactor. 175
2.3.2 Mass and energy balances 176
The total mass balance was evaluated for the operations taking place within the 177
boundaries shown in Figure 1 as follows: 178
F = mt + mL,D + mw,D + mV,F (1) 179
where F is the mass of wet faecal feedstock (kg), 𝑚𝑚𝑡𝑡 is mass of dried hydrochar obtained at 180
reaction time t (kg), 𝑚𝑚𝐿𝐿,𝐷𝐷 is the mass of liquid after filtration of the carbonised slurry (kg), 181
𝑚𝑚𝑤𝑤,𝐷𝐷 is the mass of water evaporated from the wet hydrochar during drying (kg), and 𝑚𝑚𝑉𝑉,𝐹𝐹 is 182
the mass of steam or water vapour recovered from the flash vessel (kg). 183
184 185 186 187 188 189 190 191 192 193 194 195 196 197 198
199 200
Figure 1 – Basis of mass balance calculations. 201
Dry char (Solid fuel)
Faecal sludge
Water
Heat (from steam)
Feed Preheating
HT Treatment
Pressure Release
Filtration (Dewatering)
Drying
𝐦𝐦𝐰𝐰,𝐃𝐃
Heat
𝐦𝐦𝐕𝐕,𝐅𝐅
𝐦𝐦𝐋𝐋,𝐃𝐃
𝐦𝐦𝐭𝐭
Water
F
Heat

9
The energy balance was modelled as follows: 202
�Energyinput � = � Energy to
heat reactor�+ �Energy to heatfaecal sludge �+ � Energy to
heat water�+ � Heat ofreaction� − �Heat
loss � (2) 203
That is, energy balance before energy is recovered from the process is 204
Voρocp,o(T − T0) + (HU × τh) = �mr. cp,r(T− T0)� + �mFS. cp,FS(T − T0)�
+ �mw�HL,(T) − Hw,(T0)�� + m0.∆HR − [ArUrth(T − T0)] (3) 205
where: 𝑐𝑐𝑝𝑝,𝑜𝑜 is the specific heat capacity of heating oil (kJ kg–1 K–1); 𝑐𝑐𝑝𝑝,𝐹𝐹𝐹𝐹 is the specific heat 206
capacity of dry sewage sludge (kJ kg K–1), used to represent that of faecal sludge; 𝑐𝑐𝑝𝑝,𝑟𝑟 is the 207
specific heat capacity of the reactor (kJ kg K–1); 𝜌𝜌𝑜𝑜 is the density of heating oil (kg m–3); 208
𝑚𝑚𝑜𝑜𝑜𝑜𝑜𝑜 is the mass of heating oil (kg); 𝑚𝑚𝑟𝑟 is the reactor mass (i.e. density of reactor material x 209
reactor volume, kg); 𝑚𝑚𝐹𝐹𝐹𝐹 = 𝑚𝑚0, is the mass of solids in the wet sludge as (kg); mw is the 210
mass of water in the sludge (kg); 𝐻𝐻𝑤𝑤(𝑇𝑇0) is the enthalpy of water at initial temperature (kJ kg–211
1); 𝐻𝐻𝐿𝐿(𝑇𝑇) is the enthalpy of water at the saturated liquid temperature, T (kJ kg–1); 𝐻𝐻𝑈𝑈 is heating 212
unit utility (kW); 𝜏𝜏ℎ is oil holding time (min); ∆HR is the heat of reaction during holding 213
period (kJ kg–1); Ur is the overall reactor heat transfer coefficient (W m–2 K–1); Ar is the 214
reactor heat transfer area (m2); and 𝑡𝑡ℎ is reaction time – including heat up time (45 min). 215
The reactor heat transfer area is given by 216
Ar = πL(D + tI) + 2πr2 (4) 217
where: D is reactor diameter (m); L is reactor height (m); r is the reactor radius (m); and 𝑡𝑡𝐼𝐼 is 218
the insulation thickness (m). 219
Ignoring fouling factors, the overall heat transfer coefficient of the reactor is: 220
1Ur
= 1hm
+ 1hI
+ 1hA + hR
(5) 221
where: ℎ𝐴𝐴 is the heat transfer coefficient at the reactor wall (W m–2 k–1); ℎ𝐼𝐼 is the conduction 222
coefficient of insulation (W m–2 k–1); ℎ𝑚𝑚 is the conduction coefficient of the metal walls of 223
the reactor (W m–2 K–1); ℎ𝑅𝑅 is the radiation coefficient of side walls (W m–2 K–1). 224

10
The heat transfer coefficient at the reactor wall was calculated by modifying the equation 225
proposed by Kato et al. [41] as follows: 226
hA = 0.138 × (NGr)0.36 × [(NPr)0.175 − 0.55] × kair/L (6) 227
NGr = (L3 × ρair2 × g × β × ∆T)/µair2 (7) 228
NPr = cpair × µair kair⁄ (8) 229
where: 𝑁𝑁𝐺𝐺𝑟𝑟 is the Grashof number, 𝑁𝑁𝑃𝑃𝑟𝑟 is the Prandtl number, 𝑘𝑘𝑎𝑎𝑜𝑜𝑟𝑟 is the thermal 230
conductivity of air at 25oC (W m–1 K–1); 𝑐𝑐𝑝𝑝𝑎𝑎𝑜𝑜𝑟𝑟 is the specific heat capacity of air at 25oC (kJ 231
kg–1 K–1); 𝜇𝜇𝑎𝑎𝑜𝑜𝑟𝑟 is the viscosity of air at 25oC (kg m–1 s–1); 𝜌𝜌𝑎𝑎𝑜𝑜𝑟𝑟 is the density of air at 25oC (kg 232
m–3); β is the coefficient of thermal expansion of air at 25oC (K–1), 𝑔𝑔 is the gravitational 233
constant (m s–2), L is the reactor height (m); ∆𝑇𝑇 is the average temperature (oC). 234
The average temperature drop is described in Eq. (9) using the expression proposed by 235
Kumana and Kothari [42]. 236
∆T = (T − TA) 4⁄ (9) 237
where 𝑇𝑇𝐴𝐴 is the outside air temperature (oC). 238
The conduction coefficient of the metal wall and insulation are defined as follows: 239
hm = kMtM
(10) 240
hI = kItI
(11) 241
where: 𝑘𝑘𝑀𝑀 is the thermal conductivity of the metal of the reactor at 200oC (W m–1 oC–1); 𝑘𝑘𝐼𝐼 is 242
the thermal conductivity of the insulation used (calcium silicate at 200oC, W m–1 oC–1); 𝑡𝑡𝑀𝑀 is 243
the reactor wall thickness (m). 244
The radiation coefficient of side walls is defined by Perry and Chilton [43] as follows: 245
hR = 0.1713 × ε ×��(TIS+460/100)4−�(TA+460)/100�
4��
TIS−TA (12) 246
TIS = TA + 0.25(T − TA) (13) 247

11
where: ε is the surface emissivity of the aluminium jacket, 𝑇𝑇𝐼𝐼𝐹𝐹 is the outside temperature of 248
the insulated surface (oC), 460 is the temperature conversion factor from K to oF. 𝑇𝑇𝐴𝐴 and 𝑇𝑇𝐼𝐼𝐼𝐼 249
were converted from oC to K during calculation of ℎ𝑅𝑅. 250
After the process is started, energy recycled from steam is calculated using the following 251
equation as: 252
Es = �mw × �H�w(T) − H�w(T0)�� − m0 × HHVf (14) 253
where: Es is the steam energy (kJ h–1); HHVf is the heating value of the solids in the sludge 254
(kJ kg–1); H�w(T) is the specific enthalpy of water at the reaction temperature, T (kJ kg–1); and 255
H�w(T0) is the specific enthalpy of water at reference temperature, 25oC (kJ kg–1). 256
The total mass of steam produced from flashing, mV,F was then calculated as: 257
mV,F = �1 −H�S(T)−H�w(T)
H�S(T)−H�w(120oC)� × mw (15) 258
where: 𝐻𝐻�𝐹𝐹,𝑇𝑇 is the specific enthalpy of steam at reaction temperature, T (kJ kg–1); and 259
𝐻𝐻�𝑤𝑤,120𝑜𝑜𝐶𝐶 is the specific enthalpy of water at 120oC (kJ kg–1). 260
The energy from the steam for preheating the feedstock, assuming negligible heat losses, 261
is given by: 262
mV,PF.HV,(T) = �mFT. cp,FT(Tf − T0)� + �mFS. cp,FS(Tf − T0)� 263
+ �mw�Hw(Tf) − Hw(T0)�� (16) 264
where: 𝑐𝑐𝑝𝑝,𝐹𝐹𝐹𝐹 is the specific heat capacity of feed tank (kJ kg–1 K–1); 𝑚𝑚𝑉𝑉,𝑃𝑃𝐹𝐹 is the mass of 265
steam from flash vessel for preheating feed (kg); 𝑚𝑚𝐹𝐹𝑇𝑇 is the mass of feed tank; 𝑇𝑇𝑓𝑓 is the feed 266
pretreatment temperature (oC); and 𝐻𝐻𝑤𝑤(𝑇𝑇𝑓𝑓) is the enthalpy of water at pretreatment 267
temperature (kJ kg–1), 𝐻𝐻𝑉𝑉(𝑇𝑇) is the specific steam energy, kJ kg–1 (i.e. Es/mV,F). 268
The energy for drying wet hydrochar, assuming negligible heat losses, is given by: 269
mV,D.HV(T) = �mH,D. cp,H(TD − TH)� + �mW,H × hvap� (17) 270

12
where: 𝑚𝑚𝑉𝑉,𝐷𝐷 is the mass of steam for drying (kg); 𝑚𝑚𝐻𝐻,𝐷𝐷 is the mass of wet hydrochar fed to 271
the drying process (kg); 𝑚𝑚𝑊𝑊,𝐻𝐻 is the mass of water in hydrochar (kg); 𝑐𝑐𝑝𝑝,𝐻𝐻 the specific heat 272
capacity of hydrochar (kJ kg–1 K–1); ℎ𝑣𝑣𝑎𝑎𝑝𝑝 is the latent heat of vaporisation of water (kJ kg–1); 273
𝑇𝑇𝐷𝐷 is the drying temperature (oC); and 𝑇𝑇𝐻𝐻 is the temperature of wet hydrochar entering the 274
dryer (oC). 275
The energy required to heat the reactor and contents after completion of one process 276
cycle is given by: 277
Qchar + QCH4 = �mr. cp,r(T − Tr)� + �mFS. cp,FS(T − Tf)� + ∆HRm0 278
+�mw�HL,(T) − Hw,(Tf)�� − [ArUrth(T − Tf)] (18) 279
where: 𝑄𝑄𝑐𝑐ℎ𝑎𝑎𝑟𝑟 and 𝑄𝑄𝐶𝐶𝐻𝐻4 are the energies produced from combustion of dry hydrochar and 280
methane (kJ), respectively; 𝑇𝑇𝑓𝑓 is the temperature of preheated feedstock (oC); and 𝑇𝑇𝑟𝑟 is the 281
temperature of the reactor body after completion of a process cycle (120oC); and 𝐻𝐻𝑤𝑤(𝑇𝑇𝑓𝑓) is the 282
enthalpy of water at the preheat temperature, Tf (kJ kg–1). 283
Qchar = mt × HHV of char (19) 284
QCH4 = mCH4 × HCH4 (20) 285
where 𝐻𝐻𝐶𝐶𝐻𝐻4is the heat of combustion of methane (50125 kJ kg–1) from stoichiometric 286
combustion equation. 𝑚𝑚𝐶𝐶𝐻𝐻4 is the mass of methane (kg) obtained from the relationship 287
between mass of CH4 generated and that of COD removed during anaerobic digestion (1 g 288
COD removed = 0.25 g CH4 produced, which is equivalent to 1.4 L CH4 at STP [44-46], and 289
on the basis that 90% of the COD was converted to CH4 [47]. That is by proportion: {mass of 290
CH4 produced (kg) = mass of COD (kg) x 0.9 x 0. 25 (kg)}/1 kg COD. Table 2 gives the 291
physical and thermodynamics properties of the HTC reactor, faecal waste and products. 292
293
294 295

13
296
Table 2 Physical and thermodynamic properties of the reactor and operational data
Parameter
Notation
Unit
Value
Reactor and other units Specific heat capacity of stainless steel cp,r; cp,PT kJ kg–1 K–1 0.502 Density of stainless steel reactor (at 25oC) ρr kg/m3 8027.2 Reactor diameter a D m 0.502 Reactor/jacket height a L m 0.741 Reactor jacket diameter Dj m 1.34 Reactor thickness tM m 3.18 x 10–02 Insulation thickness tI m 0.062 Thermal conductivity of insulation at 200oC b kI W m–1 oC–1 0.068 Thermal conductivity of stainless steel at 200oC kM W m–1 oC–1 17.0 Surface emissivity of jacket aluminium ε 0.05 Volume of heating oil a Vo m3
Feedstock and products Specific heat capacity of dry sewage sludge cp,FS kJ kg–1 K–1 1.7 c Specific heat capacity of hydrochar cp,H kJ kg–1 K–1 1.45 d Specific heat capacity of water at 25oC cpw kJ kg–1 K–1 4.187 Enthalpy of vaporisation of water hvap kJ kg–1 2270 Specific enthalpy of water at 25oC Hw(T0) kJ kg–1 104.8 Specific enthalpy of saturated water at 200oC HL(T) kJ kg–1 859.0 Specific enthalpy of water at 100oC Hw(Tf) kJ kg–1 419.1 Specific enthalpy of steam at 120oC HV(TF) kJ kg–1 2706.0 Specific enthalpy of steam at 200oC HS kJ kg–1 2790.0
Operational data
Specific heat capacity of heating oil cp,o kJ kg–1 K–1 1.57 Density of heating oil (at 25oC) ρo kg m–3 1005.86 Heating unit utility HU kW 3.0 Holding time τh min 45 e Reaction temperature T oC 200 Reference (feedstock) temperature T0 oC 25 Temperature of preheated feedstock Tf oC 100 Temperature of steam from flash tank TFT oC 120 Drying temperature TD oC 120 Temperature of hydrochar to dryer TH oC 100 Density of air (at 25oC) ρair Kg m–3 1.25 Specific heat capacity of air (at 25oC) cpair kJ kg –1 K–1 1.005 Viscosity of air (at 25oC) µair kg m–1 s–1 1.98 x 10⁻⁵ Thermal conductivity of air kair W m–1 K–1 0.0257 Coefficient of thermal expansion of air (at 25oC) β K–1 3.43 x 10⁻³ Gravitational constant G m s–2 9.81 a Varies based on reactor size or the number of faeces to be fed. b Calcium silicate. c [31]. d [29]. e Heat up time and reaction time.

14
3. Results and Discussion 297
3.1. Mass balance 298
Figure 2 summarises the mass balance for the HTC process carried out at 200oC and for a 299
reaction time of 30 min using faecal sludge with solid concentrations of between 5–25%, on a 300
per day basis and assuming a 12 h process operation. The hydrochar yield was about 67% of 301
the initial solids in the faeces following carbonisation under these conditions. After drying, 302
the hydrochar contained about 5% water (using the results of residual moisture content in 303
304 305 306 307
308
309
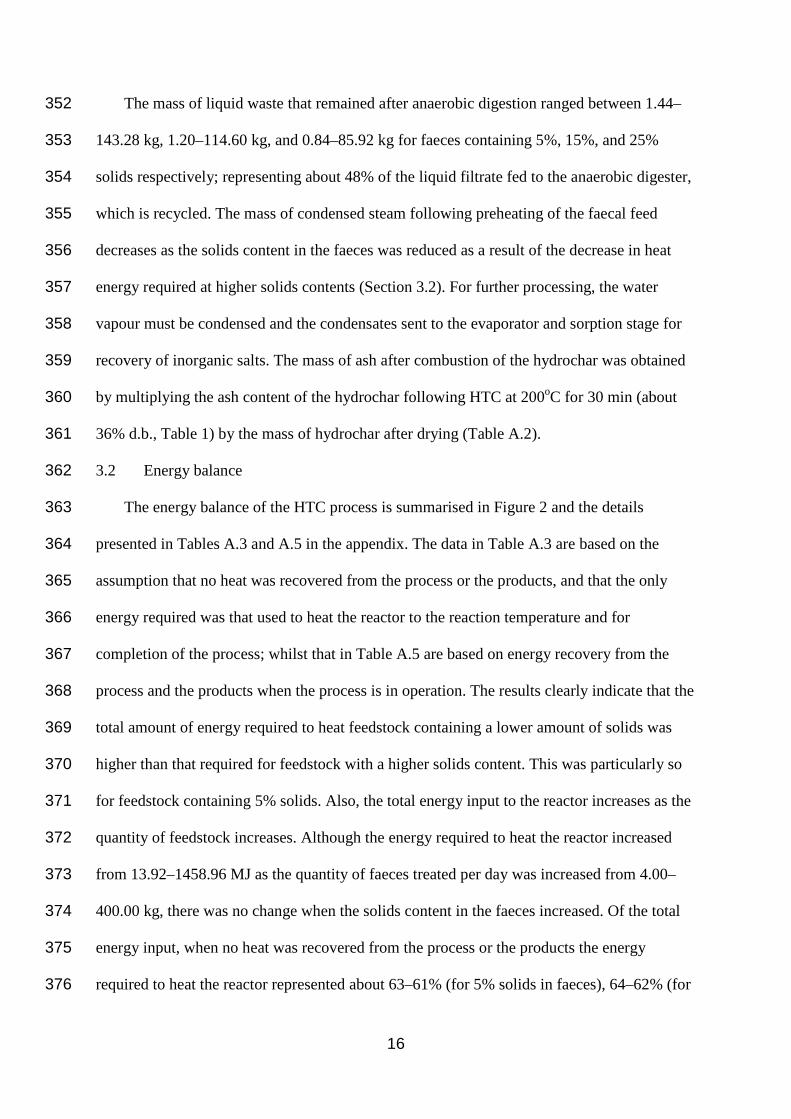
310
311
312
313
314
315
316
317
318
319
320
321
322 323 324
Figure 2 – Energy balance on a semi-continuous HTC system based on heat recycled from 325
both the process and products using feedstock with 25% solids and a daily feed rate 326
equivalent to 400.00 kg. 327
85.9 kg Waste liquid
CH4
311.2 kg (84.8%)
366.8 kg
Slurry
11.8 MJ (0.8%)
18,490 kJ kg–1
3.5 kg
1.91 kg
177.5 kg (57.0%)
133.7 kg (43.0%)
55.7 kg (15.2%) 1490.8 MJ
490.6 MJ (32.9%)
Pressure Dewatering
Water vapour
42.6 MJ
1254.2 MJ
Faecal sludge 400.0 kg
25.9 kg Condensate
Reaction Heat 279.0 MJ
29.3 kg (52.6%) Excess 988.4 MJ (66.3%) Excess Steam/vapour (Recovery)
Energy (Recovery)
25.1 kg (36.3%) Ash
64.6 kg (48.3%) Water evaporated
Energy (Recovery)
Solid fuel 69.1 kg
Water vapour
Feed Preheating
HT Treatment
Drying
Char Combustion
Biogas Combustion
Anaerobic Digestion
100.0 kg solids
300.0 kg water
25.9 kg (46.5%)
0.4 kg (0.9%)
Pressure Release Solid
cake
Liquid
Required: 832.8 MJ Excess: 464.0 MJ
(35.8%)

15
hydrochar – Table 1). As the quantity of faeces treated increases from 4.00 to 400.00 kg per 328
day, the amount of hydrochar produced after drying increases from 0.12–13.80 kg, 0.48–329
41.52 kg, and 0.72–69.12 kg when the solid content in the feedstock increases from 5%, 15% 330
and 25%, respectively (Table A.1 in the appendix). The amount of steam from the flash tank 331
increases significantly as the quantity of faeces treated increases from 4.00 to 400.00 kg per 332
day, but decreased as the solids content in the faeces increased or the liquid fraction 333
decreased. The amount of steam released from the flash tank ranged from 0.60–70.56 kg for 334
5% solids concentration, 0.60–63.24 kg for 15% solid concentration, and 0.60–55.68 kg for 335
25% solids concentration (Table A.1). 336
As shown in Figure 2, the amount of steam released from the Flash tank represents about 337
15% of the total quantity of material (slurry) fed to the Flash tank from the HT reactor, while 338
the remaining 85% consists of solids and water. For feedstock containing 15–25% solids, 339
only about 47% of the amount of steam released is required to preheat the feed to 100oC and 340
dry the hot hydrochar containing about 50% moisture. Therefore, 53% of the steam generated 341
is available for other purposes. The amount of water evaporated during drying of the wet 342
solids ranged between 0.12–12.96 kg, 0.36–38.64 kg, and 0.60–64.56 kg for faeces 343
containing 5%, 15%, and 25% solids respectively as the quantity of faeces treated was raised 344
from 4.00–400.00 kg per day (Table A.2). The mass of estimated methane yields decreased as 345
the solids content in the feedstock increases and ranged from 0.01–1.42 kg, 0.01–1.13 kg, and 346
0.01–0.85 kg for faeces with 5%, 15%, and 25% solids respectively. Previous studies 347
reported that HTC of biomass wastes followed by AD could enhance methane yields from 348
72–222% [16-18]; whilst carbonising digestate from AD by HTC has been reported to 349
improve energy recovery from biomass wastes [11,25,48] with the combined AD-HTC 350
doubling the energy recovery compared to AD process alone [48]. 351
16
The mass of liquid waste that remained after anaerobic digestion ranged between 1.44–352
143.28 kg, 1.20–114.60 kg, and 0.84–85.92 kg for faeces containing 5%, 15%, and 25% 353
solids respectively; representing about 48% of the liquid filtrate fed to the anaerobic digester, 354
which is recycled. The mass of condensed steam following preheating of the faecal feed 355
decreases as the solids content in the faeces was reduced as a result of the decrease in heat 356
energy required at higher solids contents (Section 3.2). For further processing, the water 357
vapour must be condensed and the condensates sent to the evaporator and sorption stage for 358
recovery of inorganic salts. The mass of ash after combustion of the hydrochar was obtained 359
by multiplying the ash content of the hydrochar following HTC at 200oC for 30 min (about 360
36% d.b., Table 1) by the mass of hydrochar after drying (Table A.2). 361
3.2 Energy balance 362
The energy balance of the HTC process is summarised in Figure 2 and the details 363
presented in Tables A.3 and A.5 in the appendix. The data in Table A.3 are based on the 364
assumption that no heat was recovered from the process or the products, and that the only 365
energy required was that used to heat the reactor to the reaction temperature and for 366
completion of the process; whilst that in Table A.5 are based on energy recovery from the 367
process and the products when the process is in operation. The results clearly indicate that the 368
total amount of energy required to heat feedstock containing a lower amount of solids was 369
higher than that required for feedstock with a higher solids content. This was particularly so 370
for feedstock containing 5% solids. Also, the total energy input to the reactor increases as the 371
quantity of feedstock increases. Although the energy required to heat the reactor increased 372
from 13.92–1458.96 MJ as the quantity of faeces treated per day was increased from 4.00–373
400.00 kg, there was no change when the solids content in the faeces increased. Of the total 374
energy input, when no heat was recovered from the process or the products the energy 375
required to heat the reactor represented about 63–61% (for 5% solids in faeces), 64–62% (for 376

17
15% solids in faeces), and 65–63% (for 25% solids in faeces) of the total energy input; that is 377
a slight decrease as the faeces treated per day was increased, and increased as the solids 378
content of the faeces increases (noting that energy input decreased as the faeces solid content 379
increased, as explained earlier). The energy required for heating all the faecal material 380
represents about 21–20% (for faeces with 5% solids), 20–19% (for faeces with 15% solids), 381
and 19–18% (for faeces with 25% solids) of the total energy input to the reactor, that 382
represents an increase with increases in the feed water content. These results are in keeping 383
with those of previous studies. For example, Thorsness [30] found that energy input in the 384
form of steam increased by approximately 15% as the MSW feed water content increased 385
from 25 to 35%. Stemann and Ziegler [29] also reported that the amount of energy required 386
to heat biomass to the reaction temperature depended significantly on the water content of the 387
biomass. In their study on the energetic assessment of the HTC of woody biomass, increasing 388
the water content of the feedstock resulted in increases in energy input of between 2.2% and 389
7.3% of the energy of the hydrochar. 390
Heat losses from the insulated reactor increased as the number of person equivalents 391
increased, but did not change with increases in the solids content and accounted for between 392
about 0.5–3% of the total energy input. This serves to indicate the importance of thermal 393
insulation, and heat losses on a commercial scale may become significant if proper insulation 394
is not provided, and this would adversely affect the overall energy efficiency of the process. 395
Thorsness [30] reported that heat loss effects from the walls of the reactor were significant, 396
with an increase in input steam flow rate requirement of about 40% due to adiabatic 397
conditions. Stemann and Ziegler [29] reported that heat losses from the reactor ranged from 398
0.005–0.2 MW, which accounts for about 0.2% of the system power of the HTC plant, and 399
falls within the range of values obtained in this study. The heat transfer parameters used to 400

18
estimate the heat loss from the insulated reactor are presented in Tables 2 and A.4 (in the 401
appendix). 402
The heat of reaction measured over an interval of 4 h using the DSC were –0.20 MJ kg–1 403
(±0.01) at 160oC, –0.32 MJ kg–1 (±0.03) at 180oC, and –0.70 MJ kg–1 (±0.08) at 200oC. The 404
heats of reaction were measured over a period of 4 h, as this was the time previously reported 405
[36] as being the time for complete reaction. Funke and Ziegler [36] reported that the amount 406
of energy released increases under severe carbonisation conditions. In their study because 407
cellulose required severe reaction conditions to carbonise, it took longer for the heat to be 408
released than the 30–40 min reported for wood and glucose. For a treatment time of 30 min, 409
the use of such a value measured in 4 h may represent a slight overestimate but in the overall 410
scheme the error involved would be insignificant. The heat of reaction measured at 200oC for 411
4 h was closer to the value of –0.79 MJ kg–1 reported for HTC of digestate from anaerobic 412
digested waste that was estimated based on measured higher heating value (HHV) and 413
combustion reactions [25], but significantly lower than the value of –1.6 MJ kg–1 reported for 414
cellulose [5,25], and –1.07 MJ kg–1 and –1.06 MJ kg–1 for cellulose and glucose using DSC 415
measurements [36]. The reaction heat increased as the amount of faeces undergoing treatment 416
was increased, and was calculated by multiplying the mass of faeces fed into the reactor by 417
the heat of reaction measured at 200oC. The heat of reaction alone cannot sustain the 418
carbonisation reaction as it represents only about 19–20% of the total energy required if the 419
feed had not been preheated (Table A.3 in the appendix), and between 33–35% of the energy 420
if the feed was preheated to 100oC (Table A.5 in the appendix). 421
Energy recovered from the steam in the flash tank increased as the solids content in the 422
faeces and mass of faecal sludge was increased. About 4.1, 0.9, and 0.8% of the total energy 423
recovered from steam was used to dry the hydrochar to approximately 5% moisture content 424
for faeces containing 5, 15, and 25% solids respectively; whilst 65 and 33% of the energy 425

19
was used to preheat faecal sludge with solid contents of 15 and 25% respectively (Table A.3 426
in the appendix). Preheating the feed reduced the energy required to heat the reactor by about 427
59%. However, energy recovered from steam for faeces containing 5% solids was not 428
sufficient to preheat the feed before it was fed to the HTC reactor. For faeces containing 25% 429
solids, about 63–64% of the total energy from combustion of the hydrochar and methane 430
were used to power the reactor; indicated that the surplus energy could be utilised for other 431
purposes. 432
Alternatively, the energy generated from combustion of the methane and the excess 433
energy recovered from the flashing off of steam alone (71–81%) were sufficient for powering 434
the entire HTC system; hence, the hydrochar can be used for other applications such as 435
addition to soil as a soil conditioner and carbon sequestration or combustion for syngas 436
production. It must be noted that higher methane yields were obtained when the solids 437
content of the faeces was low. Preheating the faeces to 100oC before it was fed to the reactor 438
reduced the heat losses from the reactor to between 50–60%, and also decreased the total heat 439
input required to heat the reactor and faecal content to the reaction temperature of 200oC by 440
59% (Table A.5 in the appendix). Zhao et al. [12] reported that about 48% of the heat 441
generated from hydrochar combustion could be recovered, while the total energy recovery for 442
HTC processing at temperatures above 200oC was approximately between 40% and 60% if 443
the reactor was preheated and when ignoring preheating, respectively. However, this could be 444
lower as heat losses were not considered in their study. 445
3.3. Sensitivity analysis 446
The amount of faeces to be treated, and the concentration of solids in the faeces 447
significantly determined the overall process energetics (Tables A.3 and A.5 in the appendix). 448
The latter were varied as the input parameters in the HTC process from 4.00–400.00 kg per 449
day for the feed rate, and 5–25% for the solids content. For a higher solids content (15–25%) 450

20
sufficient energy is recovered from flashing off the steam, which can be used to preheat the 451
feed to 100oC and drying the wet hydrochar with 50% moisture to 5%, with excess energy of 452
up to 34% (for 15% solids) and 66% (for 25% solids in faeces). For faeces with 25% solids 453
content energy from combustion of the hydrochar was enough to operate the reactor, leaving 454
a surplus of between 33–35%. This decreased as the amount of faecal waste increased from 455
4.00–400.00 kg/day. For HTC of feedstock with 15% solids, using the energy from 456
combustion of the hydrochar and the surplus energy from steam (10.08–1021.08 MJ per day, 457
Table A.5) would be sufficient to operate the HTC reaction. A feedstock containing 5% 458
solids produces the highest amount of methane (Table A.2 in the appendix), about 125 and 459
167% more than that produced from feedstock with 15 and 25% solids respectively; and 460
consequently generating more energy from its combustion. For all solids contents and 461
feedstock rates, the amount of energy generated from the combustion of methane alone was 462
insufficient to operate the reactor. However, for a feedstock containing 15% solids the excess 463
energy from flashing off of steam and the energy from combustion of both methane and the 464
hydrochar were sufficient to operate the HTC reactor with surplus energy of about 21–22%. 465
Also, for a feedstock containing 25% solids energy from combustion of methane and the 466
hydrochar were sufficient to operate the reactor leaving excess of about 36–37%. It must be 467
noted that the methane yield was based on an empirical estimation and that prediction of the 468
percentage of CH4 in biogas is difficult and depends on the pH in the anaerobic digestion 469
reactor, which is influenced by the equilibrium CO2. This is because carbon dioxide is 470
partially soluble in water, and so is partly dissolved in the liquid phase or converted to 471
bicarbonate depending on the pH; but the CH4 produced is practically insoluble in water and 472
is mostly present in the gas phase. As a result, the estimated CH4 yield will generally be 473
lower than the fraction of CH4 in biogas produced from experimental anaerobic digestion 474
tests. 475

21
4. Conclusions 476
The solids contents of the feedstock and the amount of feed material had a significant 477
effect on the material and energy balances of the HTC of faecal sludge. Although feedstocks 478
of lower solids content produced more steam, the steam energy from feedstock with 5% 479
solids was not sufficient for preheating the feed although it was enough for drying the wet 480
hydrochar. In a process where the liquid products were not digested for methane production 481
and for feedstocks containing 15 and 25% solids, once the process has started energy 482
recovery from flashing off steam, and combustion of the char would be sufficient for 483
operating the entire process without the need for any external sources of energy. 484
Alternatively, for a feedstock with 25% solids content and all feed rates, 79–81% of the 485
energy from combustion of methane and the excess energy recovered from flashing off of 486
steam were sufficient for sustaining the process, and the remaining 19–21% could be utilised 487
for other purposes; hence the hydrochar could be used for carbon sequestration when applied 488
to soil or for other applications such as gasification for syngas production. Further 489
investigations would need to be conducted at different reaction temperatures to fully establish 490
the effect of temperature on the energetics of the process. Also, studies into a detailed life-491
cycle and economic analysis of the process would be useful to confirm the sustainability of 492
the process. 493
494 Acknowledgements 495
This research was part of Gates Foundation: “Reinventing The Toilet Challenge”. The 496
authors are thankful to Geoffrey Russell for his help with collection of primary sewage 497
sludge. 498
References 499
[1] Sobsey MD. Excreta and household wastewaters – Introduction. Global Water, 500
Sanitation and Hygiene. ENVR 890 section 003, ENVR 296 section 003; 2006. 501

22
[2] Langergraber G, Muellegger E. Ecological Sanitation – a way to solve global sanitation 502
problems? Environ Int 2005;31:433–44. 503
[3] WHO/UNICEF/WSSCC. Global Water Supply and Sanitation Assessment Report. 504
WHO/UNICEF Joint Monitoring Programme for Water Supply and Sanitation, (ISBN 505
92 4 156202 1); 2000. 506
[4] Funke A, Ziegler F. Hydrothermal carbonization of biomass: A summary and 507
discussion of chemical mechanisms for process engineering. Biofuels Bioprod Bioref 508
2010;4:160–77. 509
[5] Libra JA, Ro KS, Kammann C, Funke A, Berge N, Neubauer Y, et al. Hydrothermal 510
carbonization of biomass residuals: a comparative review of the chemistry, processes 511
and applications of wet and dry pyrolysis. Biofuels 2011;2:89–124. 512
[6] Antoniette M. Process for converting biomass to coal-like material using hydrothermal 513
carbonisation. US Patent Application Publication; US 2011/0052125 A1. 514
[7] Demirbas A. Biomass resource facilities and biomass conversion processing for fuels 515
and chemicals. Energy Convers Manage 2001;42:1357–78. 516
[8] Demirbas A. Biofuels sources, biofuel policy, biofuel economy and global biofuel 517
projections. Energy Convers Manage 2008;49:2106–16. 518
[9] He C, Giannis A, Wang J-Y. Conversion of sewage sludge to clean solid fuel using 519
hydrothermal carbonization: Hydrochar fuel characteristics and combustion behaviour. 520
Appl Energy 2013;111:257–66. 521
[10] Parshetti GK, Liu Z, Jain A, Srinivasan MP. Hydrothermal carbonization of sewage 522
sludge for energy production with coal. Fuel 2013;111:201–10. 523
[11] Kim D, Lee K, Park KY. Hydrothermal carbonization of anaerobically digested sludge 524
for solid fuel production and energy recovery. Fuel 2014;130:120–5. 525

23
[12] Zhao P, Shen Y, Ge S, Yoshikawa K. Energy recycling from sewage sludge by 526
producing solid biofuel with hydrothermal carbonization. Energy Convers Manage 527
2014;78:815–21. 528
[13] Cantrell K, Ro K, Mahajan D, Anjom M, Hunt PG. Role of thermal conversion in 529
livestock waste-to-energy treatments: Obstacles and opportunities. Ind Eng Chem Res 530
2007;46:8918–27. 531
[14] Muthuraman M, Namioka T, Yoshikawa K. Characteristics of co-combustion and 532
kinetic study on hydrothermally treated municipal solid waste with different rank coals: 533
A thermogravimetric analysis. App Energy 2010;87:141–8. 534
[15] Lu L, Namioka T, Yoshikawa K. Effects of hydrothermal treatment on characteristics 535
and combustion behaviours of municipal solid wastes. Appl Energy 2011;88:3659–64. 536
[16] Danso-Boateng E, Shama G, Wheatley AD, Martin SJ, Holdich RG. Hydrothermal 537
Carbonisation of Sewage Sludge: Effect of Process Conditions on Product 538
Characteristics and Methane Production. Bioresour Technol 2015;177:318–27. 539
[17] Qiao W, Peng C, Wang W, Han P. UASB treatment of supernatant of sewage sludge by 540
hydrothermal pre-treatment. In: Proceedings of the 3rd International Symposium on 541
Energy from Biomass and Waste. Venice (Italy); 2010. 542
[18] Chandra R, Takeuchi H, Hasegawa T, 2012. Hydrothermal pretreatment of rice straw 543
biomass: a potential and promising method for enhanced methane production. Appl. 544
Energy 2012;94:129–40. 545
[19] Lissens G, Thomsen AB, De Baere L, Verstraete W, Ahring BK. Thermal wet 546
oxidation improves anaerobic biodegradability of raw and digested biowaste. Environ 547
Sci Technol 2004;38:3418–24. 548
[20] Fox M, Noike T. Wet oxidation pretreatment for the increase in anaerobic 549
biodegradability of newspaper waste. Bioresour Technol 2004;91:273–281. 550

24
[21] Riedel G, Koehler R, Poerschmann J, Kopinke F-D, Weiner B. Combination of 551
hydrothermal carbonization and wet oxidation of various biomasses. Chem Eng J 552
2015;279:715–24. 553
[22] Baskyr I, Weiner B, Riedel G, Poerschmann J, Kopinke F-D. Wet oxidation of char-554
water-slurries from hydrothermal carbonization of paper and brewer's spent grains. Fuel 555
Process Technol 2014;128:425–31. 556
[23] Titirici M-M, Anotonietti M, Thomas A. Back in the black: hydrothermal carbonization 557
of plant material as an efficient chemical process to treat the CO2 problem? New J 558
Chem 2007;31:787–89. 559
[24] Ramke H-G, Blohse D, Lehmann H-J, Fettig J. Hydrothermal carbonisation of organic 560
waste. In: Cossu R, Diaz LF, Stegmann R, editors. Proceedings of the 12th international 561
waste management and landfill symposium. Sardinia (Italy): CISA Publisher; 2009. 562
[25] Berge ND, Ro KS, Mao J, Flora JR, Chappell MA, Bae S. Hydrothermal carbonisation 563
of municipal waste streams. Environ Sci Technol 2011;45:5696–703. 564
[26] Schnapp R. IEA coal questionnaire. Joint Rosstat-IEA Energy Statistics Workshop. 565
Moscow; 2012. 566
[27] Akkaya AV. Predicting coal heating values using proximate analysis via a neural 567
network approach. Energy Sour Part A 2013;35:253–60. 568
[28] Erlach B, Tsatsaronis G. Upgrading of biomass by hydrothermal carbonisation: 569
Analysis of an industrial-scale plant design. In: Proceedings of the 23rd international 570
conference on efficiency, cost, optimisation, simulation and environmental impact of 571
energy systems. Lausanne (Switzerland); 2010. 572
[29] Stemann J, Ziegler F. Assessment of the energetic efficiency of a continuously operated 573
plant for hydrothermal carbonisation of biomass. In: Bioenergy Technology (BE). 574
World renewable energy congress. Linköping (Sweden); 2011, p. 125–132. 575

25
[30] Thorsness CB. A direct steam heat option for hydrothermal treatment of municipal 576
solid waste. United States DOE Technical Report. UCRL-ID-120283; 1995. 577
[31] Namioka T, Miyazaki M, Morohashi Y, Umeki K, Yoshikawa K. Modeling and 578
analysis of batch-type thermal sludge pretreatment for optimal design. Journal of 579
Environment and Engineering 2008;3:170–81. 580
[32] Kang S, Li X, Fan J, Chang J. Characterization of Hydrochars Produced by 581
Hydrothermal carbonization of lignin, cellulose, D-xylose, and wood meal. Ind Eng 582
Chem Res 2012;51:9023–9031. 583
[33] ASTM. Standard Test Methods for Proximate Analysis of Coal and Coke by Macro 584
Thermogravimetric Analysis. Method D7582-10, ASTM International: Pennsylvania; 585
2010. 586
[34] ASTM. Standard Test Methods for Instrumental Determination of Carbon, Hydrogen, 587
and Nitrogen in Laboratory Samples of Coal. Method D5373-08, ASTM International: 588
Pennsylvania; 2008. 589
[35] APHA. Standard Methods for the Examination of Water and Wastewater. Method 5220 590
D. 21st ed. American Public Health Association, American Water Works Association, 591
Water Environment Federation: Washington DC; 2005. 592
[36] Funke A, Ziegler F. Heat of reaction measurement for hydrothermal carbonisation of 593
biomass. Bioresour Technol 2011;102:7595–8. 594
[37] ISO. Plastics – Differential Scanning Calorimetry (DSC). Part 5: Determination of 595
characteristics reaction-curve temperatures and times, enthalpy of reaction and degree 596
of conversion. ISO 11357-5;1999. 597
[38] ISO. Plastics – Differential Scanning Calorimetry (DSC). Part 1: General principles. 598
ISO 11357-1;2009. 599

26
[39] Funke A, Ziegler F. Propagation of uncertainties and systematic errors in the 600
measurements of long-lasting heat flows using differential scanning calorimtery. J 601
Therm Anal Calorim 2012;108:1317–24. 602
[40] Danso-Boateng E, Holdich RG, Wheatley AD, Martin SJ, Shama G. Hydrothermal 603
carbonization of primary sewage sludge and synthetic faeces: Effect of reaction 604
temperature and time on filterability. Environ Prog Sustain Energy 2015; 605
DOI:10.1002/ep.12114. 606
[41] Kato H, Nishiwaki N, Hirata M. On the turbulent heat transfer by free convection from 607
a vertical plate. Int J Heat Mass Transfer 1968;11:1117–25. 608
[42] Kumana JD, Kothari SP. Predict storage tank heat transfer precisely. Chemical 609
Engineering Magazine, Henningson, Durham, and Richardson Inc.; 1982. 610
[43] Perry RH, Chilton CH. Chemical Engineers’ Handbook. 5th ed. New York: McGraw-611
Hill;1973. 612
[44] Birchall S, Dillon C, Roger W. Effluent and Manure Management Database 613
for the Australian Dairy Industry. Southbank Victoria: Dairy Australia;2008. 614
[45] Hamilton DW. Anaerobic digestion of animal manures: Methane production potential 615
of waste materials. BAE 1762. Stillwater, Oklahoma: Oklahoma Cooperative Extension 616
Service;2013. 617
[46] Spinosa L, Vasilind PA. Sludge Into Biosolids: Processing, Disposal, Utilization. 618
London: IWA Publishing;2001 619
[47] Franco A, Mosquera-Corral A, Campos JL, Roca E. Learning to operate anaerobic 620
bioreactors. In: Méndez-Vilas A, editor. Communicating Current Research and 621
Educational Topics in Applied Microbiology. FORMATEX: Badajoz; 2007, pp. 618–622
27. 623

27
[48] Funke A, Mumme J, Koon M, Diakite M. Cascaded production of biogas and 624
hydrochar from wheat straw: Energetic potential and recovery of carbon and plant 625
nutrients. Biomass Bioenergy 2013;58:229–37. 626
627
628
629
630
631
632
633
634
635
636
637
638
639
640
641
642
643
644
645
646
647
648

28
649
Appendix 650
651
Table A.1 Mass balance of faecal sludge HTC as a function of feedstock quantity and solids content
5% Solids in faeces
Feedstock a (kg)
Faecal Sludge (kg) Flashing (kg) Dewatering (kg) Drying (kg) Solids
Water
Slurry
Steam
Solid cake
Liquid
Hydrochar
Evaporated water
4.00 0.20 3.80
3.24 0.60
0.24 3.00
0.12 0.12 8.00 0.40 7.60 6.48 1.44 0.60 5.88 0.36 0.24
40.00 2.00 38.00 32.28 7.08 2.64 29.64 1.32 1.32 200.00 10.00 190.00 161.40 35.28 13.32 148.08 6.84 6.48 400.00 20.00 380.00 322.80 70.56 26.76 296.04 13.80 12.96
15% Solids in faeces
4.0 0.60 3.40 3.12 0.60 0.84 2.28 0.48 0.36 8.0 1.20 6.80 6.36 1.32 1.56 4.80 0.84 0.72
40.0 6.00 34.00 31.68 6.36 8.04 23.64 4.20 3.84 200.0 30.00 170.00 158.52 31.56 40.08 118.44 20.76 19.32 400.0 60.00 340.00 317.04 63.24 80.16 236.88 41.52 38.64
25% Solids in faeces
4.0 1.00 3.00 3.12 0.60 1.32 1.80 0.72 0.60 8.0 2.00 6.00 6.24 1.08 2.64 3.60 1.44 1.20
40.0 10.00 30.00 31.08 5.52 13.32 17.76 6.96 6.36 200.0 50.00 150.00 155.64 27.84 66.84 88.8 34.56 32.28 400.0 100.00 300.00 311.16 55.68 133.68 177.48 69.12 64.56
a On a per day basis, and assuming that the plant operates 12 hours a day. Solids in the faeces reduced by 66.8% following carbonisation.
652
653
654
655
656
657
658
659
660

29
661
662
Table A.2 Mass balance of faecal sludge HTC resulted from recovered and waste materials
5% Solids in faeces
Feedstock a (kg)
Feed Pre-heating (kg)
Anaerobic Digestion (kg)
Methane b Combustion (kg)
Char Combustion (kg)
Condensed Steam COD Methane Waste Water Water vapour Ash Water vapour
4.00
0.28
0.06
0.01
1.44
0.03
0.05
0.01 8.00 0.67 0.13 0.03 2.88 0.06 0.12 0.01
40.00 3.29 0.63 0.14 14.28 0.32 0.48 0.12 200.00 16.41 3.15 0.71 71.64 1.60 2.52 0.36 400.00 32.81 6.31 1.42 143.28 3.19 5.04 0.72
15% Solids in faeces 4.00 0.28 0.05 0.01 1.20 0.03 0.12 0.02 8.00 0.61 0.10 0.02 2.28 0.05 0.36 0.04
40.00 2.96 0.50 0.11 11.52 0.26 1.56 0.24 200.00 14.68 2.52 0.57 57.36 1.28 7.56 1.08 400.00 29.41 5.04 1.13 114.60 2.55 15.00 2.04
25% Solids in faeces 4.00 0.28 0.04 0.01 0.84 0.02 0.24 0.04 8.00 0.50 0.08 0.02 1.68 0.04 0.48 0.12
40.00 2.57 0.38 0.09 8.64 0.19 2.52 0.36 200.00 12.95 1.89 0.43 42.60 0.96 12.48 1.68 400.00 25.89 3.78 0.85 85.92 1.91 25.08 3.48
a On a per day basis, and assuming that the plant operates 12 hours a day. b From reaction stoichiometry: 1 kg CH4 makes 2.25 kg (16/36) kg H2O.
663
664
665
666
667
668
669
670
671
672

30
673
Table A.3 Energy balance of faecal sludge HTC without heat recovery
5% Solids in faeces
Feedstock (kg)
Hydrothermal Treatment (MJ)
Flashing (MJ)
Total input
Energy to heat reactor
Energy to faeces & water
Reaction heat
Heat loss
faeces
water
total
4.00
14.28
9.00
0.06
2.88
2.94
2.76
0.48
0.60 8.00 28.68 17.88 0.12 5.76 5.88 5.64 0.72 1.20
40.00 144.84 89.52 0.60 28.68 29.28 27.96 1.80 5.64 200.00 728.40 447.48 3.00 143.28 146.28 139.56 4.92 28.44 400.00 1458.96 894.96 6.00 286.56 292.56 279.00 7.56 56.76
15% Solids in faeces
4.00
14.04
9.00
0.24
2.52
2.76
2.76
0.48
7.68 8.00 28.32 17.88 0.36 5.16 5.52 5.64 0.72 14.76
40.00 143.04 89.52 1.80 25.68 27.48 27.96 1.80 77.40 200.00 719.28 447.48 8.88 128.16 137.04 139.56 4.92 2 387.00 400.00 1440.72 894.96 17.88 256.44 274.32 279.00 7.56 773.76
25% Solids in faeces
4.00 13.92
9.00
0.36
2.3
2.66
2.76
0.48
14.88 8.00 27.96 17.88 0.60 4.6 5.20 5.64 0.72 29.88
40.00 141.24 89.52 3.00 22.7 25.70 27.96 1.80 149.04 200.00 710.16 447.48 14.88 113.2 128.08 139.56 4.92 745.44 400.00 1422.36 894.96 29.76 226.3 256.06 279.00 7.56 1490.76
On per day basis, and assuming that the plant operates 12 hours a day. The faeces are not preheated before fed to the rector.
674
675
Table A.4 Heat transfer parameters
Feedstock a (kg)
L (m)
D (m)
𝐀𝐀𝐫𝐫 (m2)
𝐍𝐍𝐆𝐆𝐆𝐆
𝐍𝐍𝐏𝐏𝐫𝐫
𝐡𝐡𝐈𝐈 (w m–2 K–1)
𝐡𝐡𝐌𝐌 (w m–2K–1)
𝐡𝐡𝐀𝐀 (w m–2K–1)
𝐡𝐡𝐆𝐆 (w m–2K–1)
𝐔𝐔𝐫𝐫 (w m–2K–1)
4.00
0.15
0.10
0.09
1.87 x 10⁷
0.77
1.10
534.59
4.06
0.16
0.87
8.00 0.18 0.13 0.14 3.72 x 10⁷ 0.77 1.10 534.59 4.14 0.16 0.87
40.00 0.32 0.22 0.36 1.86 x 10⁸ 0.77 1.10 534.59 4.32 0.16 0.88
200.00 0.54 0.38 0.97 9.29 x 10⁸ 0.77 1.10 534.59 4.51 0.16 0.89
400.00 0.68 0.48 1.51 1.86 x 10⁹ 0.77 1.10 534.59 4.59 0.16 0.89
a On a per day basis, and assuming that the plant operates 12 hours a day.
676
677
678

31
679
Table A.5 Assessment of energy balance of faecal sludge HTC with heat recovery
5% Solids in faeces Feedstock
(kg) Preheating a
(MJ) Hydrothermal
Treatment (MJ) Flashing c
(MJ) Drying
(MJ) Combustion
(MJ) Excess d
(MJ) Steam input Input b
Reaction
heat Losses
Excess energy
Steam input
Char
Methane
4.00
5.04
8.40
2.76
0.24
Deficit
0.02
2.52
0.71
Deficit 8.00 10.08 16.80 5.64 0.36 Deficit 0.05 5.04 1.42 Deficit
40.00 50.52 84.84 27.96 1.08 Deficit 0.24 25.08 7.11 Deficit 200.00 252.84 426.60 139.56 2.76 Deficit 1.20 125.40 35.56 Deficit 400.00 505.56 854.40 279.00 4.32 Deficit 2.40 250.80 71.12 Deficit
15% solids in faeces
4.00
5.04
8.28
2.76
0.24
2.52
0.12
7.56
0.57
2.37 8.00 9.96 16.56 5.64 0.36 4.68 0.12 15.00 1.14 4.26
40.00 49.80 83.76 27.96 1.08 26.88 0.72 75.24 5.69 24.05 200.00 249.00 421.20 139.56 2.76 134.52 3.48 376.32 28.44 118.08 400.00 498.12 843.60 279.00 4.32 268.56 7.08 752.52 56.88 234.36
25% Solids in faces
4.00
4.92
8.16
2.76
0.24
9.72
0.12
12.60
0.43
14.59 8.00 9.84 16.32 5.64 0.36 19.80 0.24 25.08 0.85 29.41
40.00 49.08 82.68 27.96 1.08 98.76 1.20 125.40 4.26 145.74 200.00 245.28 415.80 139.56 2.76 494.28 5.88 627.12 21.32 727.22 400.00 490.56 832.80 279.00 4.32 988.44 11.76 1254.24 42.63 1452.51
a Includes energy to heat feed tank, faeces and water to 100oC. b Energy from combustion of the hydrochar and methane. c Only part of the energy is used to preheat the feedstock and dry the char, and the remainder represents a surplus; “deficit” indicates that the energy is used only to dry the char but is insufficient to preheat the feed. d Surplus energy recovered from steam, and from combustion of both char and methane after using part of the energy to operate the reactor. On per day basis, and assuming that the plant operates 12 hours a day.
680