
Process diagnostics
8
Real time diagnostics of technological processes and field equipment L.A. Rusinov ⁎ , I.V. Rudakova, V.V. Kurkina Saint-Petersburg State Technological Institute (Technical University), Moskowsky pr. 26, 190013 Saint-Petersburg, Russia Received 29 March 2006; received in revised form 25 October 2006; accepted 23 November 2006 Available online 29 January 2007 Abstract Diagnostics of a state of potentially dangerous technological processes and field equipment enables to detect abnormal situations and hidden (soft) failures at early stages of their development, when they are still reversible. In this paper, the combined method of diagnostics is considered. The early detection of abnormal process situations is carried out with the help of the “moving PCA” method by matching the values of statistics T 2 and Q with the thresholds. By the same method, the hidden faults of the field equipment (sensors, actuators etc.) are determined. However this method does not allow us to simply identify the abnormal situations when many variables are changing simultaneously. For this case, the methods of identification on the basis of production or frame-production diagnostic models (DM), in particular, systems on the basis of fuzzy production rules, have shown the good results. The procedure of identification consists in estimation of degree of similarity between a current situation vector S ={s 1 , s 2 , … s J } and vectors of possible abnormal situations registered in rules of a process diagnostic model S m ⁎ ={s 1m ⁎ , s 2m ⁎ , … s Jm ⁎ }. Elements s i ⁎= μ S (u i ⁎) reflect in opinion of the experts the “ideal” development of symptoms u i for the given fault. The quality of the method is illustrated by diagnostics of a state of a high-pressure polyethylene polymerization process. © 2006 Elsevier B.V. All rights reserved. Keywords: Diagnostics; Process faults; Sensor faults; PCA; Fuzzy production rules 1. Introduction The majority of chemical technological processes refers to the class of potentially dangerous (PDTP). Therefore there is a necessity for continuous PDTP monitoring and diagnostics of their state. The importance of the problem is due to the fact, that the striving to intensification of PDTP very often results in the necessity of operation near the boundaries of permissible safe ranges and even near the hazardous zones, where intensity and conversion, as a rule, are higher. In such cases, it is mandatory to employ an automatic protection system, which, however, deteriorates the qualitative and quantitative process characteristics (including economic indices). This is because the system functioning is usually accompanied by the emergency dumping of reactionary mass, irreversible reaction depressing and other actions resulted in essential losses [1–3]. Therefore it is important to detect the process deviations from its normal state at early stages of their development, when they are still reversible, and do not bring them up to operating level of a protection system. As a rule, PDTP are characterized by a high level of uncertainties, large uncontrolled disturbances, essential interior nonlinearity and, frequently, by bad observability. Very often they have no mathematical descriptions. The abnormal situations, which can arise during the process, are related to faults of two kinds: process faults and faults of field equipment (sensors and actuators) [4]. The process faults mostly stem from the large changes in parameters of raw materials, ingress of forbidden impurities and contaminations, degradation of catalyzers, variation of chemical equipment parameters, etc. The sensor and actuator errors can be divided into two main categories including hard failures (complete failures), and hidden or soft failures caused by shifts in sensor calibrations, aging drift, sticking of valves, etc. It is easy to handle the hard failures, while it can hardly be said about the soft failures. Therefore the latter are more dangerous, since an operator usually finds out the soft failures too late, when the essential violations are observed in the process [5]. A procedure for identification of an abnormal process situation (FDI) consists of two stages: detection of a fault and its Chemometrics and Intelligent Laboratory Systems 88 (2007) 18 – 25 www.elsevier.com/locate/chemolab ⁎ Corresponding author. Tel.: +7 812 4957453; fax: +7 812 7121191. E-mail addresses: [email protected], [email protected] (L.A. Rusinov). 0169-7439/$ - see front matter © 2006 Elsevier B.V. All rights reserved. doi:10.1016/j.chemolab.2006.11.007
-
Upload
leon-a-rusinov -
Category
Engineering
-
view
78 -
download
1
Transcript of Process diagnostics
ory Systems 88 (2007) 18–25www.elsevier.com/locate/chemolab
Chemometrics and Intelligent Laborat
Real time diagnostics of technological processes and field equipment
L.A. Rusinov ⁎, I.V. Rudakova, V.V. Kurkina
Saint-Petersburg State Technological Institute (Technical University), Moskowsky pr. 26, 190013 Saint-Petersburg, Russia
Received 29 March 2006; received in revised form 25 October 2006; accepted 23 November 2006Available online 29 January 2007
Abstract
Diagnostics of a state of potentially dangerous technological processes and field equipment enables to detect abnormal situations and hidden(soft) failures at early stages of their development, when they are still reversible. In this paper, the combined method of diagnostics is considered.The early detection of abnormal process situations is carried out with the help of the “moving PCA” method by matching the values of statistics T2
and Q with the thresholds. By the same method, the hidden faults of the field equipment (sensors, actuators etc.) are determined. However thismethod does not allow us to simply identify the abnormal situations when many variables are changing simultaneously. For this case, the methodsof identification on the basis of production or frame-production diagnostic models (DM), in particular, systems on the basis of fuzzy productionrules, have shown the good results. The procedure of identification consists in estimation of degree of similarity between a current situation vectorS={s1, s2, … sJ} and vectors of possible abnormal situations registered in rules of a process diagnostic model Sm⁎={s1m⁎, s2m⁎, … sJm⁎}. Elementssi⁎=μS(ui⁎) reflect in opinion of the experts the “ideal” development of symptoms ui for the given fault. The quality of the method is illustrated bydiagnostics of a state of a high-pressure polyethylene polymerization process.© 2006 Elsevier B.V. All rights reserved.
Keywords: Diagnostics; Process faults; Sensor faults; PCA; Fuzzy production rules
1. Introduction
The majority of chemical technological processes refers to theclass of potentially dangerous (PDTP). Therefore there is anecessity for continuous PDTP monitoring and diagnostics oftheir state. The importance of the problem is due to the fact, thatthe striving to intensification of PDTP very often results in thenecessity of operation near the boundaries of permissible saferanges and even near the hazardous zones, where intensity andconversion, as a rule, are higher. In such cases, it is mandatory toemploy an automatic protection system, which, however,deteriorates the qualitative and quantitative process characteristics(including economic indices). This is because the systemfunctioning is usually accompanied by the emergency dumpingof reactionary mass, irreversible reaction depressing and otheractions resulted in essential losses [1–3]. Therefore it is importantto detect the process deviations from its normal state at early
⁎ Corresponding author. Tel.: +7 812 4957453; fax: +7 812 7121191.E-mail addresses: [email protected], [email protected]
(L.A. Rusinov).
0169-7439/$ - see front matter © 2006 Elsevier B.V. All rights reserved.doi:10.1016/j.chemolab.2006.11.007
stages of their development, when they are still reversible, and donot bring them up to operating level of a protection system.
As a rule, PDTP are characterized by a high level ofuncertainties, large uncontrolled disturbances, essential interiornonlinearity and, frequently, by bad observability. Very often theyhave no mathematical descriptions. The abnormal situations,which can arise during the process, are related to faults of twokinds: process faults and faults of field equipment (sensors andactuators) [4].
The process faults mostly stem from the large changes inparameters of raw materials, ingress of forbidden impurities andcontaminations, degradation of catalyzers, variation of chemicalequipment parameters, etc. The sensor and actuator errors canbe divided into two main categories including hard failures(complete failures), and hidden or soft failures caused by shiftsin sensor calibrations, aging drift, sticking of valves, etc. It iseasy to handle the hard failures, while it can hardly be said aboutthe soft failures. Therefore the latter are more dangerous, sincean operator usually finds out the soft failures too late, when theessential violations are observed in the process [5].
A procedure for identification of an abnormal processsituation (FDI) consists of two stages: detection of a fault and its
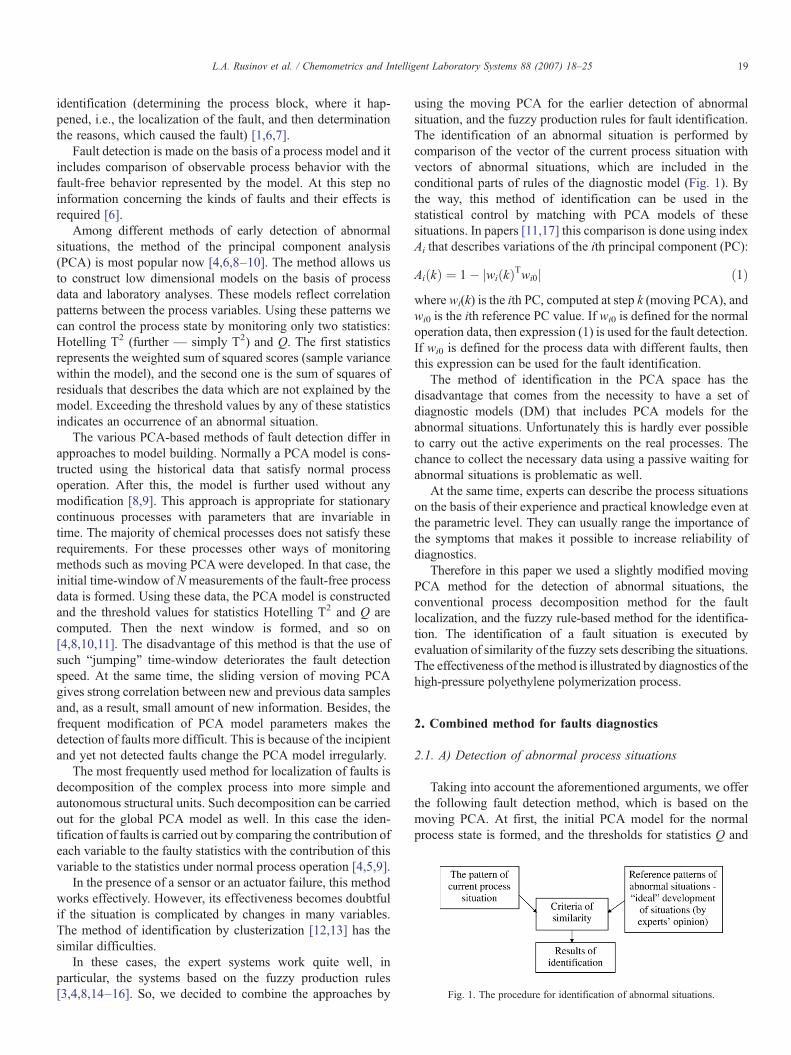
Fig. 1. The procedure for identification of abnormal situations.
19L.A. Rusinov et al. / Chemometrics and Intelligent Laboratory Systems 88 (2007) 18–25
identification (determining the process block, where it hap-pened, i.e., the localization of the fault, and then determinationthe reasons, which caused the fault) [1,6,7].
Fault detection is made on the basis of a process model and itincludes comparison of observable process behavior with thefault-free behavior represented by the model. At this step noinformation concerning the kinds of faults and their effects isrequired [6].
Among different methods of early detection of abnormalsituations, the method of the principal component analysis(PCA) is most popular now [4,6,8–10]. The method allows usto construct low dimensional models on the basis of processdata and laboratory analyses. These models reflect correlationpatterns between the process variables. Using these patterns wecan control the process state by monitoring only two statistics:Hotelling T2 (further — simply T2) and Q. The first statisticsrepresents the weighted sum of squared scores (sample variancewithin the model), and the second one is the sum of squares ofresiduals that describes the data which are not explained by themodel. Exceeding the threshold values by any of these statisticsindicates an occurrence of an abnormal situation.
The various PCA-based methods of fault detection differ inapproaches to model building. Normally a PCA model is cons-tructed using the historical data that satisfy normal processoperation. After this, the model is further used without anymodification [8,9]. This approach is appropriate for stationarycontinuous processes with parameters that are invariable intime. The majority of chemical processes does not satisfy theserequirements. For these processes other ways of monitoringmethods such as moving PCAwere developed. In that case, theinitial time-window of Nmeasurements of the fault-free processdata is formed. Using these data, the PCA model is constructedand the threshold values for statistics Hotelling T2 and Q arecomputed. Then the next window is formed, and so on[4,8,10,11]. The disadvantage of this method is that the use ofsuch “jumping” time-window deteriorates the fault detectionspeed. At the same time, the sliding version of moving PCAgives strong correlation between new and previous data samplesand, as a result, small amount of new information. Besides, thefrequent modification of PCA model parameters makes thedetection of faults more difficult. This is because of the incipientand yet not detected faults change the PCA model irregularly.
The most frequently used method for localization of faults isdecomposition of the complex process into more simple andautonomous structural units. Such decomposition can be carriedout for the global PCA model as well. In this case the iden-tification of faults is carried out by comparing the contribution ofeach variable to the faulty statistics with the contribution of thisvariable to the statistics under normal process operation [4,5,9].
In the presence of a sensor or an actuator failure, this methodworks effectively. However, its effectiveness becomes doubtfulif the situation is complicated by changes in many variables.The method of identification by clusterization [12,13] has thesimilar difficulties.
In these cases, the expert systems work quite well, inparticular, the systems based on the fuzzy production rules[3,4,8,14–16]. So, we decided to combine the approaches by
using the moving PCA for the earlier detection of abnormalsituation, and the fuzzy production rules for fault identification.The identification of an abnormal situation is performed bycomparison of the vector of the current process situation withvectors of abnormal situations, which are included in theconditional parts of rules of the diagnostic model (Fig. 1). Bythe way, this method of identification can be used in thestatistical control by matching with PCA models of thesesituations. In papers [11,17] this comparison is done using indexAi that describes variations of the ith principal component (PC):
AiðkÞ ¼ 1� jwiðkÞTwi0j ð1Þwhere wi(k) is the ith PC, computed at step k (moving PCA), andwi0 is the ith reference PC value. If wi0 is defined for the normaloperation data, then expression (1) is used for the fault detection.If wi0 is defined for the process data with different faults, thenthis expression can be used for the fault identification.
The method of identification in the PCA space has thedisadvantage that comes from the necessity to have a set ofdiagnostic models (DM) that includes PCA models for theabnormal situations. Unfortunately this is hardly ever possibleto carry out the active experiments on the real processes. Thechance to collect the necessary data using a passive waiting forabnormal situations is problematic as well.
At the same time, experts can describe the process situationson the basis of their experience and practical knowledge even atthe parametric level. They can usually range the importance ofthe symptoms that makes it possible to increase reliability ofdiagnostics.
Therefore in this paper we used a slightly modified movingPCA method for the detection of abnormal situations, theconventional process decomposition method for the faultlocalization, and the fuzzy rule-based method for the identifica-tion. The identification of a fault situation is executed byevaluation of similarity of the fuzzy sets describing the situations.The effectiveness of the method is illustrated by diagnostics of thehigh-pressure polyethylene polymerization process.
2. Combined method for faults diagnostics
2.1. A) Detection of abnormal process situations
Taking into account the aforementioned arguments, we offerthe following fault detection method, which is based on themoving PCA. At first, the initial PCA model for the normalprocess state is formed, and the thresholds for statistics Q and
20 L.A. Rusinov et al. / Chemometrics and Intelligent Laboratory Systems 88 (2007) 18–25
T2 are computed. Then every new process data vector is pro-jected on this PCA score space and the new values of statisticsQ and T2 are compared with the former threshold values. Iffaults are not detected, the procedure continues until a new dataset of the process data vectors of size N will be formed. Then anew PCA model is constructed for this new data set withdetermination of the number of principal components, andcalculation of new cutoff values. Such approach accommodatesall natural modifications of the process. The data set size, N, ischosen empirically and it depends on the dynamics of theprocess.
Therefore, the procedure of monitoring and fault detection isas follows:
1. Form the initial data set that is Xk0 (k=0) matrix with N
rows (measurements) and p columns (process variables).These are data obtained at the normal process operation.Then normalize the matrix for zero mean and unitvariance. Check for outliers, for example, using themedian filter.
2. Form the PCA model and obtain the loading Pik andscore Tik matrices, e.g. by using the NIPALS algorithm[18], and determine the number of principal componentsI utilized in the model.
3. For a given significance value α, compute the thresholdvalues CQ and CT for statistics Q and T2 [4,19]:
CQ ¼ aðbþ czaÞd ð2Þwhere
a ¼Xpi¼I
ki; b ¼ 1þ ðh2h0ðh0 � 1Þ=a2Þ;
h2 ¼Xpi¼I
k2i ; h0 ¼ ð1� 2ah3Þ=3h22; h3 ¼Xpi¼I
k3i ;
c ¼ffiffiffiffiffiffiffiffiffiffiffiffi2h2h0
p=a; d ¼ 1=h0;
zα is the α-percentile of the normal distribution; λi, i= I+1,…, p are eigenvalues that explain variations ofreference data in a subspace of residuals, instead of allp eigenvalues.
CTcpðn� 1Þn� p
Faðn; n� pÞ ð3Þ
where Fα(n,n−p) is the α-percentile of the F-distribution
with n and (n−p) degrees of freedom.4. Measure a new process data vector Xk+1, centre it by theprevious mean, and normalize it by the previous standarddeviation. Then, calculate statistics Q and T2 andcompare them with the previous threshold values.
5. If any of the statistics systematically exceeds itsthreshold value during r (1b rbN) consecutive steps,the fault is considered to be detected.
If no exceeding of the threshold values happens during Nsteps, the new data matrix Xk+1 is formed from the stored N
vectors {xk+1, …,xk+N}. New PCA model is constructed based onthese data and the new values of thresholds CQ and CT forstatistics Q and T2 are determined.
Then increase index k:=k+1 and return to step 4.
2.2. B) Identification of abnormal process situations
For identification of sensor and actuators faults and simpleprocess faults, variable contributions to statistics Q and T2 aredetermined using the following expressions.
The complete contribution of variable xj to statistics T2 isdetermined as follows:
CTð jÞ ¼XIi¼l
CTði; jÞ ð4Þ
where CT(i,j) is the contribution of variable xj into scores ti, thathave exceeded the threshold value [4]:
CTði; jÞ ¼ tixjPij
r2ið5Þ
The contribution of variable xj to statistics Q [9] is given byformula:
CQð jÞ ¼ ðxj � x̄jÞ2 ð6Þ
To build the fuzzy diagnostic model for identification ofcomposite process faults that involves changes of largenumber of variables, it is necessary to employ the fuzzificationof expert knowledge of abnormal situations. Fuzzification canbe carried out in a variety of ways [20]. Each situation isrepresented by a fuzzy set A(ui), where ui are the elements ofuniversal set U. The universal set U includes all possibleconditions (symptoms) ui (ui∈U) as its elements. The degreesof symptom development in the given situation (membershipfunctions μS(ui)) are in the left parts of rules of DM. Thus, thesituation for each production rule is described in DM byvector S⁎=(s1⁎, s2⁎,…sJ⁎) with elements si⁎=μS⁎ (ui⁎) thatreflect the “ideal” development of symptoms for a given faultin opinion of the experts.
The current (actual) process situation is described by vectorS= (s1, s2,… sJ) formed by measured values of symptoms. Therule is triggered by fulfillment of all conditions in its left part(presence of all symptoms that are taken into account by agiven rule). In this case, the situation described by that rule isconsidered to take place and the controls contained in the rightpart of this rule should be implemented. But in practicematching the vectors S⁎ and S is frequently incomplete andwe can talk about some degree of certainty in the inferenceCF≤1.
Values of the linguistic variables that describe the develop-ment of symptoms of abnormal situations can be represented byintervals on the appropriate scales, so μS(ui) can be determinedby comparison of values of symptoms with this scale [21]. Atypical scale of such representation for some variable(parameters of the technological process, translated beforehandto dimensionless form and scaled in interval [0,1]) is shown in
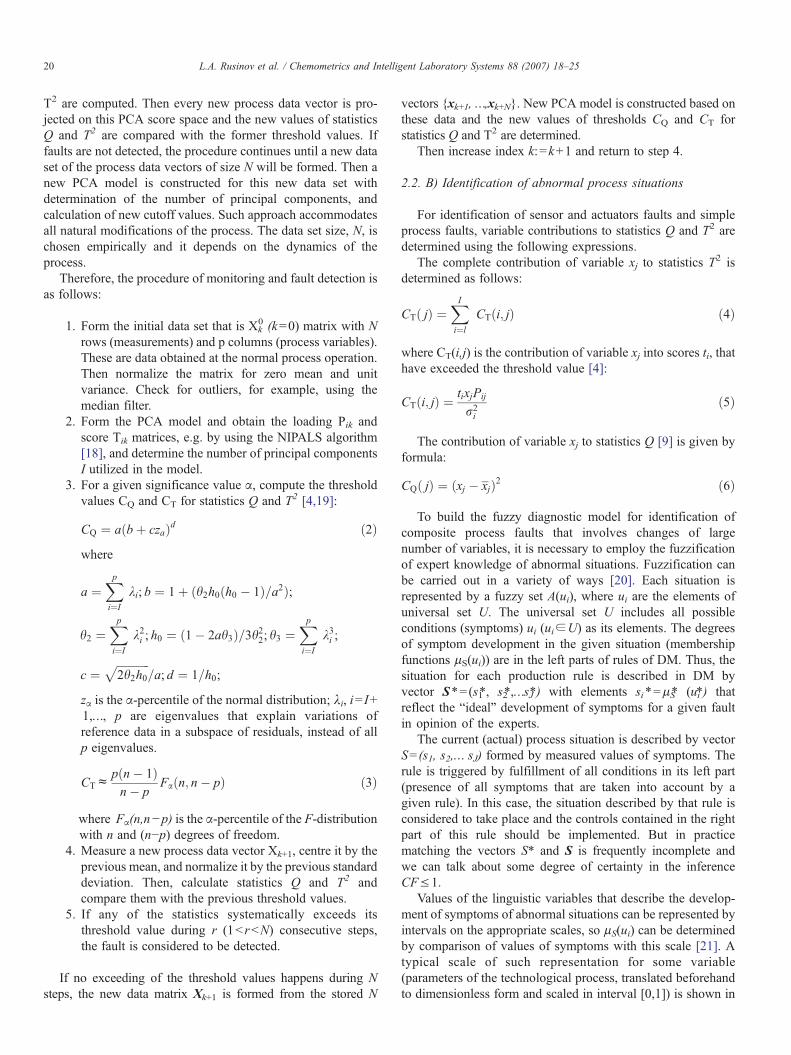
Fig. 2. Links of the process features with units of diagnostic model.
21L.A. Rusinov et al. / Chemometrics and Intelligent Laboratory Systems 88 (2007) 18–25
Table 1. Naturally the boundaries of intervals in the scale can bechanged by user.
The following two criteria for estimation of similarity ofsituations were chosen after investigation as the most perspective[15,16,21,22]:
1. Criterion SM1. The modified criterion with Euclideandistance.
SMðS; S⁎Þ ¼ 11þ dðS; S⁎Þ �
dðS; S⁎Þ2
ð7Þ
where dðS; S⁎Þ ¼ffiffiffiffiffiffiffiffiffiffiffiffiffiffiffiffiffiffiffiffiffiffiffiffiffiffiffiffiffiffiP
j gjðsj � s⁎j Þ2JP
j gj
s, J is the number of para-
meters in a precondition of a rule, γj is the weightingcoefficients determined, for example, from experts’ranking of symptoms for the given fault.
2. Criterion SM4. The inner product of vectors S and S⁎.
SMðS; S⁎Þ ¼
Xj
ðsjds⁎j Þ1=gj
maxXj
ðsjdsjÞ1=gj ;Xj
ðs⁎j d s⁎j Þ1=gj ! ð8Þ
The weighting coefficients underline the importance of thisor that symptom for identification of a given situation.
As it is mentioned above, the decomposition of the processinto a number of simpler structural units is employed for sim-plification and better transparency of results of faults localiza-tion. Then, each chosen structural process unit is described inDM by its separate root frame that joins the commoninformation on the situations at this segment of the complexprocess [23].
The abnormal situations that can arise in this part of theprocess are described by the daughter frames subordinated tothe root frame (Fig. 2). The daughter frames contain thedatabase of fuzzy production rules that describe the concretefaults and their causes. The rules are represented by matrices ofvalues of membership functions of symptoms in the givensituation and corresponding weighting coefficients describingimportance of jth symptom for diagnosing of the fault, definedby lth production rule.
As a result, the procedure of fault identification includes thefollowing steps:
1. After detection of a fault, the root frame that contains astructural unit where a fault happened, is activated. Then the
Table 1The scale for quantitative representation of fuzziness
Fuzzy value Interval Fuzzy value Interval
Very strongly high 0.90–1.00 Reduced 0.30–0.44Strongly high 0.80–0.89 Low 0.20–0.29High 0.70–0.79 Strongly low 0.10–0.19Heightened 0.55–0.69 Very strongly low 0.00–0.09Mean (normal) 0.45–0.54
fuzzy vector of symptoms of the current situation iscompared to the vectors of matrix of cause– effect relationsand the appropriate daughter frame DM is activated.
2. Using one of the above stated criteria for estimation ofsimilarity of situations, the current and reference situations inthe rules of the daughter frame are matched.
3. The results of matching (value of criteria) are compared tothe threshold values defined empirically. The cycle isrepeated until the threshold is exceeded in several consec-utive cycles.
The values of estimates of similarity of the competitivesituations (which have been grouped together in the daughterframe) describe a degree of confidence CF of the diagnosticsystem in the fact that the given fault takes place. These valuesare returned to a process operator along with recommendationsfor elimination of the recognized abnormal situation extractedfrom right parts of the rules.
3. Case study
The case study for the proposed methods of detection andidentification of abnormal situations was carried out on theprocess of the high-pressure polyethylene production [22],specifically, on the block of the reactor of polymerizationchosen as a result of process decomposition. The block isdescribed by the root frame with three daughter frames relatedto the faults in thermal conditions of the reactor, problems ofheat removal, and increase of loading on the agitator motor.Three groups of contingencies can arise at the block caused by10 different reasons in opinion of the experts. The operation ofthe block is controlled by 15 process variables (about 20diagnostic indices), and some of them are included into thecontrol loops. The evaluation of the method was carried out bysimulation using the simplified mathematical model of thereactor block.
The abnormal situation «Overheat of agitator motor» causedby two reasons (competing situations S3 and S4) was selectedfor study of the method from all possible abnormal situationsthat can appear at the block:
S3. If temperature of agitator motor shaft Heightened TE/DN0.6; γ=0.7 & current in the agitator motor High IE/DN0.75; γ=0.8 & temperature of gas at the reactor input
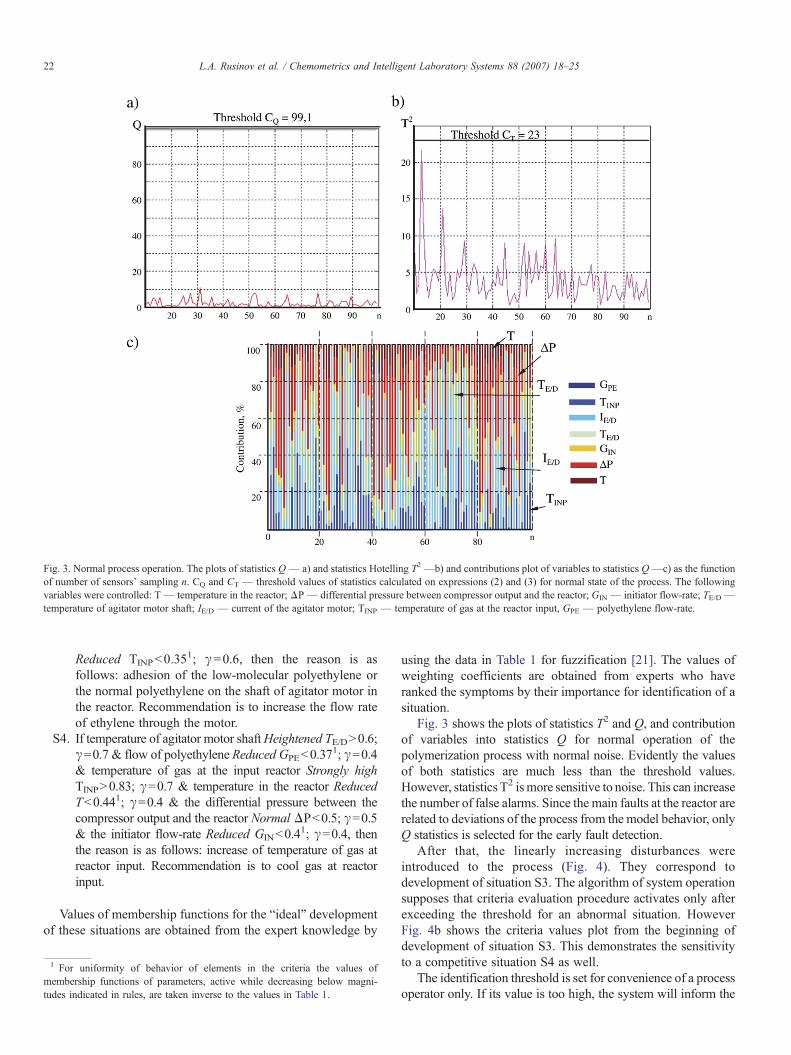
Fig. 3. Normal process operation. The plots of statistics Q— a) and statistics Hotelling T2 —b) and contributions plot of variables to statistics Q—c) as the functionof number of sensors’ sampling n. CQ and CT — threshold values of statistics calculated on expressions (2) and (3) for normal state of the process. The followingvariables were controlled: T— temperature in the reactor; ΔP— differential pressure between compressor output and the reactor; GIN — initiator flow-rate; TE/D —temperature of agitator motor shaft; IE/D — current of the agitator motor; TINP — temperature of gas at the reactor input, GPE — polyethylene flow-rate.
22 L.A. Rusinov et al. / Chemometrics and Intelligent Laboratory Systems 88 (2007) 18–25
Reduced TINPb0.351; γ=0.6, then the reason is as
follows: adhesion of the low-molecular polyethylene orthe normal polyethylene on the shaft of agitator motor inthe reactor. Recommendation is to increase the flow rateof ethylene through the motor.
S4. If temperature of agitator motor shaftHeightened TE/DN0.6;γ=0.7 & flow of polyethylene Reduced GPEb0.37
1; γ=0.4& temperature of gas at the input reactor Strongly highTINPN0.83; γ=0.7 & temperature in the reactor ReducedTb0.441; γ=0.4 & the differential pressure between thecompressor output and the reactor Normal ΔPb0.5; γ=0.5& the initiator flow-rate Reduced GINb0.4
1; γ=0.4, thenthe reason is as follows: increase of temperature of gas atreactor input. Recommendation is to cool gas at reactorinput.
Values of membership functions for the “ideal” developmentof these situations are obtained from the expert knowledge by
1 For uniformity of behavior of elements in the criteria the values ofmembership functions of parameters, active while decreasing below magni-tudes indicated in rules, are taken inverse to the values in Table 1.
using the data in Table 1 for fuzzification [21]. The values ofweighting coefficients are obtained from experts who haveranked the symptoms by their importance for identification of asituation.
Fig. 3 shows the plots of statistics T2 and Q, and contributionof variables into statistics Q for normal operation of thepolymerization process with normal noise. Evidently the valuesof both statistics are much less than the threshold values.However, statistics T2 ismore sensitive to noise. This can increasethe number of false alarms. Since the main faults at the reactor arerelated to deviations of the process from the model behavior, onlyQ statistics is selected for the early fault detection.
After that, the linearly increasing disturbances wereintroduced to the process (Fig. 4). They correspond todevelopment of situation S3. The algorithm of system operationsupposes that criteria evaluation procedure activates only afterexceeding the threshold for an abnormal situation. HoweverFig. 4b shows the criteria values plot from the beginning ofdevelopment of situation S3. This demonstrates the sensitivityto a competitive situation S4 as well.
The identification threshold is set for convenience of a processoperator only. If its value is too high, the system will inform the
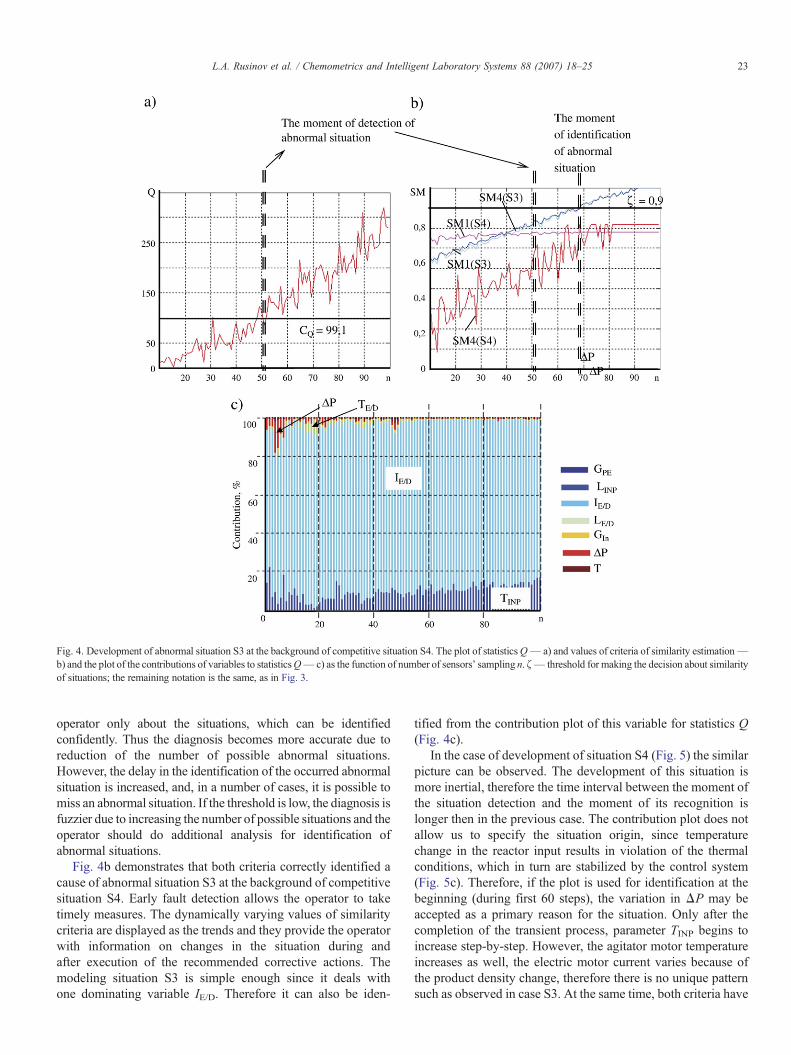
Fig. 4. Development of abnormal situation S3 at the background of competitive situation S4. The plot of statisticsQ— a) and values of criteria of similarity estimation—b) and the plot of the contributions of variables to statisticsQ— c) as the function of number of sensors' sampling n. ζ— threshold for making the decision about similarityof situations; the remaining notation is the same, as in Fig. 3.
23L.A. Rusinov et al. / Chemometrics and Intelligent Laboratory Systems 88 (2007) 18–25
operator only about the situations, which can be identifiedconfidently. Thus the diagnosis becomes more accurate due toreduction of the number of possible abnormal situations.However, the delay in the identification of the occurred abnormalsituation is increased, and, in a number of cases, it is possible tomiss an abnormal situation. If the threshold is low, the diagnosis isfuzzier due to increasing the number of possible situations and theoperator should do additional analysis for identification ofabnormal situations.
Fig. 4b demonstrates that both criteria correctly identified acause of abnormal situation S3 at the background of competitivesituation S4. Early fault detection allows the operator to taketimely measures. The dynamically varying values of similaritycriteria are displayed as the trends and they provide the operatorwith information on changes in the situation during andafter execution of the recommended corrective actions. Themodeling situation S3 is simple enough since it deals withone dominating variable IE/D. Therefore it can also be iden-
tified from the contribution plot of this variable for statistics Q(Fig. 4c).
In the case of development of situation S4 (Fig. 5) the similarpicture can be observed. The development of this situation ismore inertial, therefore the time interval between the moment ofthe situation detection and the moment of its recognition islonger then in the previous case. The contribution plot does notallow us to specify the situation origin, since temperaturechange in the reactor input results in violation of the thermalconditions, which in turn are stabilized by the control system(Fig. 5c). Therefore, if the plot is used for identification at thebeginning (during first 60 steps), the variation in ΔP may beaccepted as a primary reason for the situation. Only after thecompletion of the transient process, parameter TINP begins toincrease step-by-step. However, the agitator motor temperatureincreases as well, the electric motor current varies because ofthe product density change, therefore there is no unique patternsuch as observed in case S3. At the same time, both criteria have

Fig. 5. Development of abnormal situation S4 at the background of competitive situation S3. The plot of statisticsQ— a) and values of criteria of similarity estimation—b) and the plot of the contributions of variables to statistics Q — c) as the function of number of sensors' sampling n. Notation is the same, as in Figs. 3 and 4.
24 L.A. Rusinov et al. / Chemometrics and Intelligent Laboratory Systems 88 (2007) 18–25
confidently recognized the development of situation S4 at thebackground of competitive situation S3.
4. Conclusion
The composite method for detection and identification ofabnormal situations that can arise at potentially dangerous andhazardous technological processes is proposed.
The detection of origin of an abnormal situation is made bythe continuous monitoring of the process on the base of modifiedmoving PCA by tracking the behavior of statistics Hotelling T2
and Q. The identification of failures of sensors and actuators iscarried out by usual method by analysis of contribution plots ofeach variable in the faulty statistics. However identification ofcomplicated situations accompanying with changing of manyvariables is carried out by estimation of similarity of currentprocess situation with its reference patterns represented as thefuzzy sets. The reference patterns of abnormal situations withweighting coefficients for improving the effectiveness of iden-tification are determined on the basis of the experts' knowledge.
The evaluation of the suggested method on the process ofpolymerization in production of high-pressure polyethylene hasshown its effectiveness.
References
[1] V. Venkatasubramanian, R. Rengaswamy, K. Yin, S.N. Kavuri, Computersand Chemical Engineering 27 (2003) 293–311.
[2] I. Nimmo, Chemical Engineering Progress 91 (1995) 36–45.[3] Y. Qian, X. Li, Y. Jiang, Y. Wen, Expert Systems with Applications 24
(2003) 425–432.[4] Q. Yang, Model-based and data driven fault diagnosis methods with
applications to process monitoring. Thesis for the degree of Doctor ofPhilosophy, Case Western Reserve University, 2004, p.203.
[5] S. Wang, J. Cui, Applied Energy 82 (2005) 197–213.[6] M.A. Kramer, R. Fjellheim, AIChE 92 (1996) 12–24.[7] R. Iserman, Control Engineering Practice 5 (1997) 639–652.[8] V. Venkatasubramanian, R. Rengaswamy, K. Yin, S.N. Kavuri, Computers
and Chemical Engineering 27 (2003) 327–346.[9] S. Narasimhan, A.K. Tangirala, Proc. CEPWorkshop on Multivariate Data
Analysis Techniques and Applications, July 22, 2005.[10] R. Luo, M. Misra, D.M. Himmelblau, Industrial & Engineering Chemistry
Research 38 (1999) 1489–1495.
25L.A. Rusinov et al. / Chemometrics and Intelligent Laboratory Systems 88 (2007) 18–25
[11] T. Segawa,M. Kano, H. Ohno, S. Hasebe, I. Hashimoto, Proc. of Int. Symp.on Design Operation and Control of Next Generation Chemical Plants,(PSE Asia 2000), 6–8 Dec. 2000, Kyoto, Japan, 2000, pp. 345–350.
[12] E.L. Russell, L.H. Chiang, R.D. Braatz, Data-Driven Techniques for FaultDetection and Diagnosis in Chemical Processes, Springer-Verlag, London,2000.
[13] J.P. Lopes, J.C. Menezes, Foundations of Computer Aided ProcessOperations – FOCAPO98, Snowbird, Utah (USA), July 1998, pp. 391–396.
[14] L.A. Rusinov, G.D. Panov, N.A. Chistyakov, Ecological Chemistry 5(1997) 339–343 (In Russian).
[15] A.L.Dexter,M.Benouarets, IEEE trans. on Systems,Man andCybernetics—Pt.A 27 (1997) 673–680.
[16] D.S. Yeung, E.C. Tsang, Fuzzy Sets and Systems 88 (1997) 299–313.[17] M. Kano, H. Ohno, S. Hasebe, I. Hashimoto, Computers & Chemical
Engineering 24 (2000) 175–181.
[18] K.H. Esbensen, Multivariate data analysis – in practice, CAMO, Oslo,2000, p. 598.
[19] Y. Li, Z.Xie, D.H. Zhou, Journal of Chemical Engineering of Japan 37 (2004)514–522.
[20] S.G. Tzafestas (Ed.), Fuzzy rezoning in information decision and controlsystems, Kluwer, London, 1994, p. 567.
[21] S.M. Chen, IEEE Transactions on Systems, Man, and Cybernetics SMC-18 (1988) 1012–1016.
[22] L.A. Rusinov, I.V. Rudakova, Automation andModern Technology 7 (2003)30–36 (In Russian).
[23] L. Rusinov, V. Holodnov, G. Panov, in: F. Breitenecker (Ed.), Proc. of 2ndIMACS Symposium on mathematical modeling. I.Troch, Vienna, Austria,February 5–7 1997, pp. 103–109.