Process design, simulation and optimization of Acrolein ...
79
Process Design, Simulation and Optimization of Acrolein Production from Bioglycerol Undergraduate Thesis Yury Andrea Castañeda López Cód. 201210034004 Advisor: Santiago Builes, Ph.D Co-Advisor: Diego Acosta, Ph.D EAFIT University Engineering School Department of Process Engineering Medellín, Colombia 2016
Transcript of Process design, simulation and optimization of Acrolein ...
Process Design, Simulation and Optimization of Acrolein Production from Bioglycerol
Undergraduate Thesis
Yury Andrea Castañeda López
Cód. 201210034004
Advisor: Santiago Builes, Ph.D
Co-Advisor: Diego Acosta, Ph.D
EAFIT University
Engineering School
Department of Process Engineering
Medellín, Colombia
2016

Table of contents
1. Introduction .................................................................................................................... 1
1.1. Crude glycerol valorization ..................................................................................... 1
1.2. Acrolein from crude glycerol ................................................................................... 2
1.3. Catalysts to improve acrolein production ................................................................ 4
1.4. Acrolein market ....................................................................................................... 5
1.5. Design of an acrolein process .................................................................................. 5
2. Methodology ................................................................................................................... 6
2.1. Project Design Specification (PDS) ......................................................................... 6
2.2. Conceptual Design Package ..................................................................................... 6
2.3. Simulation ................................................................................................................ 7
2.4. Process Optimization ............................................................................................... 9
3. Results .......................................................................................................................... 10
3.1. Base case ................................................................................................................ 10
3.1.1. Conceptual design package ............................................................................ 11
3.1.1.1. Input/output diagram ............................................................................... 11
3.1.1.2. Equipment and plant costing ................................................................... 12
3.1.1.3. Process flow diagrams and equipment specification............................... 13
3.1.2. Simulation ....................................................................................................... 16
3.1.3. Economic evaluation ...................................................................................... 18
3.2. Optimized case ....................................................................................................... 19
3.2.1. Reactor length ................................................................................................. 19
3.2.2. Operating conditions of the reactor ................................................................ 19
3.2.3. Sensitivity analysis ......................................................................................... 20
3.2.3.1. Temperature distillation column K-3 ...................................................... 20
3.2.3.2. Temperature distillation column K-4 ...................................................... 21
3.2.3.3. Temperature distillation column K-5 ...................................................... 21
3.2.4. Optimal parameters......................................................................................... 22
3.2.5. Optimized case design and plant costing ........................................................ 22
3.2.6. Economic evaluation ...................................................................................... 23

4. Conclusions .................................................................................................................. 25
References ............................................................................................................................ 26
Appendix A. Project design specifications (PDS) ............................................................... 30
Appendix B. Process diagrams ............................................................................................ 38
Appendix C. Specification data sheets ................................................................................ 43
Base case........................................................................................................................... 43
Optimized case ................................................................................................................. 58
Appendix D. Equipment and plant costing .......................................................................... 68
Base Case .......................................................................................................................... 68
Optimized Case ................................................................................................................ 70
Appendix E. Economic evaluation data .............................................................................. 71
Base Case .......................................................................................................................... 71
Optimized Case ................................................................................................................ 72
Appendices references .......................................................................................................... 73

List of Tables
Table 1. Kinetic parameters of glycerol dehydration reactions [7] ....................................... 8
Table A1. Physicochemical properties of raw material and principal products .................. 30
Table A2. Glycerol composition [69] .................................................................................. 31
Table A3. Physicochemical characteristics of catalysts [27] .............................................. 31
Table A4. United Nations recommendations on the transport of dangerous goods for acrolein
[76] ....................................................................................................................................... 33
Table A5. United Nations recommendations on the transport of dangerous goods for
acetaldehyde [76] .................................................................................................................. 33
Table A6. General information about Santa Marta ............................................................. 34
Table A7. Main places in Colombia where Biodiesel from Palm is produced [83] ............ 35
Table A8. Applicable laws and resolutions in Colombia .................................................... 36
Table C1. Specification data sheet for saponification reactor (C-1) ................................... 43
Table C2. Specification data sheet for decanter (F-1) ......................................................... 44
Table C3. Specification data sheet for neutralization reactor (C-2) .................................... 45
Table C4. Specification data sheet for filter (F-2) ............................................................... 46
Table C5. Specification data sheet for distillation column (K-1) ........................................ 47
Table C6. Specification data sheet for packed bed reactor (C-3) ........................................ 48
Table C7. Specification data sheet for compressor (V-1) ................................................... 49
Table C8. Specification data sheet for fixed tube heat exchanger or cooler (W-4) ............ 50
Table C9. Specification data sheet for flash separator (K-2) .............................................. 51
Table C10. Specification data sheet for absorption column (F-3) ....................................... 52
Table C11. Specification data sheet for distillation column (K-3) ...................................... 53
Table C12. Specification data sheet for distillation column (K-4) ...................................... 54
Table C13. Specification data sheet for azeotropic distillation column (K-5) .................... 55
Table C14. Specification data sheet for distillation column (K-6) ...................................... 56
Table C15. Specification data sheet for fixed tube heat exchanger or cooler (W-9) .......... 57
Table C16. Specification data sheet for packed bed reactor (C-3) ...................................... 58
Table C17. Specification data sheet for compressor (V-1) ................................................. 59
Table C18. Specification data sheet for fixed tube heat exchanger or cooler (W-4) .......... 60
Table C19. Specification data sheet for flash separator (K-2) ............................................ 61
Table C20. Specification data sheet for absorption column (F-3) ....................................... 62
Table C21. Specification data sheet for distillation column (K-3) ...................................... 63
Table C22. Specification data sheet for distillation column (K-4) ...................................... 64
Table C23. Specification data sheet for azeotropic distillation column (K-5) .................... 65
Table C24. Specification data sheet for distillation column (K-6) ...................................... 66
Table C25. Specification data sheet for fixed tube heat exchanger or cooler (W-9) .......... 67

Table D1. Cost of products 68
Table D2. Total cost of raw materials for the base case design 68
Table D3. Bare module costs in 2015 for the equipment in the base case design 68
Table D4. Cost of the operating labor for the base case design 69
Table D5. Utility costs calculation data for the base case design 69
Table D6. Cost of products 70
Table D7. Bare module costs in 2015 for the equipment in the optimized case design 70
Table D8. Cost of the operating labor for the optimized case design 70
Table D9. Utility costs calculation data for the optimized case design 71
Table E1. Initial data for the calculation of the cash flow statement for the base case design
.............................................................................................................................................. 71
Table E2. Cash flow statement for the base case plant design for the production of acrolein
.............................................................................................................................................. 72
Table E3. Initial data for the calculation of the cash flow statement for the optimized case
design .................................................................................................................................... 72
Table E4. Cash flow statement for the optimized case plant design for the production of
acrolein ................................................................................................................................. 73

1
1. Introduction
1.1. Crude glycerol valorization
Due to globalization, the chemical industry has increased consumption of fossil resources to
meet the needs of the rising demand, correlated to world population [1]. Therefore,
greenhouse gases and pollutants emissions have increased continuously. It is necessary
therefore to produce energy and substances from renewable resources. This will allow to
reduce emissions and to decrease dependence on non-renewable resources. Much attention
has being paid to replacing fossil fuels and reduce carbon dioxide emissions by using
renewable fuels such as bioethanol and biodiesel, for the production of energy and chemicals
[2].
Bioethanol can be produced by fermentation of sugars, starch crop or lignocellulosic
biomass, which includes agricultural residues, herbaceous crops, forestry wastes, wastepaper,
and other residues [3]. The energy content of ethanol is higher than the energy required to
produce ethanol [4-5]. Thus, it has the potential to be a sustainable transportation fuel, as
well as a fuel oxygenate that can replace gasoline [3]. Biodiesel is a diesel fuel made from
renewable sources such as vegetable oils and animal fats by transesterification with alcohols
[6]. Its production generates approximately 10% by volume of glycerol as a by-product.
Glycerol obtained from transesterification of oils has several impurities that need to be
removed by different separation processes to produce pure glycerol [7]. Crude glycerol costs
US $150 /metric ton [8] whereas pure glycerol costs US $600/metric ton [9].
Different processes have been proposed for valorization of bioglycerol for instance:
Hydrogenolysis of glycerol to produce propane diols [10] such as 1,3 propanediol, which
is a simple organic chemical with a wide variety of applications in polymers, foods,
cosmetics, lubricants and medicines [11].
Polymerization of glycerol to obtain diglycerol (DG), which is a useful compound for
food, cosmetic and chemical applications [12].
Etherification of glycerol to produce ethers, in particular, tert-butyl ether which is
considered promising as an oxygenated additive for diesel fuels[13]
Steam reforming, partial oxidation or auto- thermal reforming of glycerol to produce fuels
as hydrogen [11].
Acetylation of glycerol to produce esters [14].
Dehydration of glycerol to produce specialty chemicals, like acrolein; precursors of
materials, such as polyesters and polyethers [11].
In Colombia different research groups have studied valorization of bioglycerol to produce
different chemical products, such as methyl esters [15], ethanol [16], poly-3-hydroxybutyrate
[17].

2
Acrolein is produced industrially by the oxidation of petroleum-derived propylene with a
Bi/Mo-mixed oxide catalyst at 300–450 °C [18]. However, acrolein can also be produced by
catalytic dehydration (heterogeneous or homogeneous) of glycerol at high temperatures. In
this process glycerol loses water to produce acrolein. Different processes have been proposed
for dehydration of bioglycerol: dehydration in the presence of a catalyst [7], gas-phase
dehydration with heteropoly salts as catalysts [19], dehydration in sub and supercritical water
conditions [18] and low-pressure packed-bed gas-phase dehydration [20]. In this work, the
dehydration in presence of a porous solid catalyst will be considered for the simulation and
design of the acrolein production plant. A heterogeneous catalysis will be chosen due to the
feasibility to separate the catalyst from reaction mixture in a straightforward manner by
physical methods and a higher selectivity in comparison to a homogeneous catalysis [10].
1.2. Acrolein from crude glycerol
In order to produce commercial acrolein from crude glycerol, glycerol purification and
dehydration steps are required. The latter consists of two main operations: reaction and
purification. This, involves a series of separation processes to obtain highly pure acrolein.
A sketch of the simplified process diagram is shown below (Figure 1).
Figure 1. Simplified diagram of acrolein production process
The first step of the process is the purification of crude glycerol because it contains a series
of remnant impurities from biodiesel production, such as water, ashes, soap, methanol and
salts. Each one of these impurities requires a specific unit operation for its removal. Ashes
can be separated by filtration, salts are removed employing membranes, methanol is
separated by distillation and soap particles are removed by addition of a flocculant [7].
The dehydration section to produce acrolein consists of a packed bed reactor with a zeolite
MFI as catalyst industrially available from BASF or ACS Material [21]. The main reactions
that occur in the process are:
(1)
(2)

3
(3)
(4)
In reaction 1, glycerol dehydrates, to produce Acrolein ( C3H4O) and water. Undesirable
products such as: hydrogen, carbon monoxide, ethylene, water and acetaldehyde are also
produced (reactions 2-4). Therefore, further purification and separation steps are required to
obtain the final products. A general representation of this process is shown in Figure 2.
Figure 2. Acrolein production process
Usually, the first separation unit is an absorption column used to separate hydrogen, carbon
monoxide and hydrocarbon gases from the liquid phase and a reboiler absorption column
eliminated water content. Then, a distillation column is used to separate acetaldehyde from
the heavier liquids. A second distillation column is used to separate an aqueous solution of
acrolein using glycerol as entrainer. Refined acrolein is obtained on the distillate and a
glycerol solution is obtained at the bottoms, which are connected to a third distillation column
in order to split water and glycerol and recycle the latter to the second distillation column [7].
In this process besides acrolein as a main product, acetaldehyde is also obtained.
Acetaldehyde at high purity is obtained at the first distillation column. Acetaldehyde is
produced industrially by oxidation of ethylene [22]. It is a feedstock used in the production
of perfumes, polyester resins, basic dyes, solvents for different industries (rubber, tanning,
and paper), preservatives for fruits and fishes, flavoring agents, gelatin hardeners and
denaturants for alcohol [23]. The global market for acetaldehyde has been trending
downward for the past twenty years as a result of the commercialization of more efficient
technologies to synthesize products formerly based on acetaldehyde [24]. In 2012, the global
production for acetaldehyde was 1,3 MM tons [25].

4
High purity acrolein obtained from the second distillation column is the simplest unsaturated
aldehyde. It has high synthetic and technical potential due to the conjugation of the carbonyl
group with a vinyl group. Acrolein is employed as biocide due to its antimicrobial activity
and refined acrolein is mainly used for the production of methionine [1].
1.3. Catalysts to improve acrolein production
The conversion of glycerol to acrolein requires the use of a solid catalyst. Several catalysts
have been used, with different conversions of glycerol and selectivity towards acrolein.
Markočič et al. [26] decomposed glycerol at super critical conditions in the gas-phase in
presence of a heteropoly catalyst, mainly alkali compounds, to obtain chemical intermediates,
mainly acrolein. They showed that the conversion for dilute feed solutions of glycerol in
supercritical water increased with temperature and reaction time. The pressure and the initial
concentration of glycerol increased the yield of acrolein using the heteropoly catalyst until
the decomposition reaction (Equations 2 and 3) where acrolein decreased in absence of
glycerol. Alhanash et al. [19] studied glycerol conversion to acrolein using Caesium 12-
tungstophosphate (CsPW) as catalyst. The reaction products consisted mainly of acrolein.
They showed that CsPW is an active catalyst for the dehydration of glycerol to acrolein, with
a glycerol conversion of 100% and acrolein selectivity of 98%. However, the catalytic
activity decreased significantly with reaction time. Corma and collaborators [27] produced
acrolein from gas-phase glycerol/water mixtures with zeolite MFI. They showed that
dehydration of glycerol at 350 °C on a zeolite-based catalyst in a moving-bed reactor can be
used to produce acrolein and other oxygenated chemicals, such as acetaldehyde and acetone.
Cecilia et al. [28] showed that the dehydration of glycerol can be activated in presence of
vanadium doped mesoporous SBA-15 to produce acrolein at 325°C after 2 h with 80-93% of
glycerol conversion and acrolein yield of 26%. Dalil et al. [29] obtained 73% of acrolein
selectivity after 6 h on steam from dehydration of glycerol in presence of WO3/TiO2 at 280°C.
They reported that acrolein selectivity increased with an increase in coke formation. HSiW
supported on Al2O3 was used as a catalyst by Lui et al [30] Acrolein selectivity was 75% at
300°C after 2 h on steam. Yan and Supples [31] studied low pressure packed-bed gas-phase
dehydration of glycerol in presence of H3PO4/activated carbon and various solid acid
catalysts prepared by wet impregnation of commercial α-Al2O3. They showed that acrolein
selectivity was 84% at 260°C and 0,85 bar. Zhang et al. [32] dehydrated glycerol on MFI
based zeolites using various MFI zeolites with different Si/Al ratios; the optimal conditions
were found for Si/Al ratios between 34-38 with a glycerol conversion of 100% and acrolein
selectivity of 86% after 2h.
The use of solid catalysts improves acrolein selectivity and conversion for the dehydration
of glycerol. Moreover, the product distribution can change dramatically depending on the
choice of catalyst. The different catalysts studied offer many possibilities to obtain high
yields. In particular, zeolite MFI due to its large surface area and sufficient acid sites, [27]
(i.e. the active site for the conversion of glycerol), minimizes the production of acetaldehyde
and maximizes the production of acrolein [27,32]. In this work zeolite MFI is chosen as the
catalyst for the dehydration reactions of glycerol. In Table A3 are shown the physico-
chemical characteristics of MFI used for the conceptual design and simulations.

5
1.4. Acrolein market
Approximately 350.000 ton of acrolein are produced annually worldwide, mainly in USA,
China, Japan and EU [33-34]. The main uses of acrolein are:
An intermediate for the synthesis of both acylic and acrylic acid esters [11]
As a slimicide in the manufacture of paper [11]
As a biocide for controlling microorganisms in water used in oil fracking and production
systems [35].
As feedstock, for treatment of fibers and production of chemicals, like acrylic acid, esters
and medicines.
Growth control agent of microbes in food process lines due to its antimicrobial activity
[36].
Acrolein is rarely sold as a commodity in large amounts in the open market. This product is
often used immediately after synthesis for the manufacture of other chemicals due to its
instability and safety hazards [37]. Nevertheless, it is also possible to use hydroquinone to
stabilize acrolein [38], therefore the packing and labelling are important things to considered
in the economic analysis; however, there were not taking into account due to those data do
not modified the optimization of the acrolein production process proposed in this project.
Although Colombia, does not manufacture acrolein, from January 2016 to May 2016
Firmenich S.A and Colorquímica S.A conducted fifty eight transactions related to the
purchase of 200 ton of acrolein or products obtained from it [39].
In 2015, 600 million liters of biodiesel were produced in Colombia [40] where for every liter
of biodiesel produced, 0,1 L of glycerol is produced.
1.5. Design of an acrolein process
Posada Duque [36] proposed a conceptual design and simulation of a plant for acrolein
production using H2SO4 as a homogeneous catalyst. The dehydrogenation reaction took
place at 275°C and 1 bar. This work considered the acrolein purification after the reaction
to obtain an acrolein stream with 98,5 wt.%. However, this operational requirement
increased the overall manufacture costs. Subsequently Posada et al. [41] studied the
conversion of raw glycerol to nine value-added products including acrolein, using both crude
(88 wt.%) and USP (98 wt.%) grade glycerol. The former required a further refining process
using an ion exchange resin, which removed the triglycerides contained in the mixture.
Dehydration of glycerol to acrolein as an acid catalyzed process was considered using the
reaction scheme reported by Tsukuda et al.[42] in presence of Silicotungstic acid supported
on silica with mesopores of 10 nm. They reported a conversion of 100% and molar yield for
acrolein of 85,2%.
Conversion of crude glycerol to value added products can reduce the cost of biodiesel
production and benefit the biodiesel industry. The main goal of this work is to report and to
evaluate the production of acrolein from crude glycerol in a dehydration plant in Colombia
using MFI as catalyst. This work will contribute to the development of applied research in
renewable energies. This project will also allow the estimation of optimal process conditions

6
for the base case in order to (i) reduce the waste generation, (ii) increase the acrolein
production as the desirable product and (iii) improve the economic indicators with respect to
the base case. The economic viability of a crude glycerol dehydration plant located in
Colombia and acrolein production will be assessed, considering the impacts on the biodiesel
industry and society in general. To the best of our knowledge, a study of this kind has not
been pursued before.
2. Methodology
2.1. Project Design Specification (PDS)
The physicochemical properties of glycerol [9], MFI zeolite [38] and acrolein [43], required
to design the process were obtained from the literature. Information such as: transport
regulations; UN recommendations for transportation of dangerous goods; acrolein and
acetaldehyde market; raw materials availability; applicable laws and health; and hazard
information, were determined in order to identify critical economic conditions,
environmental restrictions and plant location. The market analysis takes into account
national and international consumption of acrolein and acetaldehyde [24, 34] trade indicators
[44] and import and export data [45-46]; for further details see Appendix A.
The plant capacity was calculated taking into account crude glycerol availability in Colombia
(Santa Marta, Barrancabermeja and Meta) [47]. The biodiesel annual production in
Colombia is 600 million L [40] therefore, the crude glycerol annual production is 60 million
L which corresponds approximately to 57.000.000 kg/year of glycerol.
2.2. Conceptual Design Package
The conceptual design package includes the process mass balances and their corresponding
diagrams (In-Out diagram, B.F.D. and P.F.D.), the equipment design and the resulting
equipment data-sheets and the financial analysis. For further details of the conceptual design
package see Turton [48].
The global inputs and outputs, the reaction equations, and the inputs and outputs of every
equipment obtained from the process mass balances were used for the constitution of the In-
Out diagram and the Block Flow Diagram (B.F.D.). The control loops were designed
considering the operating conditions of each equipment, and the physicochemical
information of each stream. The Process Flow Diagram (P.F.D.) was built according to ISO
10628 standard [49]. The sizing of the equipment involved in the process was done according
to heuristics from Walas [50] and the equipment were design using properties and conditions
of the input and output streams obtained from the simulations in Aspen HYSYS.
The equipment required for saponification of fats and neutralization of glycerol are chemical
reactors. However, for simplicity in the calculations, they were considered as agitated
vessels, given that the glycerol purification is a batch process [51].
The design of the distillation columns to purify the products of glycerol dehydration was
performed using a model based on Underwood-Fenske and Gilliland with an algorithm

7
reported by Biegler et al. [51]. The information involving the equipment design is
summarized in the equipment data-sheets using the format suggested by Walas [52] and is
shown in Appendix C.
In the economic analysis the Fixed Capital Investment (FCI), Cost of Operating Labor (COL),
Cost of Utilities (CUT), Cost of Waste Treatment (CWT), Cost of Raw Materials (CRM) and the
Cost of Manufacturing (COM) are performed and calculated using the CEPCI Index from 2011
and updated to 2015 [48]. The profitability of the project was determined using the Internal
Rate of Return (IRR) and the Net Present Value (NPV).
2.3. Simulation
Aspen HYSYS V8.4 [53] was used to simulate the production process. The fluid package
with the best fits for all the streams was extended NRTL for the liquid phase and Peng
Robinson (PR) for the vapor phase. It is an appropriate model for chemical systems that have
different boiling points and when vapor-liquid equilibrium (VLE) and liquid-liquid
equilibrium (LLE) take place. The binary coefficients for both models were estimated using
UNIFAC VLE and UNIFAC LLE, respectively. Simulation results from Aspen HYSYS
were validated using case studies comparing them to experimental data from literature [54-
56].
The glycerol purification process was simulated using mass balances in order to identify how
to remove the crude glycerol impurities. It is important to note that for this stage, the
simulations did not take into account rigorous reactions. The reactors, decanter and filter
were defined as components splitters. The separation steps were specified with the mass
balances. Saponification was carried out in a reactor (C-1) to remove the esters and the output
stream was separated by a decanter (F-1) in order to split the organics and the glycerol phase,
which was fed in a reactor (C-2) to neutralize the salts and favor their removal by filtration
(F-2). Then, the filtrate without salts was fed to a distillation column (K-1) to separate
glycerol from methanol and obtain purified glycerol. The simulation scheme of the process
is shown in Figure 3.
Figure 3. Base case design of the glycerol purification implemented in Aspen HYSYS
To simulate the glycerol dehydration process, a kinetic type reaction was employed because
it does not take into account the mass transfer velocity between the components and the
catalyst. The kinetic parameters, that is, the exponential factor Ai and the activation energy
Ei, are those of the Arrhenius equation as shown in equation 5 and Table 1.
Ki = Ai exp (-Ei/RT) (5)

8
Table 1. Kinetic parameters of glycerol dehydration reactions [7]
The kinetic parameters were estimated using partial pressure, the catalytic density and its
void fraction. These parameters were converted to Aspen HYSYS format using the void
fraction (0,75) and the catalyst density (720 kg/m3). This allowed the conversion of the
reaction rate in terms of weight of the catalyst to volume of the reactor. Reaction 3 was not
considered in the simulation of the system because the produced carbon is a solid that can be
removed from the process before catalyst deactivation occurs.
Glycerol dehydration consists of two main operations: (i) reaction and (ii) purification. The
latter involves a series of separation processes in order to obtain acrolein with a high purity.
The reaction takes place in a plug flow reactor (C-3) and the gas-phase output stream is
compressed with a compressor (V-1) and then cooled (W-4) in order to separate the non-
condensable gases using a separator (K-2) and an absorption column (F-3). The liquid stream
is then fed in a reboiler absorption column (K-3) to eliminate as much water as possible.
Then a distillation column (K-4) is used to separate light compounds (acetaldehyde).
Subsequently, an azeotropic extractive distillation was performed (K-5) adding glycerol as
the solvent that breaks the acrolein-water azeotrope, in this step it was necessary to add a
sub-flowsheet to carry out the LLE separation. Finally, a distillation column (K-6) was
employed to separate glycerol and water, to recycle glycerol to the azeotropic distillation
column. The adjust function was used to avoid glycerol losses in the process. The pressure
losses were not taken into account through the process. It is important to note that shortcut
columns were simulated previously to determine the column trays. A sketch of the process
is shown in Figure 4.
Figure 4. Base case design of the acrolein production implemented in Aspen HYSYS
9
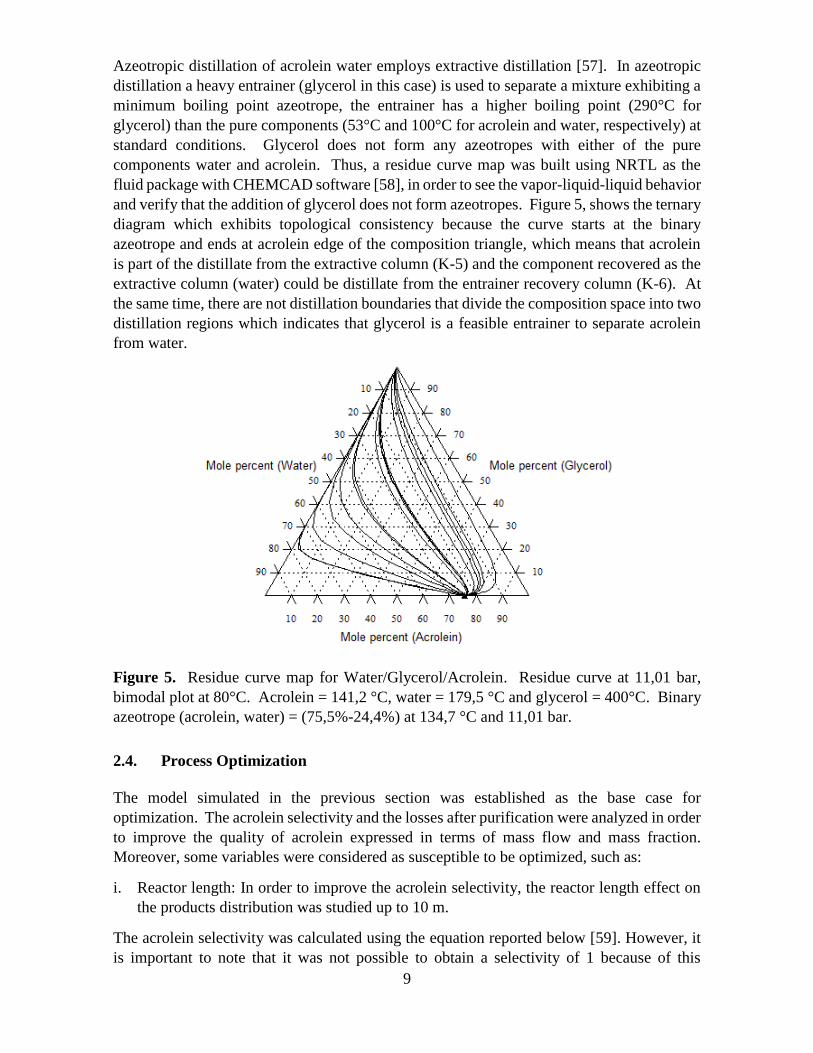
Azeotropic distillation of acrolein water employs extractive distillation [57]. In azeotropic
distillation a heavy entrainer (glycerol in this case) is used to separate a mixture exhibiting a
minimum boiling point azeotrope, the entrainer has a higher boiling point (290°C for
glycerol) than the pure components (53°C and 100°C for acrolein and water, respectively) at
standard conditions. Glycerol does not form any azeotropes with either of the pure
components water and acrolein. Thus, a residue curve map was built using NRTL as the
fluid package with CHEMCAD software [58], in order to see the vapor-liquid-liquid behavior
and verify that the addition of glycerol does not form azeotropes. Figure 5, shows the ternary
diagram which exhibits topological consistency because the curve starts at the binary
azeotrope and ends at acrolein edge of the composition triangle, which means that acrolein
is part of the distillate from the extractive column (K-5) and the component recovered as the
extractive column (water) could be distillate from the entrainer recovery column (K-6). At
the same time, there are not distillation boundaries that divide the composition space into two
distillation regions which indicates that glycerol is a feasible entrainer to separate acrolein
from water.
Figure 5. Residue curve map for Water/Glycerol/Acrolein. Residue curve at 11,01 bar,
bimodal plot at 80°C. Acrolein = 141,2 °C, water = 179,5 °C and glycerol = 400°C. Binary
azeotrope (acrolein, water) = (75,5%-24,4%) at 134,7 °C and 11,01 bar.
2.4. Process Optimization
The model simulated in the previous section was established as the base case for
optimization. The acrolein selectivity and the losses after purification were analyzed in order
to improve the quality of acrolein expressed in terms of mass flow and mass fraction.
Moreover, some variables were considered as susceptible to be optimized, such as:
i. Reactor length: In order to improve the acrolein selectivity, the reactor length effect on
the products distribution was studied up to 10 m.
The acrolein selectivity was calculated using the equation reported below [59]. However, it
is important to note that it was not possible to obtain a selectivity of 1 because of this

10
selectivity definition, therefore, it was intended to obtained a high selectivity as were
possible.
𝑆𝑒𝑙𝑒𝑐𝑡𝑖𝑣𝑖𝑡𝑦 =𝐸𝑥𝑖𝑡 𝑚𝑜𝑙𝑎𝑟 𝑓𝑙𝑜𝑤 𝑟𝑎𝑡𝑒 𝑜𝑓 𝑑𝑒𝑠𝑖𝑟𝑒𝑑 𝑝𝑟𝑜𝑑𝑢𝑐𝑡
𝐸𝑥𝑖𝑡 𝑚𝑜𝑙𝑎𝑟 𝑓𝑙𝑜𝑤 𝑟𝑎𝑡𝑒 𝑜𝑓 𝑢𝑛𝑑𝑒𝑠𝑖𝑟𝑒𝑑 𝑝𝑟𝑜𝑑𝑢𝑐𝑡 (6)
ii. Operating conditions of the reactor: The effect of the reactor’s inlet pressure on selectivity
was analyzed operating the reactor isothermally.
iii. Distillation column temperatures: A sensibility analysis of temperatures was carried out
in order to favor the separation of undesirable products from acrolein. Thereby, for the
distillation columns K-3 and K-4, the reboiler temperatures were studied taking into
account the operating temperatures reported by the simulated shortcuts and the
substances boiling points to achieve the separation at a lower cost. The condenser
temperature of K-5 was also studied in order to break the acrolein-water azeotrope at a
lower cost. The response parameters were acrolein losses after distillation columns and
utility costs.
Acrolein losses for the distillation columns were calculated according to the following
equation:
𝐴𝑐𝑟𝑜𝑙𝑒𝑖𝑛 𝑙𝑜𝑠𝑠𝑒𝑠 =𝐹𝑒𝑒𝑑 𝑐𝑜𝑙𝑢𝑚𝑛 𝑡𝑜𝑡𝑎𝑙 𝑚𝑜𝑙𝑎𝑟 𝑓𝑙𝑜𝑤−𝑑𝑖𝑠𝑡𝑖𝑙𝑙𝑎𝑡𝑒 𝑐𝑜𝑙𝑢𝑚𝑛 𝑡𝑜𝑡𝑎𝑙 𝑚𝑜𝑙𝑎𝑟 𝑓𝑙𝑜𝑤
𝐹𝑒𝑒𝑑 𝑐𝑜𝑙𝑢𝑚𝑛 𝑡𝑜𝑡𝑎𝑙 𝑚𝑜𝑙𝑎𝑟 𝑓𝑙𝑜𝑤 (7)
The data from the design and economic evaluation implemented in an Excel spreadsheet was
synchronized with the data simulated in Aspen HYSYS to identify the operating conditions,
temperature, at the lowest utility cost, low pressure steam or cooling water.
3. Results
3.1. Base case
The complete PDS is reported in Appendix A. Santa Marta, Colombia was chosen as the for
the location due to the availability of raw materials, logistics, port infrastructure and the free
trade zone of Santa Marta. Although acrolein production is not regulated directly, several
agencies develop guidelines for hazardous chemicals using occupational exposure levels
(OELs) [60].
The production plant was designed for an acrolein production of 4000 tons/year which are
higher than the entire supply for the national market. Moreover, the international market
might be composed by Venezuela and Honduras [45-46]. See details in Appendix A.
11
3.1.1. Conceptual design package
The conceptual design package includes the process diagrams (In-Out diagram and P.F.D.),
the equipment design and the resulting equipment data-sheets and the financial analysis. The
B.F.D. and the enlarged view of the P.F.D. for the glycerol purification and acrolein
production processes can be found the Appendix B.
3.1.1.1. Input/output diagram
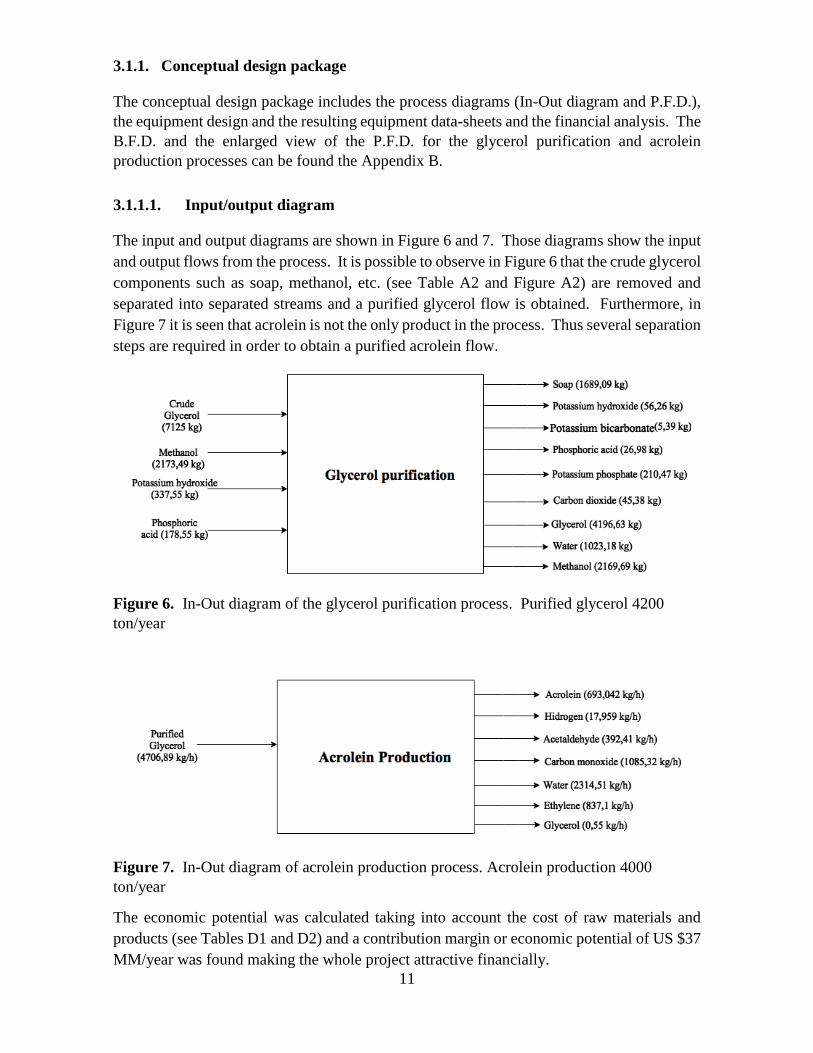
The input and output diagrams are shown in Figure 6 and 7. Those diagrams show the input
and output flows from the process. It is possible to observe in Figure 6 that the crude glycerol
components such as soap, methanol, etc. (see Table A2 and Figure A2) are removed and
separated into separated streams and a purified glycerol flow is obtained. Furthermore, in
Figure 7 it is seen that acrolein is not the only product in the process. Thus several separation
steps are required in order to obtain a purified acrolein flow.
Figure 6. In-Out diagram of the glycerol purification process. Purified glycerol 4200
ton/year
Figure 7. In-Out diagram of acrolein production process. Acrolein production 4000
ton/year
The economic potential was calculated taking into account the cost of raw materials and
products (see Tables D1 and D2) and a contribution margin or economic potential of US $37
MM/year was found making the whole project attractive financially.

12
3.1.1.2. Equipment and plant costing
C-1 represents the saponification reactor where esters are removed from crude glycerol. F-1
represents a decanter where organics are separated from glycerol. This is followed by salt’s
neutralization reactor, C-2, where the salts are removed with a filter F-2, and the glycerol is
fed to a distillation column K-1.
C-3 represents a packed bed reactor where glycerol is dehydrated in a presence of MFI as
catalyst to produce acrolein and other products, this equipment uses low pressure steam as
utility. V-1 represents the centrifugal compressor located after the reactor in order to increase
the product’s pressure. This compressor uses electricity as the utility. The product gas,
continues to a fixed tube heat exchanger, W-4, which decreases the product´s temperature
before the flash separator, K-2, and an absorption column, F-3, in order to separate non-
condensable gases. The separator uses electric energy and the absorber uses water. The
product liquids after the separation continues to the first distillation column K-3 in order to
separate the gases from water. This column uses low pressure steam as utility. The gases
continue to the second distillation column, K-4, in order to separate the light compounds.
This column also uses low pressure steam and cooling water as utilities.
The product after the second distillation continues to an azeotropic extractive distillation
column, K-5, which uses low pressure steam as utility in order to break up the acrolein-water
azeotrope. The heavy compounds continue to a distillation column, K-6. This column also
uses steam low pressure and cooling water as utilities. The liquid product from this column
is conditioned and recycled into the azeotropic distillation column to favor the azeotropic
separation. A simplified block diagram including all these units considered in the process is
shown in Figure 8a.
The results of the equipment bare module costs (CBM) were used to calculate the total module
cost (CTM), which does not consider the cost of site development. The CTM was set as the
fixed capital investment (FCI) of the project.
In Figure 8b, the bare module costs of the glycerol purification and acrolein production
equipment were compared. The most expensive equipment is the compressor (V-1) due to
the power necessary to increase the pressure of gases resulting of glycerol dehydration
process. The neutralization reactor (C-2) is particularly expensive due to the fact that some
gases are produced in this step needing a large area.

13
Figure 8. (a) Simplified block diagram of the complete acrolein production process. (b)
Bare module cost (CBM) of the process equipment.
At the same time, labor costs (COL= 0,55 MM USD/year), utility cost (CUT=21 MM
USD/year), cost of waste treatment (CWT=1,93 MM USD/year), cost of raw material
(CRM=19,7 MM USD/year) were used to estimate the cost of manufacturing (COM=54,4
MMUSD/year). It is possible to see that the CUT and the CRM comprise most of the expenses
due to the energy required to acrolein purification steps and the raw materials required to
glycerol purification process. For further details about the general expenses see Appendix
D.
3.1.1.3. Process flow diagrams and equipment specification
The diagrams shown in this section are built according to on the ISO 10628 standard [49].
Figures 9 and 10 show the P.F.D diagrams for the glycerol purification and acrolein
production process. Enlarged views of the diagrams are shown in Figures B3 and B4.

14
Figure 9. Process flow diagram of the glycerol purification process

15
Figure 10. Process flow diagram of the base case acrolein production process

16
Equipment specification data sheets show the most relevant information of the process
equipment, such as operating conditions and the construction material. The specification
data sheets for Figure 9 is shown in Tables C1-C5 and for Figure 10 in Tables C6-C15.
Taking into account that the acrolein is a very corrosive compound all the process units were
designed with austenitic stainless steel (SS) which is not easily corroded by acrolein and it
can be resist temperatures until 450°C. Stainless steel is heat and corrosion-resistant,
noncontaminating, and easily fabricated into complex shapes [61].
3.1.2. Simulation
Figures 3 and 4 show the simulation flowsheet of the glycerol purification process and
acrolein production process performed in Aspen HYSYS. The names of the streams and
equipment shown in the figures correspond to the ones shown in the P.F.Ds. Nevertheless,
the simulation includes auxiliary equipment not included in the process diagrams.
The first process begins feeding the raw materials for the glycerol purification (see Figure
3). Raw glycerol was fed into reactor at 25°C and solid potassium hydroxide is dissolved in
methanol and added under stirring to the reactor to start saponification of the esters. The
reaction mixture continues to a decanter where potassium hydroxide and soaps are separated
from glycerol at standard conditions (25°C, 1 bar). The mixture is neutralized with
concentrated phosphoric acid. Precipitated salts are removed by filtration and the excess
methanol is distilled in K-1.
Figure 11 shows in detail K-1 as used in the simulation. The condenser was defined as total
and it was fixed a distillate rate of 123,5 kgmol/h and a reflux ratio of 0,2 in order to obtain
a distillate with 68 wt.% of methanol. Then, the bottom product was cooled to 30°C and
diluted with water to feed the second process (acrolein production). The resulting purified
glycerol was fed into a reactor, 87% of glycerol conversion for reaction 1 (Equation 1) was
obtained.
Figure 11. Close-up view of the simulated distillation column K-1.
In order to separate non-condensable gases, a water flow was fed at the top of the absorber
column as shows in detail in Figure 12. Therefore, 50 wt.% of carbon monoxide and 40% of
ethylene were removed from the feed stream.

17
Figure 12. Close-up view of the simulated absorber column F-3
The liquids obtained were fed to K-3 where the water was removed and distillate was fed to
K-4, which had a partial condenser in order to remove acetaldehyde as a light compound with
a purity of 72 wt.%. The bottom stream was cooled using an auxiliary cooler before
continuing until K-5, where the acrolein-water azeotrope was broken using glycerol as
entrainer. The liquid-liquid equilibrium formed requires the use of a sub flowsheet due to
the different binary interaction parameters for the extended NRTL model required to describe
this behavior. In order to accurately predict the phase separation, this sub flowsheet used the
parameters determined using UNIFAC LLE calculations. A close-up view of the azeotropic
distillation and sub flowsheet are shown Figure 13. In the output stream acrolein at 90 wt.%
was obtained.
The bottoms product from K-5 continue to K-6 where glycerol and water were separated and
glycerol was recycled back to K-5, recovering 97% of the mass flow of glycerol. At the same
time, a glycerol stream was fed in a mixer (R-2) in order to make up the glycerol losses.
Figure 13. (a) Close-up view of the simulated azeotropic distillation (b) Close-up view of
the simulated sub flowsheet

18
3.1.3. Economic evaluation
The initial investment was calculated by adding the costs of land, the FCI (CTM) and the
working capital (WC). The required initial investment for the base case was $4 MM USD.
The cash flow statement was calculated for a 12-year period, with a startup at the second
year. At the same time, a depreciation of 10 years was fixed yearly according to Turton et
al. [48]. For further details about the considerations to estimate the cash flow, see Tables E1
and E2. Figure 14 shows the cash flow statement during a 12-year period. The effective
annual interest rate, considered for this case was 10%.
Figure 14. Cash flow statement for the base case design during a 12-year period
The revenues obtained in the project come from the acrolein, acetaldehyde and phosphoric
acid salts. The latter is obtained from the neutralization step during glycerol purification. It
is important to note that the sale price of acetaldehyde and crystals were fixed to 1.000 US/ton
and 50 USD/ton respectively according to information available in the market [62].
However, the sale price of acrolein can fluctuate between $13300 USD/ton-$13650 USD/ton
according to the market references [63]. Figure 15, shows the differences of the IRR with
changes in the price of acrolein. The raw material prices were fixed, according to the
information available in the market (see Table D2).
Figure 15. Price of acrolein vs. IRR
The profitability for the base case design of this project was determined using IRR and NPV.
The NPV was $155 MM USD and the IRR was 6%. Therefore, the project is not feasible for
the base case.

19
3.2. Optimized case
3.2.1. Reactor length
Figure 16 shows acrolein selectivity and acrolein mole fraction at different reactor lengths at
constant pressure for an adiabatic reactor with an inlet temperature of 410°C. Up to 4m of
reactor length, acrolein selectivity and mole fraction decrease, whereas from 4m to 9m
remain constant until 9m. After 9m acrolein selectivity tends to 0%, because of side reactions
of acrolein to produce carbon monoxide and ethylene (Equation 2). Therefore, the reactor
length should be fixed below 4m. There are two circles drawn in Figure 16, the dashed one
indicates the selectivity obtained in the base case where the length was 10 m and the other
one indicates the selectivity obtained in the optimized case, 1m length. Therefore, acrolein
selectivity increased from 0,064 to 0,19.
Figure 16. Calculated acrolein selectivity and mole fraction at different reactor lengths at
Tin=410°C, Tout=153,6°C and 2,013 bar. Simulated points for the base case (dashed circle)
and optimized conditions (continuous circle).
3.2.2. Operating conditions of the reactor
The reactor operation in the base case was carried out at adiabatic conditions with an inlet
temperature of 410°C, and it was decided to simulated the reactor at isothermal conditions at
410°C to understand the effect of temperature on the selectivity of the process. Similarly, to
the adiabatic case, the reactor volume was varied in order to determine its effect on
selectivity.
Figure 17 shows that up to 0,1 m and 410°C, acrolein selectivity decreases rapidly and above
0,1 m acrolein selectivity tends to 0%. Therefore, the isothermal conditions for the reactor
were not included in the optimization due to the unfeasible dimensions for obtained a good
selectivity.

20
Figure 17. Acrolein selectivity at 2,013 bar, 410°C and different reactor lengths.
3.2.3. Sensitivity analysis
Acrolein losses and utility costs were calculated at different reboiler temperatures in K-3 and
K-5, and different condenser temperatures in K-4 in order to improve the acrolein recovery
after purification.
3.2.3.1. Temperature distillation column K-3
In K-3, the water added in F-3 is removed in the bottoms in order to (i) obtain an outlet gas
stream of acrolein with low contents of water and (ii) decreased losses of acrolein after
distillation. Therefore, the reboiler temperature was modified and the acrolein losses and
utility costs in K-4 were monitored.
Figure 18 shows that at 140°C acrolein losses are 100% whereas the cost of utility (low
pressure steam for the reboiler) is one of the lowest. Above 150°C acrolein losses and cost
of utilities decrease. However, it is important to take into account that the boiling point of
water at the operating pressure (11,01 bar) is 183.9 °C. In order to avoid leaking through the
gases stream, a temperature of 173 °C was chosen. The base case reboiler temperature was
172,3°C and the optimized case where the bottom or reboiler temperature was 173,1°C, thus
acrolein losses decreased from 0,6% to 0,5% at a lower utility cost.
Figure 18. Acrolein losses and cost of utilities for K-3 at different reboiler temperatures
and 11,01 bar. Simulated points for the base case (dashed circle) and optimized conditions
(continuous circle).

21
3.2.3.2. Temperature distillation column K-4
Undesirable products (acetaldehyde and non-condensable gases) are removed at K-4 in the
distillate. Therefore, the effect of the condenser temperature was evaluated considering the
cost of utilities and acrolein losses in K-4.
Figure 19 shows that acrolein losses and cooling water increase with temperature increases.
However, the cost of steam remains almost constant. Therefore, the operating temperature
should be kept below 65°C. For the base case the temperature was 90°C and for the
optimized case was 62,5°C. Acrolein losses decreased from 0,11% to 0,08% at a lower utility
cost.
Figure 19. Acrolein losses and cost of utilities for K-4 at different condenser temperatures
and 11,01 bar. Simulated points for the base case (dashed circle) and optimized conditions
(continuous circle).
3.2.3.3. Temperature distillation column K-5
The acrolein losses and utility cost per year at different reboiler temperatures were analyzed.
Figure 20 shows that acrolein losses after K-5 and the cost of the utility (low pressure steam)
increases with temperature in the reboiler. At 11,01 bar acrolein’s boiling point is 151,3°C
and water’s boiling point is 183,9°C. Thereby, the operation temperature should be kept
above 151 °C to favor the separation process. The base case temperature was 195°C and for
the optimized case was 188°C. Acrolein losses decrease from 27% to 20%.
Figure 20. Acrolein losses and cost of utilities for K-5 at different reboiler temperatures
and 11,01 bar. Simulated points for the base case (dashed circle) and optimized conditions
(continuous circle).
22
3.2.4. Optimal parameters
The optimal reactor length was 1m, this allowed to obtain an acrolein selectivity (0,19) three
times higher than in the base case (0,064) operating at isobaric conditions. For the
purification section, which mainly involves the distillation columns K-3, K-4 and K-5, the
optimal temperatures were 173°C (reboiler temperature), 62°C (condenser temperature) and
188°C (reboiler temperature), respectively. The lower costs were achieved considering
thermodynamic limitations, thereby it was possible to recover 74% of the acrolein produced
compared to 65% in the base case. Moreover, the purity of the produced acrolein increased
from 90 to 92 wt.%. For the by-product, acetaldehyde, the recovery increased from 60 to
75% and the purity also increased from 72 to 99 wt.%.
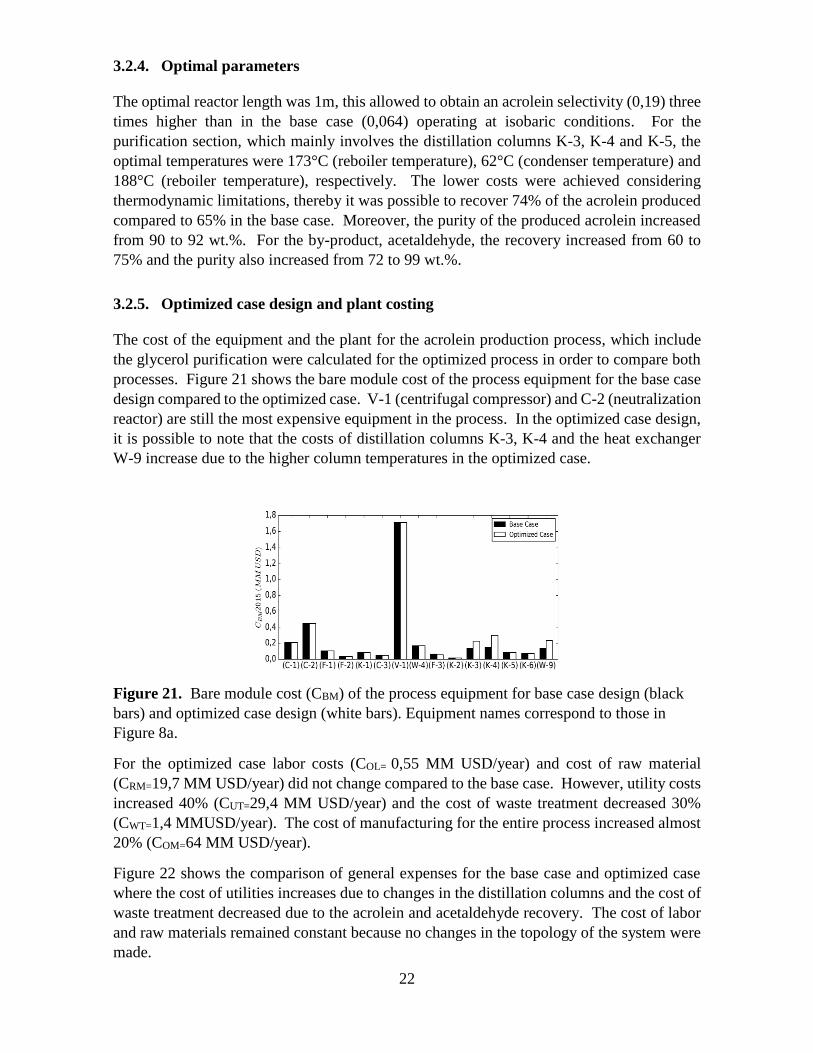
3.2.5. Optimized case design and plant costing
The cost of the equipment and the plant for the acrolein production process, which include
the glycerol purification were calculated for the optimized process in order to compare both
processes. Figure 21 shows the bare module cost of the process equipment for the base case
design compared to the optimized case. V-1 (centrifugal compressor) and C-2 (neutralization
reactor) are still the most expensive equipment in the process. In the optimized case design,
it is possible to note that the costs of distillation columns K-3, K-4 and the heat exchanger
W-9 increase due to the higher column temperatures in the optimized case.
Figure 21. Bare module cost (CBM) of the process equipment for base case design (black
bars) and optimized case design (white bars). Equipment names correspond to those in
Figure 8a.
For the optimized case labor costs (COL= 0,55 MM USD/year) and cost of raw material
(CRM=19,7 MM USD/year) did not change compared to the base case. However, utility costs
increased 40% (CUT=29,4 MM USD/year) and the cost of waste treatment decreased 30%
(CWT=1,4 MMUSD/year). The cost of manufacturing for the entire process increased almost
20% (COM=64 MM USD/year).
Figure 22 shows the comparison of general expenses for the base case and optimized case
where the cost of utilities increases due to changes in the distillation columns and the cost of
waste treatment decreased due to the acrolein and acetaldehyde recovery. The cost of labor
and raw materials remained constant because no changes in the topology of the system were
made.

23
Figure 22. Comparison of the cost of labor (COL), utilities(CUT), waste treatment (CWT)
and raw materials (CRM) for the optimized (white bars) and base case (white bars).
3.2.6. Economic evaluation
The required initial investment for the optimized case design was $4.5 MM USD, 13% higher
than for the base case. A comparison of the cash flows for the base case and optimized case
is shown in Figure 23.
Figure 23. Cash flow statement during a 12-year period
The cash flow of the optimized case has a larger increase than the base case cash flow for the
same period of time. The process’ IRR increased from 6% for the base case to 58% for the
optimized case due to the increase production of acrolein and acetaldehyde. Figure 24 shows
two diagrams with Sankey representation where the thickness of the line means the amount
of the substance in the stream and it is possible to see that the amount of acrolein increased
notably in comparison with the base case. Despite a larger consumption of utilities, the
higher revenue generated by the increased recovery of the products increases the profitability
of the project.
The optimized case had a NPV of $420 MM USD, almost 3 times larger than that of the base
case.
The acrolein price could be reduced in order to compete with the international market, to a
value greater than $5.900 USD/ton to keep a NPV above zero and a IRR of 10%.

24
Figure 24. Sankey representations for acrolein production process (a) Base case, (b)
Optimized case

25
4. Conclusions
Acrolein is an important precursor of chemicals such as methionine. It is commonly
produced from petroleum derived propylene. Using bioglycerol from the biodiesel process
presents an opportunity to replace a petroleum based raw material improving thereby the
profitability and sustainability of the whole process of acrolein production. In order to assess
the feasibility of the process, a plant for the production of acrolein from bioglycerol has been
designed, simulated and optimized.
A small packed bed reactor (1m length and 0,3m diameter) was required in order to obtain
high selectivity towards acrolein using a MFI zeolite as a catalyst. The outlet stream from
the reactor has to be purified using a flash separator, an absorption column and four
distillation columns in order to obtain pure acrolein and acetaldehyde.
The reactor length, reboiler temperatures of K-3 and K-5 and condenser temperature of K-4
were chosen as variables susceptible to be optimized, because these determine a high
selectivity and the desirable purification of acrolein. Optimization increased acrolein
selectivity from 0,06 to 0,19. Also, the recovery of the produced acrolein was increased from
65% to 74%. The NPV was increased almost threefold and the IRR increased from 6% to
58%.

26
References
[1] Arda Ülgen and aus Istanbul, “Conversion of glycerol to the valuable intermediates
acrolein and allyl alcohol in the presence of heterogeneous catalysts,” Aachen University,
2009.
[2] C. García-Sancho, J. A. Cecilia, A. Moreno-Ruiz, J. M. Mérida-Robles, J.
Santamaría-González, R. Moreno-Tost, and P. Maireles-Torres, “Influence of the
niobium supported species on the catalytic dehydration of glycerol to acrolein,” Appl.
Catal. B Environ., vol. 179, pp. 139–149, Dec. 2015.
[3] S. Kim and B. E. Dale, “Global potential bioethanol production from wasted crops
and crop residues,” Biomass Bioenergy, vol. 26, no. 4, pp. 361–375, Apr. 2004.
[4] H. Shapouri, J. A. Duffield, and M. S. Graboski, “Estimating the Net Energy Balance
of Corn Ethanol. Agricultural Economic Report,” Economic Research Service,
Washington, DC (United States), PB--95-252631/XAB; USDA/AER--721, Jun. 1995
[Online]. Available: http://www.osti.gov/scitech/biblio/104393. [Accessed: 18-Aug-
2016]
[5] H. Shapouri, J. A. Duffield, and M. Q. Wang, “The Energy Balance of Corn Ethanol:
An Update,” United States Department of Agriculture, Economic Research Service,
Agricultural Economics Reports 34075, 2002 [Online]. Available:
https://ideas.repec.org/p/ags/uerser/34075.html. [Accessed: 18-Aug-2016]
[6] J. Calero, D. Luna, E. D. Sancho, C. Luna, F. M. Bautista, A. A. Romero, A.
Posadillo, J. Berbel, and C. Verdugo-Escamilla, “An overview on glycerol-free processes
for the production of renewable liquid biofuels, applicable in diesel engines,” Renew.
Sustain. Energy Rev., vol. 42, pp. 1437–1452, Feb. 2015.
[7] I. Banu, G. Guta, C. S. Bildea, and G. Bozga, “Design and Performance Evaluation
of a Plant for Glycerol Conversion to Acrolein,” Environ. Eng. Manag. J., vol. 14, no. 3,
pp. 509–517, Mar. 2015.
[8] BioSC Biocombustibles Sostenibles del Caribe, “Personal Communication.” Aug-
2016.
[9] Science Lab. Chemicals & Laboratory Equipment, Glycerin, Synthetic, USP, EP, BP,
JP. Houston, Texas, 2005.
[10] A. Behr, J. Eilting, K. Irawadi, J. Leschinski, and F. Lindner, “Improved utilization
of renewable resources: New important derivatives of glycerol,” Green Chem., vol. 10,
no. 1, pp. 13–30, Jan. 2008.
[11] H. W. Tan, A. R. Abdul Aziz, and M. K. Aroua, “Glycerol production and its
applications as a raw material: A review,” Renew. Sustain. Energy Rev., vol. 27, pp. 118–
127, Nov. 2013.
[12] A. Martin, M. P. Checinski, and M. Richter, “Tuning of diglycerol yield and isomer
distribution in oligomerization of glycerol supported by DFT-calculations,” Catal.
Commun., vol. 25, pp. 130–135, Aug. 2012.
[13] F. Frusteri, F. Arena, G. Bonura, C. Cannilla, L. Spadaro, and O. Di Blasi, “Catalytic
etherification of glycerol by tert-butyl alcohol to produce oxygenated additives for diesel
fuel,” Appl. Catal. Gen., vol. 367, no. 1–2, pp. 77–83, Oct. 2009.
[14] L. Zhou, T.-H. Nguyen, and A. A. Adesina, “The acetylation of glycerol over
amberlyst-15: Kinetic and product distribution,” Fuel Process. Technol., vol. 104, pp.
310–318, Dec. 2012.
[15] D. A. Echeverri, F. Cardeño, and L. A. Rios, “Glycerolysis of Crude Methyl Esters
with Crude Glycerol from Biodiesel Production,” J. Am. Oil Chem. Soc., vol. 90, no. 7,
pp. 1041–1047, Apr. 2013.

27
[16] J. A. Posada and C. A. Cardona, “Design and analysis of fuel ethanol production from
raw glycerol,” Energy, vol. 35, no. 12, pp. 5286–5293, Dec. 2010.
[17] J. A. Posada, J. M. Naranjo, J. A. López, J. C. Higuita, and C. A. Cardona, “Design
and analysis of poly-3-hydroxybutyrate production processes from crude glycerol,”
Process Biochem., vol. 46, no. 1, pp. 310–317, Jan. 2011.
[18] L. Cheng, L. Liu, and X. P. Ye, “Acrolein Production from Crude Glycerol in Sub-
and Super-Critical Water,” J. Am. Oil Chem. Soc., vol. 90, no. 4, pp. 601–610, Apr. 2013.
[19] A. Alhanash, E. F. Kozhevnikova, and I. V. Kozhevnikov, “Gas-phase dehydration
of glycerol to acrolein catalysed by caesium heteropoly salt,” Appl. Catal. Gen., vol. 378,
no. 1, pp. 11–18, Apr. 2010.
[20] W. Yan and G. J. Suppes, “Low-Pressure Packed-Bed Gas-Phase Dehydration of
Glycerol to Acrolein,” Ind. Eng. Chem. Res., vol. 48, no. 7, pp. 3279–3283, Apr. 2009.
[21] “BASF Products,” BASF. [Online]. Available: http://product-finder.basf.com.
[Accessed: 15-Oct-2016]
[22] Eckert, Marc, Chemie, Wacker, Burghausen, Werk, Fleischann, Gerald, Jira,
REinhard, Bolt, Hermann, and Golka, Klaus, “Acetaldehyde,” ULLMANN’S
Encyclopedia of Industrial Chemistry, vol. 1. 2012.
[23] Chemicalland21, “ACETALDEHYDE (ETHANAL),” 2013. .
[24] IHS Markit®, “Acetaldehyde - Chemical Economics Handbook (CEH),” Apr-2013.
[Online]. Available: https://www.ihs.com/products/acetaldehyde-chemical-economics-
handbook.html. [Accessed: 08-Feb-2016]
[25] Acosta, D.A., Cardona, L.F., and Giraldo, J., Simulación de una planta de producción
de acetaldehído en estado estacionario con estudio de rentabilidad. Colombia:
Universidad EAFIT, 2014.
[26] E. Markočič, B. Kramberger, J. G. van Bennekom, H. Jan Heeres, J. Vos, and Ž.
Knez, “Glycerol reforming in supercritical water; a short review,” Renew. Sustain.
Energy Rev., vol. 23, pp. 40–48, Jul. 2013.
[27] A. Corma, G. W. Huber, L. Sauvanaud, and P. O’Connor, “Biomass to chemicals:
Catalytic conversion of glycerol/water mixtures into acrolein, reaction network,” J.
Catal., vol. 257, no. 1, pp. 163–171, Jul. 2008.
[28] J. A. Cecilia, C. García-Sancho, J. M. Mérida-Robles, J. Santamaría-González, R.
Moreno-Tost, and P. Maireles-Torres, “V and V–P containing Zr-SBA-15 catalysts for
dehydration of glycerol to acrolein,” Catal. Today, vol. 254, pp. 43–52, Oct. 2015.
[29] M. Dalil, D. Carnevali, J.-L. Dubois, and G. S. Patience, “Transient acrolein
selectivity and carbon deposition study of glycerol dehydration over WO3/TiO2
catalyst,” Chem. Eng. J., vol. 270, pp. 557–563, Jun. 2015.
[30] L. Liu, B. Wang, Y. Du, and A. Borgna, “Supported H4SiW12O40/Al2O3 solid acid
catalysts for dehydration of glycerol to acrolein: Evolution of catalyst structure and
performance with calcination temperature,” Appl. Catal. Gen., vol. 489, pp. 32–41, Jan.
2015.
[31] W. Yan and G. J. Suppes, “Low-Pressure Packed-Bed Gas-Phase Dehydration of
Glycerol to Acrolein,” Ind. Eng. Chem. Res., vol. 48, no. 7, pp. 3279–3283, Apr. 2009.
[32] H. Zhang, Z. Hu, L. Huang, H. Zhang, K. Song, L. Wang, Z. Shi, J. Ma, Y. Zhuang,
W. Shen, Y. Zhang, H. Xu, and Y. Tang, “Dehydration of Glycerol to Acrolein over
Hierarchical ZSM-5 Zeolites: Effects of Mesoporosity and Acidity,” ACS Catal., vol. 5,
no. 4, pp. 2548–2558, Apr. 2015.
[33] W. G. Etzkorn, “Acrolein and Derivatives,” in Kirk-Othmer Encyclopedia of
Chemical Technology, John Wiley & Sons, Inc., 2009 [Online]. Available:

28
http://onlinelibrary.wiley.com/doi/10.1002/0471238961.0103181505202611.a01.pub3/
abstract
[34] QYResearchGroups, Global Acrolein Consumption 2016 Market Research Report
QY Research Groups. QYResearchGroups, 2016.
[35] multi-chem®, “AcroCideTM Biocide.” 2014 [Online]. Available:
http://www.halliburton.com/public/multichem/contents/Data_Sheets/web/H011024-
AcroCide.pdf
[36] John Alexander Posada Duque, “Design and Analysis of Technological Schemes for
Glycerol Conversion to Added Value Products,” Universidad Nacional de Colombia,
Manizales, Colombia, 2011.
[37] Mccormark, Peter, “Acrolein Design Project.” 08-Nov-2014.
[38] Science Lab. Chemicals & Laboratory Equipment, Material Safety Data Sheet
Acrolein MSDS. Houston, Texas, 2013.
[39] Great Export Import, “Colombia Acrylic Aldehyde Import Data - Buyers Ranked,”
Shanghai Xuhui District City, 2015.
[40] REN21, “RenewableS 2016. Global Status Report,” 2016 [Online]. Available:
http://www.ren21.net/status-of-renewables/global-status-report/
[41] J. A. Posada, L. E. Rincón, and C. A. Cardona, “Design and analysis of biorefineries
based on raw glycerol: Addressing the glycerol problem,” Bioresour. Technol., vol. 111,
pp. 282–293, May 2012.
[42] E. Tsukuda, S. Sato, R. Takahashi, and T. Sodesawa, “Production of acrolein from
glycerol over silica-supported heteropoly acids,” Catal. Commun., vol. 8, no. 9, pp.
1349–1353, Sep. 2007.
[43] Wish Chemicals, “Material Safety Data Sheet MFI.” 2008.
[44] ITC, “Trade Map - Lista de los mercados proveedores para un producto importado
por Colombia en 2015,” 2015. [Online]. Available:
http://www.trademap.org/Country_SelProductCountry.aspx?nvpm=3|170||||291212|||6|1|
1|1|1||2|1|1. [Accessed: 08-Jun-2016]
[45] Bacex, “Reporte Importaciones Exportaciones aldehídos acíclicos sin funciones
oxigenadas.” 2016 [Online]. Available: http://bacex.mincit.gov.co/
[46] Bacex, “Reporte Importaciones Exportaciones Acetaldehído.” 2016 [Online].
Available: http://bacex.mincit.gov.co/
[47] “Federación Nacional de Biocombustibles de Colombia,” fedebicombustibles.com.
[Online]. Available: http://www.fedebiocombustibles.com/nota-web-id-923.htm.
[Accessed: 24-Aug-2015]
[48] R. Turton, R. C. Bailie, W. B. Whiting, and J. A. Shaeiwitz, Analysis, Synthesis and
Design of Chemical Processes. Pearson Education, 2008.
[49] ISO International Standard, “ISO 10628 Flow diagrams for process plants-General
rules.” 15-Apr-1997.
[50] J. R. Couper, W. R. Penney, and J. R. F. PhD, Chemical Process Equipment revised
2E: Selection and Design. Gulf Professional Publishing, 2009.
[51] L. T. Biegler, I. E. Grossmann, and A. W. Westerberg, Systematic methods of
chemical process design. Prentice Hall PTR, 1997.
[52] S. M. Walas, “Preface to the First Edition,” in Chemical Process Equipment (Revised
Second Edition), J. R. Couper, W. R. Penney, J. R. Fair, and S. M. Walas, Eds. Boston:
Gulf Professional Publishing, 2010, p. ix [Online]. Available:
http://www.sciencedirect.com/science/article/pii/B9780123725066000381. [Accessed:
23-Nov-2015]

29
[53] Aspen Technology, Inc., Aspen HYSYS. 2013 [Online]. Available:
http://www.aspentech.com/
[54] N. M. Sokolov, N. N. Sevryugova, and N. M. Zhavoronkov, “Liquid-vapor phase
equilibrium in the systems acrylonitrile water and acrolein water at various pressures,”
Teor. Osn. Khim. Tekhnol., vol. 3, no. 1, pp. 128–35, 1969.
[55] M. B. Oliveira, A. R. R. Teles, A. J. Queimada, and J. A. P. Coutinho, “Phase
equilibria of glycerol containing systems and their description with the Cubic-Plus-
Association (CPA) Equation of State,” Fluid Phase Equilibria, vol. 280, no. 1–2, pp. 22–
29, Jun. 2009.
[56] Maslennikova, V. Ya., Goryunova, N. P., Subbotina, L. A., Tsiklis, D. S., and Zh.
Fiz. Khim., “The solubility of water in compressed hydrogen,” Russ. J. Phys. Chem., vol.
50, pp. 411–4, 1976.
[57] J. V, C. M, and O. L, “Selecting Entrainers for Azeotropic Distillation,” Chem. Eng.
Prog., vol. 105, no. 3, pp. 47–53, 2009.
[58] Chemstations, Inc., CHEMCAD. 2015 [Online]. Available:
http://www.chemstations.com/
[59] H. S. Fogler, Essentials of Chemical Reaction Engineering. Pearson Education, 2010.
[60] O. US EPA, “Acrolein | Technology Transfer Network Air Toxics Web site | US
EPA.” [Online]. Available: http://www.epa.gov/airtoxics/hlthef/acrolein.html
[61] D. Green and R. Perry, Perry’s Chemical Engineers’ Handbook, Eighth Edition.
McGraw Hill Professional, 2007.
[62] L. H. Bailey, Cyclopedia of American agriculture. Рипол Классик, 1907.
[63] “Ningbo Samreal Chemical Co.,Ltd.,” 2015. [Online]. Available:
http://www.samreal.com/. [Accessed: 24-Sep-2016]

30
Appendix A. Project design specifications (PDS)
A.1. Physicochemical properties
The physicochemical properties of raw materials and main products involved in the crude
glycerol purification and glycerol dehydration are shown in Table A1, which describes the
physical state, molecular weight, color, boiling point, melting point, critical temperature,
vapor pressure and density at standard conditions.
Table A1. Physicochemical properties of raw material and principal products
[38, 64-68]
Crude glycerol purification Glycerol dehydration
Physicochemical
properties Methanol
Potassium
hydroxide
Phosphoric
acid Glycerol Acrolein Acetaldehyde
Physical state Liquid Solid (Solid
pellets)
Liquid
(Syrupy
liquid
Viscous
liquid.)
Liquid
(Viscous
(Syrupy)
liquid.)
Liquid
Liquid
(Fuming
liquid.)
Molecular
weight (g/mol-g) 32,04 56,11
Not
applicable
Color Colorless White Clear
Colorless
Clear
Colorless
Colorless
to light
yellow
Colorless
Boiling point
(°C) 64,5
1384
(Descomposition
temperature)
158 290 52.5 21
Melting point
(°C) -97,8 380 21 19 -88 (-123,5)
Critical
temperature
(°C)
240 Not available Not
available Not available 254 188
Vapor pressure
(bar)
12,3 kPa
(@ 20°C) Not available
0,3 kPa
(@ 20°C)
0 kPa
(@ 20°C)
28 kPa
(@ 20°C)
101,3 kPa
(@ 20°C)
Density (kg/m3) 792 2120 1880 1261 0.8427 788
It is important to note that the glycerol resulting from biodiesel production is not pure, thus
the composition of crude, purified and commercial glycerol are shown in Table A2. The
parameters of crude glycerol were used to determine the purification before the acrolein
production process.

31
Table A2. Glycerol composition [69]
Parameter Crude
glycerol
Purified
glycerol
Refined/commercial
glycerol
Glycerol content (%) 60–80 99,1–99,8 99,20–99,98
Moisture content (%) 1,5–6,5 0,11–0,8 0,14–0,29
Ash (%) 1,5–2,5 0,054 <0,002
Soap (%) 3,0–5,0 0,1–0,16 0,04–0,07
Acidity (pH) 0,7–1,3 0,10–0,16 0,04–0,07
Chloride (ppm) ND 1.0 0,6–9,5
Color (APHA) Dark
Secondly, in the glycerol dehydration process to obtain acrolein, MFI zeolite is used as the
catalyst, thus, the physicochemical characteristics are shown in Table A3.
Table A3. Physicochemical characteristics of catalysts [27]
Properties MFI
Density (kg/m3) 720
Void fraction 0,75
Si/Al 50
BET surface area (m2/g) 70
Micropore volume (cm3/g) 0,027
Zeolite content 15
Rare earth content, wt% -
Particle size (µm) 40-120
The zeolite is deactivated due to the coke deposition in reaction 3 (Equation 3), Corma et al.
[27] proposed that the glycerol dehydration process to be carried out in a circulating bed
reactor with continuous catalysis regeneration, a system similar with the one used in the fluid
catalytic cracking of hydrocarbons. It is important to note that Equation 3 was not considered
in the simulations, therefore if the reaction were included, it would be necessary a
restructuration of the process in the reaction section in order to implemented the catalysis
regeneration system.
A.2. Transport and safety regulations
International regulations for transport of dangerous good are shown below, it is important to
note that Colombia has national regulation for transport of dangerous goods which regulates
the packing, labelling and incompatible substances such as: Decree 1079/2015 [83] and
Colombian Technical Norm (NTC in its Spanish acronym) 1692/2015 [84].

32
Glycerol
Transport regulations
According to the Occupational Safety and Health Administration (OSHA), Glycerol is a
product that does not contain a hazardous material. The material does not appear to be subject
to the HMR (Hazardous Materials Regulations) as defined by the U.S Department of
transportation [72].
United Nations recommendations for the transport of dangerous goods
Not classified according to the United Nations Recommendations on the Transport of
Dangerous Goods [73].
Acrolein
Transport regulations
Acrolein is unlikely to be transported over long distances because of its high reactivity and
estimated short half-live on air and water, and due to it, acrolein does not tend to persist in
the environment, and its intercompartmental movement is small:
Air: Acrolein emitted to air reacts primarily with hydroxyl radicals generated in the
troposphere photo chemically. Minor processes include direct photolysis, reaction with
nitrate radicals, and reaction with ozone. Acrolein has been detected in rainwater, indicating
that it may be removed by wet deposition. The calculated atmospheric half-life of acrolein,
based on rate constants for hydroxyl radical reaction, is between 3,4 and 33,7 h. The overall
reactivity-based half-life of acrolein in air, is less than 10 h. Based on these short estimated
half-lives, acrolein is not a candidate for long.-range atmospheric transport [74].
Water: Acrolein is removed from surface water primarily by reversible hydration,
biodegradation by acclimatized microorganisms, and volatilization. In groundwater, acrolein
is removed by anaerobic biodegradation and hydrolysis. The overall reactivity-based half-
life of acrolein in surface water is estimated to be between 30 and 100 h. In groundwater,
half-lives of 11 days and 336–1344 h (14–56 days) are estimated based on aerobic and
anaerobic degradation, respectively. Observed dissipation half-lives of acrolein applied as
an herbicide in irrigation canals range from 7,3 to 10,2 h. The relatively short observed half-
lives of acrolein in surface waters make long-range aquatic transport unlikely [74].
United Nations recommendations for the transport of dangerous goods
The United Nations Committee of Experts on the Transportation of Dangerous Goods and
the International Maritime Organization classify acrolein as a flammable liquid (Class 3 and
3,1 respectively) with subsidiary risk as a poisonous substance. Acrolein is also classified as
a very dangerous substance for packing purposes (Packing Group I). Packing methods and
labels are recommended [75]. The recommended labels are:

33
Figure A1. Labels recommended for United Nations [75]
Also, the United Nations counts with a specified system of classification for each dangerous
good organized on a table, as shown below [76].
Table A4. United Nations recommendations on the transport of dangerous goods for
acrolein [76]
UN
No.
Name and
description
Class or
division
Subsidiary
risk
UN
packing
group
Special
provisions
Limited and
excepted
quantities
Packaging’s and IBC’s Portable tanks and bulk
containers
Packaging
instruction
Special
packaging
provisions
Instructions Special
provisions
(1) (2) (3) (4) (5) (6) (7a
) (7b) (8) (9) (10) (11)
1092
ACROLEIN,
STABILIZE
D
6,1 3 I 354 0 E0 P601 T22
TP2
TP7
TP13
TP35
Note: For further details, see [77].
Acetaldehyde
Transport regulations
Intercompartmental transport of acetaldehyde is expected to be limited because of its high
reactivity. However, some transfer of acetaldehyde to air from water and soil is expected,
because of its high vapor pressure and low sorption coefficient [78].
United Nations recommendations for the transport of dangerous goods
The United Nations counts with a specified system of classification for each dangerous good
organized on a table, as shown below.
Table A5. United Nations recommendations on the transport of dangerous goods for
acetaldehyde [76]
UN
No.
Name and
description
Class or
division
Subsidiary
risk
UN
packing
group
Special
provisions
Limited
and
excepted
quantities
Packaging’s and IBC’s Portable tanks and bulk
containers
Packaging
instruction
Special
packaging
provisions
Instructions Special
provisions
(1) (2) (3) (4) (5) (6) (7
a) (7b) (8) (9) (10) (11)
1089 ACETALD
EHYDE 3 I 0 E3 P001 T11
TP2
TP7
Note: For further details, see [77].

34
A.3. Plant location
Santa Marta, Colombia has been chosen as the plant’s site location due to the availability of
raw materials, the logistics and port infrastructure and the free trade zone of Santa Marta.
However, if the transport costs were including in the economic analysis, it will be necessary
a comparison between potential places to define the best plant location. Colombia is
considered by the World Bank as the country with the best business environment in Latin
America, according to the Doing Business Report 2015 [79]. Table A6 shows the main
information and characteristics of the chosen location and Figure A2 shows the geographical
location.
Table A6. General information about Santa Marta
City Santa Marta
Department Magdalena
Temperature Temperature range: 28 ° C and 33 ° C [80]
Atmospheric pressure 760 mmHg [80]
Altitude 2 msnm (min)-5,775 msnm (max) [80]
Wind speed media 3,0 m/s (Annual average) [80]
Solar radiation 5-5,5 kWh/m2 [81]
Figure A2. Geographical location of Santa Marta [82]
In Santa Marta or near it, there are wide availability of suppliers of crude glycerol as raw
material derivate from biodiesel production. The biodiesel producers in Colombia are shown
in Table A7.

35
Table A7. Main places in Colombia where Biodiesel from Palm is produced [83]
Region Company Capacity (Ton/year)
North, Codazzi Oleoflores 60.000
North, Santa Marta Biocombustibles
sostenibles del Caribe
100.000
North, Santa Marta Odin Energy 36.000
Central, Barrancabermeja Ecodiesel de Colombia 120.000
Eastern, Fotacativa BioD 120.000
Eastern, San Carlos de Guaroa
(Meta)
Aceites Manuelita 120.000
Eastern, Castilla la nueva
(Meta)
Biocastilla 15.000
Furthermore, the more convenient way to export in Colombia is through the seaports. Figure
A3 shows the main seaports of the Colombian Caribbean.
Figure A3. Ports in the Caribbean sea, Colombia [84]
Colombia has a competitive number of free trade zone within which lies the free trade zone
of Santa Marta. This is a permanent free trade zone and it is declared as such until June 29,
2024 [85]. Free trade zone provides the following benefits to projects producing goods or
services to be installed on them [86]: Income tax rate of 15%; no cause or pay customs duties
(Value-added tax (VAT) and custom tariff) for goods brought into the free zone from outside;
IVA exemption for raw materials, inputs and finished goods acquired in the national customs
territory; the exports made from free trade zone to third countries are likely to benefit from
international trade agreements signed by Colombia. Colombia free trade zones are governed
by special regulations, consisting of laws, decrees and resolutions which are available on the
website of the ministry of commerce, industry and tourism [86].

36
A.4. Applicable taxes in Colombia
Taking into account the district tax statute of Santa Marta, in the article 63. Taxes for
industrial activity, according to the code 1110 of taxes for industrial activities, it indicates a
monthly tax of 7x1000 (COP) [87, Sec. Artículo 63].
A.5. Applicable laws and resolutions
The acrolein production is not regulated directly by Colombia, due to it is not an acrolein
manufacturer. Besides, acrolein is considered toxic to humans following inhalation, oral or
dermal exposures. Acute (short-term) inhalation exposure may result in upper respiratory
tract irritation and congestion, thus, several agencies develop guidelines or objectives for
hazardous chemicals using occupational exposure levels (OELs) [60]. Nevertheless, in
Colombia exists laws and resolutions for transport of dangerous goods which regulates the
packing, labelling and incompatible substances [83-84]. Other conditions about utilities,
construction and safety and health at work are reported below:
Table A8. Applicable laws and resolutions in Colombia
Laws and resolutions Content
Occupational health and safety management system
Law 1562:2012 Labor risk prevention
Resolution 2646:2008 Risk evaluation
Decree 2566:2009 Occupational diseases
OHSAS 18001:2007 Occupational health and safety management
systems – implementation training
Utilities
Resolution N°9 0807:2013 Technical Regulations of Electrical
Installations (RETIE in Spanish)
Resolution 898:2015 Environmental criteria for fuels using in
boilers (Low pressure steam)
Environmental regulations
Decree 2:1982 Atmospheric emissions
Decree 948:1995 Air-pollution control and prevention
Decree 3930:2010 Water uses and liquid waste
Decree 1541:2008 Water uses
Construction
NSR-10 Colombian regulations for earthquake-
resistant construction
A.6. Market analysis
In order to estimate the national demand for acrolein and acetaldehyde in 2016 and identify
the international markets, a market analysis was carry out. It was taken the reported exports
and imports for acetaldehyde and acrolein which are represented by graphics below.

37
Acrolein
According to the information reported in BACEX database [75], the companies that exported
acyclic aldehyde in Colombia in 2015 and 2016 are Tauroquímica S.A.S., Lipesa Colombia
and Suministros mineros latinoamericanos S.A.S. Figure A4 depicts the main destinations
for the acyclic aldehyde exported from Colombia in the years 2015 and 2016. Venezuela,
Dominican Republic, Peru and Ecuador are Colombia’s main destinations for acyclic
aldehyde exports.
At the same time the main companies that imported acyclic aldehyde to Colombia in 2015
and 2016 are Symrise ltda and Firmenich S.A. Figure A5 it is possible to see that Germany
seem to be the main acyclic aldehyde supplier.
Figure A4. Reported exports of acyclic aldehyde
Figure A5. Reported imports of acyclic aldehyde
Acetaldehyde
According to the information reported in BACEX database [46], the company that exported
acetaldehyde in Colombia in 2015 is Callizo aromas S.A.S. Figure A6 depicts the main
Total: 4 ton Total: 7 ton
Total: 200 ton Total: 70 ton

38
destinations for the acetaldehyde exported from Colombia in the year 2015. Venezuela is
Colombia´s main destination for acetaldehyde exports.
At the same time the main companies that imported acetaldehyde to Colombia in 2015 and
2016 are Lucta Grancolombia S.A.S, Productora nacional de aromas fragancias y colorantes
S.A. and Elementos químicos LTDA. Figure A7 it is possible to see that United Kingdom
and Spain seem to be the main acetaldehyde suppliers. In 2015 most imports proceeded from
United Kingdom, while in 2016 most imports proceeded from Spain.
Figure A6. Reported exports of acetaldehyde
Figure A7. Reported exports of acetaldehyde
Appendix B. Process diagrams
Figure B1. Block flow diagram of the glycerol purification process (See page 39)
Figure B2. Block flow diagram of the acrolein production process (See page 40)
Figure B3. Process flow diagram of the glycerol purification process (See page 41)
Figure B4. Process flow diagram the acrolein production process (See page 42)
Total: 1 ton
Total: 1 ton Total: ≈1 ton


43
Appendix C. Specification data sheets
Base case
Glycerol purification process
Table C1. Specification data sheet for saponification reactor (C-1)
COLUMN SPECIFICATION
ITEM NO. NO REQ'D DESCRIPTION
C-1 Saponification reactor was defined as a vertical vessel
PERFORMANCE DATA
Conical head
FLUIDS PROCESSED: Dished head
Glycerol, soap, esters, methanol, water,
Type
potasium carbonate, potasium bicarbonate Blind flange cover
PRESSURE: Flang top closure
OPERATING: Straight Shell
DESIGN: DIAMETER (O.D): 1,6 m
TEST: LENGTH: 4,8 m
TEMPERATURE:
DESIGN: 25°C
TEST:
CONSTRUCTION DATA
MATERIAL OF CONSTRUCTION
Austenitic
Stainless Steel
DESCRIPTION OF
FUNCTION OF VESSEL AND
Saponification of esters to remove it
from crude glycerol
Non-jacketed separator
LOCATION
External
Material of protection Paint
Date: 2015 Revisions: 2016

44
Table C2. Specification data sheet for decanter (F-1)
COLUMN SPECIFICATION
ITEM NO. NO REQ'D DESCRIPTION
F-1 Decanter was defined as a vertical vessel
PERFORMANCE DATA
Conical head
FLUIDS PROCESSED: Dished head
Glycerol, soap, esters, methanol, water,
Type
potasium carbonate, potasium bicarbonate Blind flange cover
PRESSURE: Flang top closure
OPERATING: Straight Shell
DESIGN: DIAMETER (O.D): 1,199 m
TEST: LENGTH: 3,60 m
TEMPERATURE:
DESIGN: 25°C
TEST:
CONSTRUCTION DATA
MATERIAL OF
CONSTRUCTION
Austenitic
Stainless Steel
DESCRIPTION OF
FUNCTION OF VESSEL AND
Separation of the organic and glycerol
phases resulting to the saponification
process
Non-jacketed separator
LOCATION External
Material of protection Paint
Date: 2015
Revisions: 2016

45
Table C3. Specification data sheet for neutralization reactor (C-2)
COLUMN SPECIFICATION
ITEM NO. NO REQ'D DESCRIPTION
C-2 Neutralization reactor was defined as a vertical vessel
PERFORMANCE DATA
Conical head
FLUIDS PROCESSED: Dished head
Glycerol, soap, esters, methanol, water,
Type
potasium carbonate, potasium bicarbonate Blind flange cover
PRESSURE: Flang top closure
OPERATING: Straight Shell
DESIGN: DIAMETER (O.D): 2,11 m
TEST: LENGTH: 6,63 m
TEMPERATURE:
DESIGN: 25°C
TEST:
CONSTRUCTION DATA
MATERIAL OF
CONSTRUCTION
Austenitic
Stainless Steel
DESCRIPTION OF
FUNCTION OF VESSEL
AND
Neutralization of salts to remove it
from crude glycerol
Non-jacketed separator
LOCATION
External
Material of protection Paint
Date: 2015
Revisions: 2016

46
Table C4. Specification data sheet for filter (F-2)
COLUMN SPECIFICATION
ITEM NO. NO REQ'D DESCRIPTION
F-2 Decanter was defined as a vertical vessel
PERFORMANCE DATA
Conical head
FLUIDS PROCESSED: Dished head
Glycerol, soap, esters, methanol, water,
potasium bicarbonate, phosphoric acid,
potassium phosphate, carbon dioxide
Type
Blind flange cover
PRESSURE: Flang top closure
OPERATING: Straight Shell
DESIGN: DIAMETER (O.D): 0,71 m
TEST: LENGTH: 2,13 m
TEMPERATURE:
DESIGN: 25°C
TEST:
CONSTRUCTION DATA
MATERIAL OF
CONSTRUCTION
Austenitic
Stainless Steel
DESCRIPTION OF
FUNCTION OF VESSEL
AND
The filter was used to separate the
salts from crude glycerol
Non-jacketed separator
LOCATION
External
Material of protection Paint
Date: 2015
Revisions: 2016

47
Table C5. Specification data sheet for distillation column (K-1)
COLUMN SPECIFICATION
ITEM NO. NO REQ'D DESCRIPTION
K-1 Distillation column
PERFORMANCE DATA
Conical head
FLUIDS PROCESSED: Dished head
Glycerol, water and methanol
Type
Blind flange cover
PRESSURE: Flang top closure
OPERATING: Straight Shell
DESIGN: 10 bar DIAMETER (O.D): 0,60 m
TEST: LENGTH: 5,48 m
TEMPERATURE:
DESIGN: 250°C
TEST:
CONSTRUCTION DATA
MATERIAL OF
CONSTRUCTION
Austenitic
Stainless Steel
DESCRIPTION OF
FUNCTION OF VESSEL
AND
The distillation column separates the
methanol solution from the glycerol
Jacketed column disitillation
LOCATION
External
Material of protection Paint
Date: 2015
Revisions: 2016
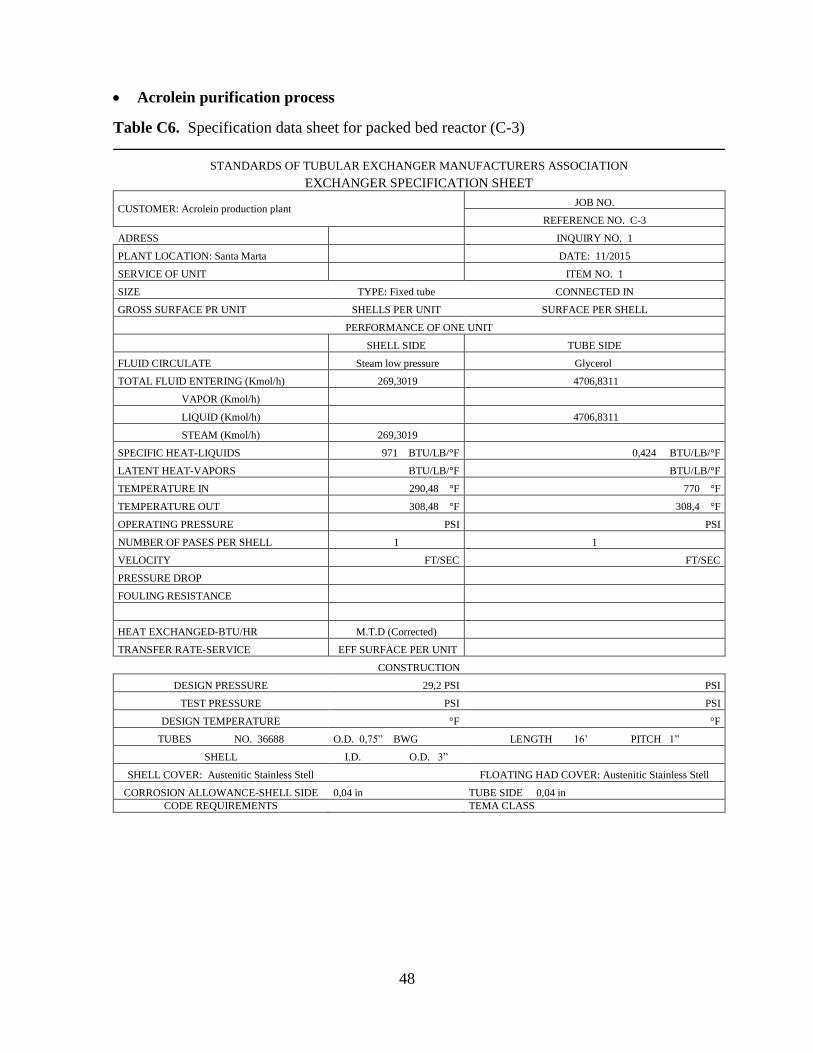
48
Acrolein purification process
Table C6. Specification data sheet for packed bed reactor (C-3)
STANDARDS OF TUBULAR EXCHANGER MANUFACTURERS ASSOCIATION
EXCHANGER SPECIFICATION SHEET
CUSTOMER: Acrolein production plant JOB NO.
REFERENCE NO. C-3
ADRESS INQUIRY NO. 1
PLANT LOCATION: Santa Marta DATE: 11/2015
SERVICE OF UNIT ITEM NO. 1
SIZE TYPE: Fixed tube CONNECTED IN
GROSS SURFACE PR UNIT SHELLS PER UNIT SURFACE PER SHELL
PERFORMANCE OF ONE UNIT
SHELL SIDE TUBE SIDE
FLUID CIRCULATE Steam low pressure Glycerol
TOTAL FLUID ENTERING (Kmol/h) 269,3019 4706,8311
VAPOR (Kmol/h)
LIQUID (Kmol/h) 4706,8311
STEAM (Kmol/h) 269,3019
SPECIFIC HEAT-LIQUIDS 971 BTU/LB/°F 0,424 BTU/LB/°F
LATENT HEAT-VAPORS BTU/LB/°F BTU/LB/°F
TEMPERATURE IN 290,48 °F 770 °F
TEMPERATURE OUT 308,48 °F 308,4 °F
OPERATING PRESSURE PSI PSI
NUMBER OF PASES PER SHELL 1 1
VELOCITY FT/SEC FT/SEC
PRESSURE DROP
FOULING RESISTANCE
HEAT EXCHANGED-BTU/HR M.T.D (Corrected)
TRANSFER RATE-SERVICE EFF SURFACE PER UNIT
CONSTRUCTION
DESIGN PRESSURE 29,2 PSI PSI
TEST PRESSURE PSI PSI
DESIGN TEMPERATURE °F °F
TUBES NO. 36688 O.D. 0,75” BWG LENGTH 16’ PITCH 1”
SHELL I.D. O.D. 3”
SHELL COVER: Austenitic Stainless Stell FLOATING HAD COVER: Austenitic Stainless Stell
CORROSION ALLOWANCE-SHELL SIDE 0,04 in TUBE SIDE 0,04 in
CODE REQUIREMENTS TEMA CLASS
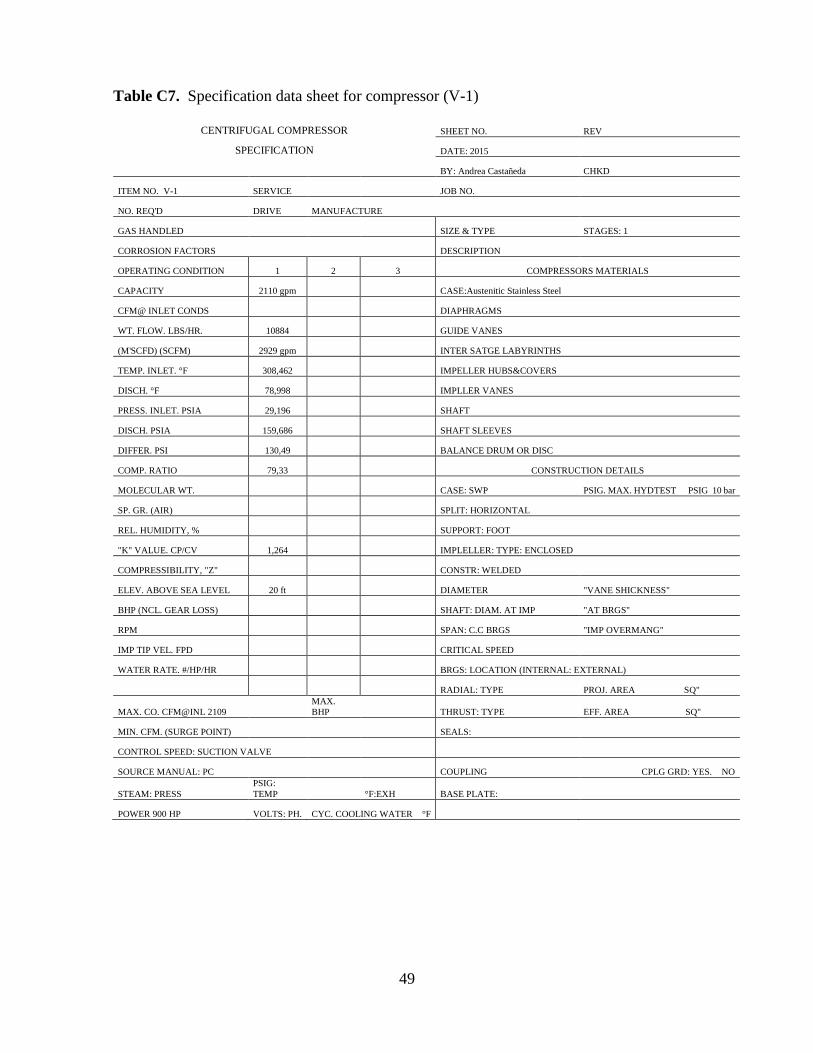
49
Table C7. Specification data sheet for compressor (V-1)
CENTRIFUGAL COMPRESSOR SHEET NO. REV
SPECIFICATION DATE: 2015
BY: Andrea Castañeda CHKD
ITEM NO. V-1 SERVICE JOB NO.
NO. REQ'D DRIVE MANUFACTURE
GAS HANDLED SIZE & TYPE STAGES: 1
CORROSION FACTORS DESCRIPTION
OPERATING CONDITION 1 2 3 COMPRESSORS MATERIALS
CAPACITY 2110 gpm CASE:Austenitic Stainless Steel
CFM@ INLET CONDS DIAPHRAGMS
WT. FLOW. LBS/HR. 10884 GUIDE VANES
(M'SCFD) (SCFM) 2929 gpm INTER SATGE LABYRINTHS
TEMP. INLET. °F 308,462 IMPELLER HUBS&COVERS
DISCH. °F 78,998 IMPLLER VANES
PRESS. INLET. PSIA 29,196 SHAFT
DISCH. PSIA 159,686 SHAFT SLEEVES
DIFFER. PSI 130,49 BALANCE DRUM OR DISC
COMP. RATIO 79,33 CONSTRUCTION DETAILS
MOLECULAR WT. CASE: SWP PSIG. MAX. HYDTEST PSIG 10 bar
SP. GR. (AIR) SPLIT: HORIZONTAL
REL. HUMIDITY, % SUPPORT: FOOT
"K" VALUE. CP/CV 1,264 IMPLELLER: TYPE: ENCLOSED
COMPRESSIBILITY, "Z" CONSTR: WELDED
ELEV. ABOVE SEA LEVEL 20 ft DIAMETER "VANE SHICKNESS"
BHP (NCL. GEAR LOSS) SHAFT: DIAM. AT IMP "AT BRGS"
RPM SPAN: C.C BRGS "IMP OVERMANG"
IMP TIP VEL. FPD CRITICAL SPEED
WATER RATE. #/HP/HR BRGS: LOCATION (INTERNAL: EXTERNAL)
RADIAL: TYPE PROJ. AREA SQ"
MAX. CO. CFM@INL 2109
MAX.
BHP THRUST: TYPE EFF. AREA SQ"
MIN. CFM. (SURGE POINT) SEALS:
CONTROL SPEED: SUCTION VALVE
SOURCE MANUAL: PC COUPLING CPLG GRD: YES. NO
STEAM: PRESS
PSIG:
TEMP °F:EXH BASE PLATE:
POWER 900 HP VOLTS: PH. CYC. COOLING WATER °F
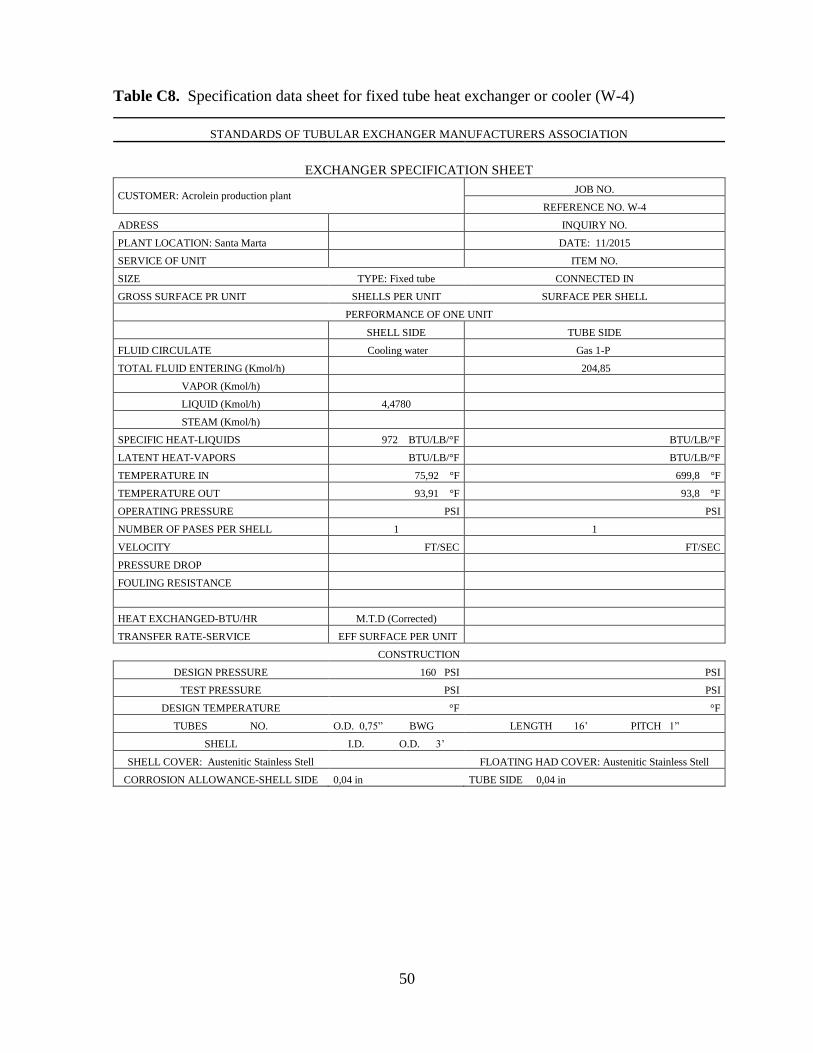
50
Table C8. Specification data sheet for fixed tube heat exchanger or cooler (W-4)
STANDARDS OF TUBULAR EXCHANGER MANUFACTURERS ASSOCIATION
EXCHANGER SPECIFICATION SHEET
CUSTOMER: Acrolein production plant JOB NO.
REFERENCE NO. W-4
ADRESS INQUIRY NO.
PLANT LOCATION: Santa Marta DATE: 11/2015
SERVICE OF UNIT ITEM NO.
SIZE TYPE: Fixed tube CONNECTED IN
GROSS SURFACE PR UNIT SHELLS PER UNIT SURFACE PER SHELL
PERFORMANCE OF ONE UNIT
SHELL SIDE TUBE SIDE
FLUID CIRCULATE Cooling water Gas 1-P
TOTAL FLUID ENTERING (Kmol/h) 204,85
VAPOR (Kmol/h)
LIQUID (Kmol/h) 4,4780
STEAM (Kmol/h)
SPECIFIC HEAT-LIQUIDS 972 BTU/LB/°F BTU/LB/°F
LATENT HEAT-VAPORS BTU/LB/°F BTU/LB/°F
TEMPERATURE IN 75,92 °F 699,8 °F
TEMPERATURE OUT 93,91 °F 93,8 °F
OPERATING PRESSURE PSI PSI
NUMBER OF PASES PER SHELL 1 1
VELOCITY FT/SEC FT/SEC
PRESSURE DROP
FOULING RESISTANCE
HEAT EXCHANGED-BTU/HR M.T.D (Corrected)
TRANSFER RATE-SERVICE EFF SURFACE PER UNIT
CONSTRUCTION
DESIGN PRESSURE 160 PSI PSI
TEST PRESSURE PSI PSI
DESIGN TEMPERATURE °F °F
TUBES NO. O.D. 0,75” BWG LENGTH 16’ PITCH 1”
SHELL I.D. O.D. 3’
SHELL COVER: Austenitic Stainless Stell FLOATING HAD COVER: Austenitic Stainless Stell
CORROSION ALLOWANCE-SHELL SIDE 0,04 in TUBE SIDE 0,04 in

51
Table C9. Specification data sheet for flash separator (K-2)
COLUMN SPECIFICATION
ITEM NO. NO REQ'D DESCRIPTION
K-2 Flash separator K-2
PERFORMANCE DATA
Conical head
FLUIDS PROCESSED: Dished head
Acrolein, acetaldehyde, hydrogen, Ethylene,
water, carbon monoxide
Type
Blind flange cover
PRESSURE: 11,01 bar Flang top closure
OPERATING: Straight Shell
DESIGN: DIAMETER (O.D): 0,39 m
TEST: LENGTH: 1,96 m
TEMPERATURE:
DESIGN: 34,4°C
TEST:
CONSTRUCTION DATA
MATERIAL OF
CONSTRUCTION
Austenitic
Stainless Steel
DESCRIPTION OF
FUNCTION OF VESSEL
AND
It is used to separate the non-
condensable gases
Jacketed flash separator LOCATION
Internal
Material of protection Paint
Date: 2015
Revisions: 2016
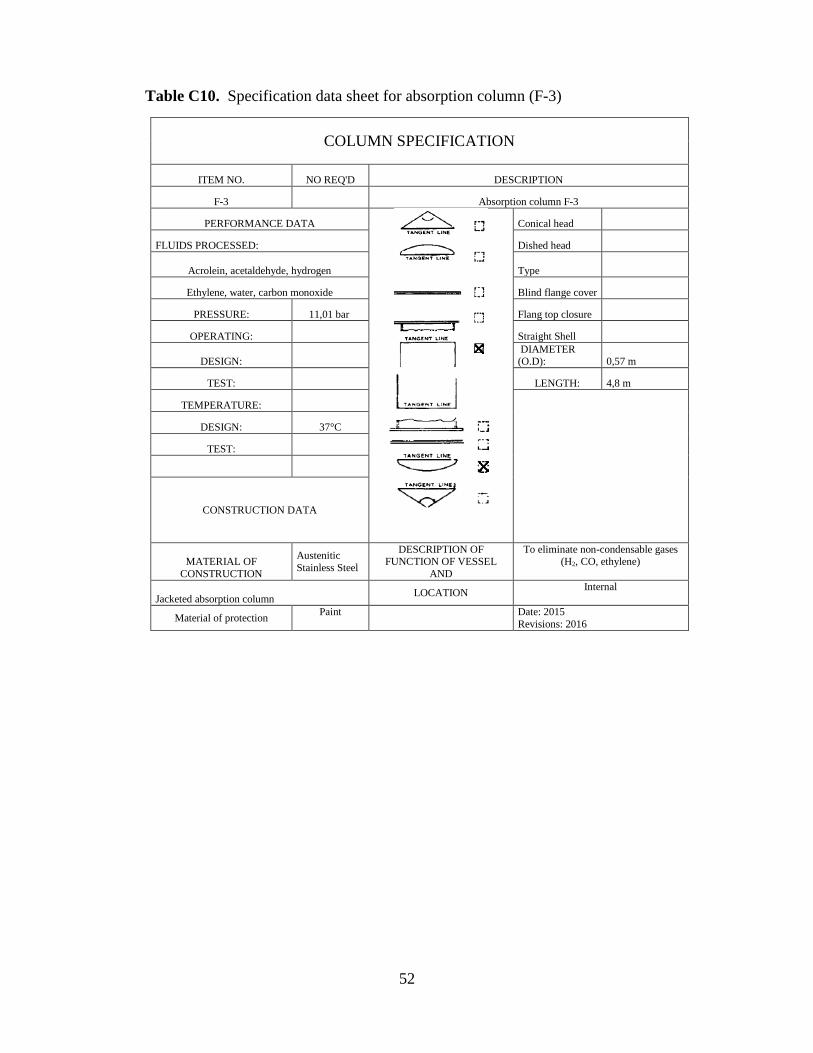
52
Table C10. Specification data sheet for absorption column (F-3)
COLUMN SPECIFICATION
ITEM NO. NO REQ'D DESCRIPTION
F-3 Absorption column F-3
PERFORMANCE DATA
Conical head
FLUIDS PROCESSED: Dished head
Acrolein, acetaldehyde, hydrogen
Type
Ethylene, water, carbon monoxide Blind flange cover
PRESSURE: 11,01 bar Flang top closure
OPERATING: Straight Shell
DESIGN: DIAMETER (O.D): 0,57 m
TEST: LENGTH: 4,8 m
TEMPERATURE:
DESIGN: 37°C
TEST:
CONSTRUCTION DATA
MATERIAL OF
CONSTRUCTION
Austenitic
Stainless Steel
DESCRIPTION OF
FUNCTION OF VESSEL
AND
To eliminate non-condensable gases
(H2, CO, ethylene)
Jacketed absorption column LOCATION
Internal
Material of protection Paint
Date: 2015
Revisions: 2016
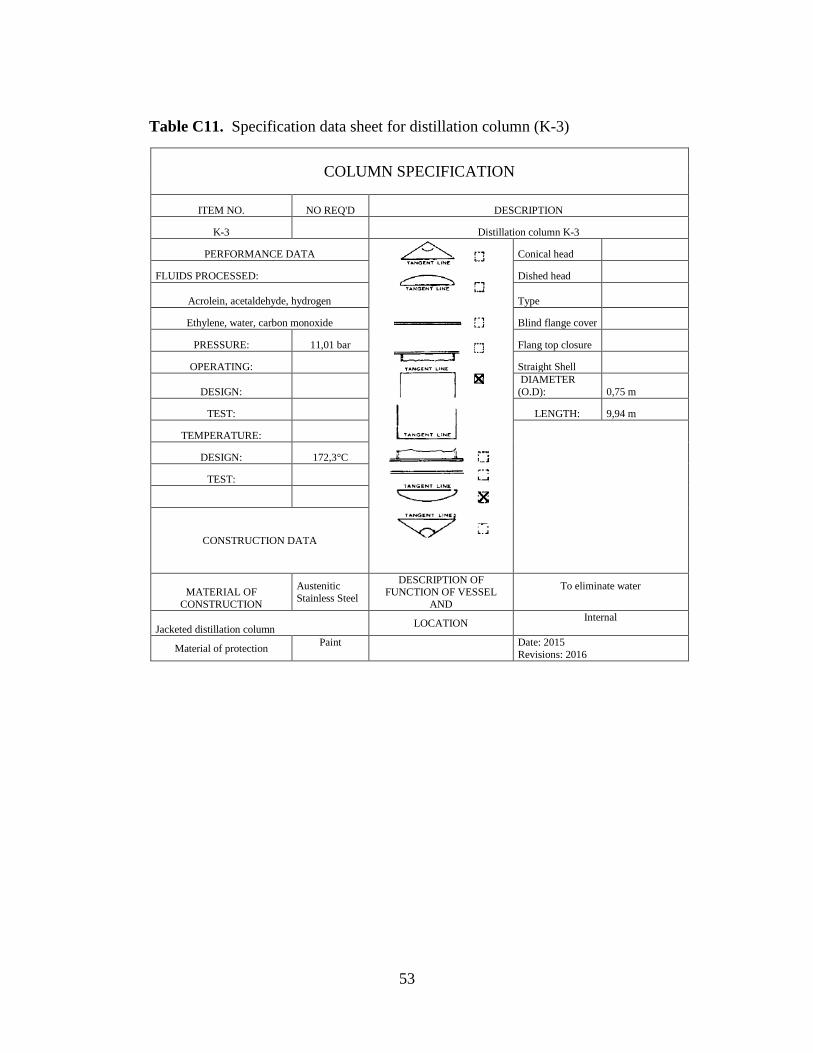
53
Table C11. Specification data sheet for distillation column (K-3)
COLUMN SPECIFICATION
ITEM NO. NO REQ'D DESCRIPTION
K-3 Distillation column K-3
PERFORMANCE DATA
Conical head
FLUIDS PROCESSED: Dished head
Acrolein, acetaldehyde, hydrogen
Type
Ethylene, water, carbon monoxide Blind flange cover
PRESSURE: 11,01 bar Flang top closure
OPERATING: Straight Shell
DESIGN:
DIAMETER
(O.D): 0,75 m
TEST: LENGTH: 9,94 m
TEMPERATURE:
DESIGN: 172,3°C
TEST:
CONSTRUCTION DATA
MATERIAL OF
CONSTRUCTION
Austenitic
Stainless Steel
DESCRIPTION OF FUNCTION OF VESSEL
AND
To eliminate water
Jacketed distillation column LOCATION
Internal
Material of protection Paint
Date: 2015
Revisions: 2016

54
Table C12. Specification data sheet for distillation column (K-4)
COLUMN SPECIFICATION
ITEM NO. NO REQ'D DESCRIPTION
K-4 Distillation column K-4
PERFORMANCE DATA
Conical head
FLUIDS PROCESSED: Dished head
Acrolein, acetaldehyde, water
Type
Blind flange cover
PRESSURE: 11,01 bar Flang top closure
OPERATING: Straight Shell
DESIGN:
DIAMETER
(O.D): 0,77 m
TEST: LENGTH: 10,96 m
TEMPERATURE:
DESIGN: 183,3°C
TEST:
CONSTRUCTION DATA
MATERIAL OF CONSTRUCTION
Austenitic Stainless Steel
DESCRIPTION OF
FUNCTION OF VESSEL
AND
It is used to separate acetaldehyde from the acrolein and other
compounds
Jacketed distillation column LOCATION
Internal
Material of protection Paint
Date: 2015 Revisions: 2016
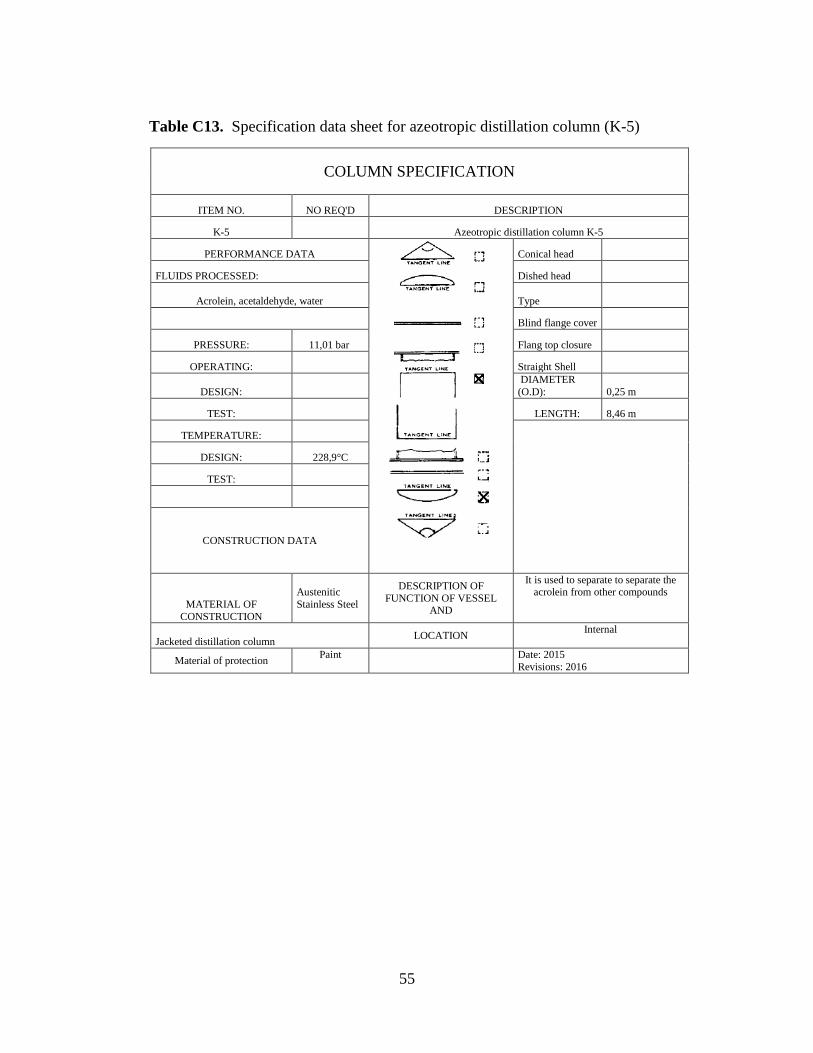
55
Table C13. Specification data sheet for azeotropic distillation column (K-5)
COLUMN SPECIFICATION
ITEM NO. NO REQ'D DESCRIPTION
K-5 Azeotropic distillation column K-5
PERFORMANCE DATA
Conical head
FLUIDS PROCESSED: Dished head
Acrolein, acetaldehyde, water
Type
Blind flange cover
PRESSURE: 11,01 bar Flang top closure
OPERATING: Straight Shell
DESIGN:
DIAMETER
(O.D): 0,25 m
TEST: LENGTH: 8,46 m
TEMPERATURE:
DESIGN: 228,9°C
TEST:
CONSTRUCTION DATA
MATERIAL OF
CONSTRUCTION
Austenitic
Stainless Steel
DESCRIPTION OF
FUNCTION OF VESSEL AND
It is used to separate to separate the acrolein from other compounds
Jacketed distillation column LOCATION
Internal
Material of protection Paint
Date: 2015
Revisions: 2016

56
Table C14. Specification data sheet for distillation column (K-6)
COLUMN SPECIFICATION
ITEM NO. NO REQ'D DESCRIPTION
K-6 Distillation column K-6
PERFORMANCE DATA
Conical head
FLUIDS PROCESSED: Dished head
Glycerol, water
Type
Blind flange cover
PRESSURE: 11,01 bar Flang top closure
OPERATING: Straight Shell
DESIGN: DIAMETER (O.D): 0,91 m
TEST: LENGTH: 5,6 m
TEMPERATURE:
DESIGN: 383°C
TEST:
CONSTRUCTION DATA
MATERIAL OF
CONSTRUCTION
Austenitic
Stainless Steel
DESCRIPTION OF
FUNCTION OF VESSEL AND
To purify glycerol and recycle it to K-5
Jacketed distillation column LOCATION
Internal
Material of protection Paint
Date: 2015 Revisions: 2016

57
Table C15. Specification data sheet for fixed tube heat exchanger or cooler (W-9)
STANDARDS OF TUBULAR EXCHANGER MANUFACTURERS ASSOCIATION
EXCHANGER SPECIFICATION SHEET
CUSTOMER: Acrolein production plant JOB NO.
REFERENCE NO. W-9
ADRESS INQUIRY NO.
PLANT LOCATION: Santa Marta DATE: 11/2015
SERVICE OF UNIT ITEM NO.
SIZE TYPE: Fixed tube CONNECTED IN
GROSS SURFACE PR UNIT SHELLS PER UNIT SURFACE PER SHELL
PERFORMANCE OF ONE UNIT
SHELL SIDE TUBE SIDE
FLUID CIRCULATE Cooling water Glycerol-out
TOTAL FLUID ENTERING (Kmol/h) 1,3265 6,2757
VAPOR (Kmol/h)
LIQUID (Kmol/h) 1,3265 6,2757
STEAM (Kmol/h)
SPECIFIC HEAT-LIQUIDS 972 BTU/LB/°F 1,37 BTU/LB/°F
LATENT HEAT-VAPORS BTU/LB/°F BTU/LB/°F
TEMPERATURE IN 89,33 °F 721,44 °F
TEMPERATURE OUT 107,33 °F 176 °F
OPERATING PRESSURE PSI PSI
NUMBER OF PASES PER SHELL 1 1
VELOCITY FT/SEC FT/SEC
PRESSURE DROP
FOULING RESISTANCE
HEAT EXCHANGED-BTU/HR M.T.D (Corrected)
TRANSFER RATE-SERVICE EFF SURFACE PER UNIT
CONSTRUCTION
DESIGN PRESSURE 160 PSI PSI
TEST PRESSURE PSI PSI
DESIGN TEMPERATURE °F °F
TUBES NO. 36688 O.D. 0,75” BWG LENGTH 26’ PITCH
SHELL I.D. 1’ O.D.
SHELL COVER FLOATING HAD COVER
CORROSION ALLOWANCE-SHELL SIDE 0,04 in TUBE SIDE 0,04 in
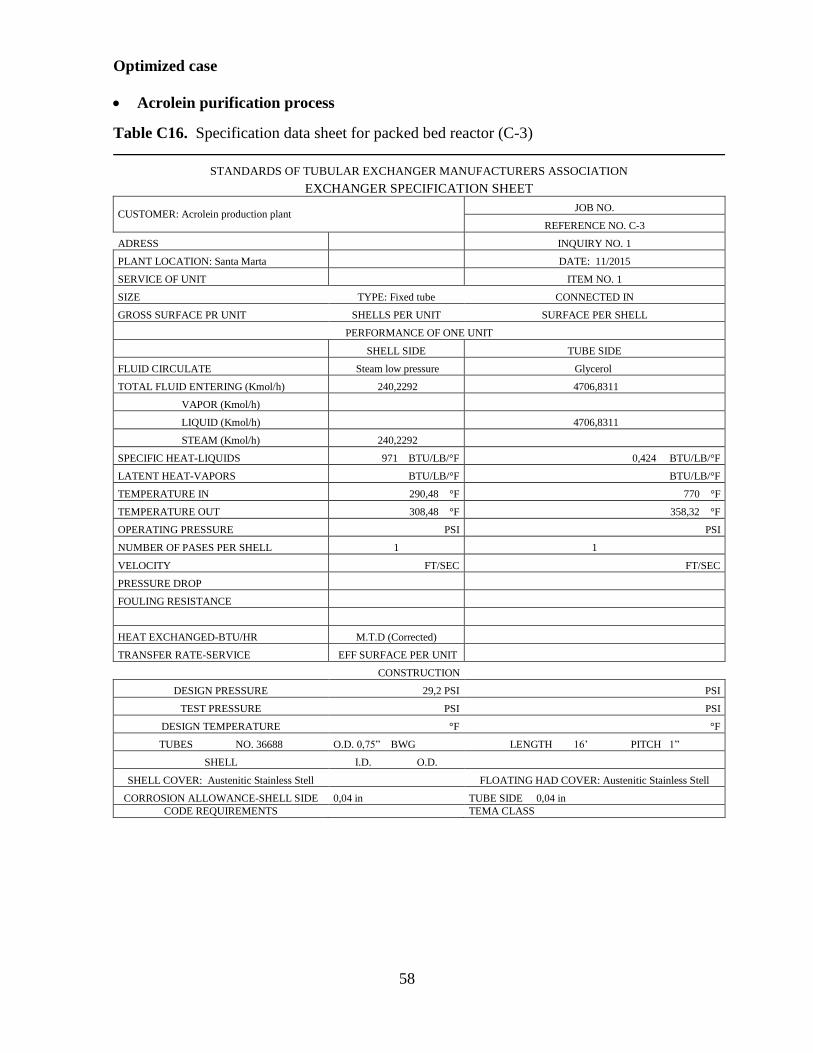
58
Optimized case
Acrolein purification process
Table C16. Specification data sheet for packed bed reactor (C-3)
STANDARDS OF TUBULAR EXCHANGER MANUFACTURERS ASSOCIATION
EXCHANGER SPECIFICATION SHEET
CUSTOMER: Acrolein production plant JOB NO.
REFERENCE NO. C-3
ADRESS INQUIRY NO. 1
PLANT LOCATION: Santa Marta DATE: 11/2015
SERVICE OF UNIT ITEM NO. 1
SIZE TYPE: Fixed tube CONNECTED IN
GROSS SURFACE PR UNIT SHELLS PER UNIT SURFACE PER SHELL
PERFORMANCE OF ONE UNIT
SHELL SIDE TUBE SIDE
FLUID CIRCULATE Steam low pressure Glycerol
TOTAL FLUID ENTERING (Kmol/h) 240,2292 4706,8311
VAPOR (Kmol/h)
LIQUID (Kmol/h) 4706,8311
STEAM (Kmol/h) 240,2292
SPECIFIC HEAT-LIQUIDS 971 BTU/LB/°F 0,424 BTU/LB/°F
LATENT HEAT-VAPORS BTU/LB/°F BTU/LB/°F
TEMPERATURE IN 290,48 °F 770 °F
TEMPERATURE OUT 308,48 °F 358,32 °F
OPERATING PRESSURE PSI PSI
NUMBER OF PASES PER SHELL 1 1
VELOCITY FT/SEC FT/SEC
PRESSURE DROP
FOULING RESISTANCE
HEAT EXCHANGED-BTU/HR M.T.D (Corrected)
TRANSFER RATE-SERVICE EFF SURFACE PER UNIT
CONSTRUCTION
DESIGN PRESSURE 29,2 PSI PSI
TEST PRESSURE PSI PSI
DESIGN TEMPERATURE °F °F
TUBES NO. 36688 O.D. 0,75” BWG LENGTH 16’ PITCH 1”
SHELL I.D. O.D.
SHELL COVER: Austenitic Stainless Stell FLOATING HAD COVER: Austenitic Stainless Stell
CORROSION ALLOWANCE-SHELL SIDE 0,04 in TUBE SIDE 0,04 in
CODE REQUIREMENTS TEMA CLASS
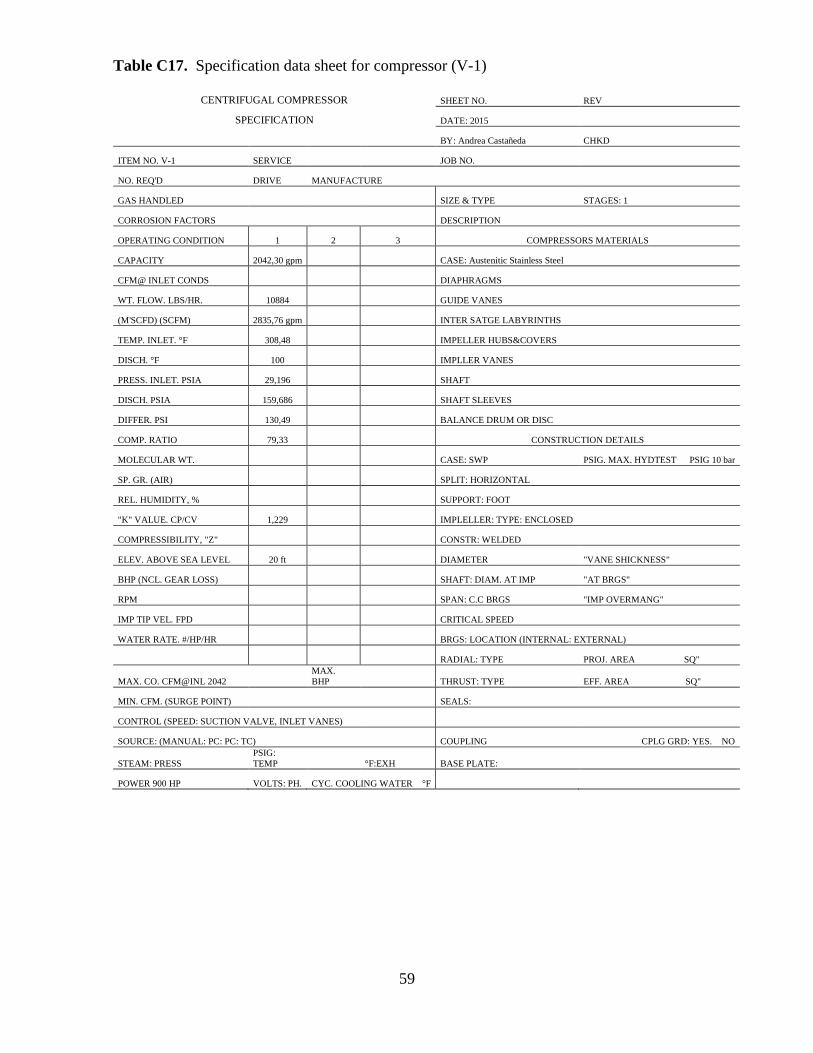
59
Table C17. Specification data sheet for compressor (V-1)
CENTRIFUGAL COMPRESSOR SHEET NO. REV
SPECIFICATION DATE: 2015
BY: Andrea Castañeda CHKD
ITEM NO. V-1 SERVICE JOB NO.
NO. REQ'D DRIVE MANUFACTURE
GAS HANDLED SIZE & TYPE STAGES: 1
CORROSION FACTORS DESCRIPTION
OPERATING CONDITION 1 2 3 COMPRESSORS MATERIALS
CAPACITY 2042,30 gpm CASE: Austenitic Stainless Steel
CFM@ INLET CONDS DIAPHRAGMS
WT. FLOW. LBS/HR. 10884 GUIDE VANES
(M'SCFD) (SCFM) 2835,76 gpm INTER SATGE LABYRINTHS
TEMP. INLET. °F 308,48 IMPELLER HUBS&COVERS
DISCH. °F 100 IMPLLER VANES
PRESS. INLET. PSIA 29,196 SHAFT
DISCH. PSIA 159,686 SHAFT SLEEVES
DIFFER. PSI 130,49 BALANCE DRUM OR DISC
COMP. RATIO 79,33 CONSTRUCTION DETAILS
MOLECULAR WT. CASE: SWP PSIG. MAX. HYDTEST PSIG 10 bar
SP. GR. (AIR) SPLIT: HORIZONTAL
REL. HUMIDITY, % SUPPORT: FOOT
"K" VALUE. CP/CV 1,229 IMPLELLER: TYPE: ENCLOSED
COMPRESSIBILITY, "Z" CONSTR: WELDED
ELEV. ABOVE SEA LEVEL 20 ft DIAMETER "VANE SHICKNESS"
BHP (NCL. GEAR LOSS) SHAFT: DIAM. AT IMP "AT BRGS"
RPM SPAN: C.C BRGS "IMP OVERMANG"
IMP TIP VEL. FPD CRITICAL SPEED
WATER RATE. #/HP/HR BRGS: LOCATION (INTERNAL: EXTERNAL)
RADIAL: TYPE PROJ. AREA SQ"
MAX. CO. CFM@INL 2042
MAX.
BHP THRUST: TYPE EFF. AREA SQ"
MIN. CFM. (SURGE POINT) SEALS:
CONTROL (SPEED: SUCTION VALVE, INLET VANES)
SOURCE: (MANUAL: PC: PC: TC) COUPLING CPLG GRD: YES. NO
STEAM: PRESS
PSIG:
TEMP °F:EXH BASE PLATE:
POWER 900 HP VOLTS: PH. CYC. COOLING WATER °F

60
Table C18. Specification data sheet for fixed tube heat exchanger or cooler (W-4)
STANDARDS OF TUBULAR EXCHANGER MANUFACTURERS ASSOCIATION
EXCHANGER SPECIFICATION SHEET
CUSTOMER: Acrolein production plant JOB NO.
REFERENCE NO. W-4
ADRESS INQUIRY NO.
PLANT LOCATION: Santa Marta DATE: 11/2015
SERVICE OF UNIT ITEM NO.
SIZE TYPE: Fixed tube CONNECTED IN
GROSS SURFACE PR UNIT SHELLS PER UNIT SURFACE PER SHELL
PERFORMANCE OF ONE UNIT
SHELL SIDE TUBE SIDE
FLUID CIRCULATE Cooling water Gas 1-P
TOTAL FLUID ENTERING (Kmol/h) 186,47
VAPOR (Kmol/h)
LIQUID (Kmol/h) 4,7331
STEAM (Kmol/h)
SPECIFIC HEAT-LIQUIDS 972 BTU/LB/°F BTU/LB/°F
LATENT HEAT-VAPORS BTU/LB/°F BTU/LB/°F
TEMPERATURE IN 75,92 °F 723,866 °F
TEMPERATURE OUT 93,91 °F 93,92 °F
OPERATING PRESSURE PSI PSI
NUMBER OF PASES PER SHELL 1 1
VELOCITY FT/SEC FT/SEC
PRESSURE DROP
FOULING RESISTANCE
HEAT EXCHANGED-BTU/HR M.T.D (Corrected)
TRANSFER RATE-SERVICE EFF SURFACE PER UNIT
CONSTRUCTION
DESIGN PRESSURE 160 PSI PSI
TEST PRESSURE PSI PSI
DESIGN TEMPERATURE °F °F
TUBES NO. O.D. 0,75” BWG LENGTH 16’ PITCH 1”
SHELL I.D. O.D. 3’
SHELL COVER: Austenitic Stainless Stell FLOATING HAD COVER: Austenitic Stainless Stell
CORROSION ALLOWANCE-SHELL SIDE 0,04 in TUBE SIDE 0,04 in

61
Table C19. Specification data sheet for flash separator (K-2)
COLUMN SPECIFICATION
ITEM NO. NO REQ'D DESCRIPTION
K-2 Flash separator K-2
PERFORMANCE DATA
Conical head
FLUIDS PROCESSED: Dished head
Acrolein, acetaldehyde, hydrogen, Ethylene, water, carbon monoxide
Type
Blind flange cover
PRESSURE: 11,01 bar Flang top closure
OPERATING: Straight Shell
DESIGN:
DIAMETER
(O.D): 0,28 m
TEST: LENGTH: 1,39 m
TEMPERATURE:
DESIGN: 34,4°C
TEST:
CONSTRUCTION DATA
MATERIAL OF CONSTRUCTION
Austenitic
Stainless Steel
DESCRIPTION OF
FUNCTION OF VESSEL AND
It is used to separate the non-
condensable gases
Jacketed flash separator LOCATION
Internal
Material of protection Paint
Date: 2015 Revisions: 2016
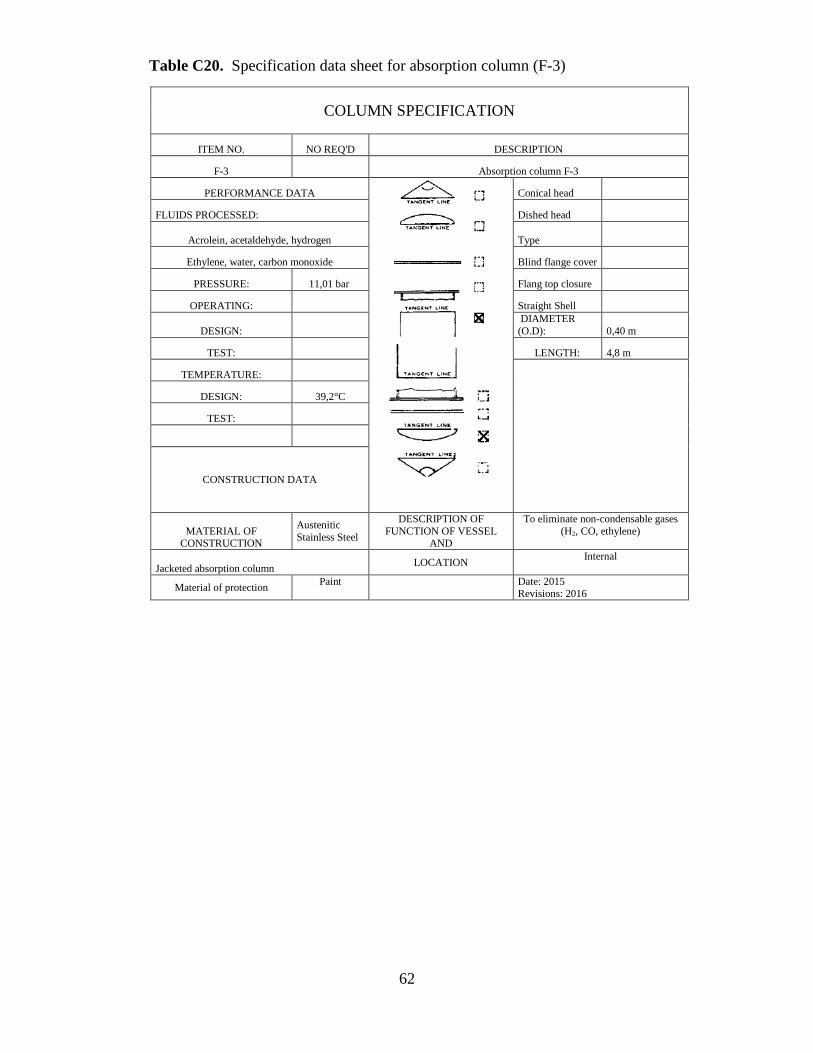
62
Table C20. Specification data sheet for absorption column (F-3)
COLUMN SPECIFICATION
ITEM NO. NO REQ'D DESCRIPTION
F-3 Absorption column F-3
PERFORMANCE DATA
Conical head
FLUIDS PROCESSED: Dished head
Acrolein, acetaldehyde, hydrogen
Type
Ethylene, water, carbon monoxide Blind flange cover
PRESSURE: 11,01 bar Flang top closure
OPERATING: Straight Shell
DESIGN:
DIAMETER
(O.D): 0,40 m
TEST: LENGTH: 4,8 m
TEMPERATURE:
DESIGN: 39,2°C
TEST:
CONSTRUCTION DATA
MATERIAL OF CONSTRUCTION
Austenitic
Stainless Steel
DESCRIPTION OF
FUNCTION OF VESSEL AND
To eliminate non-condensable gases
(H2, CO, ethylene)
Jacketed absorption column LOCATION
Internal
Material of protection Paint
Date: 2015 Revisions: 2016

63
Table C21. Specification data sheet for distillation column (K-3)
COLUMN SPECIFICATION
ITEM NO. NO REQ'D DESCRIPTION
K-3 Distillation column K-3
PERFORMANCE DATA
Conical head
FLUIDS PROCESSED: Dished head
Acrolein, acetaldehyde, hydrogen
Type
Ethylene, water, carbon monoxide Blind flange cover
PRESSURE: 11,01 bar Flang top closure
OPERATING: Straight Shell
DESIGN: DIAMETER (O.D): 1,24 m
TEST: LENGTH: 9,95 m
TEMPERATURE:
DESIGN: 173,1°C
TEST:
CONSTRUCTION DATA
MATERIAL OF
CONSTRUCTION
Austenitic
Stainless Steel
DESCRIPTION OF
FUNCTION OF VESSEL
AND
To eliminate water
Jacketed distillation column LOCATION
Internal
Material of protection Paint
Date: 2015
Revisions: 2016

64
Table C22. Specification data sheet for distillation column (K-4)
COLUMN SPECIFICATION
ITEM NO. NO REQ'D DESCRIPTION
K-4 Distillation column K-4
PERFORMANCE DATA
Conical head
FLUIDS PROCESSED: Dished head
Acrolein, acetaldehyde, water
Type
Blind flange cover
PRESSURE: 11,01 bar Flang top closure
OPERATING: Straight Shell
DESIGN: DIAMETER (O.D): 1,25 m
TEST: LENGTH: 10,96 m
TEMPERATURE:
DESIGN: 138,5°C
TEST:
CONSTRUCTION DATA
MATERIAL OF
CONSTRUCTION
Austenitic
Stainless Steel
DESCRIPTION OF
FUNCTION OF VESSEL AND
It is used to separate acetaldehyde
from the acrolein and other
compounds
Jacketed distillation column LOCATION
Internal
Material of protection Paint
Date: 2015
Revisions: 2016

65
Table C23. Specification data sheet for azeotropic distillation column (K-5)
COLUMN SPECIFICATION
ITEM NO. NO REQ'D DESCRIPTION
K-5 Azeotropic distillation column K-5
PERFORMANCE DATA
Conical head
FLUIDS PROCESSED: Dished head
Acrolein, acetaldehyde, water
Type
Blind flange cover
PRESSURE: 11,01 bar Flang top closure
OPERATING: Straight Shell
DESIGN: DIAMETER (O.D): 0,50 m
TEST: LENGTH: 8,46 m
TEMPERATURE:
DESIGN: 195°C
TEST:
CONSTRUCTION DATA
MATERIAL OF
CONSTRUCTION
Austenitic
Stainless Steel
DESCRIPTION OF
FUNCTION OF VESSEL
AND
It is used to separate to separate the
acrolein from other compounds
Jacketed distillation column LOCATION
Internal
Material of protection Paint
Date: 2015
Revisions: 2016

66
Table C24. Specification data sheet for distillation column (K-6)
COLUMN SPECIFICATION
ITEM NO. NO REQ'D DESCRIPTION
K-6 Distillation column K-6
PERFORMANCE DATA
Conical head
FLUIDS PROCESSED: Dished head
Glycerol, water
Type
Blind flange cover
PRESSURE: 11,01 bar Flang top closure
OPERATING: Straight Shell
DESIGN: DIAMETER (O.D): 0,85 m
TEST: LENGTH: 5,4 m
TEMPERATURE:
DESIGN: 383°C
TEST:
CONSTRUCTION DATA
MATERIAL OF
CONSTRUCTION
Austenitic
Stainless Steel
DESCRIPTION OF
FUNCTION OF VESSEL
AND
To purify glycerol and recycle it to
K-5
Jacketed distillation column LOCATION
Internal
Material of protection Paint
Date: 2015
Revisions: 2016

67
Table C25. Specification data sheet for fixed tube heat exchanger or cooler (W-9)
STANDARDS OF TUBULAR EXCHANGER MANUFACTURERS ASSOCIATION
EXCHANGER SPECIFICATION SHEET
CUSTOMER: Acrolein production plant JOB NO.
REFERENCE NO. W-9
ADRESS INQUIRY NO.
PLANT LOCATION: Santa Marta DATE: 11/2015
SERVICE OF UNIT ITEM NO.
SIZE TYPE: Fixed tube CONNECTED IN
GROSS SURFACE PR UNIT SHELLS PER UNIT SURFACE PER SHELL
PERFORMANCE OF ONE UNIT
SHELL SIDE TUBE SIDE
FLUID CIRCULATE Cooling water Glycerol-out
TOTAL FLUID ENTERING (Kmol/h) 0,0894 0,422
VAPOR (Kmol/h)
LIQUID (Kmol/h) 0,0894 0,422
STEAM (Kmol/h)
NON-CONDENSABLES
FLUID VAPORIZED OR CONDENSED
STEAM CONDENSED
GRAVITY-LIQUID
VISCOSITY-LIQUID
MOLECULAR WEIGHT-VAPORS
SPECIFIC HEAT-LIQUIDS 972 BTU/LB/°F 1,37 BTU/LB/°F
LATENT HEAT-VAPORS BTU/LB/°F BTU/LB/°F
TEMPERATURE IN 89,33 °F 721,4 °F
TEMPERATURE OUT 107,33 °F 176 °F
OPERATING PRESSURE PSI PSI
NUMBER OF PASES PER SHELL 1 1
VELOCITY FT/SEC FT/SEC
PRESSURE DROP
FOULING RESISTANCE
HEAT EXCHANGED-BTU/HR M.T.D (Corrected)
TRANSFER RATE-SERVICE EFF SURFACE PER UNIT
CONSTRUCTION
DESIGN PRESSURE 160 PSI PSI
TEST PRESSURE PSI PSI
DESIGN TEMPERATURE °F °F
TUBES NO. O.D. 0,75” BWG LENGTH 16’ PITCH
SHELL I.D. 1’ O.D.
SHELL COVER: Austenitic Stainless Stell FLOATING HAD COVER: Austenitic Stainless Stell
CORROSION ALLOWANCE-SHELL SIDE 0,04 in TUBE SIDE 0,04 in
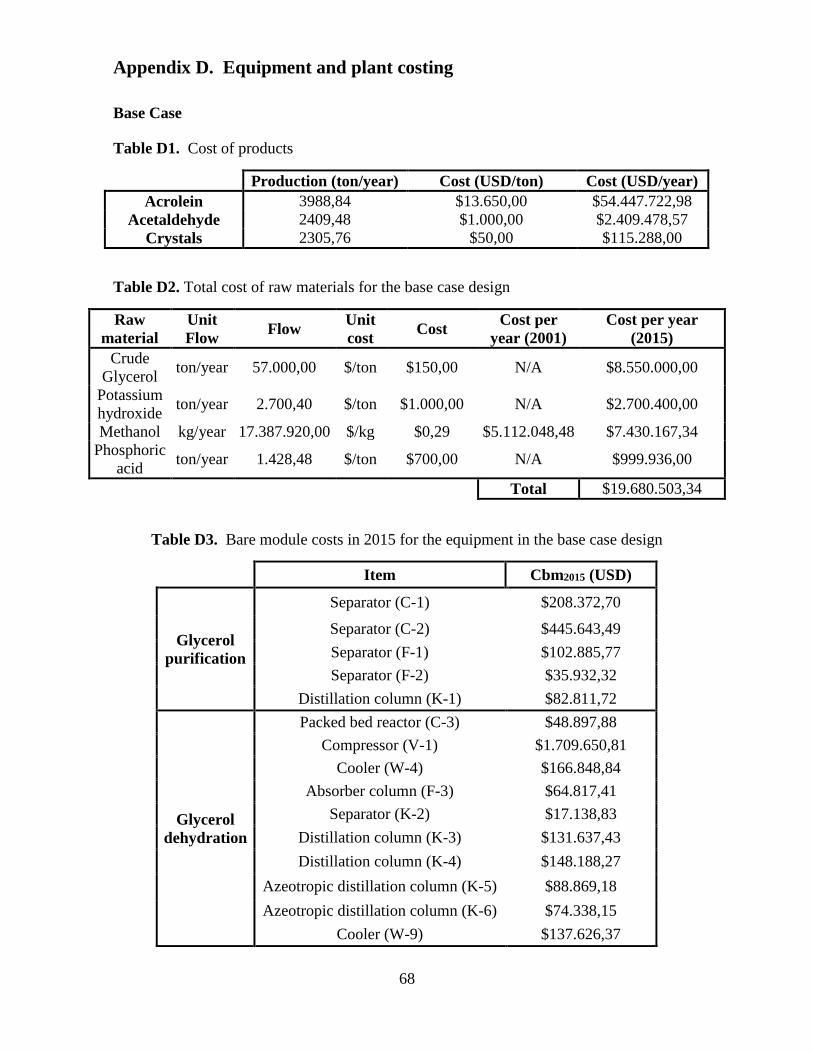
68
Appendix D. Equipment and plant costing
Base Case
Table D1. Cost of products
Production (ton/year) Cost (USD/ton) Cost (USD/year)
Acrolein 3988,84 $13.650,00 $54.447.722,98
Acetaldehyde 2409,48 $1.000,00 $2.409.478,57
Crystals 2305,76 $50,00 $115.288,00
Table D2. Total cost of raw materials for the base case design
Raw
material
Unit
Flow Flow
Unit
cost Cost
Cost per
year (2001)
Cost per year
(2015)
Crude
Glycerol ton/year 57.000,00 $/ton $150,00 N/A $8.550.000,00
Potassium
hydroxide ton/year 2.700,40 $/ton $1.000,00 N/A $2.700.400,00
Methanol kg/year 17.387.920,00 $/kg $0,29 $5.112.048,48 $7.430.167,34
Phosphoric
acid ton/year 1.428,48 $/ton $700,00 N/A $999.936,00
Total $19.680.503,34
Table D3. Bare module costs in 2015 for the equipment in the base case design
Item Cbm2015 (USD)
Glycerol
purification
Separator (C-1) $208.372,70
Separator (C-2) $445.643,49
Separator (F-1) $102.885,77
Separator (F-2) $35.932,32
Distillation column (K-1) $82.811,72
Glycerol
dehydration
Packed bed reactor (C-3) $48.897,88
Compressor (V-1) $1.709.650,81
Cooler (W-4) $166.848,84
Absorber column (F-3) $64.817,41
Separator (K-2) $17.138,83
Distillation column (K-3) $131.637,43
Distillation column (K-4) $148.188,27
Azeotropic distillation column (K-5) $88.869,18
Azeotropic distillation column (K-6) $74.338,15
Cooler (W-9) $137.626,37

69
Table D4. Cost of the operating labor for the base case design
Cost of the operating labor
Nol 3,008321791
SF 0,913242009
Work hours/year 8000
Shifts/year 1000
Shifts/operator year 300
Factor P. 3,333333333
Operators 10,0277393
Operators (rounded) 11
COL (USD/year) $550.000,00
Table D5. Utility costs calculation data for the base case design
Utility Unit utility
comsuption
Utility
consumption per
year
Unit
Cost
utility
Cost utility
Cost utility per
year (2001)
$/Año
Cost utility per
year (2015)
$/Año
V-1 Electric Distribution kWh/year 4810107,42 $/kWh $0,06 $288.606,45 $419.478,45
W-4 Cooling water m3/year 644,8275984 $/1000m3 $14,80 $9,54 $13,87
W-9 Cooling water m3/year 190,9970347 $/1000m3 $14,80 $2,83 $4,11
C-3 Steam ton/year 38779,48062 $/ton $27,70 $1.074,19 $1.561,30
Catalyst
(MFI) N/A ton 25,41721 $/ton $2.339,92 N/A $59.474,24
F-3 Other water kg/year 3294431,302 $/1000kg $1,00 $3.294,43 $4.788,33
K-2 Electric Distribution kw h/year 1039214642 $/ kw h $0,06 $62.352,88 $90.627,53
K-3 Steam Low Pressure kg/year 155145129,8 $/1000kg $27,70 $4.297.520,10 $6.246.281,43
K-4 Steam Low Pressure kg/year 140240763,3 $/1000kg $27,70 $3.884.669,14 $5.646.218,33
Cooling water m3/year 241029,4691 $/1000m3 $14,80 $3.567,24 $5.184,84
K-5 Steam Low Pressure kg/year 29207067,74 $/1000kg $27,70 $809.035,78 $1.175.902,62
K-6 Steam Low Pressure kg/year 178427029 $/1000kg $27,70 $4.942.428,70 $7.183.631,47
Cooling water m3/year 32693,11106 $/1000m3 $14,80 $483,86 $703,27
Cut (USD/year) $20.833.869,78

70
Optimized Case
Table D6. Cost of products
Production (ton/year) Cost (USD/ton) Cost (USD/year)
Acrolein 11107,44 $13.650,00 $151.616.499,39
Acetaldehyde 1961,39 $1.000,00 $1.961.390,36
Crystals 2305,76 $50,00 $115.288,00
Table D7. Bare module costs in 2015 for the equipment in the optimized case design
Item Cbm2015 (USD)
Glycerol
purification
Separator (C-1) $208.372,70
Separator (C-2) $445.643,49
Separator (F-1) $102.885,77
Separator (F-2) $35.932,32
Distillation column (K-1) $82.811,72
Glycerol
dehydration
Packed bed reactor (C-3) $50.085,63
Compressor (V-1) $1.709.650,81
Cooler (W-4) $167.888,32
Absorber column (F-3) $56.744,30
Separator (K-2) $13.930,42
Distillation column (K-3) $223.843,87
Distillation column (K-4) $300.170,42
Azeotropic distillation column (K-5) $84.941,44
Azeotropic distillation column (K-6) $67.593,87
Cooler (W-9) $234.741,78
Table D8. Cost of the operating labor for the optimized case design
Cost of the operating labor
Nol 3,008321791
SF 0,913242009
Work hours/year 8000
Shifts/year 1000
Shifts/operator year 300
Factor P. 3,333333333
Operators 10,0277393
Operators (rounded) 11
COL (USD/year) $550.000,00

71
Table D9. Utility costs calculation data for the optimized case design
Utility Unit utility
comsuption
Utility
consumption per
year
Unit Cost
utility
Cost
utility
Cost utility per
year (2001)
$/Año
Cost utility per
year (2015)
$/Año
V-1 Electric
Distribution kWh/year 4565080,7341 $/kWh $0,06 $ 273.904,84 $398.110,24
W-4 Cooling water m3/year 681,5663 $/1000m3 $14,80 $10,09 $14,66
W-9 Cooling water m3/year 12,8664 $/1000m3 $14,80 $0,19 $0,28
C-3 Steam ton/year 34593,0113 $/ton $27,70 $958,23 $1.392,75
Catalyst
(MFI) N/A ton 25,4172 $/ton $2.339,92 N/A $59.474,24
F-3 Other water kg/year 3294431,3016 $/1000kg $1,00 $3.294,43 $4.788,33
K-2 Electric
Distribution kw h/year 1063099112,3695 $/ kw h $0,06 $63.785,945 $92.710,44
K-3 Steam Low
Pressure kg/year 232342862,1364 $/1000kg $27,70 $6.435.897,28 $9.354.331,05
K-4
Steam Low
Pressure kg/year 287163823,2035 $/1000kg $27,70 $7.954.437,90 $11.561.471,88
Cooling water m3/year 537714,9503 $/1000m3 $14,80 $7.958,18 $11.566,91
K-5 Steam Low
Pressure kg/year 77201228,0539 $/1000kg $27,70 $2.138.474,02 $3.108.190,36
K-6
Steam Low
Pressure kg/year 118683771,6832 $/1000kg $27,70 $3.287.540,48 $4.778.314,60
Cooling water m3/year 28396,6965 $/1000m3 $14,80 $420,27 $610,85
Cut (USD/year) $29.370.976,57
Appendix E. Economic evaluation data
Base Case
Table E1. Initial data for the calculation of the cash flow statement for the base case
design
Cost of Land, L $437.343,29
Fixed capital investment $4.087.177,82
Cost of operating labor $550.000,00
Plant start-up End Year 2
Revenue after start-up $56.972.489,55
Cost of manufacturing $54.441.308,63
Taxes 60%
Fixed capital investment
with depreciation $272,475
Depreciation Use 10-year

72
Table E2. Cash flow statement for the base case plant design for the production of acrolein
End of
year (k) Investment dk
CTM -
SUM(dk) R COMd
(R-COM-
dk)*(1-t)+dk Cash Flow
Cumulative Cash
Flow
0 ($437.343,29) $0,00 $4.087.118,00 $0,00 $0,00 $0,00 ($437.343,29) ($437.343,00)
1 ($4.087.117,82) $0,00 $4.087.118,00 $0,00 $0,00 $0,00 ($4.087.117,82) ($4.524.461,00)
2 ($550.000,00) $0,00 $4.087.118,00 $0,00 $0,00 $0,00 ($550.000,00) ($5.074.461,00)
3 $0,00 $408.712,00 $3.678.406,00 $56.972.490,00 $54.441.309,00 $1.257.699,44 $1.257.699,44 ($3.816.761,66)
4 $0,00 $408.712,00 $3.269.694,00 $56.972.490,00 $54.441.309,00 $1.257.699,44 $1.257.699,44 ($2.559.062,20)
5 $0,00 $408.712,00 $2.860.982,50 $56.972.490,00 $54.441.309,00 $1.257.699,44 $1.257.699,44 ($1.301.362,79)
6 $0,00 $408.712,00 $2.452.270,69 $56.972.490,00 $54.441.309,00 $1.257.699,44 $1.257.699,44 ($43.663,35)
7 $0,00 $408.712,00 $2.043.558,91 $56.972.490,00 $54.441.309,00 $1.257.699,44 $1.257.699,44 $1.214.036,08
8 $0,00 $408.712,00 $1.634.847,10 $56.972.490,00 $54.441.309,00 $1.257.699,44 $1.257.699,44 $2.471.736,00
9 $0,00 $408.712,00 $1.226.135,30 $56.972.490,00 $54.441.309,00 $1.257.699,44 $1.257.699,44 $3.729.434,96
10 $0,00 $408.712,00 $817.423,60 $56.972.490,00 $54.441.309,00 $1.257.699,44 $1.257.699,44 $4.987.134,40
11 $0,00 $408.712,00 $408.711,80 $56.972.490,00 $54.441.309,00 $1.257.699,44 $1.257.699,44 $6.244.833,83
12 $987.343,29 $408.712,00 $0,00 $56.972.490,00 $54.441.309,00 $1.366.689,25 $2.354.032,53 $8.598.866,40
-Numbers in () are negative cash flows
-R=Revenue
-dk= Costs of manufacturing/Depreciation
-t=Taxes
-CTM= Fixed capital investment
-COMd= Cost of manufacturing without depreciation
Optimized Case
Table E3. Initial data for the calculation of the cash flow statement for the optimized case
design
Cost of Land, L $437.343,29
Fixed capital investment $4.466.579,49
Cost of operating labor $550.000,00
Plant start-up End Year 2
Revenue after start-up $153.693.177,75
Cost of manufacturing $64.308.168,89
Taxes 60%
Fixed capital investment
with depreciation $297.772
Depreciation Use 10-year
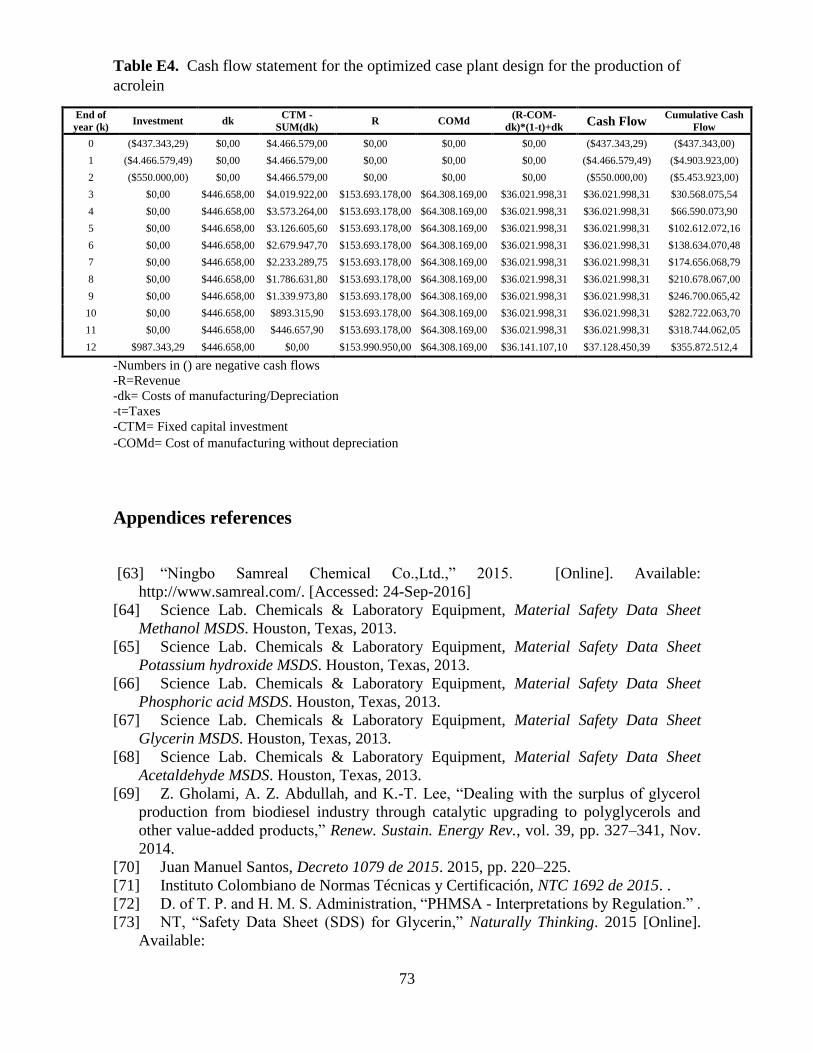
73
Table E4. Cash flow statement for the optimized case plant design for the production of
acrolein
End of
year (k) Investment dk
CTM -
SUM(dk) R COMd
(R-COM-
dk)*(1-t)+dk Cash Flow
Cumulative Cash
Flow
0 ($437.343,29) $0,00 $4.466.579,00 $0,00 $0,00 $0,00 ($437.343,29) ($437.343,00)
1 ($4.466.579,49) $0,00 $4.466.579,00 $0,00 $0,00 $0,00 ($4.466.579,49) ($4.903.923,00)
2 ($550.000,00) $0,00 $4.466.579,00 $0,00 $0,00 $0,00 ($550.000,00) ($5.453.923,00)
3 $0,00 $446.658,00 $4.019.922,00 $153.693.178,00 $64.308.169,00 $36.021.998,31 $36.021.998,31 $30.568.075,54
4 $0,00 $446.658,00 $3.573.264,00 $153.693.178,00 $64.308.169,00 $36.021.998,31 $36.021.998,31 $66.590.073,90
5 $0,00 $446.658,00 $3.126.605,60 $153.693.178,00 $64.308.169,00 $36.021.998,31 $36.021.998,31 $102.612.072,16
6 $0,00 $446.658,00 $2.679.947,70 $153.693.178,00 $64.308.169,00 $36.021.998,31 $36.021.998,31 $138.634.070,48
7 $0,00 $446.658,00 $2.233.289,75 $153.693.178,00 $64.308.169,00 $36.021.998,31 $36.021.998,31 $174.656.068,79
8 $0,00 $446.658,00 $1.786.631,80 $153.693.178,00 $64.308.169,00 $36.021.998,31 $36.021.998,31 $210.678.067,00
9 $0,00 $446.658,00 $1.339.973,80 $153.693.178,00 $64.308.169,00 $36.021.998,31 $36.021.998,31 $246.700.065,42
10 $0,00 $446.658,00 $893.315,90 $153.693.178,00 $64.308.169,00 $36.021.998,31 $36.021.998,31 $282.722.063,70
11 $0,00 $446.658,00 $446.657,90 $153.693.178,00 $64.308.169,00 $36.021.998,31 $36.021.998,31 $318.744.062,05
12 $987.343,29 $446.658,00 $0,00 $153.990.950,00 $64.308.169,00 $36.141.107,10 $37.128.450,39 $355.872.512,4
-Numbers in () are negative cash flows
-R=Revenue
-dk= Costs of manufacturing/Depreciation
-t=Taxes
-CTM= Fixed capital investment
-COMd= Cost of manufacturing without depreciation
Appendices references
[63] “Ningbo Samreal Chemical Co.,Ltd.,” 2015. [Online]. Available:
http://www.samreal.com/. [Accessed: 24-Sep-2016]
[64] Science Lab. Chemicals & Laboratory Equipment, Material Safety Data Sheet
Methanol MSDS. Houston, Texas, 2013.
[65] Science Lab. Chemicals & Laboratory Equipment, Material Safety Data Sheet
Potassium hydroxide MSDS. Houston, Texas, 2013.
[66] Science Lab. Chemicals & Laboratory Equipment, Material Safety Data Sheet
Phosphoric acid MSDS. Houston, Texas, 2013.
[67] Science Lab. Chemicals & Laboratory Equipment, Material Safety Data Sheet
Glycerin MSDS. Houston, Texas, 2013.
[68] Science Lab. Chemicals & Laboratory Equipment, Material Safety Data Sheet
Acetaldehyde MSDS. Houston, Texas, 2013.
[69] Z. Gholami, A. Z. Abdullah, and K.-T. Lee, “Dealing with the surplus of glycerol
production from biodiesel industry through catalytic upgrading to polyglycerols and
other value-added products,” Renew. Sustain. Energy Rev., vol. 39, pp. 327–341, Nov.
2014.
[70] Juan Manuel Santos, Decreto 1079 de 2015. 2015, pp. 220–225.
[71] Instituto Colombiano de Normas Técnicas y Certificación, NTC 1692 de 2015. .
[72] D. of T. P. and H. M. S. Administration, “PHMSA - Interpretations by Regulation.” .
[73] NT, “Safety Data Sheet (SDS) for Glycerin,” Naturally Thinking. 2015 [Online].
Available:

74
http://www.tox2u.com/CNPN/msds_generator.php?msdsinfo=5060233382057.
[Accessed: 06-Jul-2015]
[74] R. Gómez and M. E. Meek, “ACROLEIN,” 2002. [Online]. Available:
http://www.who.int/ipcs/publications/cicad/en/cicad43.pdf
[75] IPCS International Programme on Chemical Safety, “Acrolein (HSG 67, 1991),”
1991. [Online]. Available: http://www.inchem.org/documents/hsg/hsg/hsg067.htm.
[Accessed: 05-Sep-2016]
[76] United Nations, Recommendations on the Transport Regulations of Dangerous
Goods, 17th ed., vol. I. 2011.
[77] “Chapter 3.2. Dangerous Good List,” in Recommendations on the Transport of
Dangerous Goods: Model Regulations, 16th ed., vol. I, United Nations Publications,
2009.
[78] IPCS International Programme on Chemical Safety, “Acetaldehyde (HSG 90, 1995),”
1995. [Online]. Available: http://www.inchem.org/documents/hsg/hsg/hsg90_e.htm.
[Accessed: 05-Sep-2016]
[79] World Bank Group, Doing Business 2015, 12th ed. Washington DC, 2015.
[80] Centro de Investigaciones Oceanográficas e Hidrográficas, “Climatología de los
principales puertos del Caribe Colombiano.” 2009 [Online]. Available:
http://www.cioh.org.co/meteorologia/ResumenSantaMarta.php
[81] U. IDEAM, “Mapas de Radiación Solar Global Sobre una Superficie Plana.” 2014
[Online]. Available: http://www.upme.gov.co/Docs/Atlas_Radiacion_Solar/2-
Mapas_Radiacion_Solar.pdf
[82] IGAC, “División Politico-Administrativa Departamento del Magdalena.” 2014.
[83] “Federación Nacional de Biocombustibles de Colombia,” fedebicombustibles.com.
[Online]. Available: http://www.fedebiocombustibles.com/nota-web-id-923.htm
[84] Solano D., Sergio Paolo, “Las disputas por el control del mercado laboral en los
puertos del Caribe colombiano, 1850-1930,” 2010.
[85] Bautista Monroy, Leonardo, “Zona Franca de Santa Marta.” 10-Nov-2011.
[86] Mincomercio Industria y Turismo, “Normatividad - Zonas Francas,” 2015. [Online].
Available: http://www.mincit.gov.co/publicaciones.php?id=15891. [Accessed: 04-Sep-
2016]
[87] Distrito turístico, cultural, Acuerdo N° 011. 2006.