process Design principles - Actuaries' Club of Boston
24
ACTUARIAL TRANSFORMATION Trends and insights across data, processes, and people May 2021
Transcript of process Design principles - Actuaries' Club of Boston

ACTUARIAL TRANSFORMATIONTrends and insights across data, processes, and people
May 2021
CONFIDENTIALITYOur clients’ industries are extremely competitive, and the maintenance of confidentiality with respect to our clients’ plans and data is critical. Oliver Wyman rigorously applies internal confidentiality practices to protect the confidentiality of all client information.
Similarly, our industry is very competitive. We view our approaches and insights as proprietary and therefore look to our clients to protect our interests in our proposals, presentations, methodologies, and analytical techniques. Under no circumstances should this material be shared with any third party without the prior written consent of Oliver Wyman.
© Oliver Wyman
3© Oliver Wyman
CONT
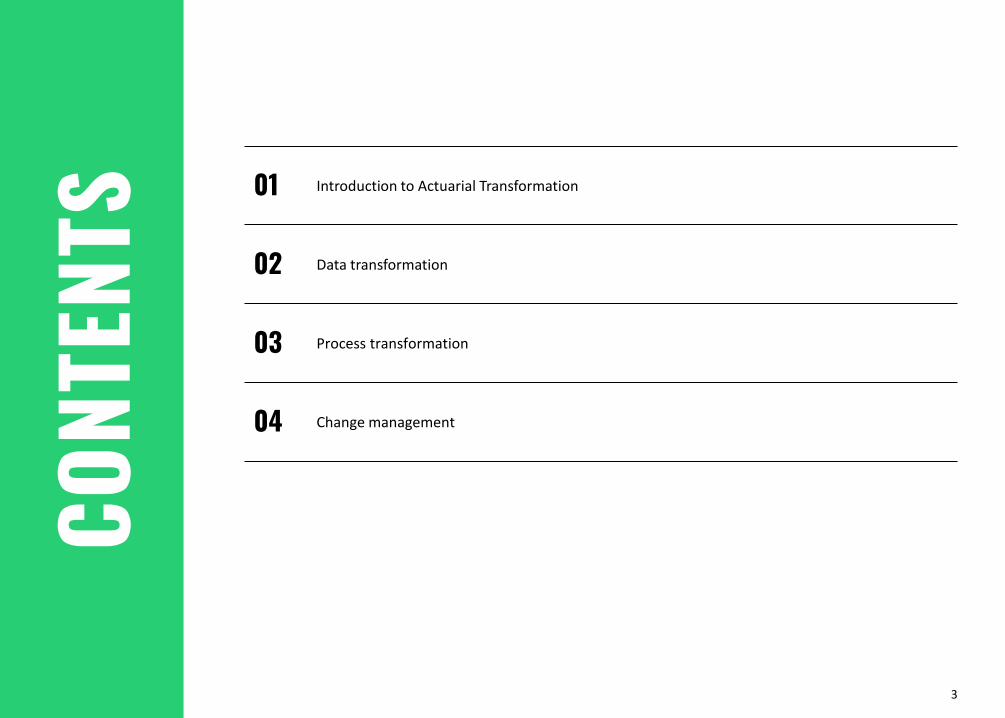
ENTS 01 Introduction to Actuarial Transformation
02 Data transformation
03 Process transformation
04 Change management

INTRODUCTION TO ACTUARIAL TRANSFORMATION
1

5© Oliver Wyman
ACTUARIAL TRANSFORMATION – VISION
FUTURE STATE75% of actuarial time is spent on analysis
and insight
CURRENT STATEMajority of time spent
on manual runs and data manipulation
DATA & TECHNOLOGY
PROCESS OPTIMIZATION
ORGANIZATIONAL EFFECTIVENESS
ACTUARIAL MODELS

6© Oliver Wyman
ACTUARIAL TRANSFORMATION – OVERVIEW
DATA & TECHNOLOGY
PROCESS OPTIMIZATION
ORGANIZATIONAL EFFECTIVENESS
ACTUARIAL MODELS
On-demand insights powered by easily accessible data from a single enterprise data solution
Robust and automated reporting delivering key metrics to management through dashboards and visualization
Strategic changes to talent development, technology vision, and governance
Streamlined forecasts and quick what-if analysis from an actuarial platform with consistent model architecture
CHALLENGES OPPORTUNITIES
Significant manual time to prepare and adjust data; issues with source systems leading to frequent data errors
Actuaries spend substantial time on routine reporting including “pressing run” on models
Underlying model structure concerns resulting in duplicated efforts for model development and use
Resources spending time on tasks not aligned to their skillset
1
2
3
4

DATA TRANSFORMATION
2

8© Oliver Wyman
Centralizing data Deploying the cloud Streamlining and accounting
DATA & TECHNOLOGYLeading companies will harness data to drive business development rather than making business decisions and dealing with data as an afterthought
3 out of 4 insurers are implementing a centralized data solution 80% of insurers are implementing
streamlined solutions to feed data to actuarial models
Implemented Implementing N/A
60% of insurers are hooking up a data repository to a standardized accounting engine
27%
9%64%
No investment in data
Big data
Traditional datawarehouse
33%
27%
38%No cloud
AWS
Azure
27% 33% 21% 18%
Improving
SAP / IA Other Homegrown
23% 34% 39% 4%
Oracle / Peoplesoft
Economies of scale is driving 2 out of every 3 insurers to the cloud
MetLife is partnered with$2.35 B 10 Insurtech startups
Access to consistently structured central data can reveal underlying
relationships and profit drivers
Processing power from the cloud unlocks new capabilities
to analyze data
Drill-down capabilities in the ledger can connect trends in financials back
to source data
Prudential spent
to acquire AssuranceIQ
MARKET INDICATORS

9© Oliver Wyman
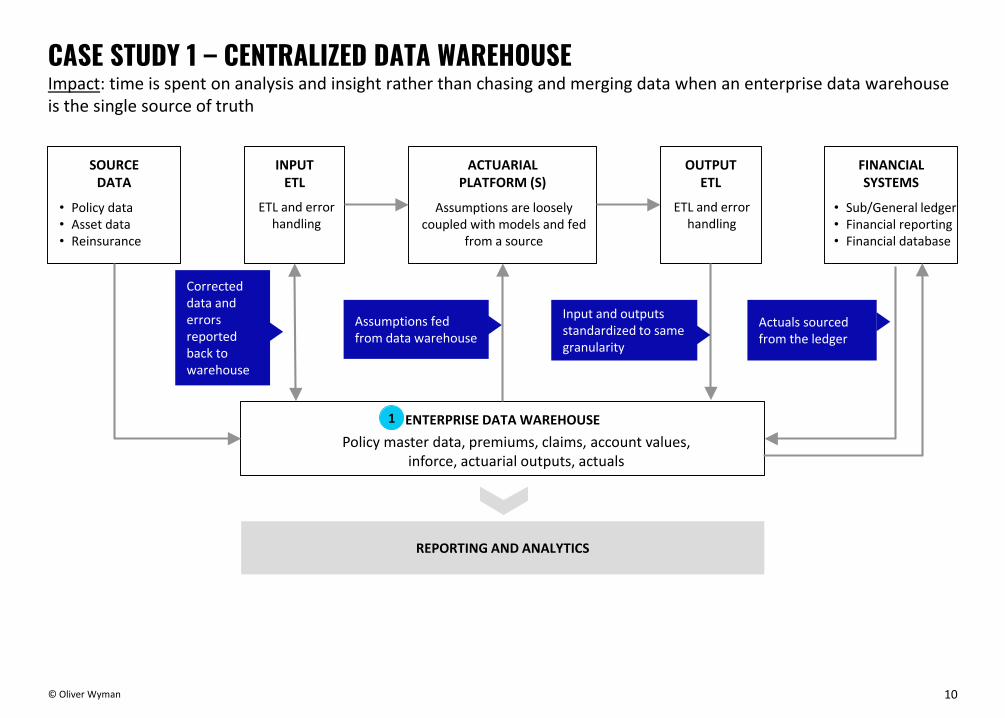
CASE STUDY 1 – CENTRALIZED DATA WAREHOUSELesson learned: data ownership and training issues must be proactively addressed because individuals who own inforce, assumptions, outputs, and actuals may resist centralizing if they feel a loss of ownership or capability
SOURCE DATA
REPORTING AND ANALYTICS
OTHER ENTERPRISE DATA
Tightly coupled assumptions and models
ACTUARIAL INFORCE
DATA
ACTUARIALPLATFORM (S)
ACTUARIAL OUTPUT
DATA
FINANCIAL SYSTEMS
ASSUMPTIONS
1
2
3 4
5
• Sub/General ledger• Financial reporting• Financial database
• Policy data• Asset data• Reinsurance
Additional merging effort and manual interventions required to join across various data sources
Output data at different granularity levels than inputs
Assumptions reside in the model
Policy master data, premiums, claims, account values
ETL and storage ETL and storage
Actuals sourced from the ledger
Querying data from various sources into a single reporting interface requires substantial effort to merge, join, and analyze
10© Oliver Wyman
SOURCE DATA
ENTERPRISE DATA WAREHOUSE
REPORTING AND ANALYTICS
Assumptions are loosely coupled with models and fed
from a source
INPUTETL
ACTUARIALPLATFORM (S)
OUTPUTETL
FINANCIAL SYSTEMS
1
• Sub/General ledger• Financial reporting• Financial database
• Policy data• Asset data• Reinsurance
Policy master data, premiums, claims, account values, inforce, actuarial outputs, actuals
Corrected data and errors reported back to warehouse
ETL and error handling
ETL and error handling
Input and outputs standardized to same granularity
Assumptions fed from data warehouse
CASE STUDY 1 – CENTRALIZED DATA WAREHOUSEImpact: time is spent on analysis and insight rather than chasing and merging data when an enterprise data warehouse is the single source of truth
Actuals sourced from the ledger
11© Oliver Wyman
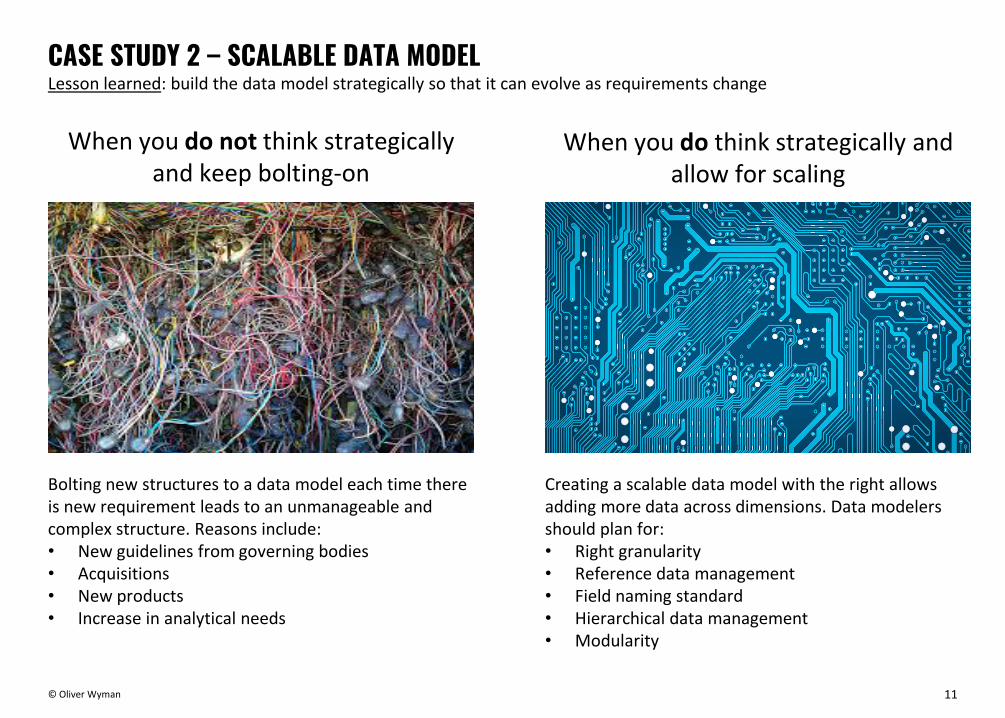
When you do not think strategically and keep bolting-on
When you do think strategically and allow for scaling
Bolting new structures to a data model each time there is new requirement leads to an unmanageable and complex structure. Reasons include:• New guidelines from governing bodies• Acquisitions• New products• Increase in analytical needs
Creating a scalable data model with the right allows adding more data across dimensions. Data modelers should plan for:• Right granularity• Reference data management• Field naming standard• Hierarchical data management• Modularity
CASE STUDY 2 – SCALABLE DATA MODELLesson learned: build the data model strategically so that it can evolve as requirements change

PROCESS TRANSFORMATION
3

13© Oliver Wyman
PROCESS OPTIMIZATIONAutomation and reporting improvements are a relatively small cost with a significant return if implemented alongside required regulatory changes
Microsoft Excel Microsoft AccessAutomated IT
workflowsAnalytical tools (e.g., Tableau, Power BI, Alteryx, Python, R)
73% 21% 25% 14%
41%
Pre-model processes (e.g. in-force creation)
Medium impact
10%
41%
High impact
17%
45%
41%
Sub-ledger or journal entry rules engine
21%
14%Post-model processes
Experience studies & assumption setting 41%38%
48%31%21%
62%Data visualization & reporting processes 28%
Low impact
Excel remains a primary tool for most insurers despite appetite for automation and greater analytics capabilities
Streamline and automate valuation processes
Workflow implementation (ledger, assumptions)
Utilize visualization tools to improve analytics
67%
42%
33%
Streamline and automate experience studies 84%
85% of insurers are planning to automate repetitive processes
Implement analytics tools to improve reporting 52%
Current state
Future state
Regulatory impacts
80% of companies expect to materially change processes for LDTI
IMPACTA recent transformation project determined that ~10 FTEs of capacity could be released through automation and streamlining alongside LDTI

14© Oliver Wyman
Normalize where possible• Normalize data to suitable levels, scale storage for data formats that evolve
over time, minimize complexity of the system• Centralize most data types (i.e., model inputs, outputs, assumptions, product
features) in the least number of tables via use of data normalization logic• Consider use of non-relational data stores where appropriate
80%Significant value from a design
based on design principles
PROCESS DESIGN PRINCIPLES
Use modular design• Create standalone components that can be updated and enhanced with no
downstream impact• All processes that operate on data report back to the centralized data store to
minimize interdependencies and redundant data mappings• Separate data transformation logic from business logic
Decouple “user” from “process”• Create a front-end interface to allow users to query and analyze without
extensive technical training• Let workflow tools take the first step: they track progress and notify users
when results are ready for review or when unforeseeable issues arise• Leverage dev-ops framework for back-end processes to make them portable
(technology agnostic)
Right size process and technology• Balance flexibility and scalability of a process against simplicity and user
experience• Select a consistent technology toolkit that helps drive business value and can
be accepted widely within the organization

15© Oliver Wyman
END-TO-END TRANSFORMATIONCombining Alteryx and Python scripts with cloud and centralized data storage (actuarial and supplemental data) can cut down manual effort while maintaining a comfortable level of supervision and interaction
Inforce / supplementary data
Pre-model
Assumptions
AXIS run orchestration
Post-model
Actuarial database
Pre-model adjustments
Trigger / user interface
SQL data warehouse
Cloud services
Microsoft BI dashboard
Virtual machine
Alteryx
Triggers automatically run Python scripts based on
time, file availability, or user instructions
Centralization of input, output and assumption
data enables streamlined and granular reporting
Cloud environment allows scaling up and down
compute resources on demand to manage costs
Dashboards provide drilldown capability to
enable easier data validation and analysis of results
16© Oliver Wyman
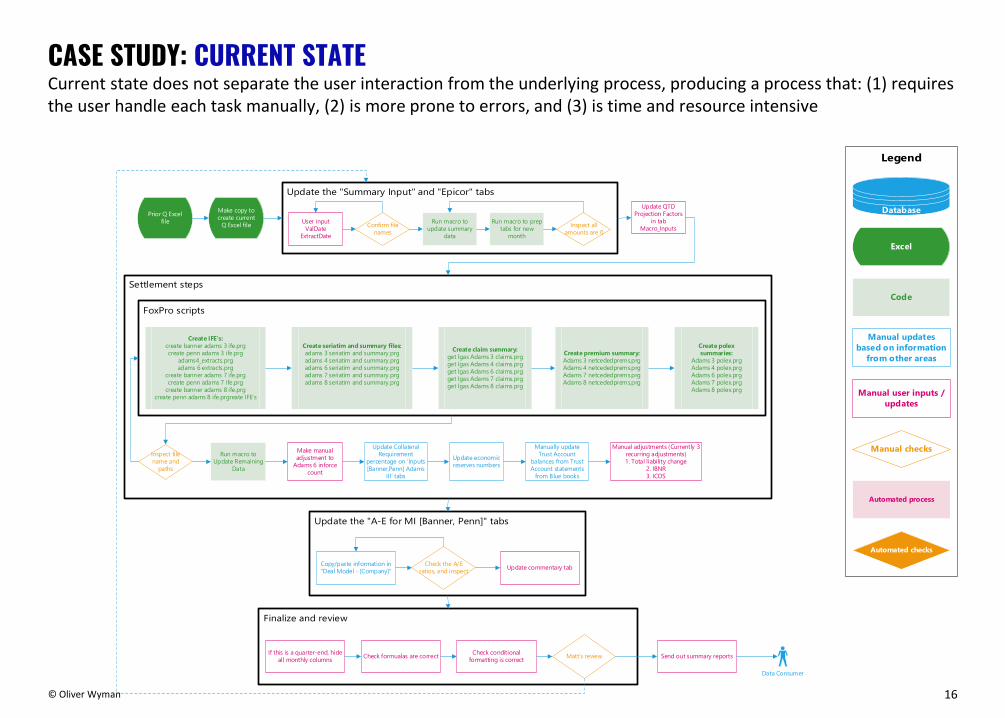
CASE STUDY: CURRENT STATECurrent state does not separate the user interaction from the underlying process, producing a process that: (1) requires the user handle each task manually, (2) is more prone to errors, and (3) is time and resource intensive
Prior Q Excel file
Make copy to create current
Q Excel file Run macro to prep tabs for new
month
Run macro to update summary
dataConfirm file
namesUser inputValDate
ExtractDateInspect all
amounts are 0
Update QTD Projection Factors
in tab Macro_Inputs
Create IFE's:create banner adams 3 ife.prgcreate penn adams 3 ife.prg
adams4_extracts.prg adams 6 extracts.prg
create banner adams 7 ife.prgcreate penn adams 7 ife.prg
create banner adams 8 ife.prg create penn adams 8 ife.prgreate IFE's
Create seriatim and summary files:adams 3 seriatim and summary.prgadams 4 seriatim and summary.prgadams 6 seriatim and summary.prgadams 7 seriatim and summary.prgadams 8 seriatim and summary.prg
Create claim summary:get lgas Adams 3 claims.prg get lgas Adams 4 claims.prg get lgas Adams 6 claims.prgget lgas Adams 7 claims.prgget lgas Adams 8 claims.prg
Create premium summary:Adams 3 netcededprems.prg Adams 4 netcededprems.prgAdams 7 netcededprems.prgAdams 8 netcededprems.prg
Create polex summaries:
Adams 3 polex.prg Adams 4 polex.prgAdams 6 polex.prgAdams 7 polex.prgAdams 8 polex.prg
Inspect file name and
paths
Run macro to Update Remaining
Data
Make manual adjustment to
Adams 6 inforce count
Update Collateral Requirement
percentage on 'Inputs [Banner,Penn] Adams
III' tabs
Update economic reserves numbers
Manually update Trust Account
balances from Trust Account statements
from Blue books
Manual adjustments (Currently 3 recurring adjustments)1. Total liability change
2. IBNR3. ICOS
Copy/paste information in "Deal Model - [Company]"
Check the A/E ratios, and inspect Update commentary tab
If this is a quarter-end, hide all monthly columns Check formualas are correct Check conditional
formatting is correct Send out summary reportsMatt’s review
Data Consumer
Manual user inputs / updates
Excel
Manual checks
Manual updates based on information
from other areas
Code
Database
Automated checks
Automated process
17© Oliver Wyman
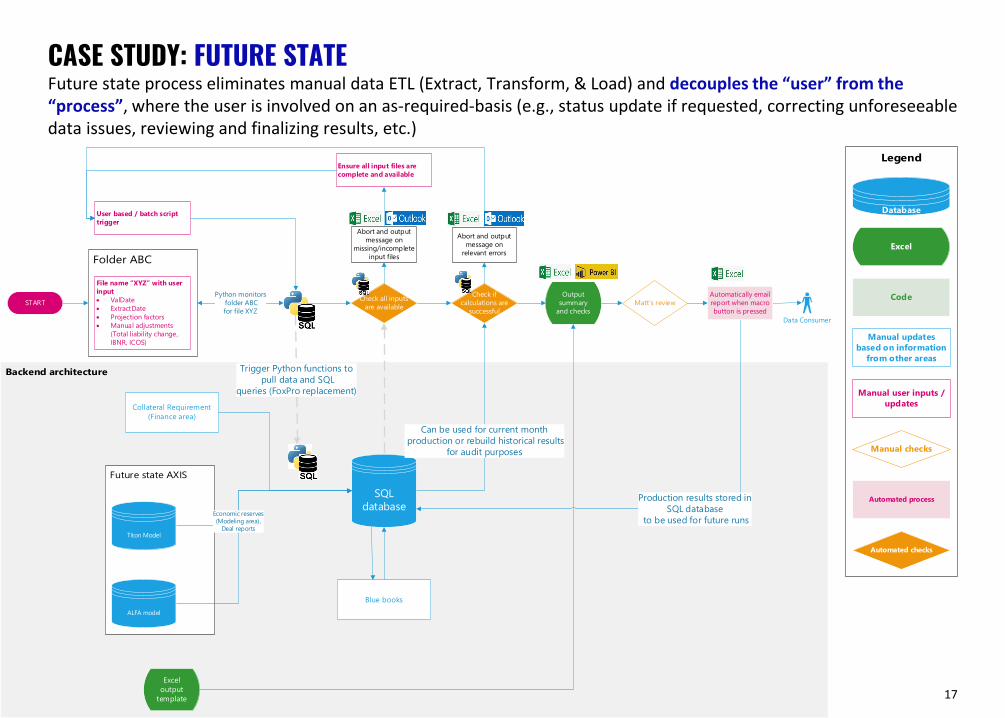
CASE STUDY: FUTURE STATEFuture state process eliminates manual data ETL (Extract, Transform, & Load) and decouples the “user” from the “process”, where the user is involved on an as-required-basis (e.g., status update if requested, correcting unforeseeable data issues, reviewing and finalizing results, etc.)
Manual user inputs / updates
Excel
Manual checks
Manual updates based on information
from other areas
Code
Database
Automated checks
Automated process
File name “XYZ” with user input• ValDate• ExtractDate• Projection factors• Manual adjustments
(Total liability change, IBNR, ICOS)
Python monitors folder ABC for file XYZ
SQL database
Collateral Requirement (Finance area)
Blue books
Check all inputs are available
User based / batch script trigger
Excel output
template
Abort and output message on
missing/incomplete input files
Trigger Python functions to pull data and SQL
queries (FoxPro replacement)
Can be used for current month production or rebuild historical results
for audit purposes
Output summary
and checks
Check if calculations are
successful
Abort and output message on
relevant errors
Matt’s review
Production results stored in SQL database
to be used for future runs
Data Consumer
Automatically email report when macro button is pressed
Ensure all input files are complete and available
START
Titon Model
ALFA model
Economic reserves (Modeling area),
Deal reports
CHANGE MANAGEMENT
4
19© Oliver Wyman
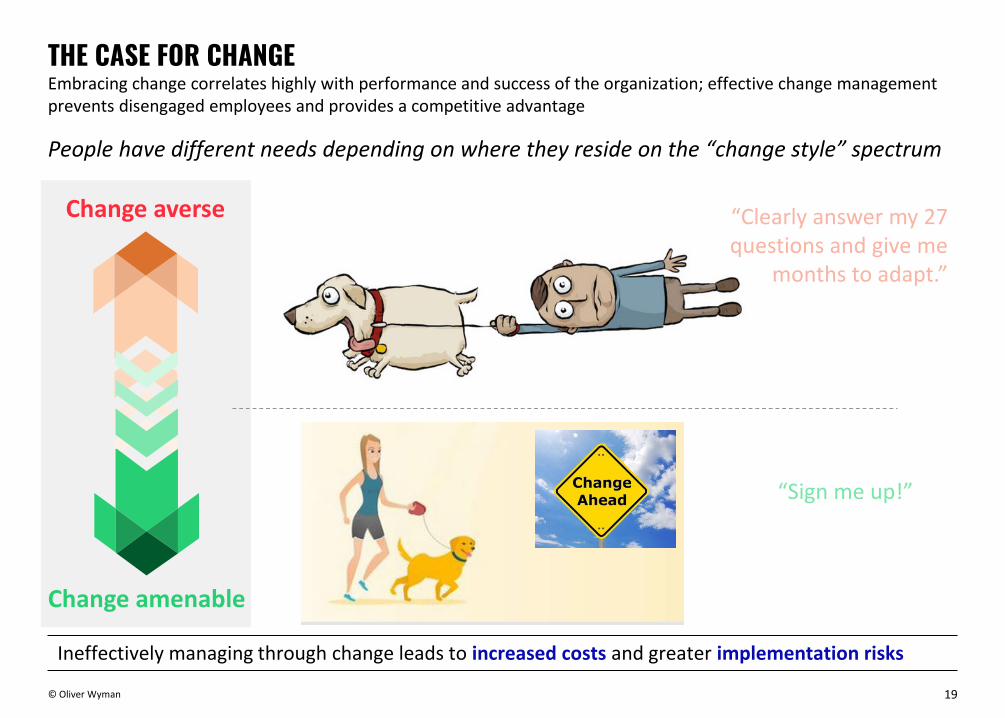
THE CASE FOR CHANGEEmbracing change correlates highly with performance and success of the organization; effective change management prevents disengaged employees and provides a competitive advantage
People have different needs depending on where they reside on the “change style” spectrum
Ineffectively managing through change leads to increased costs and greater implementation risks
Change averse
Change amenable
“Clearly answer my 27 questions and give me
months to adapt.”
“Sign me up!”

20© Oliver Wyman
APPROACH TO CHANGE MANAGEMENTTransformation efforts can be structured to naturally support change management goals
Function as a unit
• Less experienced learn from more experienced
• Involve as development occurs
• Identify supporting tools, best practices, and value-add analytics
• Make model decisions together -- relying on more experienced
• Review options (pros/cons) for to facilitate effective decision-making
Learn through apprenticeship
• “Learn while doing” is more effective “learn by training”
• New users start with smaller and well-structured tasks, increasing responsibility and ownership at a manageable pace– Early on: Provide input – Later on: Take the lead
Encourage through progress
• Set measurable goals
• Establish methods to measure progress– Self-assessment – Manager feedback
• Agree on monitoring approach
• Solicit feedback
Communicate & participate
• Plan and communicate early and often
• Share in development
• People are more comfortable with change when they provide input and know what to expect
• Establish regular cadence for soliciting feedback and monitoring progress
People must subscribe and be “brought along”, something that can’t be forced
Involvement reaps buy-in

21© Oliver Wyman
Design documentsInformed decision making
StandardsFoundation for new heights
TestingSeeing is believing
User guidesModeling 101
Organizational structureOptimal services to share
Training materialsOnboarding & development
FACILITATING CHANGE MANAGEMENTMany “deliverables” will have dual roles: (a) supporting documentation, controls, and training and (b) helping the team adapt to change

QUALIFICATIONS, ASSUMPTIONS, AND LIMITING CONDITIONSThis report is for the exclusive use of the Oliver Wyman client named herein. This report is not intended for general circulation or publication, nor is it to be reproduced, quoted, or distributed for any purpose without the prior written permission of Oliver Wyman. There are no third-party beneficiaries with respect to this report, and Oliver Wyman does not accept any liability to any third party.
Information furnished by others, upon which all or portions of this report are based, is believed to be reliable but has not been independently verified, unless otherwise expressly indicated. Public information and industry and statistical data are from sources we deem to be reliable; however, we make no representation as to the accuracy or completeness of such information. The findings contained in this report may contain predictions based on current data and historical trends. Any such predictions are subject to inherent risks and uncertainties. Oliver Wyman accepts no responsibility for actual results or future events.
The opinions expressed in this report are valid only for the purpose stated herein and as of the date of this report. No obligation is assumed to revise this report to reflect changes, events, or conditions, which occur subsequent to the date hereof.
All decisions in connection with the implementation or use of advice or recommendations contained in this report are the sole responsibility of the client. This report does not represent investment advice nor does it provide an opinion regarding the fairness of any transaction to any and all parties. In addition, this report does not represent legal, medical, accounting, safety, or other specialized advice. For any such advice, Oliver Wyman recommends seeking and obtaining advice from a qualified professional.