Continuous Manufacturing & Process Analytical Chemistry - Environmental Contributions

Process analytical technology for continuous manufacturing
of solid-dosage forms
Margot Fonteyne a.
*, Jurgen Vercruysse b, Fien De Leersnyder
a, Bernd Van
Snick b, Chris Vervaet
b, Jean Paul Remon
b, Thomas De Beer
a
a Laboratory of Pharmaceutical Process Analytical Technology, Ottergemsesteenweg 460, Ghent University,
Ghent, Belgium bLaboratory of Pharmaceutical Technology, Ghent University, Ghent, Belgium
HIGHLIGHTS
Pharmaceutical production is switching from batch towards continuous processing
Process Analytical Technology is indispensable for continuous manufacturing
Implementation of Process Analytical Technology in continuous production
ABSTRACT
Currently, pharmaceutical production is making the switch from batch processing towards
continuous processing. The quality of intermediate and end products produced by batch
processes is assured by off-line testing. It is obvious that off-line tests in analytical
laboratories cancel out the advantages of continuous processing, so the critical quality
attributes of continuously produced pharmaceuticals need to be monitored in real time. In
2004, the US Food and Drug Administration launched the process analytical technology
(PAT) concept to stimulate the pharmaceutical industry to change from off-line to real-time
quality testing. This review explores the implementation of PAT tools within continuous
pharmaceutical processes (i.e., blending, spray drying, roller compaction, twin-screw
granulation and compression), focusing on both opportunities and challenges.
Keywords:
Continuous blending
Continuous pharmaceutical manufacturing
Direct compression
Near infrared
Particle-size analysis
Process analytical technology
Raman
Roller compaction
Spray drying
Twin-screw granulation
Abbreviations: API, Active pharmaceutical ingredient; CQA, Critical quality attribute; EMEA, European
Medicines Agency; FBRM, Focused beam reflectance measurement; FDA, Food and Drug Administration;
HPLC, High-performance liquid chromatography; KF, Karl Fischer; LIF, Light-induced fluorescence; MBSD,
Moving block standard deviation; NIR, Near infrared; PAT, Process analytical technology; PC, Principal
component; PCA, Principal-component analysis; PLS, Partial least squares; QbD, Quality by Design; R&D,
Research and development; RSD, Residual standard deviation; UV, Ultraviolet
* Corresponding author. Tel.: +32 9 264 80 97.
E-mail address: [email protected] (M. Fonteyne)
*ManuscriptClick here to view linked References
1. Introduction
Pharmaceutical manufacturers of conventional solid-dosage forms (i.e., capsules and
tablets) are interested to switch from batch processing towards continuous processing [1].
Continuous processing is characterized by
(i) integration of all unit operations; and,
(ii) the “one in, one out” principle.
Starting materials are continuously fed into the process, whilst end products are
continuously removed at the same speed [2]. Several processing steps, currently used in batch
manufacturing, are continuous, such as:
(i) feeding;
(ii) milling;
(iii) roller compaction, which is a dry granulation technique;
(iv) compression, where a blend of the active pharmaceutical ingredient (API) and excipients
is compressed into tablets; and,
(v) spray-drying, in which a liquid is atomized into drops and then dried in a hot air flow
(Fig. 1).
Furthermore, in the past decade, several companies have developed integrated powder-to-
tablet production lines [2]. It is obvious that, for continuous processing, real-time quality
control is indispensable, so the need to invest in process analytical technology (PAT) is
strengthened. With the Horizon 2020 framework program for research and innovation in
mind, the European Federation for Pharmaceutical Sciences (EUFEPS) also highlighted the
need for appropriate in-line measurements, in order to make possible lean continuous
manufacturing [3]. This review aims at summarizing the status of the implementation and the
suitability of PAT tools for continuous pharmaceutical manufacturing processes of
conventional solid-dosage forms, focusing on opportunities and shortcomings. Saerens et al.
[4] earlier provided an overview of PAT monitoring in continuous hot-melt extrusion.
The adoption of continuous manufacturing of solid-dosage forms brings several
advantages, but also challenges (Table 1). The advantages have their impact in three fields:
(i) product development and quality;
(ii) costs; and,
(iii) footprint.
Continuous production equipment implies fewer scale-up issues, since the size of the
production lot is defined by the factor “time”, so the same equipment size can be used for
development and pilot studies, clinical trials and full commercial production. Since time-
intensive scale-up experiments are not needed, development time is significantly decreased
and the product can be launched faster to the market. It is important to mention that,
especially now with scarcely filled pipelines, shorter development time implies a longer
monopoly for the company prior to patent expiry – a major economic advantage.
Comparison of the economics of batch and continuous pharmaceutical production was
performed by Schaber et al. [5]. The capital investment of a continuous plant is lower since
the equipment is smaller and intermediates do not need to be stored and transferred, so less
floor space is required. In addition, the operating expenses decrease, because fewer operators
are required for processing, transfer and storage. Evaluation and assurance of product quality
no longer occurs via off-line testing, which also implies a significant cost reduction.
Furthermore, the production of tablets in a continuous way will be more sustainable than via
batch production, since the footprint reduces significantly [6].
One fair comment is that continuous manufacturing processes allow less flexibility. It is
true that batch processes are very flexible. An almost infinite number of different process
steps can be virtually linked, whereas a continuous process is more rigid, as the different unit

operations are physically integrated into a specific process chain. However, recent advances
were made in the development of readily “plug and play” continuous equipment, which
allows flexible changes between direct compression and wet and dry granulation [7].
Continuous processes need to be robust with respect to changes in the product quality of raw
materials and need to reach steady state quickly to avoid wastage of product.
The “batch”-concept is deep-seated within the pharmaceutical industry and small batches
minimize financial losses in case a product needs to be recalled. A continuous process asks
for a different tracking method (e.g., time stamps). Nevertheless, the biggest burden for the
pharmaceutical industry to adopt continuous manufacturing seems to be the regulatory issues.
If changes are made in the production of a product that is already licensed, these changes
must be re-evaluated by the authorities. When a new production line needs to be evaluated
and the product registration must be renewed, that is the right time to switch from batch to
continuous processing. Continuously-produced nimesulide tablets (Severin by Chinion) have
already been licensed and are available on the Mexican market.
Batch processes have mostly relied on off-line analysis for quality evaluation of
intermediate and end products (i.e., quality by inspection). However, continuous processes
should be evaluated in real time by means of at-line, on-line and in-line measurements, as
described in the PAT guidance for industry, launched by the US Food and Drug
Administration (FDA) [8]. Furthermore, in their “Pharmaceutical Development” guideline,
the International Conference on Harmonization of Technical Requirements for Registration
of Pharmaceuticals for Human Use (ICH) defines the Real Time Release Testing principle:
“the quality of both intermediate and final products needs to be evaluated and ensured based
on process data” [9]. These data can then be used for the construction of feedback and
feedforward control loops. This means that, when a process is fully understood and the
quality of the end-product can be assured at any time, a product can be released directly to the
market after production.
2. Implementing PAT tools in continuous pharmaceutical processes
2.1. Continuous material transfer between units
At certain time-points during pharmaceutical processes the homogeneity of powder
streams needs to be evaluated. The in-line measurement of powder streams is challenging, for
several reasons:
(i) fouling of the measurement probe frequently occurs;
(ii) it is not always easy to define the actual sample size (e.g., the sampling volume of powder
measured during the collection of a spectrum); and,
(iii) the location of the probe should be investigated, since the probe should not block nor
influence the powder stream; at the same time, it should be placed so that the moving
powder stream is measured, not, e.g., only powder that is sticking to the hopper wall (i.e.,
when channeling occurs).
Benedetti et al. [10] developed a specially designed, non-contact sampling interfacing
device with sapphire glass for quantitative evaluation of the API concentration in a flowing
powder stream by means of near-infrared (NIR) spectroscopy. Spectra collection happened
through the sapphire window and no fouling of the window was reported. A partial least
squares (PLS) calibration model was built, using manually blended samples, which were
measured in a static way. These samples were not fully homogeneous, hence not
representative of the powder stream, which was homogenously blended on an industrial scale.
The authors solved this problem by averaging 10 calibration spectra of each calibration blend
and then obtained a good PLS model. Another concern was that static measurements are not

influenced by any interference from air diffusion, powder packing differences or flow
velocity. The spectral variation did not seem to be affected by the flow rate, whereas
differences in compaction level and particle-flow discontinuity could be removed by data
pretreatment. The real-time measured API concentration showed a large standard deviation
(around 6). This was overcome by averaging the model-predicted API concentration over one
unit dose of product, decreasing the standard deviation to 3 and below, depending on the run
being evaluated.
2.2. Continuous blending
So far, two techniques have been presented for the monitoring of continuous blending,
namely NIR and light-induced fluorescence (LIF).
In 2010, Vanarase et al. [11] constructed an NIR-PLS model to determine the API
concentration of flowing powder in-line. The spectra were collected from blends, passing
under the NIR probe head on a chute at the outlet of a continuous blender. The calibration
model was constructed using spectra of flowing powders. In a second paper [12],
measurements were again conducted with the help of a chute, but, this time, a multi-point
NIR system, equipped with five probes, was mounted above the chute. Multi-point systems
have several advantages, such as instrument or process failure diagnostics (by comparing the
spectra collected by different probes). Furthermore, one spectrometer can be used to monitor
a whole continuous production process. In this study, the correlation between in-line (NIR)
and off-line (UV) measurements was determined as well as the analytical method error of the
respective methods, which was negligible for both techniques. A PLS-calibration model was
constructed with spectra of static samples, and a PLS model was constructed, based on the
spectra collected by the five different probes. The model consisted of five latent variables,
because the use of different probes increased the complexity of the spectra. Another
possibility to avoid this would have been to construct five separate models, one for each
probe. In this paper [12], the calculations of the amount of spectra, which needed to be
averaged in order to be comparable to one unit dose, were also explained extensively.
Whereas Vanarase et al. [12] prepared the calibration samples with a separate batch
blender, Martínez et al. [13] produced the calibration samples for the construction of a PLS
model directly with the continuous blender, which was equipped with two feeders. A PLS
model for API quantification was constructed and the influence of changing process
parameters was evaluated. When the powder-flow rate was decreased, the predicted API
concentration also decreased by 20%, whereas the HPLC reference method showed that the
blend was within specification. Martínez et al. [13] suggested that a lower interaction
between incident light and powder particles might cause this underestimation. However, the
absolute prediction of the target concentration was not influenced by changing the rotation
speed of the blender. Moreover, a lower rotation speed led to less fluctuation in the
predictions of the API concentration and in the residual standard deviation (RSD), as the
sample was presented more adequately to the NIR probe and the mixtures were more
uniformly blended at lower rotation speeds. Martínez et al. [13] also applied principal-
component analysis (PCA) to the spectra of runs with different process parameters. The PCA
classified the spectra according to stirring rate (PC1) and powder-flow rate (PC2), indicating
that NIR is sensitive to powder flow and powder density. The respective loadings of the
principal components were complicated to interpret. Furthermore, the in-line collected
spectra were used to determine the start-up, steady-state and shut-down phases of the
continuous blending process. Calculations were performed via PCA, RSD and moving block
standard deviation (MBSD), but no method was superior to any other for determination of the
end of the start-up phase.

An extensive study on the performance of both a continuous ZigZag blender and a double
helical ribbon blender was conducted by Pernenkil [14]. Tests were performed by not only in-
line NIR spectroscopy, but also LIF. Kehlenbeck [15] summarized parts of his PhD
dissertation [16], which described in-line concentration determination of continuously
blended mixtures by means of NIR. Furthermore, he presented a device that can be mounted
on a probe head and cleans the probe tip by means of compressed air during processing.
Although Raman spectroscopy has proved useful in monitoring blend homogeneity in
batch processes [17,18], no applications of Raman spectroscopy in continuous blending have
been presented so far.
2.3. Spray drying
Particle-size distribution is a critical quality attribute (CQA) of spray-dried material, so the
size of the microspheres was monitored by a laser-diffraction system [19]. The performance
of the system was compared when used in-line, at-line and off-line. In-line measurements
were performed between the spray dryer and the cyclone, whereas at-line measurements were
conducted after the product had left the process stream. Off-line analysis was performed both
by laser diffraction and light microscopy. During both in-line and at-line measurements a
purge air flow was needed in order to prevent particles adhering to the lenses of the
measurement system. Furthermore, extra purged air was used for a better dispersion of the
particles during at-line measurements.
The four different measurements did not yield the same results: the median particle size
was around 33% higher when the measurements were conducted in-line, compared to the
results obtained via light microscopy. The results from the at-line and off-line laser
diffraction were similar, but still slightly higher than the median particle-size values obtained
via light microscopy. This phenomenon was caused by the abundance of a dispersion stage
during in-line measurements, resulting in the measurement of more agglomerates instead of
discrete particles. However, an in-line system measures product changes in real time,
providing information regarding, e.g., intermittent process upsets and length of the start-up
phase. Unfortunately, the in-line system seemed to be insensitive to small changes in particle
size. Furthermore, the at-line set-up has the advantage that lenses can be cleaned without the
need to stop the production process. Moreover, the same measurement equipment can be used
after different processes, allowing greater flexibility and reducing the costs. Even though at-
line analysis method is destructive, the authors still preferred it.
2.4. Roller compaction
The first monitoring technique applied on roller compaction is acoustic emission, where
the signal produced by compressed powder is recorded with a microphone and then
transformed to a frequency spectrum [20–22]. Changes in acoustic emission bands could be
noticed with various compression forces and when capping occurred. The in-line monitoring
of roller compaction was also studied by a research group at Purdue University (USA), in
several studies with NIR spectroscopy on roller-compacted ribbons. The CQAs of roller-
compacted granules are the granule characteristics (e.g., moisture content, relative density,
tensile strength, and particle-size distribution) and the content uniformity. To monitor these
CQAs, there were three studies [23–25], in which NIR spectra from the mid-point of the
ribbons as they exited the rolls were collected in-line.
In the first study, samples were produced under different process conditions and measured
off-line to construct predictive models. These models, constructed with off-line data, were
then used to monitor the continuously produced ribbons in real time. When ribbons were

produced with higher compression forces, an increase in absorbance could be noted. Then, a
model for the prediction of the mechanical strength of the ribbons, based on the slope of the
best-fit line through the spectra was constructed (calculated by regression analysis). The
model could also be used to predict the particle-size distribution of the compacts after milling
[23].
In the second study [24], PLS models were constructed in order to predict the moisture
content, relative density, tensile strength and Young’s modulus of the ribbons. Although the
model constructed off-line showed good agreement between the spectra and the values from
reference methods, the model could not be transferred to an in-line setting. Large differences
between the values obtained by means of reference techniques and the predictions from the
PLS model could be noted, because the NIR spectra, used for the construction of the PLS
model, were collected after 24 h of storage. The different degrees of elastic recovery between
fresh and stored ribbons caused the discrepancy, according to the authors.
In their next study [25], the off-line spectra for model-construction were therefore
collected from the ribbons directly after their production. Again, an NIR-based PLS model
was constructed for the prediction of relative density, moisture content, tensile strength and
Young’s modulus. In this study, an API was also added to the ribbons, so the PLS model also
predicted API concentration. This time, good agreement was found between the values
predicted by the NIR method and values obtained via reference methods. Nevertheless,
whereas the scatters on the predicted moisture content and API-concentration values were
low, large scatters were found for the predictions of the other three characteristics. The
authors explained that this was due to the phenomenon of powder by-pass during rolling
compaction, whereby a small amount of powder is not compacted, and hence creates dust
clouds. These powder clouds are also measured by the NIR probe, and, whereas the moisture
content and API-concentration in the powder cloud is similar to that of the ribbon, this is not
the case for relative density, tensile strength and Young’s modulus. Consequently, extra
scatters are caused for the latter properties.
These studies also showed that it is important to conduct the calibration experiments in
similar circumstances to these in which the model will be applied afterwards. Later,
predictive models for granule and ribbon properties were constructed, taking into account not
only the NIR spectral slope, but also raw-material properties, operating parameters and roll
gap [26].
The fact that dust and the rather low detection sensitivity might lead to inconsistent
collection of in-line NIR spectra was also recognized by Feng et al. [27]. They determined
the sources of variability in in-line collected NIR spectra during roller compaction (i.e.,
motion of the rollers) and designed a new in-line control kit. Using this kit, the above
mentioned dust clouds reduced, so the light-stray effects also decreased. Furthermore, the
position and the movement of the ribbons were strictly controlled after compaction, which
reduced the fluctuations in light stray even more. Less relaxation and deformation of the
ribbons occurred, also causing fewer disturbances to the NIR signal.
In 2012, a study monitoring ribbon density in real time aimed at implementing NIR
spectroscopy to monitor physical changes in the ribbons, caused by variation in the operating
conditions [28]. Not only pure spectral changes (baseline shifts) were evaluated for
monitoring, but also PCA (qualitative analysis) and PLS (quantitative analysis) were used.
The authors reported that PCA was the most suitable, least time-consuming method for
density measurements.
NIR spectroscopy was also compared to microwave-resonance sensing for in-line
monitoring of density and moisture content of roller compacts [29]. PLS models were
constructed and, in both cases, microwave resonance proved to be more accurate than NIR.
Root mean square errors were almost double for NIR compared to those for microwave-
resonance models. The optimized microwave-resonance PLS model for density showed an
RMSE of 0.034 g/mL (evaluated range 0.675–1.216 g/mL) whereas the optimized RMSE for
moisture determination was 0.065% (evaluated range 2.1–5.5% water). Both techniques have
different penetration depths; where the penetration depth of NIR is a few millimeters,
microwave-resonance sensors penetrate several centimeters into the material; hence the
microwave signal is transmitted through the whole ribbon. Since there is a direct relation
between microwave sensor measurements and the presented mass in the measurement field,
an accurate model for the determination of ribbon density could be obtained. Furthermore,
there is a large contrast between the dielectric properties of water and most excipients, as
microwave resonance is very sensitive to water. Hence, microwave-resonance-content
models are also more accurate than NIR models for moisture determination. In addition, no
chemometric calculations are necessary to derive the relevant information from microwave-
resonance data. However, microwave resonance does not provide chemical information of the
sample, as does NIR.
A research group in Singapore performed similar work on ribbed flakes produced by roller
compaction. Different PLS models, based on off-line NIR spectra were constructed for the
prediction of API concentration, tensile strength, Young’s modulus and relative density [30].
Calibration spectra were collected in both static and dynamic ways (with a conveyor belt).
The advantage of collecting dynamic spectra is that the sample measured is larger. When
evaluating the R² of the performance of the models, it was superior using the spectra that
were collected (i) dynamically, and (ii) at the underside of the conveyer belt, and (iii) when
the first derivative of the spectra was used for model construction. A good correlation
between the predicted value and the reference value was observed for all characteristics. The
variations of the predicted tensile strength, Young’s modulus and relative density were higher
than the variations of the API concentration – again because samples were stored for three
days prior to off-line investigation and were subject to relaxation and temperature effects.
The researchers corrected for the powder by-pass dust cloud by vacuuming out the dust
particles, hence preventing the probe from fouling. In a second study [31], the optimal probe-
lens diameter and distance to the sample were determined.
2.5. Twin-screw granulation
The CQAs of wet granules are: solid states of API and excipients, granule-size
distribution, shape of granules and moisture content.
The influence of process parameters upon the solid state of theophylline (anhydrous or
monohydrate) after twin-screw granulation was monitored with NIR and Raman spectroscopy
[32]. Both spectroscopic techniques, with the help of multivariate data analysis, were capable
of detecting even small unexpected solid-state changes. Solid-state differentiation was more
definite in the Raman spectra than in the NIR spectra. As spectra were collected in a static
way, more investigations on probe implementation in wet granulation would be
advantageous. In the same study, the granule-size distribution of the wet granules was
investigated in a dynamic way, by means of a spatial filter velocimetry probe (Parsum).
Although it was equipped with an air-cleaning system, fouling of the probe remained a
problem.
The effect of formulation and process parameters upon granule-size distribution was also
measured dynamically with a high-speed imaging camera (Eyecon). This photometric stereo-
imaging technique is equipped with LEDs in three colors and provides information regarding
not only particle size, but also shape and surface, although not discussed in this study [33].
The size-determination measurements do not need prior calibration and the technique is
completely non-invasive. Adequate sample presentation is challenging, since non-spherical

particles will always be presented at their largest particle dimension when they are measured
on a chute, so a free-falling stream was used. Furthermore, when the field of view is
overfilled, this interferes with an adequate granule size measurement calculation. It is
therefore important that fine and coarse particles are separated during sample presentation.
Fouling might be a problem when working with small powders. The distance of the samples
to the lens needs to be constant and adapted to the focal distance of the system. In this study,
d10 values and particle count were preferred for process monitoring over d50 and d90 values.
The camera was sensitive to changes in granule size and count when the liquid:solid ratio was
changed.
Twin-screw granulation was also used as the wet granulation technique in a full,
continuous powder-to-tablet production line, which was recently developed (the ConsiGma-
25 system). The ConsiGma system comprises a twin-screw granulator, connected to a
segmented fluid-bed dryer and a transfer module equipped with a mill. A tablet press can also
be added to this system. Four studies of the implementation of PAT tools within the
ConsiGma system have been reported, one focused on the continuous fluid-bed dryer.
Chablani et al. [34] mounted an NIR probe in the granule-transfer module, which is
situated just after the fluid-bed dryer, hence evaluating the dried granules. Two PLS models
were constructed where the NIR spectra were regressed against the moisture content of the
granules determined via Karl Fischer (KF) titration and “loss on drying”, respectively. KF
titration resulted in the superior model. Only a small range of moisture contents was
evaluated (0.43–1.06% w/w, measured with KF). After the fluid-bed granulator, a continuous
mill was installed and the particle-size distribution of milled granules was evaluated by
focused beam reflectance measurement (FBRM) [35].
Fonteyne et al. [36] performed a Design of Experiments, varying the temperature of the
granulator barrel, the powder-feed rate and the temperature of the drying air in the fluid-bed
dryer. The granules obtained were then evaluated at-line by Raman and NIR spectroscopy
and a photometric imaging technique (Flashsizer3D). The spectroscopic techniques gave
insight into the changing solid state of the API when different process parameters were
applied, whereas the Flashsizer determined the granule-size distribution and the roughness of
the granules. This complementary physical and chemical information was then used to
predict the CQAs of the granules, namely moisture content, bulk and tapped density and
flowability. Three PLS models were successfully constructed. The spectroscopic data had the
highest predictive capability for the moisture content, whereas the imaging data were mostly
correlated with the flowability of the granules. The measurements were performed at-line,
since fouling occurred when using the Flashsizer in-line. The development of an interfacing
device that prevents the Flashsizer window from fouling is the next challenge.
The use of classical fluid-bed end-point-detection methods (i.e., humidity of the outlet
drying air and product temperature) has been compared to the use of PAT tools (NIR and
Raman spectroscopy) and a mass-balance-model approach [37]. Both the NIR and Raman
spectroscopy probes were mounted in the continuous fluid-bed dryer and an NIR-based
moisture-prediction model was constructed. As well as real-time monitoring of the residual
moisture of the granules, the solid state of the API was also successfully monitored. For real-
time end-point detection, the PAT approach was superior to both the classical end-point
detection and the mass-balance models.
2.6. Direct compression
In 2009, the successful use of NIR spectroscopy in a tablet press for monitoring powder
segregation was presented at the EMEA/EFPIA QbD Application Workshop [38].
Measurements were conducted in-line in the feed frame. Karande et al. [39] placed an NIR

probe just after the tablet-ejection area and constructed a PLS model to calculate the
concentration of the API and the excipients. This study exposed that it is important to use
similar sampling methods and circumstances for the collection of both calibration spectra and
real-time process spectra. The calibration spectra were therefore also collected in a dynamic
way using the tableting machine equipped with blank discs instead of punches and dies.
Furthermore, preprocessing techniques (standard normal variate correction and derivatives)
were used to minimize effects caused by differences between preparation during calibration
and production. The in-line NIR monitoring discovered segregation towards the end of the
production process. The concentration of the API in the tablets decreased in the second half
of the process. Whereas this was clearly picked up by the NIR method, no anomalies could be
detected with the classical UV method.
Wahl et al. [40] implemented an NIR probe directly above the paddle wheel, and they also
detected segregation towards the end of the process. Järvinen et al. [41] monitored not only
the individual tablets on the tablet press but also the powder stream coming from a
continuous mixer prior to tableting. Both calibration and test-run spectra were collected in-
line. This study proved that it is possible to perform a 100% identity check (i.e., each
individual tablet is monitored). The goodness of the method was confirmed during test runs
with differing API contents, tableting speeds and compaction forces.
NIR measurements were also performed in the feed frame of a tablet press [42]. The
derivative intensity of the API band was plotted versus time, and the influence of mass-flow
rate, potency ingress and paddle-wheel speed on the method performance was studied. Both
at changing mass-flow rate and potency variability, the change in NIR signal could be
correlated to the off-line measured tablet potency. However, when changing the paddle-wheel
rotation speed, a faster increase of NIR signal than tablet potency could be detected. The
reason for this discrepancy was not yet understood.
Singh et al. [43] presented a feedback-control system implemented in a tableting pilot
plant. Next to the classical sensors, implemented in the machine, they also implemented a
microNIR sensor, which was installed on a chute at the outlet of a continuous convective
blender mixing the API with the excipients. The quality of the collected NIR spectra was first
tested by PCA and the API composition was predicted by a PLS model. The API composition
was then altered, in order to evaluate the performance of the feedback-control operation. This
hybrid MPC-PID (model predictive control, proportional integral derivative) approach
brought the API concentration to the set point most quickly so it performed better than the
PID control scheme with which it was compared.
3. Conclusion and future challenges
Overall, a limited amount of studies regarding implementation of PAT in continuous
pharmaceutical processes have been conducted. Although researchers have worked on
different continuous processes, they came across similar challenges (Table 2), as follows.
(1) The importance of similarity between the measurement conditions when collecting
calibration spectra compared to the in-process collection of spectra.
(2) There is a need for adequate interfacing of the tools. An interfacing device should make
sure that the probe does not interfere with the process or the product stream. In other
words: chutes, e.g., are usable in an R&D environment but should be switched to
contained devices in a production setting.
(3) Since pharmaceutical processing deals with powders, fouling of probes is a much-
reported problem when implementing PAT probes. The first solutions are now on the
market (e.g., the FBRM probe with scraper, Parsum with air purge, and Lighthouse
Probe with window wash). Manufacturers could improve the usability of their products

significantly by providing a solution against probe fouling. Another option to prevent
fouling is to use probes that have a large focal distance (e.g., the Raman PhAT probe).
(4) From this review, it is clear that NIR spectroscopy is the most used PAT tool.
Nevertheless, researchers should question which tool is the most appropriate for
monitoring a certain CQA. Often, NIR spectroscopy is used because it is the most readily
available technique, but other techniques might be superior.
(5) When aiming for real-time-release, the process should be not only monitored, but also
steered. So far, no research has been presented with information derived from PAT tools
being used for feedback and feedforward steering of the pharmaceutical process.
References
[1] K. Plumb, Continous processing in the pharmaceutical industry: changing the mind set.
Chem. Eng. Res. Des. 83 (2005) 730-738.
[2] C. Vervaet, J. Vercruysse, J. Remon, T. De Beer, Continuous Processing of Pharmaceuticals,
Taylor and Francis. New York, 2013, pp. 644.
[3] R. Gaspar, B. Aksu, A. Cuine, M. Danhof, M.J.M. Takac, H.H. Linden, A. Link, E.M.
Muchitsch, C.G. Wilson, P. Öhrngren, L. Dencker, Towards a European Strategy for Medicines
Research (2014–2020): The EUFEPS Position Paper on Horizon 2020, Eur. J. Pharm. Sci. 47
(2012) 979-987.
[4] L. Saerens, C. Vervaet, J.P. Remon, T. De Beer, J., Process monitoring and visualization
solutions for hot-melt extrusion: A review. Pharm. Pharmacol. 66 (2014) 180-203.
[5] S.D. Schaber, D.I. Gerogiogis, R. Ramachandran, J.M.B. Evans, P.I. Barton, B.L. Trout,
Economic analysis of integrated continuous and batch pharmaceutical manufacturing: a case study.
Ind. Eng. Chem. Res. 50 (2011) 10083-10092.
[6] W. De Soete, J. Dewulf, P. Cappuyns, G. Van der Vorst, B. Heirman, W. Aelterman, K.
Schoeters, H. Van Langenhove, Exergetic sustainability assessment of batch versus
continuous wet granulation based pharmaceutical tablet manufacturing: a cohesive analysis at three
different levels. Green Chem. 15 (2013) 3039-3048.
[7] P. Hurter, T. Hayden, D. Nadig, D. Emiabata-Smith, A. Paone, Implementing continuous
manufacturing to streamline and accelerate drug development. AAPS Newsmagazine (2013) 15-19.
[8] FDA-Adminstration, Guidance for Industry - PAT - A Framework for Innovative
Pharmaceutical Development, Manufacturing, and Quality Assurance. 2004.
[9] International Conference on Harmonisation of Technical Requirements for Registration of
Pharmaceuticals for Human Use. Pharmaceutical Development Q8. 2009.
[10] C. Benedetti, N. Abatzoglou, J.S. Simard, L. McDermott, G. Leonarda, L. Cartilier, Cohesive,
multicomponent, dense powder flow characterisation by NIR. Int. J. Pharm. 336 (2007) 292-301.
[11] A.U. Vanarase, M. Alcala, J.I.J. Rozo, F.J. Muzzio, R.J. Romanach, Real-time monitoring of
drug concentration in a continuous powder mixing process using NMR spectroscopy. Chem. Eng. Sci.
65 (2010) 5728-5733.
[12] A.U. Vanarase, M. Jarvinen, J. Paaso, F.J. Muzzio, Development of a methodology to
estimate error in the on-line measurements of blend uniformity in a continuous powder mixing
process.
Powder Technol. 241 (2013) 263-271.
[13] L. Martinez, A. Peinado, L. Liesum, G. Betz, Use of near-inrared spectroscopy to quantify
drug content on a continuous blending process: influence of mass flow and rotation speed variations.
Eur. J. Pharm. Biopharm. 84 (2013) 606-615.
[14] L. Pernenkil, Continuous blending of dry pharmaceutical powders, Massachusetts Institute of
Technology. 2008.
[15] V. Kehlenbeck, Use of Near Infrared Spectroscopy for In- and Off-Line Performance
Determination of Continuous and Batch Powder Mixers: Opportunities & Challenges.
Proc. Food Sci. 1 (2011) 2015-2022.
[16] V. Kehlenbeck, Continuous dynamic mixing of cohesive powders. Technische Universität
München. München, 2006.
[17] G.J. Vergote, T.R.M. De Beer, C. Vervaet, J.P. Remon, W.R.G. Baeyens, N. Diericx, F.
Verpoort, In-line monitoring of a pharmaceutical blending process using FT-Raman spectroscopy.
Eur. J. Pharm. Sci. 21 (2004) 479-485.
[18] T.R.M. De Beer, C. Bodson, B. Dejaegher, B. Walczak, P. Vercruysse, A. Burggraeve, A.
Lemos, L. Delattre, Y.V. Heyden, J.P. Remon, C. Vervaete, W.R.G. Baeyens, Raman spectroscopy as
a process analytical technology (PAT) tool for the in-line monitoring and understanding of a powder
blending process. J. Pharm. Biomed. Anal. 48 (2008) 772-779.
[19] L.W. Chan, L.H. Tan, P.W.S. Heng, Process analytical technology: Application to particle
sizing in spray drying. AAPS PharmsciTech 9 (2008) 259-266.
[20] A. Hakanen, E. Laine, H. Jalonen, K. Linsaari, J. Jokinen, Acousting-emission during powder
compaction and its frequency spectral analysis. Drug Dev. Ind. Pharm. 19 (1993) 2539-2560.
[21] A. Hakanen, E. Laine, Acousting characterization of a crystalline cellulose powder during and
after its compression. Drug Dev. Ind. Pharm. 21 (1995) 1573-1582.
[22] J. Salonen, K. Salmi, A. Hakanen, E. Laine, K. Linsaari, Monitoring the acoustic activity of a
pharmaceutical powder during roller compaction. Internat. J. Pharm. 153 (1997) 257-261.
[23] A. Gupta, G.E. Peck, R.W. Miller, K.R. Morris, Nondestructive measurements of the compact
strength and the particle-size distribution after milling of roller compacted powders by near-infrared
spectroscopy. J. Pharm. Sci. 93 (2004) 1047-1053.
[24] A. Gupta, G.E. Peck, R.W. Miller, K.R. Morris, Influence of ambient moisture on the
compaction behavior of microcrystalline cellulose powder undergoing uni-axial compression and
roller-compaction: A comparative study using near-infrared spectroscopy. J. Pharm. Sci. 94 (2005)
2301-2313.
[25] A. Gupta, G.E. Peck, R.W. Miller, K.R. Morris, Real-time near-infrared monitoring of
content uniformity, moisture content, compact density, tensile strength, and young's modulus of roller
compacted powder blends. J. Pharm. Sci. 94 (2005) 1589-1597.
[26] J.L.P. Soh, N. Boersen, M.T. Carvajal, K.R. Morris, G.E. Peck, R. Pinal, Multivariate Data
Analysis to Verify the Utility of Roll Gap and NIR Slope as Process Critical Control Parameters:
Importance of Raw Material Attributes For Modeling Ribbon and Granule Properties in Roller
Compaction. J. Pharm. Innov. 2 (2007) 106-124.
[27] T. Feng, F. Wang, R. Pinal, C. Wassgren, M.T. Carvajal, Investigation of the Variability of
NIR In-line Monitoring of Roller Compaction Process by Using Fast Fourier Transform (FFT)
Analysis.
AAPS PharmSciTech 9 (2008) 419-424.
[28] D. Acevedo, A. Muliadi, A. Giridhar, J.D. Litster, R.J. Romanach, Evaluation of three
approaches for real-time monitoring of roller compaction with near infrared soectroscopy. AAPS
PharmSciTech 13 (2012) 1005-1012.
[29] J. Austin, A. Gupta, R. McDonnell, G.V. Reklaitis, M.T. Harris, The use of near-infrared and
microwave resonance sensing to monitor a continuous roller compaction process. J. Pharm. Sci. 102
(2013) 1895-1904.
[30] A.K. Samanta, A.D. Karande, K.Y. Ng, P.W.S. Heng, Application of near-infrared
spectroscopy in real-time monitoring of product attributes of ribbed roller compacted flakes. AAPS
PharmsciTech 14 (2013) 86-100.
[31] P.V. Quyet, A.K. Samanta, C.V. Liew, L.W. Chan, P.W.S. Heng, A prediction model for
monitoring of ribbed roller compacted ribbons. J. Pharm. Sci. 102 (2013) 2667-2678.
[32] M. Fonteyne, J. Vercruysse, D.C. Díaz, D. Gildemyn, C. Vervaet, J.P. Remon, T.D. Beer,
Real-time assessment of critical quality attributes of a continuousgranulation process. Pharm. Dev.
Technol. 18 (2013) 85-97.
[33] A.S. El Hagrasy, P. Cruise, I. Jones, J.D. Litster, In-line size monitoring of a twin screw
granulation process using high-speed imaging. J. Pharm. Innov. 8 (2013) 90-98.
[34] L. Chablani, M.K Taylor, A. Mehrotra, P. Rameas, W.C. Stagner, Inline Real-Time Near-
Infrared Granule Moisture Measurements of a Continuous Granulation–Drying–Milling Process,
AAPS PharmsciTech 12 (2011) 1050-1055.
[35] V. Kumar, M.K. Taylor, A. Mehrota, W.C. Stagner, Real-time particle size analysis using
focused beam reflectance measurement as a process analytical technology tool for a continuous
granulation-drying-milling process. AAPS Pharmscitech 14 (2013) 523-530.

[36] M. Fonteyne, S. Soares, J. Vercruysse, E. Peeters, A. Burggraeve, C. Vervaet, J.P. Remon, N.
Sandler, T. De Beer, Prediction of quality attributes of continuously produced granules using
complementary PAT tools. Eur. J. Pharm. Biopharm. 82 (2012) 429-436.
[37] M. Fonteyne, D. Gildemyn, E. Peeters, S. Mortier, J. Vercruysse, K.V. Gernaey, C. Vervaet,
J.P. Remon, I. Nopens, T. De Beer, Moisture and drug solid-state monitoring during a continuous
drying process using empirical and mass balance models. Eur. J. Pharm. Biopharm. 87 (2014) 616-
628.
[38] M. Diller, J. Kerridge, Feedback EMEA/Industry Discussion Eli Lilly & Co Ltd Case study:
Use of in-line near-infrared spectroscopy to monitor segregation of a pharmaceutical powder blend in
a tablet press. London, 2009.
[39] A.D. Karande, P.W.S. Heng, C.V. Liew, In-line quantification of micronized drug and
excipients in tablets by near infrared (NIR) spectroscopy: Real time monitoring of tableting process.
Int. J. Pharm. 396 (2010) 63-74.
[40] P.R. Wahl, G. Fruhmann, S. Sacher, G. Straka, S. Sowinski, J.G. Khinast, PAT for tableting:
inline monitoring of API and excipients via NIR spectroscopy. Eur. J. Pharm. Biopharm. 87 (2014)
271-278.
[41] K. Järvinen, W. Hoehe, M. Järvinen, S. Poutiainen, M. Juuti, S. Borchert, In-line monitoring
of the drug content of powder mixtures and tablets by near-infrared spectroscopy during the
continuous direct compression tableting process. Järvinen KEur. J. Pharm. Sci. 48 (2013) 680-688.
[42] H.W. Ward, D.O. Blackwood, M. Polizzi, H. Clarke, Monitoring blend potency in a tablet
press feed frame using near infrared spectroscopy. J. Pharm. Biomed. Anal. 80 (2013) 18-23.
[43] R. Singh, A. Sahay, K.M. Karry, F. Muzzio, M. Ierapetritou, R. Ramachandran,
Implementation
of a hybrid MPC-PID control strategy using PAT tools into a direct compaction continuous
pharmaceutical tablet manufacturing pilot-plant. Int. J. Pharm. 473 (2014) 38-54.
Caption Fig. 1. Industrial processes most used for the production of pharmaceutical solid-dosage forms.

Fig. 1
Figure 1

Table 1.
Advantages and challenges for the adoption of continuous processing in the pharmaceutical industry.
Advantages Challenges
No scale-up issues Not appropriate for small product loads
Ease of automation Less flexible regarding successive process steps
Production of desired product amount Need for fast steady state
Better product quality assurance Need for robust processes
Shorter product development time No obvious batch definition
Shorter time-to-market Production changes for already licensed products
Just-in-time-production Regulatory uncertainty
Reduced capital investment New mind-set needed for quality assurance
(based on continuous in-process measurements)
Reduction of labor costs
No transfer of intermediate products
No storage of intermediate products
Less floor space required
Less energy consumption
Less waste
Table 1

Table 2. Literature overview on implementation of PAT tools in continuous pharmaceutical manufacturing
Evaluated CQA PAT tool Interfacing Challenges/shortcomings/problems Ref.
Continuous powder streams
%API NIR Through sapphire window
* Bench scale test set-up differs from production scale powder hopper * Averaging was necessary for both calibration and prediction samples
[10]
Continuous blending
%API NIR Probe above the
powder, which flows on a chute
* Narrower concentration range needed to be used in order to improve the prediction of low concentration
[11]
%API Multipoint NIR
Probe above the powder, which flows on a chute
* Probe-tip fouling * One model developed for the five probes together, which resulted in additional variance in the spectra
[12]
%API NIR Probe measuring at the outlet of the continuous blender
* RSD varies with bulk variations of the powder bed * Mass-flow changes influenced the PLS predictions
[13]
Table 2
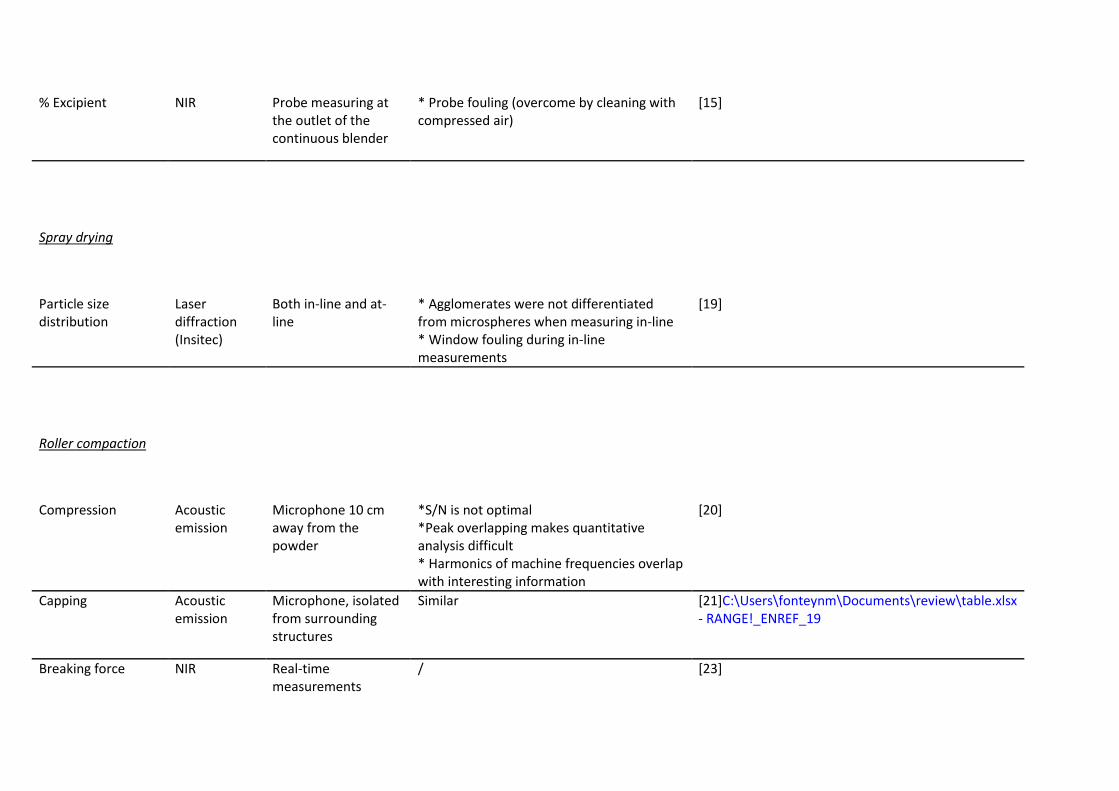
% Excipient NIR Probe measuring at the outlet of the continuous blender
* Probe fouling (overcome by cleaning with compressed air)
[15]
Spray drying
Particle size distribution
Laser diffraction (Insitec)
Both in-line and at-line
* Agglomerates were not differentiated from microspheres when measuring in-line * Window fouling during in-line measurements
[19]
Roller compaction
Compression Acoustic
emission Microphone 10 cm away from the powder
*S/N is not optimal *Peak overlapping makes quantitative analysis difficult * Harmonics of machine frequencies overlap with interesting information
[20]
Capping Acoustic emission
Microphone, isolated from surrounding structures
Similar [21]C:\Users\fonteynm\Documents\review\table.xlsx - RANGE!_ENREF_19
Breaking force NIR Real-time measurements
/ [23]

Particle size after milling
Relative density NIR Non-contact measurements, focus on mid-point of the ribbons
* Large differences between in-line predictions and off-line measured values * Variation due to non-ideal measurement conditions
[24]
Moisture content
Tensile strength
Young's modulus
%API NIR Non-contact measurements, focus on mid-point of the ribbons
* Powder by-pass created dust clouds, which confounded the relative density, tensile strength and young's modulus prediction
[25]
Relative density
Moisture content
Tensile strength
Young's modulus
Granule tablet tensile strength
NIR Real-time measurements of the unloaded ribbons
/ [26]C:\Users\fonteynm\Documents\review\table.xlsx - RANGE!_ENREF_24
Granule mean particle size
Ribbon density
Ribbon density NIR Real-time non-contact measurements, probe head situated above the ribbons
* Difficult to find a good reference method to develop PLS models predicting density. The sample area measured by the reference technique is unequal to the area measured by NIR. This causes an offset in the predictions
[28]

Ribbon density NIR and microwave resonance sensing
NIR: non-contact measurements, probe head situated above the ribbons
*NIR needs chemometrics to predict moisture and ribbon density * NIR has a small penetration depth * microwave resonance sensing does not provide chemical information
[29]
Moisture content RS: in-line with the
produced ribbon
%API NIR Use of rectangular channel, creating a constant gap between probe head and flakes
* Important to keep the distance between probe and flake constant * Different models, predicting physical characteristics needed to be constructed for each used formulation
[30]
Relative density
Tensile strength
Young's modulus
Twin screw granulation
Solid state of the API
NIR, Raman and spatial filter velocimetry
At-line static measurements, using a cuvette
* SFV probe fouling * Spectra are collected statically instead of in the product stream
[32]
Granule size (d50) Spatial filter
velocimetry In-line, dynamic measurements under granulator outlet

Granule size (d10, d50, d90)
High speed imaging camera
Camera installed above the powder, which flows on a chute
* Algorithm calculates the best fit ellipse, the Ferret diameter would be better for irregular shapes * High variation in d50 and d90 values hinders their use as quality characteristic
[33]
Moisture content NIR In-line, implemented in the evaluation module after the dryer
* Limited amount of experiments * NIR measurements after instead of during drying
[34]
Granule size distribution
FBRM In-line, implemented after the mill
* Probe fouling [35]
Moisture content NIR, Raman and photometric imaging
At-line, static measurements
* Due to fouling of the Flashsizer 3D window, the measurements needed to be performed at-line
[36]
Flowability of the granules
Solid state of the API
Residual moisture content
NIR and Raman
In-line, implemented in the fluid bed dryer
* Probe position did not allow measurement at the start of the drying cycle
[37]
Solid state of the API
Direct compression

%API NIR In-line, adjacent to the tablet ejection area
* Calibration spectra needed to be collected under the same conditions as the in-process data * Method validation according to ICH Q2, which is not optimal for spectral data
[39]
% API and excipients
NIR In-line, in the feed frame, directly above the paddle wheel
* Lack of 'sample volume' definition and calculating the number of measured 'tablets' is challenging
[40]
%API NIR In-line in the tablet press, measuring each individual tablet
* Due to the large amount of data, only each 20th spectrum was taken into account
[41]
%API NIR Through a Plexi-glass observation window in the feed frame
* NIR predictions were influenced by the paddle wheel rotational speed
[42]