PROCESS · 2018-03-31 · Mode & Effects Analysis (PFMEA), 4th Edition and Advanced Product Quality...
88
Creating and managing effective Part Number Specific Process FMEAs & Control Plans using Reference (Unit) PFMEAs Practitioner Guide Dr. Ian Riggs PROCESS Failure Mode & Effects Analysis and Production Control Plan TOOLKIT
Transcript of PROCESS · 2018-03-31 · Mode & Effects Analysis (PFMEA), 4th Edition and Advanced Product Quality...
Creating and managing effectivePart Number Specific Process FMEAs &
Control Plans using Reference (Unit) PFMEAs
Practitioner Guide
Dr. Ian Riggs
PROCESSFailure Mode & Effects Analysis
and Production Control Plan
TOOLKIT


Creating Effective Process FMEAs & Contol Plans
3
Contents LIST OF FIGURES 5
LIST OF TABLES 6
INTRODUCTION 7
Chapter One 11
PROCESS FMEA AS PART OF A DEFECT PREVENTION SYSTEM 11
THE DESIGN FMEA 12
THE PROCESS FMEA 14
THE CONTROL PLAN 17
MEASUREMENT SYSTEMS ANALYSIS 18
INITIAL CAPABILITY & PROCESS CONTROL 20
Chapter Two 23
PROCESS FMEAS – KEY POINTS & CARE POINTS 23
CROSS FUNCTIONAL TEAM APPROACH 23
PFMEA SCOPE 23
A) PART NUMBER & DESCRIPTION 25
B) CORE TEAM 27
C) ORIGINAL DATE / REVISION DATE 28
D) OPERATION / STEP 29
E) PROCESS FUNCTION / REQUIREMENT 30
F) POTENTIAL FAILURE MODES 33
G) POTENTIAL EFFECT OF FAILURE 34
H) SEVERITY RATING 35
I) POTENTIAL CAUSE(S) OF THE FAILURE MODE 36
J) PREVENTION CONTROLS 38
K) OCCURRENCE RATING 39
L) DETECTION CONTROLS 41
Creating Effective Process FMEAs & Contol Plans
4
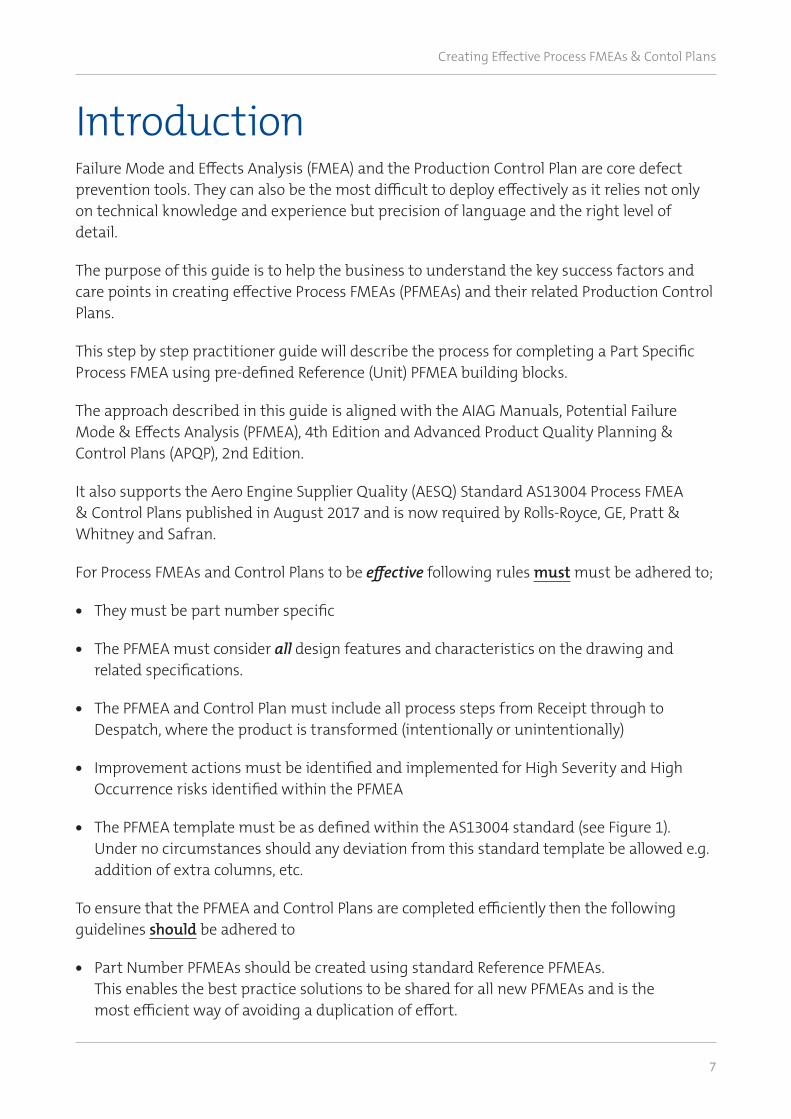
M) DETECTION RANKING 42
N) RISK PRIORITY SCORE 43
O) IMPROVEMENT ACTIONS 45
PFMEA RPN SCORING WORKED EXAMPLE 47
Chapter Three 51
CREATING REFERENCE PROCESS FMEAS 51
STEP 1: SELECT THE PROCESS FOR EVALUATION 52
STEP 2: DEFINE THE TYPICAL FEATURES AND CHARACTERISTICS OF THE PROCESS BEING EVALUATED 52
STEP 3: DEFINE TYPICAL FAILURE MODES FOR EACH CHARACTERISTIC 53
STEP 4: IDENTIFY POTENTIAL CAUSES OF FAILURE BY PROCESS TYPE 54
STEP 5: IDENTIFYING THE PREVENTION CONTROLS ALIGNED TO THE IDENTIFIED POTENTIAL CAUSES IN THE REFERENCE PFMEA 56
STEP 6: IDENTIFYING THE TYPICAL DETECTION CONTROLS FOR THE FAILURE MODE IN THE REFERENCE PFMEA 57
Chapter Four 59
COMPLETING A PFMEA USING REFERENCE PFMEAS BUILDING BLOCKS 59
STEP 1: SELECT THE PART NUMBER FOR THE PFMEA ACTIVITY & COLLATE ALL RELATED DOCUMENTATION REQUIRED TO COMPLETE THE PFMEA 60
STEP 2: COMPLETE THE PROCESS STEP AND REQUIREMENT COLUMNS OF THE PFMEA USING THE INFORMATION COLLECTED IN STEP 1. 61
STEP 3: ADD THE RELEVANT REFERENCE PFMEA INFORMATION FOR EACH CHARACTERISTIC LISTED. 63
STEP 4: COMPLETE THE PART SPECIFIC PFMEA WITH CROSS FUNCTIONAL TEAM 66
STEP 5: PRIORITISING IMPROVEMENT ACTIONS 70
Chapter Five 71
CREATING PRODUCTION CONTROL PLANS FROM THE PROCESS FMEA 71
AAPPENDIX A: AS13004 PFMEA SCORING GUIDELINES 70
APPENDIX B: TYPICAL FAILURE MODE LIBRARY 73
APPENDIX C: KEY QUESTIONS FOR PFMEA 74

Creating Effective Process FMEAs & Contol Plans
5
List of Figures Figure 1: PFMEA Template from AS13004 9 Figure 2: Creating Part Specific PFMEAs Overview using Reference PFMEAs 10 Figure 3: Advanced Quality Product Planning – Key Elements 11 Figure 4: Role of the Design FMEA 12 Figure 5: The Role of the Process FMEA 14 Figure 6: Typical Control Strategies based upon the PFMEA Risk Profile 15 Figure 7: Standard Control Plan Template 17 Figure 8: Sources of Measurement Error 18 Figure 9: The Effect of Gauge R&R Result on the Engineering Tolerance in manufacturing ‘The Zone of Uncertainty’ 19 Figure 10: Processes On Target with Minimum variation 20 Figure 11: Calculating Cpk for a Process 21 Figure 12: Impact of Cpk per feature on Part Right First Time & Parts per Million (PPM) 21 Figure 13: Relationship between Cpk, 6 Sigma and Parts per Million 22 Figure 14: Process FMEA example (truncated) 24 Figure 15: Team Size Effectiveness 27 Figure 16: Process Function and link to Potential Failure Modes in a PFMEA 31 Figure 17: Potential Causes of Failure in a PFMEA 36 Figure 18: RPN Scoring Example 43 Figure 19: RPN Improvement Actions in a PFMEA 46 Figure 20: Detection Scoring Analogy 49 Figure 21: Overview of Reference PFMEA Elements 51 Figure 22: Reference PFMEA for CNC Hole Drilling: Potential Failure Mode Causes 55 Figure 23: Reference PFMEA Prevention Controls 56 Figure 24: Identifying the Typical Detection Controls in the Reference PFMEA 58 Figure 25: Reference PFMEA Database Structure Example 60 Figure 26: Creating a part specific Shell PFMEA 61 Figure 27: Completing the Process Step and Requirements Column 61 Figure 28: Hole Pattern Example 62 Figure 29: Determining the Required Reference PFMEAs 63 Figure 30: Compiling the ‘Shell’ Part Number PFMEA using Reference PFMEAs 64 Figure 31: Reference PFMEA example 65 Figure 32: Completing the Effects and Severity Rating 66 Figure 33: Completing the Potential Causes, Prevention Controls and Occurrence Scoring sections. 67 Figure 34: Updating the Detection Controls, Detection Scoring and calculating the RPN 68

Creating Effective Process FMEAs & Contol Plans
6
Figure 35: Documenting Improvement Actions and Rescoring RPN 69 Figure 36: Prevention & Detection Control Documentation 71 Figure 37: How the Process FMEA Prevention & Detection Controls are managed. 72 Figure 38: Typical Inputs to a Production Control Plan 73 Figure 39: Standard Control Plan Template 74 Figure 40: Control Plan Structure 79 Figure 41: Example Production Control Plan for a Drilling Operation 80 Figure 42: Control Plan Data derived from Process FMEA (red text) 81 List of Tables Table 1 : Failure Mode Examples 33 Table 2 : AS13004 Process FMEA Severity Risk Scoring 35 Table 3 : AS13004 Occurrence Rating Table for Process FMEA 40 Table 4 : AS13004 Detection Rating Table 42 Table 5: Example Failure Modes 53
Creating Effective Process FMEAs & Contol Plans
7
IntroductionFailure Mode and Effects Analysis (FMEA) and the Production Control Plan are core defect prevention tools. They can also be the most difficult to deploy effectively as it relies not only on technical knowledge and experience but precision of language and the right level of detail.
The purpose of this guide is to help the business to understand the key success factors and care points in creating effective Process FMEAs (PFMEAs) and their related Production Control Plans.
This step by step practitioner guide will describe the process for completing a Part Specific Process FMEA using pre-defined Reference (Unit) PFMEA building blocks.
The approach described in this guide is aligned with the AIAG Manuals, Potential Failure Mode & Effects Analysis (PFMEA), 4th Edition and Advanced Product Quality Planning & Control Plans (APQP), 2nd Edition.
It also supports the Aero Engine Supplier Quality (AESQ) Standard AS13004 Process FMEA & Control Plans published in August 2017 and is now required by Rolls-Royce, GE, Pratt & Whitney and Safran.
For Process FMEAs and Control Plans to be effective following rules must must be adhered to;
• They must be part number specific
• The PFMEA must consider all design features and characteristics on the drawing and related specifications.
• The PFMEA and Control Plan must include all process steps from Receipt through to Despatch, where the product is transformed (intentionally or unintentionally)
• Improvement actions must be identified and implemented for High Severity and High Occurrence risks identified within the PFMEA
• The PFMEA template must be as defined within the AS13004 standard (see Figure 1). Under no circumstances should any deviation from this standard template be allowed e.g. addition of extra columns, etc.
To ensure that the PFMEA and Control Plans are completed efficiently then the following guidelines should be adhered to
• Part Number PFMEAs should be created using standard Reference PFMEAs. This enables the best practice solutions to be shared for all new PFMEAs and is the most efficient way of avoiding a duplication of effort.

Creating Effective Process FMEAs & Contol Plans
8
• Reference PFMEAs and Part Number PFMEAs should be created in a dedicated FMEA software tool that can manage the complexity and volume of data created across all part numbers. There are many standard FMEA software solutions available, many will also create the Production Control Plan as well.
• The Reference PFMEAs shall be maintained by a single function to ensure consistency and version control.
• If there are no defined Reference PFMEAs available then the team that requires it shall first create it and then make it available to the other parts of the business using the standard FMEA software.
• Care must be taken to avoid the duplication of the creation of Reference PFMEAs across the business.
• There should be a program to continually update the PFMEAs and to reduce the overall process risks.
The Business must establish a cohort of engineers that are trained in FMEA and the chosen FMEA software tools to support the process. NOTE: Reference FMEAs may also be known as ‘unit FMEAs’ or ‘standard FMEAs’.
This Guide will also describe the creation of the Production Control Plan from the part specific prevention and detection control information contained within the Process FMEA (non part specific controls may be contained in other documents such as maintenance plans or asset care requirements).
The Control Plan is a part specific key document that defines the methods of managing the process to ensure conforming product. It is to be used alongside the Work Instructions by the operator and should be referred to during manufacture or assembly to ensure that the right controls are being applied.
The Production Control plan is a live document and will be subject to regular review and updates.
Dr. Ian Riggs Head of Quality Assurance, Audit & Zero Defects Program

Creating Effective Process FMEAs & Contol Plans
9
Figure 1: PFMEA Template from AS13004
Key C
ontac
t / P
hone
Date
(Orig
.)Da
te (R
ev.)
N/C
Core
Tea
m
Cust
omer
App
rova
l Dat
e
Pre
ven
tion
Con
trol
s
Occurrence
Det
ectio
nC
ontr
ols
Detection
Act
ions
Tak
en
Com
plet
ion
Dat
e
Severity
Occurrence
Detection
RP
N
100
- CN
C D
rill -
Set
-U
p2
Set
-up
CN
C D
rill
Cor
rect
tool
s lo
aded
in
pos
ition
to d
rill t
o si
ze
(0.3
75 in
+0.
000
/ -
0.00
2 in
)
Ove
r Hig
h Li
mit
Par
t Lea
ks, r
esul
ting
in fu
el le
ak le
adin
g to
fire
, exp
losi
on o
r saf
ety
haza
rd (1
0)R
ejec
t Sen
t to
Cus
tom
er (8
)S
crap
at p
lant
w/o
late
del
iver
y (6
)
10K
CIn
corre
ct d
rill l
oade
d in
to to
ol
mag
azin
eLa
ser t
ool c
heck
prio
r to
mac
hini
ng
oper
atio
n2
Vis
ual i
nspe
ctio
n (8
)In
pro
cess
insp
ectio
n an
d Fi
nal i
nspe
ctio
n w
ith C
MM
(6)
612
0Im
plem
ent f
unct
iona
lity
to a
utom
atic
ally
st
op th
e m
achi
ning
ope
ratio
n fo
llow
ing
the
failu
re o
f a la
ser t
ool c
heck
.
Pro
cess
Eng
inee
r05
/15/
20xx
Ext
erna
l com
pany
con
tact
ed, s
olut
ion
iden
tifie
d an
d ta
rget
dat
e fo
r im
plem
enta
tion
set
(06/
02/2
0xx)
. A
ctio
n to
be
clos
ed 0
9/25
/20x
x fo
llow
ing
verif
icat
ion
of im
plem
ente
d so
lutio
n.
#1
660
100
- CN
C D
rill -
Set
-U
p2
Und
er L
ow
Lim
it
Rej
ect S
ent t
o C
usto
mer
, una
ble
to a
ssem
ble
tube
or a
dapt
or a
t en
gine
ass
embl
y fa
cilit
y (8
)R
ewor
kabl
e bu
t with
impa
ct to
del
iver
y (6
)8
KC
Inco
rrect
dril
l loa
ded
into
tool
m
agaz
ine
Lase
r too
l che
ck p
rior t
o m
achi
ning
op
erat
ion
2V
isua
l ins
pect
ion
(8)
In p
roce
ss in
spec
tion
and
Fina
l ins
pect
ion
with
CM
M (
6)6
96Im
plem
ent f
unct
iona
lity
to a
utom
atic
ally
st
op th
e m
achi
ning
ope
ratio
n fo
llow
ing
the
failu
re o
f a la
ser t
ool c
heck
.
Pro
cess
Eng
inee
r05
/15/
20xx
Ext
erna
l com
pany
con
tact
ed, s
olut
ion
iden
tifie
d an
d ta
rget
dat
e fo
r im
plem
enta
tion
set
(06/
02/2
0xx)
. A
ctio
n to
be
clos
ed 0
9/25
/20x
x fo
llow
ing
verif
icat
ion
of im
plem
ente
d so
lutio
n.
81
648
100
- CN
C D
rill -
Lo
ad M
ater
ial
3S
et-u
p C
NC
Dril
lD
rill H
oles
to c
orre
ct
loca
tion
Hol
es o
ut o
f po
sitio
n
Rej
ect S
ent t
o C
usto
mer
, una
ble
to a
ssem
ble
tube
or a
dapt
or a
t en
gine
ass
embl
y fa
cilit
y (8
)S
crap
at p
lant
w/o
late
del
iver
y (6
)8
KC
Par
t mov
ed in
Fix
ture
due
to
cutti
ng c
hips
pre
vent
ing
part
seat
ing
prop
erly
Ope
rato
r cle
ans
chip
s fro
m fi
xtur
e pr
ior t
o lo
adin
g
Ope
rato
r vis
ual i
nspe
ctio
n of
fixt
ure
cont
amin
atio
n pr
ior t
o lo
adin
g
3
Vis
ual i
nspe
ctio
n (8
)In
pro
cess
insp
ectio
n an
d Fi
nal i
nspe
ctio
n of
hol
e po
sitio
n w
ith C
MM
(6
)
614
4Im
plem
ent a
utom
ated
fixt
urin
g te
chni
ques
that
flus
h ch
ips
from
fixt
ure
prio
r to
part
bein
g lo
aded
Pro
cess
Eng
inee
r 03
/25/
20xx
Des
ign
activ
ity in
wor
k - n
ew O
ccur
renc
e es
timat
ed to
be
2 0
6/15
/20x
x8
16
48
8K
CP
art i
ncor
rect
ly lo
cate
d in
fix
ture
due
to fi
xtur
e da
mag
e
Fixt
ure
box
prot
ectio
n in
pla
ce o
n lo
catio
n po
ints
Ope
rato
r vis
ual i
nspe
ctio
n of
fixt
ure
for d
amag
e pr
ior t
o lo
adin
g
2
Vis
ual i
nspe
ctio
n (8
)In
pro
cess
insp
ectio
n an
d Fi
nal i
nspe
ctio
n of
hol
e po
sitio
n w
ith C
MM
(6
)
696
100
- CN
C D
rill -
Dril
l H
oles
4D
rill H
oles
Dril
l Hol
es
Com
plet
ely
Thr
uH
oles
not
D
rille
d T
hru
Rej
ect S
ent t
o C
usto
mer
, una
ble
to a
ssem
ble
tube
or a
dapt
or a
t en
gine
ass
embl
y fa
cilit
y (8
)R
ewor
kabl
e bu
t with
impa
ct to
del
iver
y (6
)8
KC
Wor
n/D
amag
ed d
rill
Too
l life
lim
ited
to 1
0 pa
rts /
tool
Lase
r too
l che
ck p
rior t
o m
achi
ning
op
erat
ion
3In
Pro
cess
and
Fin
al V
isua
l Ins
pect
ion
(7)
716
8Im
plem
ent t
ool t
orqu
e lim
iter t
o st
op
mac
hini
ng o
pera
tion
prio
r to
tool
br
eaka
ge
Pro
cess
Eng
inee
r 03
/15/
20xx
Upd
ate
- tal
ked
to v
endo
r of C
NC
mac
hine
and
cu
rrent
ly id
entif
ying
mea
ns o
f im
plem
entin
g m
onito
ring
syst
em o
n ex
istin
g m
achi
nes
81
216
150
- Deb
urr
1D
ebur
r - F
uel-A
ir B
rack
etR
emov
e B
urrs
Ove
r Deb
urre
dS
crap
at p
lant
w/o
late
del
iver
y (6
)6
Man
ually
dep
ende
nt p
roce
ssN
one
3In
Pro
cess
and
Fin
al V
isua
l Ins
pect
ion
(7)
712
6
Cha
nge
CN
C p
rogr
am to
low
er
occu
rrenc
e by
bui
ldin
g an
aut
o-de
burri
ng c
ycle
into
the
drill
ing
Ope
ratio
n 10
0-5
Con
side
r im
plem
enta
tion
of ro
bot
debu
rring
.
Pro
cess
Eng
inee
r 09
/15/
20xx
Pro
gram
Mod
ified
09/1
5/20
xx6
17
42
Und
er
Deb
urre
dR
ewor
kabl
e bu
t with
impa
ct to
del
iver
y (6
)6
Man
ually
dep
ende
nt p
roce
ssN
one
2In
Pro
cess
and
Fin
al V
isua
l Ins
pect
ion
(7)
784
Cha
nge
CN
C p
rogr
am to
low
er
occu
rrenc
e by
bui
ldin
g an
aut
o-de
burri
ng c
ycle
into
the
drill
ing
Ope
ratio
n 10
0-5
Con
side
r im
plem
enta
tion
of ro
bot
debu
rring
.
Pro
cess
Eng
inee
r 07
/24/
20xx
Pro
gram
Mod
ified
09/1
5/20
xx6
17
42
200
- Har
d A
nodi
ze1
Out
side
Pro
cess
ing
- Fu
el-A
ir B
rack
et; H
ard
Ano
dize
Ano
dize
Par
tP
art n
ot
anod
ized
Rej
ect S
ent t
o C
usto
mer
(8)
Rew
orka
ble
but w
ith im
pact
to d
eliv
ery
(6)
8P
roce
ss fl
ow s
tep
mis
sed
(par
t no
t sen
t to
be a
nodi
zed)
Ope
rato
r sta
mp
requ
ired
on e
ach
step
in th
e ro
uter
1
Vis
ual c
heck
of p
art a
t fin
al in
spec
tion
(with
out v
isua
l acc
epta
nce
stan
dard
s in
pl
ace)
Com
plia
nce
chec
k w
ith C
ertif
icat
e of
C
onfo
rman
ce
756
250
- Cle
anin
g1
Cle
anin
g - F
uel-A
ir B
rack
etC
lean
Par
tP
art n
ot
clea
ned
Rew
orka
ble
but w
ith im
pact
to d
eliv
ery
(6)
6M
anua
lly d
epen
dent
pro
cess
, pr
oces
s no
t ade
quat
ely
com
plet
ed
Ope
rato
r sta
mp
requ
ired
on e
ach
step
in th
e ro
uter
1V
isua
l ass
essm
ent o
f par
t cle
anlin
ess
in
final
insp
ectio
n (7
)7
42
6C
lean
ing
solu
tion
cont
amin
ated
Reg
ular
cha
nge
of c
lean
ing
solu
tion
ever
y 10
0 pa
rts o
r 1 m
onth
2V
isua
l ass
essm
ent o
f par
t cle
anlin
ess
in
final
insp
ectio
n (7
)7
84
300
- Par
t Mar
king
1M
ark
Par
ts -
Fuel
-Air
Bra
cket
Mar
k P
arts
per
Prin
tIn
corre
ct D
ata
Mar
ked
on th
e P
art
Rej
ect s
ent t
o cu
stom
er (8
)R
ewor
kabl
e w
ithou
t im
pact
to d
eliv
ery
(4)
8M
arki
ng in
form
atio
n en
tere
d m
anua
lly -
Inco
rrect
ent
ryN
one
3V
isua
l con
firm
atio
n of
mar
ked
data
in fi
nal
insp
ectio
n (7
)7
168
Impl
emen
t aut
omat
ed p
art m
arki
ng
syst
em w
ith d
ata
pulle
d di
rect
ly o
ut o
f da
taba
se a
void
ing
the
need
for m
anua
l tra
nscr
iptio
n.S
tatio
n to
incl
ude
auto
mat
ed in
sta
tion
cont
rol (
scan
ning
and
con
firm
atio
n of
ba
rcod
e)
Pro
cess
Eng
inee
r 06
/01/
20xx
Cel
l pro
cure
d an
d be
ing
inst
alle
d 06
/01/
20xx
81
324
Mar
king
not
in
corre
ct
loca
tion
Rej
ect s
ent t
o cu
stom
er (8
)R
ewor
kabl
e w
ithou
t im
pact
to d
eliv
ery
(4)
8P
art n
ot lo
cate
d co
rrect
ly in
m
arki
ng m
achi
neN
one
3V
isua
l ins
pect
ion
of m
ark
posi
tion
usin
g re
fere
nce
over
lay
tem
plat
e (7
)7
168
Impl
emen
t loc
atio
n fix
ture
on
mar
king
m
achi
ne.
Pro
cess
Eng
inee
r 05
/15/
20xx
Pro
cure
d an
d be
ing
inst
alle
d 05
/15/
20xx
81
756
350
- Pac
king
1P
ack
Par
ts -
Fuel
-Air
Bra
cket
Pac
k pa
rts fo
r S
hipp
ing
Par
ts n
ot
pack
ed
prop
erly
Par
t dam
aged
in tr
ansi
t, D
amag
ed p
art d
eliv
ered
to c
usto
mer
(8)
8In
suffi
cien
t pro
tect
ive
mat
eria
l in
clud
ed in
box
Non
e2
Vis
ual c
onfir
mat
ion
of p
acka
ging
(7)
711
2Im
plem
ent m
olde
d po
lyst
yren
e pr
otec
tion.
Pro
cess
Eng
inee
r 09
/30/
20xx
New
pac
kagi
ng in
trodu
ced.
09/3
0/20
xx8
17
56
Pro
cess
Fun
ctio
n/D
escr
iptio
n
08/15
/20xx
Severity
Ste
pP
oten
tial E
ffect
(s) o
f Fai
lure
Ope
ratio
n
Act
ion
Res
ults
Rec
omm
ende
d A
ctio
nR
PN
Pot
entia
l Cau
se(s
) of F
ailu
re
Proc
ess
Failu
re M
ode
and
Effe
cts
Anal
ysis
(PFM
EA)
Prot
otyp
e -
Pre
-Lau
nch-
P
rodu
ctio
n -
XPr
oces
s Eng
ineer
07/24
/20xx
Part
Numb
er
Req
uire
men
tsR
espo
nsib
ility
& T
arge
t C
ompl
etio
n D
ate
Cur
rent
Pro
cess
Classification
M213
45Op
erator
, Proc
ess E
ngine
er, Q
uality
Eng
ineer,
Ope
ration
MGR
Pot
entia
l Fa
ilure
Mod
e
Not
e:Th
is is
not a
com
plet
e PF
MEA
doc
umen
t, as
seve
ralp
roce
ss st
eps,
failu
re m
odes
, effe
cts a
nd c
ontr
ols h
ave
been
om
itted
from
this
exam
ple
to a
id c
larit
y fo
r the
stan
dard
. Al
l pro
cess
step
s and
rele
vant
failu
re m
odes
, ass
ocia
ted
effe
cts a
nd c
ontr
ols w
ould
be
show
n w
ithin
a ty
pica
l FM
EA fo
r thi
s pro
duct
Creating Effective Process FMEAs & Contol Plans
10
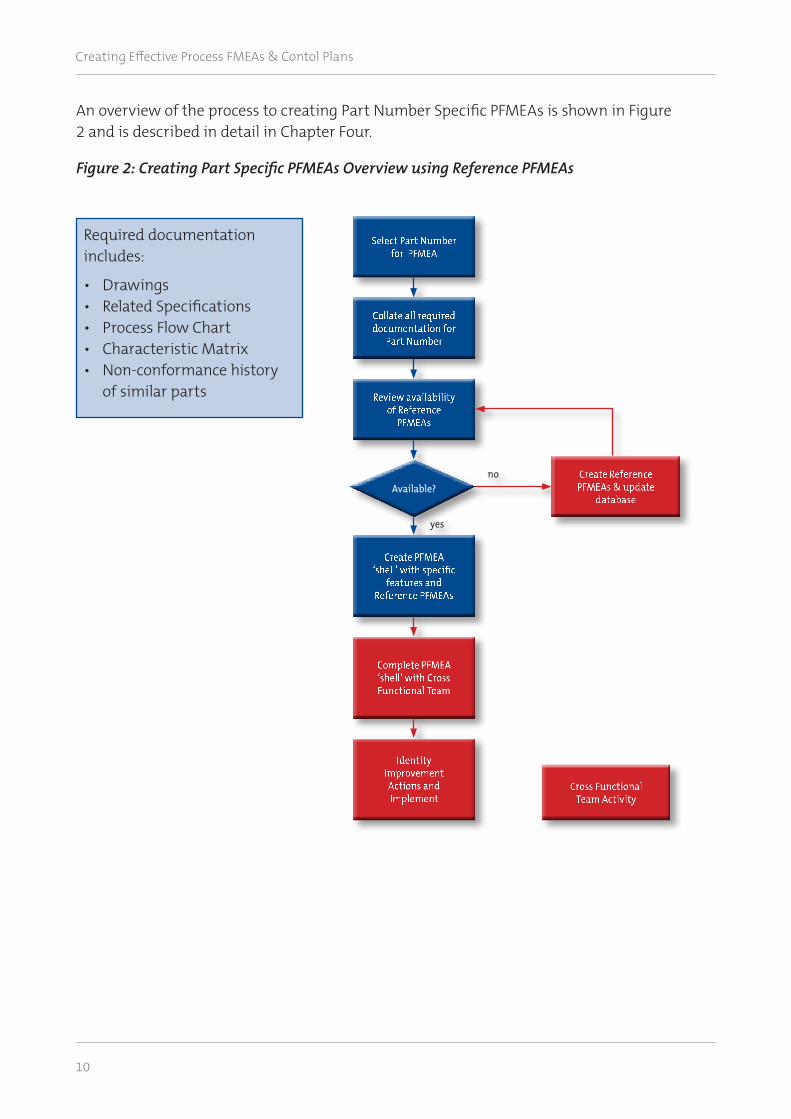
An overview of the process to creating Part Number Specific PFMEAs is shown in Figure 2 and is described in detail in Chapter Four.
Figure 2: Creating Part Specific PFMEAs Overview using Reference PFMEAs
Required documentation includes:
• Drawings• Related Specifications• Process Flow Chart• Characteristic Matrix• Non-conformance history of similar parts
Select Part Numberfor PFMEA
Collate all required documentation for
Part Number
Review availabilityof Reference
PFMEAs
yes
no
Create PFMEA‘shell’ with specific
features andReference PFMEAs
Complete PFMEA‘shell’ with CrossFunctional Team
IdentityImprovementActions andImplement
Cross FunctionalTeam Activity
Create ReferencePFMEAs & update
databaseAvailable?
Creating Effective Process FMEAs & Contol Plans
11
Chapter One Process FMEA as part of a Defect Prevention System
Process FMEAs are a key defect prevention tool and are one of the foundational activities within Advanced Product Quality Planning (APQP).
APQP is a system of interconnecting quality tools designed to ensure that product and process designs are created that meet the customer’s requirements. Deployed properly it is one of the most effective ways of designing production processes that are capable of achieving Zero Defects.
APQP is conducted on a specific part number or assembly and follows a series of activities from concept design through to manufacturing validation (Production Part Approval Process (PPAP).
The purpose of these tools is to identify potential risks with the product and process design at a point in time where changes to either the product or process can still be made to address any identified issues. Although there is still value in the use of these tools retrospectively clearly their ability to change the product or process design to mitigate any risks will be more difficult.
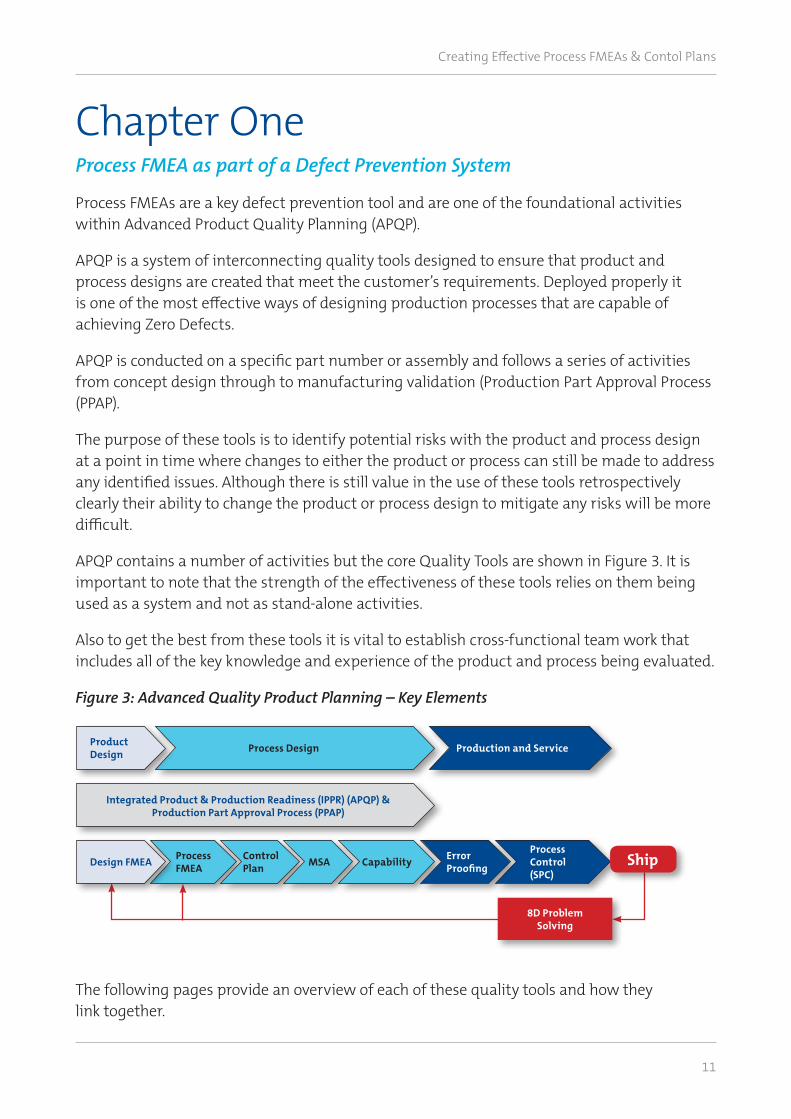
APQP contains a number of activities but the core Quality Tools are shown in Figure 3. It is important to note that the strength of the effectiveness of these tools relies on them being used as a system and not as stand-alone activities.
Also to get the best from these tools it is vital to establish cross-functional team work that includes all of the key knowledge and experience of the product and process being evaluated.
Figure 3: Advanced Quality Product Planning – Key Elements
The following pages provide an overview of each of these quality tools and how they link together.
ProductDesign
Integrated Product & Production Readiness (IPPR) (APQP) &Production Part Approval Process (PPAP)
Process Design Production and Service
Design FMEA ProcessFMEA
ControlPlan MSA Capability Error
Proofing
8D ProblemSolving
ShipProcessControl(SPC)

Creating Effective Process FMEAs & Contol Plans
12
The Design FMEA
Figure 4: Role of the Design FMEA
The Design FMEA evaluates the proposed design to identify and mitigate the ways in which the design may fail to meet the Functional Requirements of the customer.
For example the customer may specify that an engine must have a fuel efficiency of X. The Design FMEA will evaluate how the design may fail to achieve this requirement. The Failure Mode in this case would be ‘Fuel efficiency specification not met’.
For a component such as a pipe the customer requirement may be to ‘transfer water at 50 litres per second at a pressure of 50 bar’. In this example one of the Design Failure Modes would be ‘unable to transfer 50 litres of water per second’.
The DFMEA will then proceed to look for ways in which the Design could fail to meet these requirements i.e. the Potential Causes. For the pipe example this may include ‘specified pipe inner diameter too small’.
When completing a DFMEA the team must assume that the part will be made correctly. Manufacturing failures to meet specification must not be listed as Potential Causes of Failure Modes.
(2) Design Engineering Create a ProductDesign to meet the Customer’s
Functional Requirements
Key Characteristics List
Consequences of Product Failure information
(1) Customer DefinesFunctional Requirements
(3) Design FMEA
Evaluates how the Design Process may fail to produce a Product Design that meets the Functional
requirements of the Customer
Outputs of the DFMEA are the Design Verification Plan, Key Characteristics List and Design
Improvement plans
PFMEA
Creating Effective Process FMEAs
P a g e | 13 of 83 1st Edition
The Design FMEA
Figure 4: Role of the Design FMEA
The Design FMEA evaluates the proposed design to identify and mitigate the ways in which the design may fail to meet the Functional Requirements of the customer.
For example the customer may specify that an engine must have a fuel efficiency of X. The Design FMEA will evaluate how the design may fail to achieve this requirement. The Failure Mode in this case would be ‘Fuel efficiency specification not met’.
For a component such as a pipe the customer requirement may be to ‘transfer water at 50 litres per second at a pressure of 50 bar’. In this example one of the Design Failure Modes would be ‘unable to transfer 50 litres of water per second’.
The DFMEA will then proceed to look for ways in which the Design could fail to meet these requirements i.e. the Potential Causes. For the pipe example this may include ‘specified pipe inner diameter too small’.
When completing a DFMEA the team must assume that the part will be made correctly. Manufacturing failures to meet specification must not be listed as Potential Causes of Failure Modes.

Creating Effective Process FMEAs & Contol Plans
13
The DFMEA will then identify the prevention and detection controls within the design process to mitigate the potential for this design failure e.g. computer modelling, prototype testing, etc. This will form the basis of the Design Verification program.
The DFMEA will produce a list of key risks (Risk Priority Numbers or RPNs) that the team will need to address during the design phase i.e. eliminating the risk or mitigating it.
Another output from the Design FMEA will be the key design characteristics that have been identified and will have an impact on Safety and/or performance of the product to the customer. Information from the DFMEA can also be used to inform the Process FMEA of the effects and severity of specific product Failure Modes.
It should be noted however that simply reviewing the DFMEA when compiling the Process FMEA will not be straight forward. The DFMEA is a good input for the Design Engineer to bring to the PFMEA session but the team will need the Engineer’s knowledge to interpret the DFMEA for use with the PFMEA.
Where no Design FMEA is available then the Design Engineering team will need to provide support to the Process FMEA through providing an engineering knowledge.
The Process FMEA
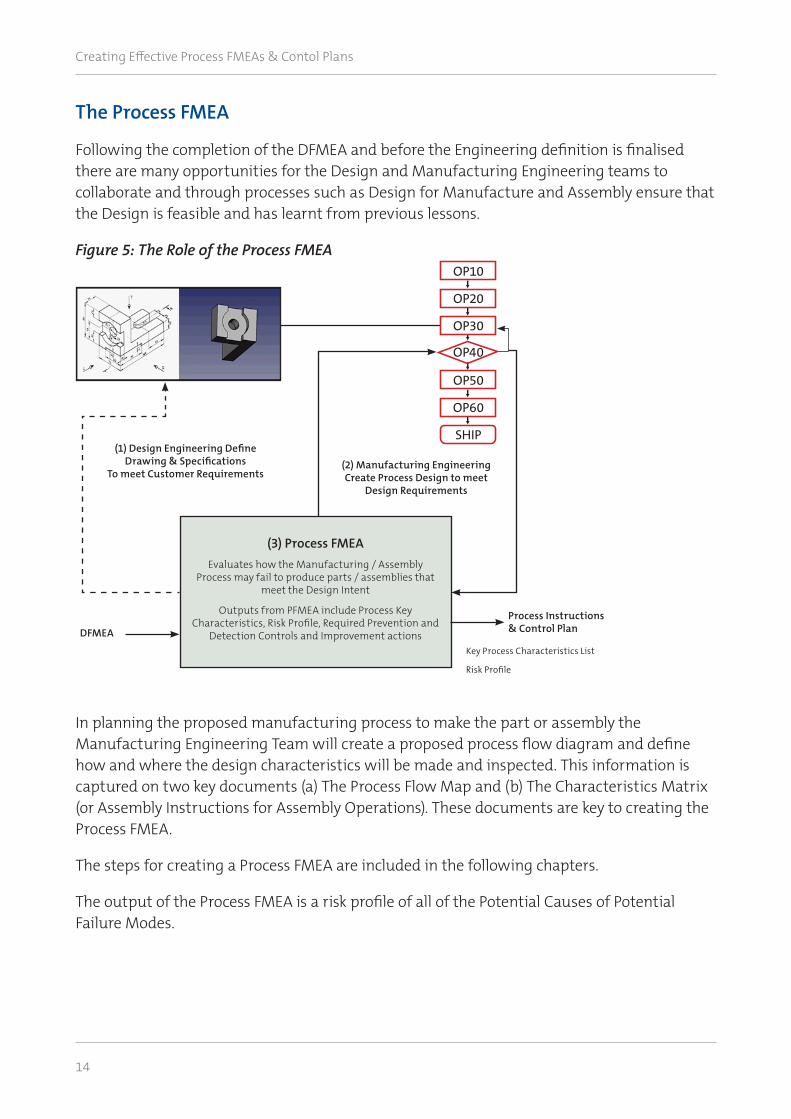
Following the completion of the DFMEA and before the Engineering definition is finalised there are many opportunities for the Design and Manufacturing Engineering teams to collaborate and through processes such as Design for Manufacture and Assembly ensure that the Design is feasible and has learnt from previous lessons.
Figure 5: The Role of the Process FMEA
In planning the proposed manufacturing process to make the part or assembly the Manufacturing Engineering Team will create a proposed process flow diagram and define how and where the design characteristics will be made and inspected. This information is captured on two key documents (a) The Process Flow Map and (b) The Characteristics Matrix (or Assembly Instructions for Assembly Operations). These documents are key to creating the Process FMEA.
The steps for creating a Process FMEA are included in the following chapters.
The output of the Process FMEA is a risk profile of all of the Potential Causes of Potential Failure Modes.
Creating Effective Process FMEAs & Contol Plans
14
Process Instructions& Control Plan
Key Process Characteristics List
Risk Profile
(1) Design Engineering Define Drawing & Specifications
To meet Customer Requirements(2) Manufacturing Engineering Create Process Design to meet
Design Requirements
(3) Process FMEAEvaluates how the Manufacturing / Assembly
Process may fail to produce parts / assemblies that meet the Design Intent
Outputs from PFMEA include Process Key Characteristics, Risk Profile, Required Prevention and
Detection Controls and Improvement actions DFMEA
Creating Effective Process FMEAs
P a g e | 13 of 83 1st Edition
The Design FMEA
Figure 4: Role of the Design FMEA
The Design FMEA evaluates the proposed design to identify and mitigate the ways in which the design may fail to meet the Functional Requirements of the customer.
For example the customer may specify that an engine must have a fuel efficiency of X. The Design FMEA will evaluate how the design may fail to achieve this requirement. The Failure Mode in this case would be ‘Fuel efficiency specification not met’.
For a component such as a pipe the customer requirement may be to ‘transfer water at 50 litres per second at a pressure of 50 bar’. In this example one of the Design Failure Modes would be ‘unable to transfer 50 litres of water per second’.
The DFMEA will then proceed to look for ways in which the Design could fail to meet these requirements i.e. the Potential Causes. For the pipe example this may include ‘specified pipe inner diameter too small’.
When completing a DFMEA the team must assume that the part will be made correctly. Manufacturing failures to meet specification must not be listed as Potential Causes of Failure Modes.
OP10
OP20
OP30
OP40
OP50
OP60
SHIP

Creating Effective Process FMEAs & Contol Plans
15
Where the risk is deemed to be unacceptable by the team then they must not proceed until improvement actions are identified and implemented.
The other use of the risk profile is to identify the appropriate level of control to be used in the manufacturing or assembly process to ensure conformance and ideally to prevent non-conformance from being created.
The Prevention Controls identified within the PFMEA are usually captured in Mistake proofing solutions, Operator Instructions, Asset Care Instructions, etc. Detection Controls from the PFMEA are captured in the Control Plan.
The Risk Profile is also a way of prioritising ongoing improvement actions.
The Process FMEA is a Knowledge Management Hub for all of the things we know about the production process used to produce a particular part number.
Figure 6: Typical Control Strategies based upon the PFMEA Risk Profile
RPN and Process Control Hierarchy
For high severity risks we must always try to design mistake proofing solutions to prevent the possibility of making the non-conformance in the first place (ideal) or at least to mistake proof the detection of the Failure Mode if it does occur.
SPC should be used on those important features identified through the Design DFMEA process (CCFs, KCFs, etc.) but also for processes that have marginal or poor capability. The sensitivity of SPC to target set the process and to detect changes in process stability will be required to optimise the process and prevent it from making non-conformance.
PFMEA
SPC
Mistake ProofingHigh SeverityFeaturesCCF’s / KCFs
Marginal ProcessCapabilityCCF’s / KCFs
Cpk >2 Features
High Cpk & lowSeverity FeaturesReference Features
RPN
Typical Strategies
Control Plan

Creating Effective Process FMEAs & Contol Plans
16
For processes where we have established a high level of capability (in excess of Cpk of 2) then pre-control limits may be all that is required. Pre-control limits are not as sensitive as SPC Control Charts and are not based on the ‘voice of the process’ but simply derived from the engineering specification.
There may be some features where the PFMEA has concluded that the risk / severity of any non-conformance is so low that it only requires periodic checking e.g. access apertures with open tolerances. This control may be achieved through FAIR and Product Audit activities.
Other activities resulting from the PFMEA analysis will be captured in work or Process Instructions e.g. asset care requirements, operator care points, etc.
Creating Effective Process FMEAs & Contol Plans
17
The Control Plan
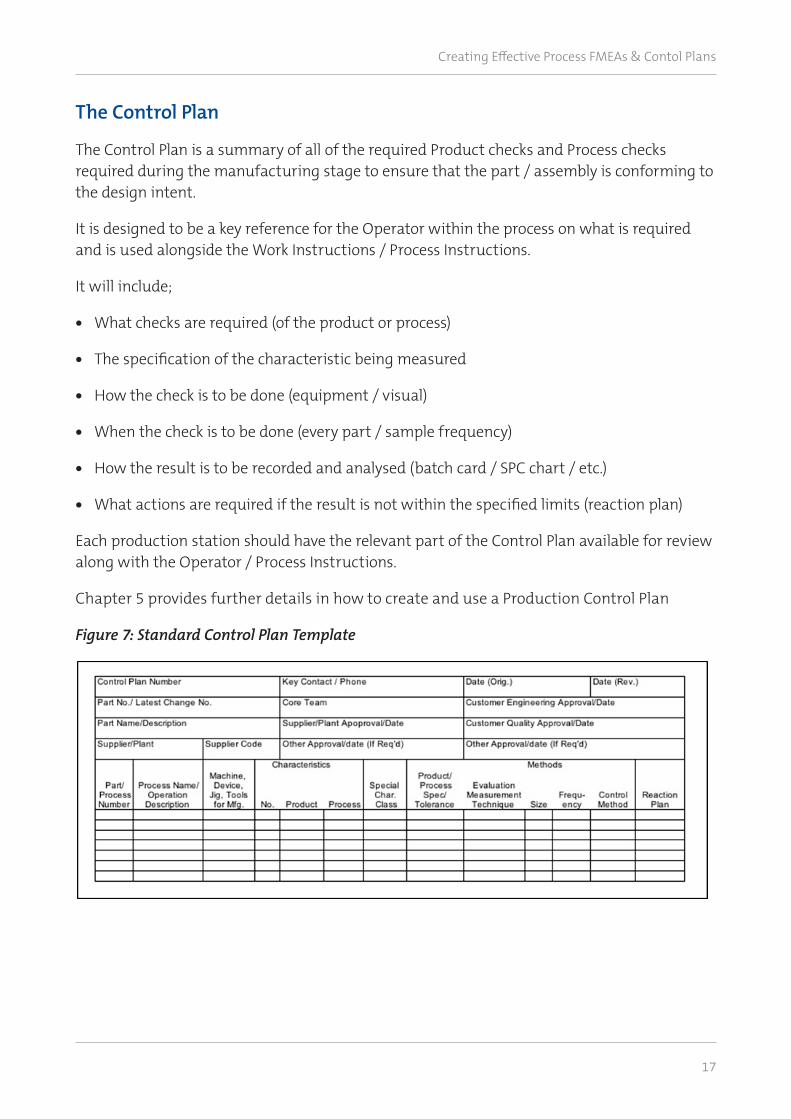
The Control Plan is a summary of all of the required Product checks and Process checks required during the manufacturing stage to ensure that the part / assembly is conforming to the design intent.
It is designed to be a key reference for the Operator within the process on what is required and is used alongside the Work Instructions / Process Instructions.
It will include;
• What checks are required (of the product or process)
• The specification of the characteristic being measured
• How the check is to be done (equipment / visual)
• When the check is to be done (every part / sample frequency)
• How the result is to be recorded and analysed (batch card / SPC chart / etc.)
• What actions are required if the result is not within the specified limits (reaction plan)
Each production station should have the relevant part of the Control Plan available for review along with the Operator / Process Instructions.
Chapter 5 provides further details in how to create and use a Production Control Plan
Figure 7: Standard Control Plan Template
Creating Effective Process FMEAs
P a g e | 17 of 82 1st Edition
The Control Plan
The Control Plan is a summary of all of the required Product checks and Process checks required during the manufacturing stage to ensure that the part / assembly is conforming to the design intent.
It is designed to be a key reference for the Operator within the process on what is required and is used alongside the Work Instructions / Process Instructions.
It will include;
• What checks are required (of the product or process) • The specification of the characteristic being measured • How the check is to be done (equipment / visual) • When the check is to be done (every part / sample frequency) • How the result is to be recorded and analysed (batch card / SPC chart /
etc.) • What actions are required if the result is not within the specified limits
(reaction plan)
Each production station should have the relevant part of the Control Plan available for review along with the Operator / Process Instructions.
Figure 7: Standard Control Plan Template

Creating Effective Process FMEAs & Contol Plans
18
Measurement Systems Analysis
Once we have established the product and process inspections required via the Control Plan we must then ensure that the proposed checking method is capable.
For variable measurements we use Gauge Repeatability and Reproducibility (GR&R) (as a minimum) and for visual or attribute inspections we use Attribute Agreement Analysis (AAA).
Figure 8: Sources of Measurement Error
These capability exercises must be validated using the actual part number and not read across from other similar parts or artefacts. There can be subtle influence of part geometry that can influence the result and will help inform us of the actual measurement capability.
These studies must be representative of real production conditions (environment, cycle time, sample of various operators, etc.). The aim is to capture all of the variation present and not to simply pass a test.
One common mistake is for the study to be done in controlled conditions so that the typical sources of variation are minimised (best operators, no cycle time pressures, etc.). This will invalidate the result of the analysis.
Gauge R&R results should be used to reduce the manufacturing tolerances to take account of the measurement uncertainty. E.g. if we have a Gauge R&R result of 20% then the Engineering tolerance for the feature being measured should be reduced by 20%.
Measurementsystem value
Reference value
Reproduceability
Gauge Repeatability & Reproduceability
A B C
Repeatability
Where different CMMs can be usedthis should be treated as if they were
different operators
Same gaugeSame feature
On 3 partsWith 3 operators (A, B, & C)
Each part measured 10 times each
Same gaugeSame feature
same operator30 times
BIAS

Creating Effective Process FMEAs & Contol Plans
19
This process reduction is described in the AIAG Measurement Systems Analysis Manual and in ISO 14253-1:2013 Geometrical product specifications (GPS) - Inspection by measurement of work pieces and measuring equipment - Part 1: Decision rules for proving conformity or nonconformity with specifications.
Figure 9: The Effect of Gauge R&R Result on the Engineering Tolerance in manufacturing ‘The Zone of Uncertainty’
Any reading inside of the specification and the Zone of Uncertainty is definitely a good part (yellow zone).
Any measurement outside of specification and the Zone of Uncertainty is definitely a bad part.
The Zone of Uncertainty implies that any measurement that is just inside tolerance in this zone may actually be non-conforming but the gauge error has mistakenly measured it as a good part. A reading that is just outside tolerance but in the Zone of Uncertainty may be good but the measurement error has called it bad.
Zone of Uncertainty
Zone of Uncertainty
Target Zone Nominal
USL
LSL
Target ZoneUse
able
Tole
ranc
e
Creating Effective Process FMEAs & Contol Plans
20
Initial Capability & Process Control
Once we know what to inspect and have established that the inspection method is capable we can begin to collect data from production parts to establish the capability of the process.
This can be done for variable measurement characteristics using Cpk and for attribute characteristics using Defects per Millions Opportunities (DPMO).
Sample sizes in an Aerospace environment can often be a problem to make statistical analysis meaningful but there are ways in which we can use data from our production parts.
For example we can use short run SPC charts to establish the average error on a range of features to give an indication of Cpk.
Also some tools will manufacture a number of identical features on a part that we can take measurements from to create a bigger data set.
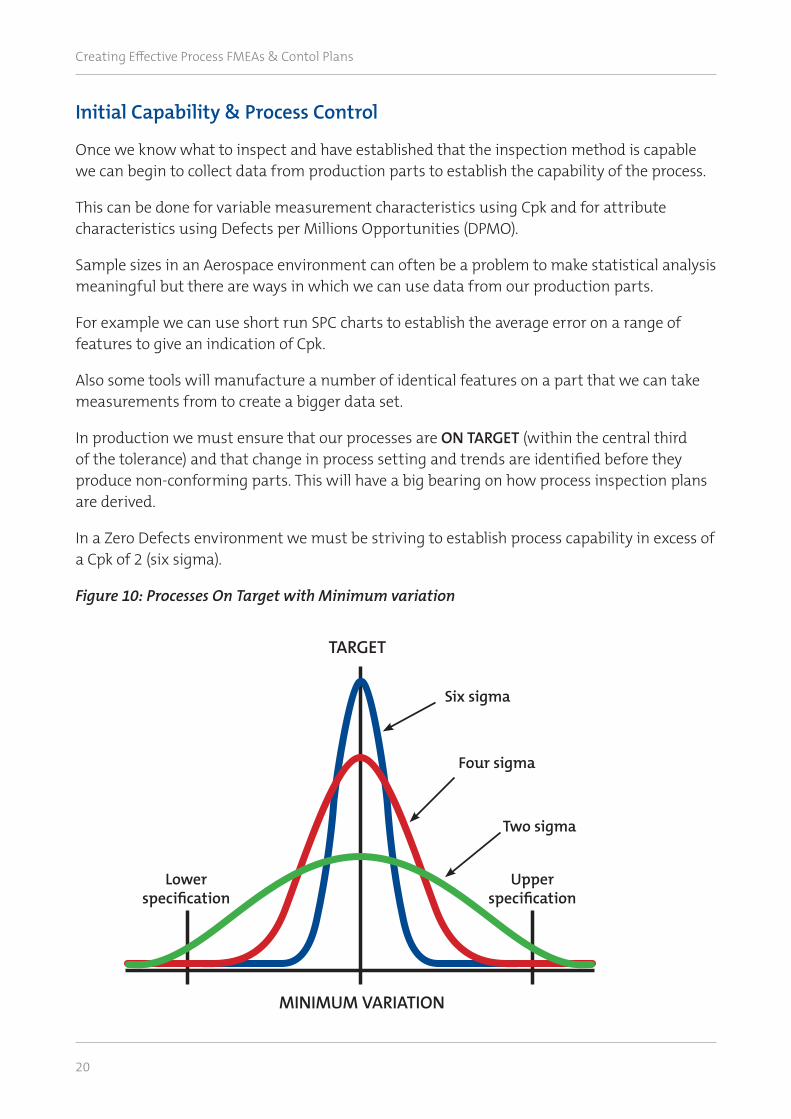
In production we must ensure that our processes are ON TARGET (within the central third of the tolerance) and that change in process setting and trends are identified before they produce non-conforming parts. This will have a big bearing on how process inspection plans are derived.
In a Zero Defects environment we must be striving to establish process capability in excess of a Cpk of 2 (six sigma).
Figure 10: Processes On Target with Minimum variation
TARGET
MINIMUM VARIATION
Lowerspecification
Upperspecification
Two sigma
Four sigma
Six sigma

Creating Effective Process FMEAs & Contol Plans
21
Figure 11: Calculating Cpk for a Process
For complex products, with many features the impact of Cpk for each feature is high. Figure 12 shows how the Parts per Million (PPM) or Right First Time % (RFT%) is impacted by Cpks of 1.33, 1.67 and 2. In automotive industry the minimum standard for acceptable Cpks is now 2.
Figure 12: Impact of Cpk per feature on Part Right First Time & Parts per Million (PPM)
Calculate Cpk
• Cpk =
min (X – LSL, USL – X) 3 3
• By centering the process without reducing variability, Cpk could be improved to a maximum of 1.33 (Cp)
• Further improvements require reduction in process variability
• The goal is Cpk >_ 2
LSL = 48 USL = 60
X = 57_
Above Specification
Below Specification
StandardDeviation = 1.5
CompressorBlade
50 features
Cpk = 1.33
Cpk = 1.67
Cpk = 2
Turbine Disk500 features
HP / IP1000 features
Creating Effective Process FMEAs
P a g e | 22 of 83 1st Edition
Figure 10: Calculating Cpk for a Process
For complex products, with many features the impact of Cpk for each feature is high. Figure 11 shows how the Parts per Million (PPM) or Right First Time % (RFT%) is impacted by Cpks of 1.33, 1.67 and 2. In automotive industry the minimum standard for acceptable Cpks is now 2.
Figure 11: Impact of Cpk per feature on Part Right First Time & Parts per Million (PPM)
PPM = 310,500
PPM = 11,650
PPM = 170
PPM = 3,200,00
PPM = 116,500
PPM = 1700
PPM = 6,400,00
PPM = 233,000
PPM = 3400
69%
98%
99%
0%
88%
99%
0%
76%
99%
Creating Effective Process FMEAs & Contol Plans
22
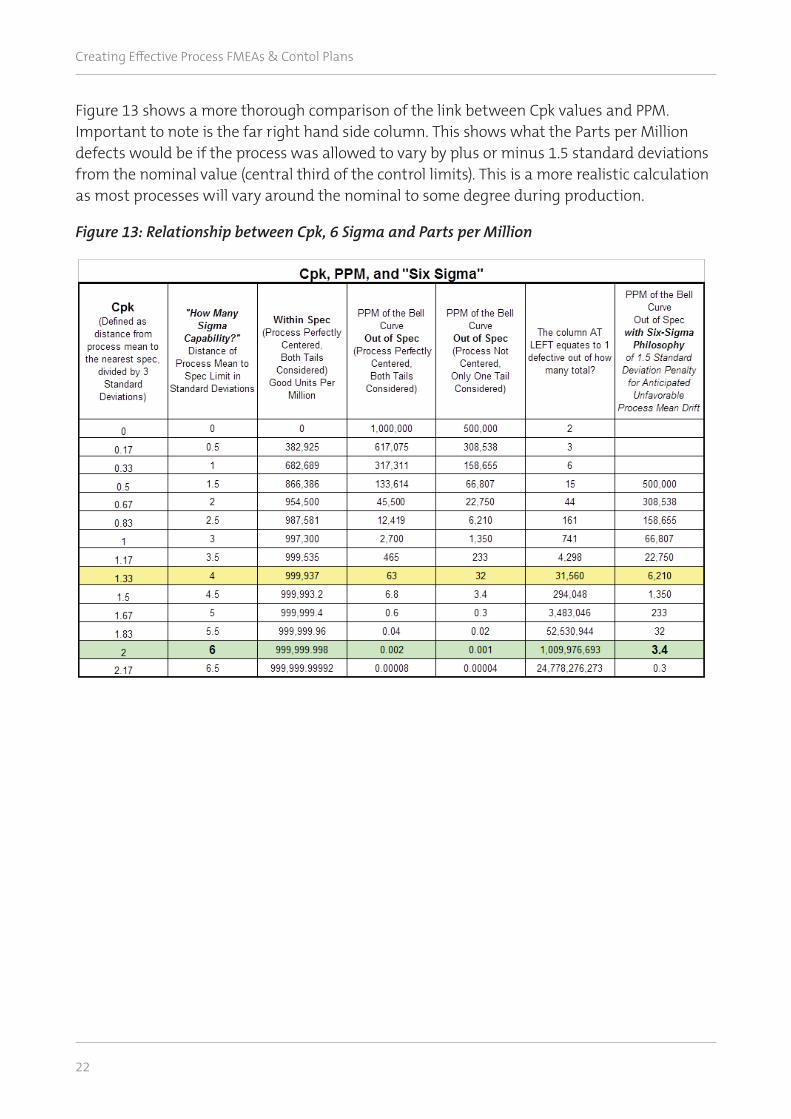
Figure 13 shows a more thorough comparison of the link between Cpk values and PPM. Important to note is the far right hand side column. This shows what the Parts per Million defects would be if the process was allowed to vary by plus or minus 1.5 standard deviations from the nominal value (central third of the control limits). This is a more realistic calculation as most processes will vary around the nominal to some degree during production.
Figure 13: Relationship between Cpk, 6 Sigma and Parts per Million
Creating Effective Process FMEAs
P a g e | 23 of 83 1st Edition
Figure 12 shows a more thorough comparison of the link between Cpk values and PPM. Important to note is the far right hand side column. This shows what the Parts per Million defects would be if the process was allowed to vary by plus or minus 1.5 standard deviations from the nominal value (central third of the control limits). This is a more realistic calculation as most processes will vary around the nominal to some degree during production.
Figure 12: Relationship between Cpk, 6 Sigma and Parts per Million

Creating Effective Process FMEAs & Contol Plans
23
Chapter TwoProcess FMEAs – Key Points & Care Points
Of all of the Defect Prevention tools available to us this is by far the most effective, if applied properly.
At a high level the purpose of the Process FMEA is to answer the question ‘what could go wrong in the process that could cause the product to fail to meet the design intent (specification)’.
Once the risks are identified improvement actions can be defined to eliminate or reduce the likelihood of occurrence of the potential cause and/or improve the ability to detect the non-conformance before it is shipped to the customer.
Cross Functional Team Approach
A Process FMEA is a highly detailed assessment and needs to be conducted by a cross functional team including Manufacturing Engineering, Operations, Quality, Design, Supplier(s) (if appropriate), Maintenance, as a minimum.
The team must have the right experience and knowledge of the product and process to add value to the PFMEA.
PFMEA Scope
For a Process FMEA to be effective it must evaluate ALL the features / characteristics on the design drawing and related specifications and consider every process step (where the product is transformed or has the potential to be transformed including inadvertently such as ‘damage due to storage & handling’.
A Process FMEA is required for every individual part number.
A common mistake to reduce the time taken to complete a PFMEA is to select only those features or process steps where it is believed that are important to the design. There are numerous examples where this ‘pre-selection’ of what is important has failed to take into account something that has gone on to have a significant impact to the customer.
The PFMEA is a tool that is supposed to evaluate all process steps and all product features in order to identify where the risks in the process are.
Creating Effective Process FMEAs & Contol Plans
24
Therefore if we do not consider all design features and process steps then the risk assessment will always be deficient.
This may appear to be a daunting task, particularly for those organisations that are new to PFMEA. However through the use of computer software and a structure of ‘Reference FMEAs’ the time taken to create a Process FMEA can be greatly reduced and still remain effective. This approach is described in Chapter’s Three and Four.
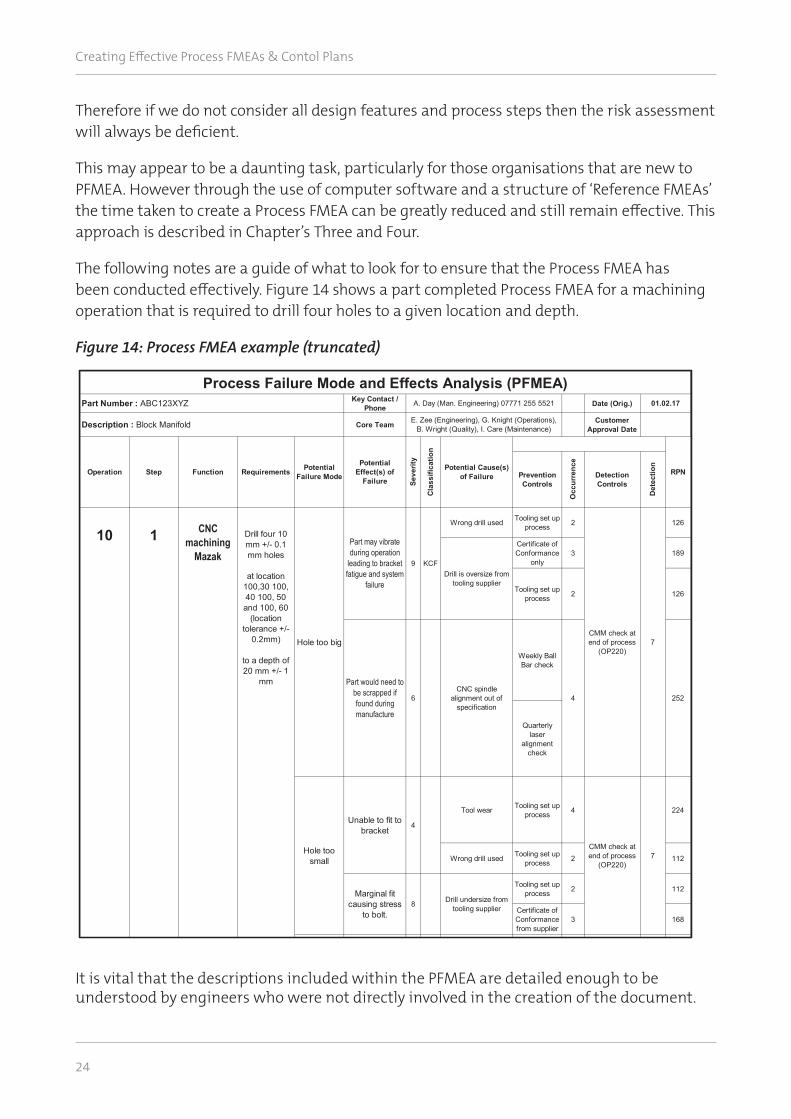
The following notes are a guide of what to look for to ensure that the Process FMEA has been conducted effectively. Figure 14 shows a part completed Process FMEA for a machining operation that is required to drill four holes to a given location and depth.
Figure 14: Process FMEA example (truncated)
It is vital that the descriptions included within the PFMEA are detailed enough to be understood by engineers who were not directly involved in the creation of the document.
Creating Effective Process FMEAs
P a g e | 26 of 83 1st Edition
Therefore if we do not consider all design features and process steps then the risk assessment will always be deficient.
This may appear to be a daunting task, particularly for those organisations that are new to PFMEA. However through the use of computer software and a structure of ‘Reference FMEAs’ the time taken to create a Process FMEA can be greatly reduced and still remain effective. This approach is described in Chapter’s Three and Four.
The following notes are a guide of what to look for to ensure that the Process FMEA has been conducted effectively. Figure 13 shows a part completed Process FMEA for a machining operation that is required to drill four holes to a given location and depth.
Figure 13: Process FMEA example (truncated)
It is vital that the descriptions included within the PFMEA are detailed enough to be understood by engineers who were not directly involved in the creation
Key Contact / Phone Date (Orig.)
Core Team Customer Approval Date
PreventionControls
Occ
urre
nce
DetectionControls
Det
ectio
n
Wrong drill used Tooling set up process 2 126
Certificate of Conformance
only3 189
Tooling set up process 2 126
Weekly Ball Bar check
Quarterly laser
alignment check
Tool wear Tooling set up process 4 224
Wrong drill used Tooling set up process 2 112
Tooling set up process 2 112
Certificate of Conformance from supplier
3 168
Drill undersize from tooling supplier
252
Hole too small
Unable to fit to bracket
4
CMM check at end of process
(OP220)7
Marginal fit causing stress
to bolt.8
KCF
CMM check at end of process
(OP220)7
Drill is oversize from tooling supplier
Part would need to be scrapped if found during manufacture
6CNC spindle
alignment out of specification
4
10 1 CNC machining
Mazak
Drill four 10 mm +/- 0.1 mm holes
at location 100,30 100, 40 100, 50 and 100, 60
(location tolerance +/-
0.2mm)
to a depth of 20 mm +/- 1
mm
Hole too big
Part may vibrate during operation
leading to bracket fatigue and system
failure
9
Seve
rity
Cla
ssifi
catio
n
Potential Cause(s) of Failure RPNOperation Step Function Requirements Potential
Failure Mode
Potential Effect(s) of
Failure
Process Failure Mode and Effects Analysis (PFMEA)Part Number : ABC123XYZ A. Day (Man. Engineering) 07771 255 5521 01.02.17
Description : Block Manifold E. Zee (Engineering), G. Knight (Operations), B. Wright (Quality), I. Care (Maintenance)

Creating Effective Process FMEAs & Contol Plans
25
These documents will be in use for many years and it is important that they can be reviewed by teams in the future that understand the intent of what has been written.
The precision of the use of language in a PFMEA are paramount.
How to complete a Process FMEA using the AS13004 PFMEA template:
a) Part Number & Description
The requirement is to include the full Part Number and a brief description of the part. The description should include the Model / Engine Name e.g. Trent 1000 and a brief name of the part e.g. Fan Blade, HP Compressor Blade, etc.
The Process FMEA should be specific to an individual part number or assembly. Rarely will it be appropriate for a single Process FMEA to cover more than one part number / assembly. Non part number specific PFMEAs should be discouraged.
Some reasons often cited for the use of PFMEAs that are not part specific are;
Generic Processes
It is often thought that processes such as Heat Treatment or Cleaning are exempt from the specific Part Number approach of a PFMEA.
In reality there are very few examples where the impact of the process is not part specific and therefore it is recommended that these processes are considered in the same way as a machining process and unique to each part number that goes through it.
Just as with other processes such as machining, the consequences of a process failure are likely to be specific to the part number specific application.
Part Families
It is often proposed that many parts can be included as a ‘part family’ approach to a Process FMEA. This will work if the part is identical with the same functional requirements, same consequences of failure, operating in the same conditions, with the same features, same specification tolerances, etc. Otherwise it is not closely related enough to simply read across.
Part families are normally defined (in the automotive industry) as a part that is exactly the same as another except for some additional features.

Creating Effective Process FMEAs & Contol Plans
26
For example a Cylinder Head used on a V8 5V engine is also used on a high powered derivative. In the derivative the cylinder bores are honed to a tighter specification but all other features remain the same. This is an example where the Family of Parts approach can be taken and the additional PFMEA analysis needs only to be completed for the modified cylinder bores.
In this example due to the tighter tolerancing we would expect to see higher Occurrence scores.
There are some applications where FMEAs can be used in ‘non-part specific’ applications. For example there are Machinery FMEAs that help with the design of process equipment or fixtures. Some Service Sector businesses use an FMEA approach to help them design transactional processes. These approaches are out of scope for this Guidance document.

Creating Effective Process FMEAs & Contol Plans
27
b) Core Team
The requirement is to list the core team members and their positions that were responsible for the original document. We should remember that this document will be regularly updated for the life of the part and therefore the team members will change over time.
It is important that the team is comprised of the right resources to be able to identify and assess potential product Failure Modes and Potential Process Causes. As a minimum it would be expected to include Manufacturing Engineering, Design Engineering, Operations, Quality and Maintenance.
It may also be appropriate for a Customer and/or a relevant Supplier representative to be involved at certain stages of compilation or review to capture their insights.
Not all members of the team need to be present for all stages of creating the FMEA as their input may be limited to specific aspects e.g. The Design Engineer has input into the effect and severity of the identified Product Failure Modes but may not have knowledge of the process to add any real value.
When compiling Reference PFMEAs a small core team should be assembled of 3 – 4 people with the correct knowledge of the part and process being considered.
Too many team members will only serve to slow the process down and will have little added value.
Figure 15: Team Size Effectiveness
Once completed, the Reference PFMEA and the Part Specific PFMEA can be circulated to a wider group for additional input and sanity checking.
0 1 2 3 4 5 6 7 8 9 10
Team Size
100
90
80
70
60
50
40
30
20
10
0
Effec
tive
ness
%s

Creating Effective Process FMEAs & Contol Plans
28
c) Original date / Revision date
The Process FMEA will be a live document and as such revision control is vital to provide a traceable history of updates etc.
Revisions to a Process FMEA will be expected if any of the following occur;
• Product definition changes
• Process changes (including inspection processes)
• Updates from 8D investigations / Continuous Improvement actions
• Quality Performance data that may influence the RPN scores

Creating Effective Process FMEAs & Contol Plans
29
d) Operation / Step
The Process FMEA must include all process steps where the product is transformed even where the transformation may be inadvertent, such as during handling and storage. The Process FMEA must include all steps from the first operation through to dispatch. Care must be taken not to fall into the trap of only completing the PFMEA on processes that are seen to be ‘important’.
The Process Steps should be defined on a Process Flow Diagram that shows the sequence of operations and the purpose (required outcomes) of each operation. A Characteristics Matrix should define the features that are created and inspected at each operation.
Some common mistakes observed are;
• Transactional processes are included e.g. complete batch card, load CNC program. These in themselves are not relevant to the Process FMEA although they may appear as a Potential Cause of a failure if a link can be made.
• Similarly, processes such as ‘Load Tools into CNC’ similarly do not belong in a PFMEA as a process step. There can be no product Failure Modes created at this process step as it is not used to ‘transform the product’.
• If the loading of tools has any impact on product quality then this will be recorded as a ‘Potential Cause’ of a defined ‘Failure Mode’ in the PFMEA in a later process step.
• Measurement processes are included as a process step and seen as the cause of dimensional non-conformance. It should be remembered that the Measurement System is considered at each process step as part of ‘Detection Method’ and does not need to be considered independently.
The only relevant consideration is if the part can be damaged during the act of measurement through handling or storage.
Creating Effective Process FMEAs & Contol Plans
30
e) Process Function / Requirement
For each Operation the function (purpose) and the required outcome (Requirement) should be defined.
This must be written in enough detail so that the Potential Failure Mode (next column) can be derived straight from the description.
For example, if the purpose at this step (or one of its purposes) is to drill a hole 10mm +/- 0.2 mm, then the potential ways in which we could fail to achieve this is simply ‘Hole too Big’ i.e. above 10.20mm or ‘Hole too Small’, i.e. less than 9.80 mm.
In an assembly operation the requirement may be to fit a seal, in the correct orientation, without damage or contamination to the sealing faces. The potential failure modes would then be (a) incorrect orientation, (b) surface damaged and (c) surface contaminated.
At this step it is important to identify all of the requirements that help to define a feature as conforming or non-conforming.
For example many features will have a general specification associated to it that is not necessarily apparent on first glance. A drilled hole feature will have geometric tolerances but also may be subject to an Engineering Specification that specifies ‘no white layer’ or similar. All requirements whether on the drawing or written in a related specification must be included.
Dealing with Manufacturing Tolerances
The PFMEA must include Manufacturing Tolerances that are used to manufacture of the part. Ideally these Manufacturing Tolerances will be identified in some way within the PFMEA to make it clear what is an Engineering requirement and what is a Manufacturing one (e.g. a designated symbol in the characteristics column or other means).
Manufacturing tolerances can also refer to processes required for a successful manufacturing step. For example a cleaning operation may be included prior to welding to ensure there is no contamination that could cause porosity. Although this may not be specified in the drawing or specifications there is an internal requirement to ensure the part is clean prior to welding. Therefore at the cleaning operation it is allowable to include ‘clean part’ as a process requirement (the cleaning process may also be referenced as a potential cause of ‘porosity defects’ when evaluating the welding process).

Creating Effective Process FMEAs & Contol Plans
31
Figure 16: Process Function and link to Potential Failure Modes in a PFMEA
In this example we can see that the Potential Failure Mode is a logical step from the way in which the requirement was described.
This is particularly important for assembly operations where the level of detail required may not be so obvious.
For example when fitting two parts together the characteristics of success are not so explicit on the drawing or design notes. Therefore the Process FMEA (and later the Process Instructions) must provide the detail required. For example;
‘Fit Part A to Part B in the correct orientation without causing any damage to surface ‘D’ and fix with a single threaded bolt and nut to a torque value of 100N +/- 2 N and an angle of 360 degrees’.
Creating Effective Process FMEAs
P a g e | 34 of 83 1st Edition
Figure 15: Process Function and link to Potential Failure Modes in a PFMEA
In this example we can see that the Potential Failure Mode is a logical step from the way in which the requirement was described.
This is particularly important for assembly operations where the level of detail required may not be so obvious.
For example when fitting two parts together the characteristics of success are not so explicit on the drawing or design notes. Therefore the Process FMEA (and later the Process Instructions) must provide the detail required. For example;
‘Fit Part A to Part B in the correct orientation without causing any damage to surface ‘D’ and fix with a single threaded bolt and nut to a torque value of 100N +/- 2 N and an angle of 360 degrees’.
Key Contact / Phone Date (Orig.)
Core Team Customer Approval Date
PreventionControls
Occ
urre
nce
DetectionControls
Det
ectio
n
Wrong drill used Tooling set up process 2 126
Certificate of Conformance
only3 189
Tooling set up process 2 126
Weekly Ball Bar check
Quarterly laser
alignment check
Tool wear Tooling set up process 4 224
Wrong drill used Tooling set up process 2 112
Tooling set up process 2 112
Certificate of Conformance from supplier
3 168
Drill undersize from tooling supplier
252
Hole too small
Unable to fit to bracket
4
CMM check at end of process
(OP220)7
Marginal fit causing stress
to bolt.8
KCF
CMM check at end of process
(OP220)7
Drill is oversize from tooling supplier
Part would need to be scrapped if found during manufacture
6CNC spindle
alignment out of specification
4
10 1 CNC machining
Mazak
Drill four 10 mm +/-
0.1 mm holes
at location 100,30 100, 40 100, 50 and 100, 60
(location tolerance +/-
0.2mm)
to a depth of 20 mm +/- 1
mm
Hole too big
Part may vibrate during operation
leading to bracket fatigue and system
failure
9
Seve
rity
Cla
ssifi
catio
n
Potential Cause(s) of Failure RPNOperation Step Function Requirements Potential
Failure Mode
Potential Effect(s) of
Failure
Process Failure Mode and Effects Analysis (PFMEA)Part Number : ABC123XYZ A. Day (Man. Engineering) 07771 255 5521 01.02.17
Description : Block Manifold E. Zee (Engineering), G. Knight (Operations), B. Wright (Quality), I. Care (Maintenance)
Creating Effective Process FMEAs & Contol Plans
32
Hence from this description the following Failure Modes could be derived;
• Incorrect orientation
• Damage to surface D
• Torque too high
• Torque too low
• No torque
• Bolt not fitted
• Angle not achieved
We must take care not to infer requirements that are not there. There are examples where the requirement was for a drilled hole at 10mm +/- 0.2 mm and the team went on to list other Failure Modes such as ‘hole not round’. Unless there is a specific roundness specification called out on the drawing then this is not relevant and should not be included.
There may also be some general drawing specification requirements that need to be considered at certain operations. These include such things as;
• No Damage / Damage not to exceed specified limits
• No Sharp edges / burrs
• No Foreign Object Debris (FOD) / No FOD above specified limits
If appropriate to the operation these should be considered as additional requirements of the operation and hence will have associated Potential Failure Modes.
Creating Effective Process FMEAs & Contol Plans
33
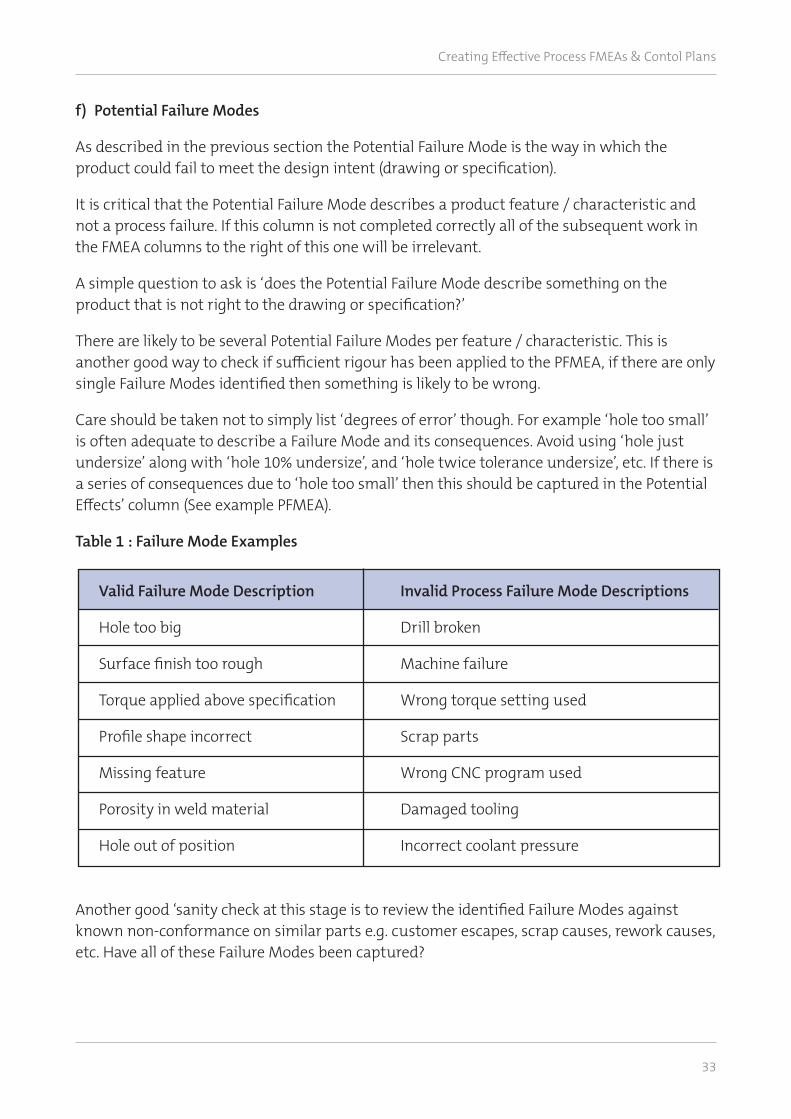
f) Potential Failure Modes
As described in the previous section the Potential Failure Mode is the way in which the product could fail to meet the design intent (drawing or specification).
It is critical that the Potential Failure Mode describes a product feature / characteristic and not a process failure. If this column is not completed correctly all of the subsequent work in the FMEA columns to the right of this one will be irrelevant.
A simple question to ask is ‘does the Potential Failure Mode describe something on the product that is not right to the drawing or specification?’
There are likely to be several Potential Failure Modes per feature / characteristic. This is another good way to check if sufficient rigour has been applied to the PFMEA, if there are only single Failure Modes identified then something is likely to be wrong.
Care should be taken not to simply list ‘degrees of error’ though. For example ‘hole too small’ is often adequate to describe a Failure Mode and its consequences. Avoid using ‘hole just undersize’ along with ‘hole 10% undersize’, and ‘hole twice tolerance undersize’, etc. If there is a series of consequences due to ‘hole too small’ then this should be captured in the Potential Effects’ column (See example PFMEA).
Table 1 : Failure Mode Examples
Another good ‘sanity check at this stage is to review the identified Failure Modes against known non-conformance on similar parts e.g. customer escapes, scrap causes, rework causes, etc. Have all of these Failure Modes been captured?
Valid Failure Mode Description Invalid Process Failure Mode Descriptions
Hole too big Drill broken
Surface finish too rough Machine failure
Torque applied above specification Wrong torque setting used
Profile shape incorrect Scrap parts
Missing feature Wrong CNC program used
Porosity in weld material Damaged tooling
Hole out of position Incorrect coolant pressure

Creating Effective Process FMEAs & Contol Plans
34
g) Potential Effect of Failure
This is a key point where the link to the Design FMEA and Design Engineering has an important role to play.
Every feature will have a design purpose, otherwise why would it be there?
Therefore if the feature was not present or was nonconforming we must understand the impact that will have on the final product (as seen by the customer or end user) as well as the impact on the manufacturing plant / business.
This is one of the factors that help to explain why ‘process based (generic) PFMEAs’ as opposed to ‘product focused PFMEAs’ are not effective. In a process based PFMEA the risk would be assumed to be equal for all holes drilled during that operation and hence scored identically. The different purposes of each hole means that the effect and hence the impact for each hole may be different. This would not be identified unless the PFMEA focuses on the Product Features.
Using the process based PFMEAs also means that the link to the Design FMEA is irrelevant.
All relevant effects should be listed for each Potential Failure Mode. We would expect to see multiple effects for most potential Failure Modes (another good check to make).
The most important effects to highlight are those that will be experienced by the customer or end user, particularly if there are safety implications.
Internal effects can also be listed e.g. scrap, rework and for certain product Failure Modes where there may be a significant safety impact to the operator, these should be included too (see Severity Scoring guidelines).
Providing the Right Level of Detail for the Potential Effects Description
When describing the Potential Effects of Failure it will be important to understand the conditions that need to be present for the Effect to be realised. E.g. If a dimensional defect may have a range of potential effects depending upon the scale of the non-conformance. This means that the defect may sometimes be cleared on a concession, reworked or scrapped. But to say this is not enough, we need to explain when it is ok to concess it or scrap it.
So for this type of Failure Mode we would expect to see three types of effect description;
1. If the defect is oversize then it may be possible to rework the dimension and bring it inside the specified tolerance
2. If the dimension is marginally out of the bottom of tolerance and therefore cannot be reworked then Design may be able to grant a concession.to allow the product to proceed
3. If the part cannot be reworked or concessed then the part will be rejected (scrapped)
Creating Effective Process FMEAs & Contol Plans
35
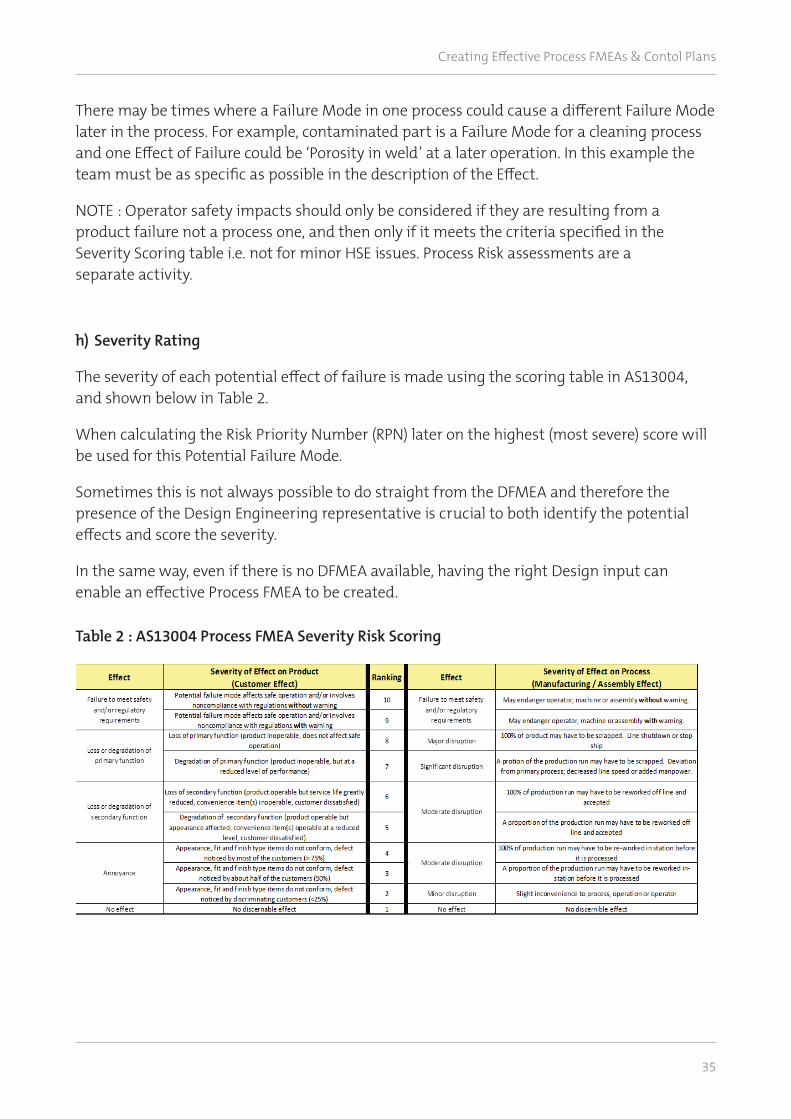
h) Severity Rating
The severity of each potential effect of failure is made using the scoring table in AS13004, and shown below in Table 2.
When calculating the Risk Priority Number (RPN) later on the highest (most severe) score will be used for this Potential Failure Mode.
Sometimes this is not always possible to do straight from the DFMEA and therefore the presence of the Design Engineering representative is crucial to both identify the potential effects and score the severity.
In the same way, even if there is no DFMEA available, having the right Design input can enable an effective Process FMEA to be created.
Table 2 : AS13004 Process FMEA Severity Risk Scoring
There may be times where a Failure Mode in one process could cause a different Failure Mode later in the process. For example, contaminated part is a Failure Mode for a cleaning process and one Effect of Failure could be ‘Porosity in weld’ at a later operation. In this example the team must be as specific as possible in the description of the Effect.
NOTE : Operator safety impacts should only be considered if they are resulting from a product failure not a process one, and then only if it meets the criteria specified in the Severity Scoring table i.e. not for minor HSE issues. Process Risk assessments are a separate activity.
Creating Effective Process FMEAs
P a g e | 39 of 83 1st Edition
h) Severity Rating
The severity of each potential effect of failure is made using the scoring table in AS13004, and shown below in Table 2.
When calculating the Risk Priority Number (RPN) later on the highest (most severe) score will be used for this Potential Failure Mode.
Sometimes this is not always possible to do straight from the DFMEA and therefore the presence of the Design Engineering representative is crucial to both identify the potential effects and score the severity.
In the same way, even if there is no DFMEA available, having the right Design input can enable an effective Process FMEA to be created.
Table 2 : AS13004 Process FMEA Severity Risk Scoring

Creating Effective Process FMEAs & Contol Plans
36
i) Potential Cause(s) of the Failure Mode
In this section we are looking to identify the things in the manufacturing / assembly process that could cause the Potential Failure Mode to exist. This is the reason it is referred to as a Process Failure Mode & Effects Analysis i.e. we are looking for the Process Risks of producing product non-conformance.
We would expect to see multiple Potential Causes per Failure Mode if done properly.
Figure 17: Potential Causes of Failure in a PFMEA
The key success factor here is to produce a list of Potential Causes that are ‘controllable’ in other words where there is a direct ‘cause and effect’. Good examples are ‘incorrect drill used ‘oversize’’ or ‘spindle alignment not true’. In other words if these things were to happen then the outcome would almost certainly result in non-conforming product. These examples allow us to take a specific action to control them.
Creating Effective Process FMEAs
P a g e | 40 of 83 1st Edition
i) Potential Cause(s) of the Failure Mode
In this section we are looking to identify the things in the manufacturing / assembly process that could cause the Potential Failure Mode to exist. This is the reason it is referred to as a Process Failure Mode & Effects Analysis i.e. we are looking for the Process Risks of producing product non-conformance.
We would expect to see multiple Potential Causes per Failure Mode if done properly.
Figure 16: Potential Causes of Failure in a PFMEA
The key success factor here is to produce a list of Potential Causes that are ‘controllable’ in other words where there is a direct ‘cause and effect’. Good examples are ‘incorrect drill used ‘oversize’’ or ‘spindle alignment not true’. In other words if these things were to happen then the outcome would almost
Key Contact / Phone Date (Orig.)
Core Team Customer Approval Date
PreventionControls
Occ
urre
nce
DetectionControls
Det
ectio
n
Wrong drill used Tooling set up process 2 126
Certificate of Conformance
only3 189
Tooling set up process 2 126
Weekly Ball Bar check
Quarterly laser
alignment check
Tool wear Tooling set up process 4 224
Wrong drill used Tooling set up process 2 112
Tooling set up process 2 112
Certificate of Conformance from supplier
3 168
Drill undersize from tooling
supplier
252
Hole too small
Unable to fit to bracket
4
CMM check at end of process
(OP220)7
Marginal fit causing stress
to bolt.8
KCF
CMM check at end of process
(OP220)7
Drill is oversize from tooling
supplier
Part would need to be scrapped if found during manufacture
6CNC spindle
alignment out of specification
4
10 1 CNC machining
Mazak
Drill four 10 mm +/- 0.1 mm holes
at location 100,30 100, 40 100, 50 and 100, 60
(location tolerance +/-
0.2mm)
to a depth of 20 mm +/- 1
mm
Hole too big
Part may vibrate during operation
leading to bracket fatigue and system
failure
9
Seve
rity
Cla
ssifi
catio
nPotential
Cause(s) of Failure
RPNOperation Step Function Requirements Potential Failure Mode
Potential Effect(s) of
Failure
Process Failure Mode and Effects Analysis (PFMEA)Part Number : ABC123XYZ A. Day (Man. Engineering) 07771 255 5521 01.02.17
Description : Block Manifold E. Zee (Engineering), G. Knight (Operations), B. Wright (Quality), I. Care (Maintenance)
Creating Effective Process FMEAs & Contol Plans
37
Common problems here are where the team has identified a long list of Potential Causes that are quite ‘tenuous’. For example ‘operator incorrectly follows procedure’, ‘maintenance error’. These descriptions are of no value in creating an effective Process FMEA and the required actions will be difficult to define.
The team should assume that the incoming parts / materials are correct. The team may make exceptions to this but only where the historical data suggests that this is a known problem.
Dangers of too much detail!
However we should also avoid going into unnecessary detail too.
In an example where the location of a weld could be misplaced the team identified that one of the Potential Causes could be that the part was incorrectly located in the fixture. This is true.
The team went on to list all of the reasons why the part may be incorrectly loaded in the fixture e.g. operator error, fixture worn, fixture damaged, etc. This additional detail adds no further value to the PFMEA than ‘part incorrectly located in fixture’.
Great care must be taken to avoid unnecessary detail that will prevent us from ‘seeing the wood for the trees’.
Teams can often ‘over think’ this section of the PFMEA. The use of Fishbone diagrams to create long lists of Potential Causes by brainstorming ‘machine’, ‘method’, ‘environment’, ‘manpower’, ‘maintenance’, etc. is not usually required.
The knowledge of the process is usually well understood by the Manufacturing Engineer, Maintenance Engineer and Operator (for example). Using the logic from the PFMEA template it is more usual that a simple list can be created easily from this combined knowledge.
The list should be evaluated for opportunities to group similar causes together or to challenge if the potential cause is really linked to the Failure Mode.
Creating Effective Process FMEAs & Contol Plans
38
j) Prevention Controls
For each Potential Cause identified we now need to identify what controls we have in place (or not) to ensure that the Potential Cause cannot happen.
The best form of Prevention Control is Mistake proofing e.g. Fixtures that prevent the part being loaded incorrectly. For high severity features we must strive for this type of control.
There are some controls, whilst not mistake proofing, do offer some protection of preventing the potential cause from happening e.g. Calibration, Maintenance routines, etc.
For example : Using our PFMEA example we can see that one of the Potential Causes for ‘hole oversize’ is ‘spindle alignment out of specification’. In this case the business has recognised this issue and introduced a Maintenance Schedule to check for spindle alignment using two methods;
a) a weekly ball bar check completed by the operator and
b) a quarterly laser alignment check conducted by the Maintenance Team.
Provided that these two activities are done to schedule and any actions identified through the checking process are addressed then we would expect to see very few ‘oversize hole conditions’ caused by spindle alignment error.
Another example would be ‘tool oversize – wrong tool used’, it may be logical to include ‘checked by operator during set up’ but this can only be included if it is clearly demonstrated that the set up checks really would find this error e.g. one of the set up checks requires a bar code reading of the tool in each tool holder. If it is not specific and is just down to luck then it should not be included.
Unnacceptable Prevention Controls
Another example to be careful of is the use of ‘Operator Training’ as a Prevention Control. Is this really going to ‘prevent’ a potential cause from happening? The danger is that having put this comment in the box the team move on without really questioning ‘what better controls could we have’. If the only control was ‘Operator Training’ then we should be wary of its effectiveness and it may be better not to include it at all.
If there are no current Prevention Controls for this specific potential cause then be prepared to write ‘none’ in this column. It may be that addressing this gap will become one of the improvement actions.
CARE POINT : The controls we identify must be things that can genuinely ‘prevent’ the cause from happening not just ‘reduce the likelihood of occurrence’. They will be activities that stop the cause from happening not find it afterwards.
A common mistake is to list things in here that detect the Potential Cause rather than prevent it. For instance a tooling check at the end of the process to ensure that it is not broken is not a Prevention Control but a Detection Control.
Creating Effective Process FMEAs & Contol Plans
39
k) Occurrence Rating
The occurrence rating looks to evaluate the potential for the Potential Cause of Failure to occur. Again, as for the Severity Rating, this is done on a scale of 1 to 10 where 10 is ‘will happen nearly always’ and 1 is ‘will never / unlikely to happen’.
Each Potential Cause identified needs to be rated separately.
Typical data sources include: customer escapes, process capability performance data (Cp, Cpk), Parts per Million (PPM), warranty metrics, etc.
Important Care Point when scoring Occurrence Ratings
The ability to be able to rate the occurrence individual Potential Causes will depend upon the data captured by the company. In many cases this may not be available for individual causes and so there are a couple of options on how to score Occurrence.
1. Use the same score for each Potential Cause. i.e. if we know that ‘hole over size occurs at around 500 parts per million (1 in 2000), this would score a 4 in our Occurrence Rating table. We could use the same score for all of the identified Causes.
The downsize of this approach is that it overestimates the occurrence of this cause and treats them all the same, but if we have no better information it may be the easiest way to begin until further data is available.
If we have some experience of the main causes we can use our engineering judgement to share the score among each Cause.
For example, the three elements should add up to the same total (1 in 200) but our judgement may be that spindle alignment is most likely with wrong drill used or drill oversize being very remote (may not have ever noticed this before). We may allocate a score of 4 to ‘spindle alignment’ and a score of 2 or 3 to the other two Potential Causes.
As we can see this is not an exact science but we need to ensure that we do not ‘under call’ individual causes and therefore avoid taking any actions later.

Creating Effective Process FMEAs & Contol Plans
40
Table 3 : AS13004 Occurrence Rating Table for Process FMEA
Creating Effective Process FMEAs
P a g e | 44 of 83 1st Edition
Table 3 : AS13004 Occurrence Rating Table for Process FMEA

Creating Effective Process FMEAs & Contol Plans
41
l) Detection Controls
This is a description of all of the ways in which the Potential Failure Mode (and key Potential Causes) are checked or inspected for conformity throughout the process.
Typically it will take the form of in process checks by the operator, automated controls or mistake proofing, or formal inspection routines.
The team should document all of the applicable controls in place and score each one using the Detection Scoring Table.
As we know that each Potential Cause will have its own RPN value it is important to recognise that each Detection Control must therefore be aligned to each Potential Cause.
For example, if we inspect hole diameters using a co-ordinate measuring machine at the end of the line then this detection method would score 7 in our Detection Rating chart (see Table 4).
This score would be read across to all Potential Causes for against each Failure Mode identified for ‘Hole Drilling’.
If there are any other detection methods used for certain Potential Causes then these should be listed against that particular Potential Cause and scored appropriately. See ‘PFMEA RPN Scoring Worked Example’ for further details.
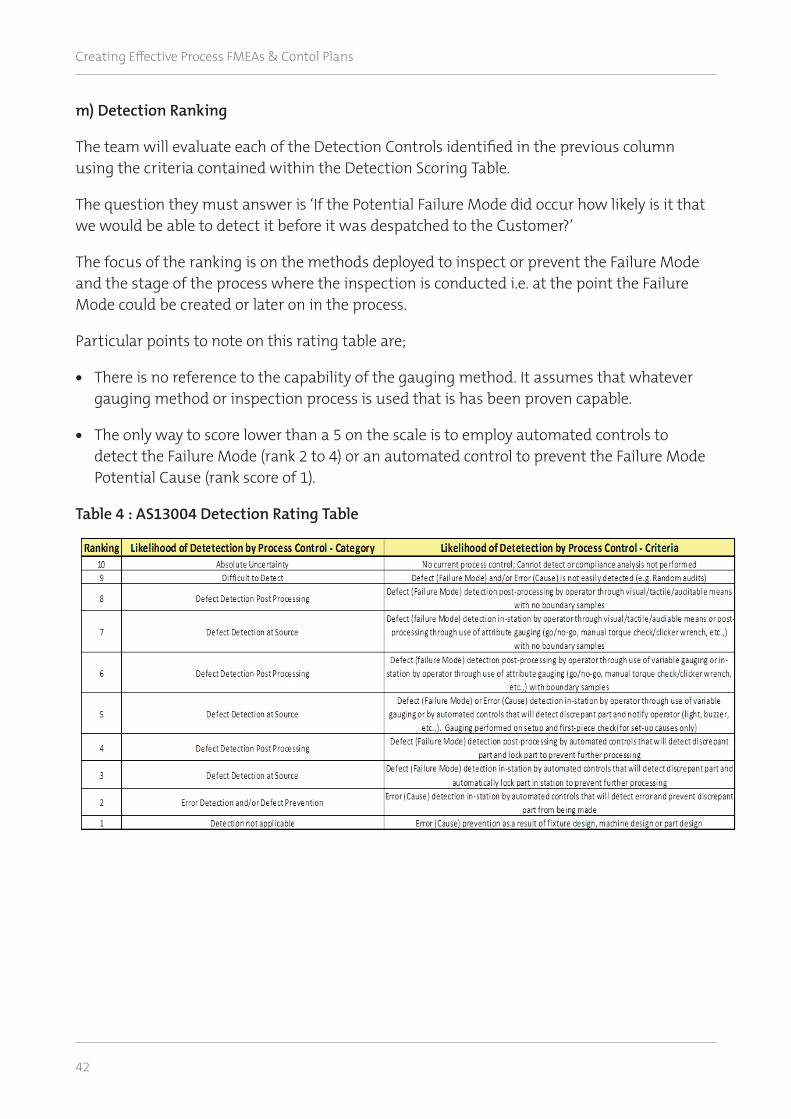
Creating Effective Process FMEAs & Contol Plans
42
m) Detection Ranking
The team will evaluate each of the Detection Controls identified in the previous column using the criteria contained within the Detection Scoring Table.
The question they must answer is ‘If the Potential Failure Mode did occur how likely is it that we would be able to detect it before it was despatched to the Customer?’
The focus of the ranking is on the methods deployed to inspect or prevent the Failure Mode and the stage of the process where the inspection is conducted i.e. at the point the Failure Mode could be created or later on in the process.
Particular points to note on this rating table are;
• There is no reference to the capability of the gauging method. It assumes that whatever gauging method or inspection process is used that is has been proven capable.
• The only way to score lower than a 5 on the scale is to employ automated controls to detect the Failure Mode (rank 2 to 4) or an automated control to prevent the Failure Mode Potential Cause (rank score of 1).
Table 4 : AS13004 Detection Rating Table
Creating Effective Process FMEAs
P a g e | 46 of 83 1st Edition
m) Detection Ranking
The team will evaluate each of the Detection Controls identified in the previous column using the criteria contained within the Detection Scoring Table.
The question they must answer is ‘If the Potential Failure Mode did occur how likely is it that we would be able to detect it before it was despatched to the Customer?’
The focus of the ranking is on the methods deployed to inspect or prevent the Failure Mode and the stage of the process where the inspection is conducted i.e. at the point the Failure Mode could be created or later on in the process.
Particular points to note on this rating table are;
• There is no reference to the capability of the gauging method. It assumes that whatever gauging method or inspection process is used that is has been proven capable.
• The only way to score lower than a 5 on the scale is to employ automated controls to detect the Failure Mode (rank 2 to 4) or an automated control to prevent the Failure Mode Potential Cause (rank score of 1).
Table 4 : AS13004 Detection Rating Table

Creating Effective Process FMEAs & Contol Plans
43
n) Risk Priority Score
The next stage of the Process FMEA is to calculate the Risk Priority Number (RPN) for each Potential Cause of a particular Failure Mode.
The calculation is quite simple.
Severity x Occurrence x Detection = RPN
The Severity Score we use is the highest ranked number for the Failure Mode, i.e. the worst that could happen.
The Occurrence Score for each Potential Failure Mode is used i.e. there will be an RPN score for every Potential Cause identified for a particular Failure Mode.
The Detection Score is the best (lowest) score identified. This means that, provided that all parts go through each inspection point, the most effective detection activity will catch the Potential Failure Mode before it is shipped to the customer.
Figure 18: RPN Scoring Example
Figure 18 shows that to calculate the RPN for the Failure Mode we select;
1. The HIGHEST Severity score, multiplied by,
2. EACH Potential Cause Occurrence Score, then multiply by
3. The LOWEST Detection score for each related to each Failure Mode and Potential Cause (if relevant).
FailureMode
PotentialCauses
PreventionControlsSe
veri
ty
Occ
urre
nce
Det
ecti
on
Effects RPNDetection
Control
1604 5
5
5
2
7
2
2
6
8
5
280
32
Creating Effective Process FMEAs & Contol Plans
44
Therefore there are three RPNs, one for every Potential Cause.
It can often be worth doing a quick sanity check by calculating the ‘overall RPN for a Failure Mode.
1. It is easy for us to identify the Severity Score for a particular Failure Mode so we should use that.
2. The Occurrence Score for an individual Cause can be quite difficult to get but the overall failure rate for the Failure Mode should be relatively easy so we can use that.
3. The Detection Score, especially that associated with Inspection, is also quite easy to get hold of so we can use that.
Calculating these three scores will give us an approximation of the Risk profile for that Failure Mode that we can then compare to our individual RPNs for each Potential Cause. We can then adjust the Occurrence Scoring if required for the individual scores if necessary.

Creating Effective Process FMEAs & Contol Plans
45
o) Improvement Actions
For all of the rigour of a Process FMEA, if done well, if we do not then react to the risk profile then it is of no value.
The key focus must be on those risks that scored high for severity, regardless of the other scores. What further action do we need to take to reduce the RPN of these items through, ideally, improving the prevention of the Failure Mode, or if not, improving the Detection of the Failure Mode.
Remember the only way to reduce the Severity score is usually to redesign the product.
High RPNs do need to be addressed. There is no set way of doing this. There is a judgement required. How much risk are you prepared to tolerate?
Some RPNs will ‘stand out’ using the pareto principle as being excessive and will clearly need to be improved.
Some companies use a RPN threshold value to select which RPNs they are going to improve. This can be dangerous as teams soon learn how to get a score that falls below the threshold value (it is not an exact science after all).
Another strategy is to look at the profile and see where the data suggests a ‘levelling out of RPNs’. The risks to the left of this point should be considered for improvement.
Remember the continual reduction of the overall risk should be our aim – this is an ongoing process that never stops.
Improvement actions should be documented in the PFMEA and once implemented and verified the RPN can be recalculated to measure the effect of the improvement action.

Creating Effective Process FMEAs & Contol Plans
46
Creating Effective Process FMEAs
P a g e | 50 of 83 1st Edition
Figure 18: RPN Improvement Actions in a PFMEA
Figure 19: RPN Improvement Actions in a PFMEA
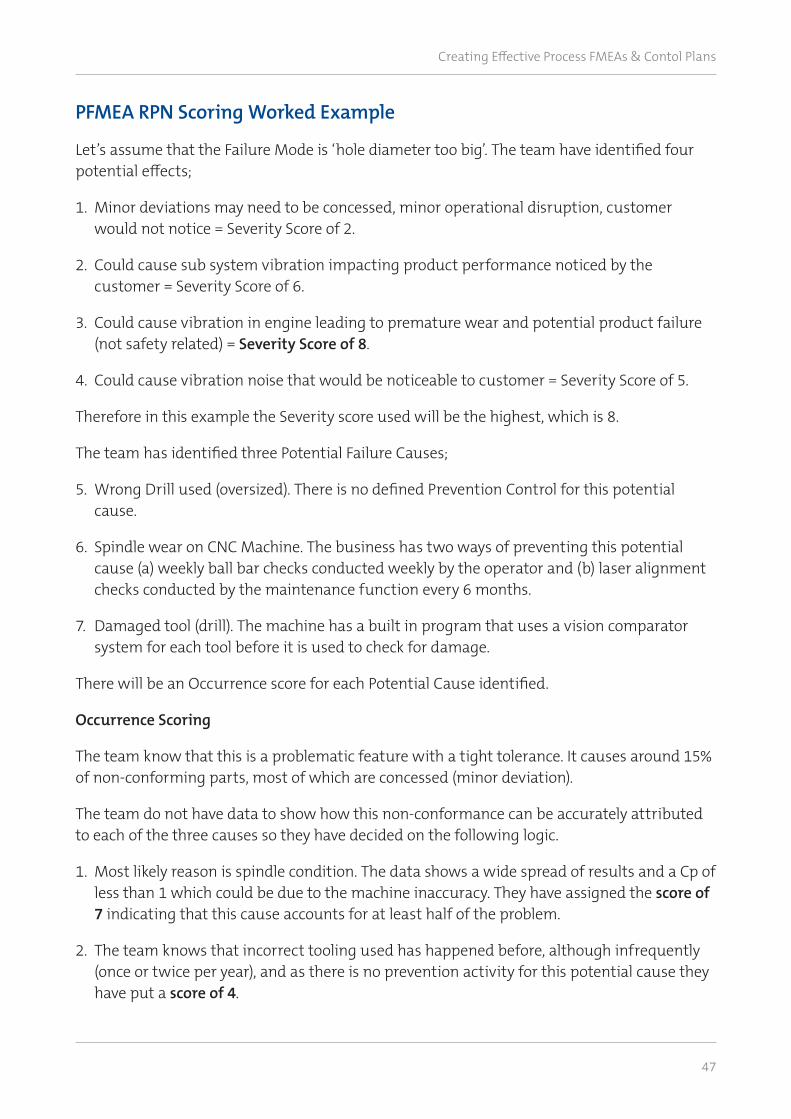
Creating Effective Process FMEAs & Contol Plans
47
PFMEA RPN Scoring Worked Example
Let’s assume that the Failure Mode is ‘hole diameter too big’. The team have identified four potential effects;
1. Minor deviations may need to be concessed, minor operational disruption, customer would not notice = Severity Score of 2.
2. Could cause sub system vibration impacting product performance noticed by the customer = Severity Score of 6.
3. Could cause vibration in engine leading to premature wear and potential product failure (not safety related) = Severity Score of 8.
4. Could cause vibration noise that would be noticeable to customer = Severity Score of 5.
Therefore in this example the Severity score used will be the highest, which is 8.
The team has identified three Potential Failure Causes;
5. Wrong Drill used (oversized). There is no defined Prevention Control for this potential cause.
6. Spindle wear on CNC Machine. The business has two ways of preventing this potential cause (a) weekly ball bar checks conducted weekly by the operator and (b) laser alignment checks conducted by the maintenance function every 6 months.
7. Damaged tool (drill). The machine has a built in program that uses a vision comparator system for each tool before it is used to check for damage.
There will be an Occurrence score for each Potential Cause identified.
Occurrence Scoring
The team know that this is a problematic feature with a tight tolerance. It causes around 15% of non-conforming parts, most of which are concessed (minor deviation).
The team do not have data to show how this non-conformance can be accurately attributed to each of the three causes so they have decided on the following logic.
1. Most likely reason is spindle condition. The data shows a wide spread of results and a Cp of less than 1 which could be due to the machine inaccuracy. They have assigned the score of 7 indicating that this cause accounts for at least half of the problem.
2. The team knows that incorrect tooling used has happened before, although infrequently (once or twice per year), and as there is no prevention activity for this potential cause they have put a score of 4.
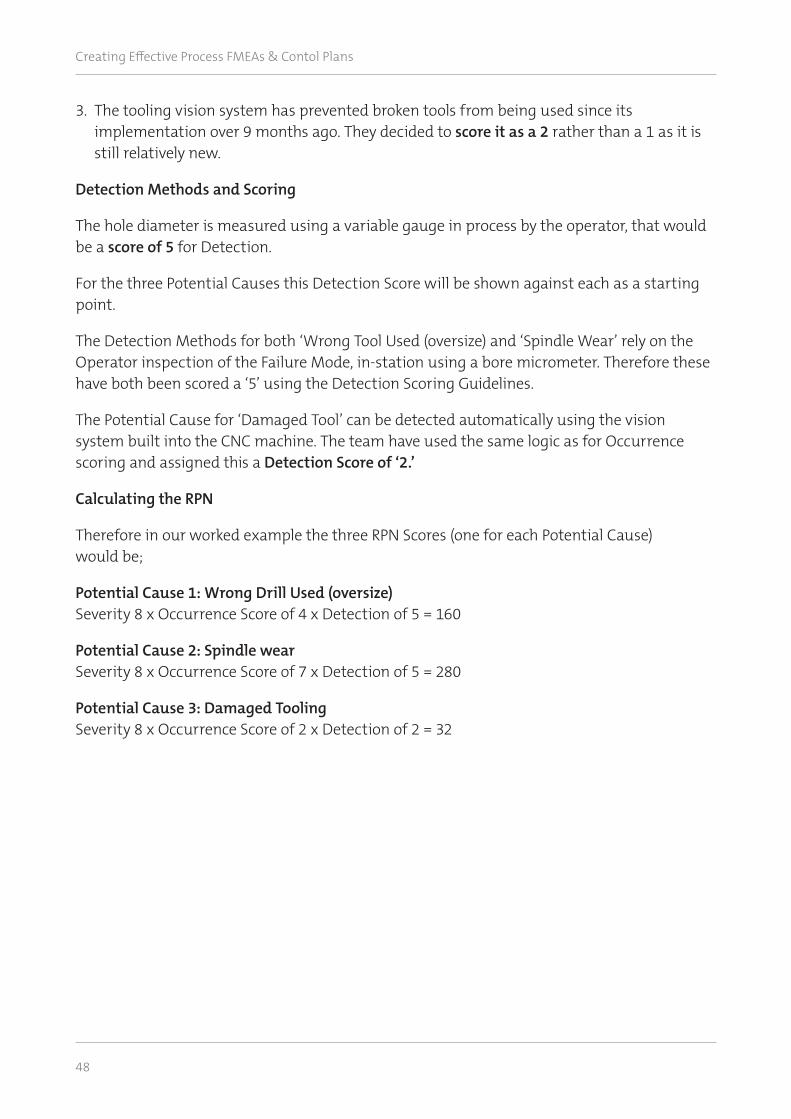
Creating Effective Process FMEAs & Contol Plans
48
3. The tooling vision system has prevented broken tools from being used since its implementation over 9 months ago. They decided to score it as a 2 rather than a 1 as it is still relatively new.
Detection Methods and Scoring
The hole diameter is measured using a variable gauge in process by the operator, that would be a score of 5 for Detection.
For the three Potential Causes this Detection Score will be shown against each as a starting point.
The Detection Methods for both ‘Wrong Tool Used (oversize) and ‘Spindle Wear’ rely on the Operator inspection of the Failure Mode, in-station using a bore micrometer. Therefore these have both been scored a ‘5’ using the Detection Scoring Guidelines.
The Potential Cause for ‘Damaged Tool’ can be detected automatically using the vision system built into the CNC machine. The team have used the same logic as for Occurrence scoring and assigned this a Detection Score of ‘2.’
Calculating the RPN
Therefore in our worked example the three RPN Scores (one for each Potential Cause) would be;
Potential Cause 1: Wrong Drill Used (oversize) Severity 8 x Occurrence Score of 4 x Detection of 5 = 160
Potential Cause 2: Spindle wear Severity 8 x Occurrence Score of 7 x Detection of 5 = 280
Potential Cause 3: Damaged Tooling Severity 8 x Occurrence Score of 2 x Detection of 2 = 32

Creating Effective Process FMEAs & Contol Plans
49
Why use the lowest Detection Score?
The selection of the lowest Detection Score rather than the highest can often cause some confusion. Think of it as if each Detection Control is like a filter paper of different grade (1 to 10). If you have three detection methods scored at 2, 6 and 8 then if the Failure Mode was to try to pass through them (in series) then the one scored at 2 would be the most effective and hence that is the score we would use. See Figure 20.
Figure 20: Detection Scoring Analogy
Once the RPNs for each Failure Mode and Potential Cause have been calculated they can be ranked in order of RPN Score (Pareto principle).
Being able to see the Risk profile of the complete process is useful for us to be able to identify those process steps with the highest risk however such as a simple analysis is not enough to determine what actions should be taken.
Detection Filters (scores)
Filter Size 8
Filter Size 6
Filter Size 2
Failure Modes

Creating Effective Process FMEAs & Contol Plans
50
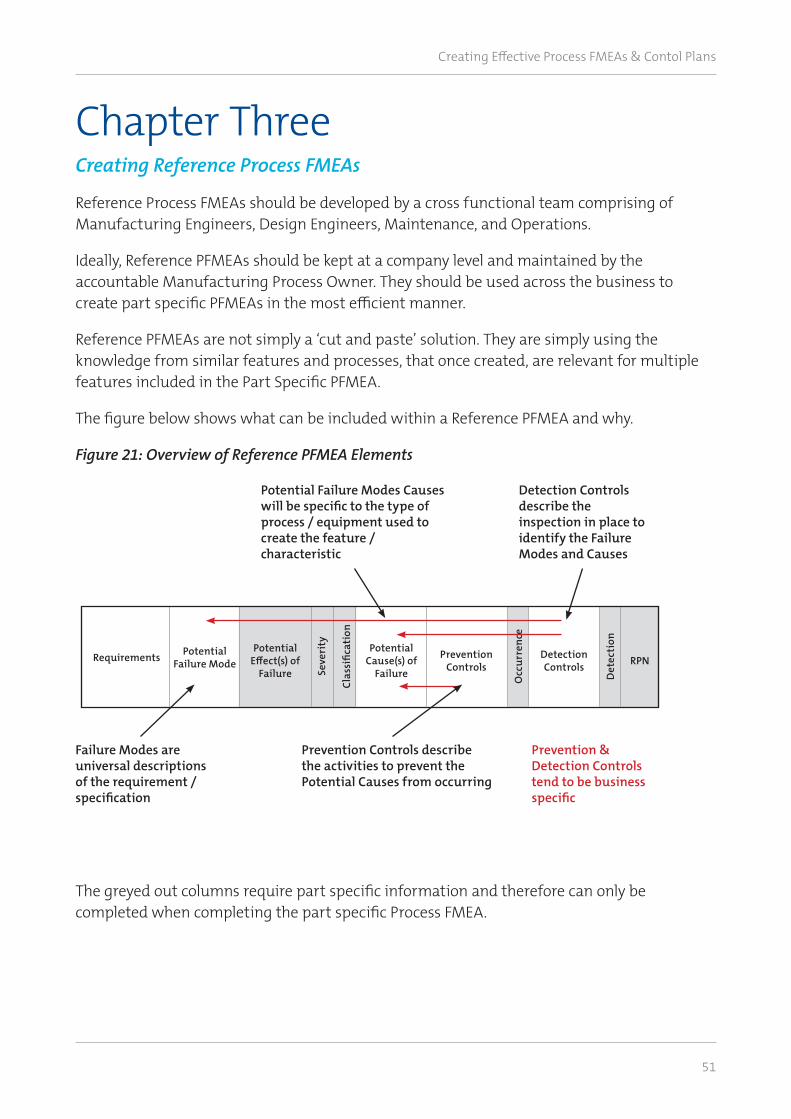
Creating Effective Process FMEAs & Contol Plans
51
Chapter Three Creating Reference Process FMEAs
Reference Process FMEAs should be developed by a cross functional team comprising of Manufacturing Engineers, Design Engineers, Maintenance, and Operations.
Ideally, Reference PFMEAs should be kept at a company level and maintained by the accountable Manufacturing Process Owner. They should be used across the business to create part specific PFMEAs in the most efficient manner.
Reference PFMEAs are not simply a ‘cut and paste’ solution. They are simply using the knowledge from similar features and processes, that once created, are relevant for multiple features included in the Part Specific PFMEA.
The figure below shows what can be included within a Reference PFMEA and why.
Figure 21: Overview of Reference PFMEA Elements
The greyed out columns require part specific information and therefore can only be completed when completing the part specific Process FMEA.
Potential Failure Modes Causeswill be specific to the type ofprocess / equipment used tocreate the feature /characteristic
Detection Controlsdescribe the inspection in place to identify the Failure Modes and Causes
Failure Modes areuniversal descriptionsof the requirement /specification
Prevention &Detection Controls tend to be businessspecific
Prevention Controls describethe activities to prevent thePotential Causes from occurring
Requirements PotentialFailure Mode
PotentialEffect(s) of
Failure
PotentialCause(s) of
Failure
PreventionControls
DetectionControls RPN
Seve
rity
Clas
sific
atio
n
Occ
urre
nce
Det
ecti
on
Creating Effective Process FMEAs & Contol Plans
52
STEP 1: Select the Process for Evaluation
A reference Process FMEA will be specific to a process type e.g. CNC machining, Electron Beam Welding, Torque Fastening, Grit blasting, etc.
The team must first select the process type for evaluation. Some processes will have several sub process types. For example CNC machining may have sub process types of;
• Turning• Grinding• Milling• Drilling
The team would focus on one of these elements to create a Reference PFMEA.
The Reference PFMEA may also be equipment specific. Some CNC machines will be constructed in a unique way and therefore the Potential Causes of Failure may be unique to that equipment type. The Team will need to decide if the best approach is to create a universal Reference PFMEA or to allow derivative to be developed also.
Step 2: Define the typical Features and Characteristics of the Process being evaluated
Each Process Type will have the potential to create certain features and characteristics. The team should list these out for the process / sub-process under evaluation. A typical characteristics matrix or Assembly Instruction for the process may help to identify features / characteristics. The team also need to refer to typical drawings and related engineering specifications.
For example a drilling process on a CNC machine will create the following features / characteristics;
• Hole position• Hole diameter• Hole depth• Hole roundness• Surface Finish• No White layer
An E-Beam Welding process will create the following features / characteristics;
• Weld position• Weld length• Weld width• Weld porosity within limits• Weld with ‘splatter’ within limits

Creating Effective Process FMEAs & Contol Plans
53
The Reference PFMEA should be structured in such a way that the team can select specific features from the process / sub-process to be used in the creation of a Part Specific PFMEA.
Define all Features / Characteristics before moving onto the next step.
Step 3: Define Typical Failure Modes for each Characteristic
Design Features and Characteristics will have a universal and finite number of Potential Failure Modes associated with them, irrespective of how they are produced. The team can brainstorm these as a start to helping define the Reference FMEA database.
Examples are shown in Table 5 (see also Appendix B).
Table 5: Example Failure Modes
Creating Effective Process FMEAs
P a g e | 57 of 83 1st Edition
• Weld width • Weld porosity within limits • Weld with ‘splatter’ within limits
The Reference PFMEA should be structured in such a way that the team can select specific features from the process / sub-process to be used in the creation of a Part Specific PFMEA.
Step 3: Define Typical Failure Modes for each Characteristic
Design Features and Characteristics will have a universal and finite number of Potential Failure Modes associated with them, irrespective of how they are produced. The team can brainstorm these as a start to helping define the Reference FMEA database.
Examples are shown in Table 5 (see also Appendix B).
Table 5: Example Failure Modes
Characteristic Failure Mode(s)
Length Too Long
Too Short
Diameter Too Big
Too Small
Radius Too Big
Too Small
Location Incorrect Location
Surface Finish Too rough
Too smooth
Profile Shape Incorrect Profile
Roundness Out of Round
No scratches / blemishes Scratches / Blemishes
No pitting Pitting
Creating Effective Process FMEAs & Contol Plans
54
For each of the Features and Characteristics listed in ‘Step 2’ the team must now define the relevant Potential Failure Modes.
In addition there may be universal Potential Failure Modes on the Drawing or related Specifications that the team should also consider e.g. Damage, FOD, Surface Finish requirements, cleanliness, etc. that are not directly related to the feature but will be evaluated on the finished part.
STEP 4: Identify Potential Causes of Failure by Process Type
The Potential Causes of each Failure Mode will depend upon the process that is being used to create the Feature / Characteristic.
For example drilling a hole with a diameter of 10mm +/- 1 mm the Failure Modes will be the same i.e. Too Big or Too Small. However the Potential Causes of ‘Hole too Big’ if created on a CNC will be different to those if created using, for example, laser drilling.
Therefore Reference FMEAs now need to become specific to a process type.
In this example we shall consider ‘hole drilling’ on a CNC machine. The team will need to decide if CNC drilling is a single Reference PFMEA or if there are different types of CNC machines that may require their own Reference PFMEA.
This can be decided by looking at the list of Potential Causes for each. If they are similar then we should strive to have only one Reference PFMEA if they are significantly different (due to the mechanical nature of the equipment for example) then separate Reference PFMEAs should be created.
The team should consider all of the direct causes that could create the Product Failure Mode.

Creating Effective Process FMEAs & Contol Plans
55
Figure 22: Reference PFMEA for CNC Hole Drilling: Potential Failure Mode Causes
Creating Effective Process FMEAs
P a g e | 59 of 83 1st Edition
Figure 21: Reference PFMEA for CNC Hole Drilling: Potential Failure Mode Causes
PreventionControls
Occ
urre
nce
DetectionControls
Det
ectio
n
Wrong drill used
Tool wear
Wrong drill selected
Tool Setting incorrect
CNC program offset incorrectly set
Tool setting incorrect
CNC program offset incorrectly set
Tool wear
Reference Process Failure Mode and Effects Analysis (PFMEA) by Characteristic
Feature / Characteristic Requirements Potential
Failure Mode
Potential Effect(s) of
Failure Seve
rity
Cla
ssifi
catio
n
Drill Hole
Diameter too big
Diameter
Too Deep
Potential Cause(s) of Failure RPN
Drill is oversize from tooling supplier
CNC spindle alignment out of specification
Drill undersize from tooling supplier
Not deep enough
Depth
Diameter too small
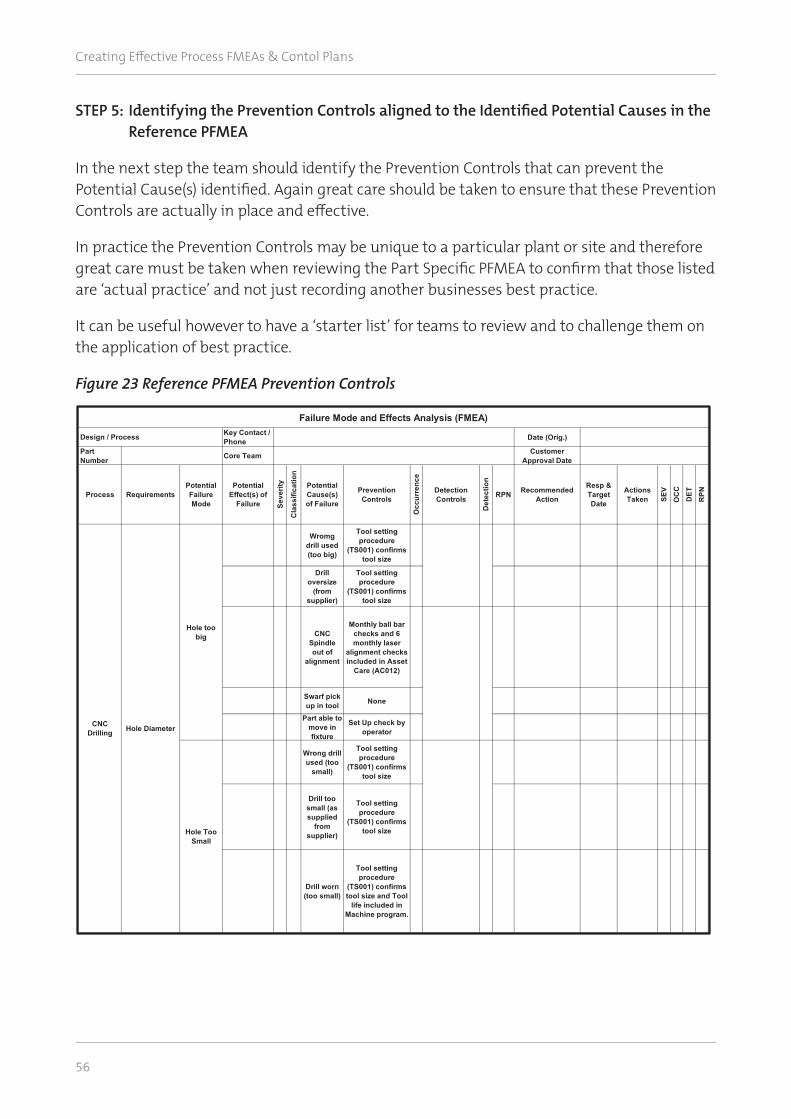
Creating Effective Process FMEAs & Contol Plans
56
STEP 5: Identifying the Prevention Controls aligned to the Identified Potential Causes in the Reference PFMEA
In the next step the team should identify the Prevention Controls that can prevent the Potential Cause(s) identified. Again great care should be taken to ensure that these Prevention Controls are actually in place and effective.
In practice the Prevention Controls may be unique to a particular plant or site and therefore great care must be taken when reviewing the Part Specific PFMEA to confirm that those listed are ‘actual practice’ and not just recording another businesses best practice.
It can be useful however to have a ‘starter list’ for teams to review and to challenge them on the application of best practice.
Figure 23 Reference PFMEA Prevention Controls
Creating Effective Process FMEAs
P a g e | 60 of 83 1st Edition
STEP 5: Identifying the Prevention Controls aligned to the Identified Potential Causes in the Reference PFMEA
In the next step the team should identify the Prevention Controls that can prevent the Potential Cause(s) identified. Again great care should be taken to ensure that these Prevention Controls are actually in place and effective.
In practice the Prevention Controls may be unique to a particular plant or site and therefore great care must be taken when reviewing the Part Specific PFMEA to confirm that those listed are ‘actual practice’ and not just recording another businesses best practice.
It can be useful however to have a ‘starter list’ for teams to review and to challenge them on the application of best practice.
Figure 22: Reference PFMEA Prevention Controls
Key Contact / Phone Date (Orig.)
Part Number Core Team Customer
Approval Date
Wromg drill used (too big)
Tool setting procedure
(TS001) confirms tool size
Drill oversize
(from supplier)
Tool setting procedure
(TS001) confirms tool size
CNC Spindle out of
alignment
Monthly ball bar checks and 6 monthly laser
alignment checks included in Asset
Care (AC012)
Swarf pick up in tool None
Part able to move in fixture
Set Up check by operator
Wrong drill used (too
small)
Tool setting procedure
(TS001) confirms tool size
Drill too small (as supplied
from supplier)
Tool setting procedure
(TS001) confirms tool size
Hole DiameterCNC Drilling
Tool setting procedure
(TS001) confirms tool size and Tool
life included in Machine program.
Drill worn (too small)
Hole Too Small
SEV
OC
CD
ETR
PN
Hole too big
Recommended Action
Resp & Target Date
Actions Taken
Potential Cause(s) of Failure
PreventionControls
Occ
urre
nce
DetectionControls
Det
ectio
nRPNProcess Requirements
Potential Failure Mode
Potential Effect(s) of
Failure Seve
rity
Cla
ssifi
catio
n
Failure Mode and Effects Analysis (FMEA)
Design / Process

Creating Effective Process FMEAs & Contol Plans
57
STEP 6: Identifying the Typical Detection Controls for the Failure Mode in the Reference PFMEA
The next task is to identify the typical Detection Controls for the Failure Mode. These will be used as a guide only and should include the latest thinking from the business experts.
As with the Prevention Controls these are often plant / site or business specific and will need to be reviewed closely to confirm that they reflect the actual condition for the application under review (the Part Number specific PFMEA).
The Global Process Owner may have minimum requirements for certain Detection Controls and these must be adhered to. For example there may be a standard method for measuring surface finish inside a bore that requires specific measuring equipment. Mandated Detection Controls should be identified within the column with a comment.
If the part specific PFMEA identifies that the Global Process Owner mandated Detection Controls are not in place then this should be identified as an improvement action within the PFMEA.

Creating Effective Process FMEAs & Contol Plans
58
Figure 24: Identifying the Typical Detection Controls in the Reference PFMEA
Creating Effective Process FMEAs
P a g e | 62 of 83 1st Edition
Figure 23: Identifying the Typical Detection Controls in the Reference PFMEA
Key Contact / Phone Date (O
Part Number Core Team Custom
Approval
Wromg drill used (too big)
Tool setting procedure
(TS001) confirms tool size
Drill oversize
(from supplier)
Tool setting procedure
(TS001) confirms tool size
CNC Spindle out of
alignment
Monthly ball bar checks and 6 monthly laser
alignment checks included in Asset
Care (AC012)
Swarf pick up in tool None
Part able to move in fixture
Set Up check by operator
Wrong drill used (too
small)
Tool setting procedure
(TS001) confirms tool size
Drill too small (as supplied
from supplier)
Tool setting procedure
(TS001) confirms tool sizeHole Too
Small
CMM Inspection at
OP240
Drill worn (too small)
Tool setting procedure
(TS001) confirms tool size and Tool
life included in Machine program.
CNC Drilling Hole Diameter
Hole too big
CMM Inspection at
OP240
Recomme Actio
Potential
Cause(s) of Failure
PreventionControls
Occ
urre
nce
DetectionControls
Det
ectio
n
RPNProcess RequirementsPotential Failure Mode
Potential Effect(s) of
Failure Seve
rity
Cla
ssifi
catio
n
Failure Mode and Effects Analysis (FMEA)
Design / Process
Creating Effective Process FMEAs & Contol Plans
59
Chapter Four Completing a PFMEA using Reference PFMEAs Building Blocks
In a mature state the business will have a database of all of the Reference PFMEAs it requires for the processes that it uses. This database will represent the ‘best practice’ for each process and be a knowledge management hub recording all of the company’s insights into managing the process.
The Reference PFMEA database should be updated whenever new information comes to light so that it can be shared across the business forming a key part of the continuous improvement activity.
As there is no product specific details held within the Reference PFMEA these can be made available to the external supply chain for them to use. This will also enable the knowledge management database to be updated by the experienced and knowledge held within the external supply chain as well as within the business making the approach even more powerful.
Care must be taken when designing the Reference PFMEA file structure to make it easy to access and find the right element.
The typical structure will include 4 levels.
Level 1 : The Process Group
This is the common name for the process and is usually defined by the equipment or process. Examples include CNC Machining, Joining, Surface Preparation
Level 2 : Process Type
This is where the process can be made more specific and will take the form of the equipment used or more detailed process description. For example CNC Grinding, CNC Drilling, CNC Turning, Joining by E-Beam Welding, Joining by Inertia Welding, Surface preparation by grit blasting, etc.
Level 3: Process Description
The Process type may need to be made more specific if there are various methods or equipment variation that can impact on the level of commonality of the process causes e.g. CNC grinding on a Mazak CNC may have a different set of Potential causes to that ground on a Viking horizontal grinding machine. In this case there may need to be two separate Reference PFMEAs for CNC Grinding, one for the Mazak and one for the Viking equipment.

Creating Effective Process FMEAs & Contol Plans
60
Level 4 : Process Characteristics / Features
The Reference PFMEA now needs to identify the typical features / characteristics that the process / equipment is designed to create. E.g. for the CNC grinding operation using the Mazak this could include ;
• Size (length, height, etc.)• Radii• Angle• Surface finishThis structure is shown in Figure 25.
Figure 25: Reference PFMEA Database Structure Example
STEP 1: Select the Part Number for the PFMEA activity & collate all related documentation required to complete the PFMEA
PFMEAs must be completed for a specific part number or assembly.
The scope will include all process steps and all features that are created to meet the design intent.In order to create a part specific PFMEA the team will require;1) Part / Assembly Drawing(s)2) Related specifications called up on the drawing(s)3) Process Flow Diagram detailing the method of manufacture4) Product Characteristic Matrix that specifies the features created at each process step5) Assembly Instructions The documents should be reviewed to ensure that these documents are complete and have the required integrity to make the PFMEA meaningful.These documents will be used to create the shell PFMEA for the specific part number using the appropriate Reference PFMEAs, as shown in Figure 26.
Creating Effective Process FMEAs
P a g e | 64 of 83 1st Edition
In this case there may need to be two separate Reference PFMEAs for CNC Grinding, one for the Mazak and one for the Viking equipment.
Level 4 : Process Characteristics / Features
The Reference PFMEA now needs to identify the typical features / characteristics that the process / equipment is designed to create. E.g. for the CNC grinding operation using the Mazak this could include ;
• Size (length, height, etc.) • Radii • Angle • Surface finish
This structure is shown in Figure 24.
Figure 24: Reference PFMEA Database Structure Example
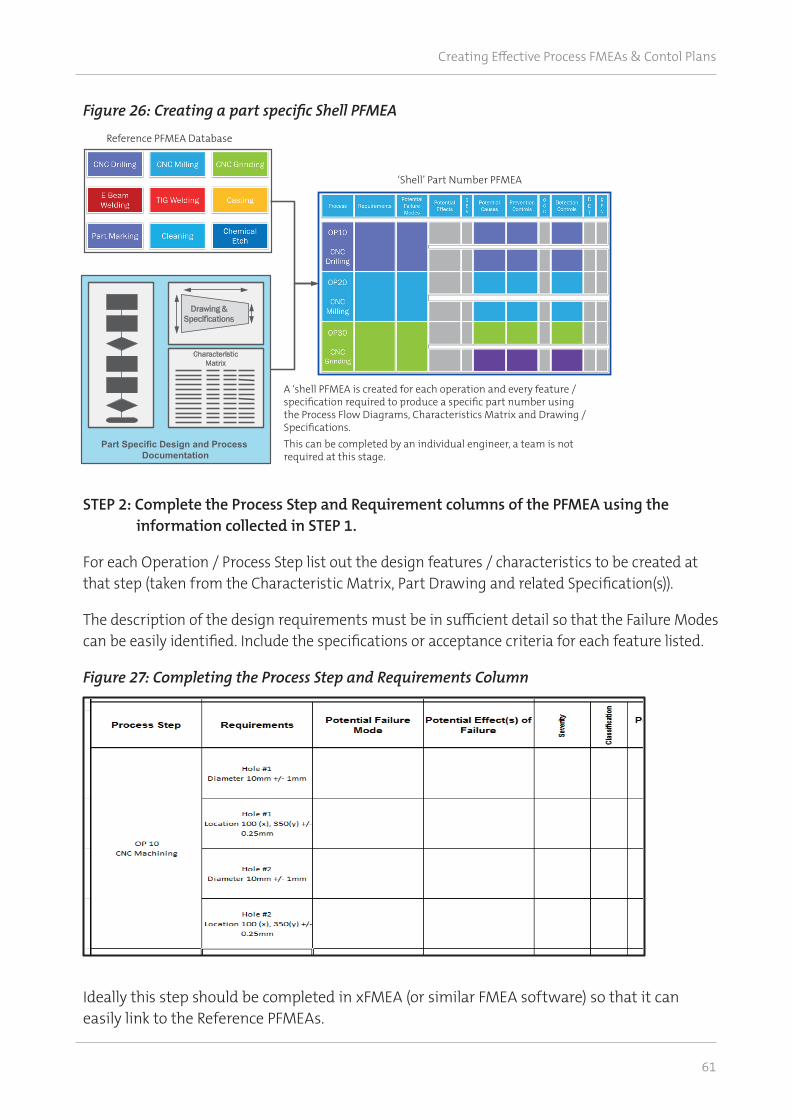
Creating Effective Process FMEAs & Contol Plans
61
STEP 2: Complete the Process Step and Requirement columns of the PFMEA using the information collected in STEP 1.
For each Operation / Process Step list out the design features / characteristics to be created at that step (taken from the Characteristic Matrix, Part Drawing and related Specification(s)).
The description of the design requirements must be in sufficient detail so that the Failure Modes can be easily identified. Include the specifications or acceptance criteria for each feature listed.
Figure 27: Completing the Process Step and Requirements Column
Ideally this step should be completed in xFMEA (or similar FMEA software) so that it can easily link to the Reference PFMEAs.
Figure 26: Creating a part specific Shell PFMEA
Creating Effective Process FMEAs
P a g e | 66 of 83 1st Edition
STEP 2: Complete the Process Step and Requirement columns of the PFMEA using the information collected in STEP 1.
For each Operation / Process Step list out the design features / characteristics to be created at that step (taken from the Characteristic Matrix, Part Drawing and related Specification(s)).
The description of the design requirements must be in sufficient detail so that the Failure Modes can be easily identified. Include the specifications or acceptance criteria for each feature listed.
Figure 25: Completing the Process Step and Requirements Column
Ideally this step should be completed in xFMEA so that it can easily link to the Reference PFMEAs.
Although PFMEAs should be completed for every feature included within the Design Definition there are some allowable exceptions and care points that should be considered.
A) Patterns of Features
The Risk Profile (RPN) of a feature within a PFMEA is derived from three attributes;
• Potential impact of the non-conformance (Severity Score), related to the purpose of the feature,
• Probability of it happening (Occurrence Score), related to the process capability and hence specification(s) limits, and
• Ability to detect it, if it was nonconforming (Detection Score).
A ‘shell PFMEA is created for each operation and every feature / specification required to produce a specific part number using the Process Flow Diagrams, Characteristics Matrix and Drawing / Specifications.This can be completed by an individual engineer, a team is not required at this stage.
Reference PFMEA Database
‘Shell’ Part Number PFMEA
Creating a Part Specific PFMEA using Reference FMEAs
Drawing & Specifications
CharacteristicMatrix
Part Specific Design and Process Documentation
Reference PFMEA Database
A ‘shell PFMEA is created for each operation and every feature / specification required to produce a specific part number using the Process Flow Diagrams, Characteristics Matrix and Drawing / Specifications.
This can be completed by an individual engineer, a team is not required at this stage.
‘Shell’ Part Number PFMEA
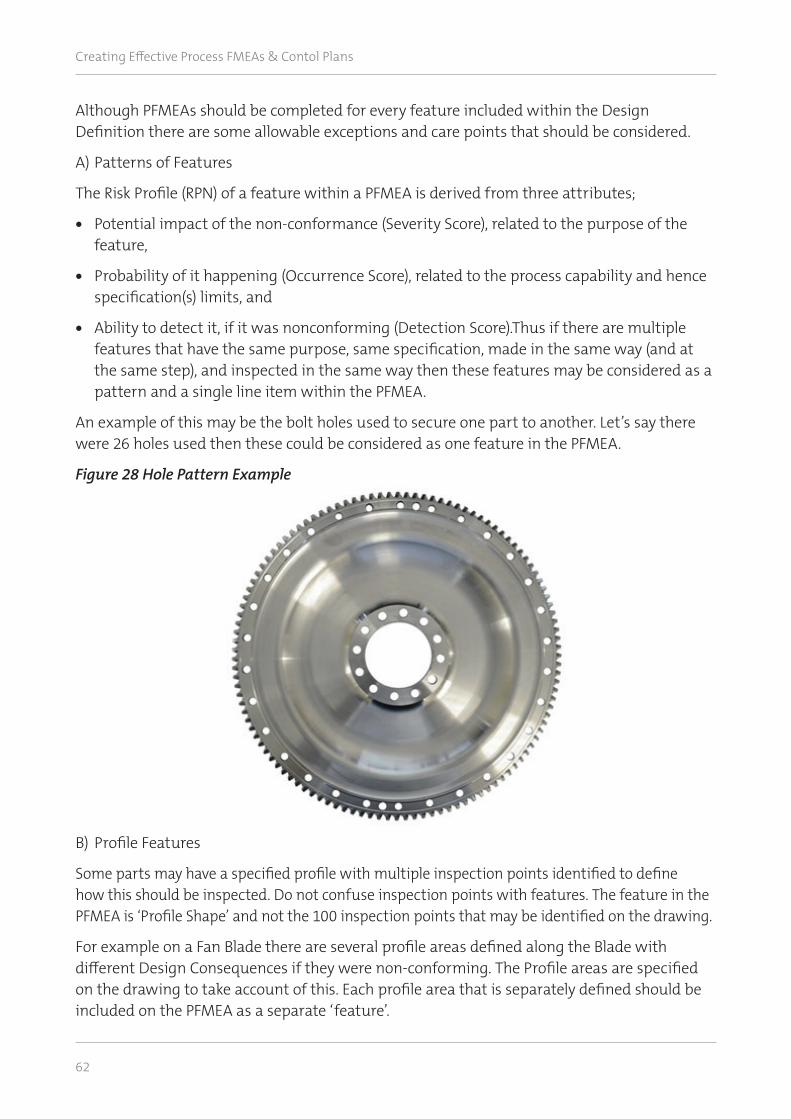
Creating Effective Process FMEAs & Contol Plans
62
Although PFMEAs should be completed for every feature included within the Design Definition there are some allowable exceptions and care points that should be considered.
A) Patterns of Features
The Risk Profile (RPN) of a feature within a PFMEA is derived from three attributes;
• Potential impact of the non-conformance (Severity Score), related to the purpose of the feature,
• Probability of it happening (Occurrence Score), related to the process capability and hence specification(s) limits, and
• Ability to detect it, if it was nonconforming (Detection Score).Thus if there are multiple features that have the same purpose, same specification, made in the same way (and at the same step), and inspected in the same way then these features may be considered as a pattern and a single line item within the PFMEA.
An example of this may be the bolt holes used to secure one part to another. Let’s say there were 26 holes used then these could be considered as one feature in the PFMEA.
Figure 28 Hole Pattern Example
B) Profile Features
Some parts may have a specified profile with multiple inspection points identified to define how this should be inspected. Do not confuse inspection points with features. The feature in the PFMEA is ‘Profile Shape’ and not the 100 inspection points that may be identified on the drawing.
For example on a Fan Blade there are several profile areas defined along the Blade with different Design Consequences if they were non-conforming. The Profile areas are specified on the drawing to take account of this. Each profile area that is separately defined should be included on the PFMEA as a separate ‘feature’.

Creating Effective Process FMEAs & Contol Plans
63
STEP 3: Add the relevant REFERENCE PFMEA information for each characteristic listed.
To determine the Reference PFMEAs required to complete the Part Specific PFMEA the Characteristics Matrix should be reviewed to identify the process types and features used to create the part.
For example a Main Line Shaft uses the following processes to create the defined features:
Figure 29: Determining the Required Reference PFMEAs
In this example there are 5 main types of Reference PFMEAs used. It assumes that the Potential Failure Modes on the Mazak are different to those on the Hermele and therefore uses a separate Reference PFMEA.
At feature level there are 13 Reference PFMEA required to cover the features listed.
Creating Effective Process FMEAs
P a g e | 68 of 83 1st Edition
STEP 3: Add the relevant REFERENCE PFMEA information for each characteristic listed.
To determine the Reference PFMEAs required to complete the Part Specific PFMEA the Characteristics Matrix should be reviewed to identify the process types and features used to create the part.
For example a Main Line Shaft uses the following processes to create the defined features:
Figure 27: Determining the Required Reference PFMEAs
In this example there are 5 main types of Reference PFMEAs used. It assumes that the Potential Failure Modes on the Mazak are different to those on the Hermele and therefore uses a separate Reference PFMEA.
At feature level there are 13 Reference PFMEA required to cover the features listed.
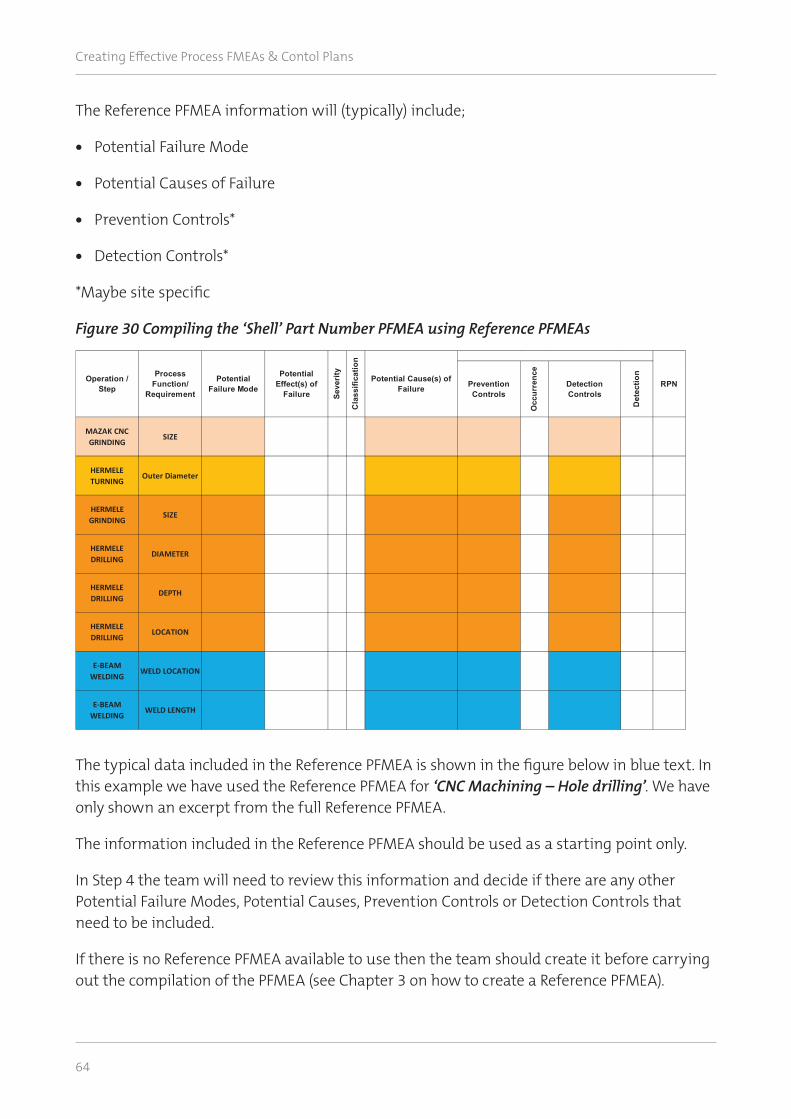
Creating Effective Process FMEAs & Contol Plans
64
The Reference PFMEA information will (typically) include;
• Potential Failure Mode
• Potential Causes of Failure
• Prevention Controls*
• Detection Controls*
*Maybe site specific
Figure 30 Compiling the ‘Shell’ Part Number PFMEA using Reference PFMEAs
The typical data included in the Reference PFMEA is shown in the figure below in blue text. In this example we have used the Reference PFMEA for ‘CNC Machining – Hole drilling’. We have only shown an excerpt from the full Reference PFMEA.
The information included in the Reference PFMEA should be used as a starting point only.
In Step 4 the team will need to review this information and decide if there are any other Potential Failure Modes, Potential Causes, Prevention Controls or Detection Controls that need to be included.
If there is no Reference PFMEA available to use then the team should create it before carrying out the compilation of the PFMEA (see Chapter 3 on how to create a Reference PFMEA).
Creating Effective Process FMEAs
P a g e | 69 of 83 1st Edition
The Reference PFMEA information will (typically) include;
• Potential Failure Mode • Potential Causes of Failure • Prevention Controls* • Detection Controls*
*Maybe site specific
Figure 28: Compiling the ‘Shell’ Part Number PFMEA using Reference PFMEAs
The typical data included in the Reference PFMEA is shown in the figure below in blue text. In this example we have used the Reference PFMEA for ‘CNC Machining – Hole drilling’. We have only shown an excerpt from the full Reference PFMEA.
The information included in the Reference PFMEA should be used as a starting point only.
In Step 4 the team will need to review this information and decide if there are any other Potential Failure Modes, Potential Causes, Prevention Controls or Detection Controls that need to be included.
If there is no Reference PFMEA available to use then the team should create it before carrying out the compilation of the PFMEA (see Chapter 3 on how to create a Reference PFMEA).
PreventionControls
Occ
urre
nce
DetectionControls
Det
ectio
n
MAZAK CNCGRINDING
SIZE
HERMELETURNING
Outer Diameter
HERMELEGRINDING
SIZE
HERMELEDRILLING
DIAMETER
HERMELEDRILLING
DEPTH
HERMELEDRILLING
LOCATION
E-BEAM WELDING
WELD LOCATION
E-BEAM WELDING
WELD LENGTH
RPNProcess
Function/ Requirement
Potential Failure Mode
Potential Effect(s) of
Failure Seve
rity
Cla
ssifi
catio
n
Potential Cause(s) of Failure
Operation / Step
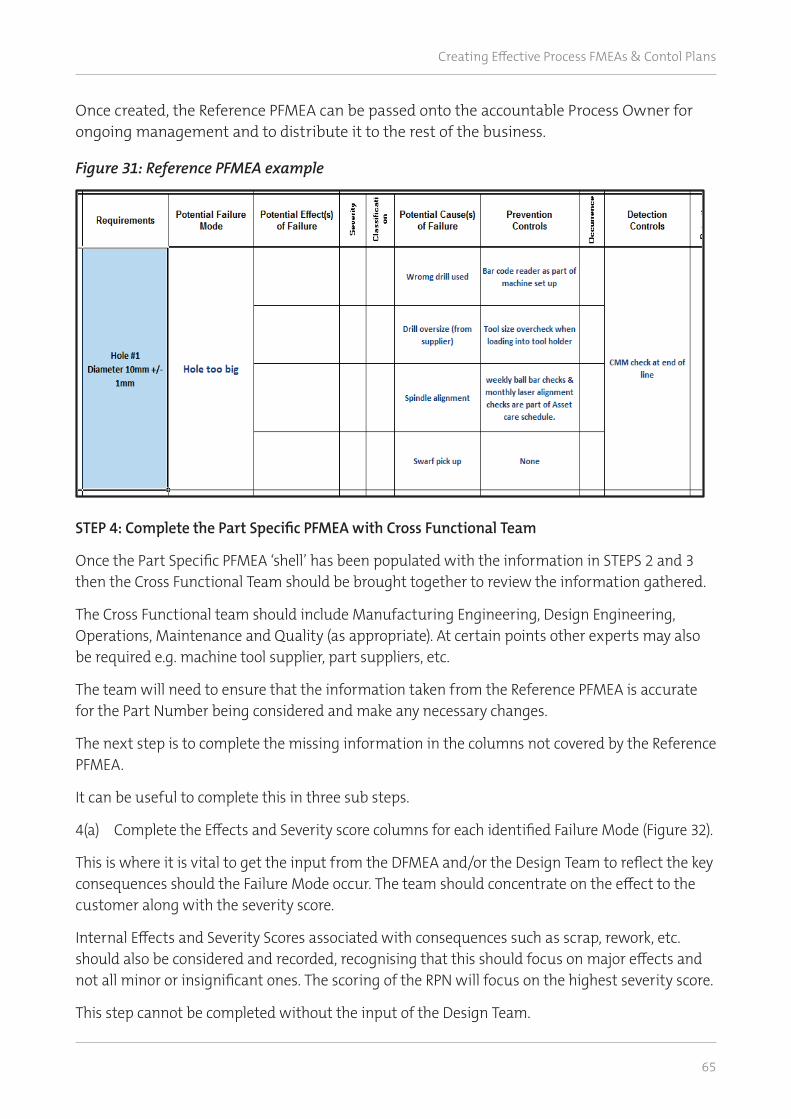
Creating Effective Process FMEAs & Contol Plans
65
Once created, the Reference PFMEA can be passed onto the accountable Process Owner for ongoing management and to distribute it to the rest of the business.
Figure 31: Reference PFMEA example
Creating Effective Process FMEAs
P a g e | 70 of 83 1st Edition
Once created, the Reference PFMEA can be passed onto the accountable Process Owner for ongoing management and to distribute it to the rest of the business.
Figure 29: Reference PFMEA example
STEP 4: Complete the Part Specific PFMEA with Cross Functional Team
Once the Part Specific PFMEA ‘shell’ has been populated with the information in STEPS 2 and 3 then the Cross Functional Team should be brought together to review the information gathered.
The Cross Functional team should include Manufacturing Engineering, Design Engineering, Operations, Maintenance and Quality (as appropriate). At certain points other experts may also be required e.g. machine tool supplier, part suppliers, etc.
The team will need to ensure that the information taken from the Reference PFMEA is accurate for the Part Number being considered and make any necessary changes.
The next step is to complete the missing information in the columns not covered by the Reference PFMEA.
It can be useful to complete this in three sub steps.
4(a) Complete the Effects and Severity score columns for each identified Failure Mode (Figure 32).
This is where it is vital to get the input from the DFMEA and/or the Design Team to reflect the key consequences should the Failure Mode occur. The team should concentrate on the effect to the customer along with the severity score.
Internal Effects and Severity Scores associated with consequences such as scrap, rework, etc. should also be considered and recorded, recognising that this should focus on major effects and not all minor or insignificant ones. The scoring of the RPN will focus on the highest severity score.
This step cannot be completed without the input of the Design Team.

Creating Effective Process FMEAs & Contol Plans
66
Figure 32: Completing the Effects and Severity Rating
4(b) Review the Potential Causes and Prevention Controls taken from the Reference PFMEA (Figure 33).
The team should review what is listed and modify to reflect the reality for this particular part number. The team may add or delete elements from the Reference PFMEA if appropriate.
In this example we have added an additional Potential Cause and Prevention Control (see red text).
The team should review performance data to allow them to complete the Occurrence Score element of the PFMEA using the Scoring Guidelines in Appendix A e.g. customer escapes, DPU (incl. feature RFT), concessions, etc.
Creating Effective Process FMEAs
P a g e | 72 of 83 1st Edition
Figure 30: Completing the Effects and Severity Rating
4(b) Review the Potential Causes and Prevention Controls taken from the Reference PFMEA (Figure 31).
The team should review what is listed and modify to reflect the reality for this particular part number. The team may add or delete elements from the Reference PFMEA if appropriate.
In this example we have added an additional Potential Cause and Prevention Control (see red text).
The team should review performance data to allow them to complete the Occurrence Score element of the PFMEA using the Scoring Guidelines in Appendix A e.g. customer escapes, DPU (incl. feature RFT), concessions, etc.

Creating Effective Process FMEAs & Contol Plans
67
Figure 33: Completing the Potential Causes, Prevention Controls and Occurrence Scoring sections.
4(c) Review the Detection Controls and Detection Score. Calculate the RPN for each Potential Cause (Figure 34).
The team should now review the Detection Controls that have been taken from the Reference PFMEA input and amend as necessary. Detection Controls refer to the part specific checks / inspections carried out to detect the Potential Failure Mode and certain key Potential Causes.
Typical Detection Controls are measurement of features, visual inspection, mistake proofing (jigs, fixtures), etc.
Once the Detection Controls and Scoring have been confirmed the team can now calculate the Risk Priority Number (RPN) for each Potential Cause listed in the PFMEA.
The RPN is calculated by multiplying the Highest Severity Score for the Potential Failure Mode by EACH Potential Cause Occurrence Score and by the best (lowest) Detection Score. i.e. there should be an RPN score for each Potential Cause identified in the PFMEA
Creating Effective Process FMEAs
P a g e | 73 of 83 1st Edition
Figure 31: Completing the Potential Causes, Prevention Controls and Occurrence Scoring sections.
4(c) Review the Detection Controls and Detection Score. Calculate the RPN for each Potential Cause (Figure 32).
The team should now review the Detection Controls that have been taken from the Reference PFMEA input and amend as necessary. Detection Controls refer to the part specific checks / inspections carried out to detect the Potential Failure Mode and certain key Potential Causes.
Typical Detection Controls are measurement of features, visual inspection, mistake proofing (jigs, fixtures), etc.
Once the Detection Controls and Scoring have been confirmed the team can now calculate the Risk Priority Number (RPN) for each Potential Cause listed in the PFMEA.
The RPN is calculated by multiplying the Highest Severity Score for the Potential Failure Mode by EACH Potential Cause Occurrence Score and by the best (lowest) Detection Score. i.e. there should be an RPN score for each Potential Cause identified in the PFMEA.

Creating Effective Process FMEAs & Contol Plans
68
Figure 34: Updating the Detection Controls, Detection Scoring and calculating the RPN
Creating Effective Process FMEAs
P a g e | 74 of 83 1st Edition
Figure 32: Updating the Detection Controls, Detection Scoring and calculating the RPN
Step 5: Prioritising Improvement Actions
The team must now review the output of the PFMEA and identify the key risks and required improvement actions.
This is done by in a defined sequence;
1. What are the high severity scores (8, 9 and 10) where occurrence is also high (7, 8, 9 and 10)? – do we have sufficient Prevention and Detection Controls to mitigate the Potential Failure Mode?
2. What are the high severity scores (regardless of Occurrence and Detection scores) and are we comfortable with the mitigation in place?
3. What are the high RPN scores and are we comfortable with the current mitigation?
4. Are there any simple controls that can be introduced to reduce the overall RPN?
Actions must be defined in the PFMEA along with the name of the accountable person and the target date for completion.
The revised RPN can be calculated based on the improvement action to predict the impact of the improvement but will only be confirmed once the action has been implemented and proven to work.
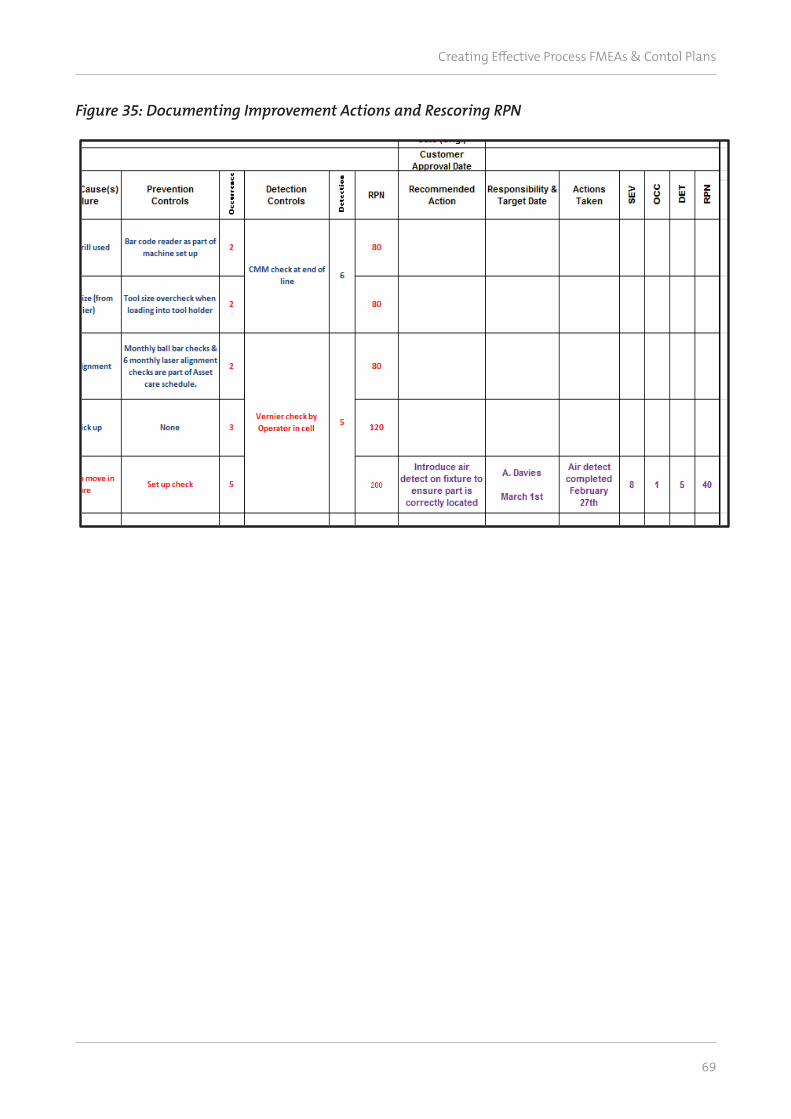
Creating Effective Process FMEAs & Contol Plans
69
Creating Effective Process FMEAs
P a g e | 75 of 83 1st Edition
Step 5: Prioritising Improvement Actions
The team must now review the output of the PFMEA and identify the key risks and required improvement actions.
This is done by in a defined sequence;
1. What are the high severity scores (8, 9 and 10) where occurrence is also high (7, 8, 9 and 10)? – do we have sufficient Prevention and Detection Controls to mitigate the Potential Failure Mode?
2. What are the high severity scores (regardless of Occurrence and Detection scores) and are we comfortable with the mitigation in place?
3. What are the high RPN scores and are we comfortable with the current mitigation?
4. Are there any simple controls that can be introduced to reduce the overall RPN?
Actions must be defined in the PFMEA along with the name of the accountable person and the target date for completion.
The revised RPN can be calculated based on the improvement action to predict the impact of the improvement but will only be confirmed once the action has been implemented and proven to work.
Figure 33: Documenting Improvement Actions and Rescoring RPN
Figure 35: Documenting Improvement Actions and Rescoring RPN

Creating Effective Process FMEAs & Contol Plans
70
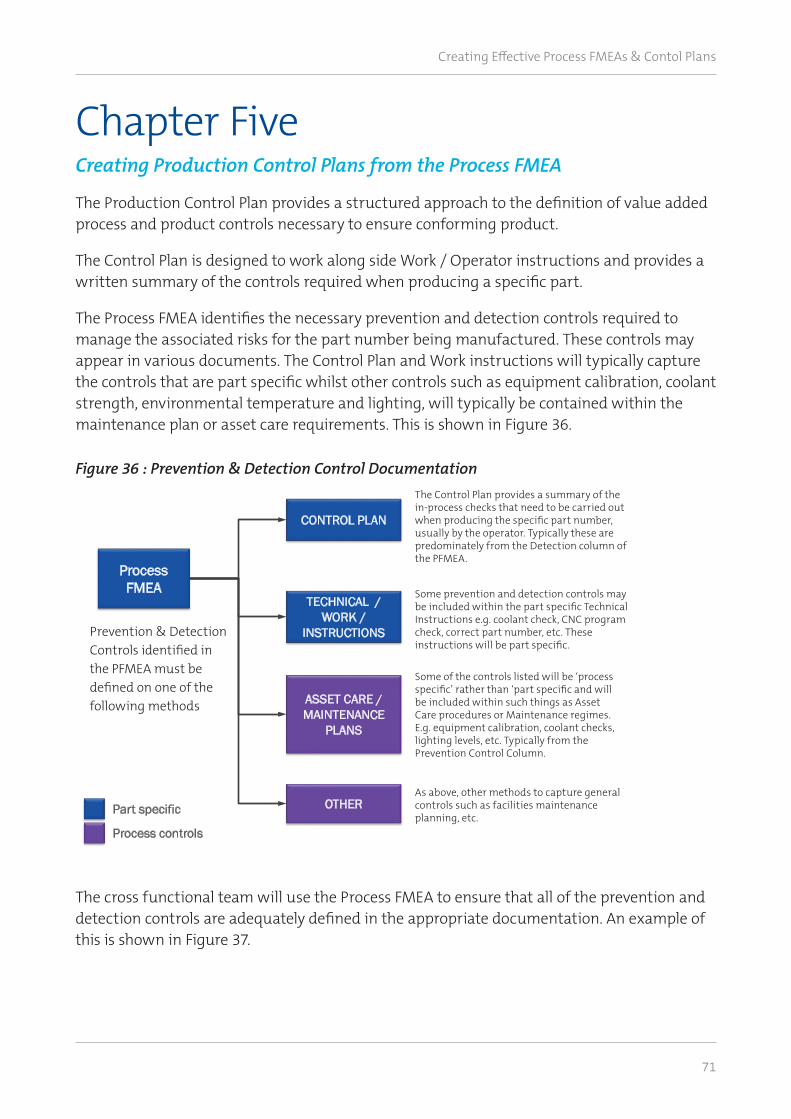
Creating Effective Process FMEAs & Contol Plans
71
Chapter Five Creating Production Control Plans from the Process FMEA
The Production Control Plan provides a structured approach to the definition of value added process and product controls necessary to ensure conforming product.
The Control Plan is designed to work along side Work / Operator instructions and provides a written summary of the controls required when producing a specific part.
The Process FMEA identifies the necessary prevention and detection controls required to manage the associated risks for the part number being manufactured. These controls may appear in various documents. The Control Plan and Work instructions will typically capture the controls that are part specific whilst other controls such as equipment calibration, coolant strength, environmental temperature and lighting, will typically be contained within the maintenance plan or asset care requirements. This is shown in Figure 36.
The cross functional team will use the Process FMEA to ensure that all of the prevention and detection controls are adequately defined in the appropriate documentation. An example of this is shown in Figure 37.
Figure 36 : Prevention & Detection Control DocumentationProcess FMEA Prevention & Detection Controls Overview
Process FMEA
CONTROL PLAN
TECHNICAL / WORK /
INSTRUCTIONS
ASSET CARE / MAINTENANCE
PLANS
OTHERPart specific
Process controls
Prevention & Detection Controls identified in the PFMEA must be defined on one of the following methods.
The Control Plan provides a summary of the in-process checks that need to be carried out when producing the specific part number, usually by the operator. Typically these are predominately from the Detection column of the PFMEA.
Some prevention and detection controls maybe included within the part specific Technical Instructions e.g. coolant check, CNC program check, correct part number, etc. These instructions will be part specific.
Some of the control listed will be ‘process specific’ rather than ‘part specific. And will be included within such things as Asset Care procedures or Maintenance regimes. E.g. equipment calibration, coolant checks, lighting levels, etc. Typically from the Prevention Control Column.
As above, other methods to capture general controls such as facilities maintenance planning, etc.
The Control Plan provides a summary of the in-process checks that need to be carried out when producing the specific part number, usually by the operator. Typically these are predominately from the Detection column of the PFMEA.
Some prevention and detection controls may be included within the part specific Technical Instructions e.g. coolant check, CNC program check, correct part number, etc. These instructions will be part specific.
Some of the controls listed will be ‘process specific’ rather than ‘part specific and will be included within such things as Asset Care procedures or Maintenance regimes. E.g. equipment calibration, coolant checks, lighting levels, etc. Typically from the Prevention Control Column.
As above, other methods to capture general controls such as facilities maintenance planning, etc.
Prevention & Detection Controls identified in the PFMEA must be defined on one of the following methods
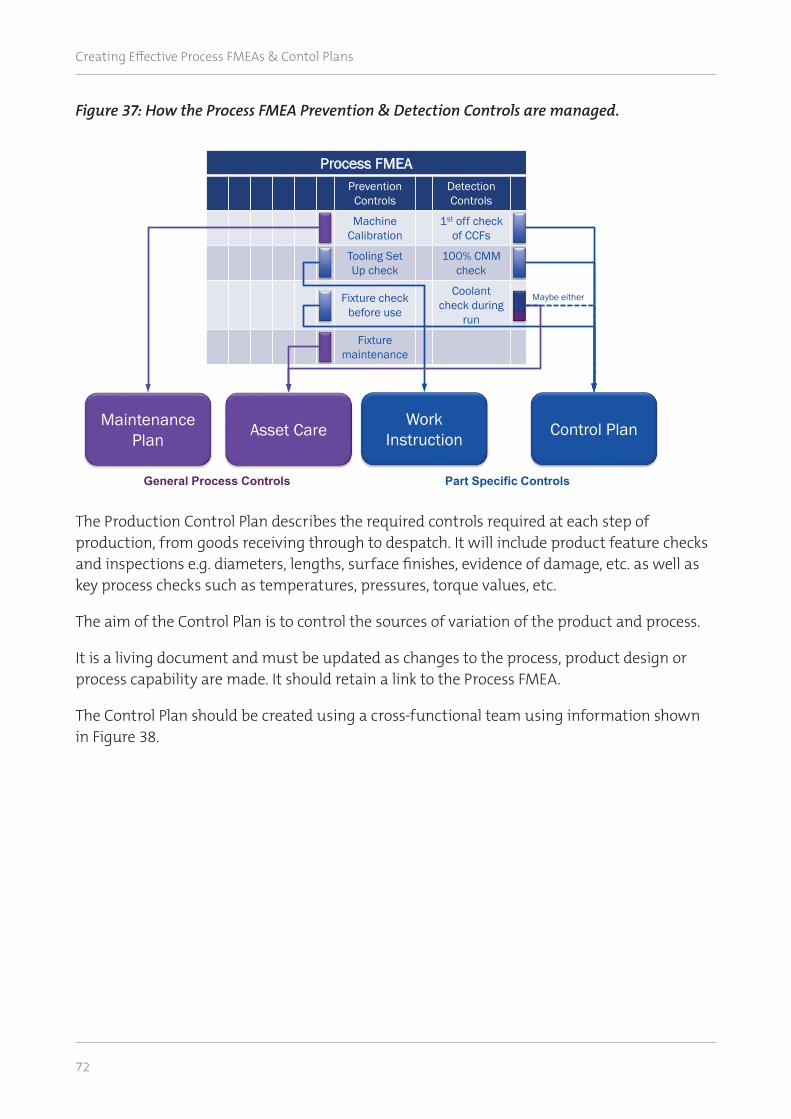
Creating Effective Process FMEAs & Contol Plans
72
Figure 37: How the Process FMEA Prevention & Detection Controls are managed.
The Production Control Plan describes the required controls required at each step of production, from goods receiving through to despatch. It will include product feature checks and inspections e.g. diameters, lengths, surface finishes, evidence of damage, etc. as well as key process checks such as temperatures, pressures, torque values, etc.
The aim of the Control Plan is to control the sources of variation of the product and process.
It is a living document and must be updated as changes to the process, product design or process capability are made. It should retain a link to the Process FMEA.
The Control Plan should be created using a cross-functional team using information shown in Figure 38.
Process FMEA Prevention & Detection Controls
Process FMEAPrevention
ControlsDetection Controls
Machine Calibration
1st off check of CCFs
Tooling Set Up check
100% CMM check
Fixture check before use
Coolant check during
run
Fixturemaintenance
Maintenance Plan Asset Care Control PlanWork
Instruction
Maybe either
Part Specific ControlsGeneral Process Controls
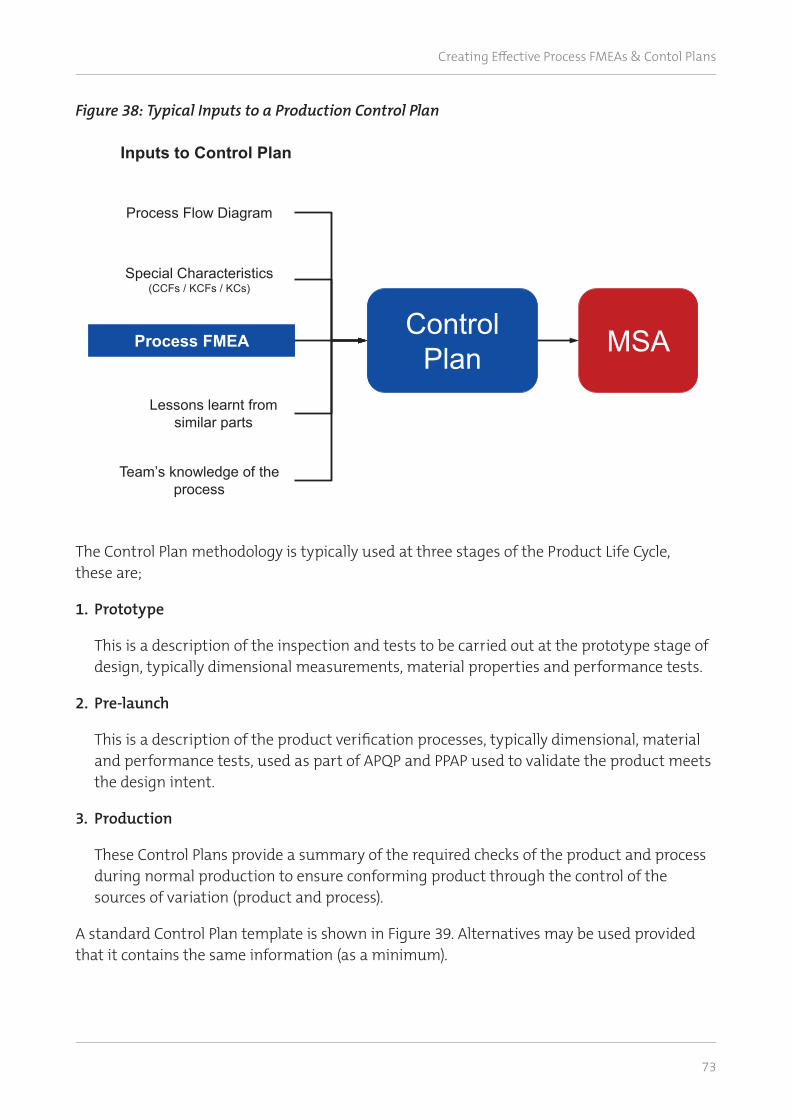
Creating Effective Process FMEAs & Contol Plans
73
Figure 38: Typical Inputs to a Production Control Plan
The Control Plan methodology is typically used at three stages of the Product Life Cycle, these are;
1. Prototype
This is a description of the inspection and tests to be carried out at the prototype stage of design, typically dimensional measurements, material properties and performance tests.
2. Pre-launch
This is a description of the product verification processes, typically dimensional, material and performance tests, used as part of APQP and PPAP used to validate the product meets the design intent.
3. Production
These Control Plans provide a summary of the required checks of the product and process during normal production to ensure conforming product through the control of the sources of variation (product and process).
A standard Control Plan template is shown in Figure 39. Alternatives may be used provided that it contains the same information (as a minimum).
Control Plan Inputs
Control Plan
Process FMEA
Process Flow Diagram
Lessons learnt from similar parts
Team’s knowledge of the process
Special Characteristics(CCFs / KCFs / KCs)
MSA
Inputs to Control Plan

Creating Effective Process FMEAs & Contol Plans
74
Figure 39: Standard Control Plan Template
CON
TRO
L PL
AN
☐Pr
otot
ype
☐Pr
e-La
unch
☐Pr
oduc�o
n
Cont
rol P
lan
Num
ber :
Key
Cont
act /
Pho
ne :
Date
(orig
inal
)Da
te re
visio
n :
Part
Num
ber &
Lat
est I
ssue
leve
l:Co
re T
eam
:Cu
stom
er E
ngin
eerin
g App
rova
l / d
ate
(if re
quire
d)
Part
Nam
e / D
escr
ip�o
n :
Org
anisa
�on
/ Pla
nt A
ppro
val /
Dat
eCu
stom
er Q
ualit
y App
rova
l :
Org
anisa
�on
Plan
t :O
rgan
isa�o
n Co
de:
Oth
er A
ppro
vals
/ dat
e (if
requ
ired)
Oth
er A
ppro
vals
/ dat
e (if
requ
ired)
Part
/ Pr
oces
s N
umbe
rPr
oces
s Nam
e /
Ope
ra�o
n De
scrip
�on
Mac
hine
/ Jig
/ D
evic
e fo
r MFG
Char
acte
ris�c
s
Spec
ial
Char
Met
hods
Reac�o
n Pl
an
No.
Prod
uct
Proc
ess
Prod
uct /
Pro
cess
Sp
ecifi
ca�o
n /
Tole
ranc
eEv
alua
�on
/ M
easu
rem
ent
Tech
niqu
eSa
mpl
e Si
zeSa
mpl
e Fr
eque
ncy
Cont
rol M
etho
d
1
2 3 4
56
7 8 9
1011 12 13
1414
1516
1718
1920
2122
2324
2526
27
Creating Effective Process FMEAs & Contol Plans
75
A description of what is required in each part of the Control Plan is as follows;
1) Prototype / Prelaunch / Production
Tick the box to indicate the Control Plan type.
2) Control Plan Number
Every Control Plan should have a unique identification number.
3) Part Number / Latest Change Level
Enter the part number of the system, sub-system or component being controlled along with the engineering change level and/or issue date of the drawing.
4) Part Name / description
Enter the name and description of the product being controlled e.g. Turbine IPT Blade, Module 1 Assembly, etc.
5) Organisation / Plant
Enter the name of the company and the appropriate division / plant where production is taking place.
6) Organisation Code (Supplier Code)
Enter the identification number e.g. DUNS, Customer supplier code, as requested by the customer (if applicable).
7) Key Contact / Phone and other contact information
Enter the name, telephone number and other contact information e.g. e-mail of the primary contact responsible for the control plan.
8) Core Team
The names, telephone numbers and other contact information such as e-mail addresses, etc. for the team preparing the control plan. It is recommended that this list be appended to the control plan and kept up to date.
9) Organisation / Plant Approval / Date
This is evidence that the responsible manufacturing plant has approved the control plan.
10) Date (Original)
The date that the original control plan was compiled (published).
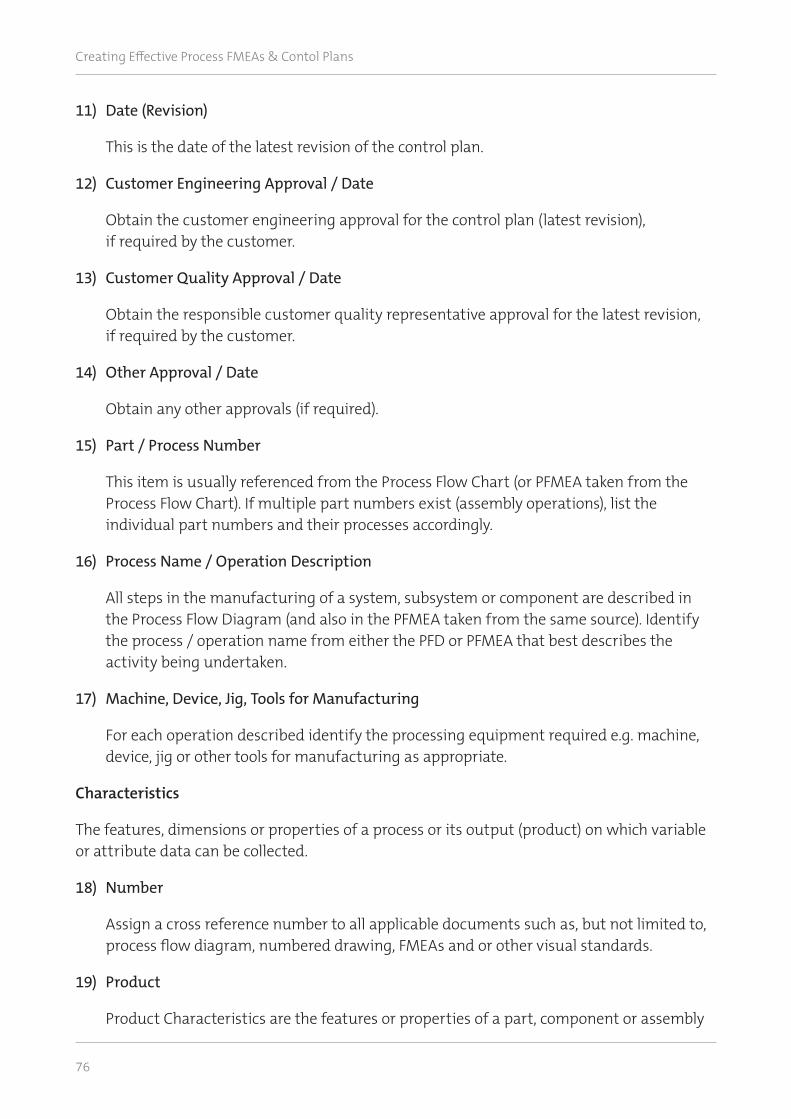
Creating Effective Process FMEAs & Contol Plans
76
11) Date (Revision)
This is the date of the latest revision of the control plan.
12) Customer Engineering Approval / Date
Obtain the customer engineering approval for the control plan (latest revision), if required by the customer.
13) Customer Quality Approval / Date
Obtain the responsible customer quality representative approval for the latest revision, if required by the customer.
14) Other Approval / Date
Obtain any other approvals (if required).
15) Part / Process Number
This item is usually referenced from the Process Flow Chart (or PFMEA taken from the Process Flow Chart). If multiple part numbers exist (assembly operations), list the individual part numbers and their processes accordingly.
16) Process Name / Operation Description
All steps in the manufacturing of a system, subsystem or component are described in the Process Flow Diagram (and also in the PFMEA taken from the same source). Identify the process / operation name from either the PFD or PFMEA that best describes the activity being undertaken.
17) Machine, Device, Jig, Tools for Manufacturing
For each operation described identify the processing equipment required e.g. machine, device, jig or other tools for manufacturing as appropriate.
Characteristics
The features, dimensions or properties of a process or its output (product) on which variable or attribute data can be collected.
18) Number
Assign a cross reference number to all applicable documents such as, but not limited to, process flow diagram, numbered drawing, FMEAs and or other visual standards.
19) Product
Product Characteristics are the features or properties of a part, component or assembly

Creating Effective Process FMEAs & Contol Plans
77
that are described on drawings or other primary engineering information. This information can be taken from the PFMEA (if compliant to AS13004).
The core team should identify the special product characteristics that are a compilation of important product characteristics from all sources (DFMEA, PFMEA, Customer inputs, etc.) All special characteristics must be listed on the control plan.
In addition the Control Plan must include all other product characteristics, and related process characteristics, that are required to be controlled during normal operations.
20) Process
Process Characteristics are the process variables (input variables) that have a cause and effect relationship with the identified product characteristic.
A process characteristic can only be measured at the time it occurs. The core team should identify process characteristics for which variation must be controlled to minimise product variation. There could be more than one process characteristic for each product characteristic listed.
In some processes one process characteristic may affect several product characteristics.
21) Special Characteristic Classification
Use the appropriate classification as required by the customer to designate the type of special characteristic or this field can be left blank for undesignated characteristics.
Methods (includes items 22 – 25)
A systematic plan using procedures and other tools to control a process
22) Product / Process Specification / Tolerance
The specification requirements may be found on the drawing or other documents such as the PFMEA, assembly documents, etc.
23) Evaluation / Measurement Technique
This column identifies the measurement system being used. This could include gauges, fixtures, tools and /or test equipment required to measure the part or process.
Measurement Systems Analysis (MSA) must be carried out on all measurement systems and attribute inspection activities (including visual inspection) being used to verify product conformity. The MSA acceptance criteria are specified in AS13003.
24) Sample Size & (25) Frequency
When sampling is allowed, list the corresponding sample size and frequency.
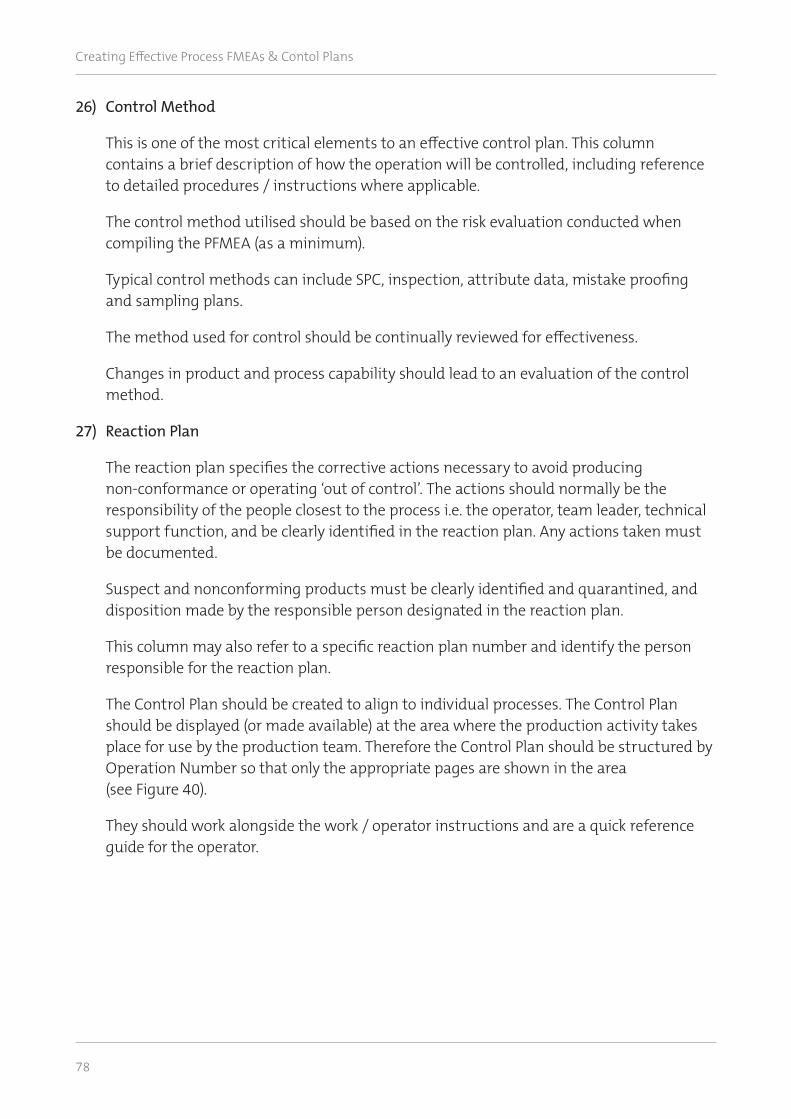
Creating Effective Process FMEAs & Contol Plans
78
26) Control Method
This is one of the most critical elements to an effective control plan. This column contains a brief description of how the operation will be controlled, including reference to detailed procedures / instructions where applicable.
The control method utilised should be based on the risk evaluation conducted when compiling the PFMEA (as a minimum).
Typical control methods can include SPC, inspection, attribute data, mistake proofing and sampling plans.
The method used for control should be continually reviewed for effectiveness.
Changes in product and process capability should lead to an evaluation of the control method.
27) Reaction Plan
The reaction plan specifies the corrective actions necessary to avoid producing non-conformance or operating ‘out of control’. The actions should normally be the responsibility of the people closest to the process i.e. the operator, team leader, technical support function, and be clearly identified in the reaction plan. Any actions taken must be documented.
Suspect and nonconforming products must be clearly identified and quarantined, and disposition made by the responsible person designated in the reaction plan.
This column may also refer to a specific reaction plan number and identify the person responsible for the reaction plan.
The Control Plan should be created to align to individual processes. The Control Plan should be displayed (or made available) at the area where the production activity takes place for use by the production team. Therefore the Control Plan should be structured by Operation Number so that only the appropriate pages are shown in the area (see Figure 40).
They should work alongside the work / operator instructions and are a quick reference guide for the operator.
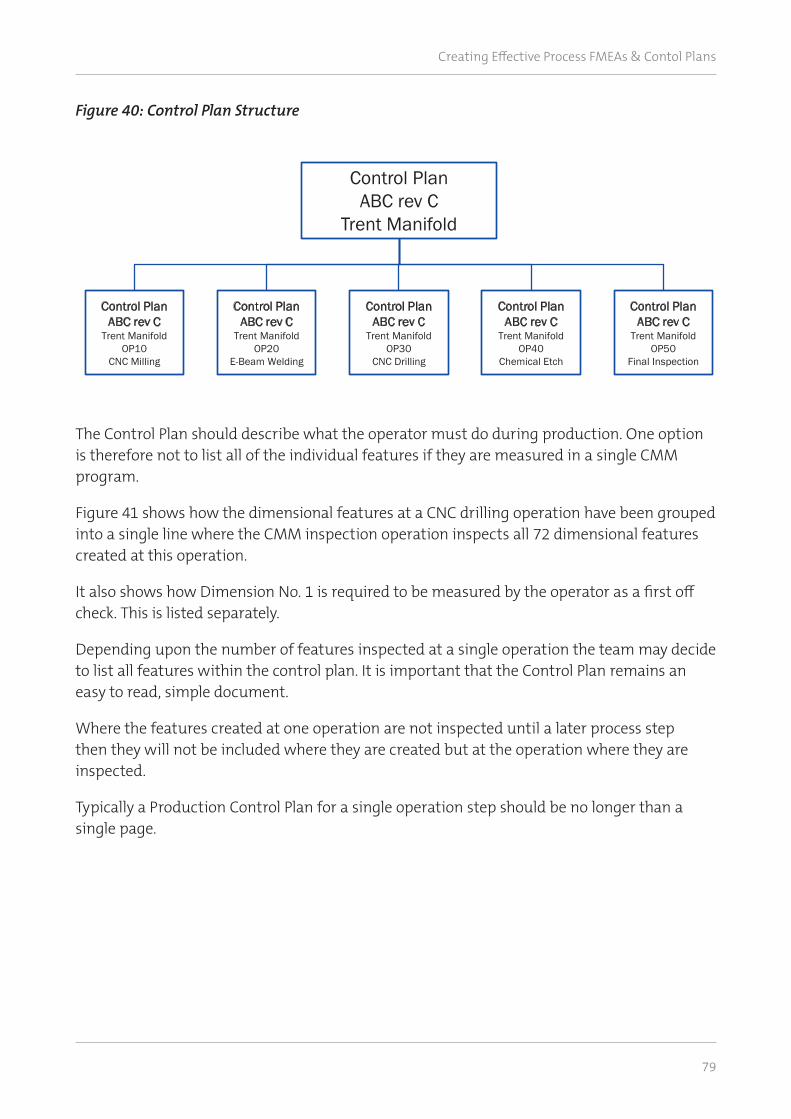
Creating Effective Process FMEAs & Contol Plans
79
The Control Plan should describe what the operator must do during production. One option is therefore not to list all of the individual features if they are measured in a single CMM program.
Figure 41 shows how the dimensional features at a CNC drilling operation have been grouped into a single line where the CMM inspection operation inspects all 72 dimensional features created at this operation.
It also shows how Dimension No. 1 is required to be measured by the operator as a first off check. This is listed separately.
Depending upon the number of features inspected at a single operation the team may decide to list all features within the control plan. It is important that the Control Plan remains an easy to read, simple document.
Where the features created at one operation are not inspected until a later process step then they will not be included where they are created but at the operation where they are inspected.
Typically a Production Control Plan for a single operation step should be no longer than a single page.
Figure 40: Control Plan Structure
Control PlanABC rev C
Trent Manifold
Control PlanABC rev C
Trent ManifoldOP10
CNC Milling
Control PlanABC rev C
Trent ManifoldOP20
E-Beam Welding
Control PlanABC rev C
Trent ManifoldOP30
CNC Drilling
Control PlanABC rev C
Trent ManifoldOP40
Chemical Etch
Control PlanABC rev C
Trent ManifoldOP50
Final Inspection
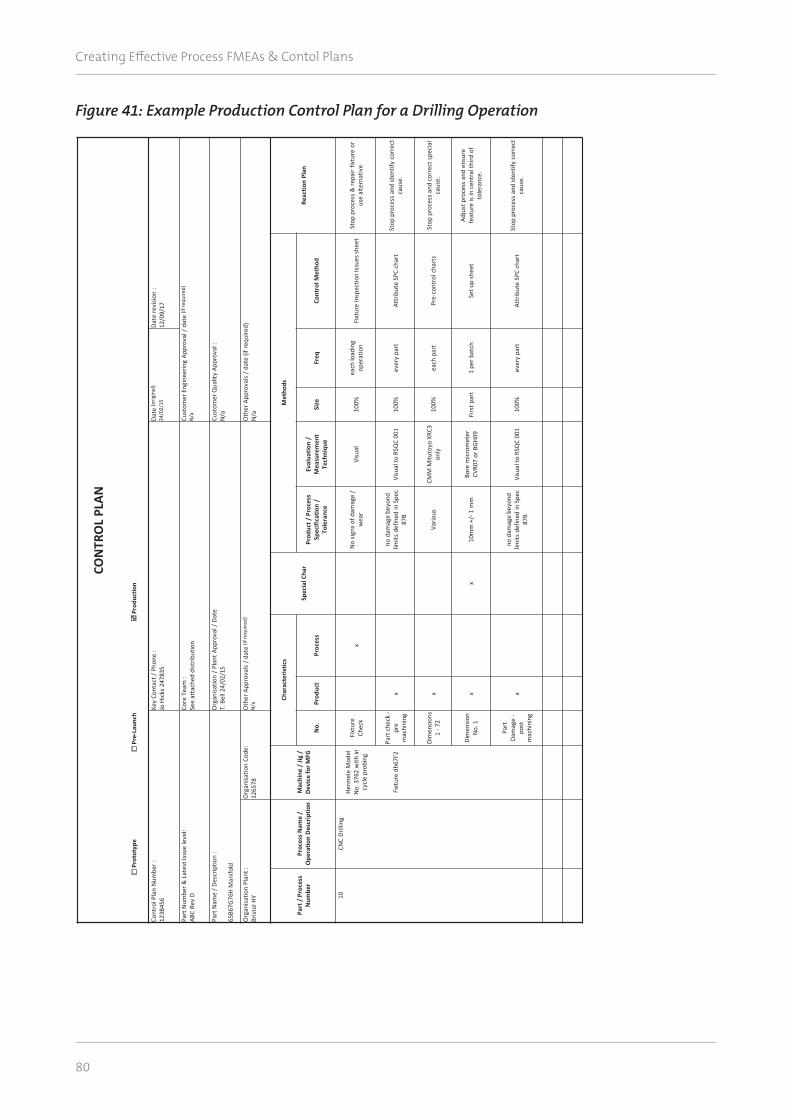
Creating Effective Process FMEAs & Contol Plans
80
Figure 41: Example Production Control Plan for a Drilling OperationCO
NTR
OL
PLAN
☐Pr
otot
ype
☐Pr
e-La
unch
Pr
oduc
tion
Cont
rol P
lan
Num
ber :
123B
456
Key
Cont
act /
Pho
ne :
Jo H
icks
247
835
Date
(orig
inal
)24
/02/
15Da
te re
visio
n :
12/0
9/17
Part
Num
ber &
Lat
est I
ssue
leve
l:AB
C Re
v D
Core
Tea
m :
See
atta
ched
dist
ribut
ion
Cust
omer
Eng
inee
ring
Appr
oval
/ d
ate
(if re
quire
d)N
/a
Part
Nam
e / D
escr
iptio
n :
65B6
7G76
H M
anifo
ld
Org
anisa
tion
/ Pla
nt A
ppro
val /
Dat
eT.
Bel
l 24/
02/1
5Cu
stom
er Q
ualit
y Ap
prov
al :
N/a
Org
anisa
tion
Plan
t :Br
istol
HY
Org
anisa
tion
Code
:12
6578
Oth
er A
ppro
vals
/ dat
e (if
requ
ired)
N/a
Oth
er A
ppro
vals
/ dat
e (if
requ
ired)
N/a
Part
/ P
roce
ss
Num
ber
Proc
ess N
ame
/ O
pera
tion
Des
crip
tion
Mac
hine
/ Ji
g /
Dev
ice
for M
FG
Char
acte
ristic
s
Spec
ial C
har
Met
hods
Reac
tion
Plan
No.
Prod
uct
Proc
ess
Prod
uct /
Pro
cess
Sp
ecifi
catio
n /
Tole
ranc
e
Eval
uatio
n /
Mea
sure
men
t Te
chni
que
Size
Freq
Cont
rol M
etho
d
10CN
C Dr
illin
gHe
rmel
e M
odel
N
o. 3
762
with
in
cycl
e pr
obin
g
Fixt
ure
Chec
kx
No
signs
of d
amag
e /
wea
rVi
sual
100%
each
load
ing
oper
atio
nFi
xtur
e In
spec
tion
Issu
es sh
eet
Stop
pro
cess
& re
pair
fixtu
re o
r us
e al
tern
ativ
e
Fixt
ure
dh67
F2Pa
rt c
heck
-pr
e m
achi
ning
xno
dam
age
beyo
nd
limits
def
ined
in S
pec
87B
Visu
al to
RSQ
C 00
110
0%ev
ery
part
Attr
ibut
e SP
C ch
art
Stop
pro
cess
and
iden
tify
corr
ect
caus
e.
Dim
ensio
ns
1 -7
2x
Vario
usCM
M M
ituto
yo X
RC3
only
100%
each
par
tPr
e-co
ntro
l cha
rts
Stop
pro
cess
and
cor
rect
spe
cial
ca
use.
Dim
ensio
n N
o. 1
xx
10m
m +
/-1
mm
Bore
mic
rom
eter
CV
R07
or B
GH0
9Fi
rst p
art
1 pe
r bat
chSe
t up
shee
tAd
just
pro
cess
and
ens
ure
feat
ure
is in
cen
tral
third
of
tole
ranc
e.
Part
Da
mag
e -
post
m
achi
ning
xno
dam
age
beyo
nd
limits
def
ined
in S
pec
87B
Visu
al to
RSQ
C 00
110
0%ev
ery
part
Attr
ibut
e SP
C ch
art
Stop
pro
cess
and
iden
tify
corr
ect
caus
e.
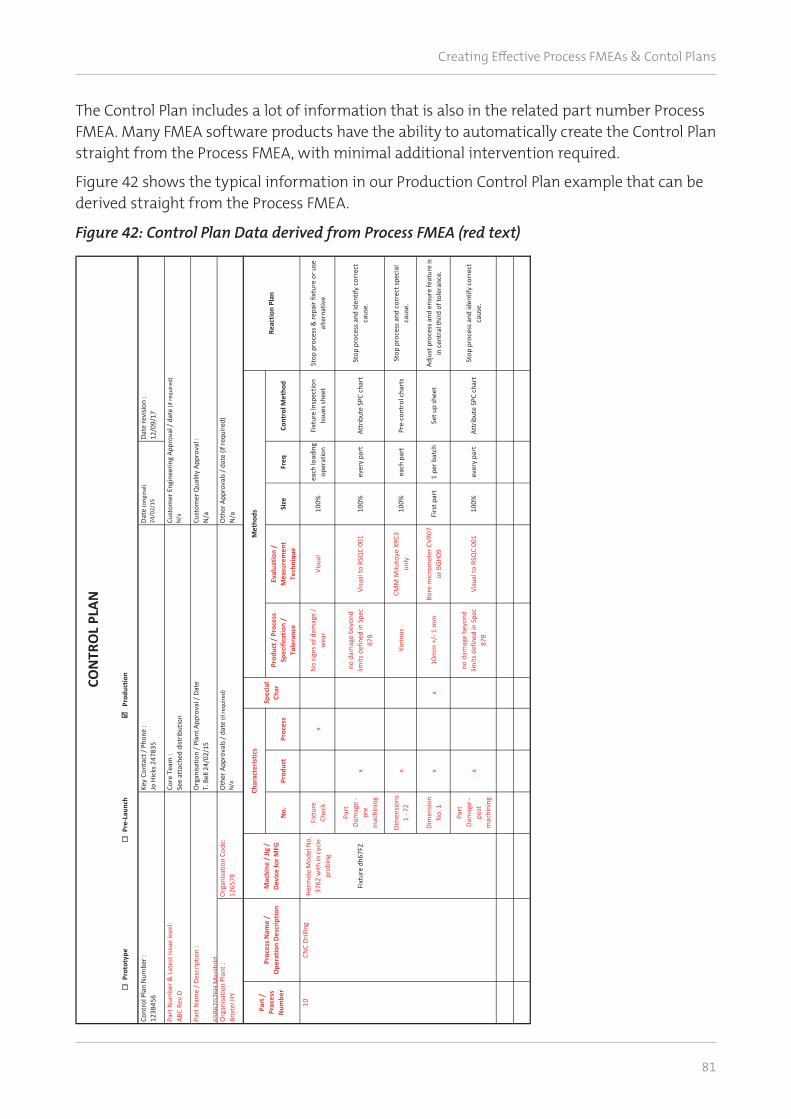
Creating Effective Process FMEAs & Contol Plans
81
The Control Plan includes a lot of information that is also in the related part number Process FMEA. Many FMEA software products have the ability to automatically create the Control Plan straight from the Process FMEA, with minimal additional intervention required.
Figure 42 shows the typical information in our Production Control Plan example that can be derived straight from the Process FMEA.
☐Pr
otot
ype
☐Pr
e-La
unch
Pr
oduc
tion
No.
Prod
uct
Proc
ess
Prod
uct /
Pro
cess
Sp
ecifi
catio
n /
Tole
ranc
e
Eval
uatio
n /
Mea
sure
men
t Te
chni
que
Size
Freq
Cont
rol M
etho
d
Herm
ele
Mod
el N
o.
3762
with
in c
ycle
pr
obin
g
Fixt
ure
Chec
kx
No
signs
of d
amag
e /
wea
rVi
sual
100%
each
load
ing
oper
atio
nFi
xtur
e In
spec
tion
Issue
s she
etSt
op p
roce
ss &
repa
ir fix
ture
or u
se
alte
rnat
ive
Fixt
ure
dh67
F2
Part
Da
mag
e -
pre
mac
hini
ng
xno
dam
age
beyo
nd
limits
def
ined
in S
pec
87B
Visu
al to
RSQ
C 00
110
0%ev
ery
part
Attr
ibut
e SP
C ch
art
Stop
pro
cess
and
iden
tify
corr
ect
caus
e.
Dim
ensio
ns
1 - 7
2x
Vario
usCM
M M
ituto
yo X
RC3
only
100%
each
par
tPr
e-co
ntro
l cha
rts
Stop
pro
cess
and
cor
rect
spec
ial
caus
e.
Dim
ensio
n N
o. 1
xx
10m
m +
/- 1
mm
Bore
mic
rom
eter
CVR
07
or B
GH09
Firs
t par
t1
per b
atch
Set u
p sh
eet
Adju
st p
roce
ss a
nd e
nsur
e fe
atur
e is
in c
entr
al th
ird o
f tol
eran
ce.
Part
Da
mag
e -
post
m
achi
ning
xno
dam
age
beyo
nd
limits
def
ined
in S
pec
87B
Visu
al to
RSQ
C 00
110
0%ev
ery
part
Attr
ibut
e SP
C ch
art
Stop
pro
cess
and
iden
tify
corr
ect
caus
e.
Part
Num
ber &
Lat
est I
ssue
leve
l:AB
C Re
v D
Core
Tea
m :
See
atta
ched
dist
ribut
ion
Cust
omer
Eng
inee
ring
Appr
oval
/ da
te (i
f req
uire
d)N
/a
CON
TRO
L PL
AN
Cont
rol P
lan
Num
ber :
123B
456
Key
Cont
act /
Pho
ne :
Jo H
icks
247
835
Date
(orig
inal
)24
/02/
15Da
te re
visio
n :
12/0
9/17
Part
Nam
e / D
escr
iptio
n :
65B6
7G76
H M
anifo
ld
Org
anisa
tion
/ Pla
nt A
ppro
val /
Dat
eT.
Bel
l 24/
02/1
5Cu
stom
er Q
ualit
y Ap
prov
al :
N/a
Org
anisa
tion
Plan
t :Br
istol
HY
Org
anisa
tion
Code
:12
6578
Oth
er A
ppro
vals
/ dat
e (if
requ
ired)
N/a
Oth
er A
ppro
vals
/ dat
e (if
requ
ired)
N/a
Reac
tion
Plan
10CN
C Dr
illin
g
Part
/
Proc
ess
Num
ber
Proc
ess N
ame
/ O
pera
tion
Desc
riptio
nM
achi
ne /
Jig
/ De
vice
for M
FG
Char
acte
ristic
s
Spec
ial
Char
Met
hods
Figure 42: Control Plan Data derived from Process FMEA (red text)
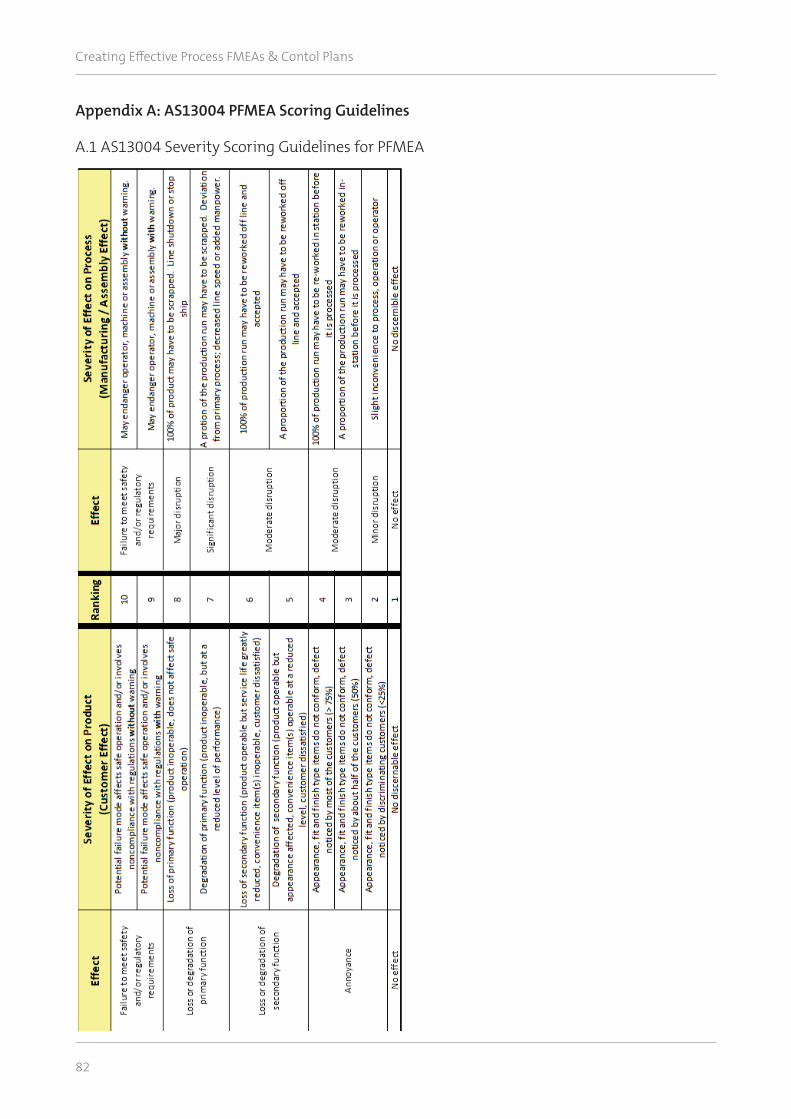
Creating Effective Process FMEAs & Contol Plans
82
Appendix A: AS13004 PFMEA Scoring Guidelines
A.1 AS13004 Severity Scoring Guidelines for PFMEA
Creating Effective Process FMEAs
P a g e | 77 of 83 1st Edition
Appendix A: Rolls-Royce PFMEA Scoring Guidelines
A.1 Severity Scoring Guidelines for PFMEA
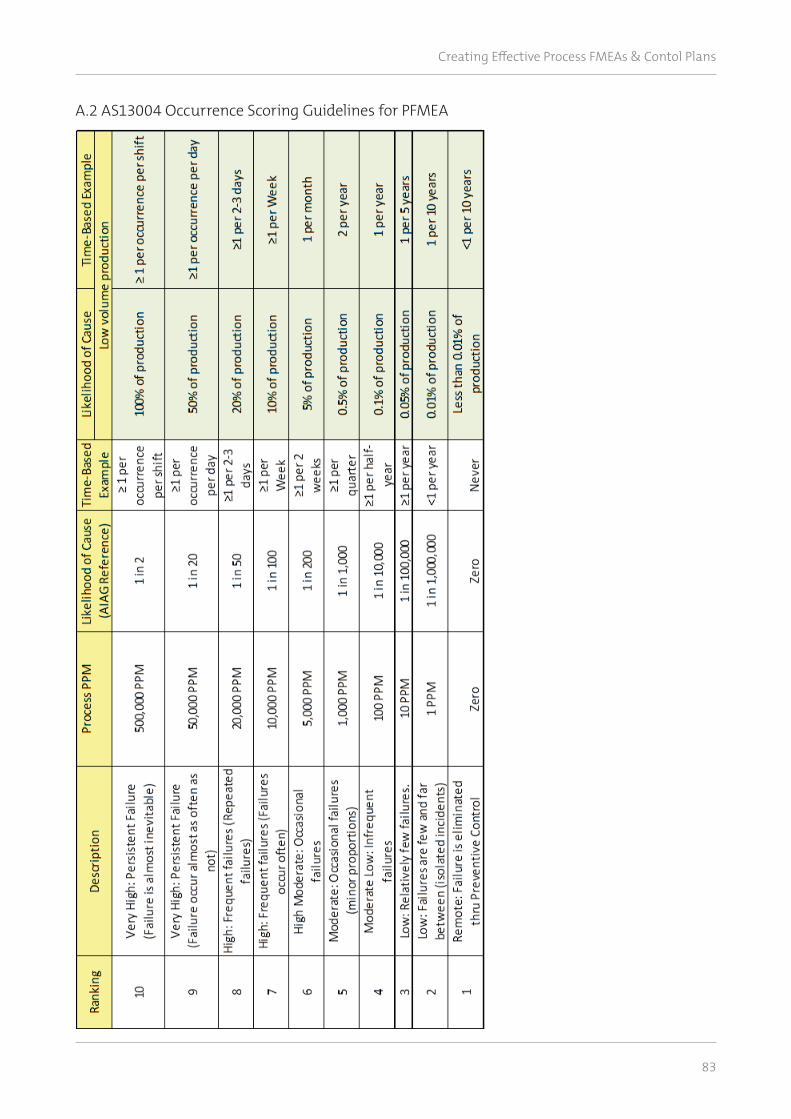
Creating Effective Process FMEAs & Contol Plans
83
A.2 AS13004 Occurrence Scoring Guidelines for PFMEA
Creating Effective Process FMEAs
P a g e | 78 of 83 1st Edition
A.2 Occurrence Scoring Guidelines for PFMEA
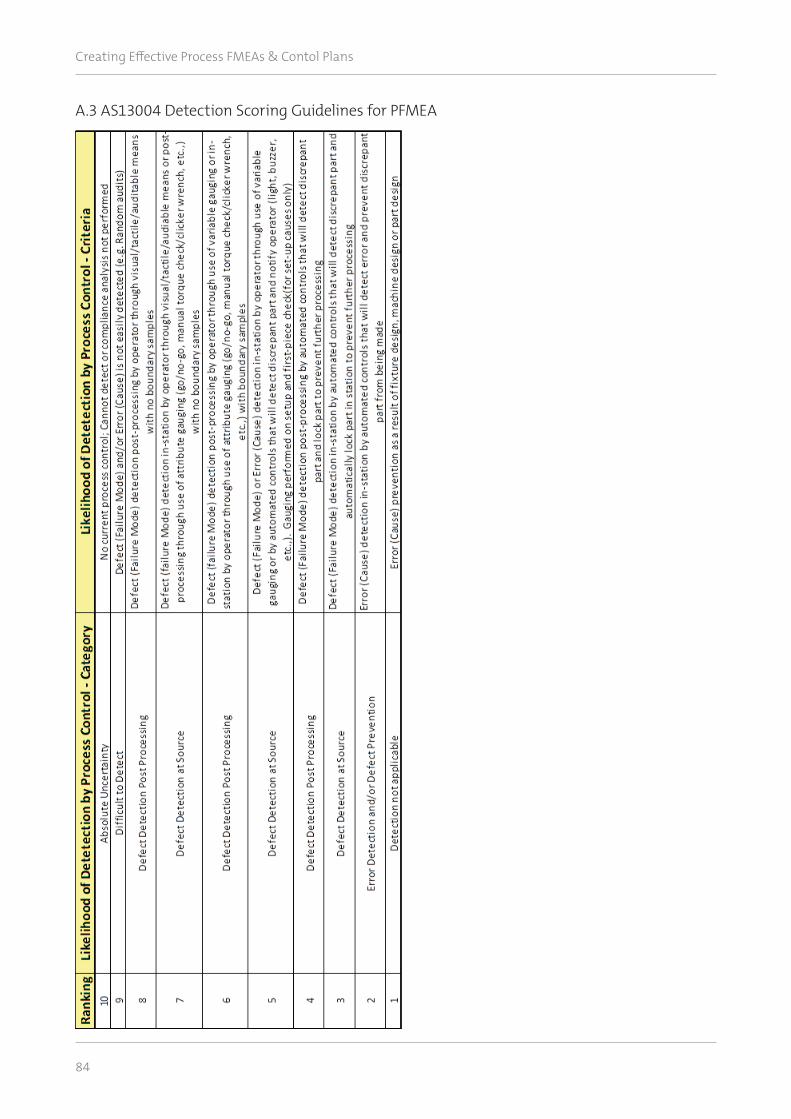
Creating Effective Process FMEAs & Contol Plans
84
A.3 AS13004 Detection Scoring Guidelines for PFMEA
Creating Effective Process FMEAs
P a g e | 79 of 83 1st Edition
A.3 Detection Scoring Guidelines for PFMEA
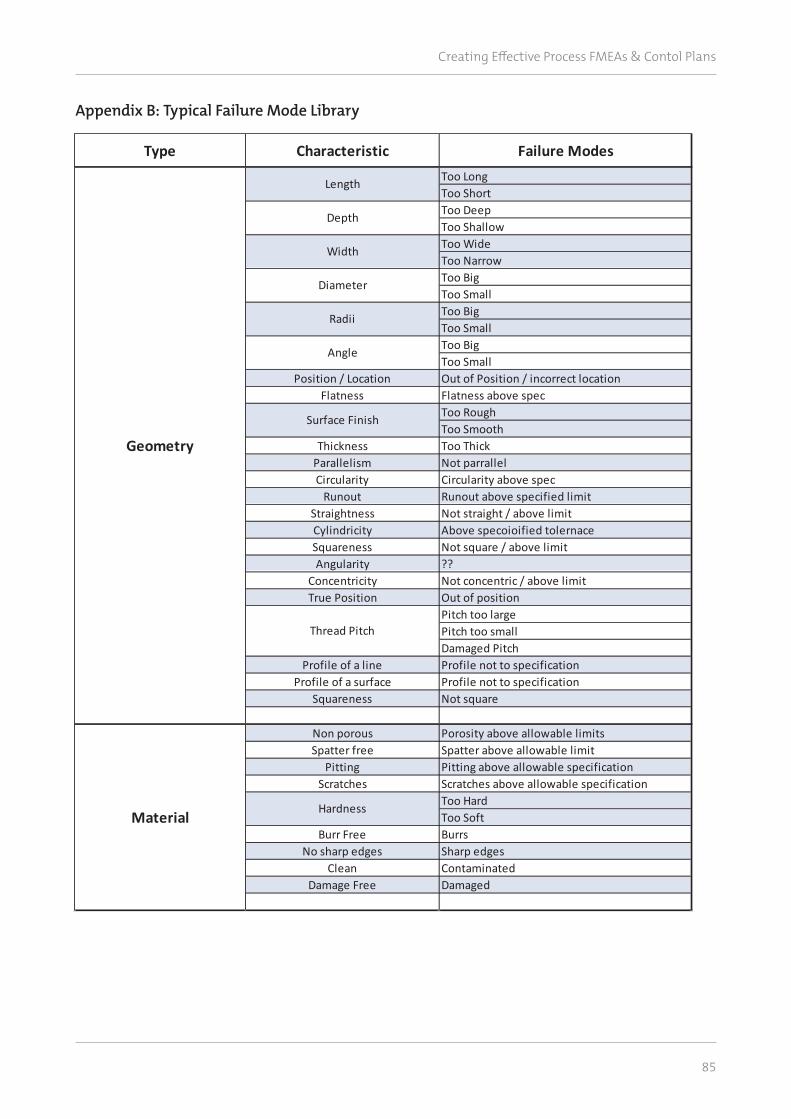
Creating Effective Process FMEAs & Contol Plans
85
Appendix B: Typical Failure Mode Library
Creating Effective Process FMEAs
P a g e | 81 of 83 1st Edition
Appendix B: Typical Failure Mode Library
Type Characteristic Failure ModesToo LongToo ShortToo DeepToo ShallowToo WideToo NarrowToo BigToo SmallToo BigToo SmallToo BigToo Small
Position / Location Out of Position / incorrect locationFlatness Flatness above spec
Too RoughToo Smooth
Thickness Too ThickParallelism Not parrallelCircularity Circularity above spec
Runout Runout above specified limitStraightness Not straight / above limitCylindricity Above specoioified tolernaceSquareness Not square / above limitAngularity ??
Concentricity Not concentric / above limitTrue Position Out of position
Pitch too largePitch too smallDamaged Pitch
Profile of a line Profile not to specificationProfile of a surface Profile not to specification
Squareness Not square
Non porous Porosity above allowable limitsSpatter free Spatter above allowable limit
Pitting Pitting above allowable specificationScratches Scratches above allowable specification
Too HardToo Soft
Burr Free BurrsNo sharp edges Sharp edges
Clean ContaminatedDamage Free Damaged
Hardness
Geometry
Material
Length
Depth
Width
Diameter
Radii
Angle
Surface Finish
Thread Pitch
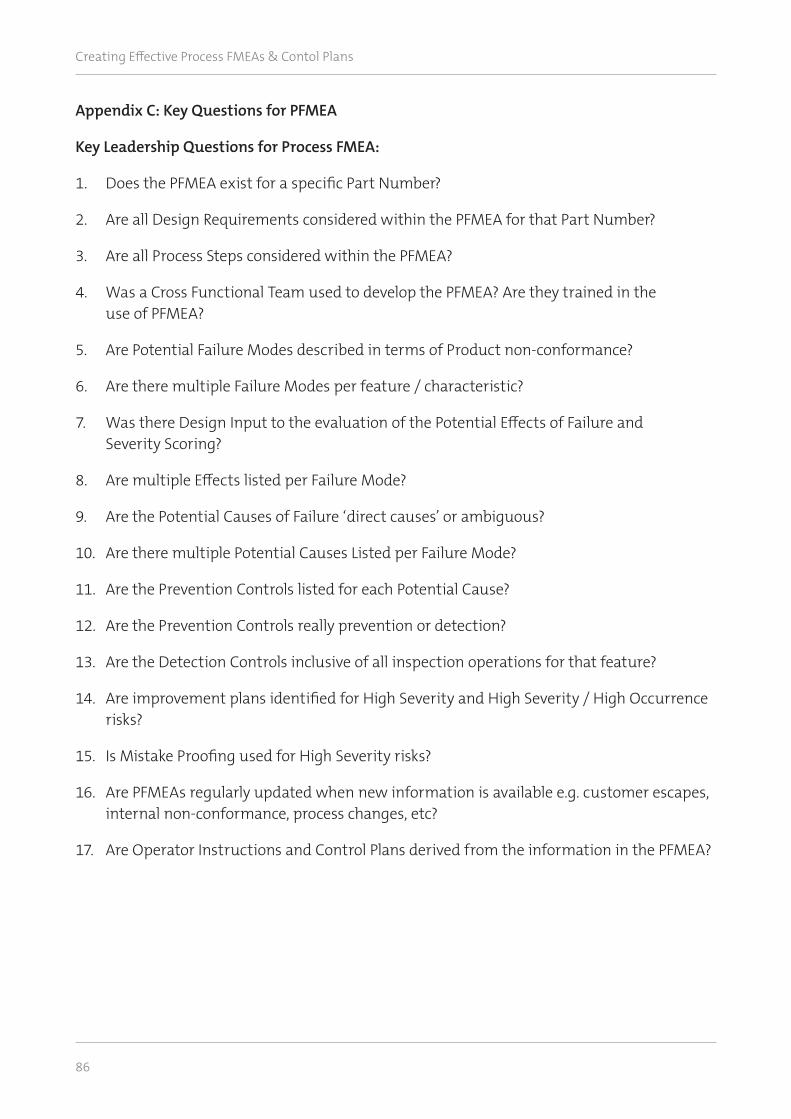
Creating Effective Process FMEAs & Contol Plans
86
Appendix C: Key Questions for PFMEA
Key Leadership Questions for Process FMEA:
1. Does the PFMEA exist for a specific Part Number?
2. Are all Design Requirements considered within the PFMEA for that Part Number?
3. Are all Process Steps considered within the PFMEA?
4. Was a Cross Functional Team used to develop the PFMEA? Are they trained in the use of PFMEA?
5. Are Potential Failure Modes described in terms of Product non-conformance?
6. Are there multiple Failure Modes per feature / characteristic?
7. Was there Design Input to the evaluation of the Potential Effects of Failure and Severity Scoring?
8. Are multiple Effects listed per Failure Mode?
9. Are the Potential Causes of Failure ‘direct causes’ or ambiguous?
10. Are there multiple Potential Causes Listed per Failure Mode?
11. Are the Prevention Controls listed for each Potential Cause?
12. Are the Prevention Controls really prevention or detection?
13. Are the Detection Controls inclusive of all inspection operations for that feature?
14. Are improvement plans identified for High Severity and High Severity / High Occurrence risks?
15. Is Mistake Proofing used for High Severity risks?
16. Are PFMEAs regularly updated when new information is available e.g. customer escapes, internal non-conformance, process changes, etc?
17. Are Operator Instructions and Control Plans derived from the information in the PFMEA?


© 2017 Rolls-Royce plc The information in this document is the property of Rolls-Royce plc and may not be copied or communicated to a third party, or used for any purpose other than that for which it is supplied without the express written consent of Rolls-Royce plc.
This information is given in good faith based upon the latest information available to Rolls-Royce plc, no warranty or representation is given concerning such information, which must not be taken as establishing any contractual or other commitment binding upon Rolls-Royce plc or any of its subsidiary or associated companies.
www.rolls-royce.com Version 3.0, November 2017