Proceedings of the World Congress on Engineering 2017 … · Proceedings of the World Congress on...
5
Tananop Piemsinlapakunchon, and Manosh C. Paul Proceedings of the World Congress on Engineering 2017 Vol II WCE 2017, July 5-7, 2017, London, U.K. ISBN: 978-988-14048-3-1 ISSN: 2078-0958 (Print); ISSN: 2078-0966 (Online) WCE 2017
Transcript of Proceedings of the World Congress on Engineering 2017 … · Proceedings of the World Congress on...

Tananop Piemsinlapakunchon, and Manosh C. Paul
Proceedings of the World Congress on Engineering 2017 Vol II WCE 2017, July 5-7, 2017, London, U.K.
ISBN: 978-988-14048-3-1 ISSN: 2078-0958 (Print); ISSN: 2078-0966 (Online)
WCE 2017

is 0.8 cm above the air inlet. This setup takes into account
the effect of fuel tube on the flow of co-flow air due to
different level between the co-flow air inlet and fuel inlet (8
mm).
In terms of boundary condition, the top and left planes are
defined as a pressure boundary. Pressure and temperature at
these boundaries are 101325 Pa and 298 K respectively.
Right plane is set as axis. Fuel and co-flow air inlet are
velocity inlet boundary. Profile of the fuel stream is
parabolic while one of the co-flows is bulk profile. Both
streams are injected at an equal average velocity of 50 cm/s
and temperature of 298 K. Vertical plane connected between
the fuel and co-flow air inlets is a wall boundary with
temperature of 298 K.
Non-uniform mesh is generated through a hyperbolic
function. The smallest cell size is 2×10⁻⁴ m and is located at
the outer of fuel tube and the same level as fuel exit. The
number of grid points in the vertical direction is 500 and 24
from the smallest cell position to the top plane and co-flow
inlet respectively. In the horizontal direction, 50 and 16 are
used from the smallest cell location to the left outlet plane
and axis. A total of 17,950 cells is produced based on this
setup which is illustrated in Fig. 1(b).
III. GOVERNING EQUATIONS
The governing equations are presented as follows:
Continuity equation
𝜕𝜌
𝜕𝑡+ 𝜌𝑉 = 0
(
1)
Momentum equation
𝜕(𝜌𝑉 )
𝜕𝑡+ ∇ ∙ 𝜌𝑉 𝑉 = −∇𝑝 + ∇ ∙ 𝜏 + 𝜌𝑔
(
2)
Where
𝜏 = 𝜇[∇𝑉 + 𝑉 𝑇 −2
3∇𝑉 𝐼]
Species transport equation
𝜕(𝜌𝑉 )
𝜕𝑡+ ∇ ∙ 𝜌𝑉 𝑌𝑖 = −∇𝐽𝑖 + 𝑅𝑖 + 𝑆𝑖
(3
)
Energy equation
∇ ∙ 𝑉 𝜌𝐸 + 𝑝 = ∇ ∙ (𝑘∇𝑇 − 𝑗 𝐽 𝑗 + (𝜏 ∙ 𝑉 ))
𝑗
+ 𝑆 (
4)
Where
𝐸 = −𝑝
𝜌+
𝑣2
2 and = 𝑌𝑗𝑗𝑗
Multi component diffusion is considered as well as
thermal diffusion as shown in (5). The previous one is
computed through Maxwell-Stefan equation while the later
one is calculated by Warnatz model. Details of them can be
found in [7] and [8].
𝐽 𝑖 = −𝜌 𝐷𝑖,𝑗∇
𝑁
𝑗=1
𝑌𝑗 − 𝜌𝐷𝑇,𝑖
𝑇𝛻𝑇
(
5)
Dynamic viscosity and thermal conductivity are defined
by Chapman-Enskong method and kinetic theory
respectively. These are illustrated in (6) and (7).
𝜇𝑖 = 2.6693 × 10⁻⁶ 𝑀𝑖𝑇
𝜎𝑖2𝛺(𝑇∗)
(6)
𝜆𝑖 =𝜇𝑖𝑀𝑖 𝑓𝑡𝑟𝑎𝑛 𝐶𝑣,𝑡𝑟𝑎𝑛 + 𝑓𝑟𝑜𝑡𝐶𝑣,𝑟𝑜𝑡 + 𝑓𝑣𝑖𝑏𝐶𝑣,𝑣𝑖𝑏 (7)
Participating media radiation model is selected for
computing radiation. Discrete Ordinates Method (DOM) is
utilized for solving the radiation transport equation [7].
Absorption coefficient is calculated through weight sum of
grey gas model (WSGG). Total absorptivity of several grey
gases is approximated as shown in (8). The medium is
assumed to consist of different fractions of grey gases with
different absorption coefficients. CO2 and H2O are assumed
to dominate cloud emission and absorption among the
combustion gas products.
𝛼 ≈ 𝑎𝑘(1 − 𝑒−𝐾𝑘𝑆)
𝐾
𝑘=0
(
8)
The medium is assumed to be optically thin. Optical path
length (𝑆) is defined as:
𝑆 = 3.6𝑉𝑜𝑙𝑢𝑚𝑒 𝑜𝑓 𝑡𝑒 𝑑𝑜𝑚𝑎𝑖𝑛
𝑠𝑢𝑟𝑓𝑎𝑐𝑐𝑒 𝑎𝑟𝑒𝑎 𝑜𝑓 𝑑𝑜𝑚𝑎𝑖𝑛
(
9)
GRI3 reaction mechanism containing 53 species and 325
reactions is selected and the governing equations are solved
by using STAR-CCM CFD software.
IV. VALIDATION OF MODELLING RESULT
All the H2/N2 flames presented in [6] are simulated by the
generated model, and the experimental and numerical results
of [8] are initially compared with the numerical results of
our model. Well agreement is obtained from the comparison
on species (H2, N2, O2, and H2O) and temperature profiles.
This confirms the reliability and accuracy of the GRI3
chemistry mechanisms and newly generated CFD model,
thus the simulations of other flames having different fuel
compositions are proceed with full confidence.
V. SIMULATION SETUP
To investigate the effect of H2, CO, and CH4 on the flame
characteristics, flames having various volume fraction of
these species are simulated. Details of these flames are
presented in Table 1. For syngas flame, volume fraction of
H2 and CO are varied between 25 and 75 % whereas volume
percentage of CH4 is set as 10 – 20% in the syngas-CH4
flame. Pure H2 and pure CH4 are formulated for assessing
the performance of syngas and syngas-CH4 flames. Average
velocity of fuel and co-flow air are set equally as 0.5 ms-1
for all the flames. This flow condition will maintain a
volume flow rate of injected fuel of 31.8 cm3s-1 respectively.
TABLE 1 SIMULATED FLAMES
Flame H2 (%) CO (%) CH4 (%) 𝜌 (kg-m-3)
A 100 0 0 0.0824
B 75 25 0 0.3480
C 50 50 0 0.6139
D 25 75 0 0.8790
E 45 45 10 0.6224
F 40 40 20 0.6182
G 0 0 100 0.6560
Proceedings of the World Congress on Engineering 2017 Vol II WCE 2017, July 5-7, 2017, London, U.K.
ISBN: 978-988-14048-3-1 ISSN: 2078-0958 (Print); ISSN: 2078-0966 (Online)
WCE 2017
VI. RESULTS AND DISCUSSION
A. Flame structure, temperature and heat release
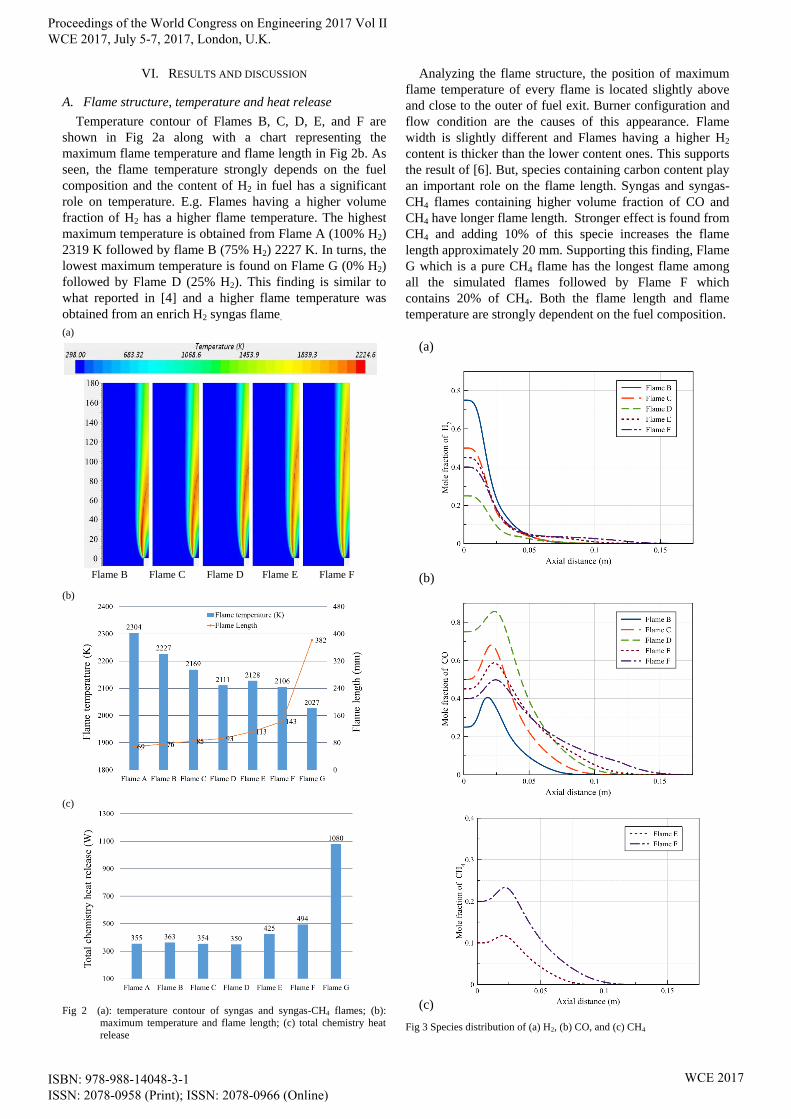
Temperature contour of Flames B, C, D, E, and F are
shown in Fig 2a along with a chart representing the
maximum flame temperature and flame length in Fig 2b. As
seen, the flame temperature strongly depends on the fuel
composition and the content of H2 in fuel has a significant
role on temperature. E.g. Flames having a higher volume
fraction of H2 has a higher flame temperature. The highest
maximum temperature is obtained from Flame A (100% H2)
2319 K followed by flame B (75% H2) 2227 K. In turns, the
lowest maximum temperature is found on Flame G (0% H2)
followed by Flame D (25% H2). This finding is similar to
what reported in [4] and a higher flame temperature was
obtained from an enrich H2 syngas flame.
(a)
Flame B Flame C Flame D Flame E Flame F
(b)
(c)
Fig 2 (a): temperature contour of syngas and syngas-CH4 flames; (b):
maximum temperature and flame length; (c) total chemistry heat
release
Analyzing the flame structure, the position of maximum
flame temperature of every flame is located slightly above
and close to the outer of fuel exit. Burner configuration and
flow condition are the causes of this appearance. Flame
width is slightly different and Flames having a higher H2
content is thicker than the lower content ones. This supports
the result of [6]. But, species containing carbon content play
an important role on the flame length. Syngas and syngas-
CH4 flames containing higher volume fraction of CO and
CH4 have longer flame length. Stronger effect is found from
CH4 and adding 10% of this specie increases the flame
length approximately 20 mm. Supporting this finding, Flame
G which is a pure CH4 flame has the longest flame among
all the simulated flames followed by Flame F which
contains 20% of CH4. Both the flame length and flame
temperature are strongly dependent on the fuel composition.
(a)
(b)
(c)
Fig 3 Species distribution of (a) H2, (b) CO, and (c) CH4
Proceedings of the World Congress on Engineering 2017 Vol II WCE 2017, July 5-7, 2017, London, U.K.
ISBN: 978-988-14048-3-1 ISSN: 2078-0958 (Print); ISSN: 2078-0966 (Online)
WCE 2017

The total chemistry heat release from all the Flame cases
is presented in Fig 2(c). The highest chemistry heat release
is found on Flame G (1080 W) followed by Flame F (494
W). Chemistry heat release of the syngas flame can be
considered as comparable. Though their flame dimension
and fuel composition are different, all syngas flames release
similar amount of heat between 354 and 363 W. Longer
flame length compensates with lower flame temperature.
This thus causes the syngas flames having lower
temperature (with higher content of CO) providing similar
amount of heat.
Moreover, this amount is similar to the chemistry heat
release of pure H2 flame (355 W). As longer flame can also
provide higher heat release, Flame E, F, and G containing
higher amount of CH4 with having significant longer flame
than syngas flame can provide significant higher heat
release compared to syngas and pure H2 flame. Addition of
10 % of CH4 to syngas increases approximately 70 W of
chemistry heat release. This amount is about 20 %
escalation.
B. Species distribution
Axial profile of H2, CO and CH4 of Flames B, C, D, E,
and F are shown in Fig. 3(a-c). Mole fraction of H2 is
significantly reduced along the axis and approaches zero at
location under the flame front. This high reduction gradient
at the distance close to the fuel exit refers to a fast burning
rate of H2. Shorter flame length with a having higher H2
content is the result of this phenomenon.
Profile of CO however increases significantly to the peak
value, which is approximately 0.1-0.18 of the mole fraction
above the CO volume fraction in fuel, then reduces
meaningfully to reach zero mole fraction at location slightly
under the flame front. Lower reduction gradient is resulted
comparing to the profile of H2 which represents a slower
burning rate of CO compared to H2. It suggests a longer
axial distance is required in order to fully consume the CO
content. This leads to the longer flame length of syngas
having a higher volume fraction of CO.
Fig 4 Production rate and maximum concentration of CO2
Profile of CH4 is similar to CO as both are carbon fuel
species. Mole fraction increases from the injected value to a
peak value which is approximately 0.12 and 0.24 in Flame E
and F respectively. Slow burning rate of CH4 can also be
seen after the peak position. Consumption of 20% volume
fraction of CH4 requires a similar distance of 75% of CO.
This results in a strong effect of CH4 content in fuel
composition on the flame dimension. The other effect of
CH4 is on the extension of distance required for fully
consumption of CO. Analysis of the CO and CH4 profiles of
Flames C, E, and F projects the change of consumption rate
of CO when content of CH4 is added.
It is shown in Fig. 4 that the CO2 formation, production
rate and maximum concentration of CO2 depend strongly on
the CO content in fuel. Higher volume fraction of CO
increases the production rate of CO2 and produces the
higher peak concentration of CO2. The highest maximum
rate and peak concentration is computed from Flame D
which contains 75% of CO. The second highest rate is
resulted from Flame C which contains 50% CO in the fuel
composition. Direct proportion can be considered for a
relation between the volume fraction of CO and CO2
formation.
VII. CONCLUSION
Effect of fuel composition on the characteristics and
emission from the co-flow laminar diffusion flames of
syngas, syngas-CH4, pure H2 and pure methane are studied.
Finite rate chemistry model along with multi-component
diffusion, thermal diffusion, and radiation model are
selected. Following key conclusions can be drawn from the
findings:
(i) Content of H2 has a significant role on the flame
temperature and dimension. Flames having a higher volume
fraction of H2 have a higher flame temperature with a wider,
and shorter dimension. Effect on the dimension is found to
be the faster burning property of H2 comparing to that of
CO and CH4.
(ii) Lower burning rate of CO than H2 leads to the
longer flame dimension of syngas with a higher volume
fraction of CO. This effect provides similar total chemistry
heat release of enrich-CO flame to enrich-H2 which has a
higher flame temperature. Longer flame dimension results in
more area of grid generating heat release. This finally
increases the total heat release.
(iii) CH4 is found to have the slowest burning rate along
the axis. This property causes flame having higher content
of CH4 thus taking longer distance to be fully consumed.
Significantly long flame length is the result. Similar to CO,
the longer flame length compensates the lower flame
temperature of CH4. This causes the higher CH4 content
flame having a higher heat release and heat flux. Moreover,
lower flame temperature property of CH4 can reduce
emission amount from syngas as H2 and CO content are
reduced from fuel composition.
NOMENCLATURE
Uppercase letters
𝐶𝑣 Contribution to the molar specific heat of each specie
𝐷𝑡 ,𝑖 Thermal diffusion coefficient
𝐷𝑖 ,𝑗 Molecular diffusivity of multi component gases
𝐹𝑘 ,𝑗 Diffusive flux component
𝐼 Unit tensor
𝐽 Diffusive flux
𝐾𝑘 Absorption coefficient of each grey gases
𝐾 Total number of grey gases
M Molecular weight
Proceedings of the World Congress on Engineering 2017 Vol II WCE 2017, July 5-7, 2017, London, U.K.
ISBN: 978-988-14048-3-1 ISSN: 2078-0958 (Print); ISSN: 2078-0966 (Online)
WCE 2017
𝑆 Optical path length
𝑆 Heat due to chemical reaction and radiation
𝑇 Temperature
𝑇∗ Reduced temperature
𝑉 Velocity
𝑌 Mass fraction
Greek letters
𝜌 Fluid density
𝜎 Collision diameter
𝜏 Viscous stress tensor
𝜇 Molecular viscosity
𝛺 Collision integral
𝜆 Thermal conductivity
Lowercase letters
𝑎𝑘 Weight factor
𝑔 Gravitational acceleration
Specific enthalpy
𝑘 Thermal conductivity coefficient
𝑝 Pressure
𝑡 Time
v Velocity
Subscripts
i component i
j Specie j
k Specie k
tran Translation
rot Rotation
vib Vibration
avg Average
ACKNOWLEDGEMENT
The lead author would like to express his gratitude to
Royal Thai Navy for supporting his Phd research at
University of Glasgow.
REFERENCES
[1] J. Park, D. S. Bae, M. S. Cha, J. H. Yun, S. I. Keel, H. Chang Cho, T.
K. Kim and J. S. Ha, "Flame characteristics in H2/CO synthetic gas
diffusion flames diluted with CO2: Effects of radiative heat loss and
mixture composition," International Journal of Hydrogen Energy, vol.
33, no. 23, pp. 7256-7264, 2008.
[2] J. Park, O. B. Kwon, J. H. Yun, S. I. Keel, H. Chang Cho and S. Kim,
"Preferential diffusion effects on flame characteristics in H2/CO
syngas diffusion flames diluted with CO2," International Journal of
Hydrogen Energy, vol. 33, no. 23, pp. 7286-7294, 2008.
[3] S. Hsin-Yi , H. Jou-Rong and L. Yu-Heng , "Computed flammability
limits of opposed-jet H2/CO syngas diffusion flames," International
Journal of Hydrogen Energy, vol. 39, no. 7, pp. 3459-3468, 2014.
[4] A. Cuoci, A. Frassoldati, G. Buzzi Ferraris, T. Faravelli and E. Ranzi,
"The ignition, combustion and flame structure of carbon
monoxide/hydrogen mixtures. Note 2: Fluid dynamics and kinetic
aspects of syngas combustion," International Journal of Hydrogen
Energy, vol. 32, no. 15 , pp. 3486-3500, 2007.
[5] K. Ranga Dinesh, X. Jiang, M. Kirkpatrick and W. Malalasekera,
"Combustion characteristics of H2/N2 and H2/CO syngas nonpremixed
flames," International Journal of Hydrogen Energy, vol. 37, no. 21, pp.
16186-16200, 2012.
[6] V. V. Toro, A. V. Mokhov, H. B. Levinsky and M. D. Smooke,
"Combined experimental and computational study of laminar,
axisymmetric hydrogen–air diffusion flames," Proceedings of the
Combustion Institute, vol. 30, no. 1, pp. 485-492, 2005.
[7] cd-adapco, "STAR CCM+ version 11 User guide," Cd-adapco, 2016.
[Online]. Available: https://stevedocs.cd-adapco.com/
[8] J. Warnatz, U. Maas and R. W. Dibble, Combustion: Physical and
Chemical Fundamentals, Modeling and Simulation, Experiments,
Pollutant Formation, Berlin, Germany: Springer, 2006.
Proceedings of the World Congress on Engineering 2017 Vol II WCE 2017, July 5-7, 2017, London, U.K.
ISBN: 978-988-14048-3-1 ISSN: 2078-0958 (Print); ISSN: 2078-0966 (Online)
WCE 2017