Proceedings of the Workshop on Interactive and … L. Forcada (Universitat d'Alacant) ... Daniel...
70
amta2014.amtaweb.org Vancouver, BC October 22-26 WORKSHOP A MT 2014 A e 11th Conference of the Association for Machine Translation in the Americas Workshop on Interactive and Adaptive Machine Translation Francisco Casacuberta Marcello Federico Philipp Koehn
Transcript of Proceedings of the Workshop on Interactive and … L. Forcada (Universitat d'Alacant) ... Daniel...

amta2014.amtaweb.org
Vancouver, BCOctober 22-26
WORKSHOP
AMT2014
A
The 11th Conference of the Association for Machine Translation in the Americas
Workshop on Interactive and Adaptive Machine Translation
Francisco CasacubertaMarcello Federico
Philipp Koehn

The 11th Conference of the Association for Machine Translation in the Americas
October 22 – 26, 2014 -- Vancouver, BC Canada
Proceedings of the
Workshop on
Interactive and Adaptive Machine Translation
Francisco Casacuberta, Marcello Federico, and Philipp Koehn (Eds.)
Association for Machine Translation in the Americas
http://www.amtaweb.org

Supported by the European Commissionunder the Matecat and CASMACAT projects(grants 287688 and 287576).
ii

Preface
The increasing use of machine translation in the workflow of professional translators creates demandfor machine translation technology that provides more interactive collaboration, learns from its errorsand adapts to the translators’ style and adapts the underlying machine translation system online to thespecific needs of the translator for the given task.
The next generation of computer aided translation (CAT) tools has to move beyond the use of staticmachine translation for human post-editing into a much richer division of labor between man andmachine that takes full advantage of man’s understanding of content and machine’s greater ability toquickly process large amounts of data.
On the other hand, these tools will allow a more friendly interaction between the human and the machinethrough the use of different modalities of interactions as speech, gaze tracking, e-pen, etc. Finally, allof these issues will lead to an increase of the productivity of the professional translators.
Such tools are in development in a number of research labs across the world, one example is the opensource workbench developed by the EU-funded projects Matecat and Casmacat, led by the organizersof this workshop.
This workshop brings to together researchers in this nascent subfield of machine translation. Theworkshop will divide its schedule between invited talks by leading researchers and paper presentationson more recent advances.
The workshop features 7 invited talks, and 6 poster presentation selected from 8 submissions.
Vancouver, October 2014
Francisco Casacuberta, Universitat Politècnica de ValènciaMarcello Federico, Fondazione Bruno KesslerPhilipp Koehn, University of Edinburgh / Johns Hopkins University
iii

Organizers:
Francisco Casacuberta, Universitat Politècnica de ValènciaMarcello Federico, Fondazione Bruno KesslerPhilipp Koehn, University of Edinburgh / Johns Hopkins University
Program Committee:
Vicent Alabau (Universitat Politècnica de València)Loïc Barrault (Université du Maine)Frédér Blain (Université du Maine)Christian Buck (University of Edinburgh)Chris Dyer (Carnegie Mellon University)Mikel L. Forcada (Universitat d’Alacant)George Foster (National Research Council, Canada)Jesús González-Rubio (Universitat Politècnica de València)Roland Kuhn (National Research Council, Canada)Mauro Cettolo (Fondazione Bruno Kessler)Matteo Negri (Fondazione Bruno Kessler)Jan Niehues (Karlsruhe Institute of Technology)Daniel Ortiz-Martínez (Universitat Politècnica de València)Juan Antonio Pérez-Ortiz (Universitat d’Alacant)Holger Schwenk (Université du Maine)Patrick Simianer (Universität Heidelberg)Lucia Specia (University of Sheffield)Marco Turchi (Fondazione Bruno Kessler)Enrique Vidal (Universitat Politècnica de València)Katharina Wäschle (Universität Heidelberg)François Yvon (LIMSI/CNRS, Orsay)
Invited Speakers:
Michael Denkowski, CMUMarcello Federico, FBKJesús González-Rubio, Universitat Politècnica de ValènciaSpence Green, StanfordJohn Moran, Trinity College / CNGLLane Schwartz, University of Illinois at Urbana-ChampaignMichel Simard, National Research Council Canada
iv

Table of Contents
Integrating Online and Active Learning in a Computer-Assisted Translation WorkbenchVicent Alabau, Jesús González-Rubio, Daniel Ortiz-Martínez, Germán Sanchis Trilles, Francisco
Casacuberta, Mercedes García-Martínez, Bartolomé Mesa-Lao, Dan Cheung Petersen, Barbara Drag-sted and Michael Carl . . . . . . . . . . . . . . . . . . . . . . . . . . . . . . . . . . . . . . . . . . . . . . . . . . . . . . . . . . . . . . . . . . . . . . . . 1
Towards a Combination of Online and Multitask Learning for MT Quality Estimation: a PreliminaryStudy
José G. C. de Souza, Marco Turchi and Matteo Negri . . . . . . . . . . . . . . . . . . . . . . . . . . . . . . . . . . . . . . . 9
Dynamic Phrase Tables for Machine Translation in an Interactive Post-editing ScenarioUlrich Germann . . . . . . . . . . . . . . . . . . . . . . . . . . . . . . . . . . . . . . . . . . . . . . . . . . . . . . . . . . . . . . . . . . . . . . . 20
Optimized MT Online Learning in Computer Assisted TranslationPrashant Mathur and Cettolo Mauro . . . . . . . . . . . . . . . . . . . . . . . . . . . . . . . . . . . . . . . . . . . . . . . . . . . . . 32
Behind the Scenes in an Interactive Speech Translation SystemMark Seligman and Mike Dillinger . . . . . . . . . . . . . . . . . . . . . . . . . . . . . . . . . . . . . . . . . . . . . . . . . . . . . . 42
Predicting Post-Editor Profiles from the Translation ProcessKaran Singla, David Orrego Carmona, Ashleigh Rhea Gonzales, Michael Carl and Srinivas Ban-
galore . . . . . . . . . . . . . . . . . . . . . . . . . . . . . . . . . . . . . . . . . . . . . . . . . . . . . . . . . . . . . . . . . . . . . . . . . . . . . . . . . . . . . 51
v

Conference Program
Wednesday, October 22, 2014
8:45am Opening of the Workshop
Invited Talks
9am Measuring Translation Productivity Offline — Some commercial challenges andresearch opportunities apparent from the iOmegaT projectJohn Moran, Trinity College / CNGL
9:30am Mixed-initiative Human Language TranslationSpence Green, Stanford
10am Online and Active Learning for Machine Translation and Computer-Assisted Trans-lationJesús González-Rubio, Universitat Politècnica de València
10:30am Coffee Break
Invited Talks
11am Translators, Machine Translation and TrustMichel Simard, National Research Council Canada
11:30am Learning from Post-Editing: Real Time Model Adaptation for Machine TranslationMichael Denkowski, CMU
12pm User-Adaptative MT in the MateCat ToolMarcello Federico, FBK
12:30pm The Human Language ModelLane Schwartz, University of Illinois at Urbana-Champaign
1pm Lunch
2:30pm Panel Discussion
3:30pm Coffee Break
vi
Wednesday, October 22, 2014 (continued)
Poster Session
4pm-5:30pm Integrating Online and Active Learning in a Computer-Assisted Translation WorkbenchVicent Alabau, Jesús González-Rubio, Daniel Ortiz-Martínez, Germán Sanchis Trilles,Francisco Casacuberta, Mercedes García-Martínez, Bartolomé Mesa-Lao, Dan CheungPetersen, Barbara Dragsted and Michael Carl
Towards a Combination of Online and Multitask Learning for MT Quality Estimation: aPreliminary StudyJosé G. C. de Souza, Marco Turchi and Matteo Negri
Dynamic Phrase Tables for Machine Translation in an Interactive Post-editing ScenarioUlrich Germann
Optimized MT Online Learning in Computer Assisted TranslationPrashant Mathur and Cettolo Mauro
Behind the Scenes in an Interactive Speech Translation SystemMark Seligman and Mike Dillinger
Predicting Post-Editor Profiles from the Translation ProcessKaran Singla, David Orrego Carmona, Ashleigh Rhea Gonzales, Michael Carl and SrinivasBangalore
vii


Proceedings of the Workshop on Interactive and Adaptive Machine Translation, pages 1–8AMTA Workshop. Vancouver, Canada. September 22, 2014
Integrating Online and Active Learning in aComputer-Assisted Translation Workbench
Vicent Alabau [email protected] Gonzalez-Rubio [email protected] Ortiz-Martınez [email protected] Sanchis-Trilles [email protected] Casacuberta [email protected] de Sistemas Informaticos y Computacion, Universitat Politecnica de ValenciaCamino de Vera s/n, 46021 Valencia (Spain)
Mercedes Garcıa-Martınez [email protected] Mesa-Lao [email protected] Cheung Petersen [email protected] Dragsted [email protected] Carl [email protected] for Research and Innovation in Translation and Translation Technology (CRITT)Copenhagen Business School, Dalgas Have 15, 2000 Frederiksberg (Denmark)
Abstract
This paper describes a pilot study with a computed-assisted translation workbench aiming attesting the integration of online and active learning features. We investigate the effect of thesefeatures on translation productivity, using interactive translation prediction (ITP) as a baseline.User activity data were collected from five beta testers using key-logging and eye-tracking.User feedback was also collected at the end of the experiments in the form of retrospectivethink-aloud protocols. We found that OL performs better than ITP, especially in terms of trans-lation speed. In addition, AL provides better translation quality than ITP for the same levels ofuser effort. We plan to incorporate these features in the final version of the workbench.
1 Introduction
The use of machine translation (MT) systems for the production of post-editing drafts has be-come a widespread practice in the industry. Many language service providers are now usingport-editing workflows due to a greater availability of resources and tools for the developmentof MT systems, as well as a successful integration of MT systems in already well-establishedcomputer-assisted translation (CAT) workbenches.
This paper reports on the CAT workbench being developed within the CASMACATproject1. Among the different features implemented in the workbench, we will investigate theinteractive translation prediction (ITP) approach (Langlais and Lapalme, 2002; Casacubertaet al., 2009; Barrachina et al., 2009). Within the ITP framework, a state-of-the-art statistical
1CASMACAT: Cognitive Analysis and Statistical Methods for Advanced Computer Aided Translation. Project co-funded by the European Union under the Seventh Framework Programme Project 287576 (ICT-2011.4.2).
1
machine translation (SMT) system is used in the following way. For a given source sentence,the SMT system automatically generates an initial translation. A human translator then proof-reads checks this machine generated translation, correcting the first error. The SMT system thenproposes a new completion (or suffix), taking the user correction into account. These steps arerepeated until the whole input sentence has been correctly translated.
The CASMACAT workbench further extends the ITP approach by introducing two newfeatures, namely, online and active learning. These two new features are designed to allowthe system to take further advantage from user feedback. Specifically, the SMT models areupdated in real time from the target translations validated by the user, preventing the systemfrom repeating errors in the translation of similar sentences. Despite the strong potential of thesefeatures to improve the user experience (Ortiz-Martınez et al., 2010; Gonzalez-Rubio et al.,2012; Bertoldi et al., 2013; Denkowski et al., 2014), they are still not widely implemented inCAT systems. To the best of our knowledge, the only exception is (Ortiz-Martınez et al., 2011)where the authors describe the implementation of online learning within an ITP system.
The present study reports on the results and user evaluation of the CASMACAT workbenchunder three different conditions: 1) basic ITP, 2) ITP with online learning, and 3) ITP with activelearning. The ultimate aim of testing these different configurations was to assess their potentialin real world post-editing scenarios and decide which of them can be successfully integratedinto the final prototype of the CASMACAT workbench for the benefit of the human translator.
2 Online and Active Learning for SMT
The proposed CAT workbench has been extended by incorporating online and active learning,which are targeted to optimizing the quality of the final translations and speeding the post-editing process by taking advantage of user feedback in real time.
2.1 Online Learning
Online learning (OL) allows us to efficiently re-estimate the parameters of the SMT model withthe new translations generated by the user (Ortiz-Martınez et al., 2010). As a result, the SMTsystem is able to learn from the translation edits of the user preventing further errors in themachine generated translations.
Conventional batch learning techniques establish a strict separation between model train-ing and the subsequent use of the estimated parameters for prediction. As a result, SMT systemsimplementing batch learning require to retrain the whole corpus whenever a new training ex-ample is available, spending days or even weeks of computation depending on the size of thetraining set. In contrast, OL techniques process the training examples one at a time or in smallbatches. This approach allows the re-estimation of the parameters of an SMT model in constanttime, whatever the number of training examples previously processed is.
The application of OL to the SMT framework requires the definition of incremental up-date rules for the statistical models involved in the translation process. For this purpose, firstit is necessary to identify a set of sufficient statistics for such models. A sufficient statisticfor a statistical model is a statistic that captures all the information that is relevant to estimatethis model. If the estimation of the statistical model does not require the use of the EM algo-rithm (Dempster et al., 1977), e.g. language models, then it is generally easy to incrementallyextend the model given a new training sample. By contrast, if the EM algorithm is required,e.g. alignment models, the estimation procedure has to be modified, since the conventionalEM algorithm is designed for its use in batch learning scenarios. To address this problem, weimplement the incremental version of the EM algorithm defined in (Neal and Hinton, 1999).
2

Figure 1: Screenshot of the CASMACAT workbench.
2.2 Active Learning
Active learning (AL) applied to ITP aims at optimizing the quality of the final translation as awhole when the available resources, (e.g. manpower, time, money, etc.) are limited (Gonzalez-Rubio and Casacuberta, 2014). In this case, the user is asked to post-edit only a subset of theworst machine generated translations while the system returns SMT outputs for the rest of thesentences. Moreover, each time the user translates a sentence, we feed the newly generatedtranslation example to the SMT model.
This AL framework has several potential advantages over conventional ITP technology.On the one hand, asking the user to only translate a subset of the sentences allows us to limit theamount of effort to be invested in the translation process and, by focusing human effort in thosesentences for which the investment of user effort is estimated to be more profitable, we alsomaximize the utility of each user interaction. On the other hand, the underlying SMT model iscontinually updated with new examples which allows the system to learn new translations andto adapt its outputs to match the preferences of the user. As a result, the subsequent machinegenerated translations will be closer to those preferred by the user thus reducing the humaneffort required to translate them. Additionally, all these technicalities are transparent to the userwho interacts with the system in the same way she does with a conventional ITP system.
An important practical challenge is the strict bound to the response time imposed by theinteraction with the user. This fact constraints the models and techniques that can be usedto implement AL. Particularly, we select which sentences should be post-edited by the useraccording to a sentence-level quality measure based on statistical lexicons (Gonzalez-Rubioet al., 2012) and, given a new translation example, the parameters of the SMT model are re-estimated via the OL techniques described above.
3

Native Danish Speaker Professional translator
U0 yes noU1 yes yesU2 no yesU3 yes yesU4 yes yes
Table 1: Profile of the users in the pilot study.
3 CASMACAT Workbench
CASMACAT is a CAT workbench developed on top of the MATECAT post-editing inter-face (Bertoldi et al., 2012). The user is presented with a GUI in which the left-hand windowdisplays the source text while the right-hand one contains the target text. Texts are split intosegments (corresponding to sentences and headings in the text) so that the translator post-editsone translation segment at a time. The user can see several segments on the screen at the sametime and can scroll back and forth to choose which segment to translate. The workbench con-tains a fully-fledged MT engine with interactivity which can search for alternative translationswhilst the user is post-editing the machine translation. The SMT engine providing the abovementioned functionalities has been implemented using the Thot toolkit (Ortiz-Martınez andCasacuberta, 2014). Figure 1 shows a screenshot of the CASMACAT workbench.
Moreover, the workbench includes facilities for logging system configuration and useractivity data including keystrokes and gaze obtained using an eye-tracking device.
4 Experimental design
The main goal of this pilot study was to assess and compare OL and AL against conventionalITP. To analyze the results, we used the following measures of the translation process:
• Speed: total number of words translated divided by time in minutes.
• Effort: total number of edits done by the user divided by the number of translated words.
The source texts were extracted from the EMEA corpus (Tiedemann, 2009). A group offive users volunteered to perform the evaluation of the system post-editing from English intoDanish. Table 1 summarizes the profile of the users. According to the professional experienceof the users, we carried out two different experiments:
First experiment: U0 post-edited three comparable texts with 55 segments each (843 words,803 words, and 1,005 words). Each text was translated using a different condition, i.e. ITP,ITP with OL, or ITP with AL.
Second experiment: Four users (U1 to U4) were asked to post-edit the same source text (theone with 1,005 words in the first experiment), each user in a different condition. In thiscase we maintain constant the translation task and compare results from different users.
4

U0 ITP OL
Words translated 843 803Words/min. 14.1 16.4Keystrokes/word 2.3 2.3
Table 2: First experiment: ITP vs. OL results.
U1 U2 U3
Native Yes No YesCondition ITP OL OLWords/minute 15.2 40.2 18.0Keystrokes/word 2.9 0.6 1.8
Table 3: Second experiment: ITP vs. OL results.
5 Results
5.1 User activity data
First we will present the results comparing conventional ITP and ITP with OL. In both condi-tions, users post-edited all the sentences in the corpus. Table 2 shows ITP and OL results forthe first experiment in which U0 post-edited different texts under the three conditions. Table 3shows the corresponding results for the second experiment, where the same text (1,005 words)was post-edited by different users under one condition each.
It can be seen that OL significantly improved translation speed (about 2.5 more wordstranslated per minute). Regarding the number of keystrokes, results are not consistent: nosignificant difference was found in the first experiment for the two conditions while it wassignificantly better for OL in the second experiment. The anomalous results for U2 can beexplained by the different profile of the user (i.e. U2 was not a native speaker of Danish).
Regarding the results for ITP with AL against conventional ITP, the users were asked topost-edit the segments according to the quality of the SMT output. That is, users post-editedfirst the segments for which the machine generated translations were considered to be worst. Itis important to note that since the user did not post-edit all machine generated translations (justthe ones with the worst quality), the final target text was a mixture of automatic and humanpost-edited translations. In a second phase, we computed the quality (BLEU) of the outputtranslations and the effort invested (keystrokes per post-edited word) as a function of the numbern of automatic translations post-edited by the user. We ranged n between zero and 55, thenumber of segments in the text. Figure 2 shows the improvement in translation quality withrespect to SMT as a function of the effort invested by U0. Similar results were obtained whencomparing U1 versus U4 in the second experiment. Results show that for the same amount ofeffort, AL provides a larger increase in translation quality as compared to conventional ITP.
5.2 User feedback
User feedback was collected after each post-editing session in the form of retrospective think-aloud protocols. The post-editing process was recorded in the form of screen capture video andthen replayed to the users in order to elicit their actions and feelings as they went about with thepost-editing tasks. Below, we include some of the comments and ideas provided by the users.
5

0
10
20
30
40
0 0.5 1 1.5 2 2.5
∆ BLEU
Effort
AL
ITP
Figure 2: First experiment: improvement in translation quality with respect to SMT as a func-tion of the human effort (keystrokes/word) invested by U0.
U1 (native speaker and professional translator) observations on post-editing through ITP.
“Compared with editing in a non-interactive setting, the interactive translation modewas generally quite a different experience from a users point of view. It was necessaryto ’unlearn’ some of the editing processes normally carried out during revision of hu-man or machine translation, such as highlighting words or segments and overwritingthem with improved alternatives, and reading and planning a whole sentence beforemaking corrections. This lead to a very different editing process, which required somegetting used to and caused a good deal of frustration at first. However, after some timeand practice, and ’unlearning’ of old habits, efficiency improvements kicked in, butonly to the extent that the dynamic changes were appropriate, which was not alwaysthe case. Thus, the problems experienced when working in the interactive mode weregenerally associated more with the quality of some of the dynamic corrections madeby the system and less with the interactive mode as such.
On the positive side, the grammatical corrections generally worked well. For exam-ple, when the definite article (’det’/’den’/’de’ in Danish) was inserted (by the user)before a pre-modifying adjective, the system automatically added the inflection -e tothe adjective, which is the correct form in Danish. Also, when a noun was writtenas an alternative to the original MT solution, the original noun was automaticallyremoved, which saved the user the delete action and thus improved efficiency.
On the negative side, dynamic corrections at the lexical level were not always appro-priate. For example, when adding the morpheme ’op-’ to the Danish noun ’løsning’to arrive at the Danish word for ’dissolution’ (’opløsning’), rather than ’solution’(’løsning’), the system suggested ’opfølgning’ (’follow-up’). This inappropriatedynamic correction then had to be revised by deleting ’følgning’ and reinserting’løsning’, which lead to decreased efficiency in the post-editing process.
The gray/black distinction to differentiate between edited and non-edited text workedwell for me. It was easy to keep track of already accepted text and output that was yetto be checked.”
6

U0 (native speaker and non professional translator) observations on ITP with AL.
“The use of AL features while post-editing helped me a lot especially when using amore technical vocabulary. The interactivity seems faster and easier to recall com-pletely different words, but it is quite the opposite when it comes to introduce smallgrammatical chances, such as word endings in Danish. I think that I would needmore hours interacting with the system to make the most of it, but it is a nice featurewhen the system is able to remember my word preferences to help me improving myproductivity and consistency overall.”
6 Conclusions
We have presented the results of a pilot study concerning the implementation of OL and ALwithin a CAT workbench. We have reported both quantitative results measuring the efficiencyof the translation process, and qualitative results in form of the comments and observationsprovided by different users of the workbench. Both configurations according to the feedbackprovided and the measurements registered have proven to be useful when integrated in theworkbench. These results must be interpreted cautiously because of the small number of usersinvolved in the study. Nevertheless, given that OL yielded the best productivity results in thispilot study, it will be the feature finally included in future versions of the workbench.
Acknowledgments
Work supported by EU’s 7th Framework Programme (FP7/2007-2013) under grant agreement287576 (CASMACAT).
References
Barrachina, S., Bender, O., Casacuberta, F., Civera, J., Cubel, E., Khadivi, S., Lagarda, A., Ney, H.,Tomas, J., Vidal, E., and Vilar, J.-M. (2009). Statistical approaches to computer-assisted translation.Computational Linguistics, 35(1):3–28.
Bertoldi, N., Cattelan, A., and Federico, M. (2012). Machine translation enhanced computer assistedtranslation. First report on lab and field tests.
Bertoldi, N., Cettolo, M., and Federico, M. (2013). Cache-based online adaptation for machine translationenhanced computer assisted translation. In Proc. MT Summit, pages 35–42.
Casacuberta, F., Civera, J., Cubel, E., Lagarda, A. L., Lapalme, G., Macklovitch, E., and Vidal, E. (2009).Human interaction for high quality machine translation. Communications of the ACM, 52(10):135–138.
Dempster, A., Laird, N., and Rubin, D. (1977). Maximum likelihood from incomplete data via the EMalgorithm. Journal of the Royal Statistical Society., 39(1):1–38.
Denkowski, M., Dyer, C., and Lavie, A. (2014). Learning from post-editing: Online model adaptation forstatistical machine translation. In Proc. EACL, pages 395–404, Gothenburg, Sweden. Association forComputational Linguistics.
Gonzalez-Rubio, J. and Casacuberta, F. (2014). Cost-sensitive active learning for computer-assisted trans-lation. Pattern Recognition Letters, 37:124–134.
Gonzalez-Rubio, J., Ortiz-Martınez, D., and Casacuberta, F. (2012). Active learning for interactive ma-chine translation. In Proc. EACL, pages 245–254.
7

Langlais, P. and Lapalme, G. (2002). TransType: development-evaluation cycles to boost translator’sproductivity. Machine Translation, 17(2):77–98.
Neal, R. and Hinton, G. (1999). A view of the EM algorithm that justifies incremental, sparse, and othervariants. Learning in graphical models, pages 355–368.
Ortiz-Martınez, D. and Casacuberta, F. (2014). The new thot toolkit for fully automatic and interactivestatistical machine translation. In Proc. EACL, pages 45–48.
Ortiz-Martınez, D., Garcıa-Varea, I., and Casacuberta, F. (2010). Online learning for interactive statisticalmachine translation. In Proc. NAACL-HLT, pages 546–554.
Ortiz-Martınez, D., Leiva, L. A., Alabau, V., Garcıa-Varea, I., and Casacuberta, F. (2011). An interactivemachine translation system with online learning. In ACL (System Demonstrations), pages 68–73.
Tiedemann, J. (2009). News from opus - a collection of multilingual parallel corpora with tools andinterfaces. In Proc. RANLP, volume V, pages 237–248.
8
Proceedings of the Workshop on Interactive and Adaptive Machine Translation, pages 9–19AMTA Workshop. Vancouver, Canada. September 22, 2014
Towards a Combination of Online and MultitaskLearning for MT Quality Estimation:
a Preliminary Study
Jose G. C. de Souza [email protected] of Trento, ItalyFondazione Bruno Kessler, Italy
Marco Turchi [email protected] Negri [email protected] Bruno Kessler, Italy
AbstractQuality estimation (QE) for machine translation has emerged as a promising way to providereal-world applications with methods to estimate at run-time the reliability of automatic trans-lations. Real-world applications, however, pose challenges that go beyond those of current QEevaluation settings. For instance, the heterogeneity and the scarce availability of training datamight contribute to significantly raise the bar. To address these issues we compare two al-ternative machine learning paradigms, namely online and multi-task learning, measuring theircapability to overcome the limitations of current batch methods. The results of our experiments,which are carried out in the same experimental setting, demonstrate the effectiveness of the twomethods and suggest their complementarity. This indicates, as a promising research avenue,the possibility to combine their strengths into an online multi-task approach to the problem.
1 Introduction
Quality estimation (QE) for machine translation (MT) is the task of estimating the quality of atranslated sentence at run-time and without access to reference translations (Specia et al., 2009).
As a quality indicator, in a typical QE setting, automatic systems have to predict eitherthe time or the number of editing operations (e.g. in terms of HTER1) required by a humanto transform the machine-translated sentence into an adequate and fluent translation. In recentyears, QE gained increasing interest in the MT community as a possible way to: decide whethera given translation is good enough for publishing as is, inform readers of the target languageonly whether or not they can rely on a translation, filter out sentences that are not good enoughfor post-editing by professional translators, or select the best translation among options frommultiple MT or translation memory systems.
So far, despite its many possible applications, QE research has been mainly conductedin controlled laboratory testing scenarios that disregard some of the possible challenges posedby real working conditions. Indeed, the large body of research resulting from three editionsof the shared QE task organized within the yearly Workshop on Machine Translation (WMT
1The HTER (Snover et al., 2006) measures the minimum edit distance between the MT output and its manuallypost-edited version. Edit distance is calculated as the number of edits (word insertions, deletions, substitutions, andshifts) divided by the number of words in the reference. Lower HTER values indicate better translations.
9

(Callison-Burch et al., 2012; Bojar et al., 2013, 2014)) has relied on simplistic assumptions thatdo not always hold in real life. These assumptions include the idea that the data available totrain QE models is: (i) large (WMT systems are usually trained over datasets of 800 or moreinstances for training) and (ii) training and test are sampled from the same distribution (WMTtraining and test sets are drawn from the same domain and are uniformly distributed).
In order to investigate the difficulties of training a QE model in realistic scenarios wheresuch conditions might not hold, in this paper we approach the task in situations where: (i)scarce amounts of training data are available and (ii) training instances come from differentdomains. In these two particularly challenging contexts from the machine learning perspective,we investigate the potential of online and multitask learning methods, comparing them with thebatch methods currently used. Our experiments are carried out over datasets of three differentdomains with 1,000 tuples of source, machine translated and post-edited sentences each.
To the best of our knowledge, this represents the first attempt to compare the two learningparadigms in the MT QE field and within the same experimental setting. The analysis of theresults achieved with the two methods yields interesting findings that suggest, as a promisingresearch avenue, the possibility to exploit their complementarity.
2 Related Work
State-of-the-art in QE explores different supervised linear or non-linear learning methods forregression or classification such as, among others, support vector machines (SVM), differenttypes of decision trees, neural networks, elastic-net, gaussian processes, naive bayes (Speciaet al., 2009; Buck, 2012; Beck et al., 2013; C. de Souza et al., 2014a). Another aspect related tothe learning methods that has received attention is the optimal selection of features in order toovercome issues related with the high-dimensionality of the feature space (Soricut et al., 2012;C. de Souza et al., 2013; Beck et al., 2013).
Despite constant improvements, such learning methods have limitations. The main one isthat they assume that both training and test data are independently and identically distributed.As a consequence, when they are applied to data from a different distribution or domain theyshow poor performance (C. de Souza et al., 2014b). This limitation harms the performance ofQE systems for several real-world applications, such as computer-assisted translation (CAT) en-vironments. Advanced CAT systems currently integrate suggestions obtained from MT engineswith those derived from translation memories (TMs). In such framework, the compelling needto speed up the translation process and reduce its costs by presenting human translators withgood-quality suggestions raises interesting research challenges for the QE community. In suchenvironments, translation jobs come from different domains that might be translated by differ-ent MT systems and are routed to professional translators with different idiolect, backgroundand quality standards (Turchi et al., 2013). Such variability calls for flexible and adaptive QEsolutions by investigating two directions: (i) modeling translator behaviour (Cohn and Specia,2013; Turchi et al., 2014) and (ii) maximize the learning capabilities from all the available data(C. de Souza et al., 2014b).
In this study we experiment with the approaches proposed to address directions (i) and (ii)under the same conditions and evaluate their performance. We use the best learning algorithmpresented by C. de Souza et al. (2014b) and the online learning protocol for QE presented inTurchi et al. (2014) and compare their results. In our experiments we use more data than bothstudies to perform our experiments (1000 data points) for three different domains and compareboth methods with each other as well as with competitive baselines.
10

3 Adaptive MT QE
Multitask Learning (MTL). In MTL different tasks (domains in our case) are correlatedvia a certain structure. Examples of such structures are the hidden layers in a neural network(Caruana, 1997), shared feature representations (Argyriou et al., 2007), among others. Thiscommon structure allows for knowledge transfer among tasks and has been demonstrated toimprove model generalization over single task learning (STL) for different problems in differentareas. Under this scenario, several assumptions can be made about the relatedness among thetasks, leading to different transfer structures.
In MTL there are T tasks and each task t ∈ T has m training samples{(x(t)1 , y
(t)1 ), . . . , (x
(t)m , y
(t)m )}, with x(t)i ∈ Rd where d is the number of features and y(t)i ∈ R
is the output (the response variable or label). The input features and labels are stacked togetherto form two different matrices X(t) = [x
(t)1 , . . . , x
(t)m ] and Y (t) = [x
(t)1 , . . . , x
(t)m ], respectively.
The weights of the features for each task are represented byW , where each column correspondsto a task and each row corresponds to a feature.
minW
T∑
t=1
||(W (t)X(t) − Y (t))||22 + λl||L||∗ + λs||S||1,2 subject to: W = L+ S (1)
where ||S||1,2 is the group regularizer that induces sparsity on the tasks and ||L||∗ is thetrace norm.
The key assumption in MTL is that tasks are related in some way. However, this assump-tion might not hold for a series of real-world problems. In situations in which tasks are notrelated a negative transfer of information among tasks might occur, harming the generalizationof the model. One way to deal with this problem is to: (i) group related tasks in one structureand share knowledge among them, and (ii) identify irrelevant tasks maintaining them in a dif-ferent group that does not share information with the first group. This is the idea of robust MTL(RMTL henceforth). The algorithm approximates task relatedness via a low-rank structure andidentifies outlier tasks using a group-sparse structure (column-sparse, at task level).
RMTL is described by Equation 1. It employs a non-negative linear combination of thetrace norm (the task relatedness component L) and a column-sparse structure induced by thel1,2-norm (the outlier task detection component S). If a task is an outlier it will have non-zeroentries in S. Both L and S are matrices that represent T tasks in the columns and d featuresin the rows, like W . The trace norm is the sum of singular values computed over the feature
weights and given by ||L||∗ =r∑
i=1
σi(L) where {σi}ri=1 is the set of non-zero singular values
in non-increasing order and r = rank(L). The l1,2-norm is given by ||S||1,2 =∑T
t=1 ||st||2where st is the column representing task t and ||.||2 is the l2-norm (also known as the Euclideannorm of a vector).
Online Learning. In the online framework, differently from the batch mode, the learningalgorithm sequentially processes a sequence of n instances X = x1, x2, . . . , xn, returning aprediction yt = wt · xt as output at each step. A loss function between yt and the true labelyt obtained as feedback is used by the algorithm to update the model. In our experimentswe aim to predict the quality of the suggested translations in terms of HTER. To this aim weuse online learning, in particular, the passive aggressive learning method, which is defined asfollows (adapted from Crammer et al. (2006)):
• Receive X , the vector of features extracted from sentence (source, target) pairs;
11

• Predict yt = wt · xt. The prediction yt is the estimated HTER score for instance t and wt
is the incrementally learned weights feature vector;
• Receive label yt = [0, 1]. The observed HTER score;
• Compute loss lt for the current instance t. The loss is 0 if |w ·x−y| < ε and |w ·x−y|− εotherwise. This is know as the ε-insensitive loss;
• Update w according to wt+1 = wt + sign(yt − yt)τtxt where τt is given by lt/||xt||2.
At each step of the process, the goal of the learner is to exploit user post-editions to reducethe difference between the predicted HTER values and the true labels for the following (source,target) pairs.
4 Experimental Setting
In this section we describe the data used for our experiments, the features extracted, the set upof the learning methods, the baselines used for comparison and the evaluation of the models.The goal of our experiments is to show that the methods presented in Section 3 outperformcompetitive baselines and standard QE learning methods that are not capable of adapting todifferent domains. We experiment with three different domains of comparable size and evaluatethe performance of the adaptive methods and the standard techniques with different amountsof training data. The RMTL algorithm described in section 3 is trained with the Malsar toolkitimplementation (Zhou et al., 2012). The online learning algorithm is trained using the AQETtoolkit2 (Turchi et al., 2014). The hyper-parameters for both RMTL and PA algorithms areoptimized using 5-fold cross-validation in a grid search procedure over the training data.
Data. Our experiments focus on the English-French language pair and encompass three verydifferent domains: newswire text (henceforth News), transcriptions of Technology Entertain-ment Design talks (TED) and Information Technology manuals (IT). Such domains are a chal-lenging combination for adaptive systems since they come from very different sources spanningspeech and written discourse (TED and News/IT, respectively) as well as a very well definedand controlled vocabulary in the case of IT.
Each domain is composed of 1000 tuples formed by the source sentence in English, theFrench translation produced by an MT system and a human post-edition of the translated sen-tence. For each pair (translation, post-edition) we use as labels the HTER score computed withTERCpp3. For the three domains we use 70% of the data for training (700 instances) and 30%of the data for testing (300 instances). The limited amount of instances for training contrastswith the 800 or more instances of the WMT evaluation campaigns and is closer to real-worldapplications where the availability of large and representative training sets is far from beingguaranteed (e.g. the CAT scenario).
The TED talks domain is formed by subtitles of several talks in a range of topics pre-sented in the TED conferences. The complete dataset has been used for MT and automaticspeech recognition systems evaluation within the International Workshop on Spoken LanguageTranslation (IWSLT). The News domain is formed by newswire text used in WMT translationcampaigns and covers different topics. The sentence tuples for TED and News domains aretaken from the Trace corpus4. The translations were generated by two different MT systems, astate-of-the-art phrase-based statistical MT system and a commercial rule-based system. Fur-thermore, the translations were post-edited by up to four different translators, as described in
2http://hlt.fbk.eu/technologies/aqet3http://sourceforge.net/projects/tercpp/4http://anrtrace.limsi.fr/trace_postedit.tar.bz2
12

(Wisniewski et al., 2013). The IT texts come from a software user manual translated by a statis-tical MT system based on the state-of-the-art phrase-based Moses toolkit (Koehn et al., 2007)trained on about 2M parallel sentences. The post-editions were collected from one professionaltranslator operating on the Matecat5 (Federico et al., 2014) CAT tool in real working conditions.
Features. For all the experiments we use the same feature set composed of 17 features pro-posed in Specia et al. (2009) and extracted with the QuEst feature extractor (Specia et al., 2013;Shah et al., 2014). The set is formed by features that model the complexity of translating thesource sentence (e.g. the average source token length or the number of tokens in the sourcesentence), and the fluency of the translated sentence produced by the MT system (e.g. the lan-guage model probability of the translation). The decision to use this feature set is motivated bythe fact that it demonstrated to be robust across language pairs, MT systems and text domains(Specia et al., 2009).
Baselines. As a term of comparison, in our experiments we consider two baselines. A simpleto implement but difficult to beat baseline when dealing with regression on tasks with differentdistributions is to compute the mean of the training labels and use it as the prediction for eachtesting point (Rubino et al., 2013). In our experiments we compute the mean HTER of thetraining instances of each domain and use it as prediction for each instance of the in-domaintest set. Hereafter we refer to this baseline as µ.
Since supervised domain adaptation techniques should outperform models that are trainedonly on the available in-domain data, we also use as baseline the regressor built only on theavailable in-domain data (SVR in-domain). The in-domain baseline system is trained on thefeature set described earlier in Section 4 with an SVM regression (SVR) method using theimplementation of Scikit-learn (Pedregosa et al., 2011). The radial basis function (RBF) kernelis used for all experiments. The hyper-parameters of the model are optimized using randomizedsearch optimization process with 50 iterations as described in Bergstra and Bengio (2012) andused previously for QE in C. de Souza et al. (2013).
Evaluation. The accuracy of the models is evaluated with the mean absolute error (MAE),which was also used in previous work and in the WMT QE shared tasks (Bojar et al., 2013).MAE is the average of the absolute difference between the prediction yi of a model and thegold standard response yi (Equation 2). As it is an error measure, lower values indicate betterperformance.
MAE =1
m
m∑
i=1
|yi − yi| (2)
In our experiments we compare multiple hypothesis among each other (µ, SVR in-domain,RMTL and PA) across different training sets sizes. Given these requirements we need to per-form multiple hypothesis tests instead of paired tests. It has been shown in Demsar (2006) thatfor comparisons of multiple machine learning models, the recommended approach is to use anon-parametric multiple hypothesis test followed by a post-hoc analysis that compares each pairof hypothesis. For computing the statistical significance we use the Friedman test (Friedman,1937, 1940) followed by a post-hoc analysis of the pairs of regressors using Holm’s procedure(Holm, 1979) to perform the pairwise comparisons when the null hypothesis is rejected. Alltests for both Friedman and post-hoc analysis are run with α = 0.05. For more details aboutthese methods, we refer the reader to Demsar (2006); Garcia and Herrera (2008) which pro-vide a complete review about the application of multiple hypothesis testing to machine learningmethods.
5www.matecat.com
13

5 Results and Discussion
In this section we describe the experiments made with the models described in Section 3 anddiscuss the results. As shown in previous work, using single task learning algorithms with in-domain training data on a cross-domain setting leads to poor results (C. de Souza et al., 2014b).In our experiments we run the baselines described in Section 4 and the methods described inSection 3 on different amounts of training data, ranging from 70 to 700 instances (10% and100% of the training data, respectively). The motivation is to verify how much training datais required by the MTL and online methods to outperform the baselines for a target domain.It is important to remark that MTL approach use the training data of the multiple domains tojointly learn the models for each domain whereas the online learning protocol used here onlyuses in-domain data.
Algorithm 20% 50% 100%TED
µ 0.2088 0.2091 0.2066SVR in-domain 0.2063 0.2083 0.2036RMTL 0.1962 0.2019 0.1990PA 0.2036 0.1977 0.1943
Newsµ 0.1384 0.1386 0.1384SVR in-domain 0.1533 0.1484 0.1460RMTL 0.1492 0.1446 0.1433PA 0.2305 0.2218 0.2200
ITµ 0.2125 0.2128 0.2125SVR in-domain 0.2114 0.1959 0.1863RMTL 0.2082 0.2041 0.2023PA 0.1917 0.1877 0.1858
Table 1: Average performance of 30 runs of the algorithms on different train and test splits with20, 50 and 100 percent of training data. The average scores reported are the MAE.
Table 1 presents the results for the three domains with models trained on 20, 50 and 100%of the training data (140, 350 and 700 instances, respectively). Each method was run on 30different train/test splits of the data in order to account for the variability of points in each split.Results for PA are statistically significant w.r.t both baselines for IT (p ≤ 0.016667) and TED(p ≤ 0.025) but not for News. Results for RMTL are statistically significant w.r.t both baselinesfor TED (p ≤ 0.025) and they are not statistically significant for the other two domains.
Both the RMTL and PA algorithms outperform the SVR in-domain and µ baselines for theTED and IT domains with different amounts of training data. For TED, with as much as 20% ofthe training data, RMTL outperforms SVR in-domain (the best performing baseline) by around4.89%. Training the models with 50 and 100% of the training data PA outperforms all othermodels and in particular the SVR in-domain by 5 and 4.5%, respectively. The learning curvesof all algorithms for the TED domain are shown in Figure 1. The learning curves show thatRMTL does very well with very little training data whereas PA performs better as we add moretraining data.
Similarly, for the IT domain, PA presents the best performance outperforming the bestperforming baselines when trained with 20, 50% of the training data by 9.13 and 4.15% and avery similar performance when trained with 100% of the training data. It is important to notice
14

Figure 1: Learning curves for the TED domain.
that PA learns in an online fashion over the test data in addition to the training data, as opposedto the other algorithms presented here.
For the News domain, RMTL outperforms SVR in-domain but it is outperformed by theµ baseline. One indication that explains why the µ baseline is hard to beat are the distributionsof the HTER scores for the News domain (Table 2). Whereas the three domains present similarmeans, the standard deviation of the HTER scores of News is smaller than for IT and TED.This indicates that every point in the News domain is closer to the mean than in the other twodomains.
Domain Mean StdIT 0.3620 0.2653TED 0.3396 0.2446News 0.3737 0.1859
Table 2: Mean and standard deviation of the distributions of HTER scores for TED, IT andNews domains.
The distribution of data for News shows that different things might be happening in thisdata, such as: (i) the different MT systems that compose this domain produce translations ofsimilar quality (around the mean of 0.3737); (ii) the difficulty of translating the sentences ishomogeneous and (iii) the post-editors tend to agree more. The kernel density estimation of thelabels for the three domains is shown in Figure 2. The News domain presents only one maximaand has a different shape than the other two domains that present at least two other maximum,indicating that TED and IT are more alike in terms of label distributions with respect to theNews domain.
The results show that both RMTL and PA improve over in-domain single-task learningon different domains. The MTL method used in our experiments is capable of transferringknowledge from different domains whereas the online learning method is capable of training
15
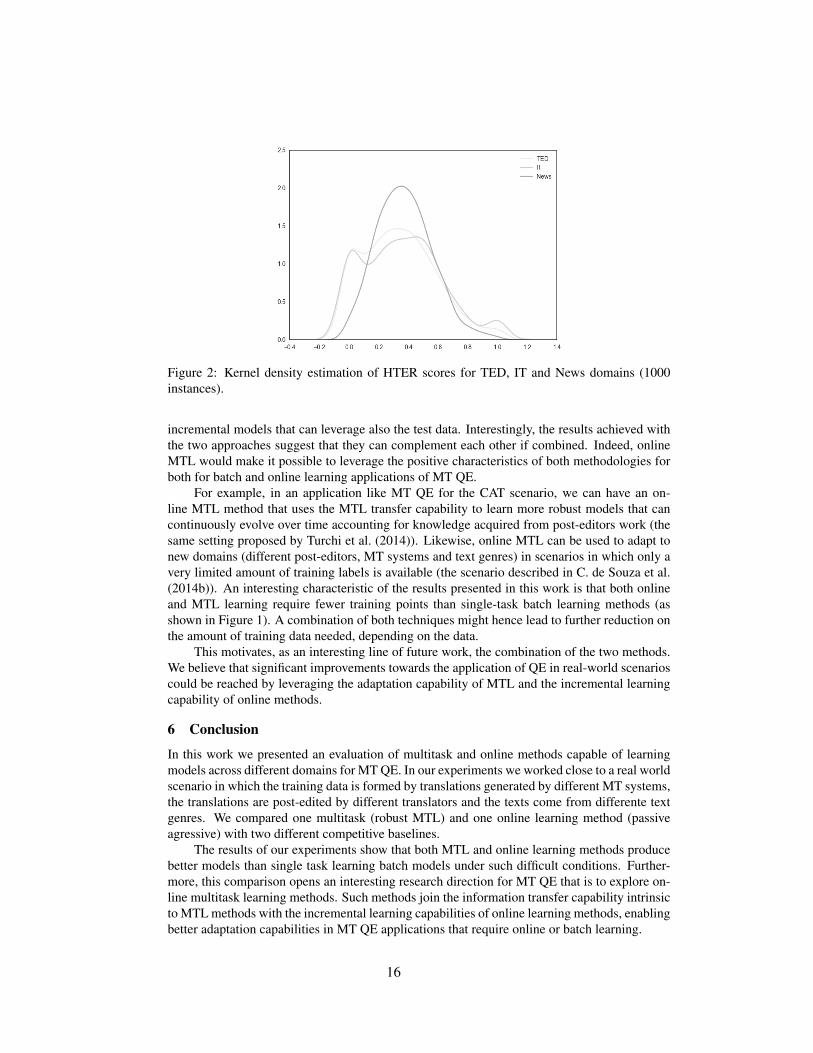
Figure 2: Kernel density estimation of HTER scores for TED, IT and News domains (1000instances).
incremental models that can leverage also the test data. Interestingly, the results achieved withthe two approaches suggest that they can complement each other if combined. Indeed, onlineMTL would make it possible to leverage the positive characteristics of both methodologies forboth for batch and online learning applications of MT QE.
For example, in an application like MT QE for the CAT scenario, we can have an on-line MTL method that uses the MTL transfer capability to learn more robust models that cancontinuously evolve over time accounting for knowledge acquired from post-editors work (thesame setting proposed by Turchi et al. (2014)). Likewise, online MTL can be used to adapt tonew domains (different post-editors, MT systems and text genres) in scenarios in which only avery limited amount of training labels is available (the scenario described in C. de Souza et al.(2014b)). An interesting characteristic of the results presented in this work is that both onlineand MTL learning require fewer training points than single-task batch learning methods (asshown in Figure 1). A combination of both techniques might hence lead to further reduction onthe amount of training data needed, depending on the data.
This motivates, as an interesting line of future work, the combination of the two methods.We believe that significant improvements towards the application of QE in real-world scenarioscould be reached by leveraging the adaptation capability of MTL and the incremental learningcapability of online methods.
6 Conclusion
In this work we presented an evaluation of multitask and online methods capable of learningmodels across different domains for MT QE. In our experiments we worked close to a real worldscenario in which the training data is formed by translations generated by different MT systems,the translations are post-edited by different translators and the texts come from differente textgenres. We compared one multitask (robust MTL) and one online learning method (passiveagressive) with two different competitive baselines.
The results of our experiments show that both MTL and online learning methods producebetter models than single task learning batch models under such difficult conditions. Further-more, this comparison opens an interesting research direction for MT QE that is to explore on-line multitask learning methods. Such methods join the information transfer capability intrinsicto MTL methods with the incremental learning capabilities of online learning methods, enablingbetter adaptation capabilities in MT QE applications that require online or batch learning.
16

References
Argyriou, A., Evgeniou, T., and Pontil, M. (2007). Multi-task feature learning. In Advances inneural information processing systems, volume 19.
Beck, D., Shah, K., Cohn, T., and Specia, L. (2013). SHEF-Lite: When less is more fortranslation quality estimation. In Proceedings of the Eighth Workshop on Statistical MachineTranslation, pages 337–342.
Bergstra, J. and Bengio, Y. (2012). Random Search for Hyper-Parameter Optimization. Journalof Machine Learning Research, 13:281–305.
Bojar, O., Buck, C., Callison-Burch, C., Federmann, C., Haddow, B., Koehn, P., Monz, C.,Post, M., Soricut, R., and Specia, L. (2013). Findings of the 2013 Workshop on StatisticalMachine Translation. In Eighth Workshop on Statistical Machine Translation, pages 1–44.
Bojar, O., Buck, C., Federmann, C., Haddow, B., Koehn, P., Leveling, J., Monz, C., Pecina, P.,Post, M., Saint-Amand, H., Soricut, R., Specia, L., and Tamchyna, A. (2014). Findings of the2014 Workshop on Statistical Machine Translation. In Proceedings of the Ninth Workshopon Statistical Machine Translation, pages 12–58.
Buck, C. (2012). Black Box Features for the WMT 2012 Quality Estimation Shared Task. InProceedings of the 7th Workshop on Statistical Machine Translation, pages 91–95.
C. de Souza, J. G., Buck, C., Turchi, M., and Negri, M. (2013). FBK-UEdin participationto the WMT13 Quality Estimation shared-task. In Proceedings of the Eighth Workshop onStatistical Machine Translation, pages 352–358.
C. de Souza, J. G., Gonzalez-Rubio, J., Buck, C., Turchi, M., and Negri, M. (2014a). FBK-UPV-UEdin participation in the WMT14 Quality Estimation shared-task. In Proceedings ofthe Ninth Workshop on Statistical Machine Translation, pages 322–328.
C. de Souza, J. G., Turchi, M., and Negri, M. (2014b). Machine Translation Quality EstimationAcross Domains. In Proceedings of COLING 2014, the 25th International Conference onComputational Linguistics: Technical Papers., pages 409–420.
Callison-Burch, C., Koehn, P., Monz, C., Post, M., Soricut, R., and Specia, L. (2012). Find-ings of the 2012 Workshop on Statistical Machine Translation. In Proceedings of the 7thWorkshop on Statistical Machine Translation, pages 10–51, Montreal, Canada. Associationfor Computational Linguistics.
Caruana, R. (1997). Multitask Learning. Machine learning, 28(28):41–75.
Cohn, T. and Specia, L. (2013). Modelling Annotator Bias with Multi-task Gaussian Processes:An application to Machine Translation Quality Estimation. In Proceedings of the 51st AnnualMeeting of the Association for Computational Linguistics, pages 32–42.
Crammer, K., Dekel, O., Keshet, J., Shalev-Shwartz, S., and Singer, Y. (2006). Online passive-aggressive algorithms. Journal of Machine Learning Research, 7:551–585.
Demsar, J. (2006). Statistical Comparisons of Classifiers over Multiple Data Sets. The Journalof Machine Learning Research, 7:1–30.
17

Federico, M., Bertoldi, N., Cettolo, M., Negri, M., Turchi, M., Trombetti, M., Cattelan, A.,Farina, A., Lupinetti, D., Martines, A., Massidda, A., Schwenk, H., Barrault, L., Blain, F.,Koehn, P., Buck, C., and Germann, U. (2014). The Matecat Tool. In Proceedings of COLING2014, the 25th International Conference on Computational Linguistics: System Demonstra-tions, pages 129–132.
Friedman, M. (1937). The Use of Ranks to Avoid the Assumption of Normality Implicit in theAnalysis of Variance. Journal of the American Statistical Association, 32(200):675–701.
Friedman, M. (1940). A Comparison of Alternative Tests of Significance for the Problem of mRankings. The Annals of Mathematical Statistics, 11(1):86–92.
Garcia, S. and Herrera, F. (2008). An Extension on ”Statistical Comparisons of Classifiers overMultiple Data Sets” for all Pairwise Comparisons. Journal of Machine Learning Research,9:2677–2694.
Holm, S. (1979). A Simple Sequentially Rejective Multiple Test Procedure. ScandinavianJournal of Statistics, 6(2):pp. 65–70.
Koehn, P., Hoang, H., Birch, A., Callison-Burch, C., Federico, M., Bertoldi, N., Cowan, B.,Shen, W., Moran, C., Zenz, R., Dyer, C., Bojar, O., Constantin, A., and Herbst, E. (2007).Moses: Open source toolkit for statistical machine translation. In ACL 2007 Demo and PosterSessions, number June, pages 177–180.
Pedregosa, F., Varoquaux, G., Gramfort, A., Michel, V., Thirion, B., Grisel, O., Blondel, M.,Prettenhofer, P., Weiss, R., Dubourg, V., Vanderplas, J., Passos, A., Cournapeau, D., Brucher,M., Perrot, M., and Duchesnay, E. (2011). Scikit-learn : Machine Learning in Python. Jour-nal of Machine Learning Research, 12:2825–2830.
Rubino, R., de Souza, J. G. C., and Specia, L. (2013). Topic Models for Translation QualityEstimation for Gisting Purposes. In Machine Translation Summit XIV, pages 295–302.
Shah, K., Turchi, M., and Specia, L. (2014). An Efficient and User-friendly Tool for MachineTranslation Quality Estimation. In Proceedings of the Ninth International Conference onLanguage Resources and Evaluation (LREC’14).
Snover, M., Dorr, B., Schwartz, R., Micciulla, L., and Makhoul, J. (2006). A Study of Transla-tion Edit Rate with Targeted Human Annotation. In Association for Machine Translation inthe Americas.
Soricut, R., Bach, N., and Wang, Z. (2012). The SDL Language Weaver Systems in the WMT12Quality Estimation Shared Task. In Proceedings of the 7th Workshop on Statistical MachineTranslation, pages 145–151.
Specia, L., Cancedda, N., Dymetman, M., Turchi, M., and Cristianini, N. (2009). Estimating theSentence-Level Quality of Machine Translation Systems. In Proceedings of the 13th AnnualConference of the EAMT, number May, pages 28–35.
Specia, L., Shah, K., de Souza, J. G. C., and Cohn, T. (2013). QuEstA translation qualityestimation framework. In Proceedings of the 51st Annual Meeting of the Association forComputational Linguistics, pages 79–84.
Turchi, M., Anastasopoulos, A., de Souza, J. G. C., and Negri, M. (2014). Adaptive QualityEstimation for Machine Translation. In Proceedings of the 52nd Annual Meeting of theAssociation for Computational Linguistics.
18

Turchi, M., Negri, M., and Federico, M. (2013). Coping with the subjectivity of human judge-ments in mt quality estimation. In Eighth Workshop on Statistical Machine Translation(WMT), pages 240–251.
Wisniewski, G., Singh, A. K., Segal, N., and Yvon, F. (2013). Design and Analysis of a LargeCorpus of Post-Edited Translations: Quality Estimation, Failure Analysis and the Variabilityof Post-Edition. In Machine Translation Summit XIV, pages 117–124.
Zhou, J., Chen, J., and Ye, J. (2012). MALSAR: Multi-tAsk Learning via StructurAl Regular-ization.
19

Proceedings of the Workshop on Interactive and Adaptive Machine Translation, pages 20–31AMTA Workshop. Vancouver, Canada. September 22, 2014
Dynamic Phrase Tables for Machine Translationin an Interactive Post-editing Scenario
Ulrich GermannUniversity of [email protected]
Abstract
This paper presents a phrase table implementation for the Moses system that computes phrasetable entries for phrase-based statistical machine translation (PBSMT) on demand by samplingan indexed bitext. While this approach has been used for years in hierarchical phrase-basedtranslation, the PBSMT community has been slow to adopt this paradigm, due to concernsthat this would be slow and lead to lower translation quality. The experiments conducted inthe course of this work provide evidence to the contrary: without loss in translation quality,the sampling phrase table ranks second out of four in terms of speed, being slightly slowerthan hash table look-up (Junczys-Dowmunt, 2012) and considerably faster than current im-plementations of the approach suggested by Zens and Ney (2007). In addition, the underlyingparallel corpus can be updated in real time, so that professionally produced translations canbe used to improve the quality of the machine translation engine immediately.
1 Introduction
In recent years, there has been an increasing interest in integrating machine translation(MT) into the professional translator’s work flow. With translation memories (TM)firmly established as a productivity tool in the translation industry, it is a conceptuallyobvious extension of this paradigm to include machine translation engines as virtualTMs in the set-up.
One major obstacle to this integration is the static nature of most machine transla-tion systems that are currently available for use in production. They cannot adapt easilyto feedback from the post-editor, or integrate new data into their knowledge base onshort notice. In other words, they do not learn interactively from corrections to theiroutput. Their models and knowledge bases were originally developed and designed fora batch translation scenario, where resources are first built and then used to translate ina fully automatic fashion without further intervention. Training the model parametersis still a slow and computationally very expensive process.
20

This paper presents dynamic phrase tables as an alternative, implemented within theopen-source statistical machine translation (SMT) system Moses (Koehn et al., 2007).1
Rather than simply looking up pre-computed entries from a database, they constructtheir entries on the fly by sampling word-aligned parallel data. The underlying cor-pus can be amended dynamically with low latency, for example by feeding post-editedoutput back to the translation server. New additions to the corpus can be exploited forfuture translations immediately.
While the underlying mechanisms are not new (cf. Callison-Burch et al., 2005;Lopez, 2007), the work reported here eliminates two major concerns about the useof bitext sampling for phrase table entry construction on demand: translation speedand translation quality. The experimental evaluation shows that in terms of speed,the sampling phrase table clearly outperforms current implementations of the work byZens and Ney (2007). It comes close to the translation speed achievable with the hash-based compact phrase table implementation of Junczys-Dowmunt (2012). It shouldbe noted that if translation speed is a serious concern, it is easy to pre-compute andstore or cache phrase table entries for frequently occurring phrases. In terms of transla-tion quality, the performance of the sampling phrase table is on par with conventionalphrase tables for phrase-based SMT. Among the phrase table implementations that wereevaluated for this work, the sampling phrase table is the only one that allows dynamicupdates to its knowledge base in real time.
2 Conventional phrase tables vs. bitext sampling
2.1 Background
Most machine translation systems used in production today follow the paradigm ofphrase-based statistical machine translation (PBSMT; Koehn et al., 2003). PBSMTsystems typically rely on three distinct models: a language model that judges target-language fluency of a proposed translation; a translation model that gauges the qualityof the elementary translation pairs that the final translation is composed of; and a dis-tortion model that models changes in word order between source text and translation.
The units of translation in PBSMT are contiguous sequences of words in the sourcetext (“phrases”) that are translated into contiguous sequences of words on the targetside. Producing the translation hypothesis left-to-right in the target language, the trans-lation algorithm selects non-overlapping phrases in arbitrary order from the source andconcatenates the corresponding translations (i.e., target phrases) to produce a translationhypothesis. Jumps between the source phrases are modelled by the distortion model.
Translation options for source phrases are conventionally stored in a pre-computedtable, which is called the phrase table. Phrase translation scores are computed viaa (log-)linear model over a number of features values associated with the phrase pair〈s, t〉 in question. In the typical set-up, phrase table entries are evaluated by four feature1 The code has been added to the Moses master branch at https://github.com/moses-smt/mosesdecoder.
21

functions. In the formulas below, As,t is the phrase-internal word alignment between sand t. The four feature functions are as follows.
• the conditional phrase-level ‘forward‘ translation probability p (t | s)
• the conditional phrase-level ‘backward‘ translation probability p (s | t)
• the joint ‘lexical forward‘ probability of all target words, given the source phrase(and possibly a word alignment between the two phrases):
∏|t|k=0 p (tk | s,As,t).
• the corresponding joint ‘lexical backward‘ probability∏|s|
k=0 p (sk | t,As,t).
In order to achieve better translations, phrase-level probabilities are typically smoothedby Good-Turing or Kneser-Ney smoothing (Foster et al., 2006). The underlying countsand smoothing parameters are computed based on a complete list of phrase pairs ex-tracted from the word-aligned parallel training corpus.
2.2 Bitext sampling
Except for toy examples, pre-computed phrase tables are typically very large, with theexact size of course depending on the maximum phrase length chosen and the size ofthe underlying corpus. The phrase table used for the timing experiments reported inSection 3.2, for example, consists of over 90 million distinct pairs of phrases of up to 7words extracted from a moderately sized parallel corpus of fewer than 2 million parallelsentences of German-English text.
The large sizes of phrase tables make it impractical to fully load them into memoryat translation time. Fully loaded into memory in the Moses decoder, the phrase table ofthe aforementioned system requires well over 100 GB of RAM and takes far beyond anhour to load. Therefore, phrase tables are usually converted to a disk-based representa-tion, with phrase table entries retrieved from disk when needed. There are several suchrepresentations (Zens and Ney, 2007; Germann et al., 2009; Junczys-Dowmunt, 2012),two of which (Zens and Ney, 2007; Junczys-Dowmunt, 2012) have been integrated intothe Moses system.
As an alternative to pre-computed phrase tables, Callison-Burch et al. (2005) sug-gested to compute phrase table entries on the fly at runtime by extracting and scor-ing a sample of source phrase occurrences and their corresponding translations froma pre-indexed bitext. For indexing, they use suffix arrays (Manber and Myers, 1990).A suffix array is an array of all token positions in a given linear sequence of tokens(e.g., a text or a DNA sequence), sorted in lexicographic order of the sub-sequenceof tokens starting at the respective position. The use of suffix-array-based bitext sam-pling in the context of MT has been explored at length by Lopez (2007) as well asSchwartz and Callison-Burch (2010), especially with respect to Hierarchical Phrase-based Translation (HPBSMT; Chiang, 2005, 2007).
22
A great advantage of the suffix-array-based approach is that it is relatively cheap andeasy to augment the underlying corpus. To add a pair of sentences to the parallel corpus,all we need to do is to construct a suffix array for the added material (O(n log n), wheren is the number of tokens in the added material), and then merge-sort the original suffixarray (of length m) with the new suffix array (O(n+m)).
While corpus sampling is common practice in other branches of MT research (es-pecially HPBSMT, due to the prohibitive size of pre-computed, general-purpose, wide-coverage rule bases), adoption in the PBSMT community has been slow, apparently2
due to concerns about translation speed and quality.
In the following, I intend to dispel these concerns by presenting experimental re-sults obtained with an implementation of suffix-array-based phrase tables that samplethe underlying bitext at run time, yet outperform existing disk-based implementationsof conventional phrase tables by a wide margin in terms of speed (despite the greatercomputational effort), without any loss in translation quality.
Much of the speed benefit is related to RAM vs. disk access. Word-aligned parallelcorpora are much more compact than fully expanded phrase tables, so we can affordto keep more of the information in memory, benefiting from access times that can beseveral orders of magnitude faster than random access to data stored on disk (Jacobs,2009).
Moreover, the data structures are designed to be mapped directly into memory,so that we can rely on the system’s virtual memory manager to transfer the data effi-ciently into memory when needed. This is much faster than regular file access. Twoof the four implementations evaluated here store all the data on disk by default andload them on demand (PhraseDictionaryBinary, PhraseDictionaryOnDisk); the othertwo (PhraseDictionaryCompact and PhraseDictionaryBitextSampling (this work)) usememory-mapped files to ensure the fastest transfer possible between disk and mem-ory. I attribute most of the speed benefits to these implementational choices (see alsoSec. 3.2).
Last but not least, one can alleviate the impact of the computational overhead onoverall translation time by caching frequently occurring entries, so that they must becomputed only once, and perform phrase table look-up in parallel for all source phrasesin a sentence submitted for translation, subject to the number of CPUs available.
The issue of translation quality is less obvious. Despite common misconceptions,it is not so much a matter of missing translation options due to sampling the bitext in-stead of taking into account every single source phrase occurrence. The vast majorityof phrases occur so rarely that we can easily investigate every single occurrence. Morefrequent words and phrases will often be contained in longer, rarer phrases whose in-stances we also fully explore. And if there is a rare translation of a very frequent wordthat escapes our sampling, it is highly unlikely that this translation would survive the
2 I base this statement on numerous conversations with practitioners in the field.
23
system’s hypothesis ranking process.
On the contrary, it is the rarity of most phrases that causes problems, as maximumlikelihood estimates based on low counts are less reliable — they tend to over-estimatethe true translation probability. As Foster et al. (2006) have shown, smoothing phrase-level conditional phrase probabilities improves translation performance. My experi-ments confirm this finding (Table 2).
Both standard methods for smoothing phrase-level translation probabilities in thephrase table, Good-Turing and Kneser-Ney, require global information about the entireset of phrasal translation relations contained in the parallel corpus. This information isnot available when we sample. To take the amount of evidence available into accountwhen estimating phrase translation probabilities, we therefore compute the lower boundof the confidence interval3 over the true translation probability, at some confidence levelα, based on the observed counts. The more evidence is available, the narrower theconfidence interval.
Another issue is the computation of the useful backward phrase-level translationprobabilities p (source phrase | target phrase). Omitting this feature function seriouslyhurts performance (see Line 5 in Table 2). One could, of course, perform a full reverselook-up for each translation candidate to obtain the inverse translation probability. Thiswould increase the number of full phrase look-ups operations necessary to construct aphrase table entry from scratch by a factor equal to the number of translation optionsconsidered for each source phrase (although again, these look-up operations could becached). In practice, this is not necessary. To determine the denominator for the back-ward phrase-level translation probability, we simply scale the number of occurrences ofeach translation candidate in the bitext by the ratio of the source phrase sample size tothe total number of source phrase occurrences in the corpus. Retrieving the total num-ber of occurrences of the translation candidate in the corpus is trivial if we also indexthe target side of the corpus with a suffix array: we only need to measure the distancebetween the first and the occurrence of the phrase in the suffix array. Since the suffixarray is sorted in lexicographic order of the corresponding suffixes, this distance is thetotal number of phrase occurrences.
3 Experiments
Two sets of experiments were conducted to compare bitext sampling to conventionalphrase tables in terms of static performance (without updates), and a third one to assesthe benefits of dynamically updating the phrase table as interactive translation pro-gresses. The first experiment aimed at determining the quality of translation achievablewith bitext sampling and the best parameter settings; the second focused on translationspeed and resource requirements. Training, tuning and test data for these two exper-iments were taken from the data sets for the WMT 2014 shared translation task (cf.Table 1). The language model was a standard 5-gram model with Kneser-Ney smooth-
3 Specifically, the Clopper-Pearson interval (Clopper and Pearson, 1934) as implemented in the Boost C++ library.
24

Table 1: Corpus statistics for the training, development and test data. All corpora werepart of the official data for the shared translation task at WMT 2014 and true-cased forprocessing.
# of tokenscorpus # of sentences German English
LM train Europarl-v7 2,218,201 60,502,373News-Commentary-v9 304,174 7,676,138
TM train Europarl-v7 1,920,209 50,960,730 53,586,045News-Commentary-v9 201,288 5,168,511 5,151,459total after alignmenta 2,084,594 53,863,321 56,351,895
Tuning Newstest-2013 3,000 64,251 65,602Testing Newstest-2014 3003 64,498 68,940a Some sentence pairs were discarded during word alignment
ing; the distortion model was a simple distance-based model without lexicalisation. Thephrase table limit (i.e., the limit on the number of distinct translation hypotheses thatwill be considered during translation) was set to 20; the distortion limit to 6. Samplingwas performed without replacement.
3.1 Translation Quality
Table 2 shows the the quality of translation achieved by the various system configura-tions, as measured by the BLEU score Papineni et al. (2002). The system configura-tions were identical except for the method used for construction and scoring of phrasetable entries.
Each system was tuned 10 times in independent tuning runs to gauge the influenceof parameter initialisation on overall performance (cf. also Clark et al., 2011). The95% confidence interval in the second-but-last column was computed with bootstrapresampling for the median system within the respective group.
The first four systems rely on conventional phrase tables with four feature functions asdescribed in Sec. 2.1: forward and backward phrase-level conditional probabilities aswell as forward and backward joint lexical translation probabilities. They differ in thesmoothing method used, except for the system in Line 3, which shows that filtering thephrase table to include only the top 100 entries (according to the forward phrase-levelprobability p(t | s)) has no effect on translation quality.
Lines 5 and below are based on bitext sampling. The poor performance in Line 5illustrates the importance of the phrase-level backward probability. Without it, the per-formance suffers significantly. Lines 4 and 6 show the benefits of smoothing.
The parameter α in Lines 7 to 9 is the confidence level for which the Clopper-Pearson interval was computed. Notice the minuscule difference between lines 2/3
25

Table 2: BLEU scores with different phrase score computation methods.
# method low high median mean95% conf.intervala
runs
1 precomp., Kneser-Ney smoothing 18.36 18.50 18.45 18.43 17.93 – 18.95 102 precomp., Good-Turing smoothing 18.29 18.63 18.54 18.52 18.05 – 19.05 103 precomp., Good-Turing smoothing, filteredb 18.43 18.61 18.53 18.53 18.04 – 19.08 104 precomp., no smoothing 17.86 18.12 18.07 18.05 17.58 – 18.61 105 max. 1000 smpl., no smoothing, no bwd. prob. 16.70 16.92 16.84 16.79 16.35 – 17.32 106 max. 1000 smpl., no smoothing, with bwd. prob. 17.61 17.72 17.69 17.68 17.14 – 18.22 87 max. 1000 smpl., α = .05, with bwd. prob.c 18.35 18.43 18.38 18.38 17.86 – 18.90 108 max. 1000 smpl., α = .01, with bwd. prob. 18.43 18.65 18.53 18.52 18.03 – 19.12 109 max. 100 smpl., α = .01, with bwd. prob. 18.40 18.55 18.46 18.46 17.94 – 19.00 10
a Confidence intervals were computed via bootstrap resampling for the median system in the group.b Top 100 entries per source phrase selected according to p (t | s).c The parameter α is the one-sided confidence level of the Clopper-Pearson interval for the observed counts.
and 8! By replacing plain maximum likelihood estimates with the lower bound ofthe confidence interval over the respective underlying translation probability, we canmake up for the lack of global information necessary for Good-Turing or Kneser-Neysmoothing.
3.2 Speed
Table 3 shows average translation times4 per sentence for four phrase table implemen-tations in the Moses system. PhraseDictionaryBinary and PhraseDictionaryOnDiskare implementations of the method described in Zens and Ney (2007). PhraseDic-tionaryCompact (Junczys-Dowmunt, 2012) is a compressed phrase table that relies ona perfect minimum hash for look-up. PhraseDictionaryBitextSampling is the suffixarray-based phrase table presented in this paper. Each system was run with 8 threads asthe only processes on an 8-core machine with locally mounted disks, translating 3003sentences from the WMT 2014 test set. Prior to each run, all file system caches in RAMwere dropped.
When the pre-computed phrase tables are not filtered, the bitext sampler outper-forms even the hash-based phrase table of Junczys-Dowmunt (2012). This is due to thecost of ranking very long lists of translation candidates for very frequent source phrases.Filtering the phrase table off-line to include only the 100 most likely translation candi-dates for each phrase (based on p(t | s)) leads to a significant speed-up without impacton translation quality (cf. Line 3 in Table 2).5 Similarly, the speed of the bitext sampler
4 The times shown were computed by dividing the total wall time of the system run by the number of sentences trans-lated. Translations were performed in 8 parallel threads, so that the average actual translation time for a single sentenceis about 8 times the time shown. Since the bitext sampler is inherently multi-threaded, the fairest form of comparisonwas to run the systems in a way that exhausts the host computer’s CPU capacity.
5 I thank M. Junczys-Dowmunt for pointing out to me that phrase tables must be filtered for optimal performance.
26

Table 3: Translation speed (wall time) with different phrase table implementations. Theimplementation names correspond to Moses configuration options. Translations wereperformed in multi-threaded mode with 8 parallel threads.
type implementation ave. sec./sntstatic PhraseDictionaryBinary (Zens and Ney, 2007) 0.879static PhraseDictionaryOnDisk (Zens and Ney, 2007) 0.717static PhraseDictionaryCompact (Junczys-Dowmunt, 2012) 0.366static PhraseDictionaryCompact (Junczys-Dowmunt, 2012), filtereda 0.214dynamic PhraseDictionaryBitextSampling, max. 1000 samples (this work) 0.256dynamic PhraseDictionaryBitextSampling, max. 100 samples (this work) 0.228a max 100 entries per source phrase
can be improved by reducing the maximum number of samples considered, althoughthis slightly (but not significantly) reduces translation quality as measured by BLEU(cf. Line 9 in Table 2). Phrase table filtering has no impact on the speed of the otherphrase table implementations.
3.3 Simulated Post-editing
The main goal of this work was to develop a phrase table that can incorporate useredits of raw machine translation output into its knowledge base at runtime. Since ex-periments involving real humans in the loop are expensive to conduct, I simulated theprocess by translating sentences from an earlier post-editing field trial in English-to-Italian translation in the legal domain. The training corpus consisted of ca. 2.5 millionsentence pairs (English: ca. 44.6 million tokens, Italian: ca. 45.9 million). Due to thenature of such studies, the amount of data available for tuning and testing was fairlysmall: 564 sentence pairs with 17,869 English and 18,528 Italian tokens for tuning,and 472 segments with 10,829 tokens of English source text and 11,595 tokens of post-edited translation into Italian.
Several feature functions were added for use with dynamic updates to the under-lying bitext. In the following, “background data” means parallel data available priorto the translation of the first sentence, and “foreground data” the parallel data that issuccessively added to the parallel corpus.
• Separate vs. pooled phrase-level conditional translation probabilities (forward andbackward), i.e. the use of distinct feature functions for these probability estimatesbased on counts obtained separately from the background and the foreground cor-pus separately, or feature functions based on pooled counts from two corpora.Because of the small size of our tuning and test sets, counts were pooled in theexperiments for this work.
• A provenance feature nx+n , where n is the number of occurrences in the corpus
27

Table 4: Simulated post-editing vs. batch translation for English-to-Italian translationin the legal domain. For simulated post-editing, counts were pooled.
method low high median mean 95% conf.intervala runs
conventional, Good-Turing smoothing 29.97 30.93 30.74 30.67 29.16 – 32.37 10sampled, no updates, no smoothing, rarity pen. 29.84 30.97 30.52 30.43 28.97 – 32.25 10simulated post-editing, pooled counts,no smoothing, rarity, provenance
30.63 33.05 31.96 31.88 30.19 – 33.77 10
aConfidence intervals were computed via bootstrap resampling for the median system in the group.
and x > 1 an adjustable parameter that determines the slope of the provenancereward. The purpose of this feature is to boost the score of phrase pairs that occurin the foreground corpus.
• A global rarity penalty xx+n (where x and n mean the same as above) that can
penalise phrase pairs that co-occur only rarely overall.
Results are shown in Table 4. None of the differences are statistically significant. Inlight of the small size of the test set, this is hardly surprising. In general, we shouldexpect the benefit of adding post-edited data immediately to the knowledge base of theSMT system to vary widely depending on the repetitiveness of the source text, and onhow well the translation domain is already covered by the background corpus.
4 Related Work
User-adaptive MT has received considerable research interest in recent years. Dueto space limitations, we can only briefly mention a few closely related efforts here.A survey of recent work can be found, for example, in the recent journal arti-cle by Bertoldi et al. (2014b). Ortiz-Martınez et al. (2010), Bertoldi et al. (2014b),and Denkowski et al. (2014) all present systems that can be updated incrementally.Ortiz-Martınez et al. (2010) present a system that can trained be incrementally fromscratch with translations that are produced in an interactive computer-aided translationscenario. The work by Bertoldi et al. (2014b) relies on cache-based models that keeptrack of how recently phrase pairs in the translation model and n-grams in the languagemodels have been used in the translation pipeline and give higher scores to recentlyused items. They also augment the phrase table with entries extracted from post-editedtranslations. The work by Denkowski et al. (2014) is the closest to the work presentedin this paper.6 Working with the cdec decoder (Dyer et al., 2010), they also use suffix ar-rays to construct phrase table entries on demand. In addition, they provide mechanismsto update the language model and re-tune the system parameters.
Focusing on dynamic adjustment of system parameters (feature function values andcombination weights), Martınez-Gomez et al. (2012) investigate various online learn-ing algorithms for this purpose. Blain et al. (2012) and Bertoldi et al. (2014a) describe6 Incidentally, Denkowski (personal communication) is using the implementation presented here to port the work of
Denkowski et al. (2014) to the Moses framework.
28

online word alignment algorithms that can produce the word alignments necessary forphrase extraction.
5 Conclusions
I have presented a new phrase table for the Moses system that computes phrase tableentries on the fly. It outperforms existing phrase table implementations in Moses interms of speed, without sacrificing translation quality. This is accomplished by a newway of computing phrase-level conditional probabilities that takes the amount of evi-dence available into account and discounts probabilities whose estimates are based onlittle evidence. Unlike static conventional phrase tables, sampling-based phrase tablesallow for rapid updates of the underlying parallel corpus and therefore lend themselvesto use in an interactive and dynamic machine translation scenario.
Acknowledgements
This work was supported by the European Union’s 7th Framework Programme(FP7/2007-2013) under grant agreements 287576 (CASMACAT), 287688 (MATECAT),and 288769 (ACCEPT). I thank the anonymous reviewers for numerous helpful sug-gestions.
References
Bertoldi, Nicola, Amin Farajian, and Marcello Federico. 2014a. “Online word alignment for online adap-tive machine translation.” Workshop on Humans and Computer-assisted Translation, 84–92. Gothen-burg, Sweden.
Bertoldi, Nicola, Patrick Simianer, Mauro Cettolo, Katharina Waschle, Marcello Federico, and Stefan Rie-zler. 2014b. “Online adaptation to post-edits for phrase-based statistical machine translation.” MachineTranslation. Accepted for publication. Preprint.
Blain, Frederic, Holger Schwenk, and Jean Senellart. 2012. “Incremental adaptation using translationinformation and post-editing analysis.” 9th International Workshop on Spoken Language Translation,229–236. Hong Kong.
Callison-Burch, Chris, Colin Bannard, and Josh Schroeder. 2005. “Scaling phrase-based statistical ma-chine translation to larger corpora and longer phrases.” 43rd Annual Meeting of the Association forComputational Linguistics (ACL ’05), 255–262. Ann Arbor, Michigan.
Chiang, David. 2005. “A hierarchical phrase-based model for statistical machine translation.” 43rd AnnualMeeting of the Association for Computational Linguistics (ACL ’05), 263–270. Ann Arbor, Michigan.
Chiang, David. 2007. “Hierarchical phrase-based translation.” Computational Linguistics, 33(2):1–28.
Clark, Jonathan H., Chris Dyer, Alon Lavie, and Noah A. Smith. 2011. “Better hypothesis testing forstatistical machine translation: Controlling for optimizer instability.” Proceedings of the 49th AnnualMeeting of the Association for Computational Linguistics: Human Language Technologies: Short Pa-pers - Volume 2, 176–181. Stroudsburg, PA, USA.
29

Clopper, C.J. and E.S. Pearson. 1934. “The use of confidence or fiducial limits illustrated in the case ofthe binomial.” Biometrika.
Denkowski, Michael, Chris Dyer, and Alon Lavie. 2014. “Learning from post-editing: Online modeladaptation for statistical machine translation.” Proceedings of the 14th Conference of the EuropeanChapter of the Association for Computational Linguistics, 395–404. Gothenburg, Sweden.
Dyer, Chris, Adam Lopez, Juri Ganitkevitch, Jonathan Weese, Ferhan Ture, Phil Blunsom, Hendra Se-tiawan, Vladimir Eidelman, and Philip Resnik. 2010. “cdec: A decoder, alignment, and learningframework for finite-state and context-free translation models.” Proceedings of the ACL 2010 SystemDemonstrations, 7–12. Uppsala, Sweden.
Foster, George F., Roland Kuhn, and Howard Johnson. 2006. “Phrasetable smoothing for statistical ma-chine translation.” EMNLP, 53–61.
Germann, Ulrich, Eric Joanis, and Samuel Larkin. 2009. “Tightly packed tries: How to fit large modelsinto memory, and make them load fast, too.” Workshop on Software Engineering, Testing, and QualityAssurance for Natural Language Processing (SETQA-NLP 2009), 31–39. Boulder, CO, USA.
Jacobs, Adam. 2009. “The pathologies of big data.” Queue, 7(6):10:10–10:19.
Junczys-Dowmunt, Marcin. 2012. “Phrasal rank-encoding: Exploiting phrase redundancy and transla-tional relations for phrase table compression.” Prague Bull. Math. Linguistics, 98:63–74.
Koehn, Philipp, Hieu Hoang, Alexandra Birch, Chris Callison-Burch, Marcello Federico, Nicola Bertoldi,Brooke Cowan, Wade Shen, Christine Moran, Richard Zens, Chris Dyer, Ondrej Bojar, Alexandra Con-stantin, and Evan Herbst. 2007. “Moses: Open source toolkit for statistical machine translation.” 45thAnnual Meeting of the Association for Computational Linguistics (ACL ’07): Demonstration Session.Prague, Czech Republic.
Koehn, Philipp, Franz Josef Och, and Daniel Marcu. 2003. “Statistical phrase-based translation.” HumanLanguage Technology Conference of the North American Chapter of the Association for ComputationalLinguistics (HLT-NAACL ’03), 48–54. Edmonton, AB, Canada.
Lopez, Adam. 2007. “Hierarchical phrase-based translation with suffix arrays.” EMNLP-CoNLL, 976–985.
Manber, Udi and Gene Myers. 1990. “Suffix arrays: A new method for on-line string searches.” Pro-ceedings of the First Annual ACM-SIAM Symposium on Discrete Algorithms, SODA ’90, 319–327.Philadelphia, PA, USA.
Martınez-Gomez, Pascual, German Sanchis-Trilles, and Francisco Casacuberta. 2012. “Online adap-tation strategies for statistical machine translation in post-editing scenarios.” Pattern Recognition,45(9):3193–3203.
Ortiz-Martınez, Daniel, Ismael Garcıa-Varea, and Francisco Casacuberta. 2010. “Online learning for inter-active statistical machine translation.” Human Language Technologies: The 2010 Annual Conferenceof the North American Chapter of the Association for Computational Linguistics, HLT ’10, 546–554.Stroudsburg, PA, USA.
Papineni, Kishore, Salim Roukos, Todd Ward, and Wei-Jing Zhu. 2002. “Bleu: a method for automaticevaluation of machine translation.” ACL 2002, 311–318. Philadelphia, PA.
30

Schwartz, Lane and Chris Callison-Burch. 2010. “Hierarchical phrase-based grammar extraction injoshua: Suffix arrays and prefix tree.” The Prague Bulletin of Mathematical Linguistics, 93:157–166.
Zens, Richard and Hermann Ney. 2007. “Efficient phrase-table representation for machine translationwith applications to online MT and speech translation.” Human Language Technology Conferenceof the North American Chapter of the Association for Computational Linguistics (HLT-NAACL ’07),492–499. Rochester, New York.
31

Proceedings of the Workshop on Interactive and Adaptive Machine Translation, pages 32–41AMTA Workshop. Vancouver, Canada. September 22, 2014
Optimized MT Online Learningin Computer Assisted Translation
Prashant Mathur [email protected], Trento, ItalyDISI, University of Trento, Italy
Mauro Cettolo [email protected], Trento, Italy
AbstractIn this paper we propose a cascading framework for optimizing online learning in machinetranslation for a computer assisted translation scenario. With the use of online learning, severalhyperparameters associated with the learning algorithm are introduced. The number of itera-tions of online learning can affect the translation quality as well. We discuss these issues andpropose a few approaches to optimize the hyperparameters and to find the number of iterationsrequired for online learning. We experimentally show that optimizing hyperparameters andnumber of iterations in online learning yields consistent improvement against baseline results.
1 IntroductionThe growing need of globalization has given a boost to the translation and localization industrywhere the high quality is guaranteed by human translators. To increase the productivity ofthese translators, Computer Assisted Translation (CAT) tools are used which provide access totranslation memories, terminology, built-in spell checkers, dictionaries. A translation memoryis a good source of previously translated segments; however, for new translation tasks, theyare often obsolete. Due to the generalization capability of Machine Translation (MT) systems,they are employed in the back end of the CAT tools, for providing translation suggestions tothe humans in cases where the translation memory fails. In fact, a seamless integration of SMTengines in CAT has shown to increase translator’s productivity (Federico et al., 2012).
In state-of-the-art CAT tools, the SMT systems are generally static in nature and cannotadapt to the corrections posted by the translators. On the contrary, an adaptable SMT systemwould be preferable which can learn from the corrections of the post editor and modifies thestatistical models accordingly. The task of learning from user corrections at the sentence levelfits well in the online learning scenario. Online learning is a machine learning task where apredictor iteratively: (1) receives an input, (2) predicts an output label, (3) receives the correctoutput label from a human and, if the two labels do not match, (4) learns from the mistake.
However, the introduction of online learning itself brings two main issues. The first regardsthe tuning of the rate of learning, which is typically determined by the value of a number ofparameters of the algorithm, hereafter referred to as hyperparameters;1 optimizing them is thenthe first issue. The second problem is the selection of the optimal number of iterations of theonline learning algorithm, i.e. an optimal stopping criterion.
In this paper, we focus on these issues and propose solutions in the context of SMT andCAT. Our work is an extension of Mathur et al. (2013), where three different hyperparametersare considered. Here, we are going to investigate techniques for optimizing the same , but inprinciple this work could be applied to any arbitrary number of hyperparameters.
1They are so called to distinguish them from the parameters of the models under analysis.
32

The organization of the paper is as follows. Section 2 gives an insight on the backgroundneeded to understand the concepts in the paper. Sections 3 and 4 describe the approacheswe use to enhance the performance of the adaptable SMT system. Section 5 and 6 presentexperiments and results, respectively. Section 7 mentions a few related works and is followedby the conclusions section.
2 BackgroundMathur et al. (2013) described an online learning approach for SMT integrated in CAT. In thatpaper, a twofold adaptation is proposed: 1) feature adaptation, in which an additional featureis added to the phrase table for rewarding the recently seen phrase pairs; 2) weight adaptation,where the log-linear interpolation weights of SMT model are adapted on the fly using MIRA(Watanabe et al., 2007). The online learning in the CAT framework is performed on the pairof source sentence and post edit, once the latter is provided by the human translator. From theimplementation point of view, a particular structure where the source sentence is paired with itspost edited translation is passed to the decoder: this activates a single online learning iteration.To perform multiple iterations, a corresponding number of copies of that structure has to bepassed as input to the decoder.
The aforementioned paper does not deeply investigate the tuning of free parameters in-volved in that online learning process. In fact, hyperparameters are optimized by means of theSimplex algorithm, but the same values are then re-used for any possible number of iterationsof the online learning, disregarding the dependence between the number of iterations and thehyperparameters, which is not a good assumption, as we will see later.
We extend that investigation from two viewpoints. First, we focus on the selection ofbetter hyperparameters; second, we look for the optimal number of iterations of online learningrequired to maximize the performance of an adaptable SMT system.
3 OptimizationThe following steps lay the optimization process in a cascaded framework:
1. Baseline SMT models are tuned on the development set.2. Copies of development set are made such that each copy represents a different number (i)
of iterations of online learning (i ∈ 1..10).3. The tuned log-linear weights are kept fixed and hyperparameters are tuned by derivate free
optimization (DFO) methods.
The optimal weights are computed by minimizing the error on a held-out parallel developmentset by means of MIRA which operates on the N -best list and re-ranks it by changing the log-linear weights. Since hyperparameters do not affect this N -best list once it is created, thereis no direct way to optimize the hyperparameters on the development set via traditional tuningmethods. An alternative solution needs to be found.
Hyperparameters in SMT models, such as distortion limit and beam size, have been typ-ically optimized using derivative free optimization (DFO) techniques such as Simplex (Chungand Galley, 2012) and Hill Climbing (Stymne et al., 2013). Analogously, once we have tunedthe log-linear weights, we keep them fixed and optimize our hyperparameters by means of DFO.This cascade approach prevents joint optimization over 18 parameters2 which is not feasible us-ing the DFO techniques because they tend not to converge with so many parameters.
In this paper we focus on three hyperparameters, namely the feature learning rate (FLR),the weight learning rate (WLR) and the slack variable (SLK). FLR determines the rate oflearning of the additional online feature; WLR and SLK control respectively the learning rateand the size of the update of the online learning algorithm (MIRA) employed for updating thelog-linear weights. Their optimization is performed with respect to a loss function defined overan objective MT evaluation metric, by the two DFO techniques described in the following.
214 weights from SMT models, plus 1 additional weight for the online learning feature and 3 hyperparameters.
33

DEV SET
Cluster
1
2
3
4
Sys-config-X
Iteration1
Iteration2
Iteration3
Iteration4
TEST SET
Predict
1
2
3
4
Translation
Block 1
Block 2
Block X+1
Block X
4 iterations
2 iterations
6 iterations
Figure 1: Clustering (left) / blockwise (right) approaches to find the optimal number of iterations for online learning.
Downhill Simplex Method The Downhill Simplex method, also known as Nelder-Meadmethod (Nelder and Mead, 1965), is a technique for minimizing an objective multivariate func-tion. The method is iterative and approximates a local optimum by using a simplex, that is apolytope of N + 1 vertices in N dimensions. At each iteration, a new test position is eval-uated by extrapolating the behavior of the objective function measured at each vertex of thesimplex. The algorithm then chooses to replace one of the vertices with the new test point andso the search progresses. New test positions are generated so that the simplex is stretched alongpromising lines (when the simplex is still far from any optimum) or shrinked towards a betterpoint (when it is close to a local optimum).
Modified Hill Climbing Hill Climbing is generally used for a single variate function f(x):it fluctuates the value of the variable x and computes the loss incurred by the function f(x).Step by step, the method moves the variable towards the direction where the loss incurred isminimum. We extended the same optimization to multivariate functions f(x1, x2, . . . , xn) bymoving one variable at a time. Moreover, we modified the original hill climbing by initiallyallowing the variable to take large steps in the convex space, and then constrain the variable totake smaller steps, similar to simulated annealing (Kirkpatrick et al., 1983). This allows HillClimbing to converge faster than in the standard approach.
Later, we will see that the optimal value of hyperparameters depends on the number ofiterations used for the online learning; therefore, the cascade optimization process is run tentimes with different numbers i of iterations (i ∈ 1..10). Given that hyperparameters are opti-mized with two derivative free optimizers, a total of twenty different optimal configurations areavailable for each SMT system to test.
4 Stopping criteria
Once the optimal values of the log-linear weights and of hyperparameters have been estimated,next step towards improving the online learning is to find the optimum number of iterationsrequired to learn. The model resulting from the run of the optimum number of iterations shouldideally outperform the models obtained with a random iteration number and avoid overfitting onthe data. We propose two solutions to find this optimum number: one, named clustering,needs a pre-processing step on the development set; the other, named blockwise, works onthe evaluation data directly.
Clustering In the clustering approach, as a pre-processing stage, the development set is par-titioned into k clusters and the optimal number of iterations for each cluster is determined. Atrun-time, each test sentence is classified into one of the clusters and the corresponding optimalnumber of iterations is used for the online learning for that source sentence and post-edit. Thek-means clustering with random seeding is performed to cluster the development set, using the
34
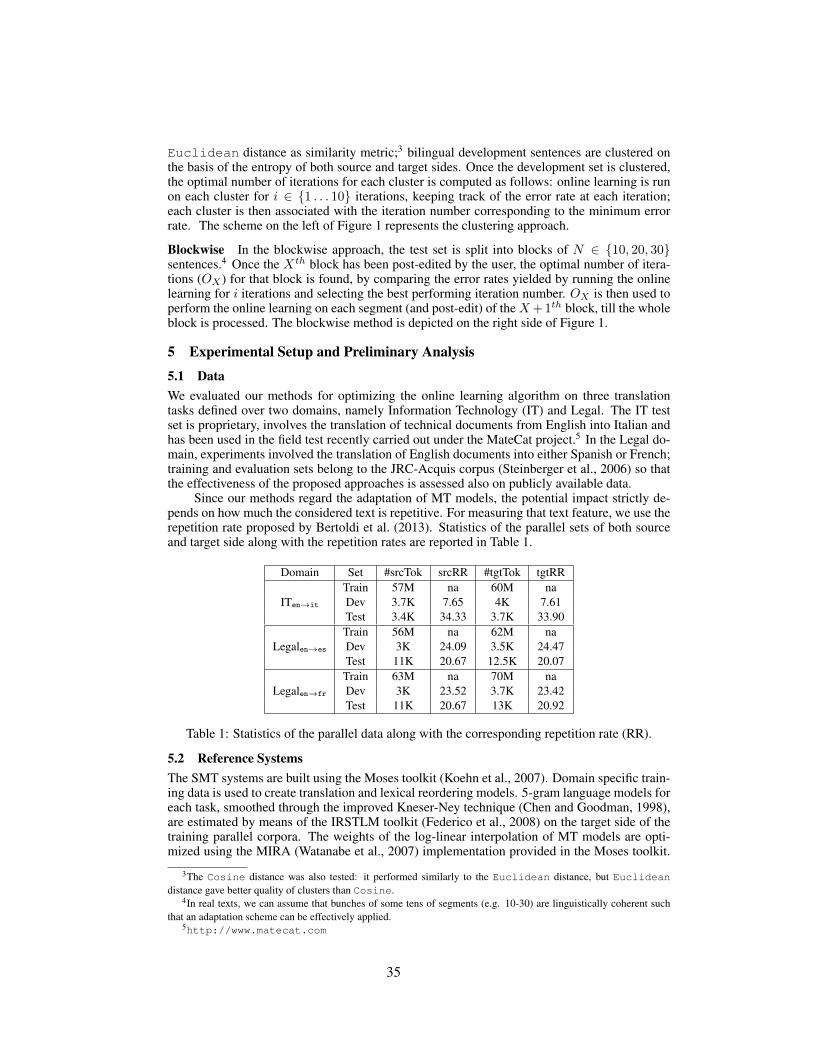
Euclidean distance as similarity metric;3 bilingual development sentences are clustered onthe basis of the entropy of both source and target sides. Once the development set is clustered,the optimal number of iterations for each cluster is computed as follows: online learning is runon each cluster for i ∈ {1 . . . 10} iterations, keeping track of the error rate at each iteration;each cluster is then associated with the iteration number corresponding to the minimum errorrate. The scheme on the left of Figure 1 represents the clustering approach.
Blockwise In the blockwise approach, the test set is split into blocks of N ∈ {10, 20, 30}sentences.4 Once the Xth block has been post-edited by the user, the optimal number of itera-tions (OX ) for that block is found, by comparing the error rates yielded by running the onlinelearning for i iterations and selecting the best performing iteration number. OX is then used toperform the online learning on each segment (and post-edit) of the X+1th block, till the wholeblock is processed. The blockwise method is depicted on the right side of Figure 1.
5 Experimental Setup and Preliminary Analysis
5.1 DataWe evaluated our methods for optimizing the online learning algorithm on three translationtasks defined over two domains, namely Information Technology (IT) and Legal. The IT testset is proprietary, involves the translation of technical documents from English into Italian andhas been used in the field test recently carried out under the MateCat project.5 In the Legal do-main, experiments involved the translation of English documents into either Spanish or French;training and evaluation sets belong to the JRC-Acquis corpus (Steinberger et al., 2006) so thatthe effectiveness of the proposed approaches is assessed also on publicly available data.
Since our methods regard the adaptation of MT models, the potential impact strictly de-pends on how much the considered text is repetitive. For measuring that text feature, we use therepetition rate proposed by Bertoldi et al. (2013). Statistics of the parallel sets of both sourceand target side along with the repetition rates are reported in Table 1.
Domain Set #srcTok srcRR #tgtTok tgtRR
ITen→it
Train 57M na 60M naDev 3.7K 7.65 4K 7.61Test 3.4K 34.33 3.7K 33.90
Legalen→es
Train 56M na 62M naDev 3K 24.09 3.5K 24.47Test 11K 20.67 12.5K 20.07
Legalen→fr
Train 63M na 70M naDev 3K 23.52 3.7K 23.42Test 11K 20.67 13K 20.92
Table 1: Statistics of the parallel data along with the corresponding repetition rate (RR).
5.2 Reference SystemsThe SMT systems are built using the Moses toolkit (Koehn et al., 2007). Domain specific train-ing data is used to create translation and lexical reordering models. 5-gram language models foreach task, smoothed through the improved Kneser-Ney technique (Chen and Goodman, 1998),are estimated by means of the IRSTLM toolkit (Federico et al., 2008) on the target side of thetraining parallel corpora. The weights of the log-linear interpolation of MT models are opti-mized using the MIRA (Watanabe et al., 2007) implementation provided in the Moses toolkit.
3The Cosine distance was also tested: it performed similarly to the Euclidean distance, but Euclideandistance gave better quality of clusters than Cosine.
4In real texts, we can assume that bunches of some tens of segments (e.g. 10-30) are linguistically coherent suchthat an adaptation scheme can be effectively applied.
5http://www.matecat.com
35

Performance is reported in terms of BLEU (Papineni et al., 2002) and TER (Snover et al., 2006).Details on the tested SMT systems follow:
Baseline The static baseline system does not perform any online learning, hence there are nohyperparameters involved in the system.
Def-Param-*x Online learning systems using default values of hyperparameters and running1, 5 and 10 iterations of online learning. These systems provide a reference for assessing theusefulness of estimation of the optimal number of iterations vs. the use of a pre-defined num-ber of iterations. The default values of the hyperparameters are FLR=0.1, WLR=0.05 andSLK=0.001, which yield reasonable performance in preliminary investigations.
5.3 Optimization of the HyperparametersHaving tuned the log-linear weights, the following systems are built:
Opt-Param-*x Online learning systems with hyperparameters optimized by means of eitherSimplex or Hill Climbing techniques of Section 3.
Figure 2 shows the convergence of the DFO methods over their number of iterations6,while keeping fixed the number of iterations of the online learning (just one, i.e. 1×) and thelog-linear weights.
25
30
35
40
45
50
0 10 20 30 40 50
BLE
U
DFO #iterations
SimplexHillClimbing
Figure 2: Simplex vs. Modified Hill Climber on theLegal/en→fr test set, with 1× iteration of the onlinelearning algorithm.
0.0E+00
5.0E-02
1.0E-01
1.5E-01
2.0E-01
2.5E-01
1 2 3 4 5 6 7 8 9 100.0E+00
2.0E-04
4.0E-04
6.0E-04
8.0E-04
1.0E-03
WLR
/FLR
SLK
online learning #iterations
WLRFLRSLK
Figure 3: Optimal values of hyperparameters computedby the Simplex for different iteration numbers of the onlinelearning algorithm (IT/en→it task).
From the figure, we can argue that the Simplex attempts many parameter values performingquite differently, and finally converges to an optimum. Hill Climbing converges to the optimumfaster, but on the other side it seems to explore a smaller portion of the search space. For assess-ing the guess, we tried to change the starting seeds of the two optimizers: Simplex still foundthe same optimum, while Hill Climbing failed even with 50 iterations, confirming our intuition.For this reason, in Opt-Param-*x systems we are only going to provide results obtained usinghyperparameters optimized via Simplex.
Figure 3 shows the optimal value of hyperparameters as a function of the number of itera-tions of the online learning algorithm. Apart a general and reasonable tendency to define smallerupdates when more iterations are performed, it is worth to note that the optimal hyperparametervalues do change with the number of iterations, again confirming our intuition.
As described in Section 3, tuning of hyperparameters was performed for different numbersof iterations of online learning, resulting in 10 different configurations for each DFO algorithm.
5.4 Online Learning Stopping CriteriaAt the end of the optimization stage, 10 optimal configurations for each of the two DFO tech-niques are available for testing. In both DFOs, a TER-based loss function is employed, since
6These are the iterations required by Simplex/HillClimbing to converge.
36

clusters/blocks can be too small to allow the reliable computation of BLEU values. A total of20 optimized systems are then run to look for the optimal number of iterations of the onlinelearning to be used on the test sets: this optimal number is found on the development set withthe clustering technique, directly on the test set with the blockwise technique.
Clustering As already mentioned, we first partition the development set using k-means clus-tering, where k takes values in {2, 4, 6, 8, 10, 12}. In principle, we can increase k but that woulddecrease the size of the clusters with the risk of data overfitting. The development set of the ITtask consists of 300 sentences, i.e. 300 data points, hence for consistency purposes we set themaximum value of k to
⌊2√300/2
⌋= 12 for all tasks.7
For each cluster, we pick the configuration8 which performs best on the development set;the test sentences that are assigned to that cluster are then translated with the chosen optimalconfiguration.
Figure 4 reports the average number of iterations of online learning required by the clus-tering technique to converge for different values of k. It is shown that the larger the number ofclusters, the faster the convergence of the online learning algorithm; this is because the onlinelearner has less to learn from small clusters, even performing more and more iterations.
Blockwise In the blockwise approach the number of iterations is optimized directly (but fair)on the test set. The optimal number for a given block is found once its post-edits are availableand is used for the translation of the following block; this step is iterated for all blocks. In otherwords, number of iteration of online learning on the current block is decided by optimizingthe number of iterations on the previous block. For the first block of the test set, the optimalconfiguration on the development set is considered.
Anyway, two main issues arise: 1) which system configuration should we use for the firstblock? 2) what should be the size of the block? We decided on the following. First, the optimalnumber of iterations for a block is found by comparing the 10× 2 configurations optimized onthe development set. This is analogous to what we do in the clustering approach.
Secondly, for testing their effect on the number of iterations, different sizes of the block(10, 20, 30 sentences) are tried. Figure 5 shows how the block size affects the optimal numberof online learning iterations for one of the considered tasks.
0
1
2
3
4
5
6
7
8
2 4 6 8 10 12
aver
age
onlin
e le
arni
ng
#ite
ratio
ns
#clusters
SimplexHillClimbing
Figure 4: Average number of iterations of the onlinelearning algorithm per number of clusters for the twooptimizers (Legal/en→fr task).
0
2
4
6
8
10
0 50 100 150 200 250 300 350 400
onlin
e le
arni
ng
#ite
ratio
ns
sentence index
BS-10BS-20BS-30
Figure 5: Effect of varying the block size on the numberof iterations of the online learning algorithm (IT/en→it).
7Rule of thumb according to Mardia et al. (1980).8These configurations are not compared all together at once; instead, we separately compare the 10 configurations
for each DFO method.
37
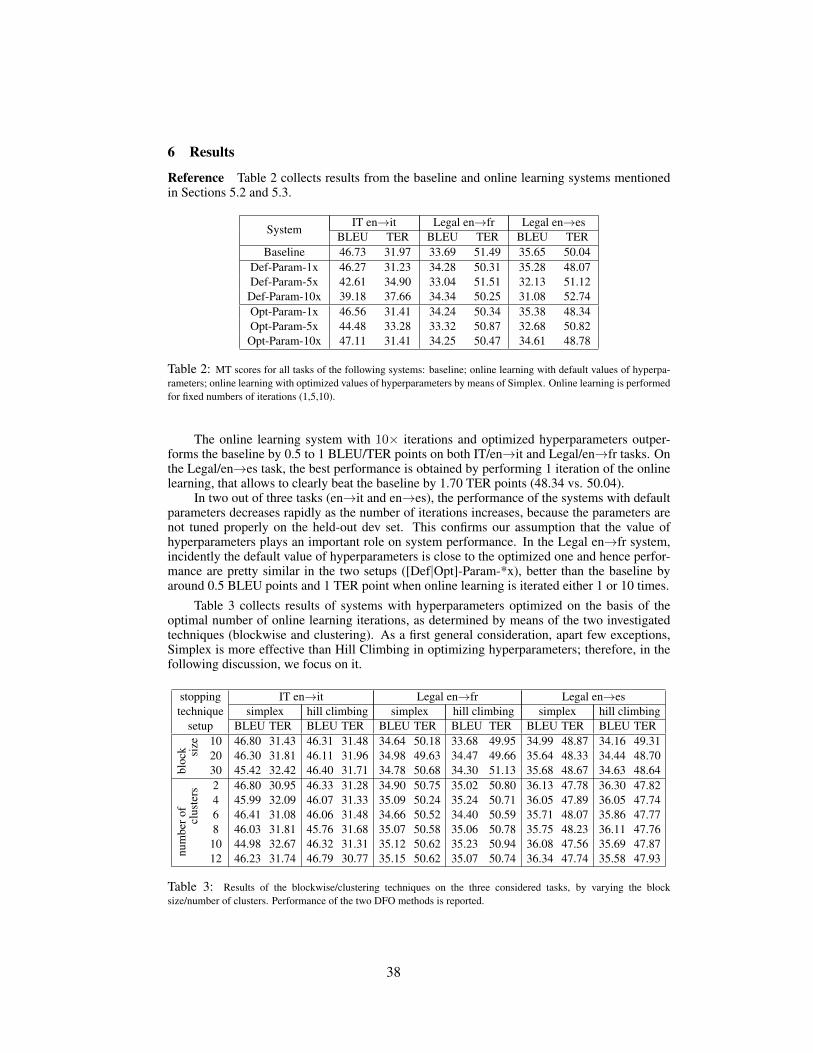
6 Results
Reference Table 2 collects results from the baseline and online learning systems mentionedin Sections 5.2 and 5.3.
SystemIT en→it Legal en→fr Legal en→es
BLEU TER BLEU TER BLEU TERBaseline 46.73 31.97 33.69 51.49 35.65 50.04
Def-Param-1x 46.27 31.23 34.28 50.31 35.28 48.07Def-Param-5x 42.61 34.90 33.04 51.51 32.13 51.12
Def-Param-10x 39.18 37.66 34.34 50.25 31.08 52.74Opt-Param-1x 46.56 31.41 34.24 50.34 35.38 48.34Opt-Param-5x 44.48 33.28 33.32 50.87 32.68 50.82
Opt-Param-10x 47.11 31.41 34.25 50.47 34.61 48.78
Table 2: MT scores for all tasks of the following systems: baseline; online learning with default values of hyperpa-rameters; online learning with optimized values of hyperparameters by means of Simplex. Online learning is performedfor fixed numbers of iterations (1,5,10).
The online learning system with 10× iterations and optimized hyperparameters outper-forms the baseline by 0.5 to 1 BLEU/TER points on both IT/en→it and Legal/en→fr tasks. Onthe Legal/en→es task, the best performance is obtained by performing 1 iteration of the onlinelearning, that allows to clearly beat the baseline by 1.70 TER points (48.34 vs. 50.04).
In two out of three tasks (en→it and en→es), the performance of the systems with defaultparameters decreases rapidly as the number of iterations increases, because the parameters arenot tuned properly on the held-out dev set. This confirms our assumption that the value ofhyperparameters plays an important role on system performance. In the Legal en→fr system,incidently the default value of hyperparameters is close to the optimized one and hence perfor-mance are pretty similar in the two setups ([Def|Opt]-Param-*x), better than the baseline byaround 0.5 BLEU points and 1 TER point when online learning is iterated either 1 or 10 times.
Table 3 collects results of systems with hyperparameters optimized on the basis of theoptimal number of online learning iterations, as determined by means of the two investigatedtechniques (blockwise and clustering). As a first general consideration, apart few exceptions,Simplex is more effective than Hill Climbing in optimizing hyperparameters; therefore, in thefollowing discussion, we focus on it.
stopping IT en→it Legal en→fr Legal en→estechnique simplex hill climbing simplex hill climbing simplex hill climbing
setup BLEU TER BLEU TER BLEU TER BLEU TER BLEU TER BLEU TER10 46.80 31.43 46.31 31.48 34.64 50.18 33.68 49.95 34.99 48.87 34.16 49.31
size
20 46.30 31.81 46.11 31.96 34.98 49.63 34.47 49.66 35.64 48.33 34.44 48.70
bloc
k
30 45.42 32.42 46.40 31.71 34.78 50.68 34.30 51.13 35.68 48.67 34.63 48.642 46.80 30.95 46.33 31.28 34.90 50.75 35.02 50.80 36.13 47.78 36.30 47.824 45.99 32.09 46.07 31.33 35.09 50.24 35.24 50.71 36.05 47.89 36.05 47.746 46.41 31.08 46.06 31.48 34.66 50.52 34.40 50.59 35.71 48.07 35.86 47.77cl
uste
rs
8 46.03 31.81 45.76 31.68 35.07 50.58 35.06 50.78 35.75 48.23 36.11 47.7610 44.98 32.67 46.32 31.31 35.12 50.62 35.23 50.94 36.08 47.56 35.69 47.87
num
bero
f
12 46.23 31.74 46.79 30.77 35.15 50.62 35.07 50.74 36.34 47.74 35.58 47.93
Table 3: Results of the blockwise/clustering techniques on the three considered tasks, by varying the blocksize/number of clusters. Performance of the two DFO methods is reported.
38

Blockwise The upper part of the table reports results employing the blockwise technique. Onthe IT/en→it task, the blockwise system (block size 10) outperforms the baseline in terms ofTER and gives comparable performance to the optimized system (with 10x iterations). To notethat this same quality is obtained more efficiently: in fact, since for each block no more than10 iterations are performed (and less likely, according to Figure 5), on an average it is expectedthat the global cost on the whole test set is lower than the cost of the Opt-Param-10x system,where 10 iterations are performed on each sentence of the test set.
On the Legal/en→fr task, the blockwise system (block size 20) outperforms the baseline aswell as the best performing online learning system with fixed number of iterations (Def-Param-10x) by 1.86 and 0.62 TER points, respectively. However, the size of the block yielding thehighest performance differs between the two domains; that is probably because the IT test setis a collection of different technical documents which makes it rather heterogeneous, while theLegal test sets, being from single documents, are much more homogeneous, allowing the use oflarger blocks.
On the Legal/en→es task, the block size does not impact significantly on the performanceof the online learning system; although there is no BLEU gain in comparison to the baselinesystem, TER improves by up to 1.71 points (48.33 vs. 50.04, when block size is set to 20).
Clustering Concerning the clustering technique, results are shown in the bottom part of Ta-ble 3. Similarly to the blockwise method, for the IT/en→it we do not see any BLEU gain, whileTER improves the baseline by even more than 1 point (30.95 vs. 31.97).
For the Legal/en→fr task, an increase of about 1.5 BLEU points is observed for most ofthe cluster sizes. Even in terms of TER, the number of cluster (and then the cluster size) seemsnot to affect much the scores, which lower the baseline TER (51.49) by around 1 point.
A behavior similar to IT/en→it is observed in the Legal/en→es task: minimal impact ofthe cluster size, small BLEU improvements (no more than 0.7 points), larger TER gains (evenmore than 2 points).
Summarizing, we see consistent improvements of TER, but not of BLEU. A possible ex-planation is the use of TER as the error metric for finding the optimal iterations of onlinelearning for the blocks and the clusters.In fact, the size of clusters is too small to allow the reli-able computation of the BLEU, but optimizing TER favors short sentences, which lower BLEUthrough the brevity penalty.
7 Related WorkOnline learning for SMT has emerged as a hot topic over the last decade (Nepveu et al., 2004;Hardt and Elming, 2010; Ortiz-Martınez et al., 2010; Martınez-Gomez et al., 2012; Denkowskiet al., 2014). Nevertheless, to our knowledge, optimizing the number of iterations of onlinelearning has not been previously studied in the context of SMT integrated in CAT tools. There-fore, this is the first work towards a fully optimized MT online learning system for CAT.
The most notable work in the field of optimization of hyperparameters in MT is that byChung and Galley (2012) where the decoder is integrated with a minimizer so that they can op-timize the values of free parameters such as beam size and distortion limit. This minimizer runsderivative free optimization techniques, such as Powell and Nelder-Mead methods, to optimizelog-linear weights as well as the hyperparameters. They also argue that this integrated mini-mizer measures the true error rate whereas MERT minimizes the artificial error rate computedon a N -best list. Their use of DFO methods pushed us to adopt the same.
Later, Stymne et al. (2013) focused on using the distortion limit (DL) in the documentlevel decoder Docent (Hardmeier et al., 2013). Their system provides better BLEU scoreswhen there is a soft constraint on the DL (i.e. DL is tunable) rather than a hard constraint (DLnot tunable). This experiment further supports the optimization of MT parameters in order togain performance.
Learning of hyperparameters has been a widely studied topic in machine learning. Gridsearch, random search (Bergstra and Bengio, 2012), Gaussian process (Snoek et al., 2012) areonly a few methods that have been used in the past for hyperparameter optimization. Gradient-
39

based hyperparameter learning algorithms have been proposed for a variety of supervised learn-ing models such as neural networks (Larsen et al., 1996). In our case, the evaluation of the lossfunction is a costly procedure which requires the translation of the whole development set: theapplication of the above approaches can then be unfeasible unless we use Racing or Latticebased decoding (Chung and Galley, 2012).
8 Conclusion
We have shown that online learning can be effectively integrated into MT for CAT by followinga cascaded framework where one first optimizes the extra parameters involved with the learningalgorithm, and then find the optimal number of iterations of online learning required on the testset. We experimented with two derivative free optimization techniques, namely Simplex andHill Climbing, and showed their convergence. Two techniques, Blockwise and Clustering, areinstead proposed to find the optimal number of iterations. After an extensive set of experimentswe can conclude that the clustering technique performs better than the blockwise one when thetest set is homogeneous in nature, otherwise the blockwise with small blocks is preferable.
Acknowledgements
This work was supported by the MateCat project (grant agreement 287688), which is funded bythe EC under the 7th Framework Programme.
References
Bergstra, J. and Bengio, Y. (2012). Random search for hyper-parameter optimization. Journalof Machine Learning Research, 13(Feb):281–305.
Bertoldi, N., Cettolo, M., and Federico, M. (2013). Cache-based online adaptation for machinetranslation enhanced computer assisted translation. In Proc. of MT Summit, pp. 35–42, Nice,France.
Chen, S. F. and Goodman, J. (1998). An empirical study of smoothing techniques for languagemodeling. Technical Report TR-10-98, Harvard University.
Chung, T. and Galley, M. (2012). Direct error rate minimization for statistical machine transla-tion. In Proc. of WMT, pp. 468–479, Montreal, Canada.
Denkowski, M., Dyer, C., and Lavie, A. (2014). Learning from post-editing: Online modeladaptation for statistical machine translation. In Proc. of EACL, pp. 395–404, Gothenburg,Sweden.
Federico, M., Bertoldi, N., and Cettolo, M. (2008). IRSTLM: An open source toolkit for han-dling large scale language models. In Proc. of Interspeech, pages 1618–1621, Brisbane,Australia.
Federico, M., Cattelan, A., and Trombetti, M. (2012). Measuring user productivity in machinetranslation enhanced computer assisted translation. In Proc. of AMTA, San Diego, US-CA.
Hardmeier, C., Stymne, S., Tiedemann, J., and Nivre, J. (2013). Docent: A document-leveldecoder for phrase-based statistical machine translation. In Proc. of ACL: System Demon-strations, pp. 193–198, Sofia, Bulgaria.
Hardt, D. and Elming, J. (2010). Incremental re-training for post-editing SMT. In Proc. ofAMTA, Denver, US-CO.
Kirkpatrick, S., Gelatt, C. D., and Vecchi, M. P. (1983). Optimization by simulated annealing.Science, 220:671–680.
40

Koehn, P., Hoang, H., Birch, A., Callison-Burch, C., Federico, M., Bertoldi, N., Cowan, B.,Shen, W., Moran, C., Zens, R., Dyer, C., Bojar, O., Constantin, A., and Herbst, E. (2007).Moses: Open source toolkit for statistical machine translation. In Proc. of ACL, CompanionVolume of the Demo and Poster Sessions, pp. 177–180, Prague, Czech Republic.
Larsen, J., Hansen, L. K., Svarer, C., and Ohlsson, M. (1996). Design and regularization ofneural networks: The optimal use of a validation set. In Proc. of IEEE Signal ProcessingSociety Workshop, pp. 62–71, Kyoto, Japan.
Mardia, K. V., Kent, J. T., and Bibby, J. M. (1980). Multivariate analysis. Academic Press.
Martınez-Gomez, P., Sanchis-Trilles, G., and Casacuberta, F. (2012). Online adaptationstrategies for statistical machine translation in post-editing scenarios. Pattern Recogn.,45(9):3193–3203.
Mathur, P., Cettolo, M., and Federico, M. (2013). Online learning approaches in computerassisted translation. In Proc. of WMT, pp. 301–308, Sofia, Bulgaria.
Nelder, J. A. and Mead, R. (1965). A simplex method for function minimization. The ComputerJournal, 7(4):308–313.
Nepveu, L., Lapalme, G., Langlais, P., and Foster, G. (2004). Adaptive language and translationmodels for interactive machine translation. In Proc. of EMNLP, pp. 190–197, Barcelona,Spain.
Ortiz-Martınez, D., Garcıa-Varea, I., and Casacuberta, F. (2010). Online learning for interactivestatistical machine translation. In Proc. of HLT-NAACL, pp. 546–554, Los Angeles, US-CA.
Papineni, K., Roukos, S., Ward, T., and Zhu, W.-J. (2002). BLEU: A method for automaticevaluation of machine translation. In Proc. of ACL, pp. 311–318, Philadelphia, US-PA.
Snoek, J., Larochelle, H., and Adams, R. P. (2012). Practical bayesian optimization of machinelearning algorithms. In Proc. of NIPS, pp. 2951–2959, Lake Tahoe, US-NV.
Snover, M., Dorr, B., Schwartz, R., Micciulla, L., and Makhoul, J. (2006). A study of translationedit rate with targeted human annotation. In Proc. of AMTA, pp 223–231, Boston, US-MA.
Steinberger, R., Pouliquen, B., Widiger, A., Ignat, C., Erjavec, T., Tufis, D., and Varga, D.(2006). The JRC-Acquis: A multilingual aligned parallel corpus with 20+ languages. InProc. of LREC, pp. 2142–2147, Genoa, Italy.
Stymne, S., Hardmeier, C., Tiedemann, J., and Nivre, J. (2013). Tunable distortion limits andcorpus cleaning for SMT. In Proc. of WMT, pp. 225–231, Sofia, Bulgaria.
Watanabe, T., Suzuki, J., Tsukada, H., and Isozaki, H. (2007). Online large-margin training forstatistical machine translation. In Proc. of EMNLP, pp. 764–773, Prague, Czech Republic.
41

Proceedings of the Workshop on Interactive and Adaptive Machine Translation, pages 42–50AMTA Workshop. Vancouver, Canada. September 22, 2014
1
Behind the Scenes in an Interactive Speech Translation System
Mark Seligman, Ph.D. Mike Dillinger, Ph.D.
Spoken Translation, Inc. Spoken Translation, Inc.
1100 West View Drive 1100 West View Drive
Berkeley, CA 94705 Berkeley, CA 94705
[email protected] [email protected]
Abstract
This paper describes the facilities of Converser for
Healthcare 4.0, a highly interactive speech translation
system which enables users to verify and correct speech
recognition and machine translation. Corrections are
presently useful for real-time reliability, and in the
future should prove applicable to offline machine
learning. We provide examples of interactive tools in
action, emphasizing semantically controlled back-
translation and lexical disambiguation, and explain for
the first time the techniques employed in the tools’
creation, focusing upon compilation of a database of
semantic cues and its connection to third-party MT
engines. Planned extensions of our techniques to
statistical MT are also discussed.
1 Introduction
Multiple applications for spoken language
translation (SLT) or automatic interpreting are now
in use – SpeechTrans, Jibbigo, iTranslate, and
others. SLT projects are in operation at several
large communications companies, including
Google and Facebook. However, widespread use
remains in the future for serious use cases like
healthcare, business, emergency relief, and law
enforcement, despite demonstrably high demand.
The essential problem is that, despite dramatic
advances during the last decade, both speech
recognition and translation technologies are still
error-prone. While the error rates may be tolerable
when the technologies are used separately, the
errors combine and even compound when they are
used together. The resulting translation output is
often below the threshold of usability when
accuracy is essential. As a result, present use is still
largely restricted to use cases – social networking,
travel – in which no representation concerning
accuracy is demanded or given.
The speech translation system discussed here,
Converser for Healthcare 4.0, applies interactive
verification and correction techniques to this
essential problem of overall reliability.
First, users can monitor and correct the speech
recognition system to ensure that the text which
will be passed to the machine translation
component is completely correct. Typing or
handwriting can be used to repair speech
recognition errors.
Next, during the machine translation (MT)
stage, users can monitor, and if necessary correct,
one especially important aspect of the translation –
lexical disambiguation.
The system’s approach to lexical
disambiguation is twofold: first, we supply a back-
translation, or re-translation of the translation.
Using this paraphrase of the initial input, even a
monolingual user can make an initial judgment
concerning the quality of the preliminary machine
translation output. Other systems, e.g. IBM’s
MASTOR (Gao, Liang, et al., 2006), have also
employed re-translation. Converser, however,
exploits proprietary technologies, outlined below,
to ensure that the lexical senses used during back-
translation accurately reflect those used in forward
translation.
In addition, if uncertainty remains about the
correctness of a given word sense, the system
supplies a proprietary set of Meaning Cues™ –
synonyms, definitions, etc. – which have been
42

2
drawn from various resources, collated in a
database (called SELECT™), and aligned with the
respective lexica of the relevant MT systems. With
these cues as guides, the user can monitor the
current, proposed meaning and when necessary
select a different, preferred meaning from among
those available. Automatic updates of translation
and back-translation then follow.
The initial purpose of these techniques is to
increase reliability during real-time speech
translation sessions. Equally important, however,
they can also enable even monolingual users to
supply feedback for off-line machine learning to
improve the system. Until now, only users with
some knowledge of the output language have been
able to supply such feedback, e.g. in Google
Translate.
Previous papers (Seligman and Dillinger 2013,
2012, 2011, 2008, 2006a, 2006b, Dillinger and
Seligman 2004a, 2004b) have reported on the user-
facing design and use of the facilities just
described. Here we provide updated examples of
interactive facilities and explain for the first time
how they were constructed.
For orientation, Section 2 of this paper will
review Converser’s current interactive facilities.
Section 3 explains the implementation of the
system’s back-translation and Section 4 does the
same for its lexical disambiguation facilities. We
conclude in a final section.
Converser has been pilot tested successfully at a
San Francisco medical center, part of a very large
healthcare organization (Seligman and Dillinger,
2011). Evaluation results concerning system
accuracy and usability are discussed below.
Negotiations concerning continued use are
ongoing with the host of the pilot and with another
large Bay Area hospital system.
2 The Converser System
We now briefly illustrate Converser’s approach
to interactive automatic interpretation. We describe
Version 4.0, italicizing new interface elements.
Converser adopts rather than creates its speech
and translation components, adding value through
the interactive interface elements to be explained.
Nuance, Inc. supplies cloud-based speech
recognition, modified by a third party for access
via desktops; rule-based English↔Spanish
machine translation is supplied by Word Magic of
Costa Rica; and text-to-speech is again provided
by Nuance.
Depending on the platform, the system can
offer up to four input modes: speech, typing,
handwriting, and touchscreen. Since we want to
illustrate the use of interactive correction for
speech recognition as well as machine translation,
we assume that the user has clicked on the round
red Mic Button to activate the microphone (Figure
1). (Starting with the 4.0 release, no voice training
or profile creation is required for either language.)
Still in Figure 1, notice the Traffic Light Icon
and two Earring Icons. These are used to switch
Verification Mode on and off for translation and
speech recognition, respectively. Both icons are
currently green, indicating “Full speed ahead!”
That is, verification has been temporarily switched
off: the user has indicated that it is unnecessary to
pre-check either ASR or MT before transmitting
the next utterance, preferring speed to accuracy.
Just prior to the figure’s snapshot, the user said,
“San Jose is a pleasant city.” Since verification had
been switched off for both ASR and MT, these
functioned without interruption. The speech
recognition result appeared briefly (and in this case
correctly) in the Input Window. Immediately
thereafter the Spanish translation result (also
correct in this case) appeared in the right-hand
section of the Transcript Window, and was
immediately pronounced via text-to-speech.
Meanwhile, the original English input was
recorded in the left-hand section of the transcript.
Also on the English side of the transcript and
just below the original English input is a specially
prepared back-translation:1 the original input was
translated into Spanish, and then retranslated back
into English. Techniques to be explained in Section
3 ensure that the back-translation means the same
as the Spanish. Thus, even though pre-verification
was bypassed for this utterance in the interest of
speed, post-verification via the transcript was still
enabled. (The Transcript Window, containing
inputs from both English and Spanish sides and the
associated back-translations, can be saved for
record-keeping. Inclusion of back-translation is
new to Version 4.0. Participant identities can
optionally be masked for confidentiality.)
Using this back-translation, the user might
1 Proprietary, and branded as Reliable Retranslation™.
43
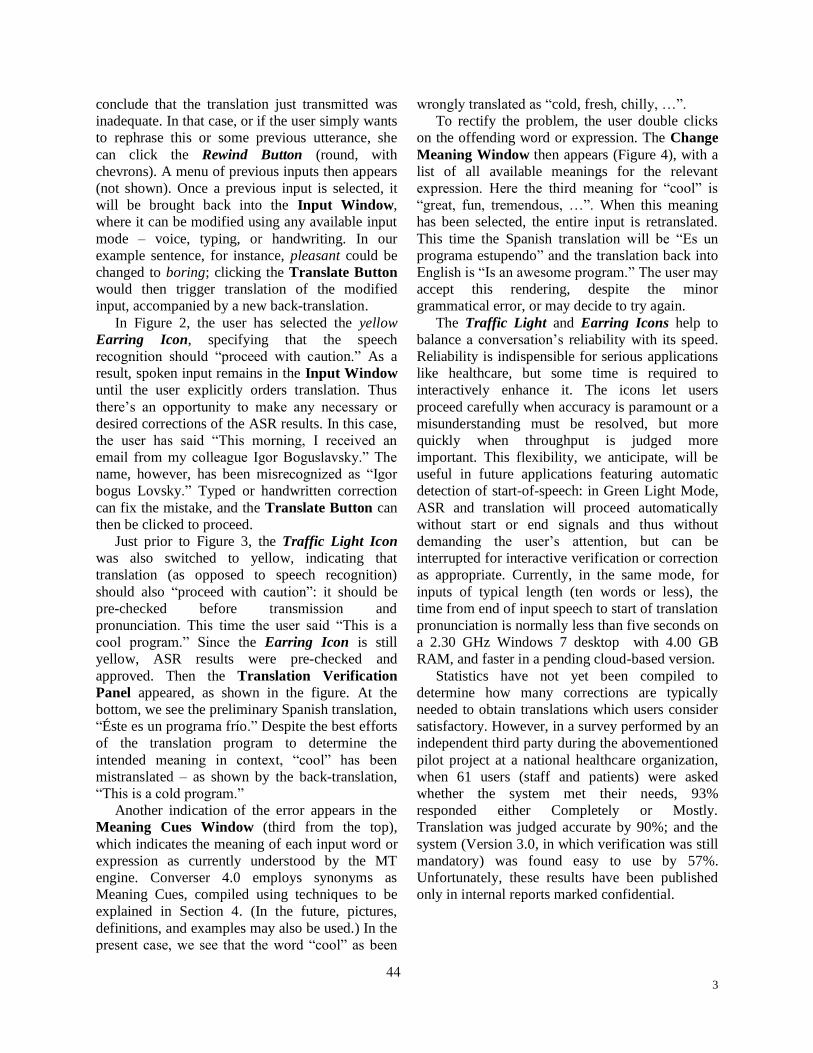
3
conclude that the translation just transmitted was
inadequate. In that case, or if the user simply wants
to rephrase this or some previous utterance, she
can click the Rewind Button (round, with
chevrons). A menu of previous inputs then appears
(not shown). Once a previous input is selected, it
will be brought back into the Input Window,
where it can be modified using any available input
mode – voice, typing, or handwriting. In our
example sentence, for instance, pleasant could be
changed to boring; clicking the Translate Button
would then trigger translation of the modified
input, accompanied by a new back-translation.
In Figure 2, the user has selected the yellow
Earring Icon, specifying that the speech
recognition should “proceed with caution.” As a
result, spoken input remains in the Input Window
until the user explicitly orders translation. Thus
there’s an opportunity to make any necessary or
desired corrections of the ASR results. In this case,
the user has said “This morning, I received an
email from my colleague Igor Boguslavsky.” The
name, however, has been misrecognized as “Igor
bogus Lovsky.” Typed or handwritten correction
can fix the mistake, and the Translate Button can
then be clicked to proceed.
Just prior to Figure 3, the Traffic Light Icon
was also switched to yellow, indicating that
translation (as opposed to speech recognition)
should also “proceed with caution”: it should be
pre-checked before transmission and
pronunciation. This time the user said “This is a
cool program.” Since the Earring Icon is still
yellow, ASR results were pre-checked and
approved. Then the Translation Verification
Panel appeared, as shown in the figure. At the
bottom, we see the preliminary Spanish translation,
“Éste es un programa frío.” Despite the best efforts
of the translation program to determine the
intended meaning in context, “cool” has been
mistranslated – as shown by the back-translation,
“This is a cold program.”
Another indication of the error appears in the
Meaning Cues Window (third from the top),
which indicates the meaning of each input word or
expression as currently understood by the MT
engine. Converser 4.0 employs synonyms as
Meaning Cues, compiled using techniques to be
explained in Section 4. (In the future, pictures,
definitions, and examples may also be used.) In the
present case, we see that the word “cool” as been
wrongly translated as “cold, fresh, chilly, …”.
To rectify the problem, the user double clicks
on the offending word or expression. The Change
Meaning Window then appears (Figure 4), with a
list of all available meanings for the relevant
expression. Here the third meaning for “cool” is
“great, fun, tremendous, …”. When this meaning
has been selected, the entire input is retranslated.
This time the Spanish translation will be “Es un
programa estupendo” and the translation back into
English is “Is an awesome program.” The user may
accept this rendering, despite the minor
grammatical error, or may decide to try again.
The Traffic Light and Earring Icons help to
balance a conversation’s reliability with its speed.
Reliability is indispensible for serious applications
like healthcare, but some time is required to
interactively enhance it. The icons let users
proceed carefully when accuracy is paramount or a
misunderstanding must be resolved, but more
quickly when throughput is judged more
important. This flexibility, we anticipate, will be
useful in future applications featuring automatic
detection of start-of-speech: in Green Light Mode,
ASR and translation will proceed automatically
without start or end signals and thus without
demanding the user’s attention, but can be
interrupted for interactive verification or correction
as appropriate. Currently, in the same mode, for
inputs of typical length (ten words or less), the
time from end of input speech to start of translation
pronunciation is normally less than five seconds on
a 2.30 GHz Windows 7 desktop with 4.00 GB
RAM, and faster in a pending cloud-based version.
Statistics have not yet been compiled to
determine how many corrections are typically
needed to obtain translations which users consider
satisfactory. However, in a survey performed by an
independent third party during the abovementioned
pilot project at a national healthcare organization,
when 61 users (staff and patients) were asked
whether the system met their needs, 93%
responded either Completely or Mostly.
Translation was judged accurate by 90%; and the
system (Version 3.0, in which verification was still
mandatory) was found easy to use by 57%.
Unfortunately, these results have been published
only in internal reports marked confidential.
44
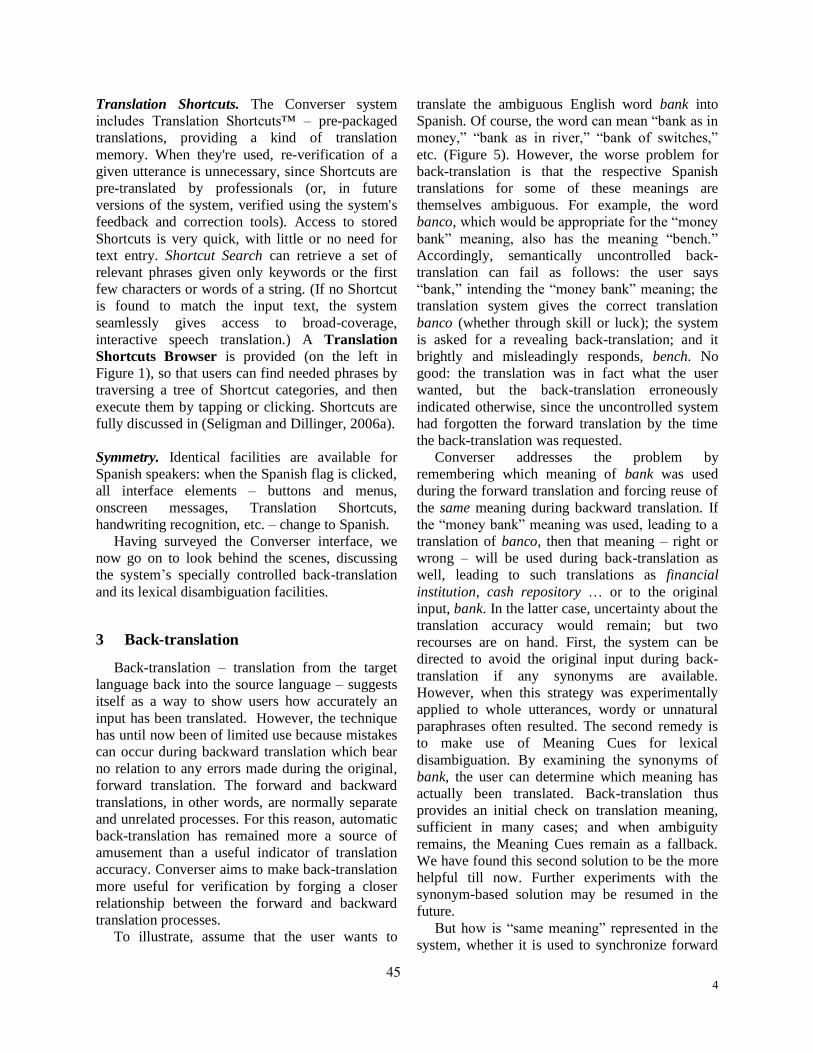
4
Translation Shortcuts. The Converser system
includes Translation Shortcuts™ – pre-packaged
translations, providing a kind of translation
memory. When they're used, re-verification of a
given utterance is unnecessary, since Shortcuts are
pre-translated by professionals (or, in future
versions of the system, verified using the system's
feedback and correction tools). Access to stored
Shortcuts is very quick, with little or no need for
text entry. Shortcut Search can retrieve a set of
relevant phrases given only keywords or the first
few characters or words of a string. (If no Shortcut
is found to match the input text, the system
seamlessly gives access to broad-coverage,
interactive speech translation.) A Translation
Shortcuts Browser is provided (on the left in
Figure 1), so that users can find needed phrases by
traversing a tree of Shortcut categories, and then
execute them by tapping or clicking. Shortcuts are
fully discussed in (Seligman and Dillinger, 2006a).
Symmetry. Identical facilities are available for
Spanish speakers: when the Spanish flag is clicked,
all interface elements – buttons and menus,
onscreen messages, Translation Shortcuts,
handwriting recognition, etc. – change to Spanish.
Having surveyed the Converser interface, we
now go on to look behind the scenes, discussing
the system’s specially controlled back-translation
and its lexical disambiguation facilities.
3 Back-translation
Back-translation – translation from the target
language back into the source language – suggests
itself as a way to show users how accurately an
input has been translated. However, the technique
has until now been of limited use because mistakes
can occur during backward translation which bear
no relation to any errors made during the original,
forward translation. The forward and backward
translations, in other words, are normally separate
and unrelated processes. For this reason, automatic
back-translation has remained more a source of
amusement than a useful indicator of translation
accuracy. Converser aims to make back-translation
more useful for verification by forging a closer
relationship between the forward and backward
translation processes.
To illustrate, assume that the user wants to
translate the ambiguous English word bank into
Spanish. Of course, the word can mean “bank as in
money,” “bank as in river,” “bank of switches,”
etc. (Figure 5). However, the worse problem for
back-translation is that the respective Spanish
translations for some of these meanings are
themselves ambiguous. For example, the word
banco, which would be appropriate for the “money
bank” meaning, also has the meaning “bench.”
Accordingly, semantically uncontrolled back-
translation can fail as follows: the user says
“bank,” intending the “money bank” meaning; the
translation system gives the correct translation
banco (whether through skill or luck); the system
is asked for a revealing back-translation; and it
brightly and misleadingly responds, bench. No
good: the translation was in fact what the user
wanted, but the back-translation erroneously
indicated otherwise, since the uncontrolled system
had forgotten the forward translation by the time
the back-translation was requested.
Converser addresses the problem by
remembering which meaning of bank was used
during the forward translation and forcing reuse of
the same meaning during backward translation. If
the “money bank” meaning was used, leading to a
translation of banco, then that meaning – right or
wrong – will be used during back-translation as
well, leading to such translations as financial
institution, cash repository … or to the original
input, bank. In the latter case, uncertainty about the
translation accuracy would remain; but two
recourses are on hand. First, the system can be
directed to avoid the original input during back-
translation if any synonyms are available.
However, when this strategy was experimentally
applied to whole utterances, wordy or unnatural
paraphrases often resulted. The second remedy is
to make use of Meaning Cues for lexical
disambiguation. By examining the synonyms of
bank, the user can determine which meaning has
actually been translated. Back-translation thus
provides an initial check on translation meaning,
sufficient in many cases; and when ambiguity
remains, the Meaning Cues remain as a fallback.
We have found this second solution to be the more
helpful till now. Further experiments with the
synonym-based solution may be resumed in the
future.
But how is “same meaning” represented in the
system, whether it is used to synchronize forward
45

5
and backward translation or to find synonyms that
can be substituted for original terms during
backward translation? We now make use of an MT
engine whose lexicon elements are Meaning IDs
(MIDs) – semantic elements comparable to the
synsets (synonym sets) of WordNet (Miller, 1995;
Fellbaum et al, 1998). Thus during back-translation
or synonym substitution, the system can enforce
re-use of specific MIDs. (MIDs are illustrated in
Figure 6 as e.g. MID#567122-567127.) Later in the
paper, we’ll comment on comparable techniques
for statistical machine translation (SMT) systems.
4 Lexical Disambiguation
In Section 2, we illustrated Converser’s facility
for lexical disambiguation using Meaning Cues.
The cues are not part of the third-party MT engine
itself, but are added by Converser as a bridge
between that engine and the user. This section
explains how the addition is accomplished.
The explanation will refer to the rule-based
machine translation engine presently in use; but
again, we’ll sketch below how the procedures can
be extended to statistical engines.
As mentioned, the main lexicon of our engine is
composed of Meaning IDs or MIDs, semantic
elements comparable to WordNet’s synsets.
However, while these unique identifiers are
suitable for programming, they remain opaque to
human readers, as seen on the left of Figure 6.
Hence there is a need to elucidate their meanings
for those readers. Many suitable cues are available
in the public domain – synonyms, pictures,
examples, definitions, and others. The problem is
to associate these with the lexicon’s opaque
symbols.
The first step toward this link-up is to collect
relevant cues. We then sort collected cues into
semantic groups, using techniques described in
(Seligman et al 2004). In essence, we define and
exploit best-match metrics for grouping purposes,
for instance in terms of maximum intersection
among such elements of interest as synonym sets
or definitions. The result is a proprietary database
called SELECT, a collection of Meaning Cue
Groups, as seen on the right of Figure 6.
The remaining task is to map or align every
group of semantic cues with an appropriate MID,
if one can be found, in the current machine
translation lexicon. A successful mapping, as
portrayed in Figure 6, will for instance associate
MID#567123 with the Meaning Cue Group
containing cues for bank in the money sense, while
MID#567124 maps to bank in the river sense, and
so on. Three such associations are represented by
arrows in the figure. The techniques for
automating MID-to-cue-group mappings are
described in (Seligman et al 2004). Groupings and
mappings are checked by linguists, so the overall
process of adding Meaning Cues to the native MT
engine can be described as semi-automatic.
Statistical machine translation. When
extending these techniques to statistical MT
engines, we plan to proceed as follows:
Begin with a standard SMT phrase table, in
which each line represents a source language term
and a possible translation. Employ a paraphrase
extraction tool to create a secondary table in which
each line is a source language term and one
possible synonym. Consolidate such synonym
lines to compose synsets, or synonym sets. Finally,
collect synsets related to a given word or
expression to yield sets of synsets, equivalent to
sets of Meaning Cues seen in the Change
Meaning Window of Figure 4. These can be
presented to users as described above to enable
word meaning choices. Once a preferred meaning
has been selected, e.g. for cool, a new translation
can be generated by modifying translation
probabilities during decoding, or by re-ranking
candidate translations following decoding.
(Temporary data structures can be used to avoid
premature alteration of permanent ones. However,
temporary results can eventually be integrated into
master structures to improve translation results.)
To create meaning-preserving back-translations
of an input sentence in an SMT context, we first
identify, for each word or expression in the input,
the meaning (represented as a synset) used in the
forward translation. To make this identification,
we observe the currently proposed translation of
the current word. For example, it might be English
cool, provisionally translated as frio. We compose
a synset containing English synonyms for cool
which according to the translation table can
likewise be translated as frio. Then, armed with the
meaning (synset) of every expression in the input
sentence, we exploit the techniques just explained
to force a new meaning-preserving translation.
46

6
5 Conclusions
The first purpose here has been to give an
updated view of the toolset for highly interactive
speech translation in Converser for Healthcare 4.0,
with emphasis upon lexical disambiguation. We’ve
illustrated the new interface’s handling of several
examples, involving the Rewind Button, icons for
switching Verification Mode on and off for speech
recognition and translation, the Verification
Panel, and the Change Meaning Window.
The second goal has been to give a look
backstage: we’ve explained in outline how
semantically controlled back-translation and
Meaning Cues have been implemented, with a
look-ahead toward their extension into statistical
machine translation.
Future work will feature actual implementation
of interactive SMT, enabling interactive spoken
language translation among many more languages.
Acknowledgments
The authors thank the many participants in the
development of Converser for Healthcare and look
forward to thanking by name the organization
which sponsored a pilot project for Converser.
References
Mike Dillinger and Mark Seligman. 2004a. “System
Description: A Highly Interactive Speech-to-speech
Translation System.” Association for Machine
Translation in the Americas (AMTA-04).
Washington, DC, September 28 – October 2, 2004.
Mike Dillinger and Mark Seligman. 2004b. “A highly
interactive speech-to-speech translation system.” In
Proceedings of the VI Conference of the Association
for Machine Translation in the Americas.
Washington, D.C., September-October, 2004.
Christiane Fellbaum, ed. 1998. WordNet: An Electronic
Lexical Database. Cambridge, MA: MIT Press.
Yuqing Gao, Gu Liang, Bowen Zhou, Ruhi Sarikaya,
Mohamed Afify, Hong-Kwang Kuo, Wei-zhong Zhu,
Yonggang Deng, Charles Prosser, Wei Zhang, and
Laurent Besacier. 2006. “IBM MASTOR system:
multilingual automatic speech-to-speech translator.”
In HLT-NAACL 2006: Proceedings of the Workshop
on Medical Speech Translation. New York, NY, June,
2006.
George Miller. 1995. “WordNet: A Lexical Database
for English.” Communications of the AMC, Vol. 38,
No. 11:39-41.
Mark Seligman, Mike Dillinger, Barton Friedland, and
Gerald Richard Cain. 2014. “Method and Application
for Cross-lingual Communication.” US Patent 7, 539,
619, Application for Continuation 13797628.130326.
Mark Seligman and Mike Dillinger. 2013. “Automatic
Speech Translation for Healthcare:: Some Internet
and Interface Aspects.” TIA (Terminology and
Artificial Intelligence) 2013: Proceedings of the
Workshop on Optimizing Understanding in
Multilingual Hospital Encounters. Paris, France,
October 30, 2013.
Mark Seligman and Mike Dillinger. 2012. “Spoken
Language Translation: Three Business
Opportunities.” Association for Machine Translation
in the Americas (AMTA-12). San Diego, CA,
October 28 – November 1, 2012.
Mark Seligman and Mike Dillinger. 2011. “Real-time
Multi-media Translation for Healthcare: a Usability
Study.” Proceedings of the 13th Machine Translation
Summit. Xiamen, China, September 19-23, 2011.
Mark Seligman and Mike Dillinger. 2008. “Rapid
Portability among Domains in an Interactive Spoken
Language Translation System.” COLING 2008:
Proceedings of the Workshop on Speech Processing
for Safety Critical Translation and Pervasive
Applications. Manchester, UK, August 23, 2008,
pages 40-47.
Mark Seligman and Mike Dillinger. 2006a. “Usability
Issues in an Interactive Speech-to-Speech Translation
System for Healthcare.” HLT/NAACL-06:
Proceedings of the Workshop on Medical Speech
Translation. NYC, NY, June 9, 2006.
Mark Seligman and Mike Dillinger. 2006b. “Converser:
Highly Interactive Speech-to-speech Translation for
Healthcare.” HLT/NAACL-06: Proceedings of the
Workshop on Medical Speech Translation. NYC,
NY, June 9, 2006.
Mark Seligman, Mike Dillinger, Barton Friedland, and
Gerald Richard Cain. 2004. “Method and Application
for Cross-lingual Communication.” US Patent 7, 539,
619.
Alexander Waibel. 2012. http://innovation.mfg.de/en/
news-and-features/simultaneous-translation-
university-without-language-barriers-1.11379
47

7
Figure 1: Earring and Traffic Light Icons are green: “Full speed ahead!”
Figure 2: Earring Icon is yellow: “Proceed with caution!”
48

8
Figure 3: Verification Panel, with a lexical disambiguation error in This is a cool program.
Figure 4: The Change Meaning Window, with four meanings of cool.
49
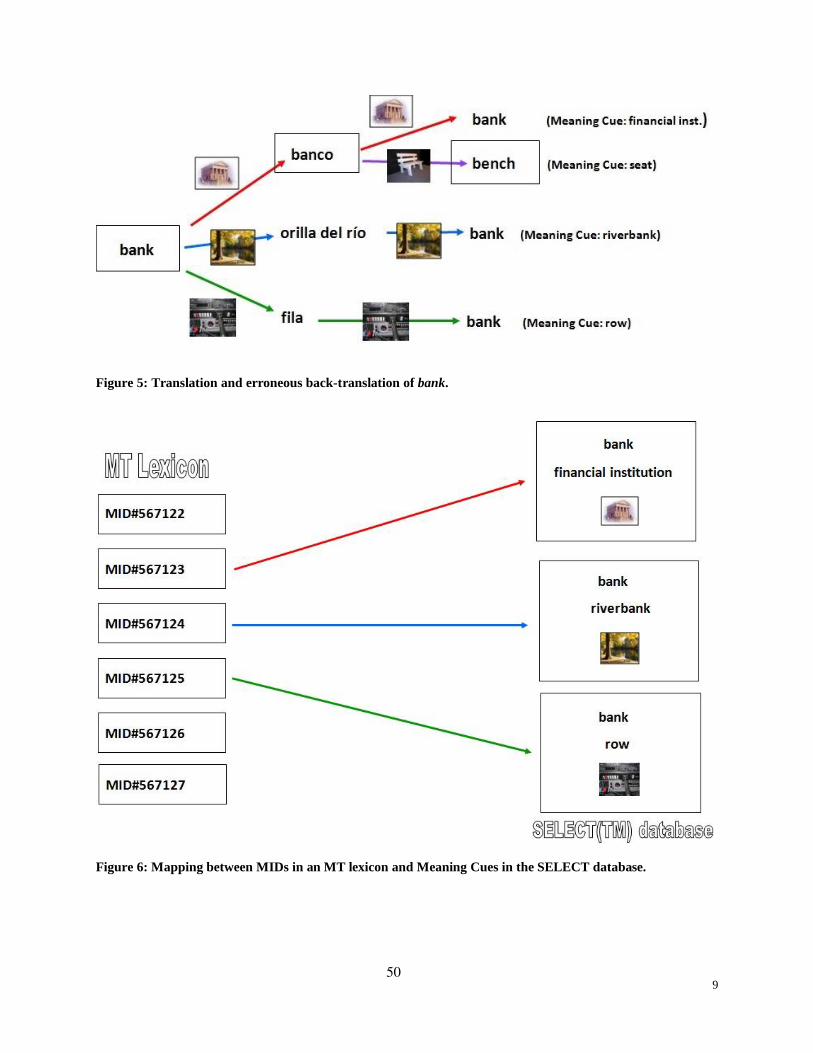
9
Figure 5: Translation and erroneous back-translation of bank.
Figure 6: Mapping between MIDs in an MT lexicon and Meaning Cues in the SELECT database.
50

Proceedings of the Workshop on Interactive and Adaptive Machine Translation, pages 51–60AMTA Workshop. Vancouver, Canada. September 22, 2014
Predicting Post-Editor Profiles from theTranslation Process
Karan Singla [email protected] Institute of Information Technology, Hyderabad, IndiaDavid Orrego-Carmona [email protected] Studies Group, Universitat Rovira i Virgili, Tarragona, SpainAshleigh Rhea Gonzales [email protected] of Linguistics, Simon Fraser University, Burnaby, CanadaMichael Carl [email protected] Business School, Copenhagen, DenmarkSrinivas Bangalore [email protected]&T Labs-Research, Bedminster, USA
Abstract
The purpose of the current investigation is to predict post-editor profiles based on user be-haviour and demographics using machine learning techniques to gain a better understanding ofpost-editor styles. Our study extracts process unit features from the CasMaCat LS14 databasefrom the CRITT Translation Process Research Database (TPR-DB). The analysis has two mainresearch goals: We create n-gram models based on user activity and part-of-speech sequencesto automatically cluster post-editors, and we use discriminative classifier models to character-ize post-editors based on a diverse range of translation process features. The classification andclustering of participants resulting from our study suggest this type of exploration could beused as a tool to develop new translation tool features or customization possibilities.
1 Introduction
While significant strides have been made in statistical machine translation (MT) technology, thequality of fully automated MT systems is still a distant second to the quality of human trans-lations. However, with the increasing demand for translation in the global market, the balancebetween quality and cost of translation is a trade-off many translation companies face. Human-in-the-loop translation techniques1 aim to strike a balance between human and machine factorsto optimize productivity. While the need for a human in the translation process loop is widelyacknowledged, the possible techniques for improving the efficiency of the translator is largelyopen. In the ongoing CasMaCat project (Alabau 2013), there have been several techniquesexplored within the user interface designed for the translator to correct the MT output, suchas automatic correction of the output based on the changes made by the post-editor, automaticreplacement terminology when the post-editor corrects a term and active retraining of the MTmodel based on the changes made by the post-editor.
The task of post-editing is cognitively demanding; thus, it is expected that the post-editingtool factors in significantly to maximize end-user experience. A personalized post-editing tool
1also known as human-assisted MT, machine-assisted human translation and interactive MT
51

that caters and adapts to a user’s work style is bound to improve productivity metrics. Tothis end, we investigate techniques that help identify the post-editor behaviour profile using amultitude of factors tracked during the post-editing process. We study this process as a sequenceof activity events that enable us to identify individual profiles. From the emergent patterns,we are then able to cluster post-editors into subgroups based on the commonalities of theirindividual process sequences. Our main motivation is that a higher level of granularity in theunits that are analyzed would provide a more detailed account of the post-editing process. Theidentification of different post-editing styles and the definition of patterns in those styles at afine-grained level provide insights for (a) the development and adaptation of translation tools,(b) classification of individual translators based on non-process factors (translator experience,translator personality, time constraints, etc.) and (c) the most salient skills required of post-editors, which can later be applied to translator training.
For the current study, we exploit the activity data tracked during the post-editing sessionsto infer clustering and classification models. We investigate a range of machine learning (ML)techniques and validate the learned clusters against demographical metadata provided by thepost-editors to demonstrate the veracity of the inferred models.
2 Related Work
The identification of translator and post-editor styles is an active field in Translation Process Re-search (TPR). To understand factors affecting translation workflow, researchers have exploredactivity data to identify patterns and define style taxonomies. This provides us with an un-derstanding into the cognitive processes involved in translation tasks: It generates user-basedknowledge for software development by considering the effects of training and experience (Carland Schaeffer, forthcoming). However, no such study has applied a machine learning (ML) ap-proach. Rather, the most widespread method to study translator style is the segmentation of thetranslation process into a limited number of subphases that broadly correspond to a preparationphase, a typing phase and a revision phase.
To identify factors and improve translation tools to better support users, Carl et al. (2011)establishes three phases in the translation process: Initial orientation, translation drafting andrevision. Within each phase, the study further identifies different possible behaviours. Eachtranslation phase and behaviour poses separate challenges, so a better choice of task supportoptions for each phase can greatly benefit the end user.
Schrijver et al. (2009) also identifies three phases in the translation process: Pre-writing,writing and post-writing phase. The aim of the study is to explore transediting – the overlappingof translation and editing activities Stetting 1989. Considering the differences between thetranslation process and the transediting process, they configure two translation methods thatvary dependent on where the first word of the target text originates. The second, more detailedmethod identifies nuances that prove important for the completion of the task and the product’sadequacy with regards to the client’s requirements.
Targeting post-editing specifically, Mesa-Lao (2013) suggests six steps that comprise thepost-editing cycle, and identifies four cycles that are more common among post-editors, defininga more specific taxonomy for categorizing post-editing processes. Variation in post-editingstyles is found to be dependent on the type of computer-assisted translation (CAT) tool GUI andthe type of post-editor, which serves as an indicator of user adaptation to different conditions.
Lastly, Martınez-Gomez et al. (2014) employ a ML approach to translator activity se-quence data to identify translator expertise. Surveying 800 translation sessions of an earlierversion of the TPR database, they classify translators based on process features related to gazefixations and keystroke activity. Notably, instead of defining translation activity subphases, theirapproach is to classify sequences of translation events (fixations and keystrokes) into distinct
52

activities to model the translation sessions. The error rate reduces when the analysis operatesunder the hypothesis of translator certification, and significantly when tasked with identifyingtranslators’ years of experience. In contrast with the current study, they focus on the predictionof expertise and years of experience, rather than the identification of translator profiles.
For the current research objectives, we implement generative and discriminative ML mod-els to analyze the activity sequences in post-editing sessions. Profiling translators and post-editors based on fine-grained units of activity hint at different underlying cognitive processesthat occur during translation; this analysis would provide grounds for further and deeper studiesof the cognitive dimension of the translation process. The fact that our methods help identifyrelevant features for the post-editors classification can also provide the statring point to obtainactionable insights for developing better CAT tools.
3 Data
The data for the current study was extracted from the CasMaCat (Alabau 2013) longitudinalstudy (LS14) carried out during a six week period between April and May 2014 (CRITT TPRDatabase2). The training and adaptation factors are the most neglected aspects in post-editingresearch. Few TPR studies have addressed this issue (cf. Massey and Ehrensberger-Dow 2013),although it is commonly explored in research dealing with the development of translation com-petence and translator training in general (Pacte 2009, Gopferich 2009).
The LS14 study is the first of its kind that implements a longitudinal approach to assesshow post-editors adapt to different GUI designs and work environments. The data collectionincludes five post-editors employed with a translation agency in Madrid, Spain. Participantsused the CasMaCat workbench to perform the post-editing tasks (Ortiz-Martınez et al. 2012).Each week, each participant translated four texts under two conditions – Two texts with tra-ditional post-editing (TPE) and two texts under interactive post-editing (IPE), which providespost-editors with real-time translation suggestions to aid in task completion – for a total of 24texts and 120 translations sessions. All participants were native speakers of Spanish and trans-lated from English into Spanish. The raw logging data included in the LS14 study is mainlyderived from the post-editors’ translation activities, extracted under the method detailed in Carland Schaeffer (2013). Eye-tracking data was also collected for all post-editors, but only for thefirst and last weeks of the experiment, so only one-third of the files includes gaze data.
In order to identify the post-editor profiles and to conduct a benchmark study using MLtechniques, we focus our analyses on the information logged in the post-editing session. Weinclude three types of segmentation information derived from process unit file conventions ex-tracted from the LS14 TPR-DB3): Activity units (CU), production units (PU), and translationsegments (SG), which are detailed below.
CUid Session Time Dur TTseg Type Label83 PE1 P1 480671 1839 1255 8 CU83-S:1255-T:8-D:183984 PE1 P1 482510 163 1255 4 CU84-S:1255-T:4-D:16385 PE1 P1 482673 8202 1255 8 CU85-S:1255-T:8-D:820286 PE1 P1 490875 1526 1255 4 CU86-S:1255-T:4-D:1526
Table 1: Activity unit (CU) of post-editing activities from Participant 1 (PE1) in Segment 1255
2CRITT Translation Process Research (TPR) Database http://bridge.cbs.dk/platform/?q=node/183Carl and Schaeffer (2013) offer a detailed account of the data annotation methods and the different units used in
the CRITT TPR Database
53

3.1 Activity Units (CU)Features from the activity units serve as a baseline of user translation processes. The sequenceswithin the translation session is a segmentation of typing, reading or pause activity recordings.We employ a dichotomous model: Activity is categorized as either Translation activity (Type4) or No Activity (Type 8) to follow the conventions of Carl and Schaeffer (2013). To achievefiner-grained distinctions in the activity profile, we refine the activity labels with duration in-formation of each event resulting in five additional classes centered around the median duration(in milliseconds). Furthermore, Part-of-speech (PoS) sequences extracted from the target text(TT) files are aligned with the CU data. There are in 68 unique PoS tags identified for Spanishin LS14, derived from TrEd/Treex (Pajas 2004, Popel and Zabokrtsky 2010).
3.2 Production Units (PU)Each production unit represents a coherent sequence of typing activity and includes informationabout the duration of the unit, duration of the preceding pause, number of edits, insertions anddeletions, tokens involved in the source text and target text and average cross values. Crossvalues are the “relative local distortion of the reference text with respect to the output text, andindicate how many words need to be consumed in the reference to produce the next token(s) inthe output” (Carl and Schaeffer 2013). A PU boundary is defined by a time lapse of more thanone second between successive keystrokes.
3.3 Translation Segments (SG)Translation segments provide sequence information of aligned source and target text segmentsdetailing the segment production duration, character length, insertions and deletions and gazedata, when available. Average word entropy, cross values, perplexity, and source text literalitywere also calculated and appended to this file type, given the level of segmentation that ouranalysis required.
4 Experiments and Results
TPR-db LS14
MetadataTarget Text Activity Units Segments Production Units
Generative Modelling Discriminative Modelling
PoS sequences
Language Models
Perplexity Scores
Clustering Models
Feature Extraction
Data Normalization
Process UnitRepository
Decision Treesn-grams MLP
Random Forest
Feature Selection
Classification Models
Activity sequences
Algorithms
Figure 1: Basic pipeline of the study: Generative and discriminative models.
54

Category Feature Description
allParticipant participant identifierDur duration of the unit
CU
Type type of activity unitdur cu duration of activity unitsTokS number of source tokens in the segmentTokT number of target tokens in the segmentPoS part of speech tag
CU, SGLenS character length of source segmentLenT character length of target segment
SG
Nedit number of edits of the segmentLenMT character length of the machine translation segment
Kdurduration of coherent keyboard activity excluding keystrokepauses greater than or equal to five (5) seconds
Fdurduration of segment production time excluding keystrokepauses greater than or equal to 200 seconds
Mins Number of manually generated insertionsMdel Number of manually generated deletionsAins Number of automatically generated insertionsAdel Number of automatically generated deletionsSTent average word translation entropy of the segmentPP perplexity score of the segment based on STentSTlit source text literalityFixS number of fixations on the source text unitFixT number of fixations on the target text unitGazeS total gaze time on source text unitGazeT total gaze time on target text unitSTcr2 cross value of source text tokenTTcr2 cross value of target text token
SG, PU
CrossS cross value of source tokenCrossT cross value of target tokenSTseg source segment identifierTTseg target segment identifier
PU
Time timestamp of the eventParalS percentage of parallel source text reading activity during unit productionParalT percentage of parallel target text reading activity during unit productionLinear degree of linear editingPause duration of production pause before typing onset
Table 2: Master process unit feature list
4.1 ToolkitsWe use the Waikato Environment for Knowledge Analysis, WEKA 3.6 (Hall et al. (2009)) open-source toolkit for data mining and machine learning. Using several machine learning algorithmsprovided by the toolkit, we train various classification models. For the generative models, weuse the SRI Language Modeling (SRILM) Toolkit (Stolcke 2002).
4.2 Claustering Post-EditorsUsing the SRILM toolkit, we build n-gram models on Activity Unit sequences and target textPoS sequences of each post-editor. We use perplexity values as scores in a k-mean clustering tofind similarity between post-editors, and then validate these clusters using the metadata.
Clustering Based on Activity Unit SequencesThe original CU files included in the TPR database contain eight types of activities. However,this classification of activity labels depends on the gaze information, which unfortunately is not
55

available across all points in our data. As such, we map the original eight categories into two:
• Type 4 (Translation activity, T4): Activity units as defined by a sequence of coherenttyping, which may also include gaze information; and,• Type 8 (No Activity, T8): Boundary between two activity units defined as a pause of
1000ms or more without any keyboard activity.
Under this modified categorization, because there are now only two types of activity, translationactivity (Type 4) is always followed by a pause (Type 8). This creates a model in which onlytwo transitions are possible (T4-T8-T4 or T8-T4-T8). Therefore, we further subdivide Type 4and Type 8 into five categories based on the duration of these events: Five buckets centered onthe median duration, further partitioning the activity and pause units into five subgroups. Table3 illustrates the generated sequences considering the duration of the translation and pause units.We create a standard trigram language model on the activity sequences of each post-editor. The
P01 T4,1 T8,3 T4,1 T8,2 T4,5 ...P02 T8,2 T4,3 T8,4 T4,1 T8,1 ......P05 T4,1,, T8,3 T4,2 T8,5 T4,2 ...
Table 3: Sample user participant activity sequences bucketed by duration
language model of one post-editor is then used to calculate the perplexity scores of the activitysequences for all the other post-editors. Perplexity, PP , is often used for measuring the fit ofa language model to a corpus of sequences. It can be interpreted as the average number oftokens that can be produced by a model at each point in the sequence. For a test set with tokensW = w1, w2, ..., wn, the perplexity of a trigram model on the test set is
PPW =∏
P (wi | wi−1, wi−2)− 1
n
where it can be noted that perplexity is normalized by the number of tokens in the test sequence.Table 4 shows the perplexity scores of each post-editors language model on the other post-
editor’s activity sequences. It illustrates that the diagonal contains the smallest perplexity valuesince the dataset is the same as the one used to create the model.4
PE1 LM PE2 LM PE3 LM PE4 LM PE5 LMPE1 4.09526 4.3195 4.62186 4.84951 4.39231PE2 4.30064 4.06063 4.41296 4.60593 4.40357PE3 4.63742 4.39636 4.06999 4.30479 4.85385PE4 4.47429 4.29059 3.99274 3.80005 4.88682PE5 4.00879 4.09205 4.46445 4.81527 3.80372
Table 4: Perplexity scores for the Activity sequence LM model for all post-editors
We use the perplexity values as distance costs in a k-means clustering algorithm to producetwo (k = 2) clusters. We obtain the following clusters: Cluster1{PE1, PE2, PE5} andCluster2{PE3, PE4}. When looking for possible explanations in the metadata, we foundthat cluster1 includes the most experienced post-editors. Based on the findings provided bythis clustering, it seems to be the case that experienced post-editors produce similar kinds ofactivity sequences in contrast with the activity sequences of inexperienced post-editors.
4However, an exception as seen in Table 4, PE 3’s activity model has a higher perplexity score on PE 3’s sequencecompared to that on PE 4’s activity sequence.
56

Clustering Based on Target Text Part-of-Speech SequencesWe extract the PoS sequences for each segment in the target text and created a n-gram languagemodel for each post-editor (PE). Then we use this model to calculate the perplexity values of thelanguage model for all other post-editors to measure the appropriateness of the model. Using theperplexity scores as distance metrics, we grouped the post-editors into two clusters by applyingstandard k-means clustering: Cluster1{PE1, PE3, PE5} and Cluster2{PE2, PE4}. Toaccount for this clustering, we compare the results with the participant metadata. We find thatPost-Editor 2 and Post-Editor 4 share a very negative response to the post-editing approach,whereas the other three participants did not indicate such apprehension towards the task. Con-sidering our data, this seems to indicate that post-editors with similar negative response towardspost-editing tend to have similar activity patterns.
4.3 Discriminating Post-Editors
Unlike generative modelling which clusters the post-editors based on their shared characteris-tics, discriminative modelling is done to determine if the ML models are able to identify thefive post-editors based on their activity profiles. We carry out tests on the three types of datamentioned in Section 3: activity units, productions units and translation segments. We segmentthe data to analyze the effect of the GUI (traditional post-editing and interactive post-editing) inthe analyses. We apply various ML algorithms with 10-fold cross validation for classification,but find that “multilayer perceptron” and “classification via regression” perform best for thistask of identifying the post-editors. The baseline accuracy is 20% given that there are the samenumber of samples for the five participants.
Algorithm Traditional PE Interactive PE Combined
Activity Unit ProfileMultilayer Perceptron 40.58 % 35.51 % 41.54 %Classification via Regression 42.37 % 36.82 % 42.72 %
Production Unit ProfileMultilayer Perceptron 44.67 % 39.82 % 37.06 %Classification via Regression 45.83 % 47.69 % 46.48 %
Translation Segment ProfileMultilayer Perceptron 42.88 % 46.93 % 44.45 %Classification via Regression 44.64 % 47.51 % 45.71 %
Table 5: Results for the 5-way classification task to discriminate post-editors based on activity,production and translation segments profiles created at the segment level.
Activity Unit ProfileTable 5 shows results obtained from frequencies of unigrams and bigrams of activities as fea-tures for discriminating post-editors. It illustrates that the model is able to discriminate post-editors better when they use the traditional PE GUI, with 42.37% accuracy, compared to 36.82%in the Interactive PE environment. However, when the data is combined using the GUI as anadditional feature, accuracy of the model remains almost the same at 42.72%.
Production Unit ProfileWe create a features matrix using the PU features described in Table 2 to identify post-editors.In the matrix, all text dependent features have been normalized using LenS (character length ofsource sentence) to ensure that the system is not biased by differences in the length of the text.Considering there are multiple production units for each segment, and that the number of PUsvary per post-editor, we make a sparse vector to group together the different production unitsof each segment. As shown in Table 5, we achieve 46.48% accuracy while using the entire dataset with GUI as a feature. When dividing the data set depending on the GUI, we achieve an
57

accuracy of 47.69% and 45.83% with the system discriminating post-editors in the traditionaland interactive enabled GUI, respectively.
Translation Segment Profile
Translation segments have some features overlapping with production unit profiles as detailed inTable 2. Nevertheless, in this file, all the information is cumulative for a segment and dependenton the text, while in the production unit files, the information is created based on the post-editors’ typing bursts. When testing the combined dataset including the data from the twoGUIs, the model has an accuracy of 45.71%. When running the tests independently for the twoGUIs, the TPE dataset achieves 44.64% of accuracy, while the IPE dataset reaches 47.51% ofaccuracy.
4.4 Feature Analysis
To serve as a clearer visualization of the features identified as salient by the classifiers, wepresent in Figure 2 a detail of a decision tree learned using a J4.8 classifier. The most relevantfeatures to classify post-editors are related to different types of duration (Fdur, Kdur, Dur) andthe post-editors’ typing activity (Mins, Nedit).
1: Fdur
2: Mins 17: Mins
18: Kdur
25: Fdur
19: Kdur
22: Nedit
26: Fdur
29: Mins
3: Fdur
10: Mins
4: Kdur
7: Mins
11: Dur
14: Kdur
<359.68 ≥359.68
<0.58≥0.58
<180.11≥180.11
<664.62≥664.62
<0.31≥0.31
<213.97≥213.97
<0.51 ≥0.51
Figure 2: Decision tree of salient features from Translation Segments (SG)
5 Discussion
In this paper, we test the hypothesis that events that make up the translation process provideenough information for the individualization of post-editor profiles. By using machine learningmodels, we are able to not only find the post-editors’ profiles, but also cluster and discriminatebetween post-editors. Classifying post-editors based on activity microunits, either dependenton the text or on the individual user, provides interesting results that are worth exploring intranslation studies and computer science. However, since only a few post-editors participatedin this pilot collection, the current study should be considered only as an initial exploration ofsuch methods on translation process data. Considering our initial results, it would be beneficialto explore how additional features on a different segmentation level affect the models, and towhat degree, if at all. For example, information related to user personality, user training andexperience, testing conditions, genre of the text and other qualitative features can be added tothe existing models to explore non-activity factors.
58
6 Conclusion
Computer assisted translation remains a progressive field of research, and there is an ever-growing interest in providing translators and post-editors with better software tools to facilitatetheir work and increase productivity. Identifying how translators interact with the tools and gaininsights into features that have an impact on their performance can help in the development of anew generation of translation tools. TPR aims at uncovering the cognitive process that unfold inthe translator’s mind while performing the translation tasks. Although our sample is undoubt-edly limited consisting of data from five participants only, our results can serve as indicatorof an avenue that starts providing interesting consideration that could be further explored at abigger and more comprehensive scale. The insights brought forth from this study are gatheredunder the goal of performance improvement through different channels: (1) Providing bettertools and (2) uncovering training needs. The empirical methods of the current study provide thefoundation for further exploration of the translation process in order to satisfy the needs in thoseareas. We believe our methods of user participant profiling can be adapted and extrapolated toanalyze different translation processes and provide researchers with solid findings for multipleapplications in the field.
7 Acknowledgments
This work was supported by EU’s 7th Framework Program (FP7/2007-2013) under grant agree-ment 287576 (CASMACAT).
References
Alabau, V. (2013). Web technologies in casmacat. Interactive machine translation. Speech & Eye-TrackingEnabled CAT (SEECAT). Copenhagen, Denmark,.
Carl, M., Dragsted, B., and Jakobsen, A. (2011). A Taxonomy of Human Translation Styles. TranslationJournal, 16(2):n.p.
Carl, M. and Schaeffer, M. J. (2013). The CRITT Translation Process Research Database v1.4.http://bridge.cbs.dk/resources/tpr-db/TPR-DB1.4.pdf.
Carl, M. and Schaeffer, M. J. (forthcoming). Processes of Literal Translation and Post-editing.
Gopferich, S. (2009). Towards a model of translation competence and its acquisition: the longitudinalstudy ’transcomp. In Gopferich, S., Jakobsen, A. L., and Mees, I. M., editors, Behind the Mind:Methods, Models and Results in Translation Process Research, Copenhagen Studies in Language 37,pages 11–37. Copenhagen.
Hall, M., Frank, E., Holmes, G., Pfahringer, B., Reutemann, P., and Witten, I. H. (2009). The weka datamining software: An update. SIGKDD Explorations, 11(1).
Martınez-Gomez, P., Minocha, A., Huang, J., Carl, M., Bangalore, S., and Aizawa, A. (2014). Recognitionof Translator Expertise using Sequences of Fixations and Keystrokes. In Qvarfordt, P. and Hansen,D. W., editors, Proceedings of Symposium on Eye Tracking Research and Applications, pages 299–302,New York, USA.
Massey, G. and Ehrensberger-Dow, M. (2013). Evaluating translation processes: opportunities and chal-lenges. In Kiraly, D., Hansen-Schirra, S., and Maksymski, K., editors, New Prospects and Perspec-tives for Educating Language Mediators, Translation Studies Series 10, pages 157–180. Gunter Narr,Tubingen.
59

Mesa-Lao, B. (2013). Eye-tracking Post-editing Behaviour in an Interactive Translation Prediction Envi-ronment. In Proceedings of the 17th European Conference on Eye Movements, Lund, Sweden.
Ortiz-Martınez, D., Sanchis-Trilles, G., Casacuberta, F., Alabau, V., Vidal, E., Benedı, J.-M., Gonzalez-Rubio, J., Sanchis, A., and Gonzalez, J. (2012). The CASMACAT Project: The Next GenerationTranslator’s Workbench. In Proceedings of the 7th Jornadas en Tecnologıa del Habla and the 3rdIberian SLTech Workshop (IberSPEECH), page 326–334.
Pacte (2009). Results of the validation of the pacte translation competence model: Acceptability anddecision making. Across Languages and Cultures, 10(2):207–230.
Pajas, P. (2004). Tred tree editor. http://ufal.mff.cuni.cz/tred/.
Popel, M. and Zabokrtsky, Z. (2010). Tectomt: Modular nlp framework. In Lecture Notes in ComputerScience, Vol. 6233, Proceedings of the 7th International Conference on Advances in Natural LanguageProcessing (IceTAL 2010), pages 293–304, Berlin/Heidelberg. Springer.
Schrijver, I., van Vaerenbergh, L., and van Waes, L. (2009). Transediting in students’ translation processes.Artesis VT working papers, 1:1–31.
Stetting, K. (1989). Transediting: A new term for coping with the grey area between editing and trans-lating. In Caie, G., Haastrup, K., and Arnt Lykke Jakobsen, e. a., editors, Proceedings from the FourthNordic Conference for English Studies, pages 371–382, Copenhagen: University of Copenhagen.
Stolcke, A. (2002). SRILM – an extensible language modeling toolkit. In Proceedings of ICSLP, volume 2,pages 901–904, Denver, USA.
60
Author Index
Alabau, Vicent, 1
Bangalore, Srinivas, 51
C. de Souza, José G., 9Carl, Michael, 1, 51Casacuberta, Francisco, 1
Dillinger, Mike, 42Dragsted, Barbara, 1
García-Martínez, Mercedes, 1Germann, Ulrich, 20Gonzales, Ashleigh Rhea, 51González-Rubio, Jesús, 1
Mathur, Prashant, 32Mauro, Cettolo, 32Mesa-Lao, Bartolomé, 1
Negri, Matteo, 9
Orrego Carmona, David, 51Ortiz-Martínez, Daniel, 1
Petersen, Dan Cheung, 1
Sanchis Trilles, Germán, 1Seligman, Mark, 42Singla, Karan, 51
Turchi, Marco, 9
61


![TrustinSocialHRI · Sources MotivationFundamentalsAttributesSummary [.2003] The 12th IEEE International Workshop on Robot and Human Interactive Communication, 2003. Proceedings.](https://static.fdocuments.in/doc/165x107/5f0274617e708231d4045845/trustinsocialhri-sources-motivationfundamentalsattributessummary-2003-the-12th.jpg)