Proceedings of the - · PDF fileDonald L. Lester, Middle Tennessee ... A PROOF OF CONCEPT...
246
ASBE 40 TH Annual Conference Proceedings of the Association for Small Business and Entrepreneurship 40 TH Annual Conference Memphis, TN September 24-26, 2014 Editor Eugenie Ardoin University of Louisiana at Monroe
Transcript of Proceedings of the - · PDF fileDonald L. Lester, Middle Tennessee ... A PROOF OF CONCEPT...

ASBE 40TH Annual Conference
Proceedings of the
Association for Small Business and
Entrepreneurship
40TH
Annual Conference
Memphis, TN
September 24-26, 2014
Editor
Eugenie Ardoin
University of Louisiana at Monroe

i
Memphis, TN, September 24-26, 2014
Officers 2014
President:
Laurie A. Babin
University of Louisiana at Monroe
(318) 342-1153
President Elect:
Eugenie A. Ardoin
University of Louisiana at Monroe
(318) 342-1194
Vice President Programs:
Henry S. Cole
University of Louisiana at Monroe
Vice President Membership:
Daniel James Scott
USF St. Petersburg
Secretary/Treasurer:
Leslie Toombs
Texas A&M University, Commerce
Executive Director:
William T. Jackson
USF St. Petersburg-College of Business
(727) 873-4892
Immediate Past President: Dr. Daniel Glaser-Segura
Texas A&M University – San Antonio
(210) 932-6275
Dear Participants,
As stated in our constitution, the purpose of the
Association for Small Business and
Entrepreneurship (ASBE) is to “Provide an active
vehicle for increasing the effectiveness and impact
of small business and entrepreneurial education.”
As you can see from this year’s program, we have a
broad array of topics such as gender differences,
natural disasters, the linkage between strategy and
performance, legal issues, and social media that
directly support our purpose. I am sure each of us
will garner insights that we can implement in our
own research, teaching, and service.
It was a pleasure to work with a great slate of
ASBE officers this year. Eugenie Ardoin, ASBE’s
new president, and her incoming administrative
group are sure to give us another excellent year.
Henry Cole and the many track chairs deserve
kudos for putting together an outstanding
conference program. Many thanks go to William
(Bill) Jackson for managing the conference site
negotiations and implementation as well as working
closely with the program chair to coordinate the
review of papers and awards for the Journal of
Business and Entrepreneurship and the innovative
awards introduced last year. It is always a pleasure
to recognize and support outstanding research,
teaching, and support for our cause. Daniel James
Scott, initiated into the officer ranks of ASBE this
year, ably handled the membership tasks, and we
appreciate his desire to be elected next year’s vice-
president of programs. I would also like to extend
special thanks to the members participating in this
year’s program – we wouldn’t have a conference
without you. Finally, I would be remiss if I did not
thank Paul Dunn who introduced me to this
organization. The past six years that I have been
active in this organization have refocused my
research and teaching interests significantly. Even
though my term as president is over, I will remain
an active member and supporter of this organization
throughout my career, and I sincerely hope you do,
too. I challenge each one of us to personally recruit
other members from our own institutions and
disciplines.
I hope that you enjoy the conference, and I look
forward to learning about your research and
enjoying good Memphis BBQ with old and new
friends. See you next year!
Sincerely,
Laurie A. Babin, President

i
Memphis, TN, September 24-26, 2014
ASSOCIATION FOR SMALL BUSINESS & ENTREPRENEURSHIP PAST
PRESIDENTS
1975-76 Robert W. Smith, North Texas State University
1977 Ann Hughes, University of Texas, Arlington
1978 Don Altman, Abilene Christian University
1979 Paul Dunn, Northeast Louisiana University
1980 Charles Neil, Texas Tech University
1981 R. Dean Lewis, Sam Houston State University
1982 John Todd, University of Arkansas
1983 Robin Peterson, New Mexico State University
1984 Ray Robbins, University of Arkansas, Little Rock
1985 Gwen F. Fontenot, North Texas State University
1986 Jude Valdez, University of Texas, San Antonio
1987 Homer L. Saunders, University of Central Arkansas
1988 Clyde Spruell, University of Science & Arts of Oklahoma
1989 Don B. Bradley III, University of Central Arkansas
1990 Walter E. Greene, University of Texas, Pan American
1991 Geralyn M. Franklin, Stephen F. Austin State University
1992 Norton E. Marks, California State University, San Bernardino
1993 Herb Lawrence, Gateway Technical College
1994 Buddy Gaster, East Central University
1995 William T. Jackson, Stephen F. Austin State University
1996 Alicia B. Gresham, Stephan F. Austin State University
1997 Louis D. Ponthieu, University of North Texas
1998 Robert D. Gulbro, Athens State University
1999-2001 Don B. Bradley III, University of Central Arkansas
2002 William T. Jackson, University of Texas of the Permian Basin
2003 Patti L. Wilber, Northwestern Oklahoma State University
2004 Corbett F. Gaulden, University of Texas of the Permian Basin
2005 Kitty Campbell, Southeastern Oklahoma State University
2006-07 Leslie A. Toombs, University of Texas of the Permian Basin
2008 Martin Bressler, Houston Baptist University
2009 Kitty Campbell, Southeastern Oklahoma State University
2010 Kathleen Liang, University of Vermont
2011 Stephen Jones, Arkansas Tech University
2012 Martin S, Bressler, Southeastern Oklahoma State University
2013 Daniel Glaser-Segura, Texas A&M University-San Antonio
2014 Laurie A. Babin, University of Louisiana at Monroe

ii
Memphis, TN, September 24-26, 2014
Table of Contents
Message from the ASBE President………………………………………………………........ i
Association for Small Business and Entrepreneurship Past Presidents……………................. ii
DOES GENDER MATTER IN SMALL
BUSINESS?...........................................………………………………………………...……. 1
Henry S. Cole, University of Louisiana at Monroe
Eugenie A. Ardoin, University of Louisiana at Monroe
Stan Williamson, University of Louisiana at Monroe
GOLIATH VS. DAVID: WHY SMALL BUSINESSES NEED TO BE AWARE OF THE
LANHAM ACT…..…………………………………………………………………………... 2
Laurie A. Babin, University of Louisiana at Monroe
Deborah Golemon, University of Louisiana at Monroe
Melissa Melancon, University of Louisiana at Monroe
IPO INVESTOR REACTIONS TO FEMALE DIRECTORS: EVOLVING ROLE
CONGRUITY……………………………………………....………………………………… 3
Christopher R. Reutzel, Sam Houston State University
Carrie A. Belsito, Western Illinois University
THE STRATEGIC MOVE TO ADOPT A NEW TECHNOLOGY. SMEs TRENDS TO
INCORPORATE WIRELESS BUSINESS IN THEIR BUSINESS MODEL……………..… 4
Michael Stoica, Washburn University
William Roach, Washburn University
Anca Gata, “Dunarea de Jos” University of Galati
SUCCESSFUL SMALL BUSINESSES AND THEIR OWNER-
MANAGERS………………………………………………………………………………….. 5
Mildred Golden Pryor, Texas A&M University, Commerce
Leslie A. Toombs, Texas A&M University, Commerce
Lisa Pryor Singleton, Golden, Pryor & Associates
ANALYZING THE LINK BETWEEN STRATEGY AND PERFORMANCE: COMPARING
SMALL BUSINESS OWNERS AND PROFESSIONAL MANAGERS…………….……… 22
William C. McDowell, Middle Tennessee State University
Shanan G. Gibson, College of Business East Carolina University
Michael L. Harris, East Carolina University
Joshua Aaron, Middle Tennessee State University
Donald L. Lester, Middle Tennessee State University

iii
Memphis, TN, September 24-26, 2014
WHAT A RHETORICAL ANALYSIS OF A COMPANY WEBSITE REVEALS ABOUT A
COMPANY’S COMMITMENTS.................................................………………..………….. 48
Anca Gata, Dunarea de Jos University of Galati
Michael Stoica, Washburn University
EXAMINING ENTREPRENEURIAL CHARACTERISTICS, MOTIVATION, BARRIERS,
AND OUTCOMES FOR SMALL VERSUS LARGE MULTIFUNCTIONAL FARM
ENTERPRISES IN NEW ENGLAND……………………………………………………….. 49
Chyi-Lyi (Kathleen) Liang, University of Vermont
Paul Dunn, University of Louisiana at Monroe
A STUDY OF SOCIAL MEDIA USAGE BY SMALL BUSINESS
OWNERS…………………………………………………………………………………...… 93
Martin S. Bressler, Southeastern Oklahoma State University
Kitty Cambell, Southeastern Oklahoma State University
Brett Elliott, Southeastern Oklahoma State University
GENDER DIFFERENCES OF ENTREPRENEURS IN MICRO BUSINESSES…………… 95
Carl A. Kogut, University of Louisiana at Monroe
Donna W. Luse, University of Louisiana at Monroe
Larry E. Short, University of Louisiana at Monroe
CREATIVITY AND ENTREPRENEURSHIP: A REVIEW OF SELECTED LITERATURE
AND PROPOSITIONS.............................................................................................................. 96
Elizabeth Stammerjohan, University of Louisiana at Monroe
Thomas DeNardin, University of Louisiana at Monroe
William W. Stammerjohan, Louisiana Tech University
EXPLORING THE RED QUEEN EFFECT ON VIETNAMESE SMALL BUSINESS AND
INNOVATION POST HURRICANE KATRINA: A QUALITATIVE STUDY………...….. 99
Joanne M. Tran, Louisiana Tech University
UNDERSTANDING COMPLAINING ON THE WEB: A RESPONSE FRAMEWORK FOR
SMALL BUSINESS...………………………………………………………..………………. 121
Christopher l. Martin, Centenary College of Louisiana
WORKPLACE SAFETY: WHAT SMALL BUSINESS OWNERS NEED TO KNOW
……………………………................................................................................................ 122
Kitty Campbell, Southeastern Oklahoma State University
Wayne Jones, Southeastern Oklahoma State University
Nick Nichols, Southeastern Oklahoma State University
Kelli Taylor, Southeastern Oklahoma State University

iv
Memphis, TN, September 24-26, 2014
JUST DO IT! A PROOF OF CONCEPT CASE STUDY……………………..…………… 142
Dale Spradling, Stephen F. Austin State University
FE-LINES, INC: DON’T DECLAW…GET STICKY PAWS!…………................................ 143
Leslie A. Toombs, Texas A&M University-Commerce
Courtney Kernek, Southeastern Oklahoma State University
Mildred Golden Pryor, Texas A&M University
Z, Y, or Z? THEORTRICAL COMPARISON OF MANAGING SMALL BUSINESS IN
CHINA AND INDIA………………………………………………….……………..……….. 145
Qiang Yun, St Benedict College and Saint John’s University
Kingshuk Mukherjee, St. Benedict College and Saint John’s University
KING DIGITAL IPO: A CASE STUDY……………………………………………...……… 147
Alair Tudor, University of Louisiana at Monroe
Eugenie A. Ardoin, University of Louisiana at Monroe
Arturo Rodriguez, University of Louisiana at Monroe
ENCOURAGING CRAFT, ARTS, AND MICRO ENTERPRISES FOR CREATIVE
ENTREPRENEURSHIP AND INNOVATIVE BUSINESS GROWTH …..………….…….. 166
Christopher Ziemnowicz, University of North Carolina at Pembroke
Michael Menefee, University of North Carolina at Pembroke
VULNERABILITY AND RESOURCE DEPENDENCY OF NONPROFIT ORGANIZATIONS
IN ALABAMA’S BLACK BELT: CALL FOR A BETTER MEASURE OF PERCEIVED
REVENUE DIVERSIFICATION ……………………………………………………………. 193
Aliquippa Allen, University of West Alabama
Russ Henley, University of West Alabama
D. Adrian Doss, University of West Alabama
THE STATE OF ENTREPRENEURSHIP IN IRAQ – A FIRST-HAND
EXPERIENCE………………………………………………………………………………… 229
William T. Jackson, USF St. Petersburg
ASBE Workshops:
ADVANCED BUSINESS MODEL APPLICATIONS IN
TEACHING…………………………………………………………………………………… 230
Daniel James Scott, USF St. Petersburg
ART, WAR, AND B-SCHOOL INNOVATION…………………………………………..…. 231
Nathan Schwagler, USF St. Petersburg

v
Memphis, TN, September 24-26, 2014
TRAINING AND EDUCATING GRASS-ROOT LEADERS IN ENTREPREURSHIP AND
RURAL DEVELOPMENT FOR THE 22ND
CENTURY UTILIZING THE TEEN REACHING
YOUTH (TRY) MODEL AND OTHER APPROACHES………………………………….... 232
Kathleen Liang, University of Vermont
Paul Dunn, University of Louisiana at Monroe

ASBE 40TH Annual Conference
1
Memphis, TN, September 24-26, 2014
Does Gender Matter in Small Business?
Henry S. Cole, University of Louisiana at Monroe
Eugenie A. Ardoin, University of Louisiana at Monroe
Stan Williamson, University of Louisiana at Monroe
Abstract
Over the last several decades, research has indicated that customer orientation and ethics
can be important in the success of a small business. To explore these variables further, this study
looked at possible gender differences in customer orientation, ethics, and sales revenues of small
businesses. Small business owners across the U.S. were surveyed with 154 men and 167 women
responding. Higher levels of customer orientation and ethics were both positively related to sales
performance in this sample. There were no significant differences between men and women in
either ethics or customer orientation. However, this study indicated that male owners’ operations
generated significantly higher revenues than the operation of female owners. Findings further
revealed that male owners tend to spend an average of 28% more time at work per week than
their female counterparts.

ASBE 40TH Annual Conference
2
Memphis, TN, September 24-26, 2014
Goliath vs. David: Why Small Businesses Need To Be Aware Of the Lanham
Act
Laurie A. Babin, University of Louisiana at Monroe
Deborah Golemon, University of Louisiana at Monroe
Melissa Melancon, University of Louisiana at Monroe
Abstract
Section 43(a) of the Federal Lanham Act allows businesses to sue other businesses for
engaging in false or misleading claims. This paper explains the Lanham Act and two recent
Supreme Court rulings. The March 2014 decision in Lexmark International v. Static Control
Components extended the scope of the Act to include cases against businesses that fall within the
“zone of interests,” not just the stricter requirement of being a direct competitor. The second
decision handed down in POM Wonderful v. Coca-Cola in June 2014 ruled that competitors can
sue under the Lanham Act even for misleading claims that are acceptable by the Food and Drug
Administration, such as saying a product is “99% natural” on the label. Though neither of these
decisions is directly related to small business per se, each can have a negative impact on small
businesses for a couple of reasons. One, small businesses can fall within the “zone of interests”
of a large corporation, and many small businesses are seeing increased legal pursuit from
corporate Goliaths that have a mightier legal arsenal than most small businesses. Second, the
reason for this increase in legal pursuit of smaller businesses by the corporate Goliath’s is due to
the Internet making it increasingly easier to discover the potentially misleading claims some
small business owners unwittingly make to market their products and services. Thus, this paper
concludes with guidelines for small businesses to ensure product claims cannot be construed as
misleading.

ASBE 40TH Annual Conference
3
Memphis, TN, September 24-26, 2014

ASBE 40TH Annual Conference
4
Memphis, TN, September 24-26, 2014
IPO Investor Reactions to Female Directors: Evolving Role Congruity
Dr. Christopher R. Reutzel, Sam Houston State University
Dr. Carrie A. Belsito, Western Illinois University
Abstract
We examine the influence of female directors on initial public offering (IPO)
underpricing in this study. IPO underpricing represents an undesirable outcome for growing
firms and their owners. We also consider the influence of changing societal perceptions of
female directors on the relationship between female presence in the board room and IPO
underpricing. The hypotheses we develop in this study are tested using a sample of 565 IPO
firms from the calendar years of 1997 and 2007. The results of this study suggest that female
director presence is weakly associated with IPO underpricing in general. We also find the
influence of female director presence on IPO underpricing to be stronger in earlier years than in
later years.

ASBE 40TH Annual Conference
5
Memphis, TN, September 24-26, 2014
The Strategic Move to Adopt a New Technology. SMEs Trends to Incorporate
Wireless Business in Their Business Model.
Michael Stoica, Washburn University
William Roach, Washburn University
Anca Gata, “Dunarea de Jos” University of Galati,
Abstract
Adoption of new technology, in particular mobile commerce, can serve as a catalyst for
improving quality of life and reducing the digital divide between different regions with different
development degrees. One of the most important changes for society through the adoption of
Information and Communication Technology appears to be the way that business is conducted.
The Internet and related technologies are creating new communication systems for a variety of
businesses in many varied industries. The proliferation of smart telephones offers a platform for
unprecedented penetration on the Internet and services such as m-commerce.
Adoption of new technology is dependent upon variables such as: surrounding
environment, organizational culture, firm’s strategy, as well as age and size. Several hypotheses
that explain the relationships between firm’s strategy and business performance in the context of
the new technology adoption process are formulated. A sample of small and medium-sized
businesses from rural America that adopted, or are in the process of adopting, wireless
technology is used to test these hypotheses. The methodology, results, and managerial
implications are discussed.
Keywords: wireless business, new technology adoption, business strategy

ASBE 40TH Annual Conference
6
Memphis, TN, September 24-26, 2014
Successful Small Businesses and Their Owner-Managers
Mildred Golden Pryor, Ph.D., Texas A&M University-Commerce
Leslie A. Toombs, D.B.A., Texas A&M University-Commerce
Lisa Pryor Singleton, M.S., Golden, Pryor & Associates
Abstract
This paper examines small businesses from the perspectives of organizational life cycle,
entrepreneurs who function as owner-managers and factors which contribute to long-term
survival and profitability. Ethics, quality, continuous learning, leadership, and management are
explicated. A model for small business success which was developed from the perspective of
entrepreneurs and owner-managers is presented, and the model elements and the need for their
alignment are elucidated. Challenges and precautionary suggestions are also included so that
owner-managers can better understand the potential for small business failure and their
respective roles in risk mitigation and failure prevention. Finally, conclusions and implications
are provided that will be of interest to academicians as well as small business entrepreneurs and
owner-managers.
Introduction
Beer (1984) indicated that he spent 30 years developing the “Viable Systems Model,
which sets out to explain how systems are viable – that is, capable of independent existence” . . .
and to elucidate the laws of viability in order to facilitate the management task” (p. 7). The
intent of small businesses is that they would be systems that are capable of long term viability.
However, d’Amboise and Muldowney (1988) lamented that “knowledge about small business
management is fragmented” (p. 226). They also suggested that “researchers must agree on
common terms and parameters . . . and common conceptual frameworks must be established”
ASBE 40TH Annual Conference
7
Memphis, TN, September 24-26, 2014
(d’Amboise and Muldowney, 1988, p. 237). Over twenty years later, Leitch, Hill, and Neergaard
(2010) concluded that “at this stage of the field’s development, the quest for a comprehensive
theoretical model, which adequately explains entrepreneurial and business growth (and viability),
may be tantamount to tilting at windmills” (p. 258).
Burgess and Wake (2012) acknowledged a gap in research and presented an approach
that uses “the VSM (previously mentioned viable systems model) as a diagnostic tool for SMEs
to undertake an audit of viability” (p. 30). In so doing, they define a system as “viable if it can
maintain a separate existence, has problem-solving capabilities and can survive disturbances
from its wider environment” (Burgess and Wake, 2012, p. 31). As noted, there have been a
number of serious attempts to search for, and/or apply, various theories and models to small
business management. However, there continues to be a significant need to study and delineate,
and/or develop, theories and models that are applicable to small businesses and useful for their
owner-managers.
Small businesses continue to be the fuel for economies in developing countries as well as
economies in the most developed countries in the world. According to the U.S. Bureau of Labor
Statistics (2014), between 1993 and mid-2013, small businesses created 63% of the net new jobs.
Thus it is important to study not only their impact, but also factors that contribute to the
organizational growth, survival capability and success of small businesses. There is much
preparatory work for owner-managers who are starting a small business, including writing a
business plan and identifying how much capital is needed and acquiring it. In addition, they
must be prepared to successfully operate their small businesses. This paper examines the
organizational life cycle as it pertains to small businesses, the impact of entrepreneurs who
function as owner-managers, and some of the factors which contribute to long-term survival and

ASBE 40TH Annual Conference
8
Memphis, TN, September 24-26, 2014
profitability for small businesses. In addition, in Figure 2, this paper presents a model that
depicts, from the perspective of the entrepreneur and small business owner-managers, elements
required for small business success and the need for their alignment.
Organizational Life Cycles
According to Ionescu and Negruşa (2007), “the most general model of the organizational
life cycle has three stages: birth, youth and maturity/decline” (p. 5). Miller and Friesen (1983)
indicate that organizations typically progress through five life cycle stages—birth, growth,
maturity, revival, and decline. They note that the revival stage could occur multiple times. Pryor,
White and Toombs (2007, 1998) describe the organizational life cycle as “activation, growth,
maturity/stabilization, decline, and demise” (p. 11-20). See Figure 1.
Whether from the perspective of a general model or a more specific model, the
organizational life cycle is relevant to the study of small businesses and their capability to
survive and flourish over the long term. Therefore, it is important for entrepreneurs and owner-
managers to understand that organizations have a natural life cycle but that organizations
(particularly startup operations) can go into a downward spiral at any stage of the life cycle. So
they must contemplate “what if” scenarios and be prepared to intervene, or assist with
appropriate interventions, as necessary. Those interventions may include rapidly streamlining
processes, training to ensure skill capability and procedural compliances, requiring specific
behavioral changes or other types of interventions. The purpose of interventions would be to
prevent, or minimize the potential for, organizational decline and demise.

ASBE 40TH Annual Conference
9
Memphis, TN, September 24-26, 2014
Stability/Maturity
Growth
Decline
Activation (Startup)
Conception Demise
Figure 1: Organizational Life Cycle. Adapted from Pryor, et al (2007, p. 11-20)
Of the impactful ingredients in the success of small businesses, the entrepreneurs and
owner-managers themselves and their attitudes, values, characteristics, and capabilities have the
greatest potential for impact on long term viability.
Impact of Entrepreneurs (Owner-Managers)
Values and Ethics
Arend (2013) contends that “small- and medium-sized enterprises . . . depend on their
good ‘ethical stature’ to survive” (p. 1). This ethical stature involves acquiring and maintaining
the trust of customers, suppliers, communities and other stakeholders in order to “enjoy
sufficient legitimacy to conduct their business.” (Arend, 2013, p. 1). This ethical reputation is
based on the capability to exercise moral judgment which is “important in managerial work
because managers have discretion and are likely to deal with ambiguous, ethically charged
issues” (Loviscky, Trevino, and Jacobs, 2007, p. 263).

ASBE 40TH Annual Conference
10
Memphis, TN, September 24-26, 2014
The ethical foundation of a small business often materializes from the principles and
core values of the owner, the entrepreneur who started the enterprise. Therefore, it is essential
for entrepreneurs to realize the extent to which their core values will impact the culture of their
respective organizations. In fact, those core values will gradually be integrated into the fabric of
the organization. Entrepreneurs must be positive role models for those with whom they interact
and refrain from anything that would have negative impact on the ethical foundations of their
organizations. “Ethical charismatic leaders use power in socially constructive ways to serve
others. They are genuinely concerned about contributing to the welfare of followers” (Howell
and Avolio, 1992, p. 44). The leader of an organization must demonstrate a high level of ethical
behavior before employees can be expected to behave ethically (Butcher, 1991). In addition,
organizational core values should be formalized with input from co-workers. According to Ye’s
(2012) research, “results indicate that organizational values have significant and direct impact on
employees’ organizational citizenship behaviors by the mediating effect of organizational
identification and organization-based self-esteem” (p. 35).
While owners of small businesses who also function as managers may find their time
very limited and feel that they don’t have time for much paperwork, it is essential for them to
ensure that policies, procedures, and codes of conduct relating to ethics and legalities are
established, formalized and communicated to employees and other stakeholders. In addition,
such ethics policies and procedures must be updated as changes occur in laws, technology, and
other factors which impact the respective organizations (Stansbury, 2009).
Because of the internet and other technological capabilities, small businesses have
opportunities to do business globally. However, Nganga (2012) cautions that there are “ethical
challenges that stifle the participation of small businesses in the global value chains . . .

ASBE 40TH Annual Conference
11
Memphis, TN, September 24-26, 2014
particularly in developing countries” (p. 19). This is another reason for owner-managers to
understand the potential impact of ethical considerations in their organizations.
Commitment to Quality
A commitment to quality is a commitment to integrity in terms of ethical decision making
and actions. According to Pryor (Pryor, et al, 2007, 1998) “Quality is the extent to which
products, services, processes and relationships are free from defects, constraints, and items which
do not add value for customers” (p. 2-3). Small business owners must understand that the very
survival of their organizations depends on providing quality to their customers and other
stakeholders. This includes quality relationships with employees, suppliers, communities,
creditors, et al. This is more than reputation. This means that the owner-managers and their
respective co-workers believe in, and work toward achieving, excellence from their own personal
perspectives as well as for their organizations. In other words, quality (excellence) is an integral
part of who they are, not just what they do. In addition to understanding and ‘living out’
excellence, owner-managers must understand the concept of value. Even if the products,
services, relationships, and processes are all perfect, they mean nothing if customers and other
stakeholders do not believe that they add value for them. Two questions that must be answered
are: (1) Were what the customers and other stakeholders received worth what they cost in terms
of time and money? and (2). Were what they received what the customers and other stakeholders
needed/required?
Attitude toward Continuous Learning
Maurer and Weiss (2010) note that “employee competence at continuous learning is
becoming increasingly important in organizations” (p. 1). They go on to say that “competence at

ASBE 40TH Annual Conference
12
Memphis, TN, September 24-26, 2014
continuous learning is increasingly a key part of successful careers and effective organizations”
(Maurer and Weiss, 2010, p. 2). Learning takes time, but it is not nearly as time consuming as
trying to operate a business without continuous learning and without trying to stay up-to-date on
knowledge that can positively impact the strategic and tactical operations of a small business.
Once owner-managers include continuous learning as an integral part of their daily routines (and
those of others in the organization), they will be pleasantly surprised as things they learn can be
used to simplify and streamline operations, thereby saving the organization additional time and
money as well as contributing to product, service and relationship excellence.
Attitude toward Risk
Gilmore, Carson, and O’Donnell (2004) caution that “there is a strong association
between small business owner-managers/entrepreneurs and risk by virtue of the high failure rates
of small firms” (p. 349). Their research found that the owner-manager entrepreneur interviewees
considered the following as risky situations: cash flow (i.e., being able to maintain sufficient
cash flow); company size (growing too quickly); entering new markets or areas of business; and
entrusting their co-workers with responsibilities (Gilmore, et al, 2004).
The capability to handle risk mitigation is a necessary skill for owner-managers because
on a daily basis small businesses potentially face numerous risks. However, the attitude of
complete risk avoidance can often be just as deadly for a small business as risks are. Plus, one’s
attitude toward risk can result in excessive stress for owner-managers and their co-workers.
Learning how to objectively evaluate potential risks contributes to the health of the people
involved as well as to the financial health of their small businesses.
Leadership and Management Capabilities
ASBE 40TH Annual Conference
13
Memphis, TN, September 24-26, 2014
A common phrase is that leaders lead people and they manage resources. However,
people are also resources, so they must be managed as well. Owner-managers must understand
that managing resources includes knowing how many and the cost of those resources. They can
include their co-workers in the human resources decisions as well as other operational decisions.
As mentioned previously, being a part of the decision making and action execution processes
positively impacts people so that they feel ownership of an organization and its success.
People who have followers are leaders whether or not they are in formal authority
positions within an organization. Such leaders may have positive impact or negative impact on
an organization, depending on their personal integrity, values, and commitment to organizational
success. Both leadership and management skills and behaviors can be learned. However, some
people learn one or both of them at very early ages. Those people may seem like natural leaders
since others come to them for assistance and advice. Owner-managers need to function as both
leaders and managers if they are to make the highest level of contribution to the success of their
respective organizations. Again, leadership and management skills and behaviors can be
learned, and not all learning has to occur in a classroom setting. Just listening and observing can
often expedite learning.
Lu’s (2014) study found that “ethical leaders have characteristics that indicate they are
trustworthy, such as benevolence and consideration. They care about Employees’ feelings and
induce affective trust in them” (p. 386). This trust encourages employees to more fully engage in
the achievement of expected outcomes.
Along this same line, Pryor (Pryor, et al, 2007, 1998) emphasizes the following about leaders:
“Throughout the world, people know the real leaders. They are the ones with
credibility – the ones you can trust. They understand that there is no zero place in
history. All people sometimes lead and sometimes follow. Each person must

ASBE 40TH Annual Conference
14
Memphis, TN, September 24-26, 2014
choose whether to lead in a positive or negative direction and whether to become
a primary leadership force in the history and future of the world. People who
inspire others to follow them are great leaders, but the BEST leaders encourage
and inspire people to follow themselves” (p. 9-2).
Humphreys and Einstein (2003) indicate that “transformational leaders operate out of
deeply held value systems that include things like justice and integrity” (p. 86). Burns (1978,
p.20) explains that transformational leadership occurs when people “engage with others in such a
way that leaders and followers raise one another to higher levels of motivation and morality” (as
cited in Humphreys and Einstein, 2003, p. 86). Burns (1978, p. 20) goes on to say that
“transforming leadership . . . raises the level of human conduct and ethical aspiration of both
leader and led, and thus it has a transforming effect on both” (as cited in Humphreys and
Einstein, 2003, p. 86). Small business owner-managers need to function as transformational
leaders which will enable them to “achieve higher levels of performance among followers than
originally thought possible” (Bass, 1990 as cited in Humphreys and Einstein, 2003, p. 86).
Small Business Model for Success
Entrepreneurs and small business owner-managers are quick to point out that their
schedules are tight and that anything that takes time detracts from the real business of supplying
their customers’ needs. So they need a simplistic model that helps them remember factors that
are beneficial to their stakeholders and to them personally. For such a model, see Figure 2.
In order for small business owner-managers to help their respective organizations to
enjoy long-term survival and profitability, they must ensure that they are able to survive. The
factors or characteristics that must become an integral part of who they are as entrepreneurs
and/or small business owner-managers are depicted in Figure 2 and are as follows:

ASBE 40TH Annual Conference
15
Memphis, TN, September 24-26, 2014
1. Knowledge and Skills. Owner-managers must make a commitment to continuous learning
for themselves and the workers so that their knowledge and skills do not become obsolete.
Also, if owner-managers care about quality, there are free resources from the Baldrige
National Quality Award website (http://www.nist.gov/baldrige/) and other national and state
quality websites. You don’t have to hire a consultant to learn about improvement initiatives
or new technologies. You can join a professional organization, interact with local
universities, and listen to experts who work in your organization.
2. Ethics, Mutual Trust, and Mutual Respect. As previously mentioned, integrity and ethics are
the foundation for decision making and actions as owner-managers interact with people
within their organizations and external to their organizations. Their commitment to, and
practice of, integrity and ethics serve as a trigger for trust and respect from the stakeholders
with whom they interact. This gradually becomes the basis for mutual trust and mutual
respect. As a result, when customers, suppliers, and other stakeholders believe in and respect
the owner-managers, relationships as well as processes can be streamlined.
3. Positive Energy. Integrity, ethics, mutual trust, and mutual respect establish a basis for
positive energy to flourish. However, more is required. In the beginning of a startup
business, few processes will have been established, money may be limited, customers may be
fickle, suppliers may not want to supply small quantities, and many other frustrating things
may occur. Instead of letting negativism thrive or trying to solve all the issues themselves,
owner-managers should use the frustrating issues as opportunities to involve employees,
customers, suppliers, university students and professors, community members and others in
thinking of innovative ways to solve frustrating problems. Of course, discretion should be
used. Not all of these stakeholders should be involved at the same time.

ASBE 40TH Annual Conference
16
Memphis, TN, September 24-26, 2014
Figure 2: Small Business Model for Success
4. Perseverance and Resilience. Physical, mental, and emotional stamina are required of people
working in a startup operation. The capability to persevere while establishing new processes
and procedures, interacting with new stakeholders, and working long hours is a requirement
Entrepreneur
Small Business Owner-
Manager
Knowledge
Skills
Capabilities
Ethics,
Mutual Trust
and
Mutual Respect
Empowerment and
Accountability
Effectiveness
and
Efficiency
Perseverance
and
Resilience
Positive
Energy

ASBE 40TH Annual Conference
17
Memphis, TN, September 24-26, 2014
for personal as well as organizational survival and success. Leader resilience is toughness,
the ability to think and be proactive as one strives to prevent or manage stressful situations
(Everly, 2011). Some ‘back to basics’ thinking will be required (e.g., eat healthy, take time
to exercise, get enough sleep). This can require less time if you really are focused on doing
things that will make you and your organization more successful.
5. Empowerment and Accountability. Owner-managers of startup organizations understand the
requirement for their own empowerment and accountability for success. However, they tend
to not empower the people who work with them, sometimes because they do not understand
how empowerment works and sometimes because they want to be in charge of everything
themselves. If employees are empowered and understand the requirements for organizational
success, they are much more likely to function as owners themselves and be accountable for
customer satisfaction and other key performance indicators.
6. Effectiveness and Efficiency. Owner-managers must understand the difference between
effectiveness (doing the right thing) and efficiency (doing things right). Also they should be
able to assist their co-workers in understanding those concepts as well.
Potential for Long-Term Survival and Profitability
Whether small business survive or fail, they impact people, organizations, communities,
the economy, and society in general. When people first think about starting a small business,
they begin to put in place things that will either positively or negatively impact it. Therefore,
entrepreneurs should do the required things for starting a business (e.g., writing business plans,
identifying sources of capital, understanding their roles in functioning as owner-managers of
their respective organizations, etc.).

ASBE 40TH Annual Conference
18
Memphis, TN, September 24-26, 2014
About half of all new small businesses survive five years or more, and about one-third of
them survive 10 years or more (U.S. Bureau of Labor Statistics, 2014). Since a large percentage
of small businesses do not survive, it would behoove owner-managers to learn about their
respective organizations potential for long-term survival and profitability before they actually
start the business (and spend money). However cautious and knowledgeable the owner-
managers are, they cannot predict many things, such as the following:
1. Weather related problems (e.g., tsunamis, tornadoes, hurricanes, earthquakes, floods)
where they and/or their suppliers are negatively impacted;
2. Economic downturns in their respective countries or globally;
3. Terrorism throughout the world where the terrorists attack businesses, civilians,
government buildings, and other people and places; and
4. Changes in laws globally and in their own countries.
It is important for entrepreneurs and owner-managers of small businesses to prepare for things
under their control that will impact the long-term viability and success of their organizations.
While they can neither predict nor control some factors, they can be aware of them and of the
extent to which their organizations may be impacted if they occur.
Rita Gunther McGrath, Columbia Business School professor, warns that managers need
to be able to recognize imminent crises. She suggests that impending crises might include
organizational inertia as well as trouble with an organization’s business model because of the
increasing speed of everything, inter-industry competition, and disruptions from business models
that offer “better customer experiences instead of simply products” (Cliffe, 2011, p. 96).
Conclusions and Implications
ASBE 40TH Annual Conference
19
Memphis, TN, September 24-26, 2014
Various models and theories exist that can be utilized by entrepreneurs and small
business owner-managers. Over the years, researchers have discussed how many of those
models and theories can contribute to the long-term viability of small businesses. However,
statistics show that about half of all new small business survive five years or more, and only
about one-third of them survive ten years or more (U.S. Bureau of Labor Statistics, 2014).
Perhaps these survival percentages could be increased if entrepreneurs and small business owner-
managers understood that their organizations are at risk because of natural organizational life
cycles. Of course, they would also have to learn how (and when) to intervene or assist with
interventions that can postpone (or perhaps prevent) the decline and demise phases of their
respective organizations’ life cycles. While entrepreneurs and small business owner-managers
can neither predict nor control some factors, but they can be aware of them and of the extent to
which their respective organizations may be impacted if they occur. Even factors outside their
control may still require interventions to prevent their organizations from moving into the
decline or demise phases of the organizational life cycle.
Entrepreneurs and owner-managers also need to understand how they can personally
impact their respective organizations from the perspectives of their: (1) values and ethics, (2)
personal commitments to quality, (3) attitudes toward continuous learning, (4) attitudes toward
risk, and (5) leadership and management capabilities. Finally, they need to understand the small
business model for success, its elements and the alignment thereof, that we developed from the
perspective of entrepreneurs and owner-managers. This very simplistic model depicted in Figure
2 enables entrepreneurs and small business owner-managers to better understand what is required
of them in terms of the long term survival and viability of their respective organizations.

ASBE 40TH Annual Conference
20
Memphis, TN, September 24-26, 2014
A preferred, although admittedly optimistic, next step would be to involve entrepreneurs
and/or small business owner-managers in the implementation of various concepts, theories, and
models in this paper and to study immediate and long term impact of the implementation. At
minimum, the concepts of organizational life cycle and the Small Business Model for Success
(Figure 2) would be positive, constructive additions to college and university small business
and/or entrepreneurship courses.
ASBE 40TH Annual Conference
21
Memphis, TN, September 24-26, 2014
References
Arend, R.J. (2013). Ethics-focused dynamic capabilities: A small business perspective. Small
Business Economics. 41:1-24.
Baldrige National Quality Award (n.d.). http://www.nist.gov/baldrige/.
Bass, B.M. (1990). From transactional to transformational leadership: learning to share the
vision. Organizational Dynamics. 18(3):19-31.
Beer, S. (1984). The viable system model: Its provenance, development, methodology and
pathology. Journal of the Operational Research Society. 35(1): 7-25.
Burgess, N. and Wake, N. (2012, August). The applicability of the viable systems model as a
diagnostic for small to medium sized enterprises. International Journal of Productivity
and Performance Management. 62(1): 29-46.
Burns, J.M. (1978). Leadership. New York: Harper.
Butcher, W.C. (2005). The Need for Ethical Leadership. Executive Speeches. 19(5), 49-52.
Cliffe, S. (2011, January-February). When your business model is in trouble. Harvard Business
Review. Pages 96-98.
d’Amboise, G. and Muldowney, M. (1988, April). Management theory for small business:
Attempts and requirements. The Academy of Management Review. 13(2): 226-240.
Everly, G.S (2011). Building a resilient organizational culture. Harvard Business Review. 10(2):
109-138.
Gilmore, A., Carson, D. and O’Donnell, A. (2004). Small business owner-managers and their
attitude to risk. Marketing Intelligence & Planning. 22(2/3): 349-360.
Howell, J.M. and Avolio, B.J. (1992). The ethics of charismatic leadership: Submission or
liberation? Academy of Management Executive. 6(2):43-54.
Humphreys, J.H. and Einstein, W.O. (2003). Nothing new under the sun: Transformational
leadership from a historical perspective. Management Decision. 41(1/2):85-95.
Ionescu, G.G. and Negrusa, A.L. (2007, December). The study about organizational life cycle
models. Review of International Comparative Management. 8(4):5-15.
Leitch, C., Hill, F., and Neergaard, H. (2010, March). Entrepreneurial and business growth and
the quest for a “comprehensive theory”: Tilting at windmills. Entrepreneurial Theory and
Practice. 34(2): 249-260.

ASBE 40TH Annual Conference
22
Memphis, TN, September 24-26, 2014
Loviscky, G.E., Trevino, L.K., and Jacobs, R.R. (2007). Assessing managers’ ethical decision-
making: An objective measure of managerial moral judgment. Journal of Business
Ethics.73:263-285.
Lu, X. (2014). Ethical leadership and organizational citizenship behavior: The mediating roles of
cognitive and affective trust. Social Behavior & Personality. 42(3): 379-389.
Maurer, T. J. and Weiss, E.M. (2010) Continuous learning skill demands: Associations with
managerial job content, age, and experience. Journal of Business Psychology. 25:1-13.
Miller, D. and Friesen, P.H. (1983). Successful and unsuccessful phases of the corporate life
cycle, Organizational Studies, 4(4): 339-356.
Nganga, J.C. (2012). The ethical dilemma in globalizing small businesses. Journal of Business
Systems, Governance and Ethics. 7(1): 19-29.
Pryor, M.G., White, J.C. and Toombs, L.A. (2007, 1998). Strategic Quality Management: A
Strategic Systems Approach to Continuous Improvement. Independence, Kentucky:
Cengage Learning.
U.S. Government. Bureau of Labor Statistics. (2014, March). www.sba.gov/advocacy/10871.
http://www.sba.gov/sites/default/files/FAQ_March_2014_0.pdf
Ye, J. (2012, December). The impact of organizational values on organizational citizenship
behaviors. Public Personnel Management. 41(5): 35-46.

ASBE 40TH Annual Conference
23
Memphis, TN, September 24-26, 2014
Analyzing the Link between Strategy and Performance:
Comparing Small Business Owners and Professional Managers
William C. McDowell, Middle Tennessee State University
Shanan G. Gibson, College of Business East Carolina University
Michael L. Harris, East Carolina University
Joshua Aaron, Middle Tennessee State University
Donald L. Lester, Middle Tennessee State University
Abstract
This study examined the differences in the strategic choices of business owners and
professional managers in the small-business context. Hypotheses posited that owners and
managers would choose differing strategic orientations based upon their concern for long-term
organizational success versus short-term profits. In addition, the role of education in strategic
orientation for these two groups was examined. The results of this study support the contention
that organizational position (owners versus managers) can impact the relationship between
strategic choice and firm performance. However, we did not find a significant relationship
between the educational level of the business owners or managers and strategy and performance.
These findings provide insight into the strategies used by small businesses, as well as the
strategic orientation differences between owner-operators and professional managers hired to run
small businesses.
Numerous reports have shown that small businesses serve as a key element of innovation
and job creation within the U.S. economy (Small Business Administration, 2012). However,
research has shown that these businesses are started by creative people with varying intentions,
and then managed and operated based on different types of strategic choices. Some of these

ASBE 40TH Annual Conference
24
Memphis, TN, September 24-26, 2014
individuals are more entrepreneurial in nature while others are better defined as small business
owners. This study examines the strategic choices of entrepreneurs versus small business
managers to determine how they may differ in developing and growing the business venture.
Specifically, we examine the use of internal and external strategies and the impact these strategic
choices have on firm performance (see Figure 1).
Entrepreneurs and small business owners come from a wide variety of backgrounds and
experiences, and their business ventures are managed based on these difference intentions and
perspectives. Adopting Penrose’s (1959) resource based view that organizations are groupings
of resources, capabilities and competencies leads to the premise that a manifest competitive
advantage can be developed when one’s resources and/or competencies are unique and hard to
reproduce (Penrose, 1995). Organizational performance has also been examined in the literature
as a function of distinctive human resources (Miller & Ross, 2003) and how a firm blends its
resources and its product or service capabilities (Wernerfelt, 1984). Furthermore, the role of
business strategies and practices have been emphasized by numerous researchers (Gibson, 2012;
Gibson, McDowell, & Harris, 2011; Harris, McDowell, Zhang, & Gibson, 2011; Sriram, Mersha,
& Herron, 2007) as key aspects impacting organizational performance. Greater knowledge of all
these factors typically accompanies experience; this learned expertise of more experienced
business owners likely plays a significant role in determining their patterns of business startup
and organizational performance (Harris & Gibson, 2008; Harris, Gibson, & Mick, 2009;
McDowell, Harris, & Gibson, 2010).
Starting and sustaining a successful business represents a substantial challenge regardless
of the past experiences of the owners. Augier and Teece (2009) argued that the distinction

ASBE 40TH Annual Conference
25
Memphis, TN, September 24-26, 2014
between the functions or entrepreneurs and managers has necessarily diminished as a result of
today’s open economies. If this is true regarding their functions, our objective is to learn more
about the strategies used by these individuals in small businesses and to determine if the type of
manager (entrepreneur/owning-manager versus non-owning manager) impacts these strategic
choices. Small business owners are often faced with substantial challenges during both the
startup and growth phases of business development and any additional knowledge can be used to
better prepare others interested in new venture creation. Our findings may also help small
business assistance programs offer more tailored strategic counseling based on the owners’
background and intentions.
Literature Review
Strategic Focus
In order to be successful, a business must create a set of resources that lead to a
competitive advantage. Examples can include both tangible items (e.g. capital, equipment,
location) and those resources that are more difficult to quantify such as specialized knowledge,
managerial acumen, or business processes and procedures. Research by Mazzarol, Reboud, &
Soutar (2009) indicates there is a relationship among business resources, strategic approach and
organizational performance. For small businesses, these resources are often highly correlated
with the talents and skills of the business owner (Runyan, Huddleston & Swinney, 2006);
research by Brush, Greene, and Hart (2001) indicated that the intangible knowledge of a business
owner was a key resource for business start-ups. Furthermore, the owner shapes the strategic
orientation of the new venture (Becherer, Finch, & Helms, 2006; Gilbert, McDougall, &
Audretsch, 2006; Lumpkin, McKelvie, Gras, & Nason, 2010). For businesses to be successful,

ASBE 40TH Annual Conference
26
Memphis, TN, September 24-26, 2014
business owners must marry their organizational competencies with their individual resources in
a manner that yields sustainable advantage; these resource combinations help explain firm
performance in the resource-based view.
Strategic knowledge is a perquisite for firm success and long-term viability; knowledge
about the marketplace, the opportunities within the marketplace, and the correct business
approach to take advantage of opportunities is necessary for success (West and Noel, 2009).
Likewise, Wiklund and Shepherd (2003) suggest that new venture creation is predicated upon an
understanding of strategic approach and this knowledge is often the result of similar prior
business experiences and situations.
There are two dominant directions that firm strategy may take, internal or external. An
internally oriented strategic approach is characterized by those that focus their energies toward
developing the inner workings of the organization such as human resources management,
structural efficiencies, and expenditure control and management (Gibson, McDowell, Harris,
2011; Verheul, Risseeum, & Bartelse, 2002). Common outcomes of an internal strategic
orientation include an emphasis on product efficiency, process improvement, and/or financial
objectives. Furthermore, product innovation and development may stem from an internal focus
as a result of deeper understanding of one’s merchandise or services (Pett & Wolff, 2007).
Alternatively, firms may pursue a more externally focused strategy. These organizations
are characterized by adopting business strategies that promote sales growth and new customer
attainment (Gibson, McDowell, Harris, 2011; Kumar, Subramanian, & Strandholm, 2001; Trinh
& O’Connor, 2002). Relationship building, marketing, and/or customer service are hallmarks of
externally focused strategies (Pett & Wolff, 2007). An external focus can facilitate exploring
strategic relationships with other organizations and new target markets; an external orientation is
ASBE 40TH Annual Conference
27
Memphis, TN, September 24-26, 2014
also exceedingly important to small businesses when contemplating international expansion (Pett
& Wolff, 2007).
Edelman, Brush, and Manolova (2005) suggest that resources alone do not explain firm
performance; a small business must make the best strategic choices based on its available
resources. Similarly, Pett and Wolff (2007) believe that business performance is dependent upon
the best fit between a firm’s internal resources and strategic orientation and its external market
conditions. The proper alliance between firm resources and strategic choices is needed to best
achieve business growth and financial profitability (Edelman, Brush, & Manolova, 2005).
Educational Attainment
Education has been shown to be an important influence on owner-manager behavior
(Storey, Watson & Wynarczyk, 1989) and contrary to the media-endorsed stereotype, the
literature shows and numerous studies support the notion that entrepreneurs are better educated
than the general population (e.g., Cooper & Dunkelberg, 1987; Robinson & Sexton, 1994;
Kilpatrick & Crowley, 1999; and Scott, Rosa, & Klandt, 1998). In fact, a recent large survey
conducted by Wadhwa, Aggarwal, Holly, and Salkever (2009) indicated that most successful
entrepreneurs are well educated; 95.1 percent of those surveyed had earned bachelor's degrees,
and 47 percent had more advanced degrees. In addition, 70% of those surveyed indicated
education was important. This is not inconsistent with very early academic assertions; as cited by
Kiesner (1984), esteemed economist Samual Aluko stated:
“About 80% of all small business failures are attributable to inadequate
planning, poor accounting, inadequate control mechanism, inability to
read and understand financial statements, and the inability to accept
technical and economic advice. That is the absence of sound business

ASBE 40TH Annual Conference
28
Memphis, TN, September 24-26, 2014
education and training.” (Kiesner, 1984, p. 17).
Surveys of small business owners also indicate that they perceive their college education
as instrumental in their business decision making; according to Al-Zubeidi (2005) entrepreneurs
reported that college education helped them run their business (69%), identify business problems
(52%) and make necessary business changes (51%); each of these is consistent with choosing an
appropriate business strategic focus. Indeed, anecdotal evidence indicates that returning to the
classroom is a common trend among entrepreneurs. David Port (2010) cites entrepreneur Gayle
Reaume as saying: "Growing a company means you need to know how the whole company
works--every part of it. I've always been strong at certain things, like marketing, but I could see I
was struggling with the intricacies of building and running a growth-oriented company." It seems
that entrepreneurs are making the link between education and effective business strategies.
Researchers have posited that having a formalized business plan is paramount to
engaging in strategic planning as it serves as the basis for making and taking strategic decisions
and as a monitoring mechanism (Deakins and Freel, 2003). Richbell, Watts and Wardle (2006)
found that for entrepreneurs, education was positively correlated with having engaged in
business planning thereby indicating that the more educated recognized the need for structure
and the role that strategic planning play in long term success.
Small business owners and managers must have a strong understanding of their business
environment and capabilities and use this knowledge to adopt the most appropriate strategic
choices. The research clearly indicates that education is believed to play a role in making good
strategic decisions and engaging in the strategic planning associated with successful firms. What
is unknown is whether or not educational differences among owner-managers and non-owning
ASBE 40TH Annual Conference
29
Memphis, TN, September 24-26, 2014
managers result in different strategic orientations stemming from their potentially conflicting
goals of long term sustainability versus immediate profit generation. Edelman, Brush, and
Manolova (2005) suggest that resources alone do not explain firm performance; a small business
must make the best strategic choices based on its available resources. Similarly, Pett and Wolff
(2007) believe that business performance is dependent upon the best fit between a firm’s internal
resources and strategic orientation and its external market conditions. The proper alliance
between firm resources and strategic choices is needed to best achieve business growth and
financial profitability (Edelman, Brush, & Manolova, 2005).
Hypotheses
The strategies used by small business owners can be greatly influenced by knowledge
gained from previous experience (Harris & Gibson, 2008). This experience can enhance their
understanding of the potential obstacles in business startup, and the resources necessary to
successfully operate the venture. It also provides a greater understanding of strategic analysis and
decision making, and how these choices impact business performance. As proposed by Runyan,
Huddleston, and Swinney (2006), the most successful small businesses have owners or managers
capable of using their individual talents and experiences in a manner that creates a sustainable
competitive advantage for the firm.
The strategic orientation pursued by business owners may very well be impacted by their
past experiences; past research has linked strategy with business knowledge and performance
(Edelman, Brush, & Manolova, 2005; Pett & Wolff, 2007; West & Noel, 2009). Whereas
inexperienced business owners and managers naturally focus on customer service and their
network of relationships (external orientation) as a means to develop relationships with others

ASBE 40TH Annual Conference
30
Memphis, TN, September 24-26, 2014
and thereby overcome resource and knowledge shortages (Lumpkin, et al. 2010), experienced
business owners are able to rely upon their existing knowledge of process and structural
efficiencies and financial objectives which is more consistent with an internal strategic
orientation (Mitchell, Smith, Seawright, & Morse, 2000). Reliance upon internal strategies has
been associated with stronger performance by traditional small organizations (Edelman, Brush,
and Manolova, 2005).
Business owners are often more focused on establishing the foundations for
organizational success, whereas managers will be more focused on the short-term success of the
already established organization. Owners are also generally more concerned about operations
and customer service while managers are more focused on the sales and revenue growth. This
would indicate that business owners often choose internal strategies focused on long-term
business development, whereas managers adopt a more external strategic approach where short-
term growth is emphasized. Thus, the following hypotheses are offered and the relationship is
shown in Figure 1.
H1: There is a positive relationship between internal strategic focus and performance
for owner-operators.
H2: There is a positive relationship between external strategic focus and performance
for non-owner managers.
--------------------Insert Table 1 here--------------------
In addition, education level of the owner or manager has been shown to impact the types
of strategic decisions they make. We expect business owners with higher educational levels
have a better understanding of the need for structure and long term success than those with lower
levels of education and will be more likely to emphasize internal strategies. Conversely, non-

ASBE 40TH Annual Conference
31
Memphis, TN, September 24-26, 2014
owner managers with higher educational levels are expected to emphasize an external strategy
because their studies have likely emphasized the importance of achieving immediate results.
Therefore, we offer the following hypotheses:
H3: Owner-operators with higher educational levels will be more likely to utilize an
internal strategy.
H4: Non-owner managers with higher educational levels will be more likely to utilize
an external strategy.
Methodology
Sample
The sample for this study included small business owners in North Carolina who worked
with or sought help from the North Carolina Small Business Technology and Development
Center. The data were collected via a survey emailed to approximately 1500 small businesses.
There were 237 usable responses from the 270 surveys received which is an 18% response rate.
Of the respondents, 55% were male, 50% indicated they were ethnic minorities, and they had an
average age of 49.2 years old. The age of the businesses ranged from zero to 68 years with an
average of 10.5 years. Of all the business surveyed, 53.5% indicated that they were in service,
13.1% indicated manufacturing, 13.1% retail, 10.6% construction, 6.6% medical, and 2% not-
for-profit.
Measures, Data, and Scale Analysis
The survey collected information on gender, age, years of current ownership, and
whether or not they were the owner operator or a non-owning manager. In addition, the
respondents were also asked several questions that indicated strategic emphasis (Gibson,
McDowell, & Harris, 2011) which assessed strategic focus. In order to evaluate construct

ASBE 40TH Annual Conference
32
Memphis, TN, September 24-26, 2014
validity of the item scores, an exploratory factor analysis was conducted on the items assessing
strategy. Using factor analysis with an Eigenvalue greater than one rule (Kaiser, 1960), these
items yielded two factors with Eigenvalues of 5.301 and 1.756 respectively. The first six items
indicated an internal strategic focus and the next seven items indicated an external strategic
focus. The factor pattern/structure coefficients including Eigenvalues and Cronbach’s alphas to
examine reliability can be found in Table 1.
--------------------Insert Table 1 here--------------------
Organizational performance was measured using 10 questions on performance (Gibson et
al., 2011). These items assessed satisfaction on multiple areas of performance within an
organization. Previous empirical evaluations have found these subjective measures are highly
correlated with objective measures (Dess & Robinson, 1984; Vernkatraman & Ramanujam,
1986) used in the business literature (Covin, Prescott & Slevin, 1990; Greenley, 1995; Slater &
Narver, 1995; Subramanian, Kumar & Strandhold, 2009). These results also indicated a good fit
to the data with the items combined into a single performance measurement. The factor
pattern/structure coefficients including the Eigenvalues and Cronbach’s alpha for performance
can be found in Table 2.
-------------------Insert Table 2 here--------------------
Regression analysis was used to examine the data and test the hypotheses. The data were
split into two groups in order to test these hypotheses. The first group is defined as the
owner/operators and the second group is defined as the non-owning managers. The control
variables, which included organizational size (number of employees) and the number of years
they had been working with this company, were regressed against performance in step one of the

ASBE 40TH Annual Conference
33
Memphis, TN, September 24-26, 2014
regression analysis followed by the independent variables, internal strategic focus and external
strategic focus, in step two of the two-step process. In order to examine the effect in both
models, F, statistical significance of the model, beta weights and structure coefficients, the
adjusted R2, and the statistical significance of the independent variable are reported and
examined. Each model was tested using the research model below where Y = performance, X1
= number of employees, X2 = number of years with the company, X3 = internal strategy, and X4
= external strategy.
Model: Y = β0 + β1X1 + β2X2 + β3X3 + β4X4 + ε
Results
The purpose of this study was to examine the relationship between strategic orientation
and performance for small business owner operators and non-owning managers. In addition, we
examined the relationship of education level and strategic focus for owner/operators as well non-
owning managers with strategic focus. We hypothesized that there would be a positive
relationship between internal strategic focus and performance for owner/operators and that there
would be a positive relationship between external strategic focus and performance for non-
owning managers. In addition, we hypothesized that higher levels of education would be
associated with a positive relationship between ownership and strategic focus with
owner/operators being more internally focused and non-owning managers being primarily
externally focused.
To test Hypothesis 1 and 2, the data were split into two groups, those who are
owner/operators and those who are non-owning managers. Ownership was determined with the

ASBE 40TH Annual Conference
34
Memphis, TN, September 24-26, 2014
use of a single question asking the respondent if they are an owner. The analysis of the first
group yielded a good fit to the data. Step one of the regression analysis included entering the
control variables, employee size and years of working with the business, into the model. The
size of the organization has been shown in previous research to affect specific organizational
processes such as communication and specialization, thus affecting performance (Indik, 1965).
The age of the business was also included as a control due to the increased institutionalization
(Dimaggio & Powell, 1983) that can occur the longer a firm continues to operate. After entering
the control variables in step one, the predictor variables of internal strategic orientation and
external strategic orientation were added in step two. The first model consisting of the control
variables resulted in an ANOVA with an F-value of 2.430 (p = .093). The second model, with
the control variables and internal and external strategy, resulted in an F-value of 8.316 (p = .000).
While the first model was significant at the p < .1 level, the inclusion of internal and external
strategy improved the fit with an R2 of .248 and a ∆R
2 of .203 that was statistically significant
(p= .000).
In addition, the relationship of the strategy items as predictors to performance were
examined utilizing standardized and unstandardized coefficients, statistical significance, and
confidence intervals. For a summary of this analysis, see Table 3. The results of the regression
analysis indicate that for businesses operated by the business owner rather than a manager, an
internal strategic focus is statistically significantly related to performance, thus supporting
Hypothesis 1.
--------------------Insert Table 3 here--------------------
The analysis was then run with the group of non-owning managers. The model was again
statistically supported with an F-value of 1.488 (p= .236) for the first model and an F-value of

ASBE 40TH Annual Conference
35
Memphis, TN, September 24-26, 2014
7.009 (p= .000) for model 2. Model 2 improved the fit with an R2 of .369 and a ∆R
2 of .313 that
was statistically significant (p= .000). The results of this regression analysis supported
Hypothesis 2 in that external strategic focus was positively related to performance for non-
owning managers. Table 4 provides the analysis summary.
--------------------Insert Table 4 here--------------------
In order to test Hypotheses 3 and 4, the data were again split into two groups,
owner/operators and managers. A correlation analysis was completed to determine the
relationship of means of each group’s educational level with both internal and external strategic
focus. The sample was limited as there were only 137 of the owner/operators and only 65 of the
managers who indicated their educational level. For the owner/operator group, the Pearson
Correlation of educational level with internal strategic focus was not statistically significant with
a value of -.148. The relationship with external strategic focus was statistically significant with a
value of -.234 at the p < .01 level. Thus, Hypothesis 3 is not supported. Additionally, for the
manager group, the Pearson Correlations between educational level and internal strategic focus
and external strategic focus were not statistically significant with values of -.094 and .077
respectively. Thus, Hypothesis 4 is also not supported. These correlations as well as the means
and standard deviations can be seen in Tables 5 and 6 below.
--------------------Insert Table 5 here--------------------
--------------------Insert Table 6 here--------------------
Discussion
The results of this study support the first two hypotheses, indicating that organizational
position (owners versus managers) can impact the relationship between strategic choice and firm

ASBE 40TH Annual Conference
36
Memphis, TN, September 24-26, 2014
performance. However, we did not find a significant relationship between the educational level
of the business owners or managers and strategy and performance. These findings provide a
greater understanding of the strategies used by small businesses, as well as the strategic
orientation differences between owner-operators and professional managers hired to run small
businesses.
As hypothesized, our findings indicate that owners are more concerned with internal
process and product refinements while managers adopt business strategies that promote sales and
customer growth. Fortuitously, both a sustainability orientation and short term sales and market
growth are instrumental to a firm’s success. Experienced business owners are often
knowledgeable about organizational processes and efficiencies, which is consistent with an
internal strategic orientation (Mitchell, Smith, Seawright, & Morse, 2000). It is not surprising to
find that owners are more concerned with strategies that promote long-term growth and
development while managers promote more short-term sales growth. Although compensation
was not analyzed in this study, managers often receive compensation packages that can be
maximized based on short-term success.
Research by Morrissey and Pittaway (2006) indicated that inexperienced owners or
managers are likely to become emotionally involved with customers and learn through social
interaction rather than formalized business practices. In addition, owners or managers with
limited education often face greater obstacles when starting and operating a business (Lussier &
Pfeifer, 2001). Because of these prior findings it was surprising that educational level was not
significantly related to the strategic choices of either business owners or managers. More
specifically, it was interesting to note that education level was not significant with either internal
or external strategies for managers, but there was a significant negative relationship between

ASBE 40TH Annual Conference
37
Memphis, TN, September 24-26, 2014
business owners with lower educational levels and the use of an external strategy. This indicates
that owners with lower educational levels tend to adopt strategies with a short-term focus that
might sacrifice long-term viability. Perhaps these owners have a limited knowledge base
compared to more educated business owners and therefore they are more focused on external
strategies that produce rapid short-term gains.
Small businesses generally have access to limited resources making it important to
understand how to strategically operate the venture in a manner that can best impact firm
performance. As these firms gain more strategic flexibility they are better able to refine business
capabilities and improve performance (Kelly, 2007). Our findings indicate a difference in the
strategic choices of small business owners compared to the professional managers they hire to
grow these business ventures. Perhaps the motivations of these different groups play a role in
strategic choice. Business owners are often more concern with long-term viability while
managers may be more focused on short-term financial growth to demonstrate their effectiveness
and possibly enhance their compensation package. One way to moderate this distinction may be
to include firm-ownership as part of managers’ compensation packages.
Research has shown that without effective strategic choices there is often a waste of
resources and lack of direction and sustainability in small businesses (Mazzarol, Reboud, &
Soutar, 2009; West & Noel, 2009). West and Noel (2009) suggest that business owners must be
rational in investing resources to start a new venture. This includes the development of the most
appropriate strategies to guide the firm through the various stages of business development. One
of the greatest challenges for small business owners is determining when to hire a professional
manager to assume control of the business. Owners devote time and resources to develop the
business, making this both a financial and emotional investment.

ASBE 40TH Annual Conference
38
Memphis, TN, September 24-26, 2014
Once owners hire someone else to manage their businesses, they often relinquish some
control of the strategic direction of the business. Our findings indicate that once organizations
experience significant growth and shift from an owner-manager model to a professional manager
model, decision-making is likely to transition from an internal strategic orientation to a more
externally oriented strategy focused more objectives such as on sales growth and customer
expansion. In order to ensure a smooth transition it is imperative for business owners to select
professional managers they are confident can both operate the business profitably in the short
term and ensure future success. Owners and managers must share a common framework of
expectations regarding both operations and the strategic direction of the business.
Future Research
While this study examined the differences in the strategic choices of business owners and
professional managers, additional research is needed to offer more definitive conclusions. Future
research should consider examining other individual and firm factors that may impact the link
between strategic orientation and firm performance within the small business context.
It is important to examine other individual characteristics of owners and managers that
may impact strategic choices. In addition to owner status and level of education, other factors
such as prior entrepreneurial experience of the owner/manager, total wealth of the
owner/manager and the social network of the owner/manager could all have major impacts on
the strategic orientation the owner adopts. These and other individualized variables may offer
more insight regarding differences or similarities between these groups.
Studies may also examine firm level characteristics such as business age or size to
determine if the organizational life cycle impacts firm strategy. A firm may alter its strategic

ASBE 40TH Annual Conference
39
Memphis, TN, September 24-26, 2014
approach over time regardless of whether it is governed by an owner or manager. Industry type
is likely an important firm-level variable to consider. Research has shown that retail and service
firms, in particular, face unique challenges that may determine more specialized strategic
choices. Manufacturing firms, conversely, experience less market uncertainty and dynamism. As
such, manufacturing firms may be inherently more internally focused than service firms. These
additional studies must continue to collect data from a broad range of small businesses in order
to gain a greater understanding of both their strategic nature and critical success factors. A
vibrant and successful small business community can serve as a major catalyst for national
economic growth.
Conclusion
Research has shown that businesses are started by people with certain intentions but often
come to be managed and operated by differently motivated people. Our study examines the
manifestation of those different intentions through the strategic focus of owner operators and
non-owner managers. We hypothesize and find that owner-operators will be more interested in
internal strategic initiatives aimed at securing the long-term success and viability of their firms
and that internal focus will manifest itself in improved financial performance for their firms. We
also suggest and find that non-owner managers will be more interested in external strategic
initiatives aimed at meeting the needs of the marketplace or responding to competitors’ actions
today rather taking the long-term view of the their firm and its success. Indeed, the non-owner
managers do exhibit such behavior and it is also positively associated with firm performance.
This is consistent with the conclusions of Katz and Niehoff (1998) who found that strategies
pursued varied based on firm-ownership, that owners and managers perceive risk differently and

ASBE 40TH Annual Conference
40
Memphis, TN, September 24-26, 2014
consequently make strategy decisions accordingly. To the authors’ way of thinking, these
findings regarding differences in strategic orientation should be perceived as encouraging; they
indicate that both owner-managers and non-owning managers are able to select strategies that
result in financial success. What they highlight is the importance of the two having a shared
belief system whereby the owner ensures the manager understands his/her values and business
intentions and the manager is properly motivated to integrate these with his/her own strategic
orientation.
We believe this study enhances the current literature concerning the strategic orientation
of small businesses. Our findings could potentially aid small business development centers in
offering more tailored strategic counseling based on the owners’ background and intentions. We
have shown that owners should and do focus more on internal strategies while managers should
and do focus more on external strategies. This is likely due to the owner/manager relying on
their individual experiences and skill sets. Perhaps, small businesses could harness the best of
both worlds by equally including an owner operator and a non-owner manager in the strategic
planning process.

ASBE 40TH Annual Conference
41
Memphis, TN, September 24-26, 2014
References
Al-Zubeidi, M. (2005). Higher education and entrepreneurship: The relation between college
educational background and all business success in Texas. Unpublished doctoral
dissertation, University of North Texas, Denton, TX. Retrieved from:
http://digital.library.unt.edu/ark:/67531/metadc4795/m2/1/high_res_d/dissertation.pdf
Augier, M. & Teece, D.J. (2009). Dynamic capabilities and the role of managers in business
strategy and economic performance. Organization Science, 20(2), 410-421.
Becherer R.C., Finch, J.H., & Helms, M.M. (2006). The influences of entrepreneurial motivation
and new business acquisition on strategic decision making. Journal of Small Business
Strategy, 16(2), 1-14.
Brush, C.G., Greene, P.G., & Hart, M.M. (2001). From initial idea to unique advantage: The
entrepreneurial challenge of constructing a resource base. Academy of Management
Perspectives, 15(1), 64-78.
Cooper, A., & Dunkelberg, W. (1987). Entrepreneurial research: Old questions, new answers and
methodological issues. American Journal of Small Business, 11(3), 11-23.
Covin, J., Prescott, J., & Slevin, D. (1990). The effects of technological sophistication on
strategic profiles, structure, and firm performance. Journal of Management Studies, 27:
485–510.
Deekins, D. & Freel, M. (2003). Entrepreneurship and small firms. McGraw Hill: London.
Dess, G.C, & Robinson, R.B. (1984). Measuring organizational performance in the absence of
objective measures: The case of privately-held firms and conglomerate business unit.
Strategic Management Journal, 5, 265-273.
Dimaggio, P. J. & Powell, W. W. (1983). The iron cage revisited: Institutional isomorphism and
collective rationality in organizational fields. American Sociological Review, 48, 147-
160.
Edelman, L.F., Brush, C.G., & Manolava, T. (2005). Co-alignment in the resource-performance
relationship: Strategy as a mediator. Journal of Business Venturing, 20(3), 359-383.
Gibson, S. G. (2012). The influence of strategic focus & gender on performance: An
examination of small businesses. Journal of Small Business Strategy, 21(2), 47-58.
Gibson, S.G., McDowell, W.C., Harris, M.L. (2011). The impact of strategic orientation and
ethnicity on small business performance. Journal of Business Diversity, 11 (1), 9-18.

ASBE 40TH Annual Conference
42
Memphis, TN, September 24-26, 2014
Gilbert, B.A., McDougall, P.P., & Audretsch, D.B. (2006). New Venture Growth: A Review and
Extension. Journal of Management, 32, 926-950.
Greenley, G. (1995). A comment on: The commodification of marketing knowledge. Journal of
Marketing Management, 11(7), 665-669.
Harris, M. & Gibson, S. (2008). Examining the entrepreneurial attitudes of U.S. business
students. Education + Training, 50 (7), 568 - 581.
Harris, M.L., Gibson, S.G., & Mick, T.D. (2009). Examining the relationship between
personality and entrepreneurial attitudes: Evidence from U.S. college students. Small
Business Institute® Journal, 3, 21-51.
Harris, M.L., McDowell, W.C., Zhang, L., & Gibson, S.G. (2011). Strategic relationships in a
small business context: The impact of information quality and continuous quality
improvement. New England Journal of Entrepreneurship, 14(2), 19-27.
Indik, B. P. (1965). Organization size and member participation. Human Relations, 18, 339-
350.
Kaiser, H. F. (1960). The application of electronic computers to factor analysis. Educational and
Psychological Measurement, 20, 141-151.
Katz, J.P. & Niehoff, B.P. (1998). How owners influence strategy: A comparison of owner-
controlled and manager-controlled firms. Long Range Planning, 31(5), 755-761.
Kelly, S. (2007). The function and character of relationship benefits: Transferring capabilities
and resources to the small firm. Journal of Small Business and Enterprise Development,
14(4), 602-619.
Kiesner, W. F. (1984). Higher education and the small businessperson: A study of the training
and education needs, uses, and desires of the small business practitioner. Unpublished
doctoral dissertation, Claremont Graduate School. Ann Arbor, MI: University Microfilms
International.
Kilpatrick, S., & Crowley, S. (1999). Learning and training: Enhancing small business success.
National Center for Vocational Research. Leabrook, Australia. ERIC (Document Reproduction
Services, No. ED 437545).
Kumar, K., Subramanian, R., & Strandholm, K. (2001). Competitive strategy, environmental
scanning and performance. International Journal of Commerce and Management, 11, 1-
33.

ASBE 40TH Annual Conference
43
Memphis, TN, September 24-26, 2014
Lumpkin, G.T., Brigham, K.H., & Moss, T.W. (2010). Long-term orientation: Implications for
entrepreneurial orientation and performance of family businesses. Entrepreneurship &
Regional Development, 22(3/4), 241-264.
Lumpkin, G.T., McKelvie, A., Gras, D.M., & Nason, R. (2010). Is strategy different for very
small and new firms? Journal of Small Business Strategy, 21(2), 1-26.
Lussier, R.N. & Pfeifer, S. (2001). A crossnational prediction model for business success.
Journal of Small Business Management, 39(3), 228-239.
Mazzarol, T., Reboud, S. & Soutar, G.N. (2009). Strategic planning in growth oriented small
firms. International Journal of Entrepreneurial Behavior & Research, 15(4), 320-345.
McDowell, W.C., Harris, M.L., & Gibson, S.G. (2010). The Impact of trust and dependency on
business performance: A study of SME suppliers. Small Business Institute® Journal, 6,
41-62.
Miller, S.R. & Ross, A.D. (2003). An exploratory analysis of resource utilization across
organizational units: Understanding the resource-based view. International Journal of
Operations and Production Management, 23(9) 1062-1084.
Mitchell, R.K., Smith, B., Seawright, K.W., & Morse, E.A. (2000). Cross-cultural cognitions and
the venture creation decision. Academy of Management Journal, 43(5). 974-993.
Morrissey, W. J. & Pittaway, L. (2006). Buyer-supplier relationships in small firms: The use of
social factors to manage relationships. International Small Business Journal, 24(3), 272-
298
Penrose, E.T. (1959). The Theory of the Growth of the Firm. New York: John Wiley.
Penrose, E. (1995). The Theory of the Growth of Firms, 3rd
edition. Oxford, NY: Oxford
Pett, T.L. & Wolff, J.A. (2007). SME performance: A case for internal consistency. Journal of
Small Business Strategy, 18(1), 1-16.
Port, D. (2010). Why business owners are heading back to campus. Entrepreneur, September 7,
2010. Retrieved from: http://www.entrepreneur.com/article/234924.
Richbell, S.M., Watts, H.D. & Wardle, P. (2006). Owner-managers and business planning in the
small firm. International Small Business Journal, 24(5), 496-514.
Robinson, P., & Sexton, E. (1994). The effect of education and experience on self-employment
success. Journal of Business Venturing, 9, 141-156.

ASBE 40TH Annual Conference
44
Memphis, TN, September 24-26, 2014
Runyan, R.C., Huddleston, P. & Swinney, J. (2006). Entrepreneurship orientation and social
capital as small firm strategies: A study of gender differences from a resource-based
view. International Entrepreneurship and Management Journal, 2(4), 455-477.
Scott, M., Rosa, P., & Klandt, H. (1998). Educating entrepreneurs for wealth creation.
Brookfield, Vermont: Ashgate Publishing Company.
Slater, S. & Narver, J. (1995). Market orientation and the learning organization. Journal of
Marketing, 59(3), 63–74.
Small Business Administration. (2012). Frequently Asked Questions. Retrieved from:
http://www.sba.gov/sites/default/files/FAQ_Sept_2012.pdf
Sriram, V., Mersha, T. & Herron, L. (2007). Drivers of urban entrepreneurship: An
integrative model. International Journal of Entrepreneurial Behaviour & Research,
13(4), 235-251.
Storey, D.J. (1994). Understanding the small business sector. International Business Press,
London-Boston.
Storey, D.J., Watson, R. & Wynarczyk, P. (1989). Fast growth small businesses: Case studies of
40 small firms in northern England. Research Paper 67, Department of Employment,
London. Cited by Storey (1994).
Subramanian, R., Kumar, K., & Strandholm, K. (2009). The relationship between market
orientation and performance under different environmental conditions: The moderating
effect of the top management team’s risk taking behavior. Academy of Strategic
Management Journal, 8, 121-133.
Trinh H.Q. & O’Connor, S.J. (2002). Helpful or harmful? The impact of strategic change on the
performance of U.S. urban hospitals. Health Services Research, 37(1), 145-171.
Venkatraman, N., & Ramanujam, V. (1986). Measurement of business performance in strategy
research: a comparison approach. Academy of Management Review, 11, 801-814.
Verheul, I., Risseeum, P. & Bartelse, G. (2002). Gender differences in strategy and human
resource management: The case of Dutch real estate brokerage. International Small
Business Journal, 20(4), 969-988.
Wadhwa, V., Aggarwal, R., Holly, K., & Salkever, A. (2009). The anatomy of an entrepreneur:
Making of a successful entrepreneur. Kauffman: The Foundation of Entrepreneurship,
retrieved from: http://www.kauffman.org/~/media/kauffman_org/research%20reports%20
and% 20covers/2009/07/makingofasuccessfulentrepreneur.pdf.

ASBE 40TH Annual Conference
45
Memphis, TN, September 24-26, 2014
Wernerfelt, B. (1984). A resource based view of the firm. Strategic Management Journal, 5(2),
171-180.
West, G.P. & Noel, T.W. (2009). The impact of knowledge resources on new venture
performance. Journal of Small Business Management, 47(1), 1-22.
Wiklund, J. & Shepherd, D. (2003). Knowledge-based resources, entrepreneurial orientation, and
the performance of small and medium-sized businesses. Strategic Management Journal,
24(13), 1307-1314.

ASBE 40TH Annual Conference
46
Memphis, TN, September 24-26, 2014
Figure 1.
The Relationship of Strategic Focus and Performance for Owner/Operators and Managers
Table 1. Factor Pattern/Structure Coefficients for Internal and External Strategy
Strategy Item Name
Internal Strategy External Strategy
Factor h2 Factor h2 Mean SD
Monitoring and enhancing employee satisfaction and morale .804 .646 3.42 1.383
Fostering employee participation and empowerment .796 .634 3.35 1.381
Incentive compensation based on team or facility performance .788 .621 2.93 1.396
Attracting and retaining high quality employees .777 .604 3.58 1.413
Employee profit Sharing .679 .461 2.20 1.420
Training and continuing education of employees .663 .440 3.16 1.356
Increasing growth in revenue .774 .599 4.24 .958
Improving profit margin .740 .548 4.10 1.026
Continuous improvement of existing products and services .729 .531 4.41 .843
Realizing returns on new products or services .724 .524 3.85 1.093
Customer satisfaction .709 .503 4.68 .757
Offering lower priced products or services .418 .175 2.76 1.329
Advertising and promotions .395 .156 3.36 1.184
Total Variance Explained 54.288
Initial and Second Eigenvalue 5.301 1.756
Third Eigenvalue .985
Alpha α = .874 α = .797
External Strategic Focus
Performance
0
20
40
60
80
100
1st Qtr 2nd Qtr 3rd Qtr 4th Qtr
East
West
North
Internal Strategic Focus

ASBE 40TH Annual Conference
47
Memphis, TN, September 24-26, 2014
Table 2. Factor Pattern/Structure Coefficients for Performance
Performance Items – Satisfaction With…
Factor h2 Mean SD
Maintaining employee morale .781 .610 3.57 1.116
Pricing products/services .753 .567 3.91 .802
Managing staffing needs .747 .558 3.61 1.144
Communicating with employees .731 .534 3.78 1.140
Retaining customers .696 .484 4.06 .938
Managing expenses .600 .360 3.99 .931
Developing new products or services to meet customer needs .595 .354 3.80 .982
Paying debts or liabilities .579 .335 4.11 .991
Collecting accounts receivables .520 .270 4.03 1.072
Finding new customers .519 .269 3.68 1.067
Total Variance Explained 43.430
Initial Eigenvalue 4.343
Second Eigenvalue 1.624
Alpha α = .851
Table 3 Variable B SE B β 95% CI Lower 95% CI Upper VIF
Step 1
Employees .004 .006 .071 -.008 .015 1.329
Company Years .008 .005 .168 -.002 .018 1.329
Step 2
Employees .002 .005 .048 -.008
.013 1.427
Company Years .004 .005 .085 -005 .013 1.385
Internal Strategies .257 .052 .469* .154 .360 1.194
External Strategies -.026 .093 -.026 -.210 .159 1.215
Note: R2 for first model = .045. R2 for second model = .248. ∆ R2 = .203. p = .000. *p < .01. N = 105. Two-tailed tests.

ASBE 40TH Annual Conference
48
Memphis, TN, September 24-26, 2014
Table 4
Variable B SE B β 95% CI
Lower 95% CI
Upper VIF
Step 1 Employees .001 .000 .236 .000 .002 1.008 Company Years -.002 .006 -.050 -.014 .010 1.008 Step 2 Employees .000 .000 .110 .000 .001 1.079 Company Years -.001 .005 -.033 -.012 .009 1.013 Internal Strategies .152 .096 .236 -.040 .345 1.671 External Strategies .341 .125 .398* .091 .591 1.604
Note: R2 for first model = .056. R
2 for second model = .369. ∆ R
2 = .313. p = .000.
*p < .01. N = 52. Two-tailed tests.
Table 5. Correlations, Means and Standard Deviations for Owner/Operators
Variable Means S.D. 1 2
Educational Level 4.67 1.316
Internal Strategies 3.065 1.120 -.148
External Strategies 3.899 .673 -.284* .427*
* p < .01
N = 139
Table 6. Correlations, Means and Standard Deviations for Non-owning Managers
Variable Means S.D. 1 2
Educational Level 4.60 1.355
Internal Strategies 3.205 1.019 -.094
External Strategies 3.926 .753 .077 .593*
* p < .01
N = 65

ASBE 40TH Annual Conference
49
Memphis, TN, September 24-26, 2014
What a Rhetorical Analysis of a Company Website Reveals about the
Company’s Commitments
Anca Gata, Dunarea de Jos University of Galati
Michael Stoica, Washburn University
Abstract
Nowadays small businesses are using websites as useful tools to communicate which
current activities are carried on and how they are facing the challenges of the business and social
environment. Our study is placed in the area of discourse analysis, a discipline and a method of
linguistics, from a rhetorical perspective. We are analyzing the discourse produced on their
website by a small Midwestern consulting agency in order to show: 1) how they organize their
activity in relationship with customers; 2) how they present their own business as an example of
best practice; 3) how they advise other companies to act in order to be successful. We have
selected for analysis pieces of discourse on various pages of the consulting agency’s website. We
are selecting text excerpts and interpreting their content in order to identify elements related to
the three previously listed points. An analysis from a rhetorical perspective on a given piece of
discourse may be rich and deep enough to provide meaningful conclusions to be consequently
tested by other studies. Moreover, this type of analysis reveals techniques used on the agency’s
website to express commitments. Some of these are rhetorical and some of them are strategic on
a practical level. The findings of our case study show that the consulting agency website allows
the manager to show commitment to the success of her own business and – at the same time – to
provide actual and potential clients advice. This is a marketing strategy frequently used by
consulting agencies.
ASBE 40TH Annual Conference
50
Memphis, TN, September 24-26, 2014
Keywords: commitment, consulting agency, rhetorical and discourse analysis, small business
website
Examining Entrepreneurial Characteristics, Motivations, Barriers, and
Outcomes for Small versus Large Multifunctional Farm Enterprises in New
England
Chyi-Lyi (Kathleen) Liang, University of Vermont
Paul Dunn, University of Louisiana at Monroe
Abstract
This article presents findings of a census type survey of New England farmers engaged in
multifunctional agriculture (MFA), focused on comparing MFA farmers’ entrepreneurial
characteristics, reasons/challenges of MFA, and self-assessed outcomes after participating in
MFA. A majority of farms, regardless sizes of operations defined by annual gross cash sales,
revealed similar entrepreneurial characteristics comparing to other entrepreneurs described in
literature. More micro and small family farms confirmed positive experiences with the MFA
focusing on connecting to customers and communities. Most farmers shared similar objectives,
barriers, and concerns/outcomes compared to those of small businesses previously studied. Large
farms were more interested in value added operations, while micro and small farms were more
likely to be engaged in agritourism and direct sales. Not as many micro and small farms were
very positive with their future outlook in agriculture, but they were certainly committed to
practicing multifunctional activities in the future.
ASBE 40TH Annual Conference
51
Memphis, TN, September 24-26, 2014
“I am very optimistic about my farm’s future, but I am not optimistic about the world.”
An Anonymous Farmer Responded to Our Survey
Introduction
Small businesses1 are the heart and soul of the United States. A general consensus about
small businesses, especially new startup firms in the past 2-3 years, relates to job creation and net
job growth in our economy. According to statistics released by the U. S. Small Business
Administration (SBA, 2008) and the Census Bureau, firms with fewer than 20 employees
contributed almost 83 percent of all of the net new jobs between 2004 and 2005. Unfortunately
the rate of new startups was slowing down between 2007 and 2010 due to the recession (SBA,
2012). Many challenges remain for small business owners, such as lack of incentive to expand or
to grow due to financial constraints, increasing costs for healthcare and production inputs, rising
concerns about global competition and market volatility, growing concerns with taxes and
regulations, widening gaps in identifying and recruiting quality and qualified workforce, and
dangling uncertainty in personal and family expectations. Policy makers, economic development
officials, and service providers continue to seek solutions to support the spirit and resources
toward entrepreneurship as the engine for future economic growth and societal stability.
Small family farms, compared to other types of small ventures, encounter some of the most
unique issues beyond commonly acknowledged challenges. Many uncontrollable and
unpredictable events such as changes in climate, environment, natural disasters, ecology, and
biophysical elements in fields, could devastate the farming livelihood and threaten the

ASBE 40TH Annual Conference
52
Memphis, TN, September 24-26, 2014
sustainability and prosperity of farm families. According to the Census of Agriculture2, the
number of farms has been slowing and steadily declining over time. The most recent Census of
Agriculture released in 2012 showed interesting trends compared to 2007 data, for example:
1. The 2012 Census showed principal farm operators are becoming older and more diverse;
following the trend of previous censuses. The average age of a principal farm operator
was 58.3 years in 2012, up 1.2 years since 2007, and continuing a 30-year trend of
steady increase. The Census also accounted for more minority-operated farms in 2012
than in 2007.
2. In 2012, the United States had 2.1 million farms – down 4.3 percent from the previous
Census in 2007. In terms of farm size by acres, this continues an overall downward trend
in mid-sized farms, while the smallest and largest-size farms held steady. Between 2007
and 2012, the amount of land in farms in the United States continued a slow downward
trend declining from 922 million acres to 915 million. This is only a decline of less than
one percent and is the third smallest decline between censuses since 1950.
Under pressure to survive and succeed, farm operators need to be entrepreneurial, and
seek and create new opportunities in a highly competitive market. Multifunctional agriculture
(MFA) was a political strategy introduced and adopted in the early 1990s by the European
countries to facilitate and promote food security and sustainable economic development
(Devries, 2000; European Commission, 2012). Broadly speaking, the MFA refers to agricultural
activities beyond serving the traditional role of producing food and fiber (Renting, et al. 2009,
Hajnalka & Alajos, 2009; Van Huylenbroeck & Durand, 2003). While there is no specific
definition or policy orientation established in the United States, farmers have been involved in
MFA, particularly in the New England region (Table 1 and 2). Many small dairy farms in
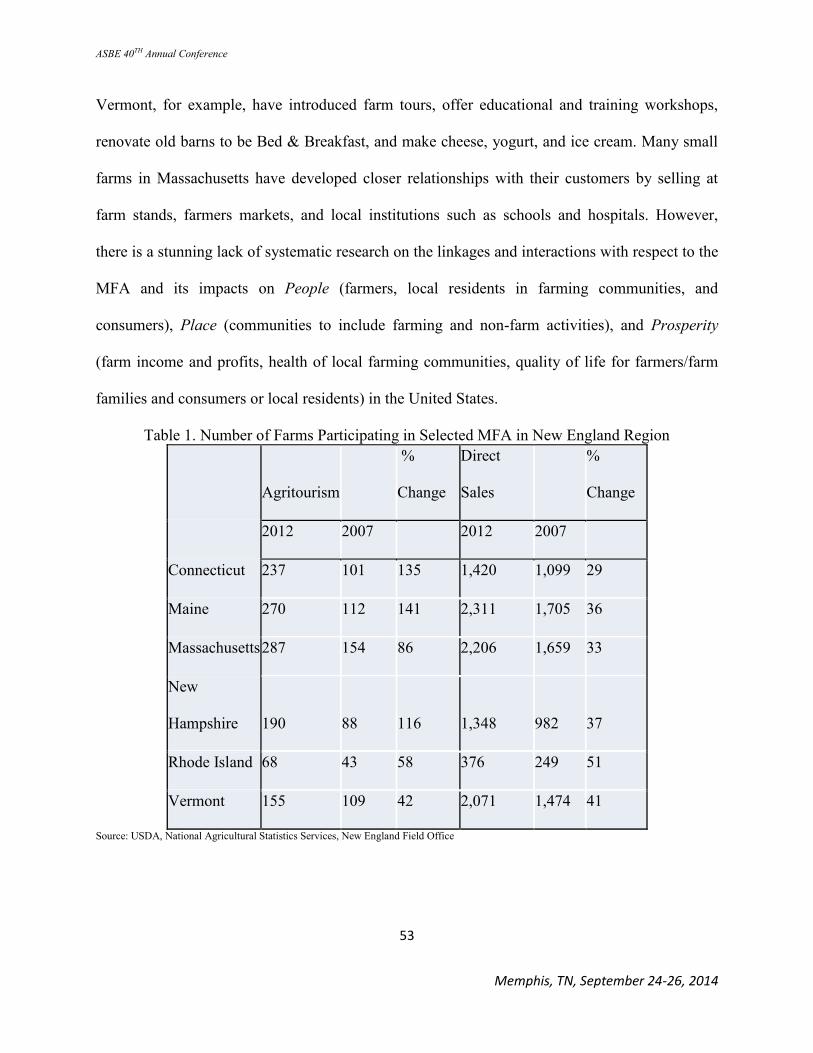
ASBE 40TH Annual Conference
53
Memphis, TN, September 24-26, 2014
Vermont, for example, have introduced farm tours, offer educational and training workshops,
renovate old barns to be Bed & Breakfast, and make cheese, yogurt, and ice cream. Many small
farms in Massachusetts have developed closer relationships with their customers by selling at
farm stands, farmers markets, and local institutions such as schools and hospitals. However,
there is a stunning lack of systematic research on the linkages and interactions with respect to the
MFA and its impacts on People (farmers, local residents in farming communities, and
consumers), Place (communities to include farming and non-farm activities), and Prosperity
(farm income and profits, health of local farming communities, quality of life for farmers/farm
families and consumers or local residents) in the United States.
Table 1. Number of Farms Participating in Selected MFA in New England Region
Agritourism
%
Change
Direct
Sales
%
Change
2012 2007 2012 2007
Connecticut 237 101 135 1,420 1,099 29
Maine 270 112 141 2,311 1,705 36
Massachusetts 287 154 86 2,206 1,659 33
New
Hampshire 190 88 116 1,348 982 37
Rhode Island 68 43 58 376 249 51
Vermont 155 109 42 2,071 1,474 41
Source: USDA, National Agricultural Statistics Services, New England Field Office

ASBE 40TH Annual Conference
54
Memphis, TN, September 24-26, 2014
Table 2. Gross Sales ($1,000) from Participating in Selected Multifunctional Ag-Activities in
New England Region
Agritourism
%
Change
Direct
Sales
%
Change
2012
($1,000)
2007
($1,000)
2012
($1,000)
2007
($1,000)
Connecticut 9497 8582 11 30,439 29,752 2
Maine 1803 1012 78 24,793 18,419 35
Massachusetts 12034 5306 127 47,909 42,065 14
New
Hampshire 3825 2316 65 20,321 16,021 27
Rhode Island 1447 689 110 6,253 6,292 -1
Vermont 1737 1490 17 27,430 22,863 20
Source: USDA, National Agricultural Statistics Services, New England Field Office
Note 1. The U. S. Small Business Administration defines small businesses as enterprises with
fewer than 500 full time equivalent employees.
Note 2. The U.S. Department of Agriculture conducts the Census of Agriculture every 5 years.
Note 3. USDA defines small farms as any commercial or non-commercial farm earning less than
$250,000 in annual gross cash sales. Farms earning more than $250,000 in annual gross cash
sales are large farms. http://www.extension.org/pages/13823/usda-small-farm-
definitions#.U776GUDyRpk

ASBE 40TH Annual Conference
55
Memphis, TN, September 24-26, 2014
This paper reports key findings from the largest field survey conducted in the U.S. to
examine MFA in relation to four different sizes of farming operations, and the size of farming
operations is defined by annual gross cash sales (adding up all cash sales from conventional
agricultural products and MFA activities) to be consistent with New England farm characteristics
and the USDA’s definition3:
Micro commercial farms – annual grow cash sales are between $1 and $10,000.
Small commercial farms – annual gross cash sales are between $10,001 and
$100,000.
Medium commercial farms - annual gross cash sales are between $100,001 and
$500,000.
Large commercial farms - annual gross cash sales are over $500,000.
We define MFA4 in our study to include four aspects modified from the original definition
introduced by the European countries – agritourism, value added, direct sales, and off farm work
(Liang & Su, 2013; Liang, Su, Dunn, & Pescatore, 2012; Liang, 2012). These activities have
been hypothesized to enhance the long term sustainability and prosperity both of farmers and the
rural communities in which they are located. Analysis and discussion presented in this paper
focus on MFA farm profile and farm operators’ entrepreneurial characteristics, motivations and
challenges relating to MFA operations, and farmers’ perception on MFA and its impacts on
personal and family life. The long term goal of this study is to identify specific strategies and
policy options that may increase the integration of local economies (communities) and farms,
and to enhance the overall viability of rural communities.
Note 4. The MFA definition for our study is different from the Census of Agriculture. The
Census of Agriculture offers general descriptions for agritourism, value added, and direct sales.

ASBE 40TH Annual Conference
56
Memphis, TN, September 24-26, 2014
In our study, agritourism refers to outdoor recreation, educational tourism, accommodations and
food services, and entertainment, festival, and other events. Value added includes jam, jelly,
other fruit preserved products, processed dairy products, pickled fruit and vegetables, wine, wool
and mohair products, process maple products, candy, cream, spice, flour, sugar, other baking and
cooking condiments, aquaculture, and forest products and by-products. Direct sales relate to
cooperative and other contracted sales, community supported agriculture, pick your own, farm
stand, farmers’ market, Christmas tree, firewood, hay, greenhouse and nursery products, local
institutions such as hospitals, schools, or correctional facilities, restaurants and local retail
outlets, national retail franchise, and other types of open market sales.
Literature Review
In studying multifunctional farmers, we were particularly interested in the similarities
between small farmers and small business people. We will begin with an overview of
entrepreneurship and small business literature. Researchers have discussed ‘pull and push’
factors beyond financial incentives for people to become entrepreneurs – being bored and
redundancy in current position, job insecurity, personal satisfaction, family happiness, taking
control of their life, making a positive impact on the society, contributing to professional
networks, and winding down in anticipation of retirement (Glancey & Malcolm,1997; Liang,
2002; Morris, et.al., 1996; Orhan & Scott, 2001; Lee, 1997; Davidson & Honig, 2003). Many
scholastic works have examined entrepreneurial individuals and their traits, characteristics, or
mindset. McClelland (1965) postulated the need for achievement among entrepreneurs as an
important motive early in these studies, and other studies continued to explore several commonly
observed or analyzed parameters such as optimism, realism, confidence, risk acceptance,

ASBE 40TH Annual Conference
57
Memphis, TN, September 24-26, 2014
independency, perseverance, passion, and goal oriented. Shane, Locke & Collins (2012)
summarized motivation/characteristics as the need for achievement, risk taking, tolerance for
ambiguity, locus of control, self-efficacy, goal setting, independence, drive, egoistic passion.
A small farm is defined as an operation earning annual gross cash income less than
$250,000, including commercial and noncommercial farms (USDA, 2012; MacDonald, 2010).
According to the Census of Agriculture, there seemed to be a diverging trend in operations
among small farms. The number of small commercial farms with annual gross cash income of
$10,000 and $250,000 fell between 2002 and 2007. The number of small noncommercial farms
earning less than $1,000 annual gross cash income actually increased, and these small
noncommercial farms contributed to all of the growth in small farm numbers between 2002 and
2007 (USDA, 2007; Hoppe, MacDonald, & Korb, 2010; MacDonald, 2010). Although the large
commercial farms contribute to 85 percent of the market value of agricultural production, small
farms offer environmental and ecological benefits to support working landscape and rural life
style. Many of these small noncommercial farms are family farms in rural areas, and most of
them rely on off farm jobs or other alternatives to make a living. Researchers speculated that
some small farms are profitable, and others are willing to accept financial losses (Hoppe,
MacDonald, & Korb, 2010). Our research questions were triggered by such significant shift in
farming patterns – what do these small farms do to survive, how do they make decisions to
engage in farming and other activities, and what are the consequences with respect to financial
situation and quality of life?
Multifunctional farm enterprise is a relatively new concept in the U.S., and has largely
been addressed at the macroeconomic level to consider trade issues (Bohman, et al. 1999). In the
European countries, the MFA concept has emerged as a key notion in scientific and policy

ASBE 40TH Annual Conference
58
Memphis, TN, September 24-26, 2014
debates on the future of agriculture and rural development (Renting, et al. 2009; Brouwer and
van der Heide 2009). Existing literature refers MFA to agricultural activities beyond the
traditional role of producing food and fiber, such as renewable resource management, landscape
and biodiversity conservation, and contribution to the socio-economic viability of rural
communities (Renting, et al. 2009, Hajnalka and Alajos, 2009; Van Huylenbroeck and Durand,
2003). Van der Ploeg and Roep (2003) described a triangular relationship to link MFA with
farming: Broadening, Deepening, and Re-grounding. Broadening involves a farming operation
diversifying its enterprises to include the production of new goods and services that encourage
the linking of farm production, visitors to rural areas, and amenities of their local communities.
Agritourism and specialty food sectors in the New England region are clear examples of
broadening activities (McGehee, 2007; Heller, 2007; Hughes, Kennedy, and Ortego, 1999).
Deepening involves refocusing agricultural production to better meet the demands of consumer
and sometimes requires advancements in the agricultural supply chain. Direct local sales are
examples of deepening activities. Researchers have analyzed specific marketing strategies
adapted by farmers such as direct farm-to-table food marketing, roadside stands, web-based
sales, community supported agriculture, small producer marketing cooperatives, pick-your-own
fresh produce, and farmer’s markets (Kinsey and Senauer, 1996; Roth, 1999; Tippins, Rassuli
and Hollander, 2002; Hansen, 2003; White, 1996; White, 1997; White and Manning, 1998).
Finally, Regrounding activities involve the total refocusing of farm household resources, such as
participating in activities outside of farming and off-farm work of farm household members.
Diagram 1 summarizes the relationships between farm household, customers/buyers, and
community/other organizations. A farm household can decide to establish any combination of
the MFA by choosing from agritourism, value added, direct sales, and off farm works (center

ASBE 40TH Annual Conference
59
Memphis, TN, September 24-26, 2014
section of Diagram 1). The overall goal of the study is to explore and analyze if MFA farm
households satisfy the entrepreneurial theory from both the micro/individual’s perspective and
the macro/economic/social/environmental aspects. This paper primarily focuses on testing the
following hypotheses:
1. MFA farm operators exhibit entrepreneurial characteristics as described in
entrepreneurship literature regardless the size of annual gross cash sales;
2. MFA farm operators choose to participate in MFA when considering different types of
MFA activities depending on the size of annual gross cash sales; and
3. MFA farms’ financial situation and quality of life have been improved as the results of
participating in MFA regardless the size of annual gross cash sales.
Survey Design and Administration
Diagram 1.
ASBE 40TH Annual Conference
60
Memphis, TN, September 24-26, 2014
Two levels of the surveys were designed and distributed in New England for this study.
The first level was to design a postcard survey (Appendix 1) to gather information from ALL
farmers in New England. This is the first attempt in the U.S. to use a census approach to study
MFA by offering all farmers in New England an opportunity to respond. Using the NASS
database and mailing services, the postcard survey was mailed to 33,112 farmers in New
England between October 2011 and February 20125. Useable postcards were collected by the
University of Vermont. Non-deliverable postcards were returned to the NASS. We received
4,636 useable responses or a 14% return rate.
Note 5. Hurricane Irene hit New England region during our postcard mailing period, which could
significantly influence response rate and farmers’ perceptions in operation, management, and
future outlook.
A detailed farm survey (Appendix 2) was designed, pre-tested, and administered to gather
information from farm operators who returned the postcards plus additional random sample units
drawn by the NASS New England office. Researchers developed questions following many
examples such as agritourism survey in Vermont and Massachusetts between 1998 and 2009,
USDA Agricultural Risk Management survey conducted by the Economic Research Services
office, and Census of Agriculture surveys. There were four sections in the farm survey and the
reference year was 2011. The first section included questions about general profile and
operation, status of organic or non-organic operations, if farmers participated in MFA in 2011
and what types, if farmer received government payment, and how farmers connect with other
farmers and organizations for advice, training, education, and technical support. The second
section gathered financial information regarding estimated sales and expenses in dollars with
respect to conventional distribution/sales, direct sales to non-conventional outlets, agritourism

ASBE 40TH Annual Conference
61
Memphis, TN, September 24-26, 2014
activities, and value added productions beyond fresh produce and meat products. The third
section includes questions about individual demographics, family/household compositions, and
off farm jobs. The last section asked farmers to identify reasons, challenges, entrepreneurial
characteristics, and expectations/future outlook as the result of their participation in MFA
activities.
The survey was printed at the University of Vermont, and the NASS New England office
assisted in mailing all surveys to 7,026 farmers (including 4,636 producers who responded to the
postcard survey, plus a random sample of 2,390 producers selected by the NASS staff). The
questionnaire was mailed in April 2012 and 1,029 surveys were returned by August 2012 and
useable for analysis (15% response rate). This paper used data from the detailed survey only.
Descriptive Statistics of Respondents’ Profile
The number of survey respondents from each state in New England matched with the
Census of Agriculture farm distribution data very well, which implied the survey respondents
formed a balanced representative sample for our analysis. The demographics of respondents also
mirrored what was reported in the 2012 Census of Agriculture (Graph 1, 2, 3). In general, most
of the respondents were over 55 year of age and a majority was male. Some respondents
indicated a joint ownership with their partners, therefore we had a few in the “male and female
category. While the Census of Agriculture provided no information about farmers’ education,
over 50 percent of our respondents had at least some college education, and most of them had 4-
year college education or above. Looking across categories of annual gross cash sales, more
respondents were earning less than $10,000, followed by earning between $10,000 and
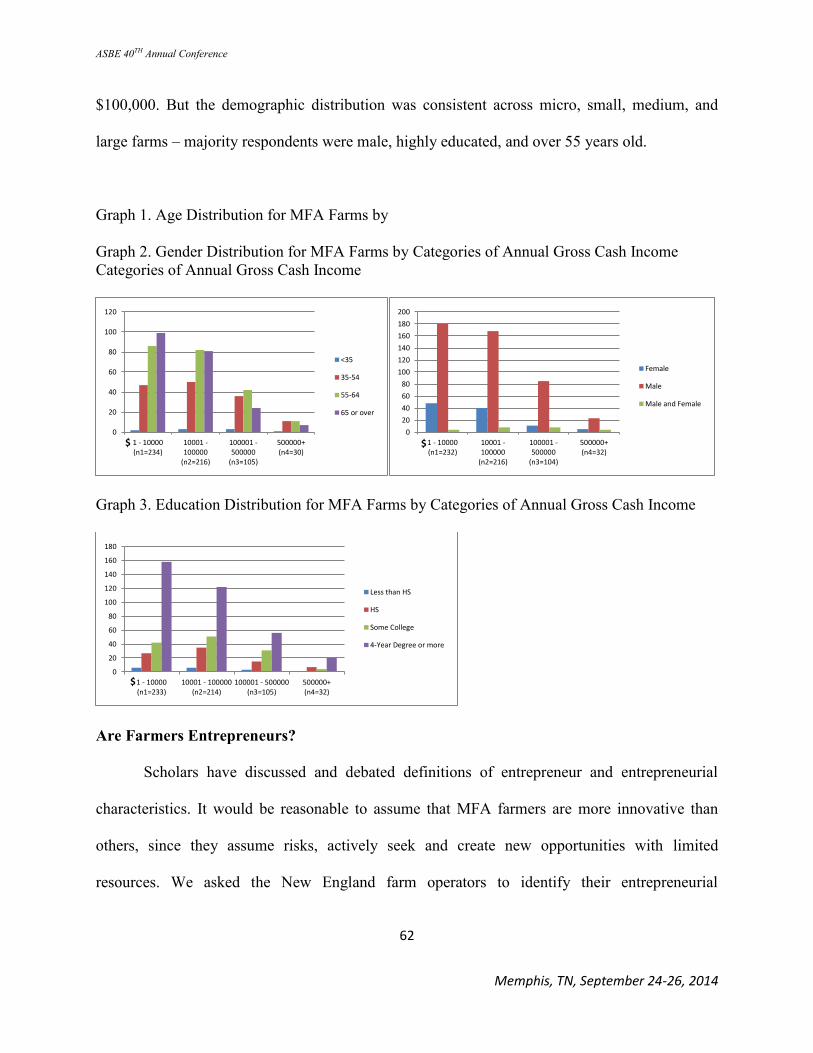
ASBE 40TH Annual Conference
62
Memphis, TN, September 24-26, 2014
$100,000. But the demographic distribution was consistent across micro, small, medium, and
large farms – majority respondents were male, highly educated, and over 55 years old.
Graph 1. Age Distribution for MFA Farms by
Graph 2. Gender Distribution for MFA Farms by Categories of Annual Gross Cash Income
Categories of Annual Gross Cash Income
Graph 3. Education Distribution for MFA Farms by Categories of Annual Gross Cash Income
Are Farmers Entrepreneurs?
Scholars have discussed and debated definitions of entrepreneur and entrepreneurial
characteristics. It would be reasonable to assume that MFA farmers are more innovative than
others, since they assume risks, actively seek and create new opportunities with limited
resources. We asked the New England farm operators to identify their entrepreneurial
0
20
40
60
80
100
120
1 - 10000(n1=234)
10001 -100000
(n2=216)
100001 -500000
(n3=105)
500000+(n4=30)
<35
35-54
55-64
65 or over
$ 0
20
40
60
80
100
120
140
160
180
200
1 - 10000(n1=232)
10001 -100000
(n2=216)
100001 -500000
(n3=104)
500000+(n4=32)
Female
Male
Male and Female
0
20
40
60
80
100
120
140
160
180
1 - 10000(n1=233)
10001 - 100000(n2=214)
100001 - 500000(n3=105)
500000+(n4=32)
Less than HS
HS
Some College
4-Year Degree or more
$
$
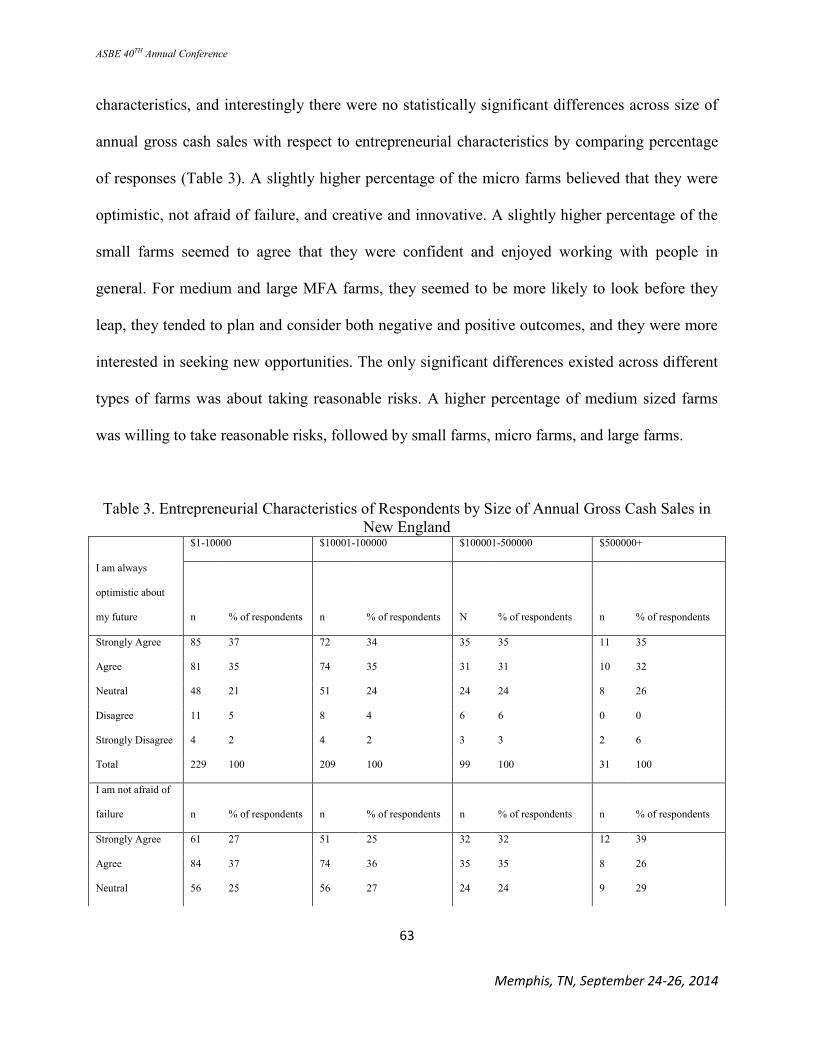
ASBE 40TH Annual Conference
63
Memphis, TN, September 24-26, 2014
characteristics, and interestingly there were no statistically significant differences across size of
annual gross cash sales with respect to entrepreneurial characteristics by comparing percentage
of responses (Table 3). A slightly higher percentage of the micro farms believed that they were
optimistic, not afraid of failure, and creative and innovative. A slightly higher percentage of the
small farms seemed to agree that they were confident and enjoyed working with people in
general. For medium and large MFA farms, they seemed to be more likely to look before they
leap, they tended to plan and consider both negative and positive outcomes, and they were more
interested in seeking new opportunities. The only significant differences existed across different
types of farms was about taking reasonable risks. A higher percentage of medium sized farms
was willing to take reasonable risks, followed by small farms, micro farms, and large farms.
Table 3. Entrepreneurial Characteristics of Respondents by Size of Annual Gross Cash Sales in
New England
$1-10000 $10001-100000 $100001-500000 $500000+
I am always
optimistic about
my future n % of respondents n % of respondents N % of respondents n % of respondents
Strongly Agree 85 37 72 34 35 35 11 35
Agree 81 35 74 35 31 31 10 32
Neutral 48 21 51 24 24 24 8 26
Disagree 11 5 8 4 6 6 0 0
Strongly Disagree 4 2 4 2 3 3 2 6
Total 229 100 209 100 99 100 31 100
I am not afraid of
failure n % of respondents n % of respondents n % of respondents n % of respondents
Strongly Agree 61 27 51 25 32 32 12 39
Agree 84 37 74 36 35 35 8 26
Neutral 56 25 56 27 24 24 9 29

ASBE 40TH Annual Conference
64
Memphis, TN, September 24-26, 2014
Disagree 24 11 21 10 6 6 1 3
Strongly Disagree 3 1 4 2 3 3 1 3
Total 228 100 206 100 100 100 31 100
I am creative and
innovative n % of respondents n % of respondents n % of respondents n % of respondents
Strongly Agree 81 36 64 31 36 36 15 48
Agree 86 38 75 36 30 30 12 39
Neutral 52 23 54 26 31 31 2 6
Disagree 6 3 11 5 1 1 2 6
Strongly Disagree 2 1 3 1 1 1 0 0
Total 227 100 207 100 99 100 31 100
I am always
confident about
my decisions n % of respondents n % of respondents n % of respondents n % of respondents
Strongly Agree 48 21 28 13 17 17 11 35
Agree 94 41 117 56 49 49 13 42
Neutral 71 31 51 24 29 29 6 19
Disagree 14 6 12 6 5 5 1 3
Strongly Disagree 1 0 1 0 0 0 0 0
Total 228 100 209 100 100 100 31 100
I enjoy working
with people in
general n % of respondents n % of respondents n % of respondents n % of respondents
Strongly Agree 83 36 69 33 32 32 8 26
Agree 78 34 80 38 31 31 13 42
Neutral 47 21 38 18 30 30 8 26
Disagree 19 8 16 8 5 5 1 3
Strongly Disagree 1 0 5 2 3 3 1 3
Total 228 100 208 100 101 100 31 100
I usually look n % of respondents n % of respondents n % of respondents n % of respondents

ASBE 40TH Annual Conference
65
Memphis, TN, September 24-26, 2014
before I leap
Strongly Agree 86 38 82 39 41 41 11 35
Agree 90 39 72 35 40 40 13 42
Neutral 41 18 43 21 15 15 5 16
Disagree 9 4 6 3 4 4 1 3
Strongly Disagree 2 1 5 2 0 0 1 3
Total 228 100 208 100 100 100 31 100
I am willing to
take reasonable
risks* n % of respondents n % of respondents n % of respondents n % of respondents
Strongly Agree 61 27 56 27 32 32 15 48
Agree 109 48 102 49 53 52 7 23
Neutral 47 21 40 19 15 15 9 29
Disagree 11 5 8 4 1 1 0 0
Strongly Disagree 1 0 2 1 0 0 0 0
Total 229 100 208 100 101 100 31 100
When planning, I
usually consider
both negative and
positive outcomes n % of respondents n % of respondents n % of respondents n % of respondents
Strongly Agree 92 40 68 33 47 47 19 61
Agree 100 44 93 45 42 42 10 32
Neutral 29 13 38 18 10 10 2 6
Disagree 6 3 6 3 2 2 0 0
Strongly Disagree 2 1 2 1 0 0 0 0
Total 229 100 207 100 101 100 31 100
I always seek new
opportunities n % of respondents n % of respondents n % of respondents n % of respondents
Strongly Agree 44 19 25 12 23 23 10 33
Agree 67 30 73 35 29 29 10 33
Neutral 94 41 80 39 38 38 8 27
Disagree 19 8 25 12 9 9 2 7
Strongly Disagree 3 1 4 2 2 2 0 0

ASBE 40TH Annual Conference
66
Memphis, TN, September 24-26, 2014
Total 227 100 207 100 101 100 30 100
I usually try to
find as much
information as I
can before I
decide what to do n % of respondents n % of respondents n % of respondents n % of respondents
Strongly Agree 89 39 86 41 40 40 13 42
Agree 84 37 76 36 39 39 8 26
Neutral 46 20 37 18 19 19 10 32
Disagree 5 2 8 4 3 3 0 0
Strongly Disagree 4 2 2 1 0 0 0 0
Total 228 100 209 100 101 100 31 100
I try to be
reasonably certain
about the situation
I face when
starting an
important activity n % of respondents n % of respondents n % of respondents n % of respondents
Strongly Agree 83 36 65 32 45 45 13 42
Agree 103 45 114 56 39 39 13 42
Neutral 32 14 19 9 15 15 4 13
Disagree 7 3 6 3 2 2 1 3
Strongly Disagree 3 1 1 0 0 0 0 0
Total 228 100 205 100 101 100 31 100
Note: * indicates statistically significant at 10%.
Why Do Farmers Engage in MFA?

ASBE 40TH Annual Conference
67
Memphis, TN, September 24-26, 2014
Why and how people become entrepreneurial is a mystery. Previous literature found that
farmers were interested in sustaining and growing their farm through additional activities to
provide jobs for family, and to use existing resources to create additional opportunities that
would generate extra value and benefits. Whether it is due to the depression or personal
preferences, farm entrepreneurs make decisions to participate in MFA by observing trends or
solving problems to improve personal and family well-being. Farming is risky, and taking on
more work certainly add stress to farm families. We asked farmers a simple question – why do
you participate in MFA? (Table 4) Obviously financial incentive, promoting connections with
customers, and seeking diversification seemed to be the most important reasons, especially for
large farms. Other reasons such as promoting locally produced products, offering employment to
family members, sustaining local farmland, and providing educational channel seemed to be
equally important across all sizes of farms. Among all direct sales strategies, respondents seemed
to favor direct sales to customers through farm stands, farmers’ markets, and Community
Supported Agriculture programs. A higher percentage of micro farms indicated that they chose to
participate in agritourism, value added production, and direct sales to consumers because it was
their hobby. Access to employer provided health insurance seemed to be very important to all
sizes of farms when they decided to obtain off farm jobs. Maybe the situation is different now
after the Affordable Care Act is in place.
Table 4. Reasons to Participate in MFA by Categories of Annual Gross Cash Sales in New
England
Annual Gross Cash Sales
1 - 10000
(n=241) 10001 - 100000 (n=223)
100001 - 500000
(n=113) 500000+ (n=34)
Increase Revenue through

ASBE 40TH Annual Conference
68
Memphis, TN, September 24-26, 2014
Agritourism*** 9.50% 17.50% 21.20% 35.30%
Value Added*** 12.90% 21.50% 27.40% 44.10%
Sales to Consumers*** 36.50% 52.90% 42.50% 52.90%
Sales to Retailers*** 13.30% 28.30% 30.10% 38.20%
Sales to Institutions*** 2.50% 7.60% 14.20% 11.80%
Off farm jobs 16.20% 15.20% 15.00% 14.70%
Improve Financial Situation through
Agritourism*** 4.60% 12.60% 17.70% 29.40%
Value Added*** 5.80% 17.00% 22.10% 29.40%
Sales to Consumers*** 20.30% 36.80% 34.50% 38.20%
Sales to Retailers*** 7.50% 18.40% 23.00% 32.40%
Sales to Institutions*** 2.10% 6.70% 8.80% 8.80%
Off farm jobs*** 28.60% 29.60% 19.50% 14.70%
Promote Connections to Consumers through
Agritourism*** 9.10% 18.40% 23.90% 32.40%
Value Added** 7.10% 12.60% 15.00% 20.60%
Sales to Consumers* 32.00% 42.20% 30.10% 35.30%
Sales to Retailers*** 7.90% 16.10% 19.50% 20.60%
Sales to Institutions** 2.50% 5.40% 9.70% 11.80%
Off farm jobs 2.10% 1.80% 1.80% 2.90%
Promote Locally Made Products through
Agritourism** 7.50% 12.60% 19.50% 17.60%
Value Added** 10.40% 16.10% 17.70% 26.50%
Sales to Consumers 32.80% 43.00% 26.50% 26.50%
Sales to Retailers* 11.60% 22.40% 15.90% 23.50%
Sales to Institutions* 2.90% 6.70% 9.70% 8.80%
Off farm jobs 3.70% 2.70% 0.90% 2.90%
Diversify Farm Operations through

ASBE 40TH Annual Conference
69
Memphis, TN, September 24-26, 2014
Agritourism* 8.70% 10.80% 16.80% 23.50%
Value Added*** 7.10% 17.90% 19.50% 32.40%
Sales to Consumers*** 12.40% 27.80% 26.50% 29.40%
Sales to Retailers*** 4.60% 14.80% 20.40% 23.50%
Sales to Institutions*** 1.20% 3.60% 9.70% 5.90%
Off farm jobs 5.00% 2.70% 3.50% 11.80%
Provide Employment for Family through
Agritourism* 4.10% 3.60% 8.80% 17.60%
Value Added*** 3.30% 4.90% 10.60% 17.60%
Sales to Consumers 10.40% 14.80% 14.20% 17.60%
Sales to Retailers*** 2.90% 5.80% 10.60% 17.60%
Sales to Institutions 0.40% 1.80% 1.80% 2.90%
Off farm jobs 3.70% 4.90% 7.10% 5.90%
Access Employer Provided Health Insurance through
Agritourism*** 0.00% 0.90% 0.00% 14.70%
Value Added* 0.00% 0.90% 0.00% 8.80%
Sales to Consumers* 1.20% 2.20% 0.00% 8.80%
Sales to Retailers*** 0.00% 1.30% 0.00% 8.80%
Sales to Institutions 0.40% 0.00% 0.00% 2.90%
Off farm jobs 17.80% 14.30% 11.50% 11.80%
Promote Local Farm Scenery through
Agritourism* 11.60% 16.60% 22.10% 20.60%
Value Added 6.60% 6.30% 5.30% 11.80%
Sales to Consumers 15.80% 17.50% 10.60% 11.80%
Sales to Retailers 4.60% 8.50% 4.40% 8.80%
Sales to Institutions 1.20% 2.20% 1.80% 2.90%

ASBE 40TH Annual Conference
70
Memphis, TN, September 24-26, 2014
Off Farm Jobs 2.10% 1.80% 0.90% 2.90%
Enhance Sustainability of Local Farmland through
Agritourism 11.20% 15.20% 15.90% 20.60%
Value Added 11.20% 15.70% 14.20% 20.60%
Sales to Consumers 28.60% 38.10% 24.80% 20.60%
Sales to Retailers* 9.10% 15.20% 13.30% 17.60%
Sales to Institutions* 2.90% 5.40% 5.30% 8.80%
Off Farm Jobs 4.60% 4.50% 1.80% 5.90%
Connect With Other Community Members through
Agritourism 6.20% 7.20% 10.60% 14.70%
Value Added 3.70% 5.40% 3.50% 8.80%
Sales to Consumers 15.40% 17.90% 8.80% 17.60%
Sales to Retailers 8.70% 5.40% 6.20% 14.70%
Sales to Institutions 3.30% 3.60% 2.70% 11.80%
Off Farm Jobs 3.70% 3.10% 4.40% 8.80%
Provide Educational Channel through
Agritourism* 12.90% 13.50% 23.90% 23.50%
Value Added 6.60% 6.30% 5.30% 5.90%
Sales to Consumers 14.90% 18.80% 8.00% 11.80%
Sales to Retailers 4.10% 6.70% 5.30% 5.90%
Sales to Institutions 2.90% 2.20% 3.50% 5.90%
Off Farm Jobs 3.70% 0.90% 2.70% 5.90%
Create Different lifestyle for Family through
Agritourism 8.30% 8.50% 12.40% 17.60%
Value Added 8.70% 9.90% 7.10% 8.80%

ASBE 40TH Annual Conference
71
Memphis, TN, September 24-26, 2014
Sales to Consumers 17.80% 26.00% 13.30% 17.60%
Sales to Retailers 5.40% 10.80% 8.00% 8.80%
Sales to Institutions 1.70% 2.70% 3.50% 2.90%
Off Farm Jobs 4.60% 4.90% 4.40% 5.90%
It is My Hobby through
Agritourism 11.20% 7.20% 6.20% 5.90%
Value Added* 9.10% 9.40% 1.80% 5.90%
Sales to Consumers*** 26.10% 21.50% 3.50% 11.80%
Sales to Retailers 7.90% 9.00% 0.90% 8.80%
Sales to Institutions 1.20% 1.30% 0.00% 8.80%
Off Farm Jobs 4.10% 4.00% 0.00% 8.80%
Note: * indicates statistically significant at 10%; ** indicates statistically significant at 1%; and *** indicates statistically significant at 0.1%.
Challenges and Barrier of MFA Operations in New England
Several challenges and issues were cited from the literature such as lack of resources,
lack of qualified and reliable employees, competition, technical training, and government tax and
other regulations. Scholars also examined family issues, socio-cultural barriers, and structural-
economic-environmental barriers (Mohammadbagher, Siami, Khozain, & Nezambabad, 2012;
Liang & Dunn, 2013). We asked New England farmers to indicate which barriers if applicable
(check all that apply) prohibited their involvement or expansion in MFA. Our survey respondents
seemed to agree with most of the issues that were identified in the literature, with some
discrepancies across different sizes of farms (Table 5).
For micro farms, access to finance was the most important barrier for them to be engaged
in off farm jobs, probably when they intended to start/manage non-agricultural works. Access to
land was one of the barriers for micro farmers to be involved in value added production and
direct sales. Most of the micro farmers agreed that access to networks and support systems was

ASBE 40TH Annual Conference
72
Memphis, TN, September 24-26, 2014
the bigger problem for them to be involved in MFA. Higher percentage of small farms indicated
that access to finance, access to market, access to labor, and access to service providers/vendors
were issues for them to be involved in MFA. Interestingly for large farms, access to training and
access to service provider/vendors were major issues with respect to value added production.
Are We Better Off as the Results of Participating in MFA?
Decisions have consequences! Farmers who choose to participate in MFA shared their
honest opinion about consequences and future outlook after they adopted MFA strategies (Table
6). An overwhelmingly higher percentage of respondents, regardless of type of farm, agreed that
they would continue participating in MFA. A significantly higher percentage of micro farmers
agreed and strongly agreed that MFA indeed improved their family financial situation and
quality of life. Many micro farmers were neutral regarding whether their family had a more
positive outlook for their farming future as the results of MFA. The future outlook of these micro
family farms probably related more to the overall assessment of economic volatility, and
uncertainty of family members’ future decisions whether young people will stay in farming. For
small, medium, and large size farms, our respondents seemed to be very positive about the
impacts of MFA on their family financial situation, quality of life, and future outlook of farming.
As discussed in previous studies, most small business owners believed that their family members
would support them in the new venture creation process if they would start another new venture
in the future (Liang & Dunn, 2009; Liang & Dunn, 2013).

ASBE 40TH Annual Conference
73
Memphis, TN, September 24-26, 2014
Table 5. Challenges for New England MFA Farmers
Access to Financing Capital to Gross Farm Income
1 - 10000 10001 - 100000 100001 - 500000 500000+ Total Respondents
Agritourism 33.30% (n=18) 38.90% (n=21) 20.40% (n=11) 7.40% (n=4) 54
Value Added 31.40% (n=16) 35.30% (n=18) 25.50% (n=13) 7.80% (n=4) 51
sales to consumers 38.30% (n=18) 42.60% (n=20) 12.80% (n=6) 6.40% (n=3) 47
Sales to retail 35.30% (n=12) 47.10% (n=16) 8.80% (n=3) 8.80% (n=3) 34
sales to institutions 30.40% (n=7) 43.50% (n=10) 17.40% (n=4) 8.70% (n=2) 23
off-farm jobs/business 60.00% (n=9) 26.70% (n=4) 6.70% (n=1) 6.70% (n=1) 15
Access to Land to Gross Farm Income
Agritourism 34.80% (n=8) 34.80% (n=8) 13.00% (n=3) 17.40% (n=4) 23
value added 50.00% (n=9) 22.20% (n=4) 22.20% (n=4) 5.60% (n=1) 18
sales to consumers 48.70% (n=19) 33.30% (n=13) 15.40% (n=6) 2.60% (n=1) 39
sales to retail 39.50% (n=15) 36.80% (n=14) 15.80% (n=6) 7.90% (n=3) 38
sales to institutions 30.00% (n=6) 40.00% (n=8) 20.00% (n=4) 10.00% (n=2) 20
off-farm jobs/business 37.50% (n=3) 50.00% (n=4) 12.50% (n=1) 8
Access to Markets and Customers to Gross Farm income
Agritourism 30.00% (n=9) 30.00% (n=9) 20.00% (n=6) 20.00% (n=6) 30
value added 18.50% (n=5) 48.10% (n=13) 18.50% (n=5) 14.80% (n=4) 27
sales to consumers 35.30% (n=18) 41.20% (n=21) 15.70% (n=8) 7.80% (n=4) 51
sales to retail 28.10% (n=9) 40.60% (n=13) 15.60% (n=5) 15.60% (n=5) 32
sales to institutions 38.10% (n=8) 33.30% (n=7) 23.80% (n=5) 4.80% (n=1) 21

ASBE 40TH Annual Conference
74
Memphis, TN, September 24-26, 2014
off-farm jobs/business 33.33% (n=3) 66.67% (n=6)
9
Access to Labor to Gross farm income
Agritourism 33.30% (n=13) 28.20% (n=11) 28.20% (n=11) 10.30% (n=4) 39
value added 33.30% (n=16) 33.30% (n=16) 25.00% (n=12) 8.30% (n=4) 48
sales to consumers 32.90% (n=24) 43.80% (n=32) 16.40% (n=12) 6.80% (n=5) 73
sales to retail 26.30% (n=10) 39.50% (n=15) 21.10% (n=8) 13.20% (n=5) 38
sales to institutions 34.60% (n=9) 26.90% (n=7) 26.90% (n=7) 11.50% (n=3) 26
off-farm jobs/business 54.50% (n=6) 18.20% (n=2) 27.30% (n=3) 11
Access to Training to Gross farm income
Agritourism 46.20% (n=6) 23.10% (n=3) 23.10% (n=3) 7.70% (n=1) 13
value added 25.00% (n=2) 25.00% (n=2) 12.50% (n=1) 37.50% (n=3) 8
sales to consumers 54.50% (n=6) 18.20% (n=2) 18.20% (n=2) 9.10% (n=1) 11
sales to retail 33.30% (n=2) 16.70% (n=1) 33.30% (n=2) 16.70% (n=1) 6
sales to institutions 33.30% (n=2) 16.70% (n=1) 33.30% (n=2) 16.70% (n=1) 6
off-farm jobs/business 50.00% (n=2) 50.00% (n=2) 4
Access to Service Providers/Vendors to Gross Farm Income
Agritourism 27.30% (n=3) 36.40% (n=4) 18.20% (n=2) 18.20% (n=2) 11
value added 27.30% (n=3) 36.40% (n=4) 9.10% (n=1) 27.30% (n=3) 11
sales to consumers 47.06% (n=8) 35.29% (n=6) 17.65% (n=3)
17
sales to retail 56.30% (n=9) 31.30% (n=5) 12.50% (n=2) 16
sales to institutions 57.10% (n=4) 28.60% (n=2) 14.30% (n=1) 7
off-farm jobs/business 50.00% (n=2) 50.00% (n=2) 4

ASBE 40TH Annual Conference
75
Memphis, TN, September 24-26, 2014
Access to networks and Support Systems to Gross Farm Income
Agritourism 50.00% (n=13) 26.90% (n=7) 11.50% (n=3) 11.50% (n=3) 26
value added 31.60% (n=6) 15.80% (n=3) 21.10% (n=4) 31.60% (n=6) 19
sales to consumers 57.10% (n=16) 25.00% (n=7) 10.70% (n=3) 7.10% (n=2) 28
sales to retail 51.90% (n=14) 33.30% (n=9) 7.40% (n=2) 7.40% (n=2) 27
sales to institutions 54.50% (n=12) 31.82% (n=7) 9.09% (n=2) 4.55% (n=1) 22
off-farm jobs/business 50.00% (n=3) 33.30% (n=2) 16.70% (n=1) 6
Table 6. Selected Outcomes for the New England MFA Farms
$1-10000 $10001-100000 $100001-500000 $500000+
My family's financial situation has been improved** n % of respondents n % of respondents n % of respondents n % of respondents
Strongly Agree 38 18 62 32 31 39 3 14
Agree 48 23 58 30 24 30 9 43
Neutral 69 33 48 25 14 18 4 19
Disagree 31 15 18 9 8 10 3 14
Strongly Disagree 22 11 9 5 2 3 2 10
Total 208 100 195 100 79 100 21 100
My family's quality of life has been improved* n % of respondents n % of respondents n % of respondents n % of respondents
Strongly Agree 72 34 75 38 23 29 3 14
Agree 82 38 63 32 23 29 7 32
Neutral 40 19 38 19 25 32 8 36
Disagree 10 5 13 7 6 8 1 5
Strongly Disagree 9 4 6 3 2 3 3 14

ASBE 40TH Annual Conference
76
Memphis, TN, September 24-26, 2014
Total 213 100 195 100 79 100 22 100
My family has a more positive outlook for our farming operations n % of respondents n % of respondents n % of respondents n % of respondents
Strongly Agree 28 14 24 13 16 21 2 9
Agree 47 23 58 30 28 36 10 45
Neutral 80 39 64 33 24 31 6 27
Disagree 38 19 36 19 8 10 2 9
Strongly Disagree 11 5 10 5 2 3 2 9
Total 204 100 192 100 78 100 22 100
I would continue participating in multifunctional operations in the future*** n % of respondents n % of respondents n % of respondents n % of respondents
Strongly Agree 88 43 85 48 40 56 10 42
Agree 74 36 51 29 17 24 12 50
Neutral 21 10 30 17 13 18 0 0
Disagree 14 7 3 2 0 0 0 0
Strongly Disagree 8 4 8 5 2 3 2 8
Total 205 100 177 100 72 100 24 100
Note: * indicates statistically significant at 10%; ** indicates statistically significant at 1%; and *** indicates statistically significant at 0.1%.

ASBE 40TH Annual Conference
77
Memphis, TN, September 24-26, 2014
Conclusions and Implications
Individuals can and will develop entrepreneurial skills and experiences when
circumstances provoke them. Globally researchers agree that people who are driven by their own
desire and accumulated experiences, supported by family/friends and organizations, and
recognized by their reputation and contribution are more likely to become successful
entrepreneurs (Pissarides, Singer, & Svejnar, 2003; Cetindamar, 2005; Bewayo, 1995; Niazkr &
Arab-Moghaddam, 2011). Our first hypothesis was supported by the survey results that most of
the farmers who participated in our study, regardless of the size of sales, shared similar
entrepreneurial characteristics as described in literature – being optimistic, realistic, creative,
innovative, confident, and open minded to opportunities. There was a significant difference with
respect to taking reasonable risks across four types of farms. Large farmers tended to be more
realistic and more conservative in planning and seeking new opportunities. It makes sense for
different sizes of farms to consider different intensity of capital investment, resource allocation,
organizational structure, and management and marketing strategies when engaging in MFA. It
would imply more complex decision making process for large commercial farms compared to
micro, small, and medium sized farms.
Literature has never discussed why farmers decided to engage in MFA, and how MFA
influenced farming orientations and future outlook for farm households. According to the Census
of Agriculture and the USDA ERS Resource Management Survey (USDA, 2009; USDA 2012),
the net increase in the number of family farms was more than 100,000 since 2005. Over 50
percent of these family farms earn less than $10,000 in annual gross cash sales. What triggered
more people to go into farming? The survey results supported our second hypothesis that MFA

ASBE 40TH Annual Conference
78
Memphis, TN, September 24-26, 2014
farm operators chose to participate in MFA when considering different types of MFA activities
depending on the size of annual gross cash sales. Micro and small farms in our study chose to
participate in various MFA activities for different reasons compared to medium and large size
farms. Given a steadily growing aging trend among farm operators, micro and small farms have
more serious concerns about their farming future. Many survey respondents, particularly micro
and small farms, chose to use direct sales to connect with customers because farmers would like
to promote consumers’ awareness about local foods, offer educational channel for general public
about farming and origin of food, enhance sustainability of local farmland, and connect with
other organizations in the community. Nor surprisingly many micro and small farms were hobby
farms or lifestyle farms, and these would likely be noncommercial family farms as defined by the
USDA. Large commercial farms, on the other hand, preferred to use value added production to
diversify farming activities and to increase revenue.
In our survey, the MFA farms share the same passion and the same concerns as
entrepreneurs in other industries. The survey results supported our third hypothesis that MFA
farms’ financial situation and quality of life had been improved as the results of participating in
MFA regardless the size of annual gross cash sales. Micro farmers had to cross more hurdles
than other sizes of farms in our survey. A higher percentage of micro farms revealed challenges
in accessing resources such as capital, land, qualified labor, technical support, and networks no
matter what types of the MFA they chose to establish. Small farms engaged in direct sales had
more issues to acquire capital, market, and customers. Large commercial farms needed more
technical training when they decided to participate in value added production. Many farmers
offered additional comments when they returned surveys. Many shared comments about future
generation lacking interests and skills to continue farming activities, and they would not

ASBE 40TH Annual Conference
79
Memphis, TN, September 24-26, 2014
recommend their own children to go into farming. Agricultural operations cannot be controlled
or managed when dealing with weather issues, climate change, and natural disasters. Farmers
rely on experience and history to operate and manage the best they can, given a set of parameters
over which they have no control. Many farmers prefer their children to get steady jobs outside
farming first, then maybe the children can stay in agriculture once they have income security.
Most of the respondents were still very excited, optimistic, and committed to the future of
farming and the development of MFA. A majority respondents believed that MFA indeed
improved their financial situation and quality of life. Micro farmers were not as sure if
participating in MFA actually made any difference in their financial situation. Micro farmers
were also more reserved in future outlook with respect to MFA. In general, a significant
proportion of our survey respondents would continue participating in MFA in the future. Several
survey respondents commented on why they would like to adopt the MFA, for example:
“I had a full time job and I am still a farmer. It is a great way to build my retirement life style to
be a farmer.”
“Our farm is a farm, but we focus more on teaching people how to grow certain things. We want
to educate others and help other farmers to succeed.”
“I want to work with other farmers to build a stronger network for farmers to link with other
people and organizations in our community. Our farm is very small, but we have a bigger vision
to contribute to our community.”

ASBE 40TH Annual Conference
80
Memphis, TN, September 24-26, 2014
“We do not sell much of our farm products. But our farm offers seed and pollination services to
others. We also give away compost to others. Our services count more than farm income.”
The spirit of the MFA is beyond applying innovative strategies for diversification or
profit maximization. Farmers, large or small, offer intangible assets to our society. The working
landscape and sustainable ecology significantly contribute to the improvement of quality of life
and community health for all. Much information in existing literature has talked about
entrepreneurs’ achievement in society (Swierczek & Thai, 2003; Benzing, Chu, & Callanan,
2005; Benzing & Chu, 2005; Pistrui, Huang, Oksoy, Zhao, & Welsch, 2001; Ozsoy, Oksoy, &
Kozan, 2001; Bewayo, 1995; Cetindamar, 2005). The MFA farmers in our study set balanced
goals to reach for personal satisfaction and growth, creating opportunities to support family
members and others, and making direct positive impacts to communities. It seems that more
people are entrepreneurial and enthusiastic about farming and engaging in MFA, which could
lead to a promising and prosperous future in agriculture in the U.S. This has a strong implication
in policy formation to support farmers who are engaged in or interested in MFA. The USDA
recently introduced a program, Know Your Farmer, Know Your Food (Image 1), to promote
local food movement and to help producers to connect with consumers. Farmers’ Market
Programs and Farm-to-School Programs are only two examples of federal initiatives in the local
food campaign. However there is still a very large gap between Federal initiatives and state and
local legislation to help small farmers. Many issues around regulations, taxation, and legitimacy
of practicing/establishing MFA still need to be defined and polished for small farmers to follow.
We also encourage our entrepreneurship and small business colleagues to include, where
possible, small farmers in their research. It will be beneficial to both agricultural and non-
agricultural audiences to learn from multiple aspects by bridging science-based knowledge and

ASBE 40TH Annual Conference
81
Memphis, TN, September 24-26, 2014
information from theories and practices generated by entrepreneurship, social studies,
economics, environmental sciences, and ecological analysis scholars.
Image 1. USDA Know Your Farmer Know Your Food Website
http://www.usda.gov/wps/portal/usda/knowyourfarmer?navid=KNOWYOURFARMER

ASBE 40TH Annual Conference
82
Memphis, TN, September 24-26, 2014
References
Benzing, C, Chu, H. & Callanan, G., (2005). A regional comparison of the motivation and
problems of Vietnamese entrepreneurs, Journal of Developmental Entrepreneurship, 10
(3), pp 3-27.
Benzing, C., & Chu, H. M. (2005). Entrepreneurial behavior in Andhra Pradesh, India,
Proceedings of the Association of Global Business, Miami Beach, Florida.
Bewayo, E. D. (1995). Uganda entrepreneurs: Why are they in business? Journal of Small
Business Strategy, 6, pp 67–78.
Bohman, M., Cooper, J., Mullarkey, D., Normile, M. A., Skully, D., Vogel, S. & Young, E.
(1999). The use and abuse of multifunctionality. U.S.Department of Agriculture,
Economic Research Service. Available at
www.ers.usda.gov/briefing/WTO/PDF/multifunc1119.pdf
Brouwer, F. & Martijn van der Heide, C. eds., (2009), Multifunctional rural land management:
Economics and policies. Earthscan Publs., Sterling, VA, 360pp.
Cetindamar, D. (2005). Policy issues for Turkish entrepreneurs. International Journal of
Entrepreneurship and Innovation Management, 5(314), pp. 187–205.
Davidsson, P. & Honig, B. (2003). The role of social and human capital among nascent
entrepreneurs. Journal of Business Venturing, 18(3), pp. 301-331.
Devries, B. (2000). Multifunctional Agriculture in the International Context: A Review, The
Land Stewardship Project, Retrieved on April 30, 2011 from
http://www.landstewardshipproject.org/mba/MFAReview.pdf
European Commission. (2012). The Common Agricultural Policy A partnership between Europe
and Farmers. Retrieved July 6, 2013, from Europa: http://ec.europa.eu/agriculture/cap-
overview/2012_en.pdf
Glancey, K. & Malcolm, P. (1997). Entrepreneurship in the hotel sector, International Journal of
Contemporary Hospitality Management. 9 (1), pp. 21-24.
Hajnalka, P. & Alajos, F. (2009). The multifunctionality of agriculture and risk management as
seen by Hungarian farmers involved in diversified farming, Studies in Agricultural
Economics, 109, pp. 103-116.
Hansen, T. (2003). Intertype competition: Specialty food stores competing with supermarkets.
Journal of Retailing and Consumer Services, 10, pp. 35-49.

ASBE 40TH Annual Conference
83
Memphis, TN, September 24-26, 2014
Heller, L. (2007). Specialty foods driven by quest for premium, Says Mintel, Food Navigator,
October 19, Retrieved on May 6, 2009 from
http://www.foodnavigatorusa.com/content/view/print/91923
Hoppe, R., MacDonald, J., & Korb, P. (2010). Small farms in the United States: Persistence
under pressure, Economic Information Bulletin, No (EIB-63).
Hughes, K. W., Kennedy, P. L. & Ortego, A. (1999). Developing agribusiness competitiveness
in global markets: A survey of Louisiana agribusiness firms. Journal of International
Food & Agribusiness Marketing, 10 (2), (March) pp. 49-63.
Kinsey, J. & Senauer, B. (1996). Food marketing in an electronic age: Implications for
agricultural producers, Working Paper 96-02, The Retail Food Industry Center.
Retrieved on May 1, 2009 from http://ideas.repec.org/p/ags/umrfwp/14303.html
Lee, J. (1997). The motivation of women entrepreneurs in Singapore. International Journal of
Entrepreneural Behavior and Research. 3 (2), pp. 93-110.
Liang, C. & Dunn, P. (2013). “The Love of My Life” or “The Life I Love” – Investigating
impacts of new venture creation on marriage. Journal of Business and Entrepreneurship.
5, pp. 95-114.
Liang, K. & Dunn, P. (2009) Entrepreneurial couples in new venture creation: Reflections on
expectations, reality, and family relationships. International Journal of Management and
Enterprise Development, 6 (2), pp. 165-183.
Liang, C., (2002). My love and my business: Expectation and reality of couples working together
in a new venture creation, Academy of Entrepreneurship Journal, 8 (2), pp. 53-78.
Liang, C. & Su, F. (2013). Understanding the relationship between multifunctional agriculture,
community resilience, and rural development, Poster Presentation, Federal Reserve
System Conference, Washington, DC, April, pp. 10-12.
Liang, C., Su, F., Dunn, P., & Pescatore, M. (2012). Exploring situations of the community-
based multifunctional agriculture in the New England Region, Applied and Agricultural
Economics Association Annual Meeting, Seattle, Washington, August.
Liang, C. (2012). Multifunctional farms in New England and implications to rural development,
webinar, eExtension, University of Vermont
http://www.uvm.edu/tourismresearch/agritourism/
MacDonald, J. (2010). Small farms, big differences, USDA Blog,
http://blogs.usda.gov/2010/05/18/small-farms-big-differences/
ASBE 40TH Annual Conference
84
Memphis, TN, September 24-26, 2014
McClelland, D. C. (1965). JV Achievement and entrepreneurship: A longitudinal study. Journal
of Personality and Social Psychology, 1, pp. 389-392.
McGehee, N. G. (2007). An agritourism systems model: A Weberian perspective, Journal of
Sustainable Tourism, 15 (2), (March), pp. 111-124.
Morris, M., Leyland, P., & Berthon, P. (1996). Entrepreneurial activity in the third world
informal sector. International Journal of Entrepreneurial Behavior and Research. 2 (1).
pp 59-76.
Niazkar, F. & Arab-Moghaddam, N. (2011). Study of barriers to women's entrepreneurship
development among Iranian women, World Academy of Science, Engineering and
Technology, 60, pp. 1115-1119.
Orhan, M. & Scott, S. (2001). Why women enter into entrepreneurship: An explanatory model.
Women in Management Review. 16 (5). pp. 232-247.
Ozsoy, O., Oksoy, D. & Kozan, K. (2001). The characteristics of Turkish entrepreneurs and
their enterprises. Long Island, NY: College of Business, Alfred University.
Pistrui, D., Huang, W., Oksoy, D., Zhao, J. & Welsch, H. (2001). The characteristics and
attributes of new Chinese entrepreneurs and their emerging enterprises, Business Forum,
24(3–4), pp. 31–39.
Pissarides, F., Singer, M., & Svejnar, J. (2003), Objectives and constraints of entrepreneurs:
Evidence from small and medium size enterprises in Russia and Bulgaria, Journal of
Comparative Economics, 31 (3), September 2003, pp. 503–531
Renting, H., Rossing, W., Groot, J., Van der Ploeg, J., Laurent, C., Perraud, D., Stobbelaar, D.,
& Van Ittersum, M. (2009), Exploring multifunctional agriculture: A review of
conceptual approaches and prospects for an integrative transitional framework. Journal of
Environmental Management, 90, S112-S123.
Roth, M. (1999). Overview of farm direct marketing industry trends, Agricultural Outlook
Forum, Agricultural Marketing Extension, Cornell Cooperative Extension.
Small Business Administration, (2008). Statistics and Summary. Available online: www.sba.gov
Small Business Administration, (2012). Statistics and Summary. Available online: www.sba.gov
Shane, S., Locke, E. A., & Collins, C. J. (2012). Entrepreneurial motivation [Electronic version].
Retrieved July 4, 2014, from Cornell University, ILR School site:
http://digitalcommons.ilr.cornell.edu/articles/x

ASBE 40TH Annual Conference
85
Memphis, TN, September 24-26, 2014
Swierczek , F. & Thai, T. (2003) Motivation, entrepreneurship and the performance of SMEs in
Vietnam, Journal of Enterprising Culture, 11 (01), pp. 47-68
Tippins, M., Rassuli, K. & Hollander, S. (2002). An assessment of direct Farm-To-Table food
marketing in the USA, International Journal of Retail & Distribution Management, 30
(7), pp. 343-353.
U.S. Department of Agriculture, National Agricultural Statistics Service, (2007)
http://www.agcensus.usda.gov/Publications/2007/Online_Highlights/Fact_Sheets/Farm_
Numbers/small_farm.pdf
U. S. Department of Agriculture, (2009). Resource Management Survey, Economic Research
Services, available online: www.ers.usda.gov
U.S. Department of Agriculture, National Agricultural Statistics Service, (2012)
http://www.agcensus.usda.gov/Publications
Van Huylenbroeck, G. & Durand, G. eds. Multifunctional Agriculture: A New Paradigm for
European Agriculture and Rural Development. Hampshire: Ashgate, 2003.
Van der Poeg, Jan Douwe and Roep, Dirk. (2003). Multifunctionality and Rural Development:
the Actual Situation in Europe, chapter 3 in Van Huylenboeck, Guido and Guy Durand,
(eds.), Multifunctional Agriculture: A New Paradigm for European Agriculture and
Rural Development. Hampshire: Ashgate.
White, G. K. (1997). International online marketing of foods to US consumers. International
Marketing Review, 4 (5), pp. 376-384.
White, G. K. (1996). Factors influencing consumers’ likelihood of purchasing specialty food and
drink products on-line: Results of consumer reviews of 12 selected sites. Journal of Food
Distribution Research, (October), pp. 31-40.
White, G. K. & Manning, B. (1998). Commercial WWW site appeal: How does it affect online
food and drink consumers’ purchasing behavior? Internet Research: Electronic
Networking Applications and Policy, 8 (1), pp. 32-38.

ASBE 40TH Annual Conference
86
Memphis, TN, September 24-26, 2014
Appendix 1. Postcard Survey

ASBE 40TH Annual Conference
87
Memphis, TN, September 24-26, 2014
Appendix 2. Detailed Farm Survey

ASBE 40TH Annual Conference
88
Memphis, TN, September 24-26, 2014
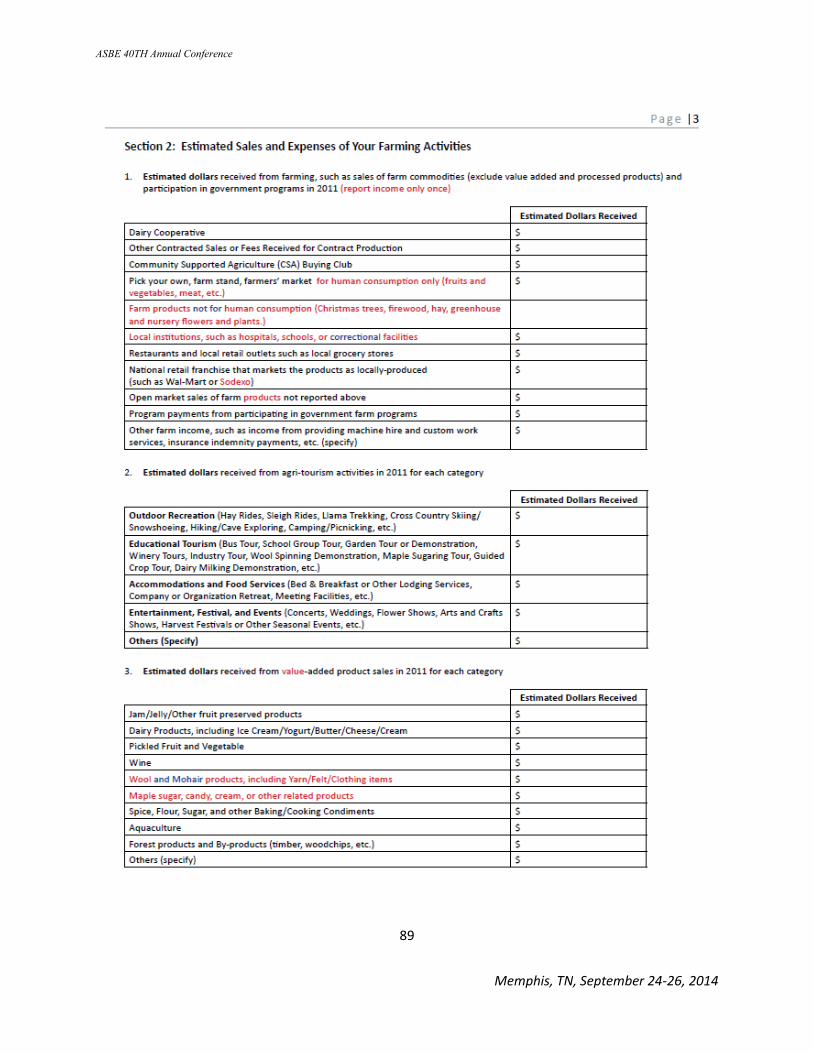
ASBE 40TH Annual Conference
89
Memphis, TN, September 24-26, 2014

ASBE 40TH Annual Conference
90
Memphis, TN, September 24-26, 2014

ASBE 40TH Annual Conference
91
Memphis, TN, September 24-26, 2014

ASBE 40TH Annual Conference
92
Memphis, TN, September 24-26, 2014

ASBE 40TH Annual Conference
93
Memphis, TN, September 24-26, 2014

ASBE 40TH Annual Conference
94
Memphis, TN, September 24-26, 2014
A Study of Social Media Usage by Small Business Owners
Martin S. Bressler, Southeastern Oklahoma State University
Kitty Campbell, Southeastern Oklahoma State University
Brett Elliott, Southeastern Oklahoma State University
Abstract
The importance of small businesses to our nation’s economy cannot be understated.
According to the U.S. Small Business Administration (SBA), in 2013 there were 28.2 million
small businesses employing 55 million persons (Small Business Profiles for the States and
Territories). Nationally, small businesses represent 99.7% of all businesses and account for 48%
of all jobs.
Social media could be an effective means for small businesses to market to their customer
markets. However, a report by eMarketer (cited in SBA Community blog) found only 24 percent
of small businesses have yet to incorporate social to their marketing efforts. That same report as
referred to findings from Constant Contact where only 49 percent of small businesses considered
social media an effective marketing tool. Of course, the lack of effectiveness could be accounted
for by small business owner lack of knowledge, selecting the wrong form of social media, lack of
time or skill to devote to a social media campaign, or other reasons.
According to Wilson (2010), the year 2001 marked an important development in social
media marketing as weblogs, or blogs began to replace cluttered forums. WordPress is one of the
most popular platforms for blogs and the company reports more than 100 million downloads of
their software. Bloggers provide customers with a new sense of power and can help shape
products and pricing. In addition, bloggers can influence followers as to what brands to buy or

ASBE 40TH Annual Conference
95
Memphis, TN, September 24-26, 2014
not buy. But as one small business owner blogger noted “One #$%$ off customer can scare off
ten others.One #$%$ off employee can scare away hundreds.”
In their small study of social media trends of New Zealand small businesses Li, Yu, and
Fielden (2013) found small businesses unwilling (or able) to spend more than $2000 on a social
media campaign and focused their efforts primarily using Facebook. Moreover, Yahoo Small
Business Advisor reports that in 2012 small business owners spent 25% of their marketing
budget (10.4% of sales) on digital marketing (Yahoo Small Business Advisor). Therefore, a
small business with one million dollars in annual revenue would spend on average, twenty-five
thousand dollars on digital marketing.
The authors conducted a nationwide survey of small business owners to develop a better
understanding of social media usage in their businesses. More than 800 small business owners
responded and their responses provided some interesting data. More than a third (37.6%0 did not
use social media at all in their business. For those small business owners who do use social
media, LinkedIn was the most commonly used medium.
Female small business owners were found to be more likely to use social media for their
business, including LinkedIn, Facebook and Twitter. Younger small business owners were found
to be more likely to social media of all types. In this paper, the authors provide a profile of small
business owner’s usage of social media and offer recommendations to market those businesses
more efficiently and effectively.

ASBE 40TH Annual Conference
96
Memphis, TN, September 24-26, 2014
Gender Differences of Entrepreneurs in Micro Businesses
Carl A. Kogut, University of Louisiana at Monroe
Donna W. Luse, University of Louisiana at Monroe
Larry E. Short, University of Louisiana at Monroe
Abstract
Analysis of the Survey of Business Owners conducted by the U.S. Census Bureau
beginning in 2007 reveals some interesting similarities and differences between male and female
entrepreneurs in micro businesses. The sample of micro businesses consisting of approximately
181,000 entrepreneurs who are sole owners of a business providing them with their primary
source of income without employing other persons shows female owners tend to be younger and
better educated, while males are more likely to be veterans and immigrants. Although a nearly
equal proportion of males and females are minorities, a greater proportion of males are Hispanic.
Female-owned micro businesses tend to be smaller than male-owned micro businesses, and
female owners tend to work fewer hours per week than males, with over half of the males
working 41 or more hours per week. One of the top three business sectors in which both females
and males owned a micro business was the Professional, Scientific, & Technical Services sector.
Generally, more home-based businesses are owned by females; however, the longer the business
has been in existence, the less likely it is to be a home-based business for both female and male
owners.

ASBE 40TH Annual Conference
97
Memphis, TN, September 24-26, 2014
Creativity and Entrepreneurship:
A Review of Selected Literature and Propositions
Elizabeth Stammerjohan, University of Louisiana at Monroe
Thomas DeNardin, University of Louisiana at Monroe
William W. Stammerjohan, Louisiana Tech University
Abstract
Although some authors feel the terms creativity and entrepreneurship may be used
interchangeably, Amabile (1996) argues that it is the implementation of creative thoughts that
embodies entrepreneurship. Much early creativity literature and entrepreneurship literature
focused either on the personality traits that are associated with these concepts or on the activities
that the concepts encompass.
Despite early studies that did not find as much relationship between creativity and
entrepreneurship and performance, later studies including some sort of mediating (preferably
behavioral) variable have begun to support this relationship (e.g. Brantnicka and Bratnicki 2013;
Weinzimmer, Michel, and Franczak 2011). Other studies have sought to analyze the
contributions of dimensions of creativity on entrepreneurial activities or performance (e.g.
Gielnik, Frese, Graf, and Kampshulte, in press).
One of the most researched aspects of entrepreneurship is one which may have the closest
relationship to creativity, opportunity recognition. Some have modeled opportunity recognition
as an inherently creative process (Hills, Schrader & Lumpkin 1999; Lumpkin, et al 2004). A four
I model, intuiting, interpreting, integrating, institutionalizing, of organizational learning has the
advantage of connecting individual learning to organizational learning (Crossan Lane and White
1999). This model also suggests that intuiting is preconscious.

ASBE 40TH Annual Conference
98
Memphis, TN, September 24-26, 2014
Recent speculations by F. T. Hong (2013) provide a fascinating direction to pursue in
opportunity recognition research. Hong suggests that “recognition” is the clue, the key word, to
explain why these creative “insights” seem to happen so unpredictably. Recognition is at least in
part perception, and perception is precognitive. Something perceived can be responded to
emotionally, before being cognitively interpreted. If opportunity recognition is in part
precognitive, then perhaps training that stimulates perception should assist this form of
entrepreneurial creativity. Perhaps visualization is a way to stimulate perceptive areas of the
brain and lead to greater entrepreneurial creativity and opportunity recognition.

ASBE 40TH Annual Conference
99
Memphis, TN, September 24-26, 2014
References
Amabile, Teresa M. (1996). Creativity and Innovation in Organizations. Publication #9-396-239.
Harvard Business School Press: Research note prepared for MBA class:
Entrepreneurship, Creativity, and Organization.
Bratnicka, Katarzyna and Bratnicki, Mariusz (2013), “Linking two dimensions of organizational
creativity to firm performance: the mediating role of corporate entrepreneurship and the
moderating role of environment,” Advances in Business-Related Scientific Research
Journal 4, (2), 153-163.
Crossan, M., H. W. Lane, and R. E. White (1999). “An Organizational learning framework: from
Intuition to Institution,” Academy of Management Review 24 (3), 522-537.
Gielnik, M M., Frese, M., Graf, J. M., & Kampschulte, A. (in press). Creativity in the
opportunity identification process and the moderating effect of diversity of information.
Journal of Business Venturing.
Hills, G. E., Shrader, R. C., & Lumpkin, G. T. (1999). Opportunity recognition as a creative
process. Frontiers of entrepreneurship research, 19(19), 216-227.
Hong, F. T. (2013). “The role of pattern recognition in creative problem solving: A case study in
search of new mathematics for biology,” Profress in Biophysics and Molecular Biology
113, 181-215.
Lumpkin, G. T., Hills, G., and Schrader, R. (2004). Opportunity Recognition. In H.P. Welsch
(ed) Entrepreneurship: The way Ahead. New York: Routledge.

ASBE 40TH Annual Conference
100
Memphis, TN, September 24-26, 2014
Exploring the Red Queen Effect on Vietnamese Small Businesses and
Innovation Post-Hurricane Katrina: A Qualitative Study
Joanne M. Tran, Louisiana Tech University
Abstract
Previous studies have focused on small businesses’ response to and recover from
disasters. However, what has not been realized is whether the impact of a crisis on small
businesses influences its survival and innovativeness. From a Red Queen perspective, the
purpose of this research is to take a qualitative approach exploring Vietnamese small businesses
in response to the crisis caused by Hurricane Katrina. Three a priori themes, derived from
previous studies, are supported. These are 1) limited financial resources, 2) ability to move
rapidly, and 3) networking relationships. Utilizing a phenomenological approach, two emergent
themes are also recognized: 1) major losses and 2) innovation. Thus, the present study extends
the small business, strategy, and crisis management literature by exploring the responses of these
small business owners and its red queen effect and innovation from a cultural perspective.
Contributions and future research are discussed.
Keywords: Red Queen Effect, Innovation, Small Business, Strategy, Vietnamese

ASBE 40TH Annual Conference
101
Memphis, TN, September 24-26, 2014
“It takes all the running you can do, to keep in the same place,” - the Red Queen in Lewis
Carroll’s (1871) Through the Looking Glass.
Introduction
On August 29, 2005, Hurricane Katrina devastated the Gulf Coast of the United States.
Hurricane Katrina, considered as one of the most catastrophic natural disasters in American
history, was responsible for over 231 deaths and $100 billion in damages in Mississippi alone
(Moss, Ryan, & Moss, 2008). According to Runyan (2006), much of the attention has been on
New Orleans, LA due to the flooding devastation and inadequacy of federal and state responses.
However, there are many communities along the Mississippi Gulf Coast, which were completely
destroyed by Hurricane Katrina ranging from almost complete obliteration, (i.e., Biloxi,
Waveland and Bay St. Louis, MS), to businesses losing inventory and equipment (i.e.,
Pascagoula, MS) from the storm’s 34’ surges (Runyan, 2006). As a result, business owners
across the coast had to innovate in order to face the barriers in getting their businesses back
following the disaster (Runyan, 2006). Businesses on the Mississippi Gulf Coast had to respond
quickly to return to pre-Katrina status “trying to differentiate themselves from their competition”
(Stahler, 2009, para. 1). The problem is competitors make the same move at the same time
hence “[…] you moved forward but your competitor also moved forward. If you do not move
you fall behind” (para.1).
Yet, despite the extensive attention upon the Mississippi Gulf Coast as a powerful vessel
for examining these issues, one particular group of people has remained comparatively
overlooked: the Vietnamese community. According to Duong (2006), at least 45,663 Asian
Americans were impacted along the Gulf Coast pathways of Hurricanes Katrina and Rita.
ASBE 40TH Annual Conference
102
Memphis, TN, September 24-26, 2014
Specifically, the storm displaced an estimated 33,000 Vietnamese residents, forcing them into
neighboring Texas, Florida, and the northern regions of Louisiana, Mississippi, and Alabama.
Nearly 15,000 Vietnamese residents evacuated into the city of Houston, TX alone (Nguyen &
Nguyen, 2007). The National Council of Asian Pacific Americans report (2006) also note that
there were additional language and economic barriers that further increased the confusion of
evacuation and recovery for the Vietnamese.
From a Red Queen perspective, the purpose of this research is to explore Vietnamese
small businesses in response to the crisis caused by Hurricane Katrina through a qualitative
study. Ten Vietnamese small businesses in the Mississippi Gulf Coast are examined. In
addition, a large coastal casino employing a significant amount of Vietnamese is explored.
Three a priori themes, derived from previous studies, are supported. These are 1) limited
financial resources, 2) ability to move rapidly, and 3) networking relationships. Furthermore,
utilizing a phenomenological approach, two emergent themes are also recognized. These are 1)
major losses and 2) innovation. The present study extends the small business, strategy, and crisis
management literature by addressing the responses of these small business owners and its Red
Queen effect and innovation from a cultural perspective. In the following sections, the paper
reviews the small business, strategy and crisis management, and Red Queen effect literature.
Then the study describes a qualitative study performed from a phenomenological approach. A
priori and emergent themes are discussed as well as contributions and future research.
Literature Review
Small Business & Strategy and Crisis Management

ASBE 40TH Annual Conference
103
Memphis, TN, September 24-26, 2014
According to the Small Business Administration (SBA) (2014), a small business is
defined as one that is independently owned and operated, but is not dominant in its field of
operation. Small businesses have several characteristics that set them apart from larger
businesses such as having revenue considerably less than large corporations, and employing
fewer than 100 workers. In 2013, there were more than 28.1 million small businesses in the
U.S., making up 99.7% of all employers nationally (Small Business Administration, 2014).
Cater and Chadwick (2008) argue that small businesses are important contributors of growth and
innovation to the U.S. economy. Small businesses employ about half of the U.S. private sector
workforce, create about 75% of all new jobs in the U.S., and provide 67% of all employees with
their first jobs and work experience (Small Business Administration, 2014). In addition,
Mintzberg (1980) suggests that a small company adopts a simple structure strategy. Typically,
small firms have power centralized in top management and consist of a top manager and a few
workers in the operative core. There is no technostructure, the support staff is small, and
workers perform overlapping tasks. As such, the goal for simple structured companies is to
emphasize innovation and long-term survival (Lunenburg, 2012).
The traditional strategy paradigm has been Porter’s (1979) five forces model, which
argues that the increase in competition leads to profit potential for individual firms (Lunenburg,
2012). Mintzberg and Waters (1985) define strategy as “a pattern in a stream of decisions” (p.
257) and that strategy falls in between two ends of a continuum from deliberate to emergent
strategies. Deliberate strategy has precise intentions and no external force to interfere the firm.
On the other hand, emergent strategy must have order in absence of intention (1985). While
Mintzberg and Waters (1985) propose that strategy formulation walks on one foot of deliberate

ASBE 40TH Annual Conference
104
Memphis, TN, September 24-26, 2014
and the other foot emergent, Mintzberg (1990) views strategy in entrepreneurial or small firms as
more emergent than deliberate.
According to Cater and Chadwick (2008), a crisis is defined as having high consequence,
low probability, and high impact and uncertainty, which requires quick decision-making. Crisis
management then comprises the deeds of identifying and assessing issues, and consequently
preventing, preparing for, and/or responding to a significant event (Darling, Hannu, & Raimo,
1996; Runyan, 2006). Runyan (2006) argues that the planning process appears to have crucial
effects to crisis management; however, many small businesses do not have a formal planning
process in place for a crisis. As such, Runyan (2006) maintains that those who plan are likely to
be more successful than those who do not. Carland and Carland (2003) argue that strategic
planning is inconsistent in entrepreneurial firms, as companies often do not produce formal
business plans, which allocate resource and constrain future activities. Rather, entrepreneurial
planning focuses more on developing a vision which can drive the firm, and constantly tuning or
evolving that vision (Carland & Carland, 2003). However, small firms that do carry out at least
some form of planning will likely outperform those who do not plan at all (Runyan, 2006). As
such, McGee, Love, and Rubach (1999) found that small firms may successfully compete in
turbulent and competitive environments even when facing radical environmental changes.
Red Queen Effect & Innovation
Since van Valen’s (1973) introduction of the Red Queen effect of how entities interact
and co-evolve with one another in evolution and ecology, the Red Queen effect has been applied
to many context including biology (Baumol, 2004), military (Dawkins & Krebs, 1979), and
business (Barnett & Sorenson, 2002; Derfus, Maggitti, Grimm, & Smith, 2008; Voelpel, Leibold,
Tekie, & Von Krogh, 2004). The Red Queen effect is based on Lewis Carroll’s (1871) Through

ASBE 40TH Annual Conference
105
Memphis, TN, September 24-26, 2014
the Looking Glass where Alice is running as fast as she can, but she is not getting anywhere.
The Red Queen responds, “Here, you see, it takes all the running you can do, to keep in the same
place. If you want to get somewhere else, you must run at least twice as fast as that!” (Carroll,
1960, p. 345).
Baumol (2004) states that the Red Queen effect can be portrayed as an arms race for
competing businesses and that innovation has become a powerful tool for competitive advantage.
Consistent with Hauser, Tellis, and Griffin (2006), innovation deals with the process of bringing
new products and services to market. Businesses are forced to run as fast as they can just to keep
the same place because their competitors are following suit. Businesses that can come up with a
better process than their competitors will therefore gain a competitive advantage. In certain
sectors, success in achieving better products or improved processes has become a matter of life
and death (Baumol, 2004). As such, no business can afford to fall behind its competitors in this
arms race of innovation (2004). This arms race is more paramount when a crisis occurs for small
businesses. While Barnett and McKendrick (2004) did not find support that smaller firms were
more responsive to the Red Queen effect, Derfus et al. (2008) found that smaller businesses
could be more effective against their competitors by being aggressive with their actions.
Vietnamese & Hurricane Katrina
In Mississippi, the news reports about Vietnamese community recovery efforts on the
Gulf Coast were stagnant. The 2000 U.S. census reported a population of 5,387 Vietnamese
residents in the entire state with the most concentrated communities located in the southern
Mississippi areas of Biloxi, D’Iberville, and Gulfport (U.S. Census Bureau, 2010). Before the
wake of Hurricane Katrina, Biloxi was home to one of the largest Vietnamese communities on
the Mississippi Gulf Coast due to the familiar industry job of shrimping and fishing. In addition,

ASBE 40TH Annual Conference
106
Memphis, TN, September 24-26, 2014
the majority of Vietnamese are small business owners. Throughout the United States and
particularly the Gulf Coast, many Vietnamese have business in supermarkets, restaurants,
bakeries, salons, auto repair, and shrimping and fishing (U.S. Census Bureau, 2010).
By 2005, nine water-bounded casinos were built along the Mississippi Gulf Coast
transitioning the industry from a shrimping and fishing to a casino business. As such, many
Vietnamese in the community have adopted their casino neighbors as a reliable source of
employment and income (Dao, 2009). Unfortunately, for many Vietnamese in the Gulf Coast,
Hurricane Katrina was at least the second time they experience a similar crisis of losing
everything they had. The first time came after the fall of Saigon, which ended the Vietnam War
in the 1975, and thousands of Vietnamese fled the country for freedom.
Qualitative Study
Informants
The majority of the informants came through people who had met the researcher through
community work. Colleagues and community leaders also led the researcher to other small
business owners willing to share their experiences. The present study includes personal
interviews conducted with ten Vietnamese small business owners from two communities in the
Mississippi Gulf Coast over the course of two weeks in June 2009. In addition, a major coastal
casino that employed many Vietnamese residents is also examined. While the casino is not a
small business, obtaining the lived experience from a firm that employs a large portion of the
Vietnamese population on the Gulf Coast adds a unique cultural perspective to the study. As
such, the current study provides a distinctive opportunity to gather small business data in the
Vietnamese community on the Mississippi Gulf Coast where Hurricane Katrina left most of the

ASBE 40TH Annual Conference
107
Memphis, TN, September 24-26, 2014
destruction in that area. Informants were assured of confidentiality, and all names and business’s
names have been changed.
Method
A phenomenological approach was performed to represent the lived experience of the
small business owners. The lack of research in this area led to a qualitative research design in
order to gain a better understanding of the phenomena of interest (Silverman, 1993; Summers,
2001). In applying this phenomenological approach, the researcher seeks to obtain testimony
(McCracken, 1988) from small business owners that are structured from their subjective
perspective (Hirschman, 1992; Thompson, Locander, & Pollio, 1989). The interview began with
the question, “What happened after Hurricane Katrina?”.
In addition to these interviews, a questionnaire was conducted after the interview in order
to measure small business owners’ attitudes and behaviors toward innovation at the present time
of the interview as well as their perspective five and ten years ago from the time of the interview
(e.g., “What is the intensity of competition in your industry?” “What do you see as the pace of
innovation in your industry?” “Please rate the importance of the following types of technological
innovation.”). No incentive was offered to the informants for their participation and the
interviews lasted from 45 minutes to two hours at the location of the small business owner or
casino. The interviews and questionnaire were conducted in English. For those who preferred to
speak and answer in their native language, the interview and questionnaire were conducted in
Vietnamese and back translated into English by an independent translator. Table 1 lists the
profile of the informants.
-Insert Table 1 here-

ASBE 40TH Annual Conference
108
Memphis, TN, September 24-26, 2014
From the data analysis, three a priori themes, derived from previous studies, are
supported. A priori themes are those that were expected to be present in the interview based
either on the extant literature (e.g., Cater & Chadwick, 2008) or through personal experience and
insider knowledge (e.g. Hirschman, 1992). These a priori themes are 1) limited financial
resources, 2) ability to move rapidly, and 3) networking relationships. In addition, two emergent
themes are also recognized. These are 1) major losses and 2) innovation.
A Priori Themes
According to Cater and Chadwick (2008), they found four themes that inhibit the
response of small businesses to a crisis and six themes that enhance a small business’s response
to a disaster. The inhibiting themes are: 1) limited financial resources, 2) communication
difficulties, 3) supply logistic problems, and 4) government bureaucracy. The enhancing themes
are: 1) sense of proximity, 2) the ability to move rapidly, 3) concern for employee welfare, 4)
versatility, 5) networking, and 6) concern for the community (Cater & Chadwick, 2008). These
themes are consistent with other related studies including Moss et al. (2008) and Runyan (2006).
While the results of the present study touch on every single theme found in Cater and Chadwick
(2008), the three a priori themes described below were expected to be present in the Vietnamese
community.
Limited Financial Resources
Resource-based view theory argues that firms’ specific resources rather than market
characteristics are the foundation to competitive advantage and firm performance (McGee et al.,
1999; Morgan, 2012). In addition, Walker and Ruekert (1987) found that small businesses’
performance appears to be positively correlated with distinctive competencies or what a business

ASBE 40TH Annual Conference
109
Memphis, TN, September 24-26, 2014
does particularly well compared to its competitors within a similar industry. However, many
small businesses are limited in financial resources. As stated by Cater and Chadwick (2008),
because of their size and resources, small businesses simply do not have the financial means to
survive when interruptions such as Katrina hinder their business activities for prolonged periods.
Tri (Tri’s Food Mart) – “We had no insurance to cover our damages from the storm. Therefore,
we had to rebuild everything out of our own pocket which was why it took us so long to rebuild.”
Mai (ABC Market) – “After Katrina, it was a hard time for my business. I filed for insurance
claim and because they ruled that it was flood damaged and not wind damaged, I was not able to
get my insurance to cover it. Therefore, I had to apply for a SBA loan and my local bank for a
loan to get my business off the ground. I lost about $400-$500k worth of business inventory,
products and equipment. Also, I lost all the contracts I had with the casinos (those casinos that
didn't come back after the storm). Business has not been the same since. The storm was a shock
and devastation to our business. It affected me emotionally, physically, and financially.”
Chau (J’s Storage Palace) – “It took us four months to re-open. We worked all day and night to
fix the place and cleaning up. We couldn't find our customers to claim what was left of their
property. Those that did lied about what they had and didn't have. We had a lot of problems with
the construction company that was supposed to clean our area up. It became so bad that we had
to file a complaint with the SBA, but they lost the letter twice. It was a nightmare! We did offer
our storage area for government use for a bit. The difficult part about surviving was that we had
several businesses and had to worry about the businesses in of importance level. Looking back,
we wished we could have a better security system for our storage.”
Ability to Move Rapidly

ASBE 40TH Annual Conference
110
Memphis, TN, September 24-26, 2014
A company’s operational excellence and competitive advantage may be attributed to their
ability to move quickly from a disaster (Cater & Chadwick, 2008). For the small business owners
on the Gulf Coast, many responded quickly once the storm passed and were able to get to their
property. Cater and Chadwick (2008) argue that “finding innovative means of accomplishing
tasks enhanced the effectiveness of a [company’s] response,” (p. 68). This is consistent with the
literature of quick responses to crises suggesting that speed and flexibility are important factors
of small firms’ resources and capabilities. As a result, smaller firms may be in a better position
to respond to natural disasters such as Hurricane Katrina (Cater & Chadwick, 2008).
According to Runyan (2006), some business owners’ responses made the difference between
being closed for an extended time period to being one of few open businesses. This ability is a
competitive advantage for those businesses that were able to open soon after the hurricane
because they were experiencing large increases in sales.
Business owners who responded quickly and decisively were able to capture large
amounts of the revenues in the months immediately following Katrina. These businesses
included those selling all types of goods and services, but especially home improvements,
building repairs, restaurants and other food service establishments (Runyan, 2006, p. 21).
Thong (TC Gas Station) – “We rebuilt ourselves and tried to open up as quickly as possible. We
were the only gas station that opened in East Biloxi at that time.”
Thu (Thu’s Salon & Spa) – “Business was closed temporarily for about two weeks and service
started again - extremely busy due to many salons closed in the area. We probably couldn't do
anything differently due to the situation.”
Xuan (TUV Casino) – “Thanks to the new management skill of [our general manager], [TUV]
reopened in a record 4 months ahead of other coast casinos.”

ASBE 40TH Annual Conference
111
Memphis, TN, September 24-26, 2014
Networking Relationships
According to Cater and Chadwick (2008), small firms have established strong ties to
local stakeholders, such as financial institutions, government agencies, and suppliers. Although
large businesses also develop ties to its stakeholders, the strong local ties benefit firms in the
disaster (2008).
Lam (Lam’s Seafood & Co.) – “A month after the storm, our family had torn the interior of the
walls of the factory. We did not necessarily have to rebuild our entire factory. Thanks to the
foundation, our building was still firm on the ground. It had taken us one month to repair the
entire shop. Then we had to refurbish supplies for the shop, which had taken another month.
Then after the third month, we made sure that other seafood shops were open because if they
weren't, then we wouldn't have anyone to sell our crabmeat. After getting all assurance from
businesses, we, then, recruited old workers, new workers, and fishermen to retrieve our products
(crabs). The year of Hurricane Katrina was probably one of our most prospering times of
business.”
Tri (Tri’s Food Mart) – “We also organized team of workers to help rebuild the neighborhood
and the church. When the holidays came around, we knew they had nothing to look forward to so
we cooked on Thanksgiving and Christmas and gave the food out to the public for free. We also
gave the volunteers free coffee and water everyday during the recovery. By offering a lending
hand during time of disaster was probably what saved us from the storm because the whole
community, in return, helped us back on our feet.”
Emergent Themes

ASBE 40TH Annual Conference
112
Memphis, TN, September 24-26, 2014
Through the data analysis, two additional themes emerged that provide a better
understanding of Vietnamese small business owners’ response to a crisis. While the present
research did not originate these themes, the researcher hopes that the additional themes extended
them in some manner. Vietnamese small businesses before Hurricane Katrina saw the pace of
innovation moderately higher in their industry than the time of the interview in 2009. As a
whole, small businesses saw the pace of innovation somewhat lower than before the storm. This
view suggests that Vietnamese small businesses saw opportunities in the market after Hurricane
Katrina. In addition, half of the businesses characterize their efforts in innovation have increased
since the storm. These results seem to agree with the literature of the Red Queen effect and
innovation. Businesses are running twice as fast just to stay in the frontlines.
According to Runyan (2006), a crisis often results unexpectedly to an organization. A
common person or business did not expect a storm like Hurricane Katrina could fall into an
unexpectedly category of devastation. As such, Runyan’s (2006) findings reveal a common
response: “[…] the residents and business owners did not expect the type of devastation that
occurred” (p. 17). Nine out of the ten small businesses mentioned that that their business could
have been at risk, but they did not believe something Hurricane Katrina would ever happen to
them. After the storm and access to their property, many informants adopted new
products/services to meet the changing demands and new opportunities after Hurricane Katrina.
As a result, many businesses had to innovate (run twice as fast) in order to stay on top of the
game. Therefore, the two emergent themes are 1) major losses and 2) innovation.
Major Losses
The largest losses occurred by small business owners from the disaster were inventory
and equipment. This loss is also apparent with Vietnamese small business owners. Because

ASBE 40TH Annual Conference
113
Memphis, TN, September 24-26, 2014
business owners had experience these types of storms before, the tendency was to downplay the
worst-case scenario of a disaster. Many owners were immediately concerned with how to get the
business back up and running again while others worried about surviving financially until they
could rebuild (Runyan, 2006).
Vinh (Vinh’s Video Store) – “We lost everything and were closed for a year. During that time, we
volunteered around the community.”
Phuong (Phuong’s Liquor) – “Lost everything; didn't opened up until a year later. Worked twice
as hard just to get back on track. Business turned out the same as before the storm. Slow right
now since the recession.”
For Phuong’s Liquor, their business turned out the same as pre-Hurricane Katrina, neither
better nor worst. This suggests that they may have experienced the Red Queen effect as a
comfort trap.
In situations where the business environment is characterized by discontinuity and
uncertainty, companies may find themselves trapped in a “catch-22” situation of learning ways
that solely protect and improve their current businesses rather than experimenting with new ways
that change the “rules of the game” (Voelpel et al., 2005, p. 39).
Perhaps, the largest losses came from the casinos along the Gulf Coast. According to
Runyan (2006), Mississippi state law, at the time, only allowed casinos to operate on the water.
That is, many casinos were water-bounded along the shoreline. With the impact of the storm’s
surges and wind, several casinos were lifted hundreds of yards off the shore (Runyan, 2006). As
a result, many Vietnamese and other casino employees lost their jobs in addition to their
livelihood. Fortunately, the first casino that reopened its doors provided employment and other
needs to the community.
ASBE 40TH Annual Conference
114
Memphis, TN, September 24-26, 2014
Xuan (TUV Casino) – “[TUV Casino] provided employment to all casino workers and others
regardless of prior affiliations, provided food clothing and shelter for the needy in the
community and began a massive and intense recovery and transformation effort which continues
today.”
Just prior to the storm, a law passed allowing casinos to be built up to 800 feet from
shore. This would allow casinos to purchase land from existing property owners. However, the
storm wiped out nearly all of downtown area leaving residents to sell their property to casino
owners rather than to rebuild (Runyan, 2006). Ultimately, Hurricane Katrina devastated the
Mississippi casino industry losing nearly $489 million in total revenue (Moss et al., 2008).
Innovation
From a business perspective, the Red Queen effect can be seen as an arms race to the
finish line. Derfus et al. (2008) argue that the Red Queen effect is a contest where each
business’s performance depends on matching or exceeding their competitor’s actions. “In these
contests, performance increases gained by one firm as a result of innovative actions tend to lead
to a performance decrease in other firms” (Derfus et al., 2008, p. 61). Each business is forced by
its competitors to participate in a continuous cycle of developments that all firms eventually end
up racing as fast as they can just to keep in the same place (2008). In the case of Hurricane
Katrina, the race was about being the first one to open. For example, Thu from Thu’s Salon &
Spa stated that she competed to be one of the first to come back. As such, those that do response
quickly and innovate reap the benefits. As stated by Hagel (2005), “[…] innovations are
ultimately much more powerful in terms of generating business value because, if done right, they
can generate a compounding effect of their own – they keep on giving […]” (para. 3).

ASBE 40TH Annual Conference
115
Memphis, TN, September 24-26, 2014
Tri (Tri’s Food Mart) – “In the mean time, we turned the store into a soup kitchen providing
meals and water for all volunteers and shelter for them.”
Thong (TC Gas Station) – “Determined to stay open and to provide the needs of the community,
we added a kitchen to our gas station and offered food for workers and volunteers who had no
place to eat or drink. Today, we still have the kitchen area where we sell deli and hot food to our
customers.”
Duyen (XYZ Supermarket) – “We renovated our damaged building and opened back up in 8
months. Business was slow, considering that we were based near the point on the East side of
Biloxi where damage was massive. The majority of the homes situated around my business were
either destroyed or damaged. Therefore, we had to institute other services such as Western
Unions and selling money orders on top of the retail we had just to keep the business afloat.
Finally, after all the hard work, we were able to evolve from a small (3k sq. ft) store into a
business ten times the original size.”
Vinh (Vinh’s Video Store) – “We lost everything. But once we re-opened, we changed our
services from a video store to more travel and international services.”
Xuan (TUV Casino) – “[TUV] is no longer the same property since before Katrina. It serves a
higher socio-economic demographic and has reached into the southeastern region more intensely
than in previous years. With a focus on service and great food, [TUV] has won awards for its
resort and fine dining establishment. Continued physical expansions and improvements provide
guests and associates with a better environment in which to do business. Also, the gaming and
non-gaming amenities have increased in number and quality since Katrina.”
Discussion & Conclusion

ASBE 40TH Annual Conference
116
Memphis, TN, September 24-26, 2014
The current study has utilized a phenomenological approach to understand small business
owners’ response to a crisis with innovation. Ten Vietnamese small businesses are examined to
determine how they respond to an externally induced crisis in the form of Hurricane Katrina. In
addition, the study explores a large casino on the Mississippi Gulf Coast who employed many
Vietnamese residents in the area. The results of this study elaborate on three a priori themes
including 1) limited financial resources, 2) ability to move rapidly, and 3) networking
relationships. Moreover, two emergent themes are found: 1) major losses and 2) innovation.
While findings confirm both the small business and strategy/crisis management literature, none
has combined the two areas from a Red Queen effect and innovation perspective. Scant research
has looked into small businesses and crisis, and even less from a cultural perspective. Yet, as can
been seen with the present study, Vietnamese small business owners face economic hardship like
many other small business owners after Hurricane Katrina. However, half of small business
owners interviewed claim they were more effective against their competitors by bringing new
products and services to their market.
Nevertheless, there are limitations to the study given the scope and number of informants.
Such limitations provide future research opportunities in different communities and crises for
generalizability. Another fruitful area for future research would be to examine the same ten
Vietnamese small businesses in a longitudinal study at the tenth anniversary of Hurricane
Katrina and compare and contrast how they fared from the devastation ten years later. Further
research should also consider how small businesses response to multiple crises and if small
business owners learn from previous crises (e.g., the Deepwater Horizon oil spill in the Gulf
Coast in 2010). In general, perhaps small businesses must innovate in order to stay ahead after a
crisis. After the destruction of Hurricane Katrina, innovation was vital to many businesses in

ASBE 40TH Annual Conference
117
Memphis, TN, September 24-26, 2014
order to recover and rebuild. Businesses had to alter their goals and strategies in order to adapt
and overcome the disaster. Whether it was adding new amenities or turning their business into a
temporarily soup kitchen or a new business sector altogether, Vietnamese small businesses
definitely ran twice as fast to stay in the competition.

ASBE 40TH Annual Conference
118
Memphis, TN, September 24-26, 2014
References
Barnett, W. P. & McKendrick, D. (2004). Why are some organizations more competitive than
others? Evidence from a changing global market. Administrative Science Quarterly, 49:
535-571. doi: 10.2307/4131490.
Barnett, W. P. & Sorenson, O. (2002). The Red Queen in organizational creation and
development. Industrial & Corporate Change, 11(2), 289-325. doi:10.1093/icc/11.2.289.
Baumol, W. (2004). Red-Queen games: arms races, rule of law and market economies. Journal
of Evolutionary Economics, 14(2), 237-247. doi: 10.1007/s00191-004-0207-y.
Carland, J. C., & Carland, J. W. (2003). A model of entrepreneurial planning and its effect on
performance. Journal of Business and Entrepreneurship, 15 (1), 1-20. Retrieved from
http://www1.usfsp.edu/jbe/ASBE.htm.
Carroll, L. (1960). The Annotated Alice: Alice's Adventures in Wonderland and Through the
Looking-Glass. New York, NY: The New American Library.
Cater III, J., & Chadwick, K. (2008). Response to Hurricane Katrina: A small business approach.
Academy of Strategic Management Journal, 7, 55-75. Retrieved from
http://ezproxy.mc.edu:2048/login?url=http://search.ebscohost.com/login.aspx?direct=true
&db=bth&AN=35637283&site=ehost-live.
Dao, V. T. (2009). Reflections on the water: A qualitative study of post-disaster Vietnamese
community building in Louisiana, Mississippi and Alabama. Unpublished doctoral
dissertation, Tulane University, New Orleans, LA.
Darling, J., Hannu, O. & Raimo, N. (1996). Crisis management in international business: A case
situation in decision making concerning trade with Russia. The Finnish Journal of
Business Economics, 4: 669-683. Retrieved from http://lta.hse.fi/.
Dawkins, R. & Krebs, J. R. (1979). Arms races between and within species. Proceedings of the
Royal Society of London, B205: 489-511. Retrieved from
http://rspb.royalsocietypublishing.org/.
Derfus, P., Maggitti, P., Grimm, C., & Smith, K. (2008). The Red Queen effect: Competitive
actions and firm performance. Academy of Management Journal, 51 (1), 61-80.
doi:10.5465/AMJ.2008.30708624.
Duong, T. (2006). Hurricane Katrina: Models for effective emergency response in the Asian
American community. Asian American Justice Center. Retrieved from http://
http://www.advancingjustice-aajc.org/news-media/publications/emergency-preparedness-
publications-and-materials.

ASBE 40TH Annual Conference
119
Memphis, TN, September 24-26, 2014
Hagel, J. (2005). Product innovation and the Red Queen effect. Edge Perspectives website.
Retrieved from
http://edgeperspectives.typepad.com/edge_perspectives/2005/09/product_innovat.html.
Hauser, J., Tellis, G. J., & Griffin, A. (2006). Research on innovation: A review and agenda for
Marketing Science. Marketing Science, 25(6), 687-717. doi:10.1287/mksc.1050.0144.
Hirschman, E. C. (1992). The consciousness of addiction: Toward a general theory of
compulsive consumption. Journal of Consumer Research, 19 (2), 155-179. Retrieved
from http://www.ejcr.org/.
Lunenburg, F. C. (2012). Organizational structure: Mintzberg’s framework. International
Journal of Scholarly, Academic, Intellectual Diversity, 14 (1), 1-8.
McCracken, G. (Ed.). (1988). The long interview (Vol. 13). Newbury Park, CA: Sage.
McGee, J. E., Love, L. G., & Rubach, M. J. (1999). Sources of competitive advantage for small
independent retailers: lessons from the neighborhood drugstore. Proceedings of
Association of Small Business & Entrepreneurship, SWFAD, Houston, TX, 119-29.
Retrieved from http://www1.usfsp.edu/jbe/ASBE.htm.
Mintzberg, H. (1980). Structure in 5's: A synthesis of the research on organization design.
Management Science, 26 (3), 322-341. doi:10.1287/mnsc.26.3.322.
Mintzberg, H. (1990). Strategy formation: Schools of thought. In J. W. Fredrickson (Ed.),
Perspectives on strategic management (pp. 105-235). New York: Harper.
Mintzberg, H., & Waters, J. A. (1985). Of strategies, deliberate and emergent. Strategic
Management Journal, 6(3), 257-272. Retrieved from http://smj.strategicmanagement.net/.
Morgan, N. A. (2012), Marketing and business performance,” Journal of the Academy of
Marketing Science, 40 (1), 102-119. doi:10.1007/s11747-011-0279-9.
Moss, S., Ryan, C., & Moss, J. (2008). The impact of Hurricane Katrina on Mississippi’s
industry. Academy of Strategic Management Journal 7, 17-30. Retrieved from
http://ezproxy.mc.edu:2048/login?url=http://search.ebscohost.com/login.aspx?direct=true
&db=bth&AN=35637279&site=ehost-live.
The National Council of Asian Pacific Americans. (2006). Current housing unit damage
estimates Hurricanes Katrina, Rita, and Wilma. U.S. Department of Housing and Urban
Development’s Office of Policy Development and Research. February 12: 1-45. Retrieved
from http://www.huduser.org/publications/pdf/GulfCoast_HsngDmgEst.pdf.

ASBE 40TH Annual Conference
120
Memphis, TN, September 24-26, 2014
Nguyen, T. and Nguyen, J. (2007). Boat people SOS: From rescue at sea to Katrina relief. Public
Manager. 36 (1): 18-22. Retrieved from
http://www.aspaonline.org/global/V36N1_BoatPeopleSOS_Nguyen.pdf.
Runyan, R. (2006). Small business in the face of crisis: Identifying barriers to recovery from a
natural disaster. Journal of Contingencies & Crisis Management, 14 (1), 12-26.
doi:10.1111/j.1468-5973.2006.00477.x.
Silverman, D. (1993). Interpreting Qualitative Data: Methods for Analyzing Talk, Text, and
Interaction. London: Sage.
Stahler, P. (2009). Business model innovation and the Red Queen effect. Business Model
Innovation website. Retrieved from http://blog.business-model-
innovation.com/2009/02/business-model-innovation-and-the-red-queen-effect/.
Summers, J. O. (2001). Guidelines for conducting research and publishing in marketing: from
conceptualization through the review process. Journal of the Academy of Marketing
Science, 29 (4), 405-415. doi:10.1177/03079450094243.
Thompson, C. J., Locander, W. B., & Pollio, H. R. (1989). Putting consumer experience back
into consumer research: The philosophy and method of existential-phenomenology.
Journal of Consumer Research, 16 (2), 133-146. Retrieved from http://www.ejcr.org/.
United States Census Bureau. (2010). U.S. Census website. Retrieved from
http://www.census.gov/.
The U.S. Small Business Administration. (2014). SBA website. Retrieved from
http://www.sba.gov/.
van Valen, L. (1973). A new evolutionary law. Evolutionary theory, 1, 1-30. Retrieved from
http://leighvanvalen.com/evolutionary-theory/.
Voelpel, S., Leibold, M., Tekie, E., & Von Krogh, G. (2005). Escaping the Red Queen effect in
competitive strategy: Sense-testing business models. European Management Journal, 23
(1), 37-49. doi:10.1016/j.emj.2004.12.008.
Walker Jr., O. C., & Ruekert, R. W. (1987). Marketing's role in the implementation of business
strategies: A critical review and conceptual framework. Journal of Marketing, 51 (3), 15-
33. Retrieved from
https://www.ama.org/publications/JournalOfMarketing/Pages/Current-Issue.aspx.

ASBE 40TH Annual Conference
121
Memphis, TN, September 24-26, 2014
Table 1 – Profile of Informants
Name Business Name
Business Sector
Pre-Katrina
Business Sector
Post-Katrina
Age
Range
Range of
Employees
Length Closure
Post-Katrina Note*
Mai ABC Market Supermarket Same 40-49 1-9 3 Months or More
Vinh Vinh's Video Store Video Rental Travel Agency 30-39 1-9 3 Months or More* 1 year
Chau J's Storage Palace Storage Same 50-59 1-9 3 Months or More*
4
months
Phuong Phuong's Liquor Liquor Store Same 40-49 1-9 3 Months or More* 1 year
Thong TC Gas Station Gas Station
Gas Station and
Deli
Under
30 1-9
Between 1-3
Months
Duyen XYZ Supermarket Supermarket
Supermarket
Expansion and
Western Union 30-39 10-19 3 Months or More*
8
months
Tri Tri's Foodmart Convenience Store
Temporary Soup
Kitchen 30-39 1-9
Between 1-3
Months
Thu Thu's Salon & Spa Hair Salon Same 30-39 1-9 8-14 Days
Kim Kim's Bakery Bakery Same 30-39 1-9 3 Months or More
Lam
Lam's Seafood &
Co.
Wholesale
Seafood Same 50-59 1-9 3 Months or More
4
months
Xuan TUV Casino Casino Same 40-49 1000+ 3 Months or More*
4
months

ASBE 40TH Annual Conference
122
Memphis, TN, September 24-26, 2014
Understanding Complaining on the Web: A Response Framework for Small
Business
Christopher L. Martin, Centenary College of Louisiana
Abstract
Small businesses have quickly learned how to optimize social media to ensure
engagement and to effectively promote their products and services. However, negative
comments posted to the web can spread just as fast as a company’s promotional viral marketing
campaign and responding to these comments has been more problematic for small businesses.
Services, products or people that do not meet consumer expectations can move from being a
simple misstep to a reputational risk with devastating effects - if not addressed quickly and
correctly. Few small businesses understand how to effectively respond to negative and
potentially damaging posts or how to prevent them from occurring in the first place. A
conceptual framework is presented that outlines factors driving the anger and pushing consumers
to loudly and publically gripe on the Internet to the point of damaging small businesses
reputation and future viability. In addition to conducting content analyses of the themes
underlying negative social media, the authors of such attacks and complaints were interviewed to
further understand their motivation. Finally a sample of small business owners was surveyed to
determine how they specifically have dealt with such attacks on their products, services and
reputation.
Keywords: social media, complaints, marketing, reputation management, anger

ASBE 40TH Annual Conference
123
Memphis, TN, September 24-26, 2014
Workplace Safety: What Small Business Owners Need to Know
Kitty Campbell, Southeastern Oklahoma State University
Wayne Jones, Southeastern Oklahoma State University
Nick Nichols, Southeastern Oklahoma State University
Kelli Taylor, Southeastern Oklahoma State University
Abstract
One of the biggest challenges small business owners face is ensuring a safe work
environment for employees. One common, and often costly misconception, is that small
businesses that employ fewer than 10 employees are exempt from the Occupational Safety and
Health Administration’s (OSHA) laws. While it is true that a majority of the laws do not apply,
there are still several that do. It is critical that small businesses remain compliant with these laws.
The scope of compliance covers everything from recordkeeping to the building the company
itself occupies. The benefits of a safety program reach far and wide and can greatly affect the
bottom line. It is important to remember that no business is too small to have a safety program.

ASBE 40TH Annual Conference
124
Memphis, TN, September 24-26, 2014
One common, and often costly misconception, is that small businesses that employ fewer
than 10 employees are exempt from the Occupational Safety and Health Administration’s
(OSHA) laws. While it is true that a majority of the laws do not apply, there are still several that
do. Should a small business owner be subjected to an inspection and be found non-compliant, the
fines levied against the business owner could run into the tens of thousands of dollars. The scope
of compliance covers everything from recordkeeping to the building the company itself occupies.
OSHA was created in December of 1970. With the creation of this administration, came
the OSH Act. This act has the lofty goal of “assuring that no employee will suffer material
impairment of health or functional capacity” (Lopez, Siepman, Heenan, Davis, & Miller, 2008).
The OSH Act covers “Any employer employing one or more employees” (“OSHA
Recordkeeping Handbook,” n.d.). Employers who have fewer than 10 employees are only
partially exempt from the OSH Act. They are still subject to OSHA investigations due to
accidents and worker complaints. Small businesses are also expected to maintain a Hazard
Communication (HAZ-COM) program, occupy a space that is compliant with OSHA standards,
maintain records of OSHA recordable incidents, post the OSHA 300 Logs during a specified
time frame, and operate with a mindset of the prevention of injuries and illnesses.
Buying chemicals in bulk can save a company a lot of money, but the obligation to
maintain an effective program for the storage, transport, and disposal of these chemicals must be
met. OSHA has many gray areas, but the website has a section called Letters of Interpretation
(LOI). Many businesses face the same issues and there are hundreds of requests submitted to
OSHA for a more detailed explanation of specific regulations. For example, exactly how much
chemical does it take to qualify for a HAZ-COM program? According to the OSHA.gov website,

ASBE 40TH Annual Conference
125
Memphis, TN, September 24-26, 2014
any chemical use that exceeds what a “reasonable person” would use in a household should have
a Safety Data Sheet (SDS) available to employees. The SDS is a document that warns users of
the specific dangers of a product and gives guidance on safe handling, storage and disposal.
OSHA recommends that if an employer is unsure about the use, then to err on the side of caution
and obtain the SDS (Clark, 1991). This can be done by contacting the chemical manufacturing
company and requesting the SDS for the chemical in question. Sometimes the SDS can be
obtained via the company’s website.
Small business owners should obtain hard copies of the SDS sheets and place them in a
designated SDS binder. The binder should be conspicuous, such as a bright color with stripes or
the letters “SDS” on the spine. All employees must know where the binder containing the SDS
is located and they must have quick access to it at all times. The SDS should never be locked
inside a cabinet during normal hours of operation. It is advisable to place a table of contents in
the front of the binder with corresponding tabs to enable ease of use. The most common scenario
for the need of an SDS is when an exposure occurs. If an employee does not have to shuffle
through each sheet to find the one they are looking for, the incident can be handled much more
efficiently. An excellent practice, though not required, is to post the CHEMTREC and Poison
Control Center hotlines inside the front cover of the SDS. Both hotlines are available to the
public free of charge. They will answer any questions about chemicals and supply helpful
information during an emergency.
All employees must be trained on the chemicals requiring an SDS. The training material
can be obtained through multiple online resources. A professional safety consultant can also
provide the necessary training. There are several online resources where training materials can be

ASBE 40TH Annual Conference
126
Memphis, TN, September 24-26, 2014
obtained. The National Fire Protection Association offers webinars, training DVDs, and
certification courses in topics ranging from electrical safety to basic outdoor safety (“Training,”
n.d.). OSHA also loans training materials and DVDs to help offset the costs of training (“Safety
and Health Training,” n.d.). There are a wide variety of publications such as safety bulletins and
posters that can be printed off of their website free of charge.
Another potentially catastrophic OSHA pitfall for small business owners is the
occupancy of older buildings. Many towns have offered small business owners incentives for
occupying their historic buildings in an effort to boost their main street or downtown programs.
There are also several renovation credits available in the form of historic tax credits, façade
easements, and tax increment financing (Matthews, 2004). While the incentives can be tempting,
the small business owner should consider several factors before signing any paperwork. The type
of lease needs to be determined. Most commercial leases are full lease, but not all. A full lease
means that the owner of the building is responsible for maintenance and upgrades needed to meet
with the city’s building codes or regulations.
Before signing a lease, the small business owner should determine if the building owner
or landlord is trustworthy and respectful. It would be wise to talk to other business owners in the
area to determine if the landlord is known for being good to their tenants. If it is found that the
landlord is negligent in making the required upgrades or does not complete them in a timely
manner, this can spell disaster for the small business owner. A certificate of occupancy must be
issued prior to the business opening. Without the abatement of any found code violations, the
certificate will not be issued. Should this happen, the business owner is left footing the bill for
the lease each month, without being able to open the doors for customers. The responsibilities for

ASBE 40TH Annual Conference
127
Memphis, TN, September 24-26, 2014
abatement of any alleged violations lie solely in the hands of the landlord and they may not be in
a hurry to spend the money to fix the issues.
Another common issue with full lease agreements is that the landlord repeatedly takes the
cheapest way out by insufficiently rectifying the problem instead of implementing a permanent
and effective solution. One downtown business was forced to operate without air conditioning
during the summer, for nearly two weeks, until the landlord eventually addressed the problem
(C. Norcutt, personal communication, January 12, 2014). Even then, the problem was patched
and the air conditioning would not cool the building adequately. This deterred customers from
spending any time inside the establishment and within a few months, the company went out of
business.
If a landlord is willing to work with its tenants and provide maintenance in a timely
manner, the full lease agreement is the optimal way to go. If the lease agreement leaves the
maintenance expenses to the tenant, extreme caution must be used. If the alleged code violation
is found to be electrical in nature, the necessary repair(s) can easily exceed a small business’s
operational budget. A full inspection, along with thorough understanding of the terms of the
lease prior to signing the lease agreement is crucial. This step can make or break a business. In
2014, a group of doctors in a busy metropolitan area recently encountered this sort of nightmare
(C. Norcutt, personal communication, January 12, 2014). They leased a large office space inside
a building containing multiple offices. The doctors spent a substantial amount of money on
renovations and upgrades to the space, only to be met with a denial for a certificate of occupancy
from one of the city’s fire marshals. The fire suppression system was not up to code. This issue

ASBE 40TH Annual Conference
128
Memphis, TN, September 24-26, 2014
would cost approximately thirty thousand dollars to abate. The doctors agreed to the cost and
hired the contracting company to abate the hazard.
The second issue was the building’s fire alarm system. Federal law requires pull boxes to
be located in all commercial buildings and that they electronically notify a twenty-four hour
monitoring company when activated. The pull boxes located in this particular building did sound
an alarm when activated, but were in no way remotely monitored. All of the current businesses
located inside this building were grandfathered in, but since the doctors’ office was considered
“new construction,” they were not allowed to occupy it until the issue had been addressed.
Heated discussions and debates followed as the contractors attempted to resolve the issues with
the fire marshal’s office. They offered to hard wire in a separate alarm system for the office that
would notify a monitoring company, but the offer was turned down as the law requires the entire
building to be up to code for new construction to inhabit it. With over a quarter of a million
dollars invested and several thousand more to go, plus no place to see their patients, the doctors
found themselves trapped in a costly and infuriating holding pattern until the new fire alarm
system could be installed in the entire building.
If a historical building has not had its major components brought up to code, the costs
and wait time for those changes can be substantial. Typically, the plumbing and electrical
systems both have to be replaced completely. It can take up to six months or longer for the
electrical system to be completely installed. For water, sewer, and fire systems, a storm water
separation system along with fire department connections and standpipe installation must be
considered (Matthews, 2004).

ASBE 40TH Annual Conference
129
Memphis, TN, September 24-26, 2014
The possibility of asbestos must also be considered, if the building in question was
constructed during the time period when asbestos was considered to be a safe building material.
If a building is determined to contain asbestos, there are two options: removal or encapsulation.
Removal is typically cost-prohibitive. If the asbestos can be encapsulated, that is usually the best
way to abate the issue. The Asbestos Containing Material (ACM) will be covered with a heavy
insulation and while expensive, it is a much cheaper option than having it all removed. The
insulation will keep the asbestos from becoming airborne particulates and creating a health
hazard.
The Americans with Disabilities Act (ADA) requirements are typically not met in a
historic building. To become ADA compliant, major renovations may have to be performed,
including the addition of an elevator if there is more than one story to the building. Depending
upon the age of the building, doorways will most likely have to be widened, along with all
entrances and exits.
OSHA inspectors will perform a walk-through free of charge. This is an excellent
opportunity to gain perspective from a government standpoint when it comes to the safety of an
establishment. Any violations found will not be cited, if no imminent danger to life or health
exist, however it is expected that hazards will be abated quickly. A good rule of thumb is to stay
with the inspector the entire time he or she is present, and to take the same notes he/she does.
Taking pictures of the same items the inspector takes pictures of is also strongly suggested. Prior
to the inspection, it is prudent to prepare a list of questions to ask the inspector. The inspector
knows a small business owner who voluntarily requests an OSHA inspection may not know
everything there is to know about safety, and that they are there to learn what needs to be done.

ASBE 40TH Annual Conference
130
Memphis, TN, September 24-26, 2014
Having an inspector walk through the business shows a willingness to cooperate, and a drive to
improve. Should OSHA be called out to inspect that same business due to an employee
complaint, the voluntary inspection and subsequent abatement of hazards will be taken into
consideration when it becomes time to negotiate over any citations issued.
A fire marshal can be an invaluable asset to the small business owner as well. His or her
services can range from inspections to education and consulting. All of this is offered free of
charge. Most fire marshals have fifteen or more years of fire service experience, along with
extensive specialized training in a wide variety of aspects of building construction. They are also
the record keepers for a building’s history, and serve as an excellent resource for information
about any buildings under consideration for lease by a small business owner. It is advisable to
request a pre-lease walk-through by the fire marshal to determine if the building in question will
pass inspection when it is time to apply for a certificate of occupancy.
Another excellent resource for determining if a building is up to code is a licensed,
professional inspector. A good inspector needs to be well versed in commercial building codes
and preferably have experience in engineering, construction, electrical, pest control, and
plumbing. The cost of hiring a seasoned professional will not be economical, but it could
potentially save thousands of dollars for the small business owner in the long run. The inspector
will typically crawl into the spaces that a fire marshal won’t. He/she will be able to tell you about
the structural makeup of the building, and its current condition. By examining every aspect of the
building from joists to plumbing, they will be able to provide a forecast of possible issues that
could arise in the near future.

ASBE 40TH Annual Conference
131
Memphis, TN, September 24-26, 2014
If renovations are going to be made, the architect’s renderings can be reviewed by the fire
marshal and inspector prior to starting the project. They will be able to tell immediately if the
renovated space will or will not meet all building code requirements. It is not uncommon for a
business to begin renovating a space, only to have to tear down or re-renovate several areas due
to existing code violations. Had the owner requested a layout review prior to starting, the issue
might have been avoided completely.
The most common mistakes made during renovations typically have to do with the
National Fire Protection Association (NFPA) Life Safety Code. In an effort to enlarge rooms,
hallways are sometimes narrowed. The NFPA requires a minimum width of four clear feet. This
means that no items, such as decorations or furniture, can intrude into the space. Storage rooms
are often a precious commodity and packed full of items. If a building has sprinkler heads
suspended from the ceiling, no items may be stacked within eighteen inches of the sprinkler
head. This distance prevents the curtain of water from becoming obstructed, which could reduce
the extinguishing ability of the system significantly. All doors that are not exits must be marked
as such. Exit signs must be placed over all exit doors and either be illuminated or reflective. In
an effort to save money, many businesses opt to print out exit signs from a computer. This is not
an acceptable practice, and should OSHA or the local Fire Marshal perform an inspection,
significant fines may be issued.
A small Brooklyn-based chain of women’s apparel stores was inspected by OSHA in
August of 2013 because of employee complaints to the OSHA regional office (“OSHA Cites
Pretty Girl Inc.,” 2013). Employees claimed they were subjected to working in unsanitary
conditions. Upon arrival, the OSHA inspector found that raw sewage had backed up into the rear
ASBE 40TH Annual Conference
132
Memphis, TN, September 24-26, 2014
of the store. Boxes and bins were strewn everywhere, and parts of the drop ceiling were falling
down. The citations issued carried a total proposed penalty of $43,890. Included in the citations
was the lack of a clear means of egress, lack of a fire escape and emergency plan, no exit lighting
or signs, and the fire extinguishers had not been mounted or inspected. The company was also
cited $770 for failure to maintain an OSHA 300 Log of injuries and illnesses.
Aside from the physical aspects of the business, employers who employ more than 10
employees must maintain a record of injuries and illnesses that are recordable by OSHA’s
standards. All employers, including those partially exempted by reason of company size or
industry classification, must report to OSHA any workplace incident that results in a fatality or
the hospitalization of three or more employees. A list of industries that are partially exempt from
recordkeeping can be found in the Appendix of this paper. An injury/illness must meet one of
the criteria set forth by OSHA to be considered recordable. The list of recordable
injuries/illnesses is outlined in Section 1904.4 in the OSHA Recordkeeping Handbook (n.d.).
The recordkeeping procedure has five steps. The first step is to obtain a report of the
incident that resulted in an injury or illness. Incident reports are not standardized; thus it is up to
the employer as to what kind of report to use. The report style can range from a single page to
multiple pages, outlining every detail. The second step is to log each injury/illness on the OSHA
300 log. The third step is to prepare the OSHA form 301. This serves as a supplementary form
for all recordable injuries/illnesses. It is important to note that this form is not required to be
filled out if the incident investigation form includes all of the information that is on the 301. The
fourth step is to prepare an annual summary of all injuries and illnesses in the form of an OSHA
form 300A, at the end of the year. This form must be posted in a conspicuous area every year

ASBE 40TH Annual Conference
133
Memphis, TN, September 24-26, 2014
from February 1 to April 30. The last step is to maintain these records in paper form for five
years. The five year rule means the current year plus the past five years. Electronic copies may
be kept in addition to, but cannot replace, the hard copies. It is advisable for companies that are
exempt from this requirement to still maintain a record keeping system (“Small Business
Handbook,” n.d.). Using the records, incidents can be tracked and used to narrow down problem
areas in the workplace. These areas can be inspected and employees interviewed for possible
abatement strategies.
All businesses, regardless of size, are required to notify OSHA upon the death of an
employee in the workplace or the hospitalization of three or more employees for other than
observation. The notification must be made within eight hours of the incident occurrence. This
must be done orally by either a phone call or a personal visit to the nearest OSHA office. This is
why no business is ever considered totally exempt from OSHA regulations. The company’s
safety program should include a paragraph outlining who is responsible for contacting OSHA
should one of these incidents occur along with the contact number for the area OSHA office. It is
important to designate someone in a management position to contact OSHA. It is important that
the first impression given is a good one. An investigator with a bad impression of the business
could spell disaster when the time comes to negotiate citations.
Along with the posting requirements of the OSHA form 300A, the OSHA Workplace
Poster must be displayed year-round. It is advisable to have a separate bulletin board located in
the employee break room or near a time-clock to post these required documents. Safety bulletin
boards can be fun as well as informative. Pictures, cartoons, and interesting facts posted on the
board regularly will help ensure employees check the bulletin board routinely. Industry specific

ASBE 40TH Annual Conference
134
Memphis, TN, September 24-26, 2014
OSHA standards that apply to the small business owner’s company should always be kept on
hand to use for reference (“Small Business Handbook,” n.d.). OSHA offers a wide variety of
safety bulletins and posters that can be posted and/or disseminated to employees. A good
practice is to focus on one aspect of workplace safety every month. Many businesses will select
the topic based on the time of year. Safe driving during inclement weather and hypothermia
awareness are excellent topics to cover during the winter. Fire safety is often discussed in the
fall. This coincides with national fire safety week and the nationwide campaign to urge
homeowners to change the batteries in their smoke detectors. The safety topics covered can not
only protect workers in the workplace, but at home as well. Many safety professionals choose to
add contests or other fun aspects to their safety programs to encourage employee participation.
All training documents, drill records, and a written copy of the safety program should be
kept in a master binder for ease of use and reference. Along with the requirements by OSHA,
there are a few elements that, if used, will assist the business owner in attaining a safer
workplace overall. Using the industry standards as a guideline, the business owner should draft a
checklist for monthly informal inspection. It is easy to become complacent about safety and this
checklist will aid in keeping hazards from being overlooked until an employee is injured or the
building catches on fire. There are several items that fall under the general industry standards
that all checklists should include. Extension cords can be used for up to 90 days where temporary
wiring is needed. The cord should have a tag placed on it that shows the date it was placed in
service and the initials of who tagged it. The cord should be completely intact with no visible
wear on the outside insulation. The ground pin should also be firmly in place. If a cord is
stretched across a building, it should be kept out of all walkways and not placed under carpets or

ASBE 40TH Annual Conference
135
Memphis, TN, September 24-26, 2014
rugs. The best option for temporary wiring is the use of a power strip in place of an extension
cord. They can be custom ordered with cords in excess of 40 feet. Storage rooms should be
routinely inspected for the presence of vermin. Exits and fire extinguishers should be inspected
as well. Any and all issues should be documented on the inspection checklist even if they are
abated on the spot. The documentation shows that the employer is identifying issues as they arise
and the documentation will help plead a case for reduced or dropped citations should an OSHA
inspection occur. Any documentation showing the employer’s dedication to safety will help
when it comes to requesting leniency from inspectors. It is also a good idea to involve employees
in the inspection process. Fresh eyes are better able to spot hazards. Employees with hands-on
experience often have excellent suggestions for abatement measures. Involving them also helps
to bring them on board and gain compliance with company policies and procedures where safety
is concerned.
The local fire department can perform inspections of the fire suppression system. They
will be able to determine if all sprinkler heads are functional, test the emergency lights, ensure
that all smoke alarms are properly placed and in working order, and identify any other hidden or
visible electrical hazards that may exist. They can also perform a test on the nearest fire hydrant
to determine if it has adequate water pressure to extinguish a fire should one break out. If the
pressure is inadequate, they will have to amend their response guidelines to include additional
resources and equipment to ensure the building is adequately protected. A successful fire
inspection could possibly translate to a lower insurance premium when conveyed to the business
owner’s insurance company. When speaking with the fire department official, it is important to
find out what the city’s ISO rating is. The ISO collects information on a community’s public fire

ASBE 40TH Annual Conference
136
Memphis, TN, September 24-26, 2014
protection. This rating can range from 1 (the best) to 10 (the worst). Insurance companies take
this rating into consideration when determining what premium to charge. Sometimes an
insurance company will not have factored this into their quote for coverage. Supplying this
information can potentially save a business thousands of dollars annually. Communities can
assist with lowering the city’s ISO rating by requesting training from the local fire department.
This documented training can be submitted to the ISO rating committee for consideration of
lowering the existing rate (“ISO Fire Suppression Rating,” n.d.). If the rating is lowered,
businesses can then report the new lower rating to their insurance companies for consideration in
premium reduction. It is very important to maintain a close relationship with the local fire
department.
Another element of a comprehensive safety program is ergonomics. The workplace
should be made to fit the employee using reasonable measures. It is not reasonable for an
employee to expect a complete rebuild of an office to accommodate them, but an ergonomics
issue may be abated with the use of items such as a step stool, an adjustable chair, or some other
means of assistance. Along with workplace inspections, employees should be observed for any
signs of physical stress. Frequent weight shifting from one foot to the other, rolling of the neck
and/or shoulders, constantly straining to reach or pick up items, and rubbing the lower back are
just a few indicators that should tell an employer that something in the workplace may need to be
changed. It is not uncommon to find that simple additions or changes can save a company
thousands of dollars in workers compensation claims and ensuing lost work days. Working with
employees when it comes to comfort may also greatly improve morale. According to
management consultant and safety/organizational behavior specialist Dan Petersen, when the

ASBE 40TH Annual Conference
137
Memphis, TN, September 24-26, 2014
culture of a company is positive, the safety program elements will be more successful (Petersen,
2001).
Prior to purchasing office equipment for a business, the varying ergonomic aspects of
each piece should be analyzed. A cheaper office chair may end up costing the business owner
thousands of dollars due to poor adjustability. Conversely, the most expensive office chair may
not be the best option either. Perusing the consumer reviews with respect to fit and comfort for
the specific product being considered will aid in selecting the best equipment for the money. If
possible, adjustable tables should also be considered for use in the workplace. This allows for a
variety of employees to work comfortably. Employers need to monitor employees who spend a
lot of time on computers to ensure they are not being exposed to lighting issues. Glare is a major
cause of eye strain and headaches. Changes in the types of bulbs used overhead or anti-glare
monitor covers are options to consider when abating this workplace stressor. Managers should
routinely check on employees to ensure the equipment is still functioning the way it should. All
broken items should be removed and replaced in a timely manner. If a piece of equipment is in
need of repair, employees should understand the correct procedure for reporting it. Repairs
should be done by a licensed professional if possible. Prompt actions by management when it
comes to reported issues will reinforce the belief that the employee matters; thus boosting
employee loyalty and morale.
The OSHA Small Business Handbook takes all of these program elements and organizes
them into a simplified outline. The outline can then be used as the backbone for a comprehensive
safety program. With the help of seasoned professionals, a lot of expenses can be avoided. A
small business has a wide variety of resources at their disposal to help with developing and

ASBE 40TH Annual Conference
138
Memphis, TN, September 24-26, 2014
maintaining a successful safety program. Many of these resources are at no or very low cost.
When safety is considered during the planning stages of a new business, a lot of hazards and
potential expenses can be avoided. These savings can even extend into lower operating costs by
having the building under consideration inspected for adequate components. A well-sealed
building will not only keep vermin out, but will be more cost-effective to heat and cool.
Employers who have happy and healthy employees who know their voices are heard and their
needs met will have lower turnover rates. According to a Gallup study, only 30 percent of
American employees feel engaged or inspired at work (“Study: Most Americans Unhappy,”
2013). A successful safety program can help alleviate those feelings of disinterest and
unhappiness. Initiating challenges, involving employees in the safety program, posting fun and
informative bulletins that are immediately relevant to not only the workplace, but their personal
lives as well, can all lend to an employee feeling not only engaged, but cared for. Ergonomic
considerations for employees will also keep morale high. If an employee expresses a need for a
change and that need is met, they will feel like valued and be less likely to leave the company.
The benefits of a safety program reach far and wide and can greatly affect the bottom line. It is
important to remember that no business is too small to have a safety program.

ASBE 40TH Annual Conference
139
Memphis, TN, September 24-26, 2014
Appendix
Partially Exempt Industries.
Employers are not required to keep OSHA injury and illness records for any
establishment classified in the following Standard Industrial Classification (SIC) codes, unless
they are asked in writing to do so by OSHA, the Bureau of Labor Statistics (BLS), or a state
agency operating under the authority of OSHA or the BLS. All employers, including those
partially exempted by reason of company size or industry classification, must report to OSHA
any workplace incident that results in a fatality or the hospitalization of three or more employees
(see § 1904.39).
SIC code Industry description SIC code Industry description
525 Hardware Stores 725 Shoe Repair and Shoeshine Parlors
542 Meat and Fish Markets 726 Funeral Service and Crematories
544 Candy, Nut, and Confectionery Stores 729 Miscellaneous Personal Services
545 Dairy Products Stores 731 Advertising Services
546 Retail Bakeries 732 Credit Reporting and Collection Services
549 Miscellaneous Food Stores 733 Mailing, Reproduction, & Stenographic
551 New and Used Car Dealers 737 Computer and Data Processing Services
552 Used Car Dealers 738 Miscellaneous Business Services
554 Gasoline Service Stations 764 Reupholstery and Furniture Repair
557 Motorcycle Dealers 78 Motion Picture
56 Apparel and Accessory Stores 791 Dance Studios, Schools, and Halls
573 Radio, Television, & Computer Stores 792 Producers, Orchestras, Entertainers
58 Eating and Drinking Places 793 Bowling Centers
591 Drug Stores and Proprietary Stores 801 Offices & Clinics Of Medical Doctors
592 Liquor Stores 802 Offices and Clinics Of Dentists
594 Miscellaneous Shopping Goods Stores 803 Offices Of Osteopathic
599 Retail Stores, Not Elsewhere Classified 804 Offices Of Other Health Practitioners
60 Depository Institutions 807 Medical and Dental Laboratories
61 Nondepository 809 Health and Allied Services, Not Elsewhere d
62 Security and Commodity Brokers 81 Legal Services
63 Insurance Carriers 82 Educational Services (schools, colleges, universities and libraries)
64 Insurance Agents, Brokers & Services 832 Individual and Family Services
653 Real Estate Agents and Managers 835 Child Day Care Services

ASBE 40TH Annual Conference
140
Memphis, TN, September 24-26, 2014
654 Title Abstract Offices 839 Social Services, Not Elsewhere Classified
67 Holding and Other Investment Offices 841 Museums and Art Galleries
722 Photographic Studios, Portrait 86 Membership Organizations
723 Beauty Shops 87 Engineering, Accounting, Research, Management, and Related Services
724 Barber Shops 899 Services, not elsewhere classified
[66 FR 6122, Jan. 19, 2001]

ASBE 40TH Annual Conference
141
Memphis, TN, September 24-26, 2014
References
Clark, P. (1991, August 15). Hazard Communication and Consumer Products. Retrieved from
https://www.osha.gov/pls/oshaweb/owadisp.show_document?p_table=INTERPRETATI
ONS&p_id=20364
Fitzgerald T., & Bowser A. (2013, August 15). US Labor Department's OSHA cites Pretty Girl
Inc. for Exit Access, Electrical and Sanitary/Housekeeping Violations at Brooklyn Store.
Retrieved from
https://www.osha.gov/pls/oshaweb/owadisp.show_document?p_table=NEWS_RELEAS
ES&p_id=24546
Lopez, M.,Siepman, K., Heenan, M., Davis, F., & Miller, M. (2008). Occupational safety and
health law handbook, 2nd ed. Lanham, Maryland: Government Institutes.
Matthews, W. (2004, August 29). Contemplating an Old Building Renovation? Think it
Through. Retrieved from
http://www.bizjournals.com/nashville/stories/2004/08/30/focus3.html?page=all
N.A. (n.d.). ISO Fire Suppression Rating Schedule Resources. Retrieved from
www.nfpa.org/research/resource-links/first-responders/iso-rating-resources
N.A. (n.d.). OSHA Recordkeeping Handbook. Retrieved from
https://www.osha.gov/recordkeeping/handbook/index.html
N.A. (n.d.). Recordkeeping. Small Business Handbook. Retrieved from
https://www.osha.gov/Publications/smallbusiness/small-business.html#keeping
N.A. (n.d.). Safety and Health Training Resources. Occupational Safety and Health
Administration. Retrieved from https://www.osha.gov/dte/library/index.html
N.A. (2013). Study: Most Americans Unhappy at Work. Retrieved from
http://www.cbsnews.com/news/study-most-americans-unhappy-at-work/
N.A. (n.d.). Training. National Fire Protection Association. Retrieved from
http://www.nfpa.org/training
Occupational Safety and Health Administration. (2001). [Chart of partially-exempt industries].
Occupational Safety and Health Administration We Can Help. Retrieved from
https://www.osha.gov/pls/oshaweb/owadisp.show_document?p_table=STANDARDS&p
_id=12791

ASBE 40TH Annual Conference
142
Memphis, TN, September 24-26, 2014
Petersen, D. (2001). Safety management: A human approach. 3rd ed. Des Plaines, Illinois:
American Society of Safety Engineers

ASBE 40TH Annual Conference
143
Memphis, TN, September 24-26, 2014
Just Do It! A Proof of Concept Case Study
Dale Spradling, Stephen F. Austin State University
Abstract
Most startups fail. Given this reality, a serial entrepreneur or incubator can maximize
resources by minimizing the mean time to failure, not success. If an idea is not going to be
commercially viable, the sooner the project reaches the autopsy stage, the better. A Proof of
Concept can accelerate this endgame by using fuzzy feedback logic to determine the financial
feasibility of a concept. This case demonstrates the Proof of Concept process by using
storytelling to illustrate the following steps: 1. Demonstrate problem/opportunity, 2. Brainstorm
innovative response; 3. Develop proof of value, 4. Cultivate a proof of technology, 5. Establish a
business/legal/tax plan, 6. Agree on timeline and milestones, 7. Demonstrate a proof of economic
feasibility, and 8. Prepare a completion post mortem. This case thus establishes that, unlike a
business plan, where a significant amount of front-end time can be spent preparing yet another
beautiful slide deck that addresses every possible contingency, a Proof of Concept is viable, but
rigorous and heuristic process for quickly determining the feasibility of a concept.
Keywords: Proof of Concept, Innovation, Financial Feasibility, Startups

ASBE 40TH Annual Conference
144
Memphis, TN, September 24-26, 2014
Fe-Lines, Inc.: Don’t Declaw…Get Sticky Paws!
Leslie A. Toombs, Texas A&M University – Commerce
Courtney Kernek, Southeastern Oklahoma State University
Mildred Golden Pryor, Texas A&M University – Commerce
Case Overview
Fe-Lines, Inc. was founded by Bonnie Pemberton, a broadcast voice over performer. She
is an avid cat lover and invented a product, Sticky Paws, to modify the behavior of cats that
sharpened their claws on furniture, rugs, and other surfaces that they found desirable in the
home. Her cat Buddy was the inspiration for the development of Sticky Paws because she loved
him dearly yet he had destroyed thousands of dollars of home furnishings and plants. In
searching for a solution to his shredding behavior she researched declawing and learned of all of
the possible side effects of this procedure. Declawing can lead to infection and inappropriate
elimination and Bonnie decided this was not an acceptable solution. This search ultimately led to
her development of this double sided adhesive product which can be applied to any surface
without leaving sticky residue or otherwise damaging the surface. It is an effective deterrent
because cats do not like anything that is sticky on their paws!
At the time Bonnie started selling Sticky Paws, she had no background or experience in
business. She was marketing her product at a trade show in Orlando, Florida, when she met Chris
and Angela Ruben, who later became the marketing arm of her company. As they watched
Bonnie at the trade show they knew that she was really in need of assistance in many aspects
from pricing, distribution, and packaging of the product to strategically planning for product line
extension. They helped Bonnie initially on a friend/mentor basis and contracted with Bonnie
during her second year of operation when she realized she could not run the company by herself.

ASBE 40TH Annual Conference
145
Memphis, TN, September 24-26, 2014
Case Objectives and Course Use
This case examines the marketing challenges faced by a start-up company in the pet
industry. A marketing company is hired to assist the founder and CEO of Sticky Paws to help
formulate strategies for the marketing mix variables that will position the product in the industry
to achieve greatest competitive position. The case takes the reader through the marketing
challenges and allows insight into the variety of issues that had to be taken into account before
recommendations can be made to the owner. Specific objectives of this case include: (1) provide
an opportunity for students to explore and apply various pricing strategies; (2) discuss the
importance of channels of distribution selection and impact on price; (3) examine the impact of
promotion on product sales performance; and (4) discuss patent protection considerations.
This case would work well in an undergraduate or graduate marketing management
course. It is also appropriate for an undergraduate or graduate promotion or sales course.

ASBE 40TH Annual Conference
146
Memphis, TN, September 24-26, 2014
X, Y, or Z? --- A Theoretical Comparison of Managing Small Business in
China and India
Qiang Yan, St Benedict College and Saint John’s University
Kingshuk Mukherjee, St Benedict College and Saint John’s University
Abstract
Numerous studies have explored the differences between managerial styles in developing
countries and those of the Western firms. However, few studies have compared managerial styles
of small business in the two emerging economies: India and China.
This study intends to fill this gap by fully examine the similarities and differences of
managing small business in China and India.
This paper analyzes the managerial styles in small business in the two countries by
applying conventional models in motivation, namely X, Y, or Z theory, to unfold the underlying
reasons of why there are such similarities and differences of managerial styles in small business
in the two countries. The other side of the coin of this study is it also tests whether the
conventional managerial models of X, Y, or Z, as proposed by Douglas McGregor and William
Ouchi, can still be held in the study of small business in emerging economies such as China and
India.
The data are mainly collected from the authors’ intensive interviews with managers and
employees who have worked or are still working in small business in China and India. Secondary
data, especially some related government documents and/or business records, are also used if
necessary.
In addition to study the management of small business in the two developing countries
through the lens of the three managerial models, this study also offers historical and cultural

ASBE 40TH Annual Conference
147
Memphis, TN, September 24-26, 2014
explanation to delineate differences and similarities of managerial styles in the two emerging
economies.
In general, this study reveals that although small business in Western cultures and small
business in China or in India may still have different managerial styles, the difference of
managerial styles in small business in the two developing countries is also huge. We also find
that although conventional culture and norms still shape managerial styles in small business in
China and India, some Western values, such as competition, cooperation, efficiency, gender
equality, etc., gradually affect managerial styles of small business in the two countries. In
addition, the effectiveness of managing small business in each country is also shaped by other
factors such as the type of industry in which the small business resides, the geographic site where
the firm locates, and managers’ personality.
In sum, this study aims to outlining some fresh understanding of managerial styles and
their influencing factors in small Chinese and Indian business. This study shows that the
conventional paradigms of motivation—X, Y, and Z, can still be applied to study the
management of small business in some countries. The study also tells us that a comprehensive
survey of macro and micro context of the target country is necessary for the successful
management of cross-cultural small business.
ASBE 40TH Annual Conference
148
Memphis, TN, September 24-26, 2014
King Digital Entertainment PLC: A Case Study
Alair Tudor, University of Louisiana at Monroe
Eugenie A. Ardoin, University of Louisiana at Monroe
Arturo Rodriguez, University of Louisiana at Monroe
Introduction
Gaming has taken on a new dimension in recent years as some companies have chosen to
gravitate from the traditional gaming platforms to gaming options that have become available
through social media. Social media sites such as Facebook have provided the opportunity for
people to connect and interact with each other. Gaming through social media sites has allowed
people to play with each other and interact with each other without having to be physically
together or having to spend large amounts of money on a gaming platform. Although it has been
reported that Facebook has been losing their fan base, the site still boasts a large amount of
potential clients for gaming companies to grow and expand. Last Yahoo News reported that the
company had approximately 1.11 billion people using the site every month, representing a 23%
growth from 2012 (Yahoo, 2013). Additionally, it has been estimated that the landscape is
changing as to the amount of gaming that is conducted online. Studies show that an estimated 3
billion hours a week are spent by people gaming online and “there are 500 million global gamers
now who spend at least an hour per day playing” (Jacques, 2011). With this platform and user
growth, social gaming companies are hoping that it will transfer to growth and popularity of their
games. Examples of these social gaming companies include: Zynga, the creator of the Farmville
and Maria Wars games which had gained popularity in the recent past, and the creator of the
popular Candy Crush Saga, King Digital Entertainment. The trend of both of these companies

ASBE 40TH Annual Conference
149
Memphis, TN, September 24-26, 2014
has been to develop and market popular games, then file with the Securities and Exchange
Commission to take the company public and raise additional capital. Given the failure in the past
of a similar company named Zynga where the stock price went from $11 at open to $2.96 per
share the question remains as to if King Digital will suffer a similar fate and see its stock in the
future continue to decline.
History
Although King Digital Entertainment was founded four years before Zynga (in January of
2003), its most popular game only gained notoriety after the great success of Zynga’s Farmville.
When King Digital started, it began developing and publishing online casual games. (Our
History, n.d.). It is led by CEO Riccardo Zacconi who started his career in economics but
eventually shifted over to digital business when the dotcom era occurred (Garside, 2014). After
the bubble burst in 2000, Zacconi moved to the U.K. where he found his first real digital success
in a dating company called uDate. The company eventually was sold to Match.com which made
Zacconi a millionaire and gave him the resources to start King Digital, along with other people
he met through different companies (Garside, 2014). After the startup, the company was able to
attract investors and grew. In 2011, it launched the Candy Crush Saga game on King’s
Tournament website (Our History, n.d.). In the same year, the company also introduced Bubble
Witch Saga which was the company’s first social media game that used Facebook, and the first
game to be launched on mobile devices. Candy Crush soon followed in November, 2012 (Our
History, n.d.). Since then, King Digital has boasted having 352 million average monthly unique
users and 190 titles offered in over 200 countries (Our History, n.d.).

ASBE 40TH Annual Conference
150
Memphis, TN, September 24-26, 2014
The IPO
After a very successful 2013, King Digital decided to take the firm public. Until this
point most investors did not know the true extent to how profitable of King Digital’s profitability
but they were aware of how popular a few of their games had been. Reuters reported that King
Digital was a money-making machine posting revenues in excess of $5 million a day
(Thompson, 2014). The potential stock offering was made attractive by the number of dividend
payments that could be made based on the size of the firm’s revenues. As such, JPMorgan
Chase, Credit Suisse, and Bank of America Merrill Lynch underwrote the filing, hoping to raise
$500 million on February 18th
(Thompson, 2014).
Although there were some who were eager to invest in the company given the recent
rapid growth and popularity of its games, there were many who met the company’s IPO with
skepticism as well. After all, many still seemed skeptical due to the recent Zynga crash and were
not quick to reinvest in yet another social gaming company. As a result, shares opened lower
than the proposed $22.50 per share at $20.50 and continued to slide by as much as 16 percent
during the day as investors expressed concerns about the company’s apparent overreliance on
Candy Crush Saga. Evidence showed that three quarters of the company’s revenue for the last
three months of 2013 was derived from the Candy Crush Saga; although it boasted to have 190
titles (180 at the time of the IPO (Nayak, 2014). Another reason given for the lackluster debut
was expressed by Roger Kay, an analyst at research firm Endpoint Technologies Associates who
stated that in the past, there have been many high priced IPOs and the valuations were “frothy”
causing investors to be disappointed when returns don’t meet expectations (Nayak, 2014). After
the less than stellar debut, there were more calls that the company’s stock was “mispriced” and

ASBE 40TH Annual Conference
151
Memphis, TN, September 24-26, 2014
indeed was another Zynga (which made a similar opening in 2011 with a smaller 5 percent stock
decrease at the end of opening day) (Nayak, 2014).
The less than stellar debut also had other impacts by decreasing the net worth of some of
the main investors of the company including the CEO Riccardo Zacconi and chairman Melvyn
Morris who could have become billionaires if the debut had been better (Mac, 2014). Zacconi
had lost $105 million and Morris, due to him holding more stock, lost approximately 125 million
(Mac, 2014). These losses were still smaller than king.com cofounder Toby Rowland and former
board member Klaaus Hommels who chose to sell their shares in the company early for cents
when three years later the company went public. Their shares in the company would have
gathered 960 million and 1.02 billion at IPO instead they walked away from the company with
2.9 million and 3 million respectively (Mac, 2014). This stands as an example for other
companies who have investors in social gaming and who are still debating whether or not to go
public. It should also send a signal to these investors that there is possible money to be made in
the industry if the firm and the IPO are managed correctly.
Business Model
The business model offered by King Digital is a fairly simple one, the games they
designed are done in a way to be easy to understand but still challenging for the user to perform
and build upon. It allows for a focus on those players who have short times available to play
games allowing these users to “play for a moment, then move on with their day and pick up their
game later” (Investor Relations, n.d.). This allows the company to gain new customers from a
broad range of demographics with the wide appeal that is available with this strategy.

ASBE 40TH Annual Conference
152
Memphis, TN, September 24-26, 2014
Essentially, the games that are made by King Digital are available for free but if users want to
gain a better experience they will purchase virtual features that are priced “relative to the
entertainment value they provide” (Investor Relations, n.d.). These virtual features make up the
majority of the revenue the company gets which is obtained from the user through the platform
which then charges “30% of the after-tax payments they collect” (King Digital Form F-1, 2014).
Additionally, the company obtains some revenue through advertising space, though it is
declining, and the company does not expect this to play a large role in their future plans. To
spark further innovation and attempt to build on previous successes, the company in the past has
aggressively bought over digital development companies in strategic locations around the world
to produce games by local game developers in foreign countries for consumers in that specific
country. For example, recently the company bought Non-Stop Games in Singapore for
approximately 100 million to develop their “game studios” (Tham, 2014). Other game studios
purchased are located in Stockholm, Bucharest, Malmo, London, Barcelona, and Berlin. Along
with these studios, the company also has offices in San Francisco, Malta, Seoul, Tokyo and
Shanghai (Investor Relations, n.d.). The CEO, Zacconi, does understand that the industry in
which the company operates is very volatile and its success is heavily dependent on how recent
the last success of the company was (King Digital CEO, 2014). To combat possible failure, the
company focuses more on attempting to flood the market with many web games. As noted
before, the company currently offers more than 190 games; which allows for the company to see
which games work on one level that could possibly be transferred to other platforms such as
mobile and social networks (King Digital CEO, 2014). Using this model has been successful at
the moment; results have shown that the company has expanded very quickly on the onset of the
success of Candy Crush Saga. Profits have grown to $568 million in 2013 from $8 million in the

ASBE 40TH Annual Conference
153
Memphis, TN, September 24-26, 2014
previous year which spurred the ability for the company to do an initial public offering in 2014
despite calls that the company is still just a one hit wonder (King Digital Form F-1, 2014).
Strengths
King Digital is a company that has tried hard to ensure that it is sustainable. As one of the
older gaming companies that started developing games on social platforms, they have shown the
ability to craft a repeatable and scalable business model. The model, as discussed before, is
somewhat simple allowing the company the opportunity to introduce new titles in the event
Candy Crush Saga loses popularity. The success of the model is attributed to the following:
-Massive player network available,
-Ability to seamlessly transfer between devices if needed, and a
-Unique, repeatable, scalable game development process
Weaknesses
At the time of the IPO both the company and various other analysts identified some distinct
weaknesses with the business model. These weaknesses may jeopardize the ability of the
company to continue to be sustainable. The weaknesses that the company exhibits are outlined
below:
-A small number of games currently generate a substantial amount of revenue,
-Not keeping up with market demands for new games,

ASBE 40TH Annual Conference
154
Memphis, TN, September 24-26, 2014
-Dependence on only a few key users / gamers as sources of revenue (small percentage of users
actually buy items),
-The loss of key personnel could have immediate negative impacts on the company, and
-Experience level of management is low
Opportunities
Although there have been numerous companies starting to focus on the online gaming market
there are still opportunities that are available to King Digital to seize these include:
-Massively growing industry,
-Fast, easy way for revenues, and
-New ad technologies that are becoming more popular providing ways to diversify revenue
sources
Threats
There are risks that are associated with the company and others investing in it, many of which
have been identified by the company itself at the IPO in their filings. These include:
-Significant competition and low barriers to entry,
-Dependence on gamers to hold interest in games produced by the company,
-Rapid change in customer preferences,

ASBE 40TH Annual Conference
155
Memphis, TN, September 24-26, 2014
-Dependence on other devices and systems not in the control of the company (Facebook article
losing popularity),
-New technologies that could make the social media gaming phenomenon obsolete,
-Potential for on online services security breaches which could occur and harm the business,
-Dependence on a small number of data providers to allow users to gain access to purchase items
online for the game.
Comparison between King and Zynga
As stated before, there are a few comparisons that are justified between Zynga and King
Digital. Both companies have had breakout hits which caused rapid increases in revenue within
short spans of time. For Zynga, it was Farmville and for King Digital it was Candy Crush Saga.
In addition, both social media gaming companies filed for IPOs after very profitable years
showing nearly consistently high revenues as depicted in Graph 1. The graph also shows faster
growth for King Digital resulting in higher revenues at the time of the IPO than Zynga and thus
having a higher valuation. Another distinct characteristic that the graph illustrates is a slight
decrease in revenues between Q3 and Q4 of 2013 pre-IPO which began thoughts of a possible
plateauing of earnings for King Digital.

ASBE 40TH Annual Conference
156
Memphis, TN, September 24-26, 2014
Graph 1: Pre IPO comparision between Zynga and King Digital retrieved from
http://www.businessinsider.com/chart-of-the-day-candy-crush-vs-zynga-2014-3
The IPO
Zynga had a turbulent opening day with its value rising to as much as $11.50 per share
before decreasing to 9.50 per share finishing 5% below the opening day pricing (Pepitone, 2011).
The similarities between the two companies had caused many potential investors to become
concerned over purchasing King Digital’s stock after the failure of Zynga years earlier (Yahoo!
Finance, 2011). The revenue from Zynga, after the company went public, started to decline
mostly due to the decrease in interest that occurs with many social gaming company’s most
popular game(s). When coupled with a slow start up on other games developed by the company,
it could make a risky investment. In Zynga’s case there was overdependence on Farmville, which
as the graph below (Graph 2) shows had peaked approximately around the eleventh month after
its release. Moreover, other games released by the company were not as quick to gain interest

ASBE 40TH Annual Conference
157
Memphis, TN, September 24-26, 2014
among the consumer to mitigate the declining pattern. King Digital has other titles that had
moderate success but even months after release there has been a rapid drop off in number of new
bookings, which is the best way in which these companies can assess how many new sales they
have achieved over a certain period of time (Matt Lynley, 2011). One game that the graph has
illustrated as not picking up as much interest as was needed was Cityville which, in a time lapse
comparison to Farmville, only achieved 50% of the bookings that Farmville recorded.
Graph 2: The trajectory of bookings between the major titles of Zynga retrieved from
http://www.businessinsider.com/zyngas-daily-user-growth-is-fading-fast-analysts-say-2011-12
King Digital is beginning to see its main revenue source decrease in terms of user interest
as a Google trend analysis shows. Although it isn’t the best metric, it does correspond with what
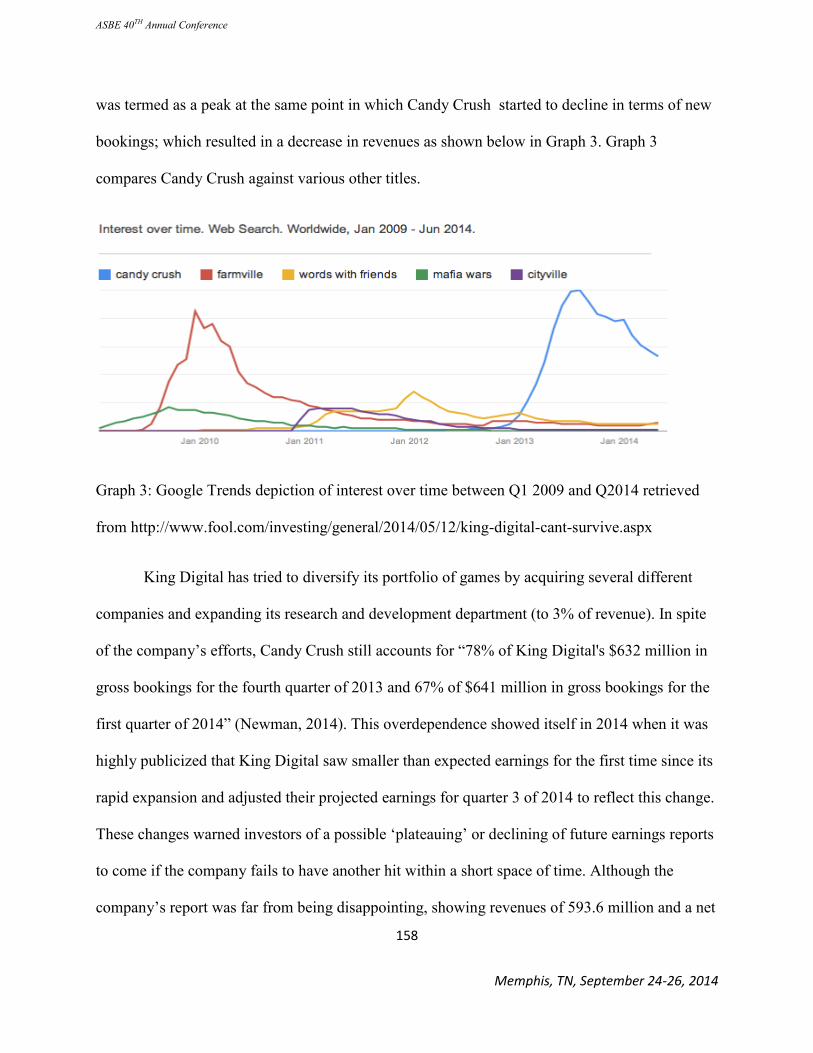
ASBE 40TH Annual Conference
158
Memphis, TN, September 24-26, 2014
was termed as a peak at the same point in which Candy Crush started to decline in terms of new
bookings; which resulted in a decrease in revenues as shown below in Graph 3. Graph 3
compares Candy Crush against various other titles.
Graph 3: Google Trends depiction of interest over time between Q1 2009 and Q2014 retrieved
from http://www.fool.com/investing/general/2014/05/12/king-digital-cant-survive.aspx
King Digital has tried to diversify its portfolio of games by acquiring several different
companies and expanding its research and development department (to 3% of revenue). In spite
of the company’s efforts, Candy Crush still accounts for “78% of King Digital's $632 million in
gross bookings for the fourth quarter of 2013 and 67% of $641 million in gross bookings for the
first quarter of 2014” (Newman, 2014). This overdependence showed itself in 2014 when it was
highly publicized that King Digital saw smaller than expected earnings for the first time since its
rapid expansion and adjusted their projected earnings for quarter 3 of 2014 to reflect this change.
These changes warned investors of a possible ‘plateauing’ or declining of future earnings reports
to come if the company fails to have another hit within a short space of time. Although the
company’s report was far from being disappointing, showing revenues of 593.6 million and a net

ASBE 40TH Annual Conference
159
Memphis, TN, September 24-26, 2014
profit of $165.4 million for the second quarter of 2014, it is a trend which already cautious
investors saw as a sign and many dumped the stock, causing the stock value to drop (Mamiit,
2014). The decrease in interest also transferred to a decrease in overall bookings for the first time
since the Candy Crush mania began as shown in Graph 4 below. This illustrates the massive
increase in bookings for King Digital after the release of Candy Crush in comparison with
Zynga, which after its original rapid growth as shown in graph 1 is going through a period of
slow decline corresponding with the rise of King Digital.
Graph 4: King versus Zynga bookings over the 2009-2014 periods retrieved from
http://www.theguardian.com/technology/2014/aug/13/candy-crush-saga-king-zynga
Although there are many similarities between the two companies, there are also some
differences as well. Zynga had made most of its success by offering the Farmville game online

ASBE 40TH Annual Conference
160
Memphis, TN, September 24-26, 2014
on the Facebook site. But the company found itself at a point where there was a rapid transition
in the way people wanted to do gaming, which was via their mobile devices. The company was
unable to adjust their business design around this new revolution in gaming, causing them to
rapidly loose bookings. This issue arose at a time when the company’s main game was losing
interest, exacerbating the situation for the firm. Zynga’s slowness to react caused the company to
lose many customers to competitors’ offerings, which included Candy Crush. As explained
earlier in the business model section, it could be seen that King Digital had recognized this
change and focused itself on putting only the best games onto mobile devices, since the firm
would be charged by various vendors to do so. Zynga struggled to adjust to the new paradigm;
although they had a moderate success with Zynga poker, the company was still not achieving the
overall success needed to overcome the increase in interest in other games. The decline of
Zynga’s market value could also be attributed to a series of bad acquisitions the company made
to maintain its market share. First the company acquired the maker of WriteSomething a game
which seemed as though it was experiencing rapid growth similar to that of Angry Birds totaling
200 million (Tassi, 2012). After the acquisition, the company declined, losing 5 million daily
average users in just a month as shown below in Graph 5.

ASBE 40TH Annual Conference
161
Memphis, TN, September 24-26, 2014
Graph 5: Decrease in daily users for app Draw Something retrieved from:
http://www.forbes.com/sites/insertcoin/2012/05/04/draw-something-loses-5m-users-a-month-
after-zynga-purchase/
Zynga also acquired NaturalMotion, a U.K. based company for which it spent $527
million (Orland, 2014). This is another large acquisition that does not have the surety of
becoming successful. These acquisitions have had a negative effect on the Zynga’s market
value. This could serve as a warning to King Digital as to how to be cautious with the
acquisitions they make in the future.
Another difference between Zynga and King Digital Entertainment is the profitability of
the two companies. As noted by The Guardian’s Stuart Dredge, and by the company’s earnings
reports it could be seen that although before the IPO, Zynga become very profitable from years
2010 and 2011 (Dredge, 2014). Prior to and after these two years, the company did not maintain
a consistent level of profits. For 2012, Zynga reported quarterly earnings of negative $85, $22,

ASBE 40TH Annual Conference
162
Memphis, TN, September 24-26, 2014
$52 and $48 million, (Zynga Form S-1, 2011). In comparison, for the period of 2013, King
Digital had seen quarterly profits of $52, $125, $229 and $159 million. This rapid increase in
profits produced a graph (see graph 6 below) that shows a similar pattern as graph 4 above,
which depicts the companies’ comparison of new bookings.
Graph 6: King vs Zynga Quarterly Revenues 2010-2013 retrieved from:
http://www.theguardian.com/technology/2014/aug/13/candy-crush-saga-king-zynga
The high profits seen by King Digital over that of Zynga means the company has a lot
more options available for further expansion. Something that King Digital stated when they filed
the F1 documents is that, unlike other companies, which tend to have a reason to file for an IPO,
it did not have a clear financial reason for going public. King Digital stated that, “We have not
allocated any specific portion of the net proceeds to any particular purpose, and our management
will have the discretion to allocate the proceeds as it determines” (Levine, 2014). This means
that the high profits achieved by the company before and after the IPO in addition to funds raised
by investors could be used towards expanding research and development into other gaming

ASBE 40TH Annual Conference
163
Memphis, TN, September 24-26, 2014
types, expanding the mobile application portfolio, or towards making acquisitions that may be
advantageous to them in the future. This could be seen just recently in King Digital’s recent
conditional acquisition of the Singaporean firm NonStop games. Unlike Zynga’s acquisitions,
the end price is conditional on whether the company meets revenue goals over a 4 year period
(Tham, 2014). This would ensure that the company did not make the same mistake as Zynga
where executives from the acquired company are bought out and then King Digital could be left
with a failing game maker.
The similarities between the two firms are many but there are distinct differences as well
that have to be considered in determining whether the companies are similar enough that they
will follow similar paths and cause King Digital to see their market valuation fall. Since Zynga
has made some reported mistakes in their past it could possibly leave a blueprint for King Digital
so they could possibly learn from Zynga’s mistakes and be successful in the future.
Conclusion
As people become more interested in online and mobile games that they could play on
their everyday downtime and without the inconvenience of having additional devices; the trend
of an increasing amount of social gaming companies that gain rapid success is expected to
increase. Companies have taken advantage of this trend including: Zynga, Rosio and recently
King Digital who were able to leverage one or two successful, wildly popular games. King
Digital has attempted to differentiate itself from others who, after a largely successful game,
have failed to produce additional successful offerings. The question that is still evident for many
investors is, do these companies (and companies like them) represent good investment

ASBE 40TH Annual Conference
164
Memphis, TN, September 24-26, 2014
opportunities? And are these companies (and those like them) going to fail in the long run due to
their present low rate of sustainability?
King Digital has had success with Candy Crush Saga and has had other smaller successes
with games like Bubble Witch 2. With the money earned they have quickly started increasing
research and development and started acquiring more companies; which could help them to
continue to produce additional revenue sources that will enable them to avoid the same fate as
Zynga. Although the comparisons between the two companies are plentiful, there are some
distinct differences between the two, most importantly the amount of money they had at IPO
which could have a positive impact on their investment opportunities. As interest in Candy Crush
begins to fall, as evidenced by the Google Trends graph, a test of King Digital’s business model
is expected to come in the near future. Only then will investors know the true sustainability the
company has. With other social media gaming companies like Kabam and Supercell growing
quickly and speculating on filing an IPO, it is important to study the success level of current
public gaming companies and determine whether it is a good option for these companies as well
as for potential investors.

ASBE 40TH Annual Conference
165
Memphis, TN, September 24-26, 2014
References
Draw Something Loses 5M Users a Month After Zynga Purchase. (2012, May 4). Retrieved
September 2, 2014.from http://www.forbes.com/sites/insertcoin/2012/05/04/draw-
something-loses-5m-users-a-month-after-zynga-purchase/
Dredge, S. (2014, August 13). Peak Candy Crush? King's summer of 2014 could be Zynga's
summer of 2012. Retrieved September 2, 2014.
Garside, J. (2014, March 25). Who are the Candy Crush millionaires? Retrieved September 2,
2014, from http://www.theguardian.com/business/2014/mar/25/candy-crush-king-
flotation-king-entertainment-shareholder-windfalls
Investor Relations. (n.d.). Retrieved September 17, 2014, from
http://investor.king.com/investors/ir-home/default.aspx
Jacques, A. (2011). Play on, player: A look inside the social gaming phenomenon. Public
Relations Tactics, 18(3), 14.
King Digital Form F-1 Registration Statement. (2014, February 18). Retrieved September 2,
2014.
King Digital CEO on 'unique' business model. (2014, March 26). Retrieved September 2, 2014,
from http://video.cnbc.com/gallery/?video=3000261483#.
Levine, M. (2014, February 18). Candy Crush Doesn't Really Want Your Money but Will Take
It Anyway. Retrieved September 16, 2014.
Lynley, M. (2011, December 13). Here's The Stunning Fact That Could Derail The Biggest Tech
IPO Since Google. Retrieved September 16, 2014.
Mac, R. (2014, March 26). Sour Candy: Weak King.Com IPO Robs Chairman And CEO Of
Billionaire Status. Retrieved September 16, 2014.
Mamiit, A. (2014, August 13). 'Candy Crush' losing appeal, King Digital stocks suffer. Retrieved
September 16, 2014.
Nayak, M. (2014, March 26). Candy Crush maker King Digital shares sour in market debut.
Retrieved September 2, 2014, from http://www.reuters.com/article/2014/03/26/us-
kingdigital-ipo-idUSBREA2O1ZQ20140326
Newman, D. (2014, May 12). King Digital Can't Survive. Retrieved September 2, 2014, from
http://www.fool.com/investing/general/2014/05/12/king-digital-cant-survive.aspx

ASBE 40TH Annual Conference
166
Memphis, TN, September 24-26, 2014
Orland, K. (2014, January 30). Zynga spends $527 million on Clumsy Ninja maker amid heavy
job cuts. Retrieved September 2, 2014, from
http://arstechnica.com/gaming/2014/01/zynga-spends-527-million-on-clumsy-ninja-
maker-amid-heavy-job-cuts/
Our History. (n.d.). Retrieved September 2, 2014, from http://company.king.com/about-us/our-
history/
Peak Candy Crush? King's summer of 2014 could be Zynga's summer of 2012. (2014, August
13). Retrieved September 2, 2014 from
http://www.theguardian.com/technology/2014/aug/13/candy-crush-saga-king-zynga
Pepitone, J. (2011, December 16). Zynga stock opens at $11 in IPO. Retrieved September 2,
2014.
Quotes & Info- Yahoo! Finance. (2014, August 28). Retrieved September 2, 2014, from
http://finance.yahoo.com/q?d=t&s=ZNGA
Tassi, P. (2012, May 4). Draw Something Loses 5M Users a Month After Zynga Purchase.
Retrieved September 16, 2014.
Tham, I. (2014, August 13). Candy Crush maker King acquires Singapore games studio for up to
US$100m. Retrieved September 2, 2014, from
http://www.straitstimes.com/news/singapore/more-singapore-stories/story/candy-crush-
maker-king-acquires-singapore-games-studio-u
Thompson, A. (2014, February 19). King - Makers of Candy Crush - Made $1.9 b in 2013, Files
for IPO | TechFaster. Retrieved September 2, 2014, from
http://www.techfaster.com/candy-crush-ipo/
Yahoo. (2013, May 1). Number of active users at Facebook over the years. Retrieved September
2, 2014, from http://news.yahoo.com/number-active-users-facebook-over-
230449748.html
Zynga Inc Form S-1. (2011, July 1). Retrieved September 2, 2014.

ASBE 40TH Annual Conference
167
Memphis, TN, September 24-26, 2014
Encouraging Craft, Arts, and Micro Enterprises for Creative
Entrepreneurship and Innovative Business Growth
Christopher Ziemnowicz, University of North Carolina at Pembroke
Michael Menefee, University of North Carolina at Pembroke
Abstract
The craft, arts, and micro enterprises are broadly termed “creative industries” and operate
in many sectors. Often unrecognized for their contributions to the general economy, they are a
major source of creativity and employment. In contrast to the typical focus on concentrated
industrial mass production by large corporations, this paper examines the widely distributed
work of micro enterprises. These entrepreneurial businesses also play an important role in the
transition to the innovation-based economy. This article reviews these endeavors, examines
policies adopted by the European Union, and uses the Polish Craft Association as a model
advocacy organization. Successful examples in the United States, as well as suggested
government policies, are presented. The steps taken within Europe toward this sector, together
with the achievements to promote micro enterprises and entrepreneurship, may serve as ideas for
implementation in the United States. These would stimulate innovation and benefit the
economically depressed areas enhancing not only traditional crafts and arts skills, but also for
their development and enriching the overall quality of life.
Introduction
The craft, arts, and micro enterprises make up a diverse array of endeavors and they are
typically unrecognized for their contributions to the general economy. They compose what is
broadly termed “creative industries” because of their entrepreneurial character and innovative
contributions. They are typically very small businesses that are run by self-employed people.

ASBE 40TH Annual Conference
168
Memphis, TN, September 24-26, 2014
They provide job opportunities within their local business areas, but their market impact may be
much larger. In some cases, they are the basis for the traditional culturally significant richness
that have made locally produced crafts and artisans important not only to specific regions, but
also to build renown across the world. On the other hand, some of them are becoming almost
irrelevant in the growing demand for lower-priced, efficiently mass produced disposable
products that are generated by the ever expanding and global-focused, large corporate-led
marketplace. Nevertheless, the craft, arts, and micro enterprises provide both significant direct
and indirect economic benefits within their local economies. They also bring about other
advantages that include significant entrepreneurship and employment prospects, as well as long-
term sustainable business operations. Moreover, they infuse innovation within other
organizations, which helps to further improve the quality of life in local communities. Lastly, the
craft, arts, and micro enterprises should be encouraged to continue their historical role in
building regional and even national identities.
The typical focus of academic research is on mass industrial production conducted by
large corporations, but this article examines the arts, crafts, and culture-related industries that are
conducted by micro enterprises. These businesses play not only an important role in the
economy, but also for long-term business sustainability, as well as in the transition to the more
innovation-based economy. This article reviews the state of craft and arts enterprises in the
European Union, examines some of the policies adopted by the European Commission, uses a
case study of the Polish Craft Association as an advocacy organization, and concludes with some
suggestions, as well as successful applications in the United States. Initiatives already taken
within Europe toward this sector, together with the achievements already witnessed, may serve
as a basis for further implementation by in the United States at all levels of government and most

ASBE 40TH Annual Conference
169
Memphis, TN, September 24-26, 2014
importantly, through local leaders. Not only could some of these ideas and policies benefit
economically depressed areas by increasing the influence where traditional crafts and arts skills
exist, but also for providing a level-playing field for micro enterprise development and their
continued success.
Traditional arts and handicraft in the modern age
The broad definition of creative industries include enterprisers in the arts and crafts
markets, design, architecture, fashion, media and advertising services, software development, the
performing arts, publishing, music, movies and TV (Parkman et al., 2012). However, it is more
common in the United States to take a narrower perspective that encompasses only the artistic-
type businesses, and typically excludes the other creative industries, such as software developers
and designers. One problem is that the individuals in creative industries are an example where
lifestyle of an entrepreneur is more important than pure business objectives (Chaston, 2008).
Nevertheless, empirical evidence suggests that creative entrepreneurs exhibit diverse orientations
(Tregaer, 2003, Chaston, 2008)
The practice of arts and crafts, or more precisely, artisanal handicraft, consists of a broad
range of types of work to make practical and decorative products, customarily by hand or basic
tools. The critical distinction is of individual artisanship, in contrast to items made by mass
production or by machines. Handcrafting began in ancient civilizations to provide the material-
goods necessities. Some specific crafts have been practiced for centuries, while others are
modern inventions, or popularizations of crafts that were originally practiced in a limited
geographic area. Many handcrafters use natural, even entirely indigenous, materials. However,

ASBE 40TH Annual Conference
170
Memphis, TN, September 24-26, 2014
some may prefer to use modern, non-traditional, and even industrial materials. A recent trend has
been to repurpose various materials, and even scrap, into innovative and practical applications.
Two major issues include the changing cultural exposure to the traditional arts and crafts,
as well as the major reduction in personal experience using handwork to individually make
various projects. Simply put, contemporary consumers may not have had little experience to
actually make anything from scratch, nor even practice the creativity needed to perform such
tasks. An example is the modern acculturation of children. Although undemanding “arts and
crafts” activities and projects continue to be a common activity within many elementary and
middle schools, the trend around the world is for children to use electronic technology-enabled
engagement, as well as purchasing ready-made mass-manufactured products.
A few nations still actively promote various advanced handicrafts within their primary
schools. In some, these form a part of the required curriculum. The reasons for continuing them
include the obvious: offering students the experience working with a variety of local-sourced
materials. More importantly, handicrafts help develop students’ practical skills and dexterity.
Accomplishing these projects allows for practicing creativity at an early age. Making things
themselves requires young pupils put into practice problem-solving abilities. Working with
actual materials expands their knowledge of the matter they have at hand, the specific tools and
skills needed for the tasks with it, as well as gauge or expand their own abilities to perform.
Moreover, an early introduction to traditional folk crafts develops and enhances understanding of
their regional culture and environment, as well as a general heightened awareness and
appreciation for artisanal handicraft.
Budgetary constraints facing many primary school systems have been combined with an
increasing emphasis on standardized student evaluations. This means reduced emphasis on

ASBE 40TH Annual Conference
171
Memphis, TN, September 24-26, 2014
practice with handicraft projects. At institutions of higher education, some art departments
provide crafts and regional folk studies, in addition to the traditional fine arts academic
programs. In the commercial sector, contemporary professional artists sometimes blend classic
art techniques with a mixture of various traditional folk crafts. Nevertheless, the trend to reduce
direct involvement with individuals making things themselves is obvious. Moreover, improving
living standards seem to stress the apparently greater efficiency of mass-production and the
conveniences that are available through mass-consumption and disposability. This is in sharp
contrast to traditional individual production of consumer goods (such as food and clothing) that
focus on timeless quality or styles. Likewise, the high-cost time-consuming artisanal handicraft
(such as furniture) is primarily designed to provide long-life and heirloom-like qualities.
The challenge to artisanal handicraft by mass production is not a new phenomenon. The
original Arts and Crafts Movement that spread from the British Isles and flourished in the second
half of the 1800s was more than an attempt to preserve elements of traditional art and culture. It
was also a political movement that sought “new principles for living and working” that promoted
“the reform of art” in conjunction with a concern for the conditions of working people in general,
and the preservation of freedoms for artisans in particular. The movement became popular across
Europe, as well as in Japan and the United States. The contemporary environment is again
witnessing the overwhelming influence of mass production over individual handicraft.
“Fundamentally, our society is not geared towards the arts and crafts anymore. Technology,
industry and science have taken precedence over arts, and without the monetary support it is not
financially feasible to make a living from a craft, which has led to the situation in which the
word ‘craft’ or ‘craftsman’ is subsumed to hobbyist – a recreational pursuit that it is good for the
soul, but not much else” (Richards, 2013).

ASBE 40TH Annual Conference
172
Memphis, TN, September 24-26, 2014
A Short History and Potential Changes
Production of large amounts of standardized products is not a new phenomenon, and
examples predate the Industrial Revolution Era. What has changed is that modern mass
production methods cover almost all products as a method of focusing on efficiency and
consolidation for cost minimization. This is the exact opposite the traditional emphasis on high-
quality craftwork and widely distributed production. Concerns have been voiced during several
periods in history about the loss of skills necessary in the arts and crafts, as well as the
disappearance of individual creativity in the production of goods. Globalization itself encourages
an increasingly homogenized and industrialized mass-production of products. An example of
alarm with this trend was while England was undergoing rapid industrialization during the late-
19th century. The latest technology, machinery, as well as large-scale, assembly-line factories in
which low-paid and mostly unskilled workers toiled, were rapidly replacing the well-honed skills
of master craftspeople. Production of standardized products, using efficient and highly
concentrated assembly lines, is central to modern economics. Yet, people questioned the shift
towards industrial-scale production, as well as the effect this had on the workers in the highly
degraded environment in and around the early factories in which this mass assembly took place.
These concerns gave rise to the Art and Crafts Movement during the second half of the 1800s.
The Art and Crafts Movement originated and fully evolved in England. It was a reaction
to the Industrial Revolution, and to the declining state of the traditional arts and crafts at that
time. The objective of the Movement was to help preserve traditional skills and support the
small-scale creation of goods. The Movement spread across Europe and to North America.
Essentially anti-industrial, the focus was on promoting long-established craftsmanship for

ASBE 40TH Annual Conference
173
Memphis, TN, September 24-26, 2014
making products that incorporated simple designs and forms with primarily folk styles of
decoration. The Movement also advocated economic and social reforms.
Our contemporary technological and globalized environment now represents similar
conditions that had led to the Art and Crafts Movement. Globalization and profit maximization
encourages outsourcing production to the lowest cost mass-manufacturing facilities. Ever
increasing competitive pressures drive businesses to lower prices throughout their activities.
Managers seek to streamline all aspects of their value chain activities. This includes decisions to
manufacture where economies of scale, reducing material use, and easing quality standards may
lead to superior financial rewards. The competitive environment in almost all market segments
tends to increase efficiency, as well as increases in perceived standards of living for many
consumers. On the other hand, over-reliance on cost containment can cause the opposite effect.
Numerous examples of product failures, such as Toyota’s accelerator problems or the dangerous
ingredients that were used to supplement the pet foods made in China, serve to highlight the
problems of concentrated outsourced mass production and cost-cutting pressures. Perhaps
because of its global influence, the strategy of manufacturing products in low-cost areas places
such as China is itself becoming the subject of growing resentment. Large corporations need
become more careful of an overreliance on single source production, at the same time as
individual consumers are increasingly looking for alternative and locally made products
(Ziemnowicz and Menefee, 2014).
There is a growing awareness regarding issues of sustainability, as well as the
consequences of mass production. Even in a global context, continual reliance on low-cost labor
or less restrictive regulations, such as those found in China, appears to be unsustainable in the
long run. Another example toward sustainability and smaller production methods is the evolving

ASBE 40TH Annual Conference
174
Memphis, TN, September 24-26, 2014
trend towards local sourcing of agricultural products. Some consumer shopping patterns have
shifted, and this has also become one of the top concerns in the restaurant and grocery industries.
Although not a revival of the historic Art and Crafts Movement, these changes in buyer
behaviors have created opportunities for local-based craftsmanship, especially within micro
enterprises, as well as among small and medium sized businesses (Ziemnowicz and Menefee,
2014).
The question is how to assist and encourage arts, crafts, and creative enterprises during
ever increasing globalization and consolidation of production. The simplest solution to stem the
disappearance of crafts is to call for the establishment of programs and subsidies that would
assist and promote craft. Other responses include expanding education for all, starting at an early
age, into these areas in general. Expanding apprenticeship programs and strengthening the
system of professional certification will also enhance skill levels. However, unless there is a
major shift in social and economic restructuring among consumers, there do not appear to be
viable career options for craftspeople. Skilled artisans were once the powerful, trusted, and
highly respected individuals in every community. They were able to work with natural and
locally derived materials to create things of function and beauty. Nevertheless, times have
changed and the production efficiencies that are characteristic of multinational enterprises are
difficult to resist for consumers with limited purchasing power. Many consumers around the
world have shunned the local arts and crafts with distinctive cultural influences in favor of mass-
produced and global-branded products that are most often made at the lowest possible cost
(Ziemnowicz and Menefee, 2014).
Today’s society seems to favor the money that is offered by working for corporations.
Artistic and craftwork has become almost a hobby pursuit. Some creative endeavors are based

ASBE 40TH Annual Conference
175
Memphis, TN, September 24-26, 2014
more on the owner’s lifestyle desires than on pure business objectives. People with the
handcrafting skills to create may no longer be able to exchange their goods for a fair wage to
support their endeavors. There have been examples of disillusionment with the current economic
and social system. These include the anti-globalization, 99-percent, and Occupy Movements.
This portends some support for expanding local and regional craftsmanship efforts (Ziemnowicz
and Menefee, 2014).
Recent reports are encouraging because they document that promoting craft enterprises
offers significant social benefits. Manufacturing is “the first cousin of craftsmanship” and that
newly developed centers that incorporate arts, crafts, and other micro enterprises “spawns
innovation, brings down trade deficit, strengthens the dollar, generates jobs, and kindles a
recovery from recession” (Sparks and Waits, 2013; Hayter and Pierce, 2009). These centers
serve as regional magnets for development by attracting people and new investment.
Craft and Micro Enterprises in Europe
Craft enterprises provide a wide range of vital products and services at local level. Many
are very small firms, with often only the owner involved. Micro enterprises, of which most are
craft-type firms, face particular challenges due to their small scale. Because they compose a
major segment of the European economy, they are studied in Europe and efforts are made to
provide them with assistance. European governments and the European Union Commission
consider them essential for overall economic stability and growth.
Craft enterprises cover a broad array of endeavors, such as carpenters, butchers, bakers,
roofers, metal workers, and information technicians. They provide vital products and services for
their local communities throughout Europe. Moreover, they create local jobs for local people. In

ASBE 40TH Annual Conference
176
Memphis, TN, September 24-26, 2014
contrast to larger firms, the management of such enterprises is fully involved in all aspects of the
business and remains in direct contact with customers. Micro enterprises cover an even wider
range of business activities and share many of the difficulties that confront the firms in the craft
sector, although broad range of business activities mean they could be operating in almost any
industrial sector. They are distributed across all regions and are found in urban and rural areas.
While over 99 percent of all enterprises in Europe are small and medium sized enterprises
(SMEs), 90 percent of them are actually micro enterprises. Most have fewer than ten employees -
and the average company has just five workers. However, these micro enterprises account for 53
percent of all jobs in Europe, so their importance to the European economy is significant (EU
Commission, 2008).
Their small size and limited resources mean micro enterprises face unique challenges. It
is difficult to finance a new business, or to grow an existing one. The administrative tasks, or red
tape, that all companies face are particularly burdensome on the micro enterprises. Moreover,
finding staff with the right skills and willing to work for a small firm can be a problem.
Likewise, a hurdle is ensuring they have the time to update their skills and keep up with
developments in their field. While micro enterprises are very often the source of innovation, they
are also especially vulnerable to competition from their equally entrepreneurial counterparts that
introduce new products or services, or improve their processes. In most cases, the micro
enterprises lack the resources needed to respond rapidly to changing conditions. Moreover,
increasing the marketing and promotional campaigns for the traditional arts handicrafts is
unlikely to overcome their unique challenges, nor improve their long-term business viability.

ASBE 40TH Annual Conference
177
Memphis, TN, September 24-26, 2014
Common characteristics
Starting back from the medieval times, craftsmen tended to form associations based on
their trades. Each of these guilds controlled their traditionally imparted technology and arts
related to their crafts. Guilds have experienced a revival in Europe as local organizations for
craftsmen, primarily in traditional skills and trades. They function as forums for developing
competence and may serve as local units of a national employer’s organization. However, while
there is a European SME definition, there is no European definition for craft enterprises. This is
mainly due to the very different legal or non-legal aspects and definitions at the national level of
what constitutes a craft enterprise. Although undefined in official documents, the following are
four characteristics that most craft enterprises have in common across Europe, and they also
reflect the vast majority of micro enterprises: (EU Commission, 2008)
• Strong involvement in all steps of the operations or workflow by the entrepreneur, owner, or
head of the enterprise. This includes the goals of financial independence and the characteristic
of a strong personal responsibility.
• Emphasis is on the organization’s craft, technical, and management competences, as well as
using them as a differential competitive advantage. An example is apprenticeship that is seen
as a means of passing on those specialized abilities.
• Active value-added contributions take place in the production of their products and services.
This is particularly important in tailor-made and single-size-products, or prepared in small
quantities.
• Close proximity with their clients is the norm, as well as a pattern of significant involvement in
local activities.

ASBE 40TH Annual Conference
178
Memphis, TN, September 24-26, 2014
European Union Commission Support
The European Commission has official objectives for the promotion of entrepreneurship
and improving the business environment to realize full potential in the global economy. The
Commission also attempts to help and encourage its member nations to identify and implement
measures in support of craft, arts, and micro enterprises. Four directives have been established
accomplish this: (EU Commission, 2008)
• Increasing the knowledge of the sector through research studies, conferences, and workshops,
as well as by the collection of the necessary data and statistics to facilitate decision-making.
• Identifying the obstacles to helping achieving sustainable development of these enterprises,
and to prepare proposals or legislation to address issues of sustainability.
• Enhancing craft and small businesses’ capacities for growth in their markets, such as by SME-
friendly European standards and public dissemination about these standards, easier and
improved access to public procurement opportunities, or the promotion of innovation and
research in micro- and craft businesses through various forms of cooperation and partnerships
with universities and other institutions.
• Promoting a more favorable business environment for craft and small enterprises through
quality support services, better legal and fiscal environment, social protection of new
entrepreneurs, etc.
Skills needs in small enterprises
Micro and craft type enterprises make up not only the vast majority of SMEs in Europe,
but are also the main source of job creation in the European Union (Gamme, Siem, and
Lodguard, 2013). They are active in traditional professions that are essential for prosperity and
well being of both urban and rural areas. However, these firms are acutely affected by skilled

ASBE 40TH Annual Conference
179
Memphis, TN, September 24-26, 2014
labor shortages. Thus, many micro and craft enterprises face recruitment difficulties. This is
primarily caused by a shortage of skilled labor as a consequence of demographic trends. The
craft, arts, and micro businesses also appear to be less attractive employers, especially to young
people. They do not offer the career growth potential as within large corporations. Recruitment
policies of small businesses and specific skill profiles will need to be adjusted to attract new
target audience and to provide them with the most desired skills and qualifications.
The European Commission has developed initiatives to identify future skills needs. This
started with a future skills needs study for micro- and craft-type enterprises that was taken from
the point of view of enterprises, business organizations, and training institutes. It was conducted
in eight countries (Austria, Bulgaria, Denmark, France, Germany, Italy, Poland, and the United
Kingdom) focusing on the three sectors (construction, food, and personal/health services). While
there were different perspectives expressed by companies, business organizations, training
institutions, in many cases their perspectives overlap. Though there was already a general
increase in skill needs over the recent past, the requirements at small enterprises are expected to
increase even further into the future. The most desired skills are those combining work processes
and market activities, together with organizational skills and technical/legal skills. All of these
require continuing vocational education. Improved communication and personal skills are
increasing as well, but these are not yet seen as critical. The study identified actions needed by
the EU to forecast expertise needs, as well as to have systematic training programs that benefit
small enterprises.
Future skill needs are important, and planning for developing a prepared workforce is
critical for survival and business sustainability. Large corporations know this requirement and its
relevance. There is a general consensus that approaches that are more systematic would be

ASBE 40TH Annual Conference
180
Memphis, TN, September 24-26, 2014
useful. However, this is often not reflected within small enterprises. Small company activities in
this area are mainly spontaneous, often conducted in reaction to customer or employee demands,
as well as being guided by personal assumptions. Typically, small enterprises have direct contact
and get information from the marketplace. Strategic planning is not characteristic for them in the
human resources area. They either cope with workforce skills they demand internally on an as
needed basis, or by working in cooperative networks with others.
The European Commission’s DG Enterprise and Industry report inventoried the current
situation and extrapolated broad types of future skills that will be demanded. The objective was
to develop ideas and proposals for assisting small businesses. The study identified the following
overall skill needs as increasing in the future: customer and market orientation, working in
cooperative and collaborative international work structures, and management skills. The top
three skill needs that already increased the most and expected to be ongoing into the future were:
1 - Customer service communication: 80 percent
2 - Developing new services and broaden the range of offered products: 78 percent
3 - Analyzing known tasks: 77 percent
The top three emerging skills needs as measured by the difference between past and
future increases included:
1 - Developing knowledge about foreign markets: 35 percent
2 - Communicating with customers and employees in foreign language: 28 percent
3 - Securing own innovations and patents: 25 percent
There is a consensus among the three perspectives (companies, business organizations,
and training institutes) on the need to increase skill levels in the future, though there were
varying degrees of emphasis on different skills. Companies and business organizations highly
ASBE 40TH Annual Conference
181
Memphis, TN, September 24-26, 2014
rate skills related to core work processes and management aspects. Business organizations tend
to highlight work organization skills. Training institutions placed a greater emphasis on personal
skills.
Moreover, the company perspective on future skill needs is most often business sector-
specific. For example, interior construction firms give prominence to the alignment of work
processes with regulations and standards, as well as with customer demands. On the other hand,
the food sector highlights the skills needed to meet customer requirements, as well as integrating
the managerial aspects of work. The personal and health services sector highly ranks integrative
management aspects and customer orientation skills. Future skill needs within a particular
business sector are closely linked to the sector’s key factors in driving change. A comparison of
the evolution of skill needs between the recent past and the coming few years shows common
trends transgressing sector boundaries. A major finding was that orientation toward foreign
markets is driving skill needs in all the sectors. This is most likely the result of companies
needing language skills for analyzing foreign markets and communicating with an expanding
base of customers and foreign partners.
The result was EU-level policy initiatives aimed at anticipating and matching labor
market supply and skill demand, identifying skill needs and mismatches, as well as strengthening
the links between craft and vocational programs with the labor market. This included making
education and training more available to employers and employees alike throughout their entire
professional lifetimes. The EU developed an “Agenda for new skills and jobs” and implemented
the Small Business Act for Europe. The findings in the area of skill development within small
enterprises also contributed to the “Europe 2020” economic and employment strategy, as well as
to the EU’s overall orientation towards smart, sustainable, and inclusive growth.

ASBE 40TH Annual Conference
182
Memphis, TN, September 24-26, 2014
Increased global competition, the transition to a knowledge-based society, as well as
rapidly changing technology, have transformed all aspects within small firms. Survival means
having people with different occupational skills, with specific job profiles, and with more
medium- and high-level qualifications. This requires continual updating of skills and
professional competences. One way is through apprentice exchange programs to gain experience
and new ways of doing things in another European nation. Small enterprises can benefit from the
mobility actions available under the EU’s Leonardo de Vinci program.
Encouraging craft and micro businesses
The European Commission has anchored a “Think Small First” principle in its policy-
making. This represents a major shift from focusing on large enterprises and concentrated mass
production. It is also an attempt to counter the power and influence of large corporations.
The “Think Small First” principle is applied in all EU activities: from regulation to public
service. An ambitious policy agenda included the “Small Business Act” for Europe. It has ten
principles to help guide the conception and implementation of policies at the EU level, as well as
within each member country. Primary objectives include creating a level playing field for small
enterprises, as well as to improve the legal and administrative environment throughout the EU to
facilitate their creation and continued growth. The ten principles are: (EU Commission, 2008)
• Create an environment in which entrepreneurs and family businesses can thrive and
entrepreneurship is rewarded.
• Ensure that honest entrepreneurs who have faced bankruptcy quickly get a second chance.
• Design rules and regulations according to the “Think Small First” principle.
• Make public administrations responsive to SME needs.

ASBE 40TH Annual Conference
183
Memphis, TN, September 24-26, 2014
• Adapt public policy tools to small business needs: facilitate their participation in public
procurement and use financing assistance or benefit from any available subsidies.
• Facilitate access to finance and develop a legal and business environment supportive to timely
payments in commercial transactions.
• Help small enterprises benefit from the opportunities offered by the European single market.
• Promote the upgrading of skills within small enterprises and in all forms of innovation.
• Enable SMEs turn environmental challenges into opportunities.
• Encourage and support SMEs to benefit from the growth of markets.
The Polish Craft Association
An example of the efforts to organize craft, arts, and micro enterprises is the Polish Craft
Association (Zwiazek Rzemiosla Polskiego - ZRP). It is a nationwide, social, and professional
organization that was established in 1933. The ZRP has evolved into an officially recognized
representative employers’ organization. It consists of 27 regional craft chambers, 479 craft
guilds, and 222 cooperatives, thus making it the largest and oldest economic self-government
structure in Poland. The ZRP unites about 300,000 micro-, small-, and medium-sized enterprises
in Poland. It is a trade association that represents the interests of these enterprises to various
governmental, administrative, and regulatory bodies, as well as in the courts and in various
social-economic organizations in Poland.
The official goals of the Polish Craft Association include: (ZRP, 2014)
• Represent the craft community towards government bodies, public administration, courts,
and socio-economic organizations in Poland and abroad (especially in the European Union).

ASBE 40TH Annual Conference
184
Memphis, TN, September 24-26, 2014
• Initiate and develop socio-professional, economic and social activities to maintain integrity
of the craft community.
• Provide associated organizations with comprehensive assistance.
• Inspire and work out legal solutions pertaining to crafts and SMEs.
• Coordinate activities concerning the vocational education.
• Disseminate ethical standards in professional practice.
• Popularize achievements of the Polish crafts and SMEs.
• Undertake activities aimed at preparing SMEs and their organizations to functioning within
the European Single Market.
As the employers’ organization representing the SME sector, the ZRP is a member of the
Tripartite Commission for Social and Economic. This commission is comprised of national
government officials, as well as representatives of the largest employers, organizations, and trade
unions. Membership allows the ZRP to have a voice and an opportunity to contribute ideas and
opinions on legislation in economic and social policy: taxes, government budget, labor market,
EU structural funds, as well as salaries and social benefits. The ZRP is also active abroad, with a
particular focus on the European Union. The ZRP lobbies for Polish employers in the European
Union of Craft, Small, and Medium Enterprises (UEAPME), the International Labor
Organization (ILO), and the European Commission.
Poland’s EU membership, along with increasing globalization in economic, social, and
political spheres, represents competitive challenges for the nation, as well as for its indigenous
small businesses and craftspeople in particular. For example, many European agricultural and
tourism enterprises are small and they need revitalization to a craft focus. This would help

ASBE 40TH Annual Conference
185
Memphis, TN, September 24-26, 2014
differentiate or reposition their products and services to be more specialized within the more
competitive European market.
One of its most important tasks is teaching in the craft and trade professions, as well as
infusing safety and environment protection. The ZRP provides a wide range of apprenticeship
and training programs that include the standard, as well as unusual occupations. The ZRP’s
member employers-craftsmen train over 92,000 students in 113 specific occupations. Successful
completion of an apprentice or training programs includes a document certifying the individual’s
craft or occupation. The ZRP also promotes safety and conducts research or coordinates with
institutions dealing with these issues, such as the Polish National Labor Inspectorate and the
Central Institute for Labor Protection. Another important function is promotion of occupational
safety and health protection principles. These include nationwide contests on the principles of
health and safety for young people. An area of need for micro enterprises is in environmental
protection. Comprehensive activities in this area include how environmental protection improves
their competitiveness.
In summary, the ZRP is an effective organization that focuses on promotion, as well as
ensuring professionalism and the sustainability of craft enterprises in Poland and in the European
Union (Ziemnowicz and Romaniuk, 2014).
Examples in the United States
The National Governors Association (NGA) Center for Best Practices has published
extensive reports stating the arts and culture are important to state economies (Sparks and Waits,
2013; Hayter and Pierce, 2009). In its role to develop innovative solutions to today’s most
pressing public policy challenges, the NGA’s conclusion was that “arts and culture-related
ASBE 40TH Annual Conference
186
Memphis, TN, September 24-26, 2014
industries, also known as ‘creative industries,’ provide direct economic benefits to states and
communities: They create jobs, attract investments, generate tax revenues, and stimulate local
economies through tourism and consumer purchases” (Sparks and Waits, 2013; Hayter and
Pierce, 2009). The NGA Center’s research and development serves the 50 U.S. state governors
and concluded, these “industries also provide an array of other benefits, such as infusing other
industries with creative insight for their products and services and preparing workers to
participate in the contemporary workforce. In addition, because they enhance quality of life, the
arts and culture are an important complement to community development, enriching local
amenities and attracting young professionals to an area” (Sparks and Waits, 2013; Hayter and
Pierce, 2009)
The influence of large corporations on decision-makers at all levels of government is well
known, but the micro enterprises do not have the same access during policy making. The NGA
notes the importance of the cultural and artisanal sector in the local economy. They are widely
distributed, improve the overall quality of life, enrich the local economy, and contribute to
further business sustainability. In short, they are described as the “New Engines for Growth”
(Sparks and Waits, 2012).
These centers of craftsmanship are designed to attract a critical mass of creative talent
and facilitate clustering of complementary enterprises. Numerous studies indicate that the
presence of creative enterprises, with artistic and cultural related endeavors in particular,
contribute to the local economy in two ways. The most significant is that their presence and
activities serve as focal points within the area for cultural and business activity to take place.
Secondly, they serve as a magnet for other entrepreneurs and enterprises wanting to capitalize on
the existing innovation clustering, thus further enhancing the creative ecosystem. Comprehensive
ASBE 40TH Annual Conference
187
Memphis, TN, September 24-26, 2014
programs provide opportunities for effective arts, crafts, and micro enterprise sustainability, not a
focus on single solutions such as reducing taxes. Entrepreneurs and micro enterprises respond to
market demands for their products and services, and not directly to the taxable rates in a given
area.
The NGA’s suggested policies have been proven to be effective in fostering creative
entrepreneurship and innovative business growth. The following are brief examples of two
successful clusters for arts, crafts, and micro enterprises in the United States.
The Tamarack Center in West Virginia
Tamarack, or as it is also called “The Best of West Virginia” serves as an example of
developing a hub driven by regional craftspeople and artisans that has firmly established itself as
a tourist destination (Tamarak, 2014). Located in Beckley, WV, along the West Virginia
Turnpike, this large arts and crafts facility attracts over 500,000 visitors annually. The West
Virginia Parkways Authority operates it as an economic development project, but no tolls are
used to support it. The regional attraction has multiple use facilities. It focuses on marketing
West Virginia craft products that include wood, glass, textiles, pottery, metal, jewelry, fine art,
books, recordings, and specialty food items. There are also resident artisan studios, craft
demonstrations, food tastings, book signings, live performances, as well as numerous public and
private special events. A 2009 study conducted by Marshall University showed that Tamarack
contributed $18.6 million to the state’s economy from its $5.9 million income and 236 jobs
during the 2008 fiscal year (Marshall, 2008). However, the center’s indirect economic impacts
were not included. The study identified Tamarack’s economic impact extends into every West
Virginia county by way of income and jobs. This is because of the widely dispersed production
of the handcrafted products and artwork it markets, as well as through the live performances that

ASBE 40TH Annual Conference
188
Memphis, TN, September 24-26, 2014
are supported by Tamarack. In summary, this innovative concept facilitates and enhances the
contributions artisans make to economic development, as well as making possible a creative
workforce where micro enterprises and entrepreneurs in the arts and crafts are just as important
as traditional corporations to the economy of West Virginia. (Stanton, 2009)
The Pottery Highway in North Carolina
The Piedmont region of North Carolina is at the base of the oldest mountain range in the
and the sediment that washed into the valley has been became the ideal raw material for potters.
Native Americans were first to develop this resource for functional and ceremonial products.
This continues as clay is made into decorative items as well as traditional functional food storage
containers. Because of this natural resource, numerous potters have clustered along the “Pottery
Highway” that straddles two counties (Soboeir). Some have been operating at the same location
since the mid-1800s, while new artisans have moved into the area more recently to capitalize on
the visitor traffic in search of clay products. The concentration of these handmade products along
the highway has become a major tourist attraction for North Carolina. Moreover, because their
products are unique, potters do not to see each other as competitors. Their distinct products and
designs fill different niches and this increases visitors and sales.
The potters began to work together during the mid-1950s to promote the area, produce
exhibitions, and hand out the first area-wide pottery maps. The Seagrove Area Potters
Association was established and it now has an Internet presence (Seagrove Area Potters
Association). This craft industry is one of the oldest and most valuable traditions in the region,
but his specific economic impact of the Pottery Highway is difficult to calculate. A proxy for the
increasing demand is the North Carolina North Carolina Pottery Center that opened in 1998.
Located in Seagrove, NC, along the “Pottery Highway,” it is the only statewide facility in the

ASBE 40TH Annual Conference
189
Memphis, TN, September 24-26, 2014
nation devoted solely to pottery. It promotes public awareness and appreciation of the history,
heritage, and ongoing tradition of pottery making in the state. This center represents over 1,000
potters in North Carolina, as well as conducts research and documentation, educational
programs, and preservation from historic Native American to contemporary pieces (North
Carolina Pottery Center, 2014).
Lessons to apply
The easiest answer to slow the disappearance of traditional arts handicraft is to provide
more resources for marketing and promotional campaigns. This may have the effect of
stimulating increased purchases, but this spending will not solve the need for long-term
employment and business sustainability for craft, arts, and micro enterprises. Education and
apprentice programs may help to continue the traditional craft professions, but there is no
guarantee if these individuals can make a living with their skills. It may be a very noble goal to
creating more traditionally skilled people. However, the question remains if there is any work or
good job opportunities for them. Many crafts and arts have become more of a hobby pursuit than
a career. Solving this issue may require a restructuring of social and economic relationships, as
well as a generally more knowledgeable and appreciative society with purchasing power so that
people with a traditional handicraft or creative skills can create and exchange goods for a fair
wage.
The European Union has taken steps to evaluate the creative industry sector and to
identify the opportunities and threats. A number of steps have already been taken by the EU to
encourage the development of craft and micro type enterprises. Among the lessons is the need to
enhance workforce skill development and thus the viability of these enterprises. Other

ASBE 40TH Annual Conference
190
Memphis, TN, September 24-26, 2014
enhancements seek to provide the equivalent of developing dynamic creative industry clusters.
There is a need to integrate entrepreneurship into the craft, art, and apprentice programs, as well
as offering small business development training for individuals and micro enterprises engaged in
the creative fields. Established or mature industries, such as agriculture and tourism, need to be
revitalized with a craft focus and to help reposition their products and services as their markets
become more competitive.
The Polish Craft Association is a good example of a comprehensive effort to promote
crafts. Not only to lobby a broad range of venues and powerful groups, but also to serve as an
effective organization that focuses on professionalism and the sustainability of all craft and trade
enterprises. This is just one activity in helping to preserve and to ensure sustainability of craft
enterprises and traditional handicrafts within a technology focused and globalized marketplace.
The examples from the United States show positive results from policies that assist
development and marketing of local creative districts or centers of regional craftsmanship. The
presence and wide range of cultural activities that are conducted by them serve as a magnet for
tourists and other business activities. Other entrepreneurs and enterprises piggyback on this
creativity and innovation ecosystem.
The skill needs needed by the micro and craft enterprises remain as critical factors for
continued success. A greater focus needs to be placed on development efforts to encourage arts
and crafts in the education system, particularly in the primary school systems. The creative skills
that children can develop at an early age will serve them later in life. Innovation and creativity
are increasingly a prerequisite for good jobs, business success, and sustainable economic
prosperity.

ASBE 40TH Annual Conference
191
Memphis, TN, September 24-26, 2014
This overview illustrates some of the steps the EU has taken to encourage crafts and
micro enterprises to innovate and develop. Poland has a long-standing national lobby to promote
and develop the craft and trade sectors. Leaders in the United States, as well as local authorities,
should develop further strategies and appropriate initiatives to make small creative enterprises an
effective and sustainable industry sector. Examples would include early exposure within the
school curriculum, apprentice programs, upgrading skills, as well as enhancing the
entrepreneurial activity and the overall quality of life. More than focusing on capturing large
corporations, this would form a broader-based and vibrant component within a region’s overall
economic growth agenda.
Conclusions
There are numerous options to expand and strengthen the role and viability of craft, arts,
and micro enterprises. These businesses face daunting challenges and are not able to simply
overcome the problems themselves. Government officials at all levels should observe what is
happening in Europe to support entrepreneurship and facilitate craft, arts, and micro businesses.
Leaders in the United States should establish policies that level the playing field for these
entrepreneurs and creative enterprises. There is a disparity gap faced by small business,
compared to the influence of large corporations. West Virginia’s Tamarack Center and the North
Carolina Pottery Center are examples of the states providing places to promote and sell their
crafts. Providing an outlet for sales is definitely a step in the right direction, but more should be
done in the United States to help artists and crafts people provide for a living for themselves and
their employees, as well as to preserve the arts and crafts traditions within future generations.

ASBE 40TH Annual Conference
192
Memphis, TN, September 24-26, 2014
Further research is required to explore how craft, arts, and micro enterprises can be
benefit from the types of policies adopted in Europe, as well as what new techniques that will
work in the United States. Government units at all levels, together with leaders in all areas,
should recognize the importance of this sector in the economy and expand their efforts to find
ways to assist craft, arts, and micro enterprises profit with creative entrepreneurship and
innovative business growth.

ASBE 40TH Annual Conference
193
Memphis, TN, September 24-26, 2014
References
Chaston, Ian (2008) “Small creative industry firms: a development dilemma?” Management
Decision, Vol. 46 Issue 6, pp. 819-831
EU Commission (2008) Communication From the Commission to the Council, the European
Parliament, the European Economic and Social Committee and the Committee of the
Regions - “Think Small First” and A “Small Business Act” for Europe” COM (2008) 394
final version - English.
Gamme, Inger, Siem, Eva Amdahl, and Lodguard, Eirin (2013) “Performance Measurement
Systems for Craft-Oriented Small Enterprises” Advances in Production Management
Systems. Competitive Manufacturing for Innovative Products and Services, Vol. 398, pp
265-272
Hayter, Chris and Pierce, Stephanie Casey (2009) “Arts and the Economy: Using Arts and
Culture to Stimulate State Economic Development”, The National Governors Association
(NGA) Center for Best Practices,
http://www.nga.org/files/live/sites/NGA/files/pdf/0901ARTSANDECONOMY.PDF
Marshall University (December 2008) Center for Business and Economic Research “The
Economic Impact of Tamarak”
www.marshall.edu/cber/docs/2008_12_31_Tamarack01072009.pdf
North Carolina Pottery Center (2014) A Brief History http://www.ncpotterycenter.org/about-
us/yesterday-today-tomorrow.html
Parkman, Ian D., Holloway, Samuel S., and Helder, Sabastio (2012). Creative Industries:
Aligning Entrepreneurial Orientation and Innovation Capacity. Journal of Research in
Marketing and Entrepreneurship, 14 (1), 95-114.
Richards, George (February 19, 2013) “The Death of Art and Crafts” Arts And Society, Vol. 4,
Issue 4. http://canvas.union.shef.ac.uk/wordpress/?p=1673
Seagrove Area Potters Association (n.d.) “Pottery Highway” http://www.discoverseagrove.com
Soboeiro, Andrew (n.d.) “Adventures in Sandhills Pottery” http://sandhillsnc.com/?page_id=161
Sparks, Erin and Waits, Mary Jo (May 2012) “New Engines for Growth” National Governors
Association, (NGA) Center for Best Practices,
http://www.nga.org/files/live/sites/NGA/files/pdf/1204NEWENGINESOFGROWTH.PD
F

ASBE 40TH Annual Conference
194
Memphis, TN, September 24-26, 2014
Stanton, Audrey. (February 24, 2009) “ Tamarack’s economic impact huge, study shows” The
Register-Herald, Beckley, West Virginia. http://www.register-
herald.com/local/x519110530/Tamarack-s-economic-impact-huge-study-shows/print
Tamarak (2014) “The best of West Virginia” https://www.tamarackwv.com
Tregear, Angela (2003) “Market orientation and the craftsperson”, European Journal of
Marketing, Vol. 37, Issue11/12, pp. 1621-1635
Ziemnowicz, Christopher and Menefee, Michael (2014) “The Future of Craft Enterprises: The
European approach to fostering micro businesses” Proceedings of the Academy of
International Business Midwest Chapter, Volume 28, pp. 364-371.
Ziemnowicz, Christopher and Romaniuk, Jaroslaw (2014) “Traditional Arts Handicraft in Poland
- a Case Study of Change in a Globalized Economy” Proceedings of the Academy of
International Business Midwest Chapter, Volume 28, pp. 372-382.
ZRP - Związek Rzemiosła Polskiego (2014) “About ZRP”
http://www.zrp.pl/tabid/314/language/pl/Default.aspx

ASBE 40TH Annual Conference
195
Memphis, TN, September 24-26, 2014
Vulnerability and Resource Dependency of Nonprofit Organizations in
Alabama’s Black Belt: Call for a Better Measure of Perceived Revenue
Diversification
Aliquippa Allen, PhD, University of West Alabama
Russ Henley, PhD, University of West Alabama
D. Adrian Doss, PhD, University of West Alabama
Abstract
Over the past decade, nonprofit organizations’ (NPOs) abilities to execute their social
missions have been hindered due to changes in the economy. Critical resources are thinning and
competition for resources are increasing among rival NPOs. Obtaining critical resources from
diverse sources is an objective of vulnerable organizations and a concept of resource dependence
theory (RDT). NPOs’ reliance on outside organizations is descriptive of the basic constructs of
RDT and is the grounding theory for this study. This study provided an empirical analysis of the
correlation between vulnerability and revenue diversification, and is based on the perception of
NPOs in Alabama’s Black Belt region. A researcher-developed 30-question survey, based on 102
participants’ responses, was used to answer the research question: How does resource
dependence theory explain the relationships between perceived revenue diversification and
perceived vulnerability of NPOs in the Black Belt? This paper calls for a better measure of
perceived revenue diversification.

ASBE 40TH Annual Conference
196
Memphis, TN, September 24-26, 2014
Background of the Study
Over the past decade, changes in the economy have threatened the ability of nonprofit
organizations (NPOs) to carry out their social missions. Resources are thinning and competition
among rival NPOs is increasing for critical resources. Scholars have assessed the state of
traditional funding sources and found in many cases they are not sufficient; the scholars
suggested alternative ways to generate the revenue needed to fulfill NPOs’ missions (Boris, de
Leon, Roeger, & Nikolova, 2010; Georgia Center for Nonprofits, 2010; Giving USA Foundation,
2008; Keating et al., 2005). Some scholars suggest NPOs form joint ventures with for-profit
businesses as a viable strategic option to leverage their vulnerabilities due to thinning resources
and increased competition (Dees, 1998; Defourny & Nyssens, 2008; Massetti, 2008; Moizer &
Tracey, 2010).
The changes that are taking place in the economy are leaving resources thinner and future
acquisitions uncertain (Barman, 2008; Froelich, 1999; Hager, 2001; Hodge & Piccolo, 2005;
Keating et al., 2005). During the most recent recession, the lack of readily available resources
crippled NPOs’ budgets and interrupted a part of the nation’s critical delivery system that is used
to deliver goods and services to distressed communities (Giving USA Foundation, 2008). Shifts
in private contributions, public support, and commercial activities (Hodge & Piccolo, 2005)
contribute to the uncertainty of available critical resources NPOs need to survive. Giving USA
Foundation (2008) reported a double-digit drop in private contributions between 2008 and 2009.
Government funding also fell (Boris et al., 2010; Brooks, 2005). NPOs’ biggest supporter, the
government, contributed significantly to the reduction in NPOs’ revenues because of the
deficiencies in broken government systems (National Council of Nonprofits, 2010). In 2008,
ASBE 40TH Annual Conference
197
Memphis, TN, September 24-26, 2014
government funding accounted for 27.4% of all funding for the NPO sector, private donors
provided 10.4%, and foundations provided 1% (National Council of Nonprofits, 2010).
Communities that rely heavily on the contributions of NPOs will likely be impacted by the
changes that are taking place in the economy.
The literature repeatedly states that competition for thinning critical resources is
extremely high and the National Center for Charitable Statistics (NCCS) reflects an increase in
the number of NPOs in the Black Belt region. For example, in 2009, the NCCS (n.d.) listed over
27,000 registered NPOs in Alabama, which represented a 25% increase in NPOs in Alabama in
less than 2 years, thus escalating competition. A correlation appears to exist between the growth
in the number of NPOs, the high unemployment rate, and the increase in the number of people in
need, specifically in the Black Belt. The Alabama Department of Industrial Relations (2010)
reported unemployment rates in some Black Belt counties as high as 24.9%, which was
significantly higher than the national average of 9.1% in 2010. This is significant because
organizations are dependent on their environments to provide the resources they need to survive
(Pfeffer & Salancik, 1978/2003; J. D. Thompson, 1967). Over 1,250 NPOs are in the Black Belt,
which makes competition for thinning resources very high.
Alabama’s Black Belt is part of the Southern Black Belt, the “nation’s largest and most
impoverished rural area in the United States” (Wimberley & Morris, 1996, p. 118). The term
Black Belt dates back more than 100 years and describes the abundant black soil found in the
region that was excellent for cultivating cotton, wheat, and rice (“Black Belt Region in
Alabama,” 2011). The Black Belt is a conglomeration of 11 states, which includes Alabama,
Arkansas, Florida, Georgia, Louisiana, Mississippi, North Carolina, South Carolina, Tennessee,
Texas, and Virginia, and 623 rural counties. Counties within the Black Belt lack critical

ASBE 40TH Annual Conference
198
Memphis, TN, September 24-26, 2014
resources, such as adequate leaders, finances, infrastructure, and skilled laborers, which are
commonplace in urban communities (Wimberley & Morris, 1996). Twelve of Alabama’s 67
counties are located in the Black Belt. This study targeted NPOs in the 12 counties because of
the potential influence of thinning resources on the vulnerability of these NPOs.
The concept of charitable organizations dates back to the American Revolution, but has
evolved over time. During the 1800s, churches, private charities, and charitable organizations
comprised of approximately 1% of the U.S. labor force (Hammack, 2001). During this period,
the majority of contributions from private givers were directed toward workers that provided
services in the areas of religion, education, and healthcare. NPOs and other charitable
organizations received lesser amounts to provide various goods and/or services to the needy.
In the 1900s, the number of NPOs grew, their roles expanded, and their support became
significant, but restrictions interfered with their ability to deliver aid to the poor and distressed.
Du Bois (1907) explained that the restrictions put in place on charitable organizations retarded
growth in predominantly African American communities. Du Bois indicated that Southern state
governments that were obsessed with segregation put restrictive policies in place that denied
individuals their rights to organize, but they tolerated the organization of African American
churches and private schools. Some of the restrictions and policies put in place by White-
controlled organizations were specifically designed to prevent the startup of independent
charitable organizations and Black churches as well. These restrictions and policies helped to
maintain the existing state of the South: slavery and segregation (Raboteau, 1978). The church
became the center of economic, educational, social, and recreational activities (Du Bois, 1907).
Suffrage restrictions hindered individual voting rights and the formation of civil rights
organizations in an effort to maintain White supremacy in the South (Argersinger, 1992;

ASBE 40TH Annual Conference
199
Memphis, TN, September 24-26, 2014
Hammack, 2001). To deter participation in organized groups, civil rights organizations and
individuals were consistently harassed. Individual names were given to local officials annually to
restrict their rights. Despite the multitude of restrictions put in place, charitable organizations
continued to address societal needs.
At the turn of the century, voluntary associations’ influence on political outcomes
increased; however, “if states could constitute, regulate and constrain those organizations, they
did” (Clemens, 2000, p. 2). It took an act of Congress to lift the restrictions placed on NPOs and
individuals who wanted to publish, petition, and, most importantly, participate in NPOs. Once
restrictions were eliminated, individuals organized benevolent, religious, and mutually beneficial
organizations in every part of the country.
Congress eventually lifted restrictive measures on NPOs, but donors decided to enact
their own stipulations and often attached strings to their contributions. Frumkin (1997) and
Lenkowsky (2002) found that some contributors set up their own funding priority systems rather
than distributing their gifts based on NPOs’ established priorities. Barman (2008) stated that a
“disjuncture [exists] between funders’ goals and nonprofits’ missions” (p. 41). He found that
donors’ designations might unduly influence the beneficiaries and potentially harm the missions
of NPOs. NPOs might also become victims of this disjuncture if they are told how or where to
designate their resources. The fact that donors have strategically positioned themselves where
they can control and/or restrict the use of their contributions signifies a multitude of potential
issues for NPOs (Helms, Henkin, & Murray, 2005). If philanthropists specifically target or
earmark their charitable contributions, NPOs may have to alter their missions. Gronbjerg and
Martell (2000) found that some NPOs strategically position themselves to accommodate the
contingencies because of their levels of dependence on their providers.

ASBE 40TH Annual Conference
200
Memphis, TN, September 24-26, 2014
Extant literature indicates that scholars have researched dependence issues in the NPO
sector and found that NPOs, which rely heavily on philanthropists, are likely to accommodate the
wishes and inputs of their donors. Some NPOs willingly comply with contributors’ inputs on
organizational structures, practices, and resource distribution. According to Barman (2008),
private donors are not the only funders who apply restrictions or attach strings to their donors.
Some government agencies attach specific administration and monitoring requirements to their
contributions provided to resource-dependent organizations.
When the two primary funding sources (private, public) were cut, NPOs began focusing
on a third source (commercial activities), which is gaining popularity (Froelich, 1999).
Commercial activities include fundraising, charging membership fees and dues, and other forms
of revenue-generating activities that increase revenues. Social enterprise is the latest form of
commercial activity and is widespread throughout NPO literature. Several scholars and
practitioners have researched this type of commercial activity and have recommended using it to
generate revenues to fill the gap left by cutbacks (Bornstein & Davis, 2010; Boschee &
McClurg, 2003; Dees, 1998; Georgia Center for Nonprofits, 2010; Hynes, 2009; Lohmann,
2007; Massarsky & Beinhacker, 2002; Massetti, 2008; McBrearty, 2007; Seanor & Meaton,
2007; VanSandt, Sud, & Marmé, 2009; Warm, 2004). These authors stated that current
conditions and limited funding sources have resulted in a paradigm shift in the NPO sector that
has created a need for NPOs to consider various types of commercial activities other than
fundraising. Massarsky and Beinhacker (2002), Warm (2004), and Georgia Center for Nonprofits
(2010) surveyed the use of nascent business ventures, such as consulting services, thrift stores,
adult classes, housing, and other types of retail stores, and found that NPOs actively engaged in
various types of these for-profit ventures. Consulting services, thrift stores, adult classes,

ASBE 40TH Annual Conference
201
Memphis, TN, September 24-26, 2014
housing, and other types of retail were the top five commercial ventures that NPOs engage in
(Georgia Center for Nonprofits, 2010). These studies suggested the use of revenue
diversification, a construct of RDT that influences vulnerability.
The use of a commercial activity, such as social enterprise, is widely suggested
throughout NPO literature. Social enterprise first surfaced in Italy in the 1980s and gained
prominence in Europe in the 1990s. The United States followed suit a few years later (Defourny
& Nyssens, 2008). Social enterprise has taken on several definitions throughout the literature.
The Social Enterprise Alliance (n.d.) indicated that social enterprises were established to meet
the general needs of society at large. Social enterprises entail the use of various business and
marketing tactics to develop a strategy that will allow the organizations to fulfill their intended
purposes. The Georgia Center for Nonprofits (2010) reported that an enormous number of NPOs
are considering, or currently engaging in, this form of commercial activity. The study of
Georgia’s NPOs showed 45 new ventures launched in 2010 versus 94 over the past 10 years. The
study also found social enterprise to be an essential form of commercial activities for the future
of NPOs (Georgia Center for Nonprofits, 2010).
According to scholars (Carroll & Stater, 2008; Hafsi & Thomas, 2005; Wimberley &
Morris, 1996), vision, good leaders, and a large number of volunteers are not enough to reduce
the vulnerabilities of rural NPOs. NPOs need long-term sustainment strategies to decrease their
vulnerabilities to their environments. Studies indicate the use of commercial activities could
decrease vulnerabilities; however, the associated costs are not always worth the pursuits

ASBE 40TH Annual Conference
202
Memphis, TN, September 24-26, 2014
Statement of the Problem
The problem is that funding sources for NPOs such as government subsidies/grants,
philanthropic organizations, and private donors are drying up and the vulnerability of NPOs in
the Black Belt is rising. These NPOs provide essential goods and/or services to 12 of the most
economically distressed counties in the U.S. NPOs in these counties are highly dependent on
traditional sources to carry out their social missions, which make them vulnerable to their
environments. NPOs should be mindful that revenues generated from traditional sources
fluctuate over time and that survival is largely dependent on the actions they take to diversify
their revenues, control their dependence, and countervail the powers of influential organizations
that control the resources.
Researchers found changes in the NPO sector that confirm the need for NPOs to take
action to lessen their dependence or countervail the powers of external providers, who no longer
assure the availability of the critical resources NPOs need to accomplish their missions.
Researchers also confirmed the existence of alternative strategies to reduce vulnerability, such as
revenue diversification, dependence, and countervailing power. Very little scholarly literature
has targeted the Black Belt and assessed NPOs’ perceptions of these constructs of RDT
simultaneously.
The findings from this study provide value to scholars studying the financial health of
NPOs serving economically distressed areas. Researchers studying rural NPOs may find value in
NPOs’ perceptions of their organizations in relation to their vulnerabilities. Scholars could use
the results of this study as a foundation for future studies of rural NPOs. This study may also be a
good source of reference to assist potential donors in deciding where to invest their

ASBE 40TH Annual Conference
203
Memphis, TN, September 24-26, 2014
contributions. Practitioners may use this study to determine alternative ways to reduce
organizational vulnerability in spite of diminishing sources. Other interested parties may find the
results useful in building programs that could assist NPOs.
Purpose of the Study
Much of the responsibility for addressing the social ills of the nation is levied on NPOs,
which are expected to continue to operate efficiently in spite of the reduction in traditional
funding sources. Public recipients may be unaware of the impact this has on the organizations
they rely on for goods and services. As funding dries up, dependent organizations become
vulnerable. The primary purpose of this research was to determine if NPOs perceive themselves
as vulnerable. This is significant because vulnerable organizations take action to reduce their
vulnerabilities; however, their perceptions can drive their behaviors. Another purpose of this
study was to conduct a theoretical and empirical analysis to understand the relationship between
selected constructs within RDT and perceived vulnerability. The objective was to administer
online surveys to capture NPOs’ perceptions of these constructs and use a statistical program
(SPSS) to determine the correlation.
Funding reductions may continue; therefore, practitioners must determine a course of
action to reduce the fallout. If state budget shortfalls continue to climb, NPOs are likely to
continue to see reductions in their ability to deliver human and social services (Boris et al.,
2010). This research was essential because NPOs’ survival rests on their dependence and their
ability to adopt strategies that strategically position them to compete for limited funding
successfully. NPOs’ perceptions may determine their ability to continue to deliver goods and
services to the Black Belt, an underserved region of the United States.

ASBE 40TH Annual Conference
204
Memphis, TN, September 24-26, 2014
Recessionary periods can reduce funding, but NPOs that continue to maintain
relationships with their donors are likely to be profitable during these periods. Giving USA
Foundation (2008) reported that recessions occur about every 5–10 years and economic
downturns happen periodically. Between 1967 and 2007, a noted period of recessions and
economic slowdowns, researchers found that, on average, giving rose, which indicates people are
willing to give during difficult times (Giving USA Foundation, 2008). Individual donors are the
single largest source of charitable contributions. Donors gave 80% of total contributions during
the past four recessionary periods: 1970, 1974, 1982, and 2001. Declines in their contributions
may have tremendous impacts on dependent organizations. Experts recommend NPOs continue
to solicit individual contributions to fulfill their specific needs during these lulls. A comparative
study using 40 years of data conducted by Giving USA Foundation (2008) revealed that some
experts and professionals with decades of experience recommend NPOs take the following
actions to obtain resources:
1. Work closely with boards of directors to ensure similar vision and purpose.
2. Develop workable plans (i.e. fundraising, communication, and stewardship) and stick
to them.
3. Acknowledge all type of givers and the significances of their contributions to the
organizations’ overall efforts.
4. Maximize various fundraising efforts via several methods, such as the media and
public relations, in order to provide as many options as possible to communicate the
organizations’ message and raise the funds necessary. (p. 1)
Reportedly, donors give during recessions, but they desire to give to organizations that
are excellent stewards of their financial contributions. Some contributors have changed their
charitable contribution strategies and have become inclusive in the organizations’ decisions-
making processes. About 88% of all United Way’s contributors have some form of control over
the distribution of their donations (Barman, 2008). Other donors are looking for NPOs that are

ASBE 40TH Annual Conference
205
Memphis, TN, September 24-26, 2014
engaged in proactive measures that allow them to see the impact of their donations. Gronbjerg
and Martell (2000), Frumkin and Kim (2001), and Moizer and Tracey (2010) found that
organizations that take an active role in managing their dependence and establishing ways to
acquire resources may have advantages over other NPOs competing for the same funding. This is
important to scholars because awareness of donors’ criteria is likely to result in NPOs
successfully competing for critical resources.
NPOs have relied heavily on traditional funding sources to generate revenue; however, a
paradigm shift occurred in the NPO sector that required organizations to consider new ways of
generating funding. Although Giving USA Foundation’s (2008) comparative study revealed that
donors give during recessionary periods, several scholars recommend NPOs take measures to
generate revenue because of the diminishing funds, the rising cost of operations, and the
accelerating number of rival NPOs competing for the resources (Boschee & McClurg, 2003;
Carroll & Stater, 2008; Dees, 1998; Hafsi & Thomas, 2005; Keating et al., 2005). These scholars
determined that traditional funding sources are no longer sufficient or, in some cases, available to
provide the goods and services needed in rural communities. Within the sector, NPOs have
shifted their foci to employing ways to generate revenue using for-profit ventures to lessen their
vulnerabilities. Dees (1998), Dart (2004), Certo and Miller (2008), and Defourny and Nyssens
(2008) ascertained that for-profit business ventures can reduce NPOs’ dependence on
philanthropists, government grants and subsidies, and other charitable organizations. The
scholarly literature reviewed on the vulnerability of NPOs did not address whether NPOs in the
Black Belt have adopted the new perspective on generating revenue to sustain their missions.
This research was important because NPOs are distributors of the goods and services
needed to aid distressed rural communities, such as Alabama’s Black Belt. Like other rural

ASBE 40TH Annual Conference
206
Memphis, TN, September 24-26, 2014
communities throughout the United States and abroad, these organizations struggle to provide
essential goods and services to underserved communities. Dees (1998), Frumkin and Kim
(2001), and Carroll and Stater (2008) indicated strategies are needed to generate revenue, lessen
dependence on external organizations, and countervail the power of entities that control the
critical resources NPOs need.
This research may be of interest to scholars and practitioners because it filled an in NPO
literature regarding vulnerabilities of rural NPOs. No scholarly journal articles or books were
found during the literature review that addressed the perception of vulnerabilities among NPOs
in Alabama’s Black Belt. To begin filling the gap in the literature, this study targeted NPOs in
the Black Belt and the researcher introduced a researcher-developed survey to capture NPOs’
perceptions of their vulnerabilities.
Research Question
Pfeffer and Salancik (1978/2003) suggest that organizations become vulnerable when the
environment changes and the resources they rely on are no longer guaranteed. The literature
review of NPOs indicated a paradigm shift has occurred within the NPO sector because their
environments have changed and traditional sources of funding are no longer certain. Given that
scholars confirmed the shift in the NPO sector, they suggested that NPOs develop alternate
strategies to acquire and secure revenue streams. This researcher sought to determine the
existence of alternate revenue strategies and NPOs’ dependence on the external organizations
based on their perceptions, by answering the research question: How does resource dependence
theory explain the relationships between perceived revenue diversification, perceived
dependence, perceived countervailing power, and perceived vulnerability of NPOs in the Black

ASBE 40TH Annual Conference
207
Memphis, TN, September 24-26, 2014
Belt? The intent was to determine if rural NPOs perceive they are vulnerable and assesses how
their perceptions correlate to perceived revenue diversification, perceived dependence, and
perceived countervailing power. Environmental changes, such as a reduction in traditional
funding sources, may influence the level of vulnerability that exists in rural NPOs. This research
was necessary because rural communities traditionally face an unprecedented set of issues that
affect the welfare of their people and their communities (Beaulieu, 2005). Some of the
challenges that affect rural communities throughout North America are
1. An influx of new people with a diversity of cultures, languages, and values;
2. The out-migration of talented youth and adults who seek greater economic
opportunities in larger populated areas;
3. The accelerated growth of service producing sector jobs that are offering rural
workers fewer opportunities to secure decent paying jobs;
4. The persistence of poverty among rural women, children, and minorities;
5. The decaying state of roads, bridges, and other basic components of the community’s
infrastructure;
6. The declining capacity to afford or to have access to quality health care in close
proximity to their places of residence;
7. The accelerated demands on rural schools to meet performance and accountability
standards that are best suited or modeled for urban and suburban school systems;
8. The daily outflow of local residents who commute outside the area which hinders
their active engagements in the civic lives of their communities;

ASBE 40TH Annual Conference
208
Memphis, TN, September 24-26, 2014
9. Local governance structures that are struggling to keep pace with program
management and fiscal responsibilities that were once the purview of federal and state
agencies; and
10. A technology-sophisticated world that has had a limited presence in many rural areas.
(Beaulieu, 2005, p. 1)
The issues that rural communities face coupled with the decline of funding sources
warrant the attention of scholars and practitioners to further the study of the NPO sector. This
study centered on perceived vulnerability of NPOs and RDT. Four constructs were used to
address the research question and hypotheses. First, the survey responses from participants
helped determine perceived vulnerability (dependent variable). The survey also captured data
applicable to the three independent variables (perceived revenue diversification, perceived
dependence, and perceived countervailing power). Correlation analysis tested the relationship
between the four constructs. This study sought to provide results that researchers can use to
conduct further studies of NPOs.
Definition of Terms
The Black Belt. “This social and demographic crescent of 623 counties containing higher than
average percentages of black residents” (Wimberley & Morris, 1996, p. 12).
Commercial activity. “Income from sources, such as client fees and charges” (Boschee, 2006, p.
1).
Nonprofit organizations (NPOs). “501(c)(3) describes qualifying organizations as Corporations,
and any community chest, fund, or foundation, organized and operated exclusively for religious,

ASBE 40TH Annual Conference
209
Memphis, TN, September 24-26, 2014
charitable, scientific, testing for public safety, literary, or educational purposes” (Internal
Revenue Service [IRS], n.d.).
Perceived countervailing power. The shifting of the power in asymmetrical (unequal) business-
to-business exchanges or relationships (Galbraith, 1993).
Perceived dependence. The “results from exchange processes and from the requirements of
organizations to acquire resources and engage in exchange with their environments” (Pfeffer &
Salancik, 1978/2003, p. 52).
Perceived revenue diversification. “a prudent revenue generation strategy to potentially
minimize the volatility of revenue portfolios managed by nonprofit organizations” (Carroll &
Stater, 2008, p. 949).
Perceived vulnerability. Refers to an organization’s belief as to the magnitude of its dependence
on external resources and influences required to conduct its operations (Pfeffer & Salancik,
1978/2003).
Self-sufficiency. “Can be achieved through earned revenue alone” (Boschee, 2006, p. 1).
Social enterprise. Refers to “non-profit ventures designed to achieve both social and commercial
objectives” (Moizer & Tracey, 2010, p. 252).
Vulnerability. “An organization’s vulnerability to its environment is the result of its need for
resources such as raw materials, labor, capital, equipment, knowledge and outlets for its products
and services—resources that are controlled by the environment” (Hatch & Cunliffe, 2006, p. 81).
Nature of the Study
The growth of NPOs throughout the 19th century was slow but steady because of changes
in the rules at various levels of government (Hammack, 2001). Revised legislation throughout

ASBE 40TH Annual Conference
210
Memphis, TN, September 24-26, 2014
this period modified the government’s responsibility, absolving the government from being
solely, legally, or morally bound to provide for marginalized members of society. The revised
legislation greatly affected rural communities, such as Alabama’s Black Belt. To fill the gap,
when tax dollars or private funds were no longer available, organizations with social or
charitable missions formally organized. Although NPOs have social missions and noble
objectives, many are dependent on external sources of funding to help meet the needs of their
communities. Organizations are not self-sufficient because they are dependent on external
sources (Pfeffer & Salancik, 1978/2003). When these organizations become too dependent on
resources from specific donors, they are likely to fail. External funding, such as government
grants and private donors, is an environmentally controlled resource, which affects the
vulnerability of NPOs.
Studies were not found that outlined this theoretical framework in regard to NPOs in
Alabama’s Black Belt. This study added to the knowledge base of rural NPOs by examining their
perceived vulnerabilities and their relationships to constructs within RDT. Conclusions made in
this study provide scholars, educators, practitioners, and other interested parties with the
perceived state of vulnerability of NPOs in a rural region of the United States.
An extensive search for key terms, such as vulnerability, rural NPOs, and RDT using
online databases revealed a significant number of studies addressing financial vulnerability of
NPOs. Several scholars proclaimed that NPOs, which are dependent on a limited set of suppliers
for critical resources, are vulnerable to their environments. Throughout the literature, scholars
consistently recommend NPOs consider alternatives, or more than one strategy, to acquire
needed resources to stabilize their revenues. The conceptual framework, derived from extant
literature, revealed a paradigm shift in the NPO sector regarding how to secure needed resources

ASBE 40TH Annual Conference
211
Memphis, TN, September 24-26, 2014
when fewer suppliers and limited resources exist in highly competitive environments. These
scholarly confirmations are consistent with the central theme of RDT in that organizations
cannot survive without resources from their external environments. Often organizations will
restructure dependence by using various tactics to influence donors or generate new streams of
revenue. Studies revealed that drastic changes have transpired over the past 20 years. During this
period, the costs of operating organizations have excelled while the competition for traditional
funding has tripled (Boschee & McClurg, 2003).
NPOs’ perceptions of environmental influences are essential in deciding their states of
vulnerability and dependence on external providers. Their perceived vulnerabilities could also be
influenced by the actions they take to countervail the power external providers have over their
dependent organizations. This study examined constructs within RDT from the NPOs’
perspective. Figure 1 is the researcher’s depiction of four selected constructs within RDT that
influence NPOs’ vulnerabilities. Only two constructs will be addressed in this paper. The model
signifies that NPOs’ perceived revenue diversification, perceived dependence, and perceived
countervailing power could affect their perceived vulnerabilities. NPOs may use these constructs
as defensive or offensive strategies to lessen their vulnerabilities.
Traditional funding
sources
Nontraditional
funding sources
Combined funding
sources (traditional
& nontraditional)
Perceived
Revenue
Diversification
Importance/essentiality
and criticality of
resources
Certainty of resources
Alternative/substitutable
resources
The ability of
Organization A to
pressure Organization B
to provide needed
resources
Collaborations
Internal evaluations
Strategic positioning
Social networking
Boundary spanning
Policy advocacy
Perceived Vulnerability
Perceived
Dependence
Perceived
Countervailing
Power

ASBE 40TH Annual Conference
212
Memphis, TN, September 24-26, 2014
Figure 1. Theoretical framework.
Research Design
A survey can quantify characteristics, trends, attitudes, and opinions of a sample, and
generalize the results to the population (Creswell, 2009). Responses to the 30-question survey
were used to determine perceived vulnerability and its relationship to perceived revenue
diversification, and the other constructs outlined Carroll and Stater’s (2008) research contributed
to the formulation of survey items to measure perceived revenue diversification in this study. A
survey was the preferred instrument for this study because it was relatively inexpensive to
administer and the population of interest was dispersed over a broad geographic area. A cross-
sectional design permitted comparisons and correlations between variables using demographics.
The researcher selected a survey design because researchers such as Snavely and Tracy (2000),
Iecovich (2001), Svensson (2004), Hodge and Piccolo (2005), JungWook (2011), and Meehan
and Wright (2011) effectively used surveys for similar studies of NPOs.
Sample
If the NPO sector becomes vulnerable, the country’s delivery system of public services
may also become vulnerable (Wimberley & Morris, 1996), specifically during changes in social
processes of the economy. The population of interest for this study comprised NPOs in the 12
Black Belt counties. The unit of analysis was the perceived vulnerability of the NPOs in the 12

ASBE 40TH Annual Conference
213
Memphis, TN, September 24-26, 2014
Black Belt counties. The primary reason NPOs in the Black Belt were selected for this study is
they are a significant part of the delivery system and are located in the “nation’s largest and most
impoverished rural area in the United States” (Wimberley & Morris, 1996, p. 118). These NPOs
are also part of rural communities where lack of critical resources is commonplace (Wimberley
& Morris, 1996) and downturns in the economy will likely threaten their ability to achieve their
goals. A review of scholarly literature of the NPO sector did not reveal studies inclusive of these
counties, which is the secondary reason this population was studied.
A database was purchased from the NCCS website, which was believed to be the primary
source for e-mail and/or mailing addresses for the sample. Mailing addresses were available, but
e-mail addresses were not, which required an additional step in the data collection process to
administer an online survey. At the onset of this study, the NCCS contained approximately 1,250
registered NPOs in the Black Belt; however, only 715 were valid at that point in time. To obtain
the sample for this study, solicitation letters were sent via traditional mail to the NPOs’ addresses
listed on the NCCS website. A low response rate was anticipated because of the outcome in
previous studies. Snavely and Tracy’s (2000) study of 530 NPOs in rural southern Illinois and
Mississippi counties yielded a 24% response rate. JungWook’s (2011) study of RDT and 1,142
NPOs yielded a 30.2% response rate. Based on previous studies with similar geographic
locations and foci, the expected response rate for the current study was approximately 24% (301
responses).
Hypotheses
Three hypotheses were designed to address the research question; however, only the
results of one will be discussed perceived vulnerability was the sole dependent variable in this

ASBE 40TH Annual Conference
214
Memphis, TN, September 24-26, 2014
study and the independent variables were perceived revenue diversification, perceived
dependence, and perceived countervailing power.
The null hypothesis that will be discussed here is:
Ho1. There is no relationship between perceived revenue diversification and perceived
vulnerability.
Key Constructs
In the literature reviewed, researchers studied various dimensions of financial
vulnerability. Tuckman and Chang’s (1991) seminal work provided the baseline for these studies
and the concept upon which subsequent research expounded. Tuckman and Chang’s work
yielded a theory of financial vulnerability for NPOs. The theory suggests that organizations are
financially vulnerable if cutbacks in programs or services are necessary when an interruption in
revenues occurs. The authors used financial ratios as operational criteria to determine
vulnerability. Greenlee and Trussel (2000), Hager (2001), Trussel (2002), Trussel and Greenlee
(2004), and Keating et al. (2005) consistently modified the criteria to expand the body of
knowledge as it relates to financial vulnerability. Keating et al. used four drivers of vulnerability:
“insolvency risk, financial disruption, funding disruption, and program disruption” (p. 11), which
are derivatives of Tuckman and Chang’s operational criteria: to measure financial vulnerability.
Scholarly research addressing financial vulnerability of NPOs is extensive. Operational
criteria and drivers of vulnerability were addressed in this study to place emphasis on the
constructs and variables tested in previous studies. This study addressed selected constructs
within RDT in lieu of operational criteria or drivers of financial vulnerability. Testing these
constructs added another dimension to the study of vulnerable NPOs. Tuckman and Chang

ASBE 40TH Annual Conference
215
Memphis, TN, September 24-26, 2014
(1991) offered that it is the mixture of supporters, revenue diversification, management, and
adequate capital that will determine the financial vulnerability of NPOs. This study used that
concept by focusing on similar factors, such as perceived revenue diversification, perceived
dependence, and perceived countervailing power, that influence vulnerability in NPOs. Several
constructs within RDT were measured simultaneously, which allowed the researcher to expand
the body of knowledge by confirming NPOs’ perceptions of vulnerability, which appeared to be
unexplored in the literature. Determining NPOs’ perceptions of vulnerability enhanced the
usefulness of previous findings in other rural regions that are underserved and highly dependent
on NPOs to deliver vital goods and services to their communities.
Several constructs within RDT could have been applied to study perceived vulnerability
of NPOs; however, only two have been selected for discussion. Table 1 summarizes the
conceptual and operational definitions of two key constructs.

ASBE 40TH Annual Conference
216
Memphis, TN, September 24-26, 2014
Table 1. Construct Definitions: Conceptual and Operational
Constructs Conceptual Operational
Perceived vulnerability
(DV)
Perceived vulnerability is defined as
an organization’s belief as to the
magnitude of its dependence on
external resources and influences
required to conduct its operations
(Pfeffer & Salancik, 1978/2003)
Others:
Aguirre (2007)
Chang & Tuckman (1991)
Greenlee & Trussel (2000)
Hodge & Piccolo (2005)
Keating et al. (2005)
Svensson (2004)
Tuckman & Chang (1991)
Perceived vulnerability was
measured using a 5-point Likert scale
ranging from 1 (strongly disagree) to
5 (strongly agree). Scores generated
from the scale were used to
determine two levels of perceived
vulnerability: high and low. The
levels were calculated by taking the
mean scores of each respondent for
Survey Questions 7–13. Mean scores
lower than 3 reflected low perceived
vulnerability and mean scores higher
than 3 reflected high perceived
vulnerability.
Perceived revenue
diversification (IV1)
Perceived revenue diversification is
“a prudent revenue generation
strategy to potentially minimize the
volatility of revenue portfolios
managed by nonprofit organizations”
(Carroll & Stater, 2008, p. 949).
Others:
Chang & Tuckman (1994)
Froelich (1999)
Frumkin & Keating (2002)
Hansmann (1987)
Jegers (1997)
Yan et al. (2009)
Perceived revenue diversification
was measured using a 5-point Likert
scale ranging from 1 (strongly
disagree) to 5 (strongly agree).
Scores generated from the scale were
used to determine two levels of
perceived vulnerability: high and
low. The levels were calculated by
taking the mean scores of each
respondent for Survey Questions 14–
18.
Perceived vulnerability (dependent variable) is the first key construct that was assessed; it
refers to an organization’s belief as to the magnitude of its dependence on external resources and
influences required to conduct its operations (Pfeffer & Salancik, 1978/2003). The second
construct and potential influence of perceived vulnerability that was assessed is perceived
revenue diversification (independent variable, IV1). Perceived revenue diversification is NPOs’

ASBE 40TH Annual Conference
217
Memphis, TN, September 24-26, 2014
tactics used to generate revenue for the purpose of minimizing the financial fluctuation within
the organization (Carroll & Stater, 2008). To survive, NPOs require a revenue-generating
strategy that will permit them to deliver their goods and services and simultaneously decrease
their vulnerabilities. Pfeffer and Salancik (1978/2003) contended that organizations that rely
heavily on one resource to sustain operations versus multiple resources are likely to become
dependent on those specific donors.
Hansmann (1987), Chang and Tuckman (1994), Jegers (1997), Froelich (1999), and
Frumkin and Keating (2002) examined the concept of revenue diversification and determined
that NPOs with access to multiple funding sources are perceived as less vulnerable because the
loss in one revenue source may be offset by the gain in another.
Validity and Reliability
An instrument has validity if the conclusions drawn are meaningful and inferences are
valid based on the scores on the instrument (Creswell, 2009). Construct validity was used to
validate the survey instrument to answer questions such as, what does the survey measure? and
Does it adequately measure the construct outlined? Babbie (1990) indicated that reliability is a
question of whether the same technique can be used repeatedly and garner the same results each
time. Reliability is necessary, but it is not the sole determinant of validity.
Summary of the Results
As noted at the beginning of this research, funding sources for NPOs are drying up. If the
NPO sector becomes vulnerable, the country’s delivery system of public services may also
become vulnerable (Wimberley & Morris, 1996). The primary reason NPOs in the Black Belt
were selected for this study is because they are a significant part of the delivery system and are

ASBE 40TH Annual Conference
218
Memphis, TN, September 24-26, 2014
located in the “nation’s largest and most impoverished rural area in the United States”
(Wimberley & Morris, 1996, p. 118). The problem is that funding sources, such as government
subsidies and grants, philanthropic organizations, and private donors, are drying up, and the
vulnerabilities of NPOs in the Black Belt are rising as well. The study was conducted to
determine if NPOs in the Black Belt perceive themselves as vulnerable and if relationships exist
between perceived vulnerability and three constructs of RDT: perceived revenue diversification,
perceived dependence, and perceived countervailing power. This is significant because
vulnerable organizations take action to reduce their vulnerabilities, and their perceptions can
drive their behaviors.
Three hypotheses were empirically tested to answer the research question. The data from
the researcher-developed survey were collected online. The sampling frame was obtained from a
database purchased from the NCCS. A sample of approximately 1,200 was expected; however,
only 715 registered 501(c)(3)s in the Black Belt were identified in the database of over 1 million
NPOs in the United States. Based on the participants’ responses, two of the three null hypotheses
were rejected and one was confirmed. The confirmed hypothesis is the subject of discussion.
Discussion of the Results
All hypotheses were tested at the .05 level of significance. Two hypotheses were highly
significant at the .01 level. The practical implication is discussed below.
Hypothesis 1
This hypothesis suggested that a relationship between perceived revenue diversification
and perceived vulnerability does not exist. In other words, multiple streams of revenue do not
impact the vulnerability of an organization. The null hypothesis was accepted based on statistical

ASBE 40TH Annual Conference
219
Memphis, TN, September 24-26, 2014
testing of survey responses. As previously stated, RDT theorists argue that organizations that do
not have several sources of revenue are vulnerable. Based on the responses of survey
participants, this statement was not supported by the findings in this study. In this case, the null
hypothesis was true.
Although not required, another set of correlations was performed to assess the
relationship between high and low categories of perceived vulnerability (dependent variable) and
the three independent variables: perceived revenue diversification, perceived dependence, and
perceived countervailing power. This type of correlation was completed for each hypothesis.
The second correlation supported Hypothesis 1. The results did not indicate a relationship
between respondents who perceived their organizations to be highly vulnerable and respondents’
perceptions of revenue diversification. Conversely, statistical testing did not determine a
correlation between low perceived vulnerability and perceived revenue diversification.
Hansmann (1987), Chang and Tuckman (1994), Jegers (1997), Froelich (1999), and
Frumkin and Keating (2002) examined the concept of revenue diversification and determined
that NPOs with access to multiple funding sources are perceived as less vulnerable because the
loss in one revenue source may be offset by the gain in another. The implication is that this
construct was not confirmed for NPOs in the Black Belt. Based on the observations during
reliability testing, it is likely that the measurements for the revenue diversification scale will
require revision in future studies. Four of the seven measurements were removed from the scale
because of indicators of internal inconsistency, based on a Cronbach’s alpha of .472.

ASBE 40TH Annual Conference
220
Memphis, TN, September 24-26, 2014
Population and Sample
NPOs in 12 Alabama counties, known as the Black Belt, were the population of interest
for this study. A database containing over 1 million U.S. registered NPOs was purchased from
the NCCS to obtain the sample frame. The researcher invited all 715 registered NPOs in
Alabama’s Black Belt to participate in the study. A solicitation letter and prepaid postcard were
mailed to each of the 715 organizations. The solicitation letters requested each potential
participant fill out the postcard and return it regardless of his or her desire to participate in the
study. The postcard captured the e-mail address and other demographic data needed before the
researcher could proceed to the next step. The data collection process took 55 days and involved
several steps.
In the first step, solicitation letters and prepaid postcards were mailed to 715 NPOs for
the purpose of identifying willing participants. Fifty-five (7%) solicitation letters were returned
unopened for a variety of reasons: no mail receptacle (12), vacant (12), no such number or street
(10), not deliverable (8), insufficient address (4), and miscellaneous (9). The returned requests
were subtracted from the overall sample population, leaving 660 possible participants. Four
hundred ninety-four (75%) NPOs did not respond to the first and second solicitation requests.
Of the 660 possible participants, 167 (25%) responded to the solicitation request, 47 of
whom declined (nonrespondents) and 120 offered to participate. Of the 47 nonrespondents, 22
(47%) replied within 14 days of the initial invitation. Eleven (23%) nonrespondents were from
one county. The remaining 35 (74%) nonrespondents were spread throughout the other Black
Belt counties. Their responses were received within the data collection period. Approximately
45% of nonrespondents (21 NPOs) were human services and religion-related NPOs. Arts,

ASBE 40TH Annual Conference
221
Memphis, TN, September 24-26, 2014
culture, and humanities (5 NPOs); education (8 NPOs); health (3 NPOs); and public, societal
benefit (3 NPOs) organizations made up 40% of nonrespondents. Fifteen percent of
nonrespondents did not provide sufficient information to determine the type of organization.
Respondents who indicated a desire to participate were e-mailed an informed consent
form and a link to the online survey. Three separate distribution lists were utilized to ensure the
respondents received the informed consent and survey link within a reasonable time frame. To
maintain the anonymity of the participants, e-mail addresses were masked in the blind carbon
copy line of the e-mail. The first distribution list contained the e-mail addresses of the 50
individuals who responded within 2 weeks of the initial solicitation request. The first and
subsequent e-mails directed the recipients to read the informed consent form prior to clicking on
the survey link. Participants indicated they had read the form by checking “yes” at the beginning
of the survey. The remaining 70 e-mails were forwarded under a second and third distribution list
based on when the individuals responded to the solicitation letter.
Follow-ups were very important steps in the data collection process. Follow-ups and
reminders were sent during Weeks 3 and 5 of the data collection period. Initially, reminders were
sent to NPOs that did not respond to the initial solicitation letters. Subsequent follow-ups were e-
mailed to participants as reminders to complete the online survey. Overall, of the 120 willing
participants, 18 did not respond to follow-up requests; 102 completed the survey, for an actual
response rate of 15%.
Survey responses were captured online and converted to an Excel spreadsheet, which was
imported into SPSS for data analysis. The Office of Institutional Effectiveness at a local
university collected and compiled the data and provided them to the researcher. To prepare the

ASBE 40TH Annual Conference
222
Memphis, TN, September 24-26, 2014
data for analysis, missing data were assigned the missing value number 999 and a “missing data”
value label.
Implication of the Results
What do the results mean to the NPO sector and to the Black Belt? Overall, the results
indicate the majority (67%) of NPOs in Alabama’s Black Belt perceived themselves as highly
vulnerable. The results confirmed that the perceived vulnerabilities of these organizations are
related to their perceived dependence on outside organizations and the perceived activities they
engage in to lessen their vulnerabilities.
What theoretical implication can be made from these results? The implication of the
results in regard to the four constructs of RDT used in this study is that organizations are affected
by their dependence and countervailing activities that impact their vulnerabilities. The results did
not confirm that perceived revenue diversification is related to the perceived vulnerability of
NPOs in the Black Belt.
Reliability assessments were performed at the onset of data analysis. Based on the initial
assessment of internal consistency, several variables were eliminated and the Cronbach’s alpha
was recalculated. Although the results of the remaining scale items are valid, the researcher
believes modification to the revenue diversification scale may have yielded different results,
specifically when determining the respondent’s perception of revenue diversification.
The researcher did not plan to interact with participants; however, due to the low
response rate, it was necessary to make phone calls. The significant increase in the actual
response rate after the phone calls is indicative of the rapport and trust that developed between
the researcher and the sample population. Although the sample had received the solicitation

ASBE 40TH Annual Conference
223
Memphis, TN, September 24-26, 2014
request, many had opted to set it aside and complete it later. The phone calls were significant
because many participants simply forgot about the survey and others were more willing to
complete it after the researcher assured them it would take only 5 minutes to complete.
Additionally, rapport and trust could have been established earlier in the data collection process
if the researcher had indicated her association with the community being studied. For example,
the researcher should have noted that she resided in the area of interest, worked in the area of
interest, and worked with nonprofit organizations. All of these factors played a role in increasing
the actual response rate by 46%.
Limitations
Initially, three limitations were identified in Chapter 1: a heavy reliance on NPOs’
perceptions of vulnerability, the inferences made by using solely quantitative data, and the
unique challenges facing the Black Belt. During the actual study, other limitations were found.
First, the number of 501(c)(3) organizations in the Black Belt was considerably lower
than initially projected. The NCCS database contained 715 registered 501(c)(3) NPOs in the 12
Black Belt counties rather than the 1,200 expected at the onset of the study. Second, the
perceived revenue diversification measurement did not meet the minimum reliability requirement
(α = .70) recommended by Nunnally (1978). Finally, the actual response rate was significantly
lower than anticipated, which could impact the generalizability of the results.
Recommendations for Further Research
Several recommendations for further study of rural NPOs are provided. First, a
qualitative or mixed-method study will provide more opportunity to determine why NPOs in
rural communities are vulnerable. Secondly, qualitative data may uncover why no relationship

ASBE 40TH Annual Conference
224
Memphis, TN, September 24-26, 2014
was confirmed between perceived vulnerability and perceived revenue diversification. This
would be significant in adding to the body of knowledge of RDT. Responses to open-ended
questions can be triangulated with quantitative data to get an actual picture as to the vulnerability
of rural NPOs. Finally, the type of organizations assessed should be streamlined to reduce
disparity in the results. For example, volunteer fire departments, churches, and historical
facilities provide significantly different responses to questions of vulnerability than more well-
equipped organizations such as educational centers and human services facilities.
Conclusion
This study provided an empirical analysis of the correlation between vulnerability and
revenue diversification, and is based on the perception of NPOs in Alabama’s Black Belt region.
This paper discussed the correlation between the two constructs of RDT and the results
confirmed that NPOs in Alabama’s Black Belt are highly vulnerable; however, it does not
confirm theorists’ arguments that organizations are vulnerable if they do not have diverse
streams of revenue. Reliability and internal consistency assessments were performed at the onset
of data analysis; however, based on the observations during reliability testing, it is likely that the
measurements for the revenue diversification scale will require revision in future studies.
Reliability is necessary but not a sufficient condition for validity; therefore, reliability issues for
this measure needs to be addressed first. Based on these results, this paper calls for a better
measure for revenue diversification.
ASBE 40TH Annual Conference
225
Memphis, TN, September 24-26, 2014
References
Aguirre, B. E. (2007). Dialectics of vulnerability and resilience. Georgetown Journal on Poverty
Law & Policy, 14(39), 1–17.
Alabama Association of Nonprofits. (n.d.). Alabama’s nonprofit sector as an economic engine.
Retrieved from http://alabamanonprofits.org/
Alabama Department of Industrial Relations. (2010, September 17). Alabama’s unemployment
rate drops to 9.2% [News release]. Retrieved from http://dir
.alabama.gov/docs/pressreleases/uc_august%202010%20rate%20release.pdf
Argersinger, P. H. (1992). Structure, process, and party: Essays in American political history.
Armonk, NY: Sharpe.
Babbie, E. (1990). Survey research methods (2nd ed.). Belmont, CA: Wadsworth.
Barman, E. (2008). With strings attached: Nonprofits and the adoption of donor choice.
Nonprofit and Voluntary Sector Quarterly, 37, 39–56. doi:10.1177
/0899764007303530
Beaulieu, L. J. (2005). Breaking walls, building bridges: Expanding the presence and relevance
of rural sociology. Rural Sociology, 70(1), 1–27.
Black Belt Region in Alabama. (2011). In Encyclopedia of Alabama. Retrieved from
http://www.encyclopediaofalabama.or/face/AritlcePrintable.jsp?id=h-2458
Boris, E. T., de Leon, E., Roeger, K. L., & Nikolova, M. (2010). Human service nonprofits and
government collaboration: Findings from the 2010 national survey of nonprofit
government contracting and grants. Retrieved from http://www
.urban.org/publications/412228.html
Bornstein, D., & Davis, S. (2010). Social entrepreneurship: What everyone needs to know. New
York, NY: Oxford University Press.
Boschee, J. (2006). Strategic marketing for social entrepreneurs. Retrieved from http://
www.socialent.org/beta/pdfs/StrategicMarketing.pdf
Boschee, J., & McClurg, J. (2003). Toward a better understanding of social entrepreneurship:
Some important distinctions. Retrieved from http://www.vizavi
-edu.md/uploads/testtrtr.pdf

ASBE 40TH Annual Conference
226
Memphis, TN, September 24-26, 2014
Brooks, A. C. (2005). What do nonprofit organizations seek? (and why should policymakers
care?). Journal of Policy Analysis & Management, 24(3), 543–558.
doi:10.1002/pam.20114
Carroll, D. A., & Stater, K. J. (2008). Revenue diversification in nonprofit organizations: Does it
lead to financial stability? Journal of Public Administration Research & Theory, 19(4),
947–966. doi:10.1093/jopart/mun025
Certo, S. T., & Miller, T. (2008). Social entrepreneurship: Key issues and concepts. Business
Horizons, 51(4), 267–271.
Chang, C. F., & Tuckman, H. P. (1991). Financial vulnerability and attrition as measures of
nonprofit performance. Annals of Public and Cooperative Economics, 62(4), 655–672.
doi:10.1111/j.1467-8292.1991.tb01372.x
Chang, C. F., & Tuckman, H. P. (1994). Revenue diversification among non-profits.
VOLUNTAS: International Journal of Voluntary and Nonprofit Organizations, 5(3), 273–
290. doi:10.1007/BF02354036
Clemens, E. (2000, November). The encounter of civil society and the states: Legislation, law,
and association, 1900–1920. Paper presented at the Social Science History Association
annual meeting, Pittsburgh, PA. Retrieved from http://users.polisci
.wisc.edu/apw/archives/clemens.pdf
Creswell, J. W. (2009). Research design: Qualitative, quantitative, and mixed methods
approaches (3rd ed.). Thousand Oaks, CA: Sage.
Dart, R. (2004). The legitimacy of social enterprise. Nonprofit Management and Leadership,
14(4), 411–424.
Dees, J. G. (1998). Enterprising nonprofits. Harvard Business Review, 76(1), 54–67.
Defourny, J., & Nyssens, M. (2008). Social enterprise in Europe: Recent trends and
developments. Social Enterprise Journal, 4(3), 202. doi:10.1108
/17508610810922703
Du Bois, W. E. B. (1907). Economic cooperation among negro Americans. Retrieved from
http://docsouth.unc.edu/church/dubois07/dubois.html
Froelich, K. A. (1999). Diversification of revenue strategies: Evolving resource dependence in
nonprofit organizations. Nonprofit and Voluntary Sector Quarterly, 28(246), 246–266.
doi:10.1177/0899764099283002
Frumkin, P. (1997). Fidelity in philanthropy: Two challenges to community foundations.
Nonprofit Management and Leadership, 8, 65–76. doi:10.1002/nml.4130080107

ASBE 40TH Annual Conference
227
Memphis, TN, September 24-26, 2014
Frumkin, P., & Keating, E. K. (2002, November). The risks and rewards of nonprofit revenue
concentration. Paper presented at the Association for Research on Nonprofit
Organizations and Voluntary Action annual conference, Montreal, Quebec, Canada.
Frumkin, P., & Kim, M. T. (2001). Strategic Positioning and the financing of nonprofit
organizations: Is efficiency rewarded in the contributions marketplace? Public
Administration Review, 61(3), 266–275.
Galbraith, J. K. (1993). American capitalism: The concept of countervailing power. New
Brunswick, NJ: Transaction.
Georgia Center for Nonprofits. (2010). Social enterprise in Georgia: A profile of the field and
strategies at work. Retrieved from http://www.gcn.org/files/social_enterprise
Giving USA Foundation. (2008). Giving during recessions and economic slowdowns. Giving
USA Spotlight, (3), 1–18. Retrieved from http://www.ruotoloassoc.com
/Spotlight3-2008Final.pdf
Greenlee, J., & Trussel, J. (2000). Predicting the financial vulnerability of charitable
organizations. Nonprofit Management and Leadership, 11(2), 199–210. doi:10
.1002/nml.11205
Gronbjerg, K. A., Martell, L. (with Paarlberg, L.). (2000). Philanthropic funding of human
services: Solving ambiguity through the two-stage competitive process. Nonprofit and
Voluntary Sector Quarterly, 37(4), 603–625. doi:10.1177
/0899764007312667
Hafsi, T., & Thomas, H. (2005). Strategic management and change in high dependency
environments: The case of a philanthropic organization. VOLUNTAS: International
Journal of Voluntary and Nonprofit Organization, 16(4), 329–351. doi:10.107/s11266-
005-9146-y
Hager, M. A. (2001). Financial vulnerability among arts organizations: A test of the Tuckman–
Chang measures. Nonprofit and Voluntary Sector Quarterly, 30, 376–392.
doi:10.1177/0899764001302010
Hammack, D. C. (2001, June). Introduction: Growth, transformation, and quiet revolution in the
nonprofit sector over two centuries. In The Quiet Revolution in the Nonprofit Sector:
Law, Policy, and Commerce, Symposium conducted at Case Western Reserve University,
Cleveland, OH. Retrieved from http://nvs.sagepub
.com

ASBE 40TH Annual Conference
228
Memphis, TN, September 24-26, 2014
Hansmann, H. (1987). The effect of tax exemption and other factors on the market share of
nonprofit versus for-profit firms. National Tax Journal, 40(1), 71–82.
Hatch, M. J., & Cunliffe, A. L. (2006). Organization theory (2nd ed.). New York, NY: Oxford
University Press.
Helms, L., Henkin, A. B., & Murray, K. (2005). Playing by the rules: Restricted endowment
assets in colleges and universities. Nonprofit Management & Leadership, 15(3), 341–356.
Hodge, M. M., & Piccolo, R. F. (2005). Funding source, board involvement techniques, and
financial vulnerability in nonprofit organizations: A test of resource dependence.
Nonprofit Management and Leadership, 16(2), 171–190. Retrieved from Business Source
Complete.
Hynes, B. (2009). Growing the social enterprise—Issues and challenges. Social Enterprise
Journal, 5(2), 114.
Iecovich, E. (2001). Resource dependencies of old age homes: Definitions and measurements.
Administration in Social Work, 25(2), 21–37.
Internal Revenue Service. (n.d.). [Home page.] Retrieved from http://www.irs.gov/
Jegers, M. (1997). Portfolio theory and nonprofit financial stability: A comment and extension.
Nonprofit and Voluntary Sector Quarterly, 26(1), 65–72.
JungWook, S. (2011). Resource dependence patterns and organizational performance in
nonprofit organizations. Doctoral dissertation, Arizona State University, Tempe.
Keating, E. K., Fischer, M., Gordon, T. P., & Greenlee, J. (2005). Assessing financial
vulnerability in the nonprofit sector (RWP05-002). Retrieved from http://papers
.ssrn.com/sol3/papers.cfm?abstract_id=647662
Lenkowsky, L. (2002). Foundations and corporate philanthropy. In L. Salamon (Ed.), State of
nonprofit America (pp. 355–386). Washington, DC: Brookings Institution.
Lohmann, R. A. (2007). Charity, philanthropy, public service, or enterprise: What are the big
questions of nonprofit management today? Public Administration Review, 67(3), 437–
444. doi:10.1111/j.1540-6210.2007.00727.x
Massarsky, C. W., & Beinhacker, S. L. (2002). Enterprising nonprofits: Revenue generation in
the nonprofit sector. Retrieved from http://www
.centreonphilanthropy.org/files/kb_articles/1250274914Enterprising_Nonprofits

ASBE 40TH Annual Conference
229
Memphis, TN, September 24-26, 2014
Massetti, B. L. (2008). The social entrepreneurship matrix as a “tipping point” for economic
change. Emergence: Complexity & Organization, 10(3), 1–8.
McBrearty, S. (2007). Social enterprise—A solution for the voluntary sector? Social Enterprise
Journal, 3(1), 67–77.
Meehan, J., & Wright, G. H. (2011). The origins of power in buyer–seller relationships.
Industrial Marketing Management, 9(15), 669–679. doi:10.1016/j.indmarman
.2011.09.015
Moizer, J., & Tracey, P. (2010). Strategy making in social enterprise: The role of resource
allocation and its effects on organizational sustainability. Systems Research & Behavioral
Science, 27(3), 252–266. doi:10.1002/sres.1006
National Center for Charitable Statistics. (n.d.). [Home page.] Retrieved from http://nccs
.urban.org/database/
National Council of Nonprofits. (2010). Costs, complexification, and crisis: Government’s
human services contracting “system” hurts everyone (Special report). Retrieved from
http://www.councilofnonprofits.org
Nunnally, J. C. (1978). Psychometric theory (2nd ed.). New York, NY: McGraw-Hill.
Pfeffer, J., & Salancik, G. R. (2003). The external control of organizations: A resource
dependence perspective. Stanford, CA: Stanford University Press. (Original work
published 1978)
Raboteau, A. J. (1978). Slave religion: The “invisible institution” in the antebellum South. New
York, NY: Oxford University Press.
Seanor, P., & Meaton, J. (2007). Making sense of social enterprise. Social Enterprise Journal,
3(1), 90–99.
Snavely, K., & Tracy, M. B. (2000). Collaboration among rural nonprofit organizations.
Nonprofit Management and Leadership, 11(2), 145–162. doi:10.1002/nml.11202
Social Enterprise Alliance. (n.d.). What is social enterprise? Retrieved from https://www
.se-alliance.org/what-is-social-enterprise
Svensson, G. (2004). Vulnerability in business relationships: The gap between dependence and
trust. Journal of Business & Industrial Marketing, 19(7), 469–483.
Thompson, J. D. (1967). Organizations in action: Social science bases of administrative theory.
New York, NY: McGraw-Hill.

ASBE 40TH Annual Conference
230
Memphis, TN, September 24-26, 2014
Trussel, J. M. (2002). Revisiting the prediction of financial vulnerability. Nonprofit Management
& Leadership, 13(1), 17–31.
Trussel, J. M., & Greenlee, J. (2004). A financial rating system for nonprofit organizations.
Research in Government and Nonprofit Accounting, 11, 105–128.
Tuckman, H. P., & Chang, C. F. (1991). A methodology for measuring the financial vulnerability
of charitable nonprofit organizations. Nonprofit and Voluntary Sector Quarterly, 20(4),
445–460. doi:10.1177/089976409102000407
VanSandt, C., Sud, M., & Marmé, C. (2009). Enabling the original intent: Catalysts for social
entrepreneurship. Journal of Business Ethics, 90, 419–428. doi:10.1007
/s10551-010-0419-z
Warm, J. J. (2004). From good to gold: Predicting nonprofit engagement in entrepreneurial
activity. Doctoral dissertation, University of Kansas, Kansas City, MO.
Wimberley, R. C., & Morris, L. V. (1996). The reference book on regional well-being: U.S.
regions, the Black Belt, Appalachia (Report No. 143). Retrieved from ERIC database.
(ED403098)
Yan, W., Denison, D. V., & Butler, J. S. (2009). Revenue structure and nonprofit borrowing.
Public Finance Review, 37, 47–67. doi:10.1177/1091142108321239

ASBE 40TH Annual Conference
231
Memphis, TN, September 24-26, 2014
“The State of Entrepreneurship in Iraq— A First-Hand Experience”
William T. Jackson, USF St. Petersburg
Abstract
Implications of the future of entrepreneurship in Iraq are discussed from both a personal
experience as well as secondary research. The focus of this discussion uses criteria from both the
Global Entrepreneurship Report model as well as theoretical underpinnings of entrepreneurship
theory. Findings point toward a difficult task for integrating entrepreneurial thinking and action
into the Iraqi culture.

ASBE 40TH Annual Conference
232
Memphis, TN, September 24-26, 2014
“ADVANCED BUSINESS MODEL APPLICATIONS IN TEACHING”
Daniel James Scott, USF St. Petersburg
Workshop Summary
The business model canvas holds secrets your students simply haven’t found yet. There
are nuances hidden in its nooks that can help shape students into better entrepreneurs. They can
more effectively evaluate their new ventures, pitch with more confidence, and execute with more
precision. Learn about these advanced concepts, how to apply them to the classroom, and make
your students even more successful.

ASBE 40TH Annual Conference
233
Memphis, TN, September 24-26, 2014
"ART, WAR, AND B-SCHOOL INNOVATION"
Nathan Schwagler, USF St. Petersburg
Workshop Summary
The tools of artistry are many and diverse; however, three stand out as paramount to
entrepreneurship and entrepreneurship education: observation, imagination, and visualization.
Perhaps counterintuitive to our understanding of military conflict, these tools of art are also
evidenced in theatres of warfare. This workshop will highlight a case example of artistic
innovation influencing strategy in WWII, and demonstrate how the tools of artists, designers, and
creative problem solvers are directly applicable to the way we design and deliver experiential
entrepreneurship and innovation education within the B school.

ASBE 40TH Annual Conference
234
Memphis, TN, September 24-26, 2014
Training and Educating Grass-Root Leaders in Entrepreneurship and Rural
Development for the 22nd Century Utilizing the Teen Reaching Youth
(TRY) Model and Other Approaches
Chyi-Lyi (Kathleen) Liang, University of Vermont
Paul Dunn, University of Louisiana Monroe
Introduction and Purpose
The purpose of this workshop is to discuss alternative approaches to youth
entrepreneurship and rural development. Understanding the rural development is a long term
process of creating new enterprises, aiding existing businesses to expand and to attract, where
practical and possible existing businesses. The first and second alternatives imply developing
entrepreneurial friendly communities. Our purpose is to explore the first two with our
colleagues.
We will do this by showing two approaches that have been and/or are being used and
asking our colleagues to share other approaches that they have developed or seen. Impact
analysis, evaluation tools, and program development guides will also be shared. Colleagues are
encouraged to bring a one-page handout of other approaches.
Approach 1:
We will share how we propose to design, develop, integrate, and implement an
innovative multi-tier training/education/leadership program that will generate enduring impacts
and build a legacy for young people in rural communities. Teens Reaching Youth (TRY) for
Entrepreneurship and Rural Development offers a combined experiential learning and service
learning opportunity that is teen-led (grades 8-12) and mentor guided to teach the functions and
interactions of entrepreneurship and rural development issues to younger children (grades K-3),

ASBE 40TH Annual Conference
235
Memphis, TN, September 24-26, 2014
while giving teens the opportunity to become agents of positive change in their communities and
families.
The idea of the multi-tier training/education/leadership program is to improve the
leadership capacity of teens and the knowledge level in entrepreneurship and rural development
of both teens and young children. Over time teens will gain leadership skills through teaching the
TRY lessons, and young children will gain more knowledge about entrepreneurship and its
interactions with our communities by learning about integrated entrepreneurship subjects. As this
project evolves over time, all participants (teens, K-3 children, mentors, families, and other
collaborators) will increase their understanding, appreciation, and awareness of the
entrepreneurship and its contribution to rural development and our society.
The purpose of this project is to strengthen youth entrepreneurship development in the
rural environment, to improve knowledge and awareness of entrepreneurship by integrating the
most recent research-based information. Vermont is one of the most rural states in the United
States with more than 80 percent of the population living in rural communities. There has been a
growing trend in labor out-migration among young people between 18 and 25 years old. It is
essential to assist young people living in rural environments to access education and training that
will support them to identify or create opportunities where they are. The UVM College of
Agriculture and Life Sciences and Extension has excellent resources and sufficient capacity to
design and deliver this project that will (1) enhance our existing connections with
entrepreneurship and rural communities; (2) expand our existing effort to develop innovative
curricula for youth entrepreneurship education; and (3) encourage teens and youth to practice
leadership skills through experiential and service learning.
Measurable, result-oriented objectives for TRY model:

ASBE 40TH Annual Conference
236
Memphis, TN, September 24-26, 2014
Objective 1: to design, modify, pre-test, and implement a set of curricula focused on youth
entrepreneurship and rural development issues by incorporating (1) existing 4-H youth
agricultural training materials, (2) existing TRY for the Environment program model at
UVM, (3) existing Entrepreneurship, Leadership and Community Engagement program
at UVM, and (4) the most current new research-based information about entrepreneurship
and rural development with experiential learning components that are age appropriate for
K3rd
grade youth education.
Objective 2: to offer entrepreneurship and rural development training and education to teens,
mentors, and K-3 youth. Teens will demonstrate practicing new techniques/activities to
better prepare youth to develop life and job skills, and K-3 youth and their families will
receive information and gain knowledge to raise their awareness of entrepreneurship
issues which will lead to positive changes in their understanding, decisions, and actions
with respect to their life and their rural communities.
Tier 1 – recruit/train new teen participants, and teach K-3 for the first time using intro-level
curriculum.
Tier 2 – continue to train new teams to teach intro-level curriculum, support returning teams to
recruit new teams, and to train returning teams to teach advanced curriculum.
Tier 3 – teens who are qualified in attending UVM Summer Academy Entrepreneurship,
Leadership and Community Engagement course will apply and attend this advanced training
opportunity. In this course, teens will design, plan, and implement their own entrepreneurial
projects that will directly benefit their own communities.
(Note: Our goal in year 1 is to recruit 12 teams who will teach the program 2 times - each time
reaching 15 or more youth. We will reach 360+ K-3 youth plus 24-48 teens and 12 mentors in

ASBE 40TH Annual Conference
237
Memphis, TN, September 24-26, 2014
year 1. In year 2 some of these teams will want to continue and we will recruit some new teams
to maintain a 12-team structure. So each year we would reach 360+ K-3 youth with the
programming, and 24-28 teens and 12 mentors. Over 3 years we will reach 1080+ K-3 youth
with lessons and all of the teens and mentors.)
Objective 3: to attend and present TRY for Entrepreneurship and Rural Development program to
at least 10 professional organizations, farm association meetings, and extension development
workshops (we can present on site or use extension system to conduct webinars) in 3 years to
share our curriculum and program model with other educators and researchers in the Northeast
region, and to create collaborative efforts across states for long-term planning an
implementation.
Approach 2:
Camp Enterprise was a program that was successfully developed and run by the
Entrepreneurship Studies Center faculty of the University of Louisiana at Monroe in cooperation
with the Rotary Clubs of Louisiana. Students were recruited and sponsored by Rotary Clubs.
The cost for each student (approximately $250) was paid by the Rotary Club. Students were
brought to the ULM campus for 4 days. Students checked in on Sunday afternoon. At 6 p.m. on
Sunday, students were given and overview and orientation to the program by the faculty and
several regional entrepreneurs.
On Monday morning, students were asked to identify an entrepreneurial idea they wanted
to explore during camp. During the morning each student working with faculty began the
development of various aspects of their concept. During the early afternoon, students were
transported to three successful entrepreneurial firms to see the venture close up and personal with

ASBE 40TH Annual Conference
238
Memphis, TN, September 24-26, 2014
a tour introduction by the entrepreneur and a guided tour by the entrepreneur and their
employees. A Q & A Session with the entrepreneur occurred at the end of the tour.
After dinner, students continued the development of their concept while interacting with
other campers and selected faculty and participating entrepreneurs.
Tuesday and Wednesday were essentially duplicates of Monday with an evening social or
recreational event.
Thursday morning, each camper presented their concept to an audience including their
Rotary sponsor and their parents. A Camp Enterprise Awards Ceremony was held after the
presentations, students were given an opportunity to tour campus and visit the University
Bookstore. The camp ended at 3 p.m. on Thursday.

ASBE 40TH Annual Conference
239
Memphis, TN, September 24-26, 2014