
Proceedings of the 50th Hawaii International Conference on ...
10
1 Tomi Dahlberg Turku School of Economics & Aalto University School of Business, Finland [email protected] Hannu Kivijärvi Aalto University School of Business, Finland [email protected] Timo Saarinen Aalto University School of Business, Finland [email protected] Abstract Cloud computing, a term introduced ten years ago, has proliferated rapidly both in developed and developing economies. Benefit expectations have impacted the rapid usage increase of this technology. We investigated with a five-year longitudinal survey changes in the expectations regarding cloud computing. We also crafted an integrated multilevel model to understand how cloud expectations and cloud readiness influence cloud computing deployment and performance combined with five IT business value (ITBV) factors. We tested empirically the crafted hypotheses and the research model using survey data collected from approximately 200+200 randomly selected business and IT executives in 2014 and 2015. Empirical results confirmed that our research model explained approximately one half of cloud computing performance for both years. 1. Introduction Google, Amazon, and other IT (advisory) service vendors introduced the cloud computing as a term approximately ten years ago, in 2006 [55, 52]. Yet, many authors [e.g. 54, 2, 31] describe cloud computing as an amalgamation of decade-long developments in several IT technologies and more recent service delivery over the Internet [e.g. 52, 53]. Technologies mentioned include various hardware, virtualization and distributed computing technologies [e.g. 52, 31]. Still, the new way to deliver IT as a service is even more emphasized [e.g. 13, 29]. Generic types of cloud computing services include information as a service (IaaS), platform as a service (PaaS), and software as a service (SaaS) [e.g. 52, 31, 8]. On the basis of the relationship between the service provider and the user, cloud computing is classified as public, private, community and hybrid cloud computing [e.g. 52]. Yang and Tate [52] offer several other classifications of cloud computing concepts. Thus it is no wonder that cloud computing has accumulated several definitions. We utilize the NIST definition: “Cloud computing is a model for enabling ubiquitous, convenient, on-demand network access to a shared pool of configurable computing resources (e.g., networks, servers, storage, applications, and services) that can be rapidly provisioned and released with minimal management effort or service provider interaction” [29]. We thus investigate cloud computing deployment and performance at the organizational level. The proliferation of cloud computing has been rapid after 2006. In the country of the present study (Finland), cloud computing penetration surpassed 50 % in companies with 10+ employees in 2014 [40], and increased to 53 % in 2015 with a significant one-year jump in companies with 100+ employees (54 to 73 %) [41]. Rapid penetration of cloud computing has also been reported globally [e.g. 8], both in developed economies, such as Australia [1] and Ireland [5], and in developing economies, such as Kenya, Nigeria, and South Africa [30]. The deployment of cloud computing is, however, still nascent in terms of width and depth [e.g. 28, 31, 8]. The above-cited 2015 study disclosed that email at 37 %, file storing at 30 % and office applications at 24 % usage dominated cloud computing penetration. For ERP and other traditional IT services, the penetration rate reached it highest at the 7 % mark [41]. Academic research on cloud computing started soon after the term was launched. Several early studies published between 2008 and 2012 [e.g. 20, 54, 18, 42, 27, 7, 55, 2] were (partially) conceptual and operational descriptions of cloud computing. In 2012, Yang and Tate [52] and Venters and Whitley [46] summarized and evaluated the achievements of and also gaps in the cloud computing research. After these articles, extensive reviews of prior studies were included in articles on specific topics, most notably cloud adoption [3, 31], cloud success [47] or decisions to transform to the use of cloud computing [28]. The adoption and/or the post-adoption success / performance of cloud computing appear to have been the most popular topics in survey studies [e.g. 13, 27, 24, 47, 31]. Also case study [e.g. 28, 53, 5], interview [e.g. 19, 1, 46] and literature analysis [3] data collection strategies have been applied for cloud computing adoption and success studies. According to Lacity and Reynolds [25] real world cases - up to mid 2013 - were mostly on cost savings, the ability to avoid investments in hardware, software and/or personnel and gaining greater flexibility with the deployment of IT. Recent case studies have described cloud computing’s organizational and business impacts in various activities in organizations ranging in size from SMEs to global companies [e.g. 26, 50, 43, 37]. Against this backdrop, we noted that longitudinal empirical studies on cloud computing expectations and/or cloud computing readiness have not yet been conducted. Moreover, there are very few survey studies, the study of Oliveira et al. [31] being an exception, where survey respondents were recruited on the basis of random sampling. So far it has likely been necessary to recruit survey and interview respondents from early adopters. As the penetration of cloud computing has now surpassed 50 Longitudinal Study on the Expectations of Cloud Computing Benefits and an Integrative Multilevel Model for Understanding Cloud Computing Performance 4251 Proceedings of the 50th Hawaii International Conference on System Sciences | 2017 URI: http://hdl.handle.net/10125/41674 ISBN: 978-0-9981331-0-2 CC-BY-NC-ND
Transcript of Proceedings of the 50th Hawaii International Conference on ...
1
Tomi Dahlberg Turku School of Economics & Aalto
University School of Business, Finland [email protected]
Hannu Kivijärvi Aalto University School of Business,
Finland [email protected]
Timo Saarinen Aalto University School of Business,
Finland [email protected]
Abstract
Cloud computing, a term introduced ten years ago, has proliferated rapidly both in developed and developing economies. Benefit expectations have impacted the rapid usage increase of this technology. We investigated with a five-year longitudinal survey changes in the expectations regarding cloud computing. We also crafted an integrated multilevel model to understand how cloud expectations and cloud readiness influence cloud computing deployment and performance combined with five IT business value (ITBV) factors. We tested empirically the crafted hypotheses and the research model using survey data collected from approximately 200+200 randomly selected business and IT executives in 2014 and 2015. Empirical results confirmed that our research model explained approximately one half of cloud computing performance for both years.
1. Introduction Google, Amazon, and other IT (advisory) service
vendors introduced the cloud computing as a term approximately ten years ago, in 2006 [55, 52]. Yet, many authors [e.g. 54, 2, 31] describe cloud computing as an amalgamation of decade-long developments in several IT technologies and more recent service delivery over the Internet [e.g. 52, 53]. Technologies mentioned include various hardware, virtualization and distributed computing technologies [e.g. 52, 31]. Still, the new way to deliver IT as a service is even more emphasized [e.g. 13, 29].
Generic types of cloud computing services include information as a service (IaaS), platform as a service (PaaS), and software as a service (SaaS) [e.g. 52, 31, 8]. On the basis of the relationship between the service provider and the user, cloud computing is classified as public, private, community and hybrid cloud computing [e.g. 52]. Yang and Tate [52] offer several other classifications of cloud computing concepts. Thus it is no wonder that cloud computing has accumulated several definitions. We utilize the NIST definition: “Cloud computing is a model for enabling ubiquitous, convenient, on-demand network access to a shared pool of configurable computing resources (e.g., networks, servers, storage, applications, and services) that can be rapidly provisioned and released with minimal management effort or service provider interaction” [29]. We thus investigate cloud computing deployment and performance at the organizational level.
The proliferation of cloud computing has been rapid
after 2006. In the country of the present study (Finland), cloud computing penetration surpassed 50 % in companies with 10+ employees in 2014 [40], and increased to 53 % in 2015 with a significant one-year jump in companies with 100+ employees (54 to 73 %) [41]. Rapid penetration of cloud computing has also been reported globally [e.g. 8], both in developed economies, such as Australia [1] and Ireland [5], and in developing economies, such as Kenya, Nigeria, and South Africa [30]. The deployment of cloud computing is, however, still nascent in terms of width and depth [e.g. 28, 31, 8]. The above-cited 2015 study disclosed that email at 37 %, file storing at 30 % and office applications at 24 % usage dominated cloud computing penetration. For ERP and other traditional IT services, the penetration rate reached it highest at the 7 % mark [41].
Academic research on cloud computing started soon after the term was launched. Several early studies published between 2008 and 2012 [e.g. 20, 54, 18, 42, 27, 7, 55, 2] were (partially) conceptual and operational descriptions of cloud computing. In 2012, Yang and Tate [52] and Venters and Whitley [46] summarized and evaluated the achievements of and also gaps in the cloud computing research. After these articles, extensive reviews of prior studies were included in articles on specific topics, most notably cloud adoption [3, 31], cloud success [47] or decisions to transform to the use of cloud computing [28].
The adoption and/or the post-adoption success / performance of cloud computing appear to have been the most popular topics in survey studies [e.g. 13, 27, 24, 47, 31]. Also case study [e.g. 28, 53, 5], interview [e.g. 19, 1, 46] and literature analysis [3] data collection strategies have been applied for cloud computing adoption and success studies. According to Lacity and Reynolds [25] real world cases - up to mid 2013 - were mostly on cost savings, the ability to avoid investments in hardware, software and/or personnel and gaining greater flexibility with the deployment of IT. Recent case studies have described cloud computing’s organizational and business impacts in various activities in organizations ranging in size from SMEs to global companies [e.g. 26, 50, 43, 37].
Against this backdrop, we noted that longitudinal empirical studies on cloud computing expectations and/or cloud computing readiness have not yet been conducted. Moreover, there are very few survey studies, the study of Oliveira et al. [31] being an exception, where survey respondents were recruited on the basis of random sampling. So far it has likely been necessary to recruit survey and interview respondents from early adopters. As the penetration of cloud computing has now surpassed 50
Longitudinal Study on the Expectations of Cloud Computing Benefits and an Integrative Multilevel Model for Understanding Cloud Computing Performance
4251
Proceedings of the 50th Hawaii International Conference on System Sciences | 2017
URI: http://hdl.handle.net/10125/41674ISBN: 978-0-9981331-0-2CC-BY-NC-ND
2
% in many economies, we believe the research should be directed toward investigating the post- adoption performance of cloud computing. The purpose of this article, therefore, is to contribute to the overall cloud computing research by addressing these particular issues.
With our longitudinal study, we investigated changes in six typical cloud computing benefit-inhibitor expectation variables and in three cloud computing readiness variables during the years of 2011-2015. We used the data of annual surveys collected by a national information processing association from randomly selected business and IT executives with an emphasis on organizations with more than 500 employees. Since cloud computing penetration reached 50 percent in 2014 we used the same data to test a multilevel model on cloud computing deployment and performance with data collected in 2014 and 2015. We developed the multilevel model inspired by IT business value research, especially by the work of Kohli and Grover [22] and Schreyen [38]. The objective of our study is to answer the following two research questions:
How have business and IT executives’ perceptions about cloud computing expectations and cloud readiness changed during the investigated five-year period? And
What are the influences of cloud computing expectations, cloud readiness and IT/IS business value factors in isolation and as a multilevel model on cloud computing performance?
The rest of this article is organized as follows. For theoretical background, we first depict cloud computing benefit expectations and cloud readiness factors. We then discuss how those two factors, together with the factors taken from the IT business value research, act as hypothesized antecedents to actual cloud computing performance. We summarize the theoretical background by offering a research model and hypotheses. We then explicate the research methods used and the empirical data collected. Afterwards, we report the results of the study and end with a discussion on contributions and conclusions.
2. Theoretical background
2.1. Cloud benefit expectations and readiness
Prior studies cite similar benefit/payoff expectations as
the drivers of cloud computing adoption and/or success, e.g., cost savings and flexibility. Prior studies also depict similar inhibitors to cloud computing, e.g., data security. Expected benefits and inhibitors can be seen as two sides of the same variable(s) [e.g. 37]. For example, some business or IT executives could assess that data security is a risk and deem that the assessed data security risk should inhibit their organization’s willingness to adopt and use cloud computing. Other executives could consider cloud computing to be more secure due to cloud service providers’ sophisticated and well documented security processes, resources and highly skilled professionals. We follow the reasoning wherein expected cloud computing benefits and inhibitors are defined as the two ends of a variable scale. In our study, Likert scale is used to do that.
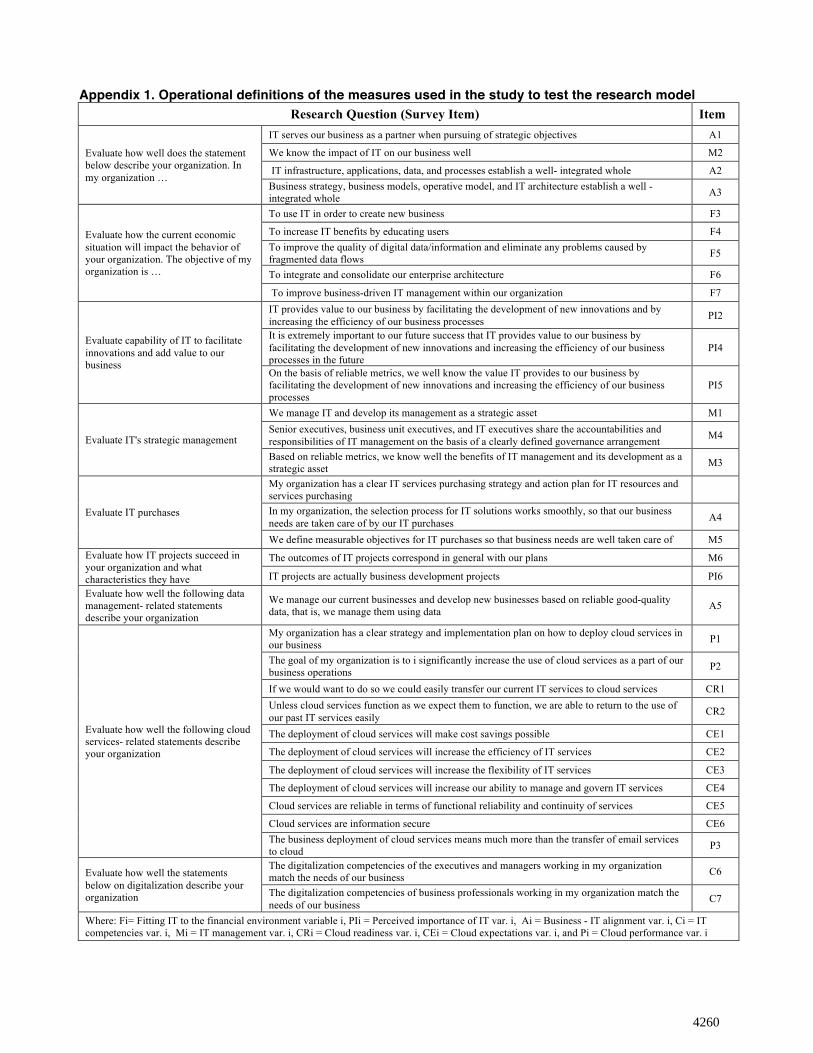
We crafted Table 1 by including six common cloud computing benefit-inhibitor variables and three cloud readiness variables as the first column of the table. In this research, these variables constitute the cloud computing benefit expectations and cloud readiness factors. The exact wording of variables as survey items is offered in Appendix 1, together with other survey items. We applied the DeLone-McLean IS success framework [32] and prior cloud computing research to select the benefit-inhibitor variables. We did, however, include only those constructs in the DeLone-McLean framework that we deemed relevant for evaluating cloud computing benefit expectations. References to the DeLone-McLean frame-work constructs are shown in the second column of Table 1. Both cloud computing benefit expectations and cloud readiness variables have synonyms in prior research. Those are shown as the third column in Table 1. The first annual survey to include cloud computing variables was conducted in late 2011. For this reason, the cloud computing expectations variables were frozen in 2011 so as to collect consistent data. Table 1 indicates that the cloud computing benefit expectation variables that were defined for the 2011 survey are still used in cloud computing research.
On the basis of past cloud computing research, we hypothesize that cloud computing benefit expectations positively impact cloud computing performance. We also hypothesize that the cloud readiness factor influences both cloud computing benefit expectations and cloud computing performance positively.
2.2. Business – IT value research factors impacting cloud computing performance
Prior studies have used several different theories and models as their theoretical background to investigate cloud computing adoption, post-adoption, and success. Garrison et al. [13] applied the resource based view (RBV) [4] and examined the success of cloud computing deployment. Oliveira et al. [31] compared the diffusion of innovations (DOI) [35] and the technology-organization-environment (TOE) (44] models in their study on the adoption of cloud computing. Low et al. [27] also used the TOE model. Chebrolu [7] investigated, how cloud adoption and strategic business-IT alignment impact IT effectiveness. Dembla et al. [9] used the DeLone and Mclean IS success framework [32]. All the mentioned theories and models are organization level theories or models and potentially are suited to our organizational level research approach. Yet, we decided to base our research on an IT-business value (ITBV) approach [22, 38] for the following reasons:
First, DOI and TOE are innovation/technology adoption models whereas we investigate cloud computing deployment and performance, that is, post adoption behavior, and not adoption. Furthermore, DOI and TOE models treat the factors of the respective models independent, whereas our model, built on the ITBV research, postulates interrelations and path dependencies between the model factors, and also depicts influences between the different levels of the research model.
4252
3
Table 1. Cloud computing benefit-inhibitor and readiness variables in our study, relation to the constructs in the DeLone-Mclean Framework, and synonyms to our variables in prior studies Cloud Computing Variable Construct in DeLone-
McLean Framework Synonyms and Their References
Cloud (benefit) Expectation Cost savings Cost reduction Lower investments/capital expenditures [54,13, lower costs [54, 13, 46, 7, 28*, 50*,
39*, 37*, 3*], cost reductions [55, 52 31*], pay as you go/use [42, 2], relative advantage [9, 31*]
Efficiency of IT services Net benefits Economies of scale [54, 13. 19, 2], cost-effectiveness [13], simple delivery [42], efficiency [46, 7], short implementation time [50*]
Flexibility of IT services Operational performance, development performance
Easy/ubiquitous access [54, 25], sourcing independence [18], location independence [25] infinite resources / scalability [2, 50*, 37*], creativity [46], flexibility [55, 7, 37*, 31*], variety [46]
Manageability of IT services Strategic alignment Manageability [55] Increased business agility [13], focus on core competencies [13, 31*], performance/transformation of IT [13, 7, 39*], create new business [39*]
Reliability/continuity Technical quality, IS service quality
(Reduced) business risks [54, 19, 52, 46, 7, 50*, 31*], interoperability [55] trust in cloud vendor - fear of vendor lock [13, 42] Business benefit –risk patters [19], sufficiency of functionality [50*], continuity [2],
Data Security Information quality Confidentiality/security [54, 52, 46, 7, 2, 50*, 37*, 31*], Information sharing [13], protection/control [13]
Cloud Readiness Ability to transform to cloud Architecture readiness/adaptability [54, 13], cloud / technology readiness/non [13, 26,
37*, 3*, 31*, 28*], virtual business environment [25], transferability / adaptability [25, 55], mix of cloud and traditional IT services [26, 50*], integration [39*]
Ability to return from cloud Controlled interface [25], architecture [19] non-cloud-able [37*] Strategy for (out)sourcing Sourcing strategy including clouds [28*, 13, 39*, 37*]
* Study published after 2011/12 – following the first annual survey that was conducted to compile data used in the present research
Secondly, research models that follow the ITBV approach consider business-IT alignment, resources and capabilities and IS success as internal factors of those models (=value antecedents). Both business-IT alignment and competencies are important factors in our multilevel research model. In line with the ITBV research approach we described the connection between the DeLone-McLean IS success framework [32] and cloud computing expectations in Section 2.1. Our research investigates cloud computing deployment and performance as the outcome factor, not IS success. Deployment and performance have strong organizational behavior connotations, partly as the consequences of IS success. In the ITBV approach, most DeLone-McLean model factors are regarded as antecedents to short-term and long-term organizational performance.
The ITBV models of [22] and [38] differ in their details, but both are multilevel and the compositions of levels are fairly similar. These levels include the environment (of an organization, typically expressed as IT investments), the (internal) processes and competencies of the organization, technologies deployed by the organization, and the outcomes. Environment impacts the organization and the deployment of technology, which then influence short-term and long-term organizational performance (outcomes). Our multilevel research model follows the same logic, namely, environmental level – organizational level - technology level – outcomes. We divide the technology level into generic and specific cloud computing technology levels. The previously discussed cloud computing expectation and readiness factors constitute the specific cloud computing technology level. We point out that the outcome factor in our model, i.e., cloud computing deployment and performance, does not include long-term organizational benefits. The reason is
that time delays happen between short-term and long-term organizational benefits [see e.g., 38], which even longitudinal survey studies only seldom capture.
The mentioned ITBV models [22, 38] are vague on how they describe the relationships between ITBV factors. ITBV factor relationships in different contexts, such as cloud computing, as well as the isolated and combined influences of ITBV factors and their relationships on organizational outcomes are seen as promising future research topics in ITBV research [22, 38]. We crafted our research model inspired by this ITBV research opportunity/gap and the conceptually rich prior ITBV research. The levels and the factors of each level in our research model with generic hypotheses are the following:
Environmental level: Fitting IT to the financial situation is the environmental level factor in our model. With fit, we understand the degree of compatibility between IT and the organizational context [10]. The survey data to test the research model was collected during two years of economic recession. We reasoned that there could be two complementary approaches that could increase the fit during an economic recession. An organization may cut IT costs, postpone IT investments and other IT developments to increase efficiency, and/or change IT investment behavior by preferring short-return times with low-level risks [e.g. 24]. Secondly, it is possible to improve the quality of data, educate users to deploy IT better, improve IT management capabilities, or consolidate IT to reduce the complexity of IT and thus remove overlapping IT assets through enterprise architectural work [e.g. 22, 49, 33]. We hypothesize that fit positively impacts the perceived importance of IT and cloud benefit expectations. Fit is expected to influence executives’ perceptions about the funds available to IT and thus also available for cloud
4253
4
computing. Appendix 1 lists the specific survey items that were used to test the research model.
Organization level: Our research model includes two factors; perceived importance of IT and business – IT alignment. The findings of the prior research suggest that if IT assets, resources, and capabilities are seen as having the potential to offer competitive advantages to an organization, then that organization will take actions to realize that potential [e.g. 4, 49). That is why we name this factor the perceived importance of IT. We hypothesize that when an organization considers IT as a strategic asset, resource, and capability, then the organization is likely to place more emphasis on business – IT alignment as well as the governance and management of IT and on acquiring IT competencies. The latter two factors are discussed below as factors that refer to the technology level. On the basis of prior research [e.g. 6] we also hypothesize that well executed business - IT alignment influences IT management and IT competencies positively, i.e., generic technology level factors, as well as cloud readiness.
Technology (generic) level: This level of the research model has two factors: competencies and IT management. Prior studies have discovered consistently that IT competencies impact the short-term and long-term outcomes of IT usage positively [e.g. 11]. We hypothesize that IT competencies influence positively cloud readiness and cloud benefit expectations, and through them cloud deployment and performance. Prior studies have also discovered that good IT management and IT governance are positively related to IT performance (e.g. 43, 45, 48]. We hypothesize that good management influences cloud deployment and performance positively.
Cloud computing deployment and performance outcomes: As discussed above, this outcome factor measures short-term performance. We reason that successful deployment and performance means that an organization has a clear strategy for the deployment of cloud computing in business [13, 52, 11, 37] and that an organization will aim to increase the exploitation of this technology in business [31, 28, 32]. We also expect that business deployment of cloud computing is understood to mean more than only the transfer of email service to cloud.
2.3. Research model and hypotheses
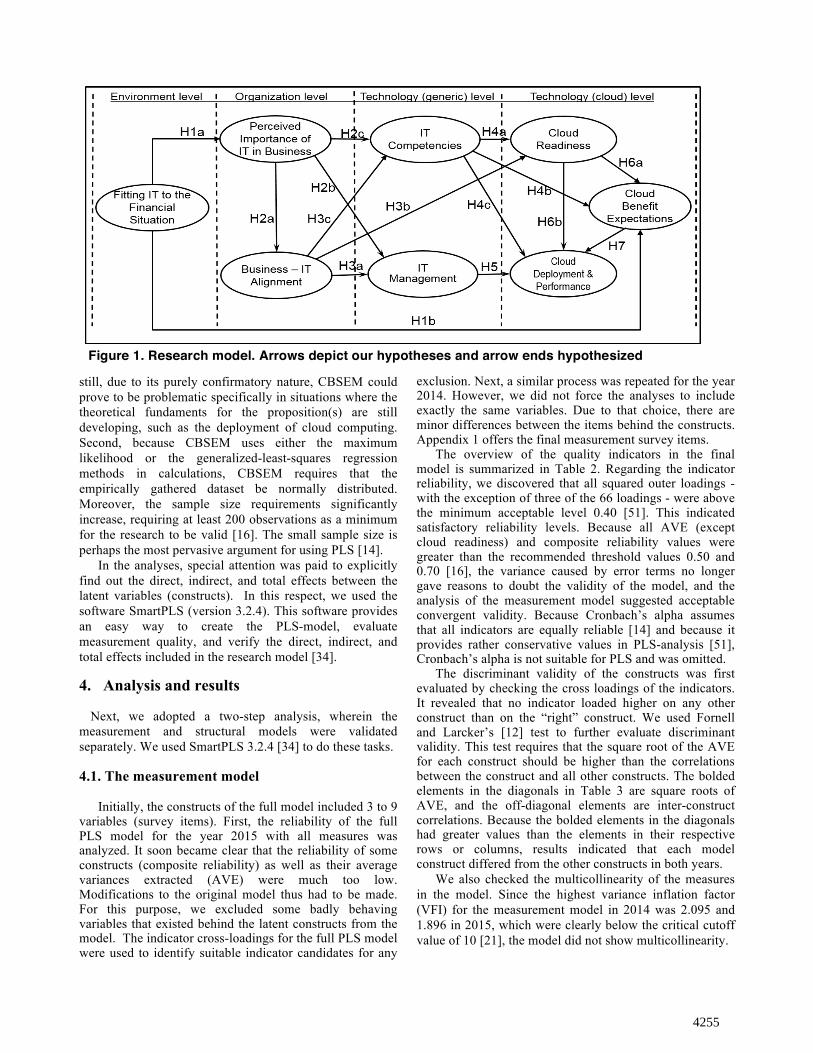
The theoretical research model used in this study is shown in Figure 1. This model builds on the constructs discussed in Sections 2.1 and 2.2, and includes 8 factors. Our research model suggests that there is a relatively complex structure of direct and indirect relationships behind the cloud computing outcomes. In general, we hypothesize that the outcomes are not solely dependent on any single model factor, but on a right combination of these factors. Our hypotheses are the following: H1a: Fitting IT to the financial situation has a positive
direct effect on the Perceived importance of IT. H1b: Fitting IT to the financial situation has a positive
direct effect on Cloud deployment and performance.
H2a: Perceived importance of IT has a positive direct effect on Business – IT alignment.
H2b: Perceived importance of IT has a positive direct effect on IT management.
H2c: Perceived importance of IT has a positive direct effect on IT competencies.
H3a: Business-IT alignment has a positive direct effect on IT management.
H3b: Business-IT alignment has a positive direct effect on Cloud readiness.
H3a: Business-IT alignment has a positive direct effect on IT competencies.
H4a: IT competences has a positive direct effect on Cloud readiness
H4b: IT competences has a positive direct effect on Cloud expectations.
H4c: IT competences has a positive direct effect on Cloud deployment and performance.
H5: IT management has a positive direct effect on Cloud deployment and performance.
H6a: Cloud readiness has a positive direct effect on Cloud expectations.
H6a: Cloud readiness has a positive direct effect on Cloud deployment and performance.
H7: Cloud expectations has a positive direct effect on Cloud deployment and performance.
3. Methodology
To disclose ongoing changes in cloud computing
attitudes and test our research hypotheses, we adopted survey research as the data collection method. We used relatively large, existing data sets called IT-Barometer from years 2011 - 2015. A National Data Processing Association collected the data with our support from business and IT executives, both from companies and public sector organizations focusing on organizations with more than 500 employees. In our study, we used only those survey items of the available data that concentrated on the hypothesized issues. An invitation to participate in the survey along with one reminder was sent annually to approximately 2,000 people. The response rate was 10%, which we regard as normal for surveys sent to executives.
To test the hypotheses of our research model empirically, we applied one form of confirmatory factor analysis (CFA), namely structural equations modeling (SEM). The variance-based SEM - more often referred to as partial least squares (PLS) – was used here instead of covariance-based SEM (CBSEM). This choice was based on three arguments that limit the usage of CBSEM in certain circumstances. First, CBSEM aims to estimate a set of given parameters in such a way that the theorized covariance matrix corresponds as closely as possible to the empirically discovered covariance matrix. This notion fundamentally limits the usability of CBSEM for predicting the future, as the objective is to achieve a fit with the status quo rather than to open ways for alternative solutions [16]. Further
4254
5
still, due to its purely confirmatory nature, CBSEM could prove to be problematic specifically in situations where the theoretical fundaments for the proposition(s) are still developing, such as the deployment of cloud computing. Second, because CBSEM uses either the maximum likelihood or the generalized-least-squares regression methods in calculations, CBSEM requires that the empirically gathered dataset be normally distributed. Moreover, the sample size requirements significantly increase, requiring at least 200 observations as a minimum for the research to be valid [16]. The small sample size is perhaps the most pervasive argument for using PLS [14].
In the analyses, special attention was paid to explicitly find out the direct, indirect, and total effects between the latent variables (constructs). In this respect, we used the software SmartPLS (version 3.2.4). This software provides an easy way to create the PLS-model, evaluate measurement quality, and verify the direct, indirect, and total effects included in the research model [34]. 4. Analysis and results
Next, we adopted a two-step analysis, wherein the
measurement and structural models were validated separately. We used SmartPLS 3.2.4 [34] to do these tasks.
4.1. The measurement model
Initially, the constructs of the full model included 3 to 9
variables (survey items). First, the reliability of the full PLS model for the year 2015 with all measures was analyzed. It soon became clear that the reliability of some constructs (composite reliability) as well as their average variances extracted (AVE) were much too low. Modifications to the original model thus had to be made. For this purpose, we excluded some badly behaving variables that existed behind the latent constructs from the model. The indicator cross-loadings for the full PLS model were used to identify suitable indicator candidates for any
exclusion. Next, a similar process was repeated for the year 2014. However, we did not force the analyses to include exactly the same variables. Due to that choice, there are minor differences between the items behind the constructs. Appendix 1 offers the final measurement survey items.
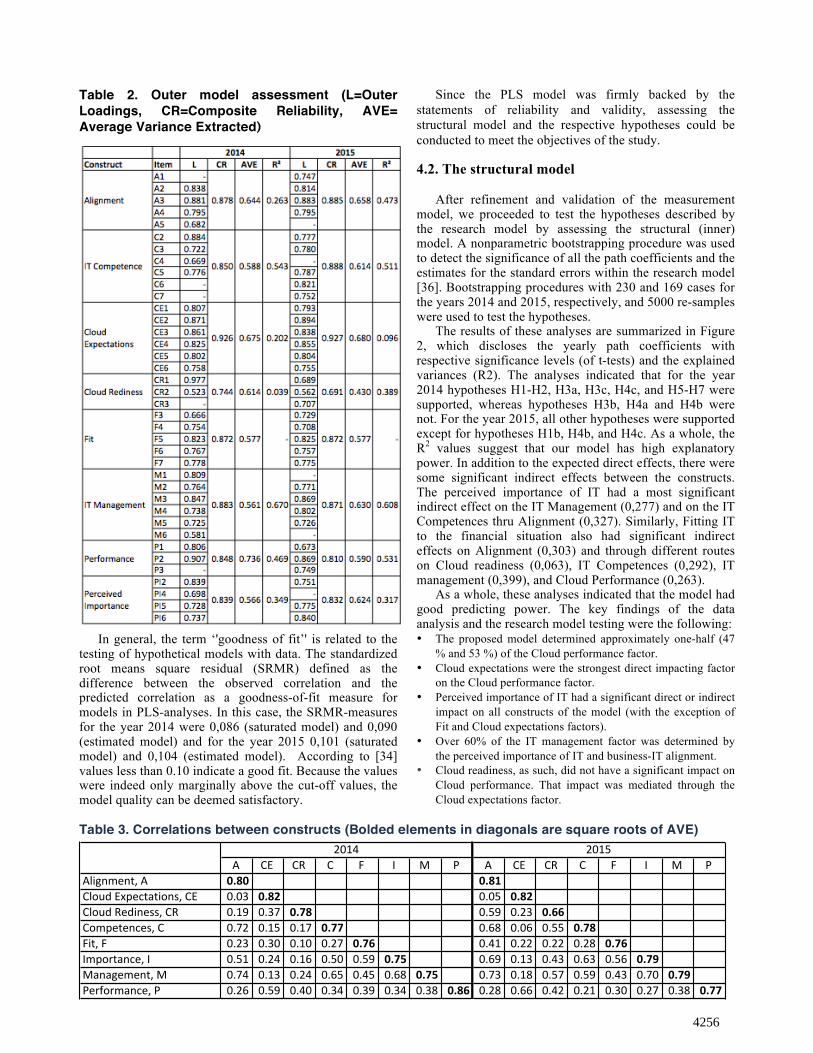
The overview of the quality indicators in the final model is summarized in Table 2. Regarding the indicator reliability, we discovered that all squared outer loadings - with the exception of three of the 66 loadings - were above the minimum acceptable level 0.40 [51]. This indicated satisfactory reliability levels. Because all AVE (except cloud readiness) and composite reliability values were greater than the recommended threshold values 0.50 and 0.70 [16], the variance caused by error terms no longer gave reasons to doubt the validity of the model, and the analysis of the measurement model suggested acceptable convergent validity. Because Cronbach’s alpha assumes that all indicators are equally reliable [14] and because it provides rather conservative values in PLS-analysis [51], Cronbach’s alpha is not suitable for PLS and was omitted.
The discriminant validity of the constructs was first evaluated by checking the cross loadings of the indicators. It revealed that no indicator loaded higher on any other construct than on the “right” construct. We used Fornell and Larcker’s [12] test to further evaluate discriminant validity. This test requires that the square root of the AVE for each construct should be higher than the correlations between the construct and all other constructs. The bolded elements in the diagonals in Table 3 are square roots of AVE, and the off-diagonal elements are inter-construct correlations. Because the bolded elements in the diagonals had greater values than the elements in their respective rows or columns, results indicated that each model construct differed from the other constructs in both years.
We also checked the multicollinearity of the measures in the model. Since the highest variance inflation factor (VFI) for the measurement model in 2014 was 2.095 and 1.896 in 2015, which were clearly below the critical cutoff value of 10 [21], the model did not show multicollinearity.
Figure 1. Research model. Arrows depict our hypotheses and arrow ends hypothesized
4255
6
Table 2. Outer model assessment (L=Outer Loadings, CR=Composite Reliability, AVE= Average Variance Extracted)
In general, the term ‘'goodness of fit’' is related to the testing of hypothetical models with data. The standardized root means square residual (SRMR) defined as the difference between the observed correlation and the predicted correlation as a goodness-of-fit measure for models in PLS-analyses. In this case, the SRMR-measures for the year 2014 were 0,086 (saturated model) and 0,090 (estimated model) and for the year 2015 0,101 (saturated model) and 0,104 (estimated model). According to [34] values less than 0.10 indicate a good fit. Because the values were indeed only marginally above the cut-off values, the model quality can be deemed satisfactory.
Since the PLS model was firmly backed by the statements of reliability and validity, assessing the structural model and the respective hypotheses could be conducted to meet the objectives of the study.
4.2. The structural model
After refinement and validation of the measurement
model, we proceeded to test the hypotheses described by the research model by assessing the structural (inner) model. A nonparametric bootstrapping procedure was used to detect the significance of all the path coefficients and the estimates for the standard errors within the research model [36]. Bootstrapping procedures with 230 and 169 cases for the years 2014 and 2015, respectively, and 5000 re-samples were used to test the hypotheses.
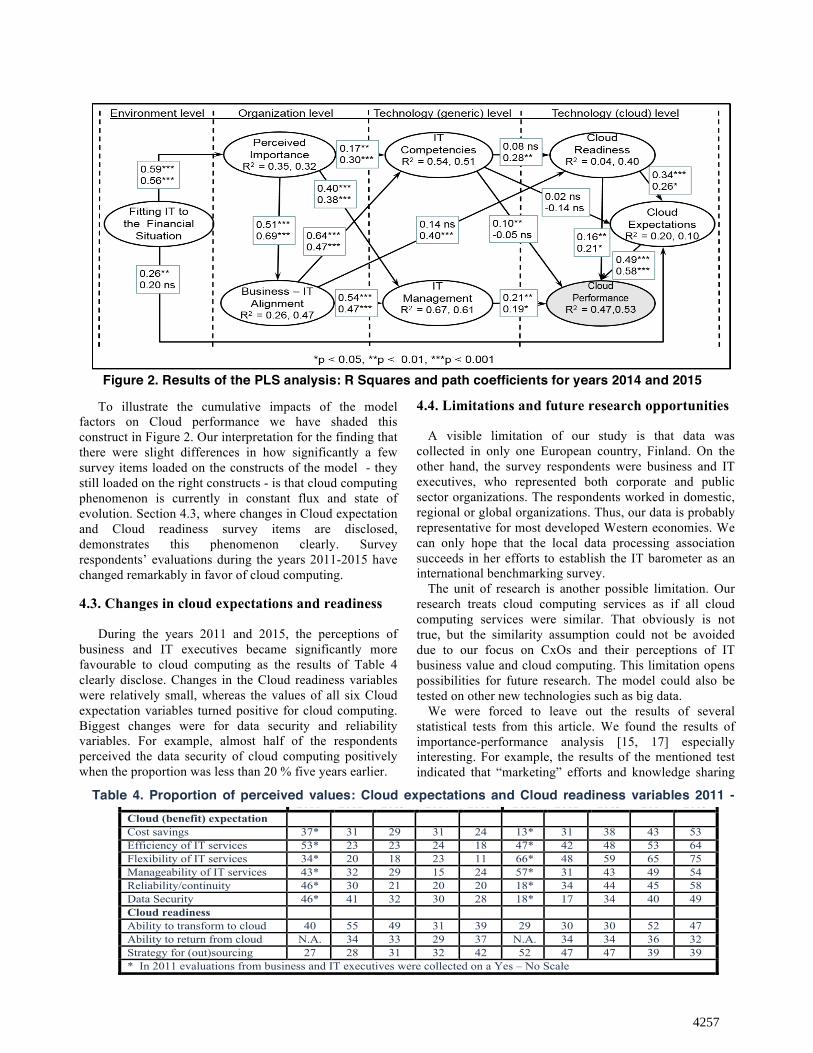
The results of these analyses are summarized in Figure 2, which discloses the yearly path coefficients with respective significance levels (of t-tests) and the explained variances (R2). The analyses indicated that for the year 2014 hypotheses H1-H2, H3a, H3c, H4c, and H5-H7 were supported, whereas hypotheses H3b, H4a and H4b were not. For the year 2015, all other hypotheses were supported except for hypotheses H1b, H4b, and H4c. As a whole, the R2 values suggest that our model has high explanatory power. In addition to the expected direct effects, there were some significant indirect effects between the constructs. The perceived importance of IT had a most significant indirect effect on the IT Management (0,277) and on the IT Competences thru Alignment (0,327). Similarly, Fitting IT to the financial situation also had significant indirect effects on Alignment (0,303) and through different routes on Cloud readiness (0,063), IT Competences (0,292), IT management (0,399), and Cloud Performance (0,263).
As a whole, these analyses indicated that the model had good predicting power. The key findings of the data analysis and the research model testing were the following: • The proposed model determined approximately one-half (47
% and 53 %) of the Cloud performance factor. • Cloud expectations were the strongest direct impacting factor
on the Cloud performance factor. • Perceived importance of IT had a significant direct or indirect
impact on all constructs of the model (with the exception of Fit and Cloud expectations factors).
• Over 60% of the IT management factor was determined by the perceived importance of IT and business-IT alignment.
• Cloud readiness, as such, did not have a significant impact on Cloud performance. That impact was mediated through the Cloud expectations factor.
Table 3. Correlations between constructs (Bolded elements in diagonals are square roots of AVE)
A CE CR C F I M P A CE CR C F I M PAlignment,1A 0.80 0.81Cloud1Expectations,1CE 0.03 0.82 0.05 0.82Cloud1Rediness,1CR 0.19 0.37 0.78 0.59 0.23 0.66Competences,1C 0.72 0.15 0.17 0.77 0.68 0.06 0.55 0.78Fit,1F 0.23 0.30 0.10 0.27 0.76 0.41 0.22 0.22 0.28 0.76Importance,1I 0.51 0.24 0.16 0.50 0.59 0.75 0.69 0.13 0.43 0.63 0.56 0.79Management,1M 0.74 0.13 0.24 0.65 0.45 0.68 0.75 0.73 0.18 0.57 0.59 0.43 0.70 0.79Performance,1P 0.26 0.59 0.40 0.34 0.39 0.34 0.38 0.86 0.28 0.66 0.42 0.21 0.30 0.27 0.38 0.77
2014 2015Table 3. Correlations between constructs (Bolded elements in diagonals are square roots of AVE)
4256
7
To illustrate the cumulative impacts of the model factors on Cloud performance we have shaded this construct in Figure 2. Our interpretation for the finding that there were slight differences in how significantly a few survey items loaded on the constructs of the model - they still loaded on the right constructs - is that cloud computing phenomenon is currently in constant flux and state of evolution. Section 4.3, where changes in Cloud expectation and Cloud readiness survey items are disclosed, demonstrates this phenomenon clearly. Survey respondents’ evaluations during the years 2011-2015 have changed remarkably in favor of cloud computing. 4.3. Changes in cloud expectations and readiness
During the years 2011 and 2015, the perceptions of business and IT executives became significantly more favourable to cloud computing as the results of Table 4 clearly disclose. Changes in the Cloud readiness variables were relatively small, whereas the values of all six Cloud expectation variables turned positive for cloud computing. Biggest changes were for data security and reliability variables. For example, almost half of the respondents perceived the data security of cloud computing positively when the proportion was less than 20 % five years earlier.
4.4. Limitations and future research opportunities
A visible limitation of our study is that data was collected in only one European country, Finland. On the other hand, the survey respondents were business and IT executives, who represented both corporate and public sector organizations. The respondents worked in domestic, regional or global organizations. Thus, our data is probably representative for most developed Western economies. We can only hope that the local data processing association succeeds in her efforts to establish the IT barometer as an international benchmarking survey.
The unit of research is another possible limitation. Our research treats cloud computing services as if all cloud computing services were similar. That obviously is not true, but the similarity assumption could not be avoided due to our focus on CxOs and their perceptions of IT business value and cloud computing. This limitation opens possibilities for future research. The model could also be tested on other new technologies such as big data.
We were forced to leave out the results of several statistical tests from this article. We found the results of importance-performance analysis [15, 17] especially interesting. For example, the results of the mentioned test indicated that “marketing” efforts and knowledge sharing
Figure 2. Results of the PLS analysis: R Squares and path coefficients for years 2014 and 2015
Cloud Computing Variable
Negative evaluations (values 1-3) % Positive evaluations (values 5-7) % 2011 2012 2013 2014 2015 2011 2012 2013 2014 2015
Cloud (benefit) expectation Cost savings 37* 31 29 31 24 13* 31 38 43 53 Efficiency of IT services 53* 23 23 24 18 47* 42 48 53 64 Flexibility of IT services 34* 20 18 23 11 66* 48 59 65 75 Manageability of IT services 43* 32 29 15 24 57* 31 43 49 54 Reliability/continuity 46* 30 21 20 20 18* 34 44 45 58 Data Security 46* 41 32 30 28 18* 17 34 40 49 Cloud readiness Ability to transform to cloud 40 55 49 31 39 29 30 30 52 47 Ability to return from cloud N.A. 34 33 29 37 N.A. 34 34 36 32 Strategy for (out)sourcing 27 28 31 32 42 52 47 47 39 39 * In 2011 evaluations from business and IT executives were collected on a Yes – No Scale
!
Table 4. Proportion of perceived values: Cloud expectations and Cloud readiness variables 2011 - 2015
4257
8
about the benefits of cloud services might have enhanced Cloud Performance positively, whereas generic IT competences were less important, as also Figure 2 shows. 5. Conclusions and discussion The use of cloud computing has proliferated rapidly. Both practitioners and researchers have tried to understand the drivers of this phenomenon. Our literature review, Table 1, showed a myriad of synonyms that have been used to describe the same few cloud computing benefit and inhibitor expectations. We discovered that during the five-year period 2011-2015, the cloud computing expectations held by business and IT executives became much more favourable to the extent that data security and other fears regarding the business risks of cloud computing decreased notably. These findings are our answer to the first research question of the present study.
We also investigated how cloud computing readiness and cloud benefit expectations, together with five IT business value factors, influence cloud computing deployment and performance. Inspired by IT business value research we crafted and verified empirically an integrated multilevel model with a relatively complex structure of direct and indirect relationships situated behind the cloud computing outcome. The model starts with the environment of an organization and moves forward to cloud performance outcomes through the model’s levels - organization, generic technology, and specific cloud computing technology – as well as the path dependencies of those factors. We tested the model using survey data collected from randomly selected CxOs from 2014 and 2015. We were able to explain approximately one half (47 % and 53 %) of Cloud performance in the two respective years. This finding constitutes our response to the second research question raised at the beginning of this article.
We presented future research ideas related to the present article in section 4.4. In addition to those future research ideas we hope that our study encourages other researchers to conduct new cloud computing survey studies by selecting respondents randomly and by conducting longitudinal studies. Cloud computing expectations and Cloud readiness influence Cloud performance. It could be useful to study whether or not cloud computing usage leads to expected benefits, or cloud payoff mantras as [50] calls them. Prior ITBV research [e.g. 22, 38, 6, 11] has discovered that IT competencies are an important determinant for the short-term and the long-term organizational value of IT. In our study, generic IT competencies did not influence cloud performance positively. Is this a more generic phenomenon during the early years in new IT technologies deployment?
Our advice to practitioners is to carefully consider the significance of IT for their various organizational activities, since this factor appeared in our study as the most significant single determinant for the business value of IT. We also urge practitioners to provide experience-based knowledge on cloud computing so as to influence cloud expectations and cloud readiness and improve cloud performance by doing so.
References
[1] Ali, O., Soar, J., McClymont, H., Yong, J. & Biswas, B. (2015). Anticipated Benefits of Cloud Computing Adoption in Australian Regional Municipal Governments. 19th PACIS. http://pacis2015.comp.nus.edu.sg. [2] Armhurst, M., Fox, A., Griffith, R., Joseph A.D., Katz, R., Konwinski, A., Lee, G., Patterson, D., Rabkin, A., Stoica, I. & Zaharia, M. (2010). A View of Cloud Computing. Communications of the ACM 53 (4), 50-58. [3] Asatiani, A. (2015). Why Cloud? - A Review of Cloud Adoption Determinants in Organizations. ECIS 2015, http://aisel.aisnet.org/ecis2015_cr/13. [4] Barney, J.B. (1991). Firm Resources and Sustained Competitive Advantage. Journal of Management, 17 (1), 109–120 [5] Carcary, M., Doherty, E. & Conway, G. (2014). The Adoption of Cloud Computing by Irish SMEs – an Exploratory Study. The Electronic Journal of Information Systems Evaluation 17 (1), 3-14. [6] Chan, Y. & Reich, B. (2007). IT Alignment: What Have We Learned? Journal of Information Technology, 22 (4), 297– 315. [7] Chebrolu, S.B. (2011). Assessing the Relationships among Cloud Adoption, Strategic Alignment and IT effectiveness. Journal of Information Technology Management 22 (2), 13-29. [8] Cisco, (2016). Cisco Global Cloud Index: Forecast and Methodology, 2014–2019 White Paper. Updated April 21, 2016, http://www.cisco.com/c/en/us/solutions/collateral/service-provider/global-cloud-index-gci/Cloud_Index_White_Paper.html. [9] Dembla, P., Flack, C. & Petter, S., (2015). Extending the DeLone and McLean IS Success Model to Cloud Computing. 21st AMCIS, http://aisel.aisnet.org/cgi/viewcontent.cgi. [10] Drazin, R. & Van de Ven. A.H. (1985). Alternative Forms of Fit in Contingency Theory. Administrative Science Quarterly 30 (4), 514-539. [11] Feeny, D. and Willcocks, L. (1998). Core IS Capabilities for Exploiting Information Technology. Sloan Management Review, 39 (3), 9-21. [12] Fornell, C. & Larcker, D. F. (1981). Evaluating structural equation models with unobservable variables and measurement error. Journal of Marketing Research, 18 (1), 39-50. [13] Garrison, G., Kim, S. & Wakefield, R.L. (2012). Success Factors for Deploying Cloud Computing. Communications of the ACM 55 (9), 62-68. [14] Hair, J. F., Sarstedt, M., Ringle, C. M. & Mena, J. A. (2012) An assessment of the use of partial least squares structural equation modeling in marketing research”, Journal of the Academy of Marketing Science 40 (3), 414-433. [15] Hair, J., Hult, G., Ringle, C. & Sarstedt, M. (2014). A Primer on Partial Least Squares Structural Equation Modeling (PLS-SEM). Sage: Thousand Oaks. [16] Hair, J.F, C. Ringle, C.M. & Sarstedt, M. (2011). “PLS_SEM: Indeed a Silver Bullet”, Journal of Marketing Theory and Practice, 19 (2). 139-151. [17] Höck, C. Ringle, C. M. & Sarstedt, M. (2010). Management of Multi-Purpose Stadiums: Importance and Performance Measurement of Service Interfaces. International Journal of Services Technology and Management, 14 (2), 188-207. [18] Iyer, B. & Henderson, J. (2010). Preparing for the Future: Understanding the Seven Capabilities of Cloud Computing. MIS Quarterly Executive 9 (2), 117-131.
4258
9
[19] Iyer, B. & Henderson, J. (2012). Business Value from Clouds: learning from users. MIS Quarterly Executive 11 (1), 51-60. [20] Kim, W., Kim, S.D., Lee, E. & Lee, S. (2009). Adoption Issues for Cloud Computing. Proceedings of the 7th International Conference on Advances in Mobile Computing and Multimedia. http://dl.acm.org/citation.cfm? id=1806341. [21] Kleinbaum, L., Kupper, L., & Muller, K.E. (1988). Applied regression analysis and other multivariate methods, 2nd ed. Boston, MA: PWS-Kent. [22] Kohli, R. & Grover, V. (2008). Business Value of IT: An Essay on Expanding Research Directions to Keep up with the Times. Journal of the Association for Information Systems, 9 (1), 23-39. [23] Kohli, R., Devaraj, S., & Ow, T.T. (2012). Does Information Technology Investment Influence a Firm’s market Value? A Case of Non-Publicly Traded Healthcare Firms. MIS Quarterly, 36 (4), 1145–1163. [24] Lacity, M. C. & Willcocks, L.R. (2013). Cloud Services Forecast: Rain and Shine. Pulse, (May/June), 16-21. [25] Lacity, M.C. & Reynolds, P. (2014). Cloud Services Practices for Small and Medium-Sized Enterprises. MIS Quarterly Executive 13 (1), 31-44. [26] Loebbecke, C., Thomas, B. & Ullrich, T. (2012). Assessing Cloud Readiness At Continental Ag. MIS Quarterly Executive 11 (1), 11-23. [27] Low, C., Chen, Y. & Wu, M. (2011). Understanding the determinants of cloud computing adoption. Industrial Management & Data Systems 111 (7), 1006-1023. [28] Maklouf, M., Allal-Cherif, O. & Dumas, M. (2016). Determinants of the Decision to Transform Towards Cloud: an Exploratory Analysis of 225 CISCO Case Studies. 49th HICSS, IEEE xplore, 3948-3958. [29] Mell, P. and Grance, T. (2011). The NIST definition of cloud computing, recommendations of the National Institute of Standards and Technology, Special Publication 800-‐145. http://csrc.nist.gov/publications/nistpubs/800-‐145/SP800-‐145. [30] Muhammed, K., Zaharaddeen, I., Rumana, K. & Turaki, A.M. (2016). Cloud Computing Adoption in Nigeria: Challenges and Benefits. Proceedings of The Fourth Academic Conference of Mediterranean Research. [31] Oliveira, T., Thomas, M. & Espanadal, M. (2014). Assessing the determinants of cloud computing adoption: An analysis of the manufacturing and services sectors. Information & Management 51 (5), 497-510. [32] Petter, S., DeLone, W., McLean, E.R. (2011). The Past, Present, and Future of “IS Success”. Journal of the AIS 13 (Special Issue), 341-362. [33] Pollalis, Y. (2003). Patterns of Co-alignment in Information intensive Organizations: Business Performance Through Integration Strategies. International Journal of Information Management 23 (6), 469–492. [34] Ringle, C. M., Wende, S. & Becker, J.-M. (2015). SmartPLS 3. Boenningstedt: SmartPLS GmbH, http://www.smartpls.com. [35] Rogers, E.M. (2003). Diffusion of Innovations, 5th ed. Free Press, New York. [36] Sattler, H., Völckner, F., Riediger, C. & Ringle, C.M. (2010). The Impact of Brand Extension Success Factors on Brand
Extension Price Premium, International Journal of Research in Marketing 27 (4), 319-328. [37] Schlagwein, D., Thorogood, A., Willcocks, L.P. (2014). How Commonwealth Bank of Australia Gained Benefits Using a Standards- Based, Multi-Provider Cloud Model. MIS Quarterly Executive 13 (4), 209-222. [38] Schreyen, G. (2013). Revisiting IS Business Value Research: What We Already Know, What We Still Need to Know, and How We Can Get There. European Journal of Information Systems, 22 (November), 139–169. [39] Stamas, P.J., Kaarst-Brown, M.L. & Bernard, S.A. (2014). The Business Transformation Payoffs of Cloud Services at Mohawk. MIS Quarterly Executive 13 (4), 177-192. [40] Statistics Finland 2014, ICT in companies 2014. [41] Statistics Finland 2015, ICT in companies 2015. [42] Sultan N.A. (2011). Reaching for the “cloud”: How SMEs can manage? International Journal of Information Management 31 (3), 272–278. [43] Tallon, P.P., Ramirez, V., & Short, J.E. (2013). The Information Artifact in IT Governance: Toward a Theory of Information Governance. Journal of Management Information Systems, 30 (3), 141–177. [44] Tornatzky, L.G. & Fleischer, M. (1990) The Processes of Technological Innovation. Lexington Books, Massachusetts. [45] Van Grembergen, W. & De Haes, S. (2008). Implementing Information Technology Governance: Models, Practices and Cases. Idea Group Global, Hershey. [46] Venters, W., Whitley, E.A. (2012). A critical review of cloud computing: Researching desires and realities. Journal of Information Technology 27 (2), 179–197. [47] Walther, S., Sedera, D., Sarker, S. & Eymann, T. (2013) Evaluating Operational Cloud Enterprise System Success: An Organizational Perspective. ECIS 2013, http://aisel.aisnet.org. [48] Weill, P. & Ross, J. (2005). A Matrixed Approach to Designing IT Governance. Sloan Management Review, 40 (2), 26-34 [49] Wiengarten, F., Humphreys, P., Cao, G., & McHugh, M. (2013). Exploring the Important Role of Organizational Factors in IT Business Value: Taking a Contingency Perspective on the Resource-Based View. International Journal of Management Reviews 15 (1), 30–463. [50] Winkler, T.J., Piper, M., Benlian, A. & Hirsch, H. (2014). Bayer HealthCare Delivers a Dose of Reality for Cloud Payoff Mantras in Multinationals. MIS Quarterly Executive 13 (4),. [51] Wong, K. K. (2013) Partial least squares structural equation modeling (PLS-SEM) techniques using SmartPLS. Marketing Bulletin 24(1), 1-32. [52] Yang, H. & Tate, M. (2012). Descriptive Literature Review and Classification of Cloud Computing Research. Communications of the AIS 31(Article 2), 35-60. [53] Yarlikas, S., Bilgen, S. (2013). Cloud Computing Effectiveness Assessment. International Journal of Cloud Computing and Services Science 2 (4), 226~248. [54] Zhang, Q., Cheng, L. & Boutaba, R., (2010). Cloud computing: state-of-the-art and research challenges. Journal of Internet Services and Applications 1(1), 7–18. [55] Zissis, D. & Lekkas, D. (2012). Is cloud computing finally beginning to mature? International Journal of Cloud Computing and Services Science 1(4). 172~175.
4259
10
Appendix 1. Operational definitions of the measures used in the study to test the research model Research Question (Survey Item) Item
Evaluate how well does the statement below describe your organization. In my organization …
IT serves our business as a partner when pursuing of strategic objectives A1
We know the impact of IT on our business well M2
IT infrastructure, applications, data, and processes establish a well- integrated whole A2 Business strategy, business models, operative model, and IT architecture establish a well -integrated whole A3
Evaluate how the current economic situation will impact the behavior of your organization. The objective of my organization is …
To use IT in order to create new business F3
To increase IT benefits by educating users F4 To improve the quality of digital data/information and eliminate any problems caused by fragmented data flows F5
To integrate and consolidate our enterprise architecture F6
To improve business-driven IT management within our organization F7
Evaluate capability of IT to facilitate innovations and add value to our business
IT provides value to our business by facilitating the development of new innovations and by increasing the efficiency of our business processes PI2
It is extremely important to our future success that IT provides value to our business by facilitating the development of new innovations and increasing the efficiency of our business processes in the future
PI4
On the basis of reliable metrics, we well know the value IT provides to our business by facilitating the development of new innovations and increasing the efficiency of our business processes
PI5
Evaluate IT's strategic management
We manage IT and develop its management as a strategic asset M1 Senior executives, business unit executives, and IT executives share the accountabilities and responsibilities of IT management on the basis of a clearly defined governance arrangement M4
Based on reliable metrics, we know well the benefits of IT management and its development as a strategic asset M3
Evaluate IT purchases
My organization has a clear IT services purchasing strategy and action plan for IT resources and services purchasing
In my organization, the selection process for IT solutions works smoothly, so that our business needs are taken care of by our IT purchases A4
We define measurable objectives for IT purchases so that business needs are well taken care of M5 Evaluate how IT projects succeed in your organization and what characteristics they have
The outcomes of IT projects correspond in general with our plans M6
IT projects are actually business development projects PI6 Evaluate how well the following data management- related statements describe your organization
We manage our current businesses and develop new businesses based on reliable good-quality data, that is, we manage them using data A5
Evaluate how well the following cloud services- related statements describe your organization
My organization has a clear strategy and implementation plan on how to deploy cloud services in our business P1
The goal of my organization is to i significantly increase the use of cloud services as a part of our business operations P2
If we would want to do so we could easily transfer our current IT services to cloud services CR1 Unless cloud services function as we expect them to function, we are able to return to the use of our past IT services easily CR2
The deployment of cloud services will make cost savings possible CE1
The deployment of cloud services will increase the efficiency of IT services CE2
The deployment of cloud services will increase the flexibility of IT services CE3
The deployment of cloud services will increase our ability to manage and govern IT services CE4
Cloud services are reliable in terms of functional reliability and continuity of services CE5
Cloud services are information secure CE6 The business deployment of cloud services means much more than the transfer of email services to cloud P3
Evaluate how well the statements below on digitalization describe your organization
The digitalization competencies of the executives and managers working in my organization match the needs of our business C6
The digitalization competencies of business professionals working in my organization match the needs of our business C7
Where: Fi= Fitting IT to the financial environment variable i, PIi = Perceived importance of IT var. i, Ai = Business - IT alignment var. i, Ci = IT competencies var. i, Mi = IT management var. i, CRi = Cloud readiness var. i, CEi = Cloud expectations var. i, and Pi = Cloud performance var. i
4260


![Proceedings of the Sixth / [Hauptbd.] / Proceedings ... · PROCEEDINGS SIXTH HAWAII INTERNATIONAL CONFERENCE ON SYSTEM SCIENCES Edited By Art Lew Conference Held January 9, 10, 11,](https://static.fdocuments.in/doc/165x107/60b75b8fa13ada13c82e1c13/proceedings-of-the-sixth-hauptbd-proceedings-proceedings-sixth-hawaii.jpg)


