
ZACH MA WINTER 2015 A Parallelized Multi-Agent Transportation Simulation Using MASS MATMASSim.

Proceedings of the 2017 Winter Simulation ConferenceW. K. V. Chan, A. D’Ambrogio, G. Zacharewicz, N. Mustafee, G. Wainer, and E. Page, eds.
SIMULATING DDOS ATTACKS ON THE US FIBER-OPTICS INTERNET INFRASTRUCTURE
Sumeet KumarKathleen M. Carley
School of Computer ScienceCarnegie Mellon University
5000 Forbes AvePittsburgh, PA 15213, USA
ABSTRACT
Network-based attacks like the distributed denial-of-service (DDoS) attacks are not new, but we are beginningto see attacks of unprecedented scale. Examples of such attacks include the 2016 attack on DYN INCthat crippled a part of the Internet for hours, and the attack on Liberia, which partially brought down theAfrican nation. Limitations in identifying vulnerable Internet infrastructure and testing possible defensestrategies are a part of the problem. We need a simulation testbed that can reflect the complexity of theInternet, yet allows to swiftly test attacks, providing insights that can apply to real-world attack scenarios.In this research, we have designed a test-bed that mirrors the Internet infrastructure of the US and cansimulate the Internet traffic flow patterns for different attack targets. We also estimate the degradation inthe quality-of-service and the number of users impacted in two attack scenarios.
1 INTRODUCTION
Network based cyber-attacks like DDoS appear to be a growing phenomenon (Inofsecurity 2016). However,there is no clear understanding of where the attacks are coming from, how the attacks are organized, andhow the attack targets are identified. While it is known that a majority of these attacks are originatingfrom bots (Kandula et al. 2005, Alomari et al. 2012), there is lesser clarity on where the bots are located(Kumar and Carley 2016b) and how the bots are controlled (Stinson and Mitchell 2007, Santanna et al.2015). To add to the puzzle, the specific impact and maximum possible damage of such attacks are also notknown, and we only estimate the impact after the attacks have happened. However, one thing is clear thatthe bandwidth used in these attacks are increasing with time (Inofsecurity 2016). In a recent example ofthe cyber-attack on the African nation of Liberia (Kumar 2016), thousands of bots targeted the fiber-opticcable exchange point (IXP), bringing down the Internet connectivity of the entire country for almost aday. Another example is the attack on Estonia (Ottis 2008), which crippled the Estonia’s governmentweb-services for a few weeks. These incidents highlight the serious nature of such attacks and call forpolicies to counter them (Kumar, Benigni, and Carley 2016), and ways to understand and control them (Yuet al. 2014, Kumar and Carley 2016a). In this research, we propose a simulation test-bed to estimate theimpact of such attacks.
Because of the complexity of the Internet, simulating an Internet-scale network based attack is nearlyinfeasible. Most existing simulation environments are designed for small-scale tests and are usuallyconducted in a lab setting using a few systems. Results from a small-scale simulation may not be a goodrepresentation of the Internet scale problem. The complexity is two-fold. First, it’s hard to model agents thatcould resemble modern computer systems, but at the same time consume reasonable computing resourcesfor a large-scale simulation. Second, openly available information on the Internet infrastructure is limited.Fortunately, we can endeavor to overcome both the problems. For a network-based attack like DDoS, we

Kumar and Carley
(a) The location of physical conduits. Adaptedfrom Durairajan, Barford, Sommers, and Willinger(2015) with permission from the authors. Copyright2015 by the Association for Computing Machinery.
(b) The network built using the physical conduits data (shownon the left). The green nodes are the IXPs located in differentcities, and the conduits connecting them are modeled asstraight edges.
Figure 1: The network designed to simulate attacks on the US Internet infrastructure.
can model the attackers and the target as dumb systems that can send and receive network packets. For thesecond limitation of modeling a close to the real Internet infrastructure, we apply recent development onmapping the optical fiber cables of the US. The mapping of the Internet infrastructure project (Durairajanet al. 2015) (see Fig.1a) has provided a practical knowledge of the US cyber infrastructure. By combiningthe cyber-infrastructure data with data on the Internet adoption by countries (Whitehouse.gov 2016), asimulation environment could be built to model a real attack environment. Our simulation environmentallows to evaluate different attack scenarios and providing information on average degradation of thequality-of-service, and the approximate number of users impacted.
The important contributions of this research are: a) We design a simulation testbed mirroring the fiber-optics Internet architecture of the US. To the best of our knowledge, this is the first work that simulatesDDoS attacks on a realistic US cyber infrastructure. b) We present a model to estimate the degradationin the quality-of-service and the number of users impacted in different attack scenarios. To make oursimulation more realistic, we use a dynamic packet flow algorithm that changes the Internet traffic flowpattern with congestion. c) Our model enables to find cyber installations that are more vulnerable to attacks.We believe our approach could be useful to cyber-infrastructure companies and the Homeland Security.
The rest of this paper is organized as follows. Section 2 presents related work. We introduce themethodology of the simulation in section 3. In section 4, we model and discuss the experiments. The resultsof the experiments are presented in section 5, along with a discussion on the outcomes of the simulations.Limitations of our approach are described in section 6. We finally conclude and discuss future work insection 7.
2 RELATED WORK
Prior work on using simulation to model cyber-attacks can be grouped in two categories: a) Measuringresiliency of the Internet infrastructure b) Simulation of network based attacks.
2.1 Measuring Resiliency of the Internet Infrastructure
To explore the node to node resiliency of the global Internet infrastructure to under-sea cables physicaldamage, Omer et al. (2009b) and Omer et al. (2009a) modeled the Internet resiliency as a networkoptimization problem. The authors solved it using linear and mixed integer programming with constraints.Since most cyber-attacks don’t entirely stop the flow of network packets but rather makes the Internetslower, this model is not best suitable for simulating DDoS attacks. Moreover this model did not accountfor the dynamic nature of the path used by Internet traffic, which is included in our model. In this research,we are interested in resiliency, but we don’t model physical damage to the under-sea cables.
Kumar and Carley
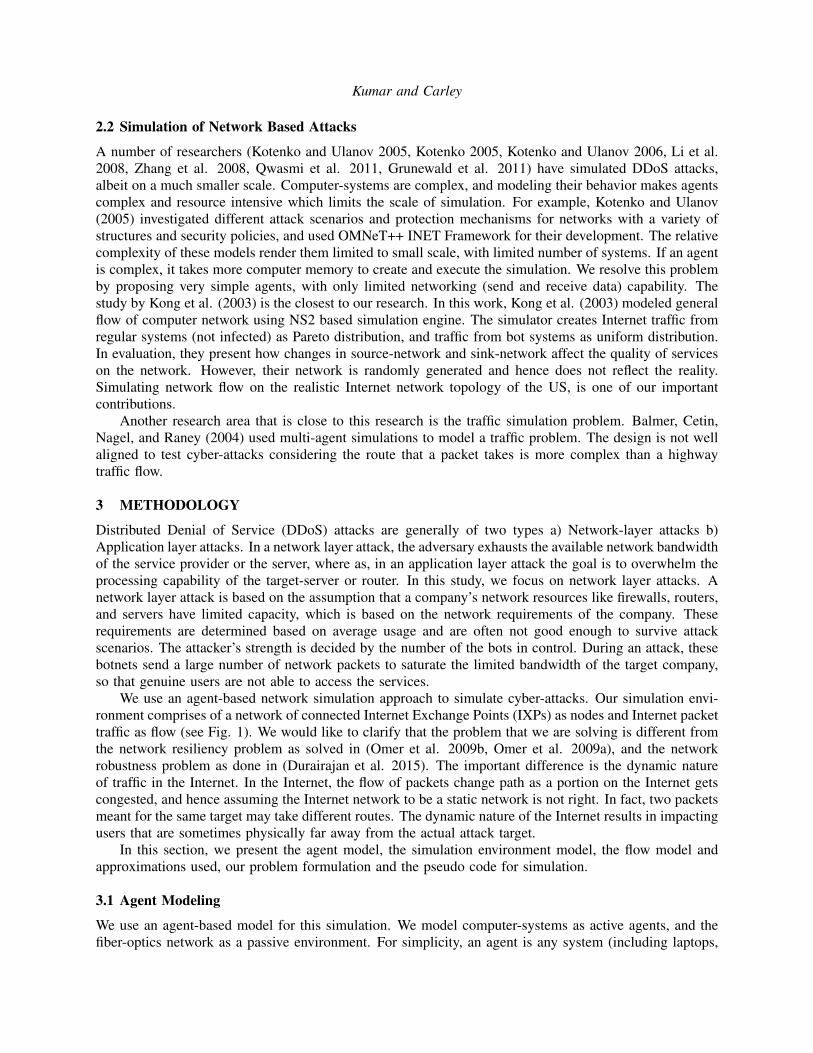
2.2 Simulation of Network Based Attacks
A number of researchers (Kotenko and Ulanov 2005, Kotenko 2005, Kotenko and Ulanov 2006, Li et al.2008, Zhang et al. 2008, Qwasmi et al. 2011, Grunewald et al. 2011) have simulated DDoS attacks,albeit on a much smaller scale. Computer-systems are complex, and modeling their behavior makes agentscomplex and resource intensive which limits the scale of simulation. For example, Kotenko and Ulanov(2005) investigated different attack scenarios and protection mechanisms for networks with a variety ofstructures and security policies, and used OMNeT++ INET Framework for their development. The relativecomplexity of these models render them limited to small scale, with limited number of systems. If an agentis complex, it takes more computer memory to create and execute the simulation. We resolve this problemby proposing very simple agents, with only limited networking (send and receive data) capability. Thestudy by Kong et al. (2003) is the closest to our research. In this work, Kong et al. (2003) modeled generalflow of computer network using NS2 based simulation engine. The simulator creates Internet traffic fromregular systems (not infected) as Pareto distribution, and traffic from bot systems as uniform distribution.In evaluation, they present how changes in source-network and sink-network affect the quality of serviceson the network. However, their network is randomly generated and hence does not reflect the reality.Simulating network flow on the realistic Internet network topology of the US, is one of our importantcontributions.
Another research area that is close to this research is the traffic simulation problem. Balmer, Cetin,Nagel, and Raney (2004) used multi-agent simulations to model a traffic problem. The design is not wellaligned to test cyber-attacks considering the route that a packet takes is more complex than a highwaytraffic flow.
3 METHODOLOGY
Distributed Denial of Service (DDoS) attacks are generally of two types a) Network-layer attacks b)Application layer attacks. In a network layer attack, the adversary exhausts the available network bandwidthof the service provider or the server, where as, in an application layer attack the goal is to overwhelm theprocessing capability of the target-server or router. In this study, we focus on network layer attacks. Anetwork layer attack is based on the assumption that a company’s network resources like firewalls, routers,and servers have limited capacity, which is based on the network requirements of the company. Theserequirements are determined based on average usage and are often not good enough to survive attackscenarios. The attacker’s strength is decided by the number of the bots in control. During an attack, thesebotnets send a large number of network packets to saturate the limited bandwidth of the target company,so that genuine users are not able to access the services.
We use an agent-based network simulation approach to simulate cyber-attacks. Our simulation envi-ronment comprises of a network of connected Internet Exchange Points (IXPs) as nodes and Internet packettraffic as flow (see Fig. 1). We would like to clarify that the problem that we are solving is different fromthe network resiliency problem as solved in (Omer et al. 2009b, Omer et al. 2009a), and the networkrobustness problem as done in (Durairajan et al. 2015). The important difference is the dynamic natureof traffic in the Internet. In the Internet, the flow of packets change path as a portion on the Internet getscongested, and hence assuming the Internet network to be a static network is not right. In fact, two packetsmeant for the same target may take different routes. The dynamic nature of the Internet results in impactingusers that are sometimes physically far away from the actual attack target.
In this section, we present the agent model, the simulation environment model, the flow model andapproximations used, our problem formulation and the pseudo code for simulation.
3.1 Agent Modeling
We use an agent-based model for this simulation. We model computer-systems as active agents, and thefiber-optics network as a passive environment. For simplicity, an agent is any system (including laptops,

Kumar and Carley
(a) Internet adoption in the US by county. (b) The generated computer density map.Figure 2: The computer distribution used in our study is generated from population density distributionand Internet adoption map (2013 census). In the right image, computers are grouped by connecting themto the nearest IXP. Groups are visualized in different colors.
mobile devices, Internet of Things, and Servers) that is connected to the Internet. Agents can act both assource or sink of packets, and to simulate a more realistic environment both the source and the sink havelimited bandwidth. Flow through links also have a bandwidth limitation. In simulation, source agents sendpackets that travel from source to target (sink).
We have two types of agents. First agent type is ‘Un-compromised Agents’ i.e. the systems that are notcompromised. The second agent type is bots, i.e. the systems that are compromised and are used in attacks.For location of ‘un-compromosed agents’ we use the data from US census on population and percentagepopulation with active Internet connection (Fig. 2a). For location of botnets (infected computers), weus botnet tracker data from Malwaretech website (Malwaretech 2016). Since we know the approximatelocation of each of the agents (shared by Malwaretech), we could approximate the route the packets froman agent could take to reach a target (explained later). We can do the same for all bots, to understand thenetwork congestion these bots can create.
3.2 Environment Modeling
We used systems as agents to simulate the DDoS cyber attacks on the US Internet infrastructure. Theenvironment in our case is the network generated by the optical fiber cables and the Internet exchangepoints (IXP). We model it as a network with nodes and links. Nodes represent the IXPs and links are opticalcables connecting different IXPs. We use optical-fibers data from Durairajan et al. (2015) for modelingthe links. Figure 1b shows the network built using nodes and edges data. The authors shared their dataon nodes, and their connections between cities (Fig: 1a), but they do not have data on bandwidth capacityof these optical fibers. We approximate the bandwidth limitation of the long-haul pipes to 8 Tbps (Betkeret al. 2014).
3.3 Flow Modelling
An attack scenario is modeled as flow of large traffic to a target node. We first estimate the regular trafficflow in the network without any attacks using computer density distribution. For estimating the attack traffic,we first pick an attack target, and direct all bots to send data packets to the target. We then superimposethe attack traffic on the regular traffic. In our experimental attack scenarios, We use the information onthe bots locations shared by a security website (Malwaretech 2016) to find the nearest IXP for all bots,and estimate the number for bots connected to each IXP (Fig. 3). The number of bots connected to eachIXP allows to estimate of the attack-traffic that an IXP generates and adds to the Internet. After estimatingthe attack-traffic, we remove the bots from the simulation and only keep the IXPs with equivalent bots
Kumar and Carley
load. This way we avoid the complexity of using millions of systems in the simulation, but still use theirattack impact. The superposition of attack traffic on regular traffic creates a congestion map of the entirenetwork, and allows us to measure the drop in average quality-of-service. We also estimate the number ofusers impacted, which is indirectly approximated by the number of users connected to each IXP (Fig. 3b)and the estimate of congestion at each IXP.
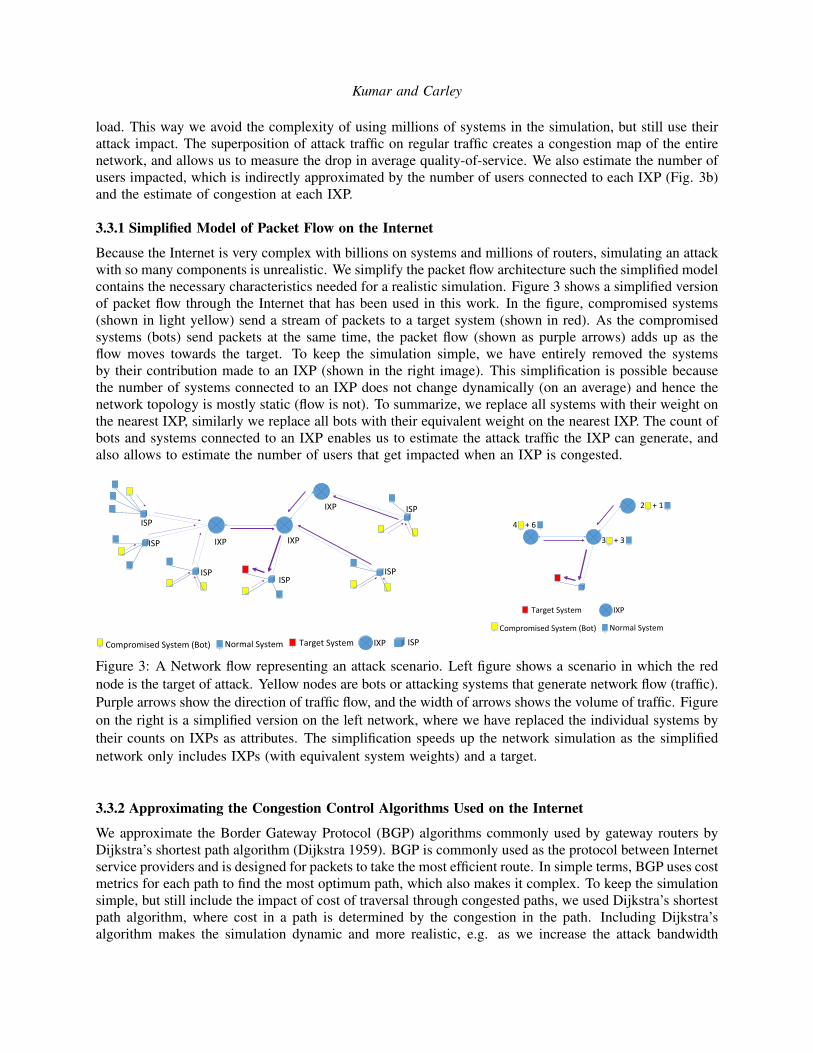
3.3.1 Simplified Model of Packet Flow on the Internet
Because the Internet is very complex with billions on systems and millions of routers, simulating an attackwith so many components is unrealistic. We simplify the packet flow architecture such the simplified modelcontains the necessary characteristics needed for a realistic simulation. Figure 3 shows a simplified versionof packet flow through the Internet that has been used in this work. In the figure, compromised systems(shown in light yellow) send a stream of packets to a target system (shown in red). As the compromisedsystems (bots) send packets at the same time, the packet flow (shown as purple arrows) adds up as theflow moves towards the target. To keep the simulation simple, we have entirely removed the systemsby their contribution made to an IXP (shown in the right image). This simplification is possible becausethe number of systems connected to an IXP does not change dynamically (on an average) and hence thenetwork topology is mostly static (flow is not). To summarize, we replace all systems with their weight onthe nearest IXP, similarly we replace all bots with their equivalent weight on the nearest IXP. The count ofbots and systems connected to an IXP enables us to estimate the attack traffic the IXP can generate, andalso allows to estimate the number of users that get impacted when an IXP is congested.
IXP IXP
CompromisedSystem(Bot) NormalSystem IXPTargetSystem
ISP
ISP
ISP
ISPISP
ISP
IXP ISP
IXPTargetSystem
4+6
CompromisedSystem(Bot) NormalSystem
2+1
3+3
Figure 3: A Network flow representing an attack scenario. Left figure shows a scenario in which the rednode is the target of attack. Yellow nodes are bots or attacking systems that generate network flow (traffic).Purple arrows show the direction of traffic flow, and the width of arrows shows the volume of traffic. Figureon the right is a simplified version on the left network, where we have replaced the individual systems bytheir counts on IXPs as attributes. The simplification speeds up the network simulation as the simplifiednetwork only includes IXPs (with equivalent system weights) and a target.
3.3.2 Approximating the Congestion Control Algorithms Used on the Internet
We approximate the Border Gateway Protocol (BGP) algorithms commonly used by gateway routers byDijkstra’s shortest path algorithm (Dijkstra 1959). BGP is commonly used as the protocol between Internetservice providers and is designed for packets to take the most efficient route. In simple terms, BGP uses costmetrics for each path to find the most optimum path, which also makes it complex. To keep the simulationsimple, but still include the impact of cost of traversal through congested paths, we used Dijkstra’s shortestpath algorithm, where cost in a path is determined by the congestion in the path. Including Dijkstra’salgorithm makes the simulation dynamic and more realistic, e.g. as we increase the attack bandwidth

Kumar and Carley
sent by a bot, the packets are likely to take different paths, and hence creates congestion in other pathsinfluencing the quality of service in areas which may not be close to the target.
3.4 Problem Formulation
Given a flow network G = (V,E), many non-negative sources f : (Vi)→ Z+, a negative sink h : (Vj)→ z−,links with limited capacity Ei(Vi,Vj)< E(max), there exists a equilibrium state of flow using any weightedshortest path algorithm. Ui is the number of systems (or users) connected to Vi (IXP) which is determinedby the systems density map (Fig. 2b), where users (U ∼User Density) grouped to nearest node (explainedin Fig. 3). Similarly Bi ∝ f : (Vi) is the number of bots connected to Vi (IXP). Here Bi is determined bybots density data from Malwaretech (Malwaretech 2016) grouped by nearest node (IXP). The equilibriumstate allows estimation of congestion at each node Ci, which enables to estimate the number of usersimpacted ∑iUi. To estimate f : (Vi), i.e. the flow generated by node Vi (an IXP), we use bot densityfunction (B∼ Bot Density), and group the bots to their nearest node which implies Bi is the total numberof bots connected to ith node. To estimate the number of users impacted (Uimpacted), we sum the numberof users ∑iUi connected to ith congested node. Given an attack target, the average reduction in quality ofservice could be measured by estimating the congestion in the network, which could be approximated by∑i, j E(Vi,Vj)avg/∑i, j E(Vi,Vj)congestion. In an attack situation, the users trying to access the targeted server(or IXP) get impacted the most. Also the users connected to other nodes experiencing congestion getimpacted. We estimate the number of users impacted by counting all the users connected to the congestedIXPs (Uimpacted = ∑i∈cUi,where c is the set of congested nodes). Given an attack scenario with an attacktarget, we measure the trend of ‘number of users’ impacted, with increase in attack bandwidth (e.g. eachinfected system sends attack bandwidth from 1 Mbps to 5 Mbps) (see Algorithm 1). Source code toreproduce similar experiments can be obtained by requesting the first author.
3.5 Virtual Experiment
Table: 1 summarizes the variables used in the experiment. We have two parameters in the model, a target andthe bandwidth of attack initiated by each bot. The constants are maps that we obtained from different datasources including ‘optical-cable’ map from Durairajan et al. (2015), population and computer ownershipfrom census, and map of Mirai botnet (Malwaretech 2016). The output variables are the number of usersthat get impacted in an attack scenario, and the degradation on QoS (sometimes referred as congestion).To validate, we used the data from downdetector website.
4 EXPERIMENTS
Our experiment has different scenarios, and each scenario has a target. Though it is possible to use multipletargets, to keep the results easy to understand, we have used a single target in each scenario. For example,we can pick a server hosted in New York city as an attack target, and simulate the experiment. In anyexperiment, we generate network traffic from all nodes (except the target node) directed towards the chosentarget. The simulation will result in a map of users that get impacted because of attack on the target. Wecan also determine the trend the number of users that get impacted as the attack bandwidth (by each bot)is varied. Besides, we can also estimate the average degradation (using congestion in the network) in thequality of service with the increase in attack bandwidth. We simulated two different attack scenarios andestimated the impact of attacks.
4.1 Scenario 1 - Attack on Dyn Inc on 21st of Oct, 2016
Targeting a server hosted in New York City, we try to mimic the attack on DYN Inc (DYN INC2016). In this attack simulation, all bots target the New York city server. Since Downdetector web-site (http://downdetector.com/) provides data on how people in different regions got impacted because of
Kumar and Carley
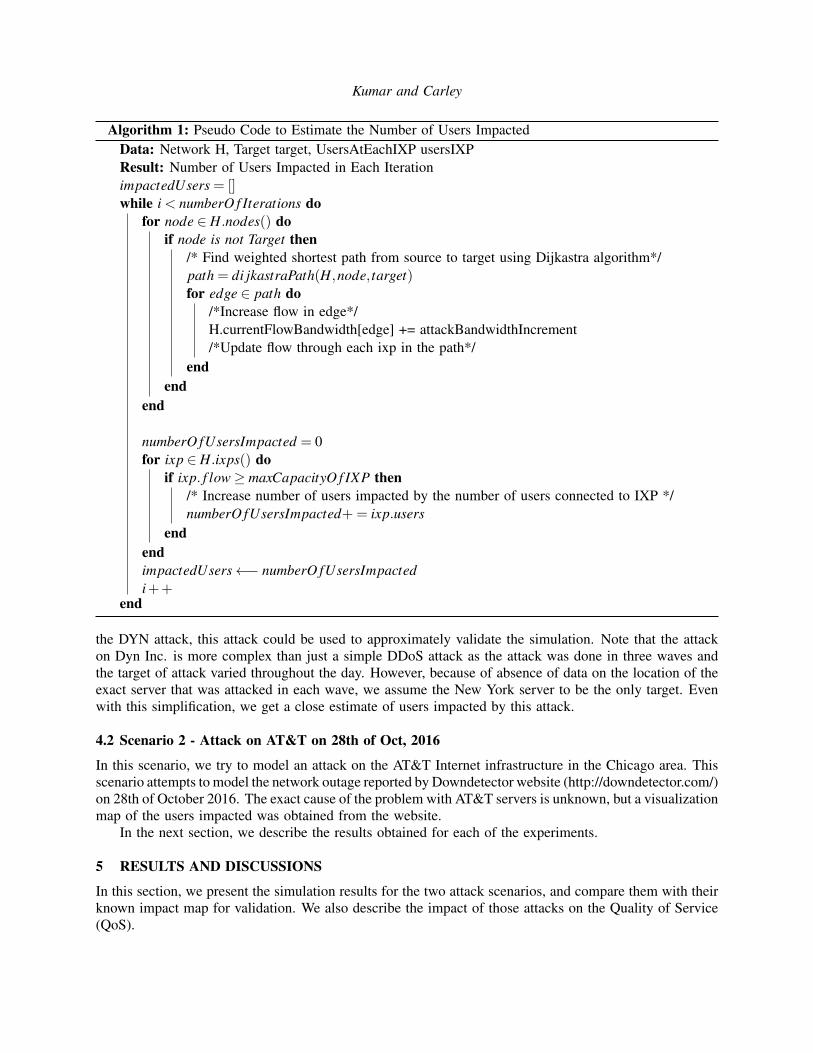
Algorithm 1: Pseudo Code to Estimate the Number of Users ImpactedData: Network H, Target target, UsersAtEachIXP usersIXPResult: Number of Users Impacted in Each IterationimpactedUsers = []while i < numberO f Iterations do
for node ∈ H.nodes() doif node is not Target then
/* Find weighted shortest path from source to target using Dijkastra algorithm*/path = di jkastraPath(H,node, target)for edge ∈ path do
/*Increase flow in edge*/H.currentFlowBandwidth[edge] += attackBandwidthIncrement/*Update flow through each ixp in the path*/
endend
end
numberO fUsersImpacted = 0for ixp ∈ H.ixps() do
if ixp. f low≥ maxCapacityO f IXP then/* Increase number of users impacted by the number of users connected to IXP */numberO fUsersImpacted+= ixp.users
endendimpactedUsers←− numberO fUsersImpactedi++
end
the DYN attack, this attack could be used to approximately validate the simulation. Note that the attackon Dyn Inc. is more complex than just a simple DDoS attack as the attack was done in three waves andthe target of attack varied throughout the day. However, because of absence of data on the location of theexact server that was attacked in each wave, we assume the New York server to be the only target. Evenwith this simplification, we get a close estimate of users impacted by this attack.
4.2 Scenario 2 - Attack on AT&T on 28th of Oct, 2016
In this scenario, we try to model an attack on the AT&T Internet infrastructure in the Chicago area. Thisscenario attempts to model the network outage reported by Downdetector website (http://downdetector.com/)on 28th of October 2016. The exact cause of the problem with AT&T servers is unknown, but a visualizationmap of the users impacted was obtained from the website.
In the next section, we describe the results obtained for each of the experiments.
5 RESULTS AND DISCUSSIONS
In this section, we present the simulation results for the two attack scenarios, and compare them with theirknown impact map for validation. We also describe the impact of those attacks on the Quality of Service(QoS).

Kumar and Carley
Table 1: Virtual Experiment Table
Factors Values # of ValuesInputsAttack Target (A web-server or an IXP) One of the nodes in the Network 1Bandwidth of Attack 1 to 5 Mbps per bot 10ConstantsLong-haul optical-fiber Map Map from (Durairajan et al. 2015)Population density Number from censusComputer Ownership Percentage from censusMap of Botnets Mirai Bot family from (Malwaretech 2016)OutcomesNumber of Users Impacted In thousandsDegradation in Quality of Service Percentage 1-100ValidationAT&T Attack on 28th of Oct, 2016 Map of Impacted UsersDYN Attack on 21st of Oct, 2016 Map of Impacted Users
5.1 Scenario 1 - Attack on Dyn Inc. on 21st of Oct, 2016
In scenario 1, we use a server linked to the New York city IXP as the target of attack. The attack triesto simulate the DYN server attack that happened on Oct 21, 2016. We first discuss the congestion in thefiber-optics cables as observed in the simulation (Fig. 4a). In Fig. 4a, the width of edges indicate thenetwork flow through the optical fibers, and the color indicates the congestion level. As the bandwidth ofattack is increased in each iteration, more and more edges (optical-fibers) showed congestion. This is asexpected in an attack. However, the edges that got more congested were not always close to the target.In fact, two of the most congested links are actually connecting the west coast areas, and one of the linksis connecting the southern part of the US. This is a result of the dynamic nature of simulation. BecauseDijkstra’s shortest path algorithm chooses path with the least cost from a source to a target, this changesthe packet flow routes as current routes get more congested. Moreover, we can see that the most congestedlinks are mostly linking high density areas and are long-haul links. This can be explained by the fact thatthese long haul links are likely to be the best route from far-off areas, as the length of optic-fibers do notaffect the edge weight.
25°N
30°N
35°N
40°N
45°N
130°W 120°W 110°W 100°W 90°W 80°W 70°W 60°W
1
2
3
4
56
78
9 10
11
12
13
14
15
16
17
18
19
20
21
22
23
24
25
26
27
28
2930
31
32
33
34
35
36
37
38
39
40
41
42
43
44
45
46
47
48
49
50
5152
5354
55
56
57
58
59
60
61
6263
64
65
66
67
68
69
70
7172
73
74 75
76
77
7879
80
81
82
83
84
85
86
87
8889
90
91
92
9394
95
96
97
98
99
100
101
102103104
105
106
107
108
109
110111
112
113
114115
116
117
118
119
120
121122
123
124
125
126
127
128
129
130
131
132
133
134135
136
137
138
139
140
141142
143
144
145
146
147
148
149
150
151
152
153
154
155
156
157158159
160
161162
163
164
165
166
167
168
169
170
171
172
173
174
175 176
177
178
179180
181
182
183
184
185
186
187
188189
190
191192193
194
195
196
197
198
199
200
201
202
203
204
205
206
207
208
209
210211
212213
214
215
216217
218219
220
221
222
223
224225
226
227228
229
230
231
232
233
234
235236
237238
239
240
241
242
243
244
245
246247
248
249 250251
252
253 254
255
256
257
258
259
260
261
262
263
264
265
266267
268
269
270
271
272273
Live Simulation
(a) Simulation Scenario 1: Visual-izing the congestion in the networkwhile an attack on the DNC INC NewYork city service.
25°N
30°N
35°N
40°N
45°N
130°W 120°W 110°W 100°W 90°W 80°W 70°W 60°W 0
20
40
60
80
100
Qu
ality
of
Serv
ice in
%
(b) Simulation result for attack.The color bar indicates the relativeimpact in different areas.
(c) Actual impact as reported byDownDetector website. The redareas are most adversely impacted.
Figure 4: DYN attack Simulation: For DYN outage on 21th Oct, we compare the result of simulation toactual impact as reported by DownDetector website.

Kumar and Carley
Figure 4b shows the result of the final stage of simulation (max bandwidth of attack). In Fig. 4c, weshow the actual impact as reported by downdetector website. The image was downloaded from wikipedia,and shows the impact of the DYN attack as measured by ‘downdetector.com’. The red areas are mostadversely impacted regions. The image shows that the east coast of the US was primarily impacted becauseof the attack, but outages were also recorded in some western and southern parts of the US. If we comparethe simulation result (Fig. 4b) and the actual impact (Fig. 4c), we can observe that both of them highlightthe eastern areas as mostly impacted. This is expected as the target of the attack was based in the NewYork city. What is interesting to see that some areas in the central, and western parts of the US wereimpacted, and the simulation also predicted similar areas.
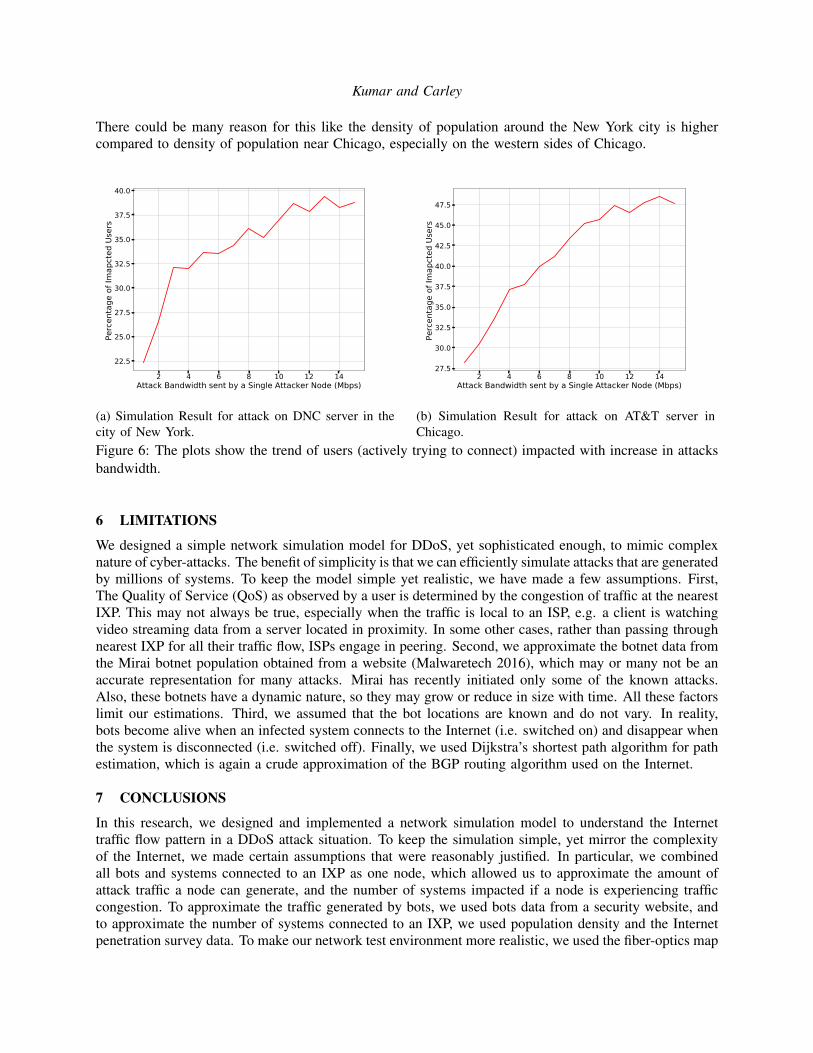
Lastly, we use the trend plot (Fig. 6a) to discuss the percentage of users impacted, and how the numberchanges with increase in the bandwidth of attacks. As we can observe, the increase is steeper in thebeginning but the rate of increase slows down with increase in attack. The plot of the users impacted isbased on the estimation of the users who are actively connecting to the attacked server.
5.2 Scenario 2 - Attack on AT&T on 28th of Oct, 2016
In scenario 2, we use Chicago city AT&T server as the target of attack. The attack tries to mirror the AT&Tserver problem that happened on Oct 28, 2016. We first discuss the congestion in the fiber-optics cablesas observed in the simulation (Fig. 5a). As described earlier, the width of edges indicate the network flowthrough an optical pipe, and the color indicates congestion level. As the bandwidth of attack is increasedin each iteration, more and more optical-fibers (edges) registered congestion. Figure 5b shows the resultof the final stage of simulation.
25°N
30°N
35°N
40°N
45°N
130°W 120°W 110°W 100°W 90°W 80°W 70°W 60°W
1
2
3
4
56
78
9 10
11
12
13
14
15
16
17
18
19
20
21
22
23
24
25
26
27
28
2930
31
32
33
34
35
36
37
38
39
40
41
42
43
44
45
46
47
48
49
50
5152
5354
55
56
57
58
59
60
61
6263
64
65
66
67
68
69
70
7172
73
74 75
76
77
7879
80
81
82
83
84
85
86
87
8889
90
91
92
9394
95
96
97
98
99
100
101
102103104
105
106
107
108
109
110111
112
113
114115
116
117
118
119
120
121122
123
124
125
126
127
128
129
130
131
132
133
134135
136
137
138
139
140
141142
143
144
145
146
147
148
149
150
151
152
153
154
155
156
157158159
160
161162
163
164
165
166
167
168
169
170
171
172
173
174
175 176
177
178
179180
181
182
183
184
185
186
187
188189
190
191192193
194
195
196
197
198
199
200
201
202
203
204
205
206
207
208
209
210211
212213
214
215
216217
218219
220
221
222
223
224225
226
227228
229
230
231
232
233
234
235236
237238
239
240
241
242
243
244
245
246247
248
249 250251
252
253 254
255
256
257
258
259
260
261
262
263
264
265
266267
268
269
270
271
272273
(a) Simulation Scenario 2: Visual-izing the congestion in the networkwhile attack on a server in Chicago.Red lines are the congested routes.
25°N
30°N
35°N
40°N
45°N
130°W 120°W 110°W 100°W 90°W 80°W 70°W 60°W 0
20
40
60
80
100
Qu
ality
of
Serv
ice in
%
(b) Simulation result of degradationin the quality of service by an attackon a server connected to ChicagoIXP . More red is more severe.
(c) Actual impact as reported byDownDetector website. The red ar-eas are more adversely impacted re-gions.
Figure 5: AT&T attack Simulation: For the AT&T outage on 28th Oct, we compare the result of simulatingan attack on a server connected to Chicago IXP to actual impact as reported by DownDetector website.
In Fig. 5c, we show the actual impact as reported by downdetector website. The image was obtainedfrom ‘downdetector.com’ website. The red areas are most adversely impacted regions. The image showsthat areas near Chicago and south of Chicago were mostly impacted because of the attack, but minoroutages were also recorded in some far areas. If we compare the simulation result (Fig. 5b) and the actualimpact (Fig. 5c), we can observe that both of them highlight similar areas as the one primarily impacted.The QoS not only degraded near the Chicago city but also in some areas far away.
Figure 6b shows the trend of ‘percentage of users’ impacted as the bandwidth of attack was increasedassuming assuming these users were actively trying connect to the server. As we can observe, the increaseis steeper in the beginning but the rate of increase slows down and converges.
If we compare the result of attack on ‘New York IXP’ to the result of attack on ‘Chicago IXP’, wefind that the plot of ‘number of users’ impacted is more steep in case of the attack on the ‘New York IXP’.
Kumar and Carley
There could be many reason for this like the density of population around the New York city is highercompared to density of population near Chicago, especially on the western sides of Chicago.
2 4 6 8 10 12 14Attack Bandwidth sent by a Single Attacker Node (Mbps)
22.5
25.0
27.5
30.0
32.5
35.0
37.5
40.0
Perc
enta
ge o
f Im
apct
ed U
sers
(a) Simulation Result for attack on DNC server in thecity of New York.
2 4 6 8 10 12 14Attack Bandwidth sent by a Single Attacker Node (Mbps)
27.5
30.0
32.5
35.0
37.5
40.0
42.5
45.0
47.5
Perc
enta
ge o
f Im
apct
ed U
sers
(b) Simulation Result for attack on AT&T server inChicago.
Figure 6: The plots show the trend of users (actively trying to connect) impacted with increase in attacksbandwidth.
6 LIMITATIONS
We designed a simple network simulation model for DDoS, yet sophisticated enough, to mimic complexnature of cyber-attacks. The benefit of simplicity is that we can efficiently simulate attacks that are generatedby millions of systems. To keep the model simple yet realistic, we have made a few assumptions. First,The Quality of Service (QoS) as observed by a user is determined by the congestion of traffic at the nearestIXP. This may not always be true, especially when the traffic is local to an ISP, e.g. a client is watchingvideo streaming data from a server located in proximity. In some other cases, rather than passing throughnearest IXP for all their traffic flow, ISPs engage in peering. Second, we approximate the botnet data fromthe Mirai botnet population obtained from a website (Malwaretech 2016), which may or many not be anaccurate representation for many attacks. Mirai has recently initiated only some of the known attacks.Also, these botnets have a dynamic nature, so they may grow or reduce in size with time. All these factorslimit our estimations. Third, we assumed that the bot locations are known and do not vary. In reality,bots become alive when an infected system connects to the Internet (i.e. switched on) and disappear whenthe system is disconnected (i.e. switched off). Finally, we used Dijkstra’s shortest path algorithm for pathestimation, which is again a crude approximation of the BGP routing algorithm used on the Internet.
7 CONCLUSIONS
In this research, we designed and implemented a network simulation model to understand the Internettraffic flow pattern in a DDoS attack situation. To keep the simulation simple, yet mirror the complexityof the Internet, we made certain assumptions that were reasonably justified. In particular, we combinedall bots and systems connected to an IXP as one node, which allowed us to approximate the amount ofattack traffic a node can generate, and the number of systems impacted if a node is experiencing trafficcongestion. To approximate the traffic generated by bots, we used bots data from a security website, andto approximate the number of systems connected to an IXP, we used population density and the Internetpenetration survey data. To make our network test environment more realistic, we used the fiber-optics map

Kumar and Carley
of the US from a recent research study. Using this novel network simulation test-bed, we simulated resultsfor two different attack scenarios to understand the traffic flow as a function of attack-bandwidth. Thetraffic flow visualization enabled us to find the edges (fiber-optic cables) that are more prone to congestionin case of an attack. We also used real data from downdetector.com website to compare both simulationresults and found a reasonably good similarity. We provided a list of assumptions that limit our study, butwe hope that the approach we have used could be used by the Internet Infrastructure companies or theHomeland Security to better understand the Internet infrastructure vulnerabilities of the US.
ACKNOWLEDGMENTS
This work was supported in part by the ARL under Award No. W911NF1610049, DTRA Award No.HDTRA11010102, MURI Award No. N000140811186 and the Center for Computational Analysis ofSocial and Organization Systems (CASOS). The views and conclusions contained in this document arethose of the authors and should not be interpreted as representing the official policies, either expressed orimplied, of the US Army Research Laboratory, the Office of Naval Research, or the U.S. government.
REFERENCES
Alomari, E., S. Manickam, B. Gupta, S. Karuppayah, and R. Alfaris. 2012. “Botnet-Based Distributed Denialof Service (DDoS) Attacks on Web Servers: Classification and Art”. arXiv preprint arXiv:1208.0403.
Balmer, M., N. Cetin, K. Nagel, and B. Raney. 2004. “Towards Truly Agent-Based Traffic and MobilitySimulations”. In Proceedings of the Third International Joint Conference on Autonomous Agents andMultiagent Systems - Volume 1, AAMAS ’04, 60–67. Washington, DC, USA: IEEE Computer Society.
Betker, A., I. Gamrath, D. Kosiankowski, C. Lange, H. Lehmann, F. Pfeuffer, F. Simon, and A. Werner.2014. “Comprehensive Topology and Traffic Model of a Nationwide Telecommunication Network”.Journal of Optical Communications and Networking 6 (11): 1038–1047.
Dijkstra, E. W. 1959. “A Note on Two Problems in Connexion with Graphs”. Numerische mathematik 1(1): 269–271.
Durairajan, R., P. Barford, J. Sommers, and W. Willinger. 2015. “InterTubes: A Study of the US Long-Haul Fiber-Optic Infrastructure”. In ACM SIGCOMM Computer Communication Review, Volume 45,565–578. ACM.
DYN INC 2016, Nov. “DYN Statement on DDOS attack”. http://dyn.com/blog/dyn-statement-on-10212016-ddos-attack/.
Grunewald, D., M. Lutzenberger, J. Chinnow, R. Bye, K. Bsufka, and S. Albayrak. 2011. “Agent-BasedNetwork security Simulation”. In The 10th International Conference on Autonomous Agents and Multi-agent Systems-Volume 3, 1325–1326. International Foundation for Autonomous Agents and MultiagentSystems.
Inofsecurity 2016, Nov. “DDOS Attacks Increase in Size and Frequency”. http://www.infosecurity-magazine.com/news/ddos-attacks-increase-in-size-and.
Kandula, S., D. Katabi, M. Jacob, and A. Berger. 2005. “Botz-4-sale: Surviving Organized DDoS AttacksThat Mimic Flash Crowds”. In Proceedings of the 2nd conference on Symposium on Networked SystemsDesign & Implementation-Volume 2, 287–300. USENIX Association.
Kong, J., M. Mirza, J. Shu, C. Yoedhana, M. Gerla, and S. Lu. 2003. “Random Flow Network Modelingand Simulations for DDoS Attack Mitigation”. In Communications, 2003. ICC’03. IEEE InternationalConference on, Volume 1, 487–491. IEEE.
Kotenko, I. 2005. “Agent-based Modeling and Simulation of Cyber-Warfare Between Malefactors andSecurity Agents in Internet”. In 19th European Simulation Multiconference Simulation in wider Europe.
Kotenko, I., and A. Ulanov. 2006. “Simulation of internet DDoS attacks and defense”. In InternationalConference on Information Security, 327–342. Springer.
Kumar and Carley
Kotenko, I. V., and A. Ulanov. 2005. “The Software Environment for Multi-agent Simulation of DefenseMechanisms against DDoS Attacks.”. In CIMCA/IAWTIC, 283–289.
Mohit Kumar 2016, Nov. “More Insights On Alleged DDoS Attack Against Liberia Using Mirai Botnet”.http://thehackernews.com/2016/11/ddos-attack-mirai-liberia.html.
Kumar, S., M. Benigni, and K. M. Carley. 2016. “The Impact of US Cyber Policies on Cyber-AttacksTrend”. In Intelligence and Security Informatics (ISI), 2016 IEEE Conference on, 181–186. IEEE.
Kumar, S., and K. M. Carley. 2016a. “Approaches to Understanding the Motivations behind Cyber Attacks”.In Intelligence and Security Informatics (ISI), 2016 IEEE Conference on, 307–309. IEEE.
Kumar, S., and K. M. Carley. 2016b. “DDoS cyber-attacks Network: Who’s Attacking Whom”. In Intelligenceand Security Informatics (ISI), 2016 IEEE Conference on, 218–218. IEEE.
Li, M., J. Li, and W. Zhao. 2008. “Simulation Study of Flood Attacking of DDOS”. In 2008 InternationalConference on Internet Computing in Science and Engineering, 286–293. IEEE.
Malwaretech 2016, Nov. “Malwaretech”. https://intel.malwaretech.com.Omer, M., R. Nilchiani, and A. Mostashari. 2009a, March. “Measuring the Resilience of the GlobalIinternet
Infrastructure System”. In 2009 3rd Annual IEEE Systems Conference, 156–162.Omer, M., R. Nilchiani, and A. Mostashari. 2009b. “Measuring the Resilience of the Trans-oceanic
Telecommunication Cable System”. IEEE Systems Journal 3 (3): 295–303.Ottis, R. 2008. “Analysis of the 2007 Cyber Attacks Against Estonia from the Information Warfare
Perspective”. In Proceedings of the 7th European Conference on Information Warfare, 163.Qwasmi, N., F. Ahmed, and R. Liscano. 2011. “Simulation of DDOS Attacks on P2P Networks”. In High
Performance Computing and Communications (HPCC), 2011 IEEE 13th International Conference on,610–614. IEEE.
Santanna, J. J., R. van Rijswijk-Deij, R. Hofstede, A. Sperotto, M. Wierbosch, L. Z. Granville, and A. Pras.2015. “BootersAn Analysis of DDoS-as-a-Service Attacks”. In Integrated Network Management (IM),2015 IFIP/IEEE International Symposium on, 243–251. IEEE.
Stinson, E., and J. C. Mitchell. 2007. “Characterizing Bots Remote Control Behavior”. In InternationalConference on Detection of Intrusions and Malware, and Vulnerability Assessment, 89–108. Springer.
Whitehouse.gov 2016, Nov. “Mapping the Digital Divide”. https://www.whitehouse.gov/sites/default/files/wh digital divide issue brief.pdf.
Yu, S., Y. Tian, S. Guo, and D. O. Wu. 2014. “Can We Beat DDoS Attacks in Clouds?”. IEEE Transactionson Parallel and Distributed Systems 25 (9): 2245–2254.
Zhang, M.-q., J. Xie, M. Zhang, and X.-l. Zhang. 2008. “Modeling and Simulation of DDos Attacks UsingOPNET Modeler [J]”. Journal of System Simulation 10:055.
AUTHOR BIOGRAPHIES
Sumeet Kumar is a PhD student in the Institute for Software Research at Carnegie Mellon University.He is interested in cyber security, machine learning and dynamic network analysis. He received an MSdegree in Software Engineering from Carnegie Mellon University in 2013, and a B.Tech in AerospaceEngineering from the Indian Institute of Technology Kanpur (IIT Kanpur) in 2007. His email address [email protected].
Kathleen M. Carley is a professor in the School of Computer Science in the department - Institute forSoftware Research - at Carnegie Mellon University. She is the director of the Center for ComputationalAnalysis of Social and Organizational Systems (CASOS), a university wide interdisciplinary center thatbrings together network analysis, computer science, and organization science. She and her lab have devel-oped infrastructure tools for analyzing large scale dynamic networks and various multi-agent simulationsystems. Her email address is [email protected].


