Proceedings from the Second GODAE High Resolution...
88
EUR-2nd-GHRSST-PP-workshop-report-v3.0.doc Page 1 of 88 Friday, October 11, 2002 Proceedings of the 2 nd GHRSST-PP workshop Proceedings from the Second GODAE High Resolution SST Pilot Project Workshop NASDA/EORC, Tokyo, Japan, 13-16 th May, 2002. GHRSST-PP Report No. GHRSST/5 GODAE Report No. 8 EUR ?? EN
Transcript of Proceedings from the Second GODAE High Resolution...
EUR-2nd-GHRSST-PP-workshop-report-v3.0.doc Page 1 of 88 Friday, October 11, 2002
Proceedings of the 2nd GHRSST-PP workshop
Proceedings from the Second GODAE High Resolution SST Pilot Project Workshop NASDA/EORC, Tokyo, Japan, 13-16th May, 2002. GHRSST-PP Report No. GHRSST/5 GODAE Report No. 8 EUR ?? EN

EUR-2nd-GHRSST-PP-workshop-report-v3.0.doc Page 2 of 88 Friday, October 11, 2002
Proceedings of the 2nd GHRSST-PP workshop
Proceedings from the Second GODAE High
Resolution SST Pilot Project Workshop
NASDA/EORC, Tokyo, Japan, 13-16th May, 2002.
GODAE Report Number 8.
Craig James Donlon
Joint Research Centre of the European Commission Institute for EWnvironment and Sustainability
Inland and Marine Waters Unit – TP272 I-21020 Ispra – ITALY [email protected]

EUR-2nd-GHRSST-PP-workshop-report-v3.0.doc Page 3 of 88 Friday, October 11, 2002
Proceedings of the 2nd GHRSST-PP workshop
LEGAL NOTICE
Neither the European commission nor any person acting on behalf of the Commission is responsible for the use which might be made of the following
information.
EUR ?? EN © European communities, 2002
Reproduction is authorised provided the source is acknowledged Printed in Italy.
EUR-2nd-GHRSST-PP-workshop-report-v3.0.doc Page 4 of 88 Friday, October 11, 2002
Proceedings of the 2nd GHRSST-PP workshop
Document change record
Author Modification Issue Ref. Date C J Donlon Draft for ST review 1.0 GHRSSTPP/5 September 6 2002
C J Donlon Revised as EUR report 1.1 CHRSSTPP/5, GODAE-8, EUR October 7 2002

EUR-2nd-GHRSST-PP-workshop-report-v3.0.doc Page 5 of 88 Friday, October 11, 2002
Proceedings of the 2nd GHRSST-PP workshop
Forward In 1997, using the First GARP Global Experiment (FGGE) as a model, the Ocean Observing Panel for Climate (OOPC) proposed the Global Ocean Data Assimilation Experiment (GODAE) as an experiment in which a comprehensive, integrated observing system would be established and held in place for several years. GODAE will provide a global system of observations, communications, modeling and assimilation that will deliver regular, comprehensive information on the state of the oceans, in a way that will promote and engender wide utility and availability of this resource for maximum benefit to the community. Sea surface temperature is fundamental for many GODAE activities. It contains information about climate conditions that directly affect human health, economy, and enterprise. It is an ocean parameter that is widely used for describing ocean circulation and dynamics, in the study of upper-ocean physical and biogeochemical processes, as a boundary condition for meteorological models, as a central factor in studies of air sea fluxes, and as an indicator for climate change and variability. In the last decade, satellite measurements of sea surface temperature have matured considerably and several instruments provide unprecedented daily views of the structure and dynamics of the ocean surface with astonishing accuracy. New microwave instruments are now entering service providing global measurements that are free from the corrupting influence of clouds and stratospheric aerosols - contaminants that have perpetually frustrated infrared measurements from space. Global networks of moored and drifting buoys report in situ sea surface temperature in real time via satellite link and the Global Telecommunications System. In situ radiometer systems, providing precise measurements of the surface skin temperature, capable of autonomous deployment aboard commercial ships for extended periods are emerging, promising for the first time, the possibility of an extensive data resource for the proper validation of sea surface temperatures from infrared satellite sensors. While the measurement of sea surface temperature, arguably one of the most basic yet important oceanographic parameters, represents a fine example of operational oceanography, fundamental challenges remain. Satellite sea surface temperature products are of varied heritage, assembled using many different approaches and algorithms, often with considerable duplication of effort in different countries. Extensive data sets are derived from multiple sensors sampling at different times of the day introducing regional and temporal biases associated with diurnal stratification of the upper ocean. In some cases, precessive satellite orbits compound this problem although little progress has been made to address these effects. In practice, the accuracy, sensitivity, and sampling resolution of global sea surface temperature products is far from optimal. GODAE rapidly realized that current sea surface temperature data sets are not able to fulfill its requirements and In March 2000, the International GODAE Steering Team issued a prospectus that established the broad scientific rationale for the development of an operational high-resolution sea surface temperature data product that could address the needs of GODAE and the wider oceanographic community. By November 2000, an International Workshop was convened at the European Commission Joint Research Center in Italy to develop the prospectus. Rather than improving individual satellite data streams, a fresh approach emerged based on the fusion and combined analysis of complementary satellite and in situ measurements. The combination of satellite and in situ sea surface temperature data sets is one of great significance. Only by careful reference to in situ observations can satellite measurements attain the quality and accuracy required to confidently reveal the small signals associated with climate change and variability. A new generation of global sea surface temperature products would be derived harnessing the unique strengths of separate data streams to alleviate the weakness of others. High-resolution products would be generated in real time by a demonstration system and would

EUR-2nd-GHRSST-PP-workshop-report-v3.0.doc Page 6 of 88 Friday, October 11, 2002
Proceedings of the 2nd GHRSST-PP workshop
be freely and widely available. From this Workshop, the GODAE High Resolution Sea Surface Temperature Pilot Project (GHRSST-PP) was born. There is no doubt that the vision of the GHRSST-PP is ambitious. Equally, there are few who would argue that the project is not required. Much progress has already been achieved since the first Workshop; A Strategy has been prepared and an International Science Team convened to oversee the project. In fact considerable support for the project is already evident. Large-scale regional projects that will implement a substantial part of the GHRSST-PP in Japan, Europe and, the USA are advancing steadily. Dedicated data servers and direct real-time data feeds are soon to be installed allowing large volumes of satellite data to be exchanged in real time. There is a tremendous momentum within the GHRSST-PP. Removing the Barriers to the Implementation of the GHRSST-PP is a fitting title for this Second GHRSST-PP Workshop, hosted at the Earth Observation Research Center, Tokyo, Japan by the Japanese Space agency, NASDA. The proceedings and conclusions found in the following pages of this volume constitute a consensus opinion for the data products and Implementation of the GHRSST-PP. Representatives from Meteorological Offices, Space Agencies, Military organizations, International Oceanographic projects, Government agencies, Universities and International data centers were all in attendance. It is their task to translate the Strategy and scientific vision of the GHRSST-PP into a demonstration system providing a new generation of sea surface temperature measurements for GODAE and the scientific community. Craig Donlon Chairman of the GHRSST-PP Science Team Ispra, Italy, September 6th 2002.

EUR-2nd-GHRSST-PP-workshop-report-v3.0.doc Page 7 of 88 Friday, October 11, 2002
Proceedings of the 2nd GHRSST-PP workshop
Table of Contents 1 INTRODUCTION: THE GHRSST-PP STRATEGY 9
1.1 THE SECOND GHRSST-PP WORKSHOP: “REMOVING BARRIERS TO THE IMPLEMENTATION OF THE GHRSST-PP” 11 1.2 REFERENCE DOCUMENTS 11
2 OPENING SESSION 12
3 SESSION 1: THE GHRSST-PP DEMONSTRATION PRODUCT DEFINITIONS INCLUDING ERROR AND CONFIDENCE DATA. 13
3.1.1 H. KAWAMURA, Y. KAWAI, L. GUAN, K. HOSODA, M. KACHI AND H. MURAKAMI (TOHOKU UNIVERSITY, JAPAN): "THE NEW GENERATION SST VERSION 1.0 (NGSSTV1)". 13 3.1.2 Y. KAWAI: "NGSSTV1 TREATMENT OF SST DIURNAL VARIATIONS". 15 3.1.3 L.GUAN: "NGSSTV1 SST MERGING METHODOLOGY" 16 3.1.4 H. KAWAMURA AND K. HOSODA: "ERROR ANALYSES OF THE NGSSTV1" 18 3.1.5 CHELLE GENTEMANN (RSS, USA) “BLENDED MW IR DATA ALGORITHMS” 18 3.1.6 PIERRE LEBORGNE (CMS/METEO FRANCE, FRANCE)“CONFIDENCE LEVELS AND ASSOCIATED ERROR CHARACTERISTICS IN THE O&SI SAF SST PRODUCTS". 21 3.1.7 ALICE STUART MENTETH (SOC, UK): “WHY THE GHRSST-PP SHOULD WORRY ABOUT DIURNAL STRATIFICATION” 23 3.2 SESSION I CONCLUSIONS 26
4 SESSION 2. ACCESS TO SST DATA STREAMS 28
4.1 SESSION 2, PART I: ACCESS TO SATELLITE DATA STREAMS. 28 4.1.1 IAN ROBINSON (SOC, UK): "IS THERE A NEED FOR A GHRSST-PP DYNAMIC DISTRIBUTED DATASET (DDD)?" 28 4.1.2 MISAKO KACHI AND HIROSHI MURAKAMI (NASDA, JAPAN): “IMPLEMENTATION PLAN FOR THE ADEOS-II/AQUA SST GENERATION” 30 4.1.3 GARY WICK (U. COLORADO, USA): “SKIN SST FROM NPOESS VISIBLE AND INFRARED IMAGER RADIOMETER SUITE (VIIRS)” 30 4.1.4 KENNETH CASEY (NOAA, USA) "TOWARD THE DEVELOPMENT OF A GLOBAL 4KM AVHRR SST DATASET". 31 4.2 SESSION 2 PART II: ACCESS TO IN SITU DATA STREAMS 34 4.2.1 SATOSHI SATO (JAPAN OCEANOGRAPHIC DATA CENTER): “INTERNATIONAL OCEANOGRAPHIC DATA EXCHANGE (IODE) UNDERWAY SEA SURFACE SALINITY DATA PILOT PROJECT ACTIVITIES” 34 4.2.2 CRAIG DONLON (EUROPEAN COMMISSION, ITALY) “OPERATIONAL VALIDATION OF SATELLITE DATA USING IN SITU RADIOMETERS” 34 4.2.3 IAN BARTON (CSIRO, AUSTRALIA: “THE MIAMI2 IN SITU RADIOMETER INTER-CALIBRATION EXERCISE AND BEYOND “ 38 4.3 SESSION 2 CONCLUSIONS 40
5 SESSION 3. THE GHRSST-PP IMPLEMENTATION PLAN 42
5.1 SESSION 3 PART I: A REVIEW, PRIORITIZE AND FORMULATE THE GHRSST-PP IMPLEMENTATION PLAN 42 5.1.1 CRAIG DONLON (EC/JRC, ITALY) “OVERVIEW OF THE INITIAL GHRSST-PP IMPLEMENTATION PLAN” 42 5.1.2 ANDY HARRIS (NOAA/NESDIS, USA) “THE ROLE OF THE GHRSST-PP IN NOAA/NESDIS”. 43 5.1.3 HIROSHI KAWAMURA (EORC/NASDA, JAPAN) THEN PRESENTED “AN IMPLEMENTATION PLAN FOR GLOBAL NEW GENERATION SST DATA PRODUCTS”. 45 5.1.4 OLIVIER ARINO (ESA, ITALY) “MEDSPIRATION : AN ESA INITIATIVE IN RESPONSE TO GODAE GHRSST-PP". 48 5.1.5 TOSHIYUKI SAKURAI (JMA, JAPAN) “OPERATIONAL DAILY MAPPING OF HIGH RESOLUTION DAILY SST BY JMA”. 50 5.1.6 GARY WICK (NOAA, USA): “SST MERGING STRATEGIES” 51 5.2 CONCLUSIONS FORM SESSION 3 PART 1 53 5.3 SESSION3 PART II: TO FORMALIZE RELATIONSHIP AND COMMITMENTS TO GODAE AND OTHER ASSOCIATED PROJECTS 55 5.3.1 BILL ROSSOW (NASA, USA): "THE GEWEX PROJECTS OF MOST RELEVANCE TO THE GHRSST-PP: THE SURFACE RADIATION BUDGET PROJECT (SRB), THE PRECIPITATION PROJECT (GPCP) AND THE SEAFLUX ACTIVITY." 55 5.3.2 NAOTO MATSUURA (NASDA, JAPAN): "ADEOS-II SCIENCE PROJECT STATUS". 56 5.3.3 NICK RAYNER (HADLEY CENTRE, UK): “CLIMATE REQUIREMENTS FOR SST DATA SETS: THE AOPC/OOPC SST AND SEA ICE WORKING GROUP”. 56 5.4 CONCLUSIONS FORM SESSION 3 PART 2 59 5.5 SESSION 3 PART III: TO DEFINE AND FORMALIZE THE GHRSST-PP DEMONSTRATION INFRASTRUCTURE 60 5.5.1 HIROSHI KAWAMURA (NASDA, JAPAN): “A NASDA SERVER FOR GHRSST-PP”. 60 5.5.2 JIM CUMMINGS (US NAVY): “THE US-GODAE MONTERREY SERVER AND THE GHRSST-PP”. 61 5.5.3 CRAIG DONLON AND SIMON PINNOCK (EC/JRC, ITALY): “THE GHRSST-PP DIAGNOSTIC DATA SET: INITIAL EXPERIENCE”. 62 5.5.4 ED ARMSTRONG (JPL, USA): “THE PHYSICAL OCEANOGRAPHY DISTRIBUTED ACTIVE ARCHIVE CENTER (PO.DAAC)”. 64 5.6 CONCLUSIONS FORM SESSION 3 PART 3 66

EUR-2nd-GHRSST-PP-workshop-report-v3.0.doc Page 8 of 88 Friday, October 11, 2002
Proceedings of the 2nd GHRSST-PP workshop
5.7 SESSION 3 PART IV: IDENTIFICATION OF METRICS FOR THE GHRSST-PP 68 5.8 CONCLUSIONS FORM SESSION 3 PART 4 69
6 SESSION 4. ESTIMATE THE BUDGET REQUIREMENTS OF THE GHRSST-PP AND TO IDENTIFY THE FUNDING SOURCES AND MECHANISMS AVAILABLE TO THE GHRSST-PP 70
7 FINAL PLENARY DISCUSSION: REMOVING THE BARRIERS TO THE IMPLEMENTATION OF THE GHRSST-PP 73
7.1.1 GLOBAL OPERATIONAL DATA PROVISION AND SERVERS 76 7.1.2 REGIONAL DATA PROVISION AND SERVERS 76 7.1.3 GLOBAL TELECOMMUNICATIONS SYSTEM (GTS) 77 7.1.4 NEW GENERATION SST (NGSST) PROJECT 77 7.1.5 EUROSST PROJECT 77 7.1.6 COOPERATIVE US SST PROJECT 77 7.1.7 JAPAN, EUROPEAN AND, USA REGIONAL DATA ASSEMBLY CENTER (RDAC) 77 7.1.8 GLOBAL DATA ANALYSIS CENTER (GDAC) 77 7.1.9 IN SITU AND SATELLITE DATA INTEGRATION (ISDI) 78 7.1.10 IN SITU AND SATELLITE DATA INTEGRATION TECHNICAL ADVISORY GROUP (ISDI-TAG) 78 7.1.11 THE DIAGNOSTIC DATA SET (DDS) 78 7.1.12 THE METADATA REPOSITORY (MDR) 78 7.1.13 THE DATA PRODUCT COMPUTATIONAL FACILITY (DPCF) 79 7.1.14 THE USER INFORMATION SERVICE (UIS) 79 7.1.15 GHRST-PP DATA PRODUCT SERVING (UIS-DS) 79 7.1.16 GHRSST-PP WEB PORTAL AND OUTREACH ACTIVITIES (UIS-WWP) 79 7.1.17 DATA ACCESS-ARCHIVE CENTER (UIS-DAAC) 79 7.1.18 REANALYSIS PROJECT (UIS-RAN) 79 7.1.19 APPLICATIONS AND USER SERVICES (AUS) 80 7.2 SCHEDULE FOR THE IMPLEMENTATION OF THE GHRSST-PP 81
8 AOB 82
9 ANNEX I: ATTENDANCE LIST FOR THE GHRSST-PP 2ND WORKSHOP 83
10 ANNEX II: AGENDA 86
10.1.1 AGENDA FOR TUESDAY, 14TH MAY 2002 86 10.1.2 AGENDA FOR WEDNESDAY, 15TH MAY 2002 87 10.1.3 AGENDA FOR THURSDAY, 16TH MAY 2002 88

EUR-2nd-GHRSST-PP-workshop-report-v3.0.doc Page 9 of 88 Friday, October 11, 2002
Proceedings of the 2nd GHRSST-PP workshop
1 Introduction: The GHRSST-PP strategy Following the first GHRSST-PP workshop held at the European Commission Joint Research Center, Italy, (Smith, 2000), the GODAE high-resolution sea surface temperature Pilot Project (GHRSST-PP) was established to give international focus and coordination for the development of a global, multi-sensor, high-resolution, Sea Surface Temperature (SST) data set. In order to achieve this, the GHRSST-PP project will deliver a demonstration system that integrates data from internationally distributed sources. The output of the demonstration system will be a new generation of SST data products suitable for use in GODAE and the scientific community as a whole derived using innovative data merging and analysis techniques that will capitalize on the synergy between satellite and in situ SST data streams. The GHRSST-PP Strategic Plan (Donlon, 2002) states the main aim of the GHRSST-PP project:
“Ensure the provision of rapidly and regularly distributed, high-quality sea surface temperature products at a fine spatial and temporal resolution that meet the diverse needs of GODAE, the scientific community, operational users and climate applications at a global scale.”
The Strategy describes five primary objectives in order to achieve this aim. These are to:
1. Identify SST data sources and data providers (including measurements of SST from existing and future satellite and in situ sources and satellite data (e.g., Infrared, microwave) from which SST observations are derived and data users across all application sectors and establish data access agreements, timely data exchange routes, protocols and services.
2. Characterize the quality of SST data sources through validation exercises and identify differences between them by inter-comparison at local, regional and global spatial scales and for daily, weekly and monthly temporal scales.
3. Develop innovative SST data integration and assimilation methods that exploit existing SST datasets through data merging/fusion in order to generate improved multi-sensor SST products.
4. Identify and promote targeted research and development needed to address outstanding issues concerning, for example, the access to and exchange of data, merging of complementary SST data streams, appropriate cloud clearing strategies and SST algorithms.
5. Implement a demonstration system to provide timely SST products that are responsive to user requirements during the 2003-2005 GODAE demonstration period.
Four interrelated GHRSST-PP strategic themes propose a conceptual system to integrate satellite and in situ data from international data sources using state-of-the-art communications and analysis tools. Each theme is designed to guide the implementation of the GHRSST-PP by achieving several practical objectives:
• Theme I: Delivery and specification of SST data products required by different users and diverse applications

EUR-2nd-GHRSST-PP-workshop-report-v3.0.doc Page 10 of 88 Friday, October 11, 2002
Proceedings of the 2nd GHRSST-PP workshop
• Theme II: Characterization and identification of differences between different satellite and in situ SST datasets
• Theme III: Targeted research and development for integrating satellite and in situ data
• Theme IV: Generation of improved, multi-sensor SST data products through data merging and analysis.
Figure 1 (taken from the GHRSST-PP Strategy and Initial Implementation Plan) presents a schematic overview of the GHRSST-PP Strategy. A user information and support (UIS) facility that will co-ordinate and manage all interactions with the GHRSST-PP user community including user services (e.g., data access), all user application feedback, general project information, project contacts, and product activity descriptions. The UIS is the portal to the GHRSST-PP project and in its simplest form may be realized as an interactive WWW site and a project Office. A dynamic distributed database (DDD) providing a virtual database system that coordinates access and exchange of existing globally distributed satellite and in situ SST data for use within the GHRSST-PP linked by an automatically updated metadata repository. This provides a master index of all GHRSST-PP datasets for use within the project. In its simplest form, the DDD may be implemented using existing tools and networks such as ftp servers and the Distributed Oceanographic Data system (DODS) together with a dedicated metadata repository. Several interconnected data servers will be installed to exchange data in real time within the GHRSST-PP.
Figure 1. Schematic diagram showing the GHRSST-PP Strategic Themes and their inter-relationships and
feedback loops. A quality control and analysis facility that includes a set of activities that test, inter-compare and validate input SST data streams considered by the GHRSST-PP at local, regional and global time-scales and at a variety of spatial resolutions. At its core is the concept of a diagnostic data set (DDS) that contains high-resolution satellite data and in situ observations contemporaneous with other satellite data for globally distributed small area (2° x 2°) "DDS-sites" that collectively, represent global climatic regimes. The DDS provides a means to test and develop new data merging and analysis methods, SST algorithms and, to validate GHRSST-PP products.
EUR-2nd-GHRSST-PP-workshop-report-v3.0.doc Page 11 of 88 Friday, October 11, 2002
Proceedings of the 2nd GHRSST-PP workshop
Software tools that access and merge internationally distributed SST datasets in order to create the GHRSST-PP products described in Table 1. This is referred to as in situ and satellite data integration (ISDI) and is an evolutionary system improving as more data and different approaches to analysis and data fusion are explored throughout the GHRSST-PP lifetime. In its simplest form, this may be realized as a set of software tools that generate a finite set of GHRSST-PP demonstration data products. The reader is referred to The GHRSST-PP Strategy and Initial Implementation Plan (Donlon, 2002) for a complete description of the GHRSST-PP strategy. This and all other documents can be found at the GHRSST-PP web site http://www.ghrsst-pp.org.
1.1 The second GHRSST-PP workshop: “Removing barriers to the implementation of the GHRSST-PP”
It was agreed at the 6th International GODAE Steering Team meeting (December 2001) that a second GHRSST-PP Science Team meeting (described in a separate report, GHRSST/4) and workshop should be called. The purpose of the workshop was to convene key representatives of the international SST community to discuss the implementation of the GHRSST-PP. The aim of the workshop was to map the scientific vision provided by the GHRSST-PP thematic strategy into a viable but detailed implementation framework. This report provides a summary of proceedings during the 2nd GHRSST-PP workshop over the period 14th-16th May, 2002. The meeting was sponsored by the National Space Development Agency (NASDA) Earth Observation Research Center (EORC) in and took place at Harumi Island Triton Square Office Tower-X, 1-8-10 Harumi, Chuo-ku, Tokyo 104-6023. The workshop format was based on a series of thematic sessions designed to address the practical implementation of the GHRSST-PP. Each session consisted of several formal presentations coordinated by a session leader. This was followed by plenary discussion at the end of each session. Workshop participants were drawn from a wide background and, in addition to the GHRSST-PP Science Team, representatives from international space agencies, operational oceanographic and meteorological agencies, funding agencies, user groups and GODAE data and information management teams were represented. A list of participants is provided as Annex I to the report and the working workshop agenda is provided in Annex II.
1.2 Reference documents All of these documents are available from http://www.ghrsst-pp.org
1. GHRSST/2: Smith, N, Report of the GODAE high resolution SST workshop, 30th October - 1st November 2000, (GODAE report No. 7), available from the International GODAE project office, Bureau of Meteorology, Melbourne, 3001, Australia, 64pp, 2001.
2. GHRSST/3: Donlon, C. J., The GODAE High Resolution SST pilot project Strategy and initial implementation plan, available from the International GODAE project office, Bureau of Meteorology, Melbourne, 3001, Australia, 2002.
3. GHRSST/6: GHRSST-PP Implementation plan.

EUR-2nd-GHRSST-PP-workshop-report-v3.0.doc Page 12 of 88 Friday, October 11, 2002
Proceedings of the 2nd GHRSST-PP workshop
2 Opening Session Following a brief welcome and a summary of local arrangements made by Hiroshi Kawamura, the GHRSST-PP 2nd workshop was formerly opened by Mr. Matsuura (NASDA/EORC). Matsuura gave an overview of the Advanced Microwave Scanning Radiometer (AMSR) and AMSR-E activities within NASDA. He stressed that the AMSR and AMSR-E instruments would make an important contribution to the development of a new generation of global SST data sets and that the GHRSST-PP should take full advantage of these data. NASDA was committed to the GHRSST-PP and would work closely with the project to ensure the best support and delivery of Japanese data to the project. Matsuura wished all participants a pleasant stay in Tokyo and that the Workshop would be successful. The Chair (Craig Donlon) then presented the workshop agenda (Annex II) for the approval of participants. The agenda was accepted as the working agenda and timetable for the workshop. The Chair then presented a brief review of the GHRSST-PP Strategy and initial implementation plan highlighting the aims and objectives of the project and the initial table of GHRSST-PP data products and confidence data sets. These were expected to change significantly by the end of the meeting but served as a starting point for discussions. A summary review of the GHRSST-PP organizational structure, strategic themes, expected outcomes and proposed timeline for the GHRSST-PP (fully described in the Strategy document) was presented in order to place the workshop into context. The Chair drew attention to the v0.2 GHRSST-PP Implementation plan that had been circulated to each participant prior to the meeting and stressed that this second workshop had been called in order to develop this implementation plan based on the scientific vision provided by the Strategy document. The Chair concluded that the outcome of the workshop would form a detailed GHRSST-PP Implementation plan. In this respect, it was important to consider the implementation of the GHRSST-PP at all times throughout the workshop and that session leaders should try and encourage focused plenary discussion to this end.

EUR-2nd-GHRSST-PP-workshop-report-v3.0.doc Page 13 of 88 Friday, October 11, 2002
Proceedings of the 2nd GHRSST-PP workshop
3 Session 1: The GHRSST-PP demonstration product definitions including error and confidence data.
This session, chaired by Hiroshi Kawamura and Andrew Harris, was dedicated to reviewing the various developments of new satellite SST data products (infrared, microwave) that may satisfy the demands of the GHRSST-PP. The session was also dedicated to developing a better understanding of the relationship between the SST at depth and that measured by satellite sensors. While the cool skin of the ocean is important in this context, the role of diurnal thermal stratification is a more significant issue that must be resolved before complementary satellite and in situ data sets can be merged. Several presentations and considerable discussion was dedicated to this latter issue. The first part of the session was dedicated to a thorough review of the New Generation Sea surface Temperature (NGSST-v1) system developed by at Tohoku University. This took the form of a series of related talks describing the history and basis for the NGSST approach. The remaining talks then considered a wider scope of issues. 3.1.1 H. Kawamura, Y. Kawai, L. Guan, K. Hosoda, M. Kachi and H. Murakami
(Tohoku University, Japan): "The new generation SST Version 1.0 (NGSSTv1)". Kawamura provided a summary of all activities relating to the NGSST-v1 project as an introduction to the talks to follow. The NGSSTv1 products are based on an objective analysis of different data sets that are used together to provide an estimate of the “minimum daily SST” at 1m depth that is assumed to occur at 6:00 am. Note that the NGSST-v1.0 provides a 1m depth SST that is still affected by diurnal signal and therefore the algorithm specification is based on nighttime data alone.
Figure 2. Validation of GMS VISSR solar radiation retrievals using ship observations. (a) Ship tracks (b)
Hourly mean solar radiation derived from GMS VISSR vs in situ observations. (H. Kawamura) A combination of mean monthly solar radiation, extensively validated using ship observations shown in Figure 2, and SST derived from GMS VISSR data are used together with daily wind speed observations from NSCAT to derive a daily diurnal
EUR-2nd-GHRSST-PP-workshop-report-v3.0.doc Page 14 of 88 Friday, October 11, 2002
Proceedings of the 2nd GHRSST-PP workshop
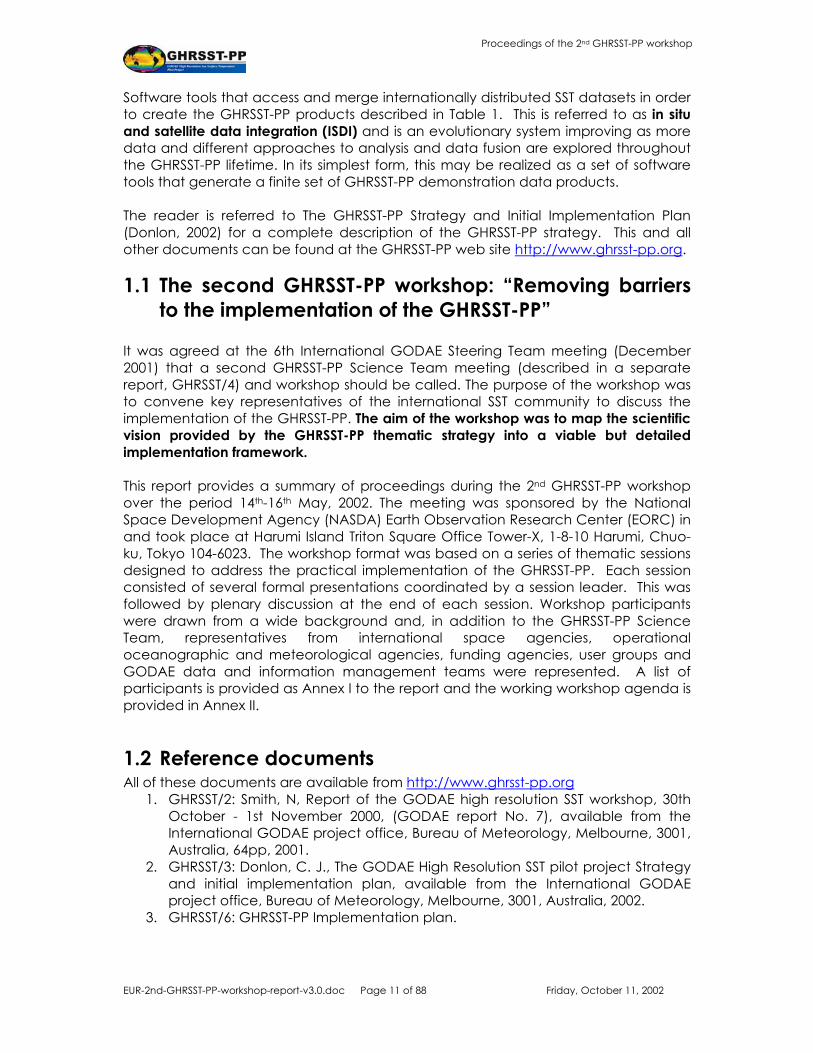
signal using a simple 1D model. The monthly diurnal signal provided by the NGSST diurnal signal model compares well to a more complete model (Price). This model is used to correct individual satellite data sets in the general NGSSTv1 method which is shown schematically in Figure 3.
Figure 3. General overview of NGSSTv1.0 merging strategy (H. Kawamura).
Data from infrared (AVHRR, TRMM VIRS) and microwave satellite sensors (TRMM TMI) having different orbit configurations are used to derive independent SST fields. A 1D model is used to derive a diurnal variation correction based on satellite derived solar radiation (based on GMS VISSR) and wind speed (TMI, QuickScat) observations. Each input SST data set is then adjusted to provide a daily minimum SST using the diurnal variation correction. Finally, objective analysis is used to merge individual SST data sets into a single analyzed SST data product. Many Japanese agencies are contributing to the NGSST effort as shown in Figure 3. Kawamura concluded that the NGSST is now providing operational data sets for the Japanese region (GMS footprint) that are available via Internet connection at http://www.ocean.caos.tohoku.ac.jp.
Figure 3. Schematic overview of the contributing agencies working on the operational NGSST project.
(H. Kawamura)
EUR-2nd-GHRSST-PP-workshop-report-v3.0.doc Page 15 of 88 Friday, October 11, 2002
Proceedings of the 2nd GHRSST-PP workshop
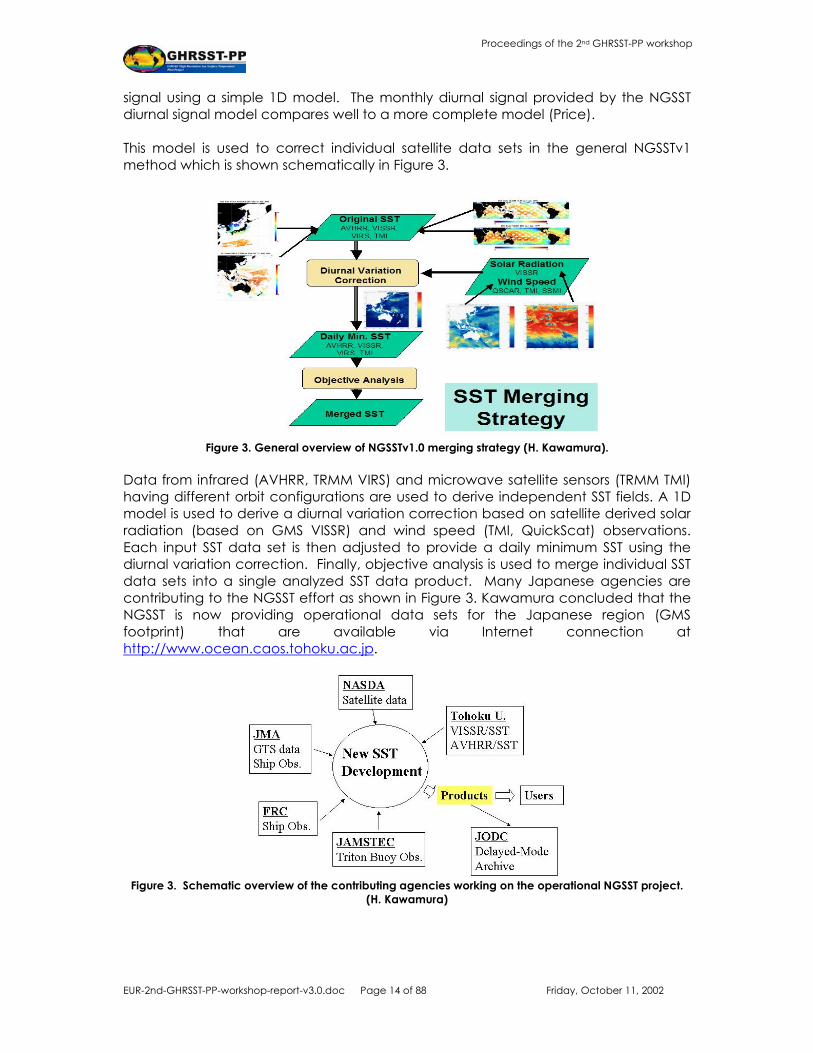
3.1.2 Y. Kawai: "NGSSTv1 treatment of SST diurnal variations". Kawai continued the NGSSTv1 overview highlighting the difference between a daily mean SST, the maximum diurnal amplitude SST and, the mean minimum SST. This is shown schematically in Figure 4. The NGSST-v1 proposes a 1 m depth mean minimum SST (MMSST). In order to properly derive MMST from satellite observations obtained at different times within a diurnal period, it is necessary to fully remove any diurnal signal present in the data (within the upper 1m of the ocean surface) to obtain a minimum SST value. The approach used is to subtract the diurnal signal from each input data set and finally average all available adjusted data to provide a single daily minimum SST.
Figure 4. Adjustment of satellite data obtained at different times of the day to provide daily mean
minimum SST (shown as a blue line). The blue dot defines the minimum daily SST, the red dot defines the maximum daily SST and the red line shows the maximum diurnal SST amplitude. Greed dots represent
satellite data sets obtained at different times off the day. (Y. Kawai) Kawai discussed the method that has been developed for correcting infrared and microwave satellite SST observations to provide daily minimum SST estimates. The technique uses satellite data together with a simple 1D coupled atmosphere-ocean model that assimilates water vapor, daily maximum solar radiation and wind speed.
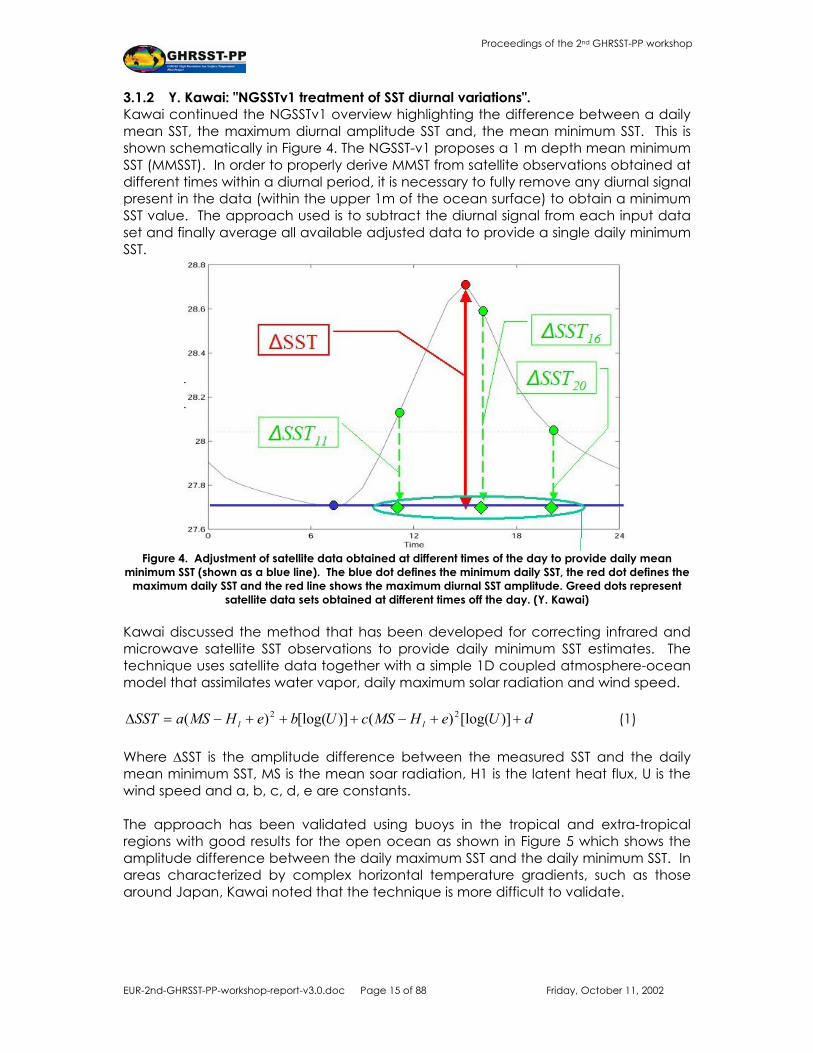
dUeHMScUbeHMSaSST ll ++−+++−=∆ )][log()()][log()( 22 (1) Where ∆SST is the amplitude difference between the measured SST and the daily mean minimum SST, MS is the mean soar radiation, H1 is the latent heat flux, U is the wind speed and a, b, c, d, e are constants. The approach has been validated using buoys in the tropical and extra-tropical regions with good results for the open ocean as shown in Figure 5 which shows the amplitude difference between the daily maximum SST and the daily minimum SST. In areas characterized by complex horizontal temperature gradients, such as those around Japan, Kawai noted that the technique is more difficult to validate.
EUR-2nd-GHRSST-PP-workshop-report-v3.0.doc Page 16 of 88 Friday, October 11, 2002
Proceedings of the 2nd GHRSST-PP workshop
Figure 5. Validation of the estimated ∆SST using Equation 1 in (a) Drifting buoys: (Lat ≥ 14º) Bias ±–0.04 K, S.D. ±0.20 K, Correlation 0.775 (b) TAO buoys: Bias –0.00 K, S.D.0.18 K, Correlation 0.790. (H.Kawai)
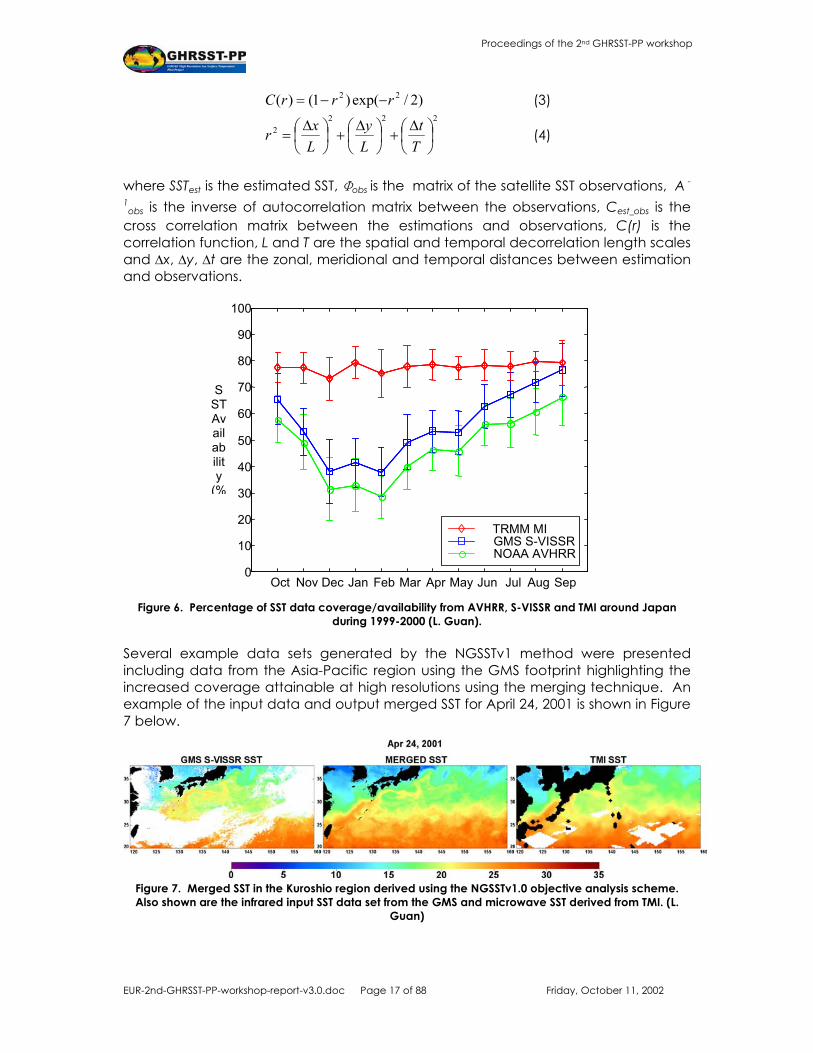
There are several problems with this methodology discussed by Kawai, including the fact that the error associated with satellite SST data is often larger that the diurnal signal. Kawai concluded that the model was currently submitted as a paper and the text was available at the NGSST-v1.0 web pages (http://www.ocean.caos.tohoku.ac.jp). The workshop expressed concern about the shape of the diurnal warming curve shown in the presentation with several participants suggesting that the phase and amplitude of the diurnal signal will be different depending on the local wind speed, cloud, solar radiation and water type. This was acknowledged and Kawai replied that the NGSST-v1 method is a first step, designed for real time operations, and is a simplified version compared to what might be achievable in a reanalysis SST product. 3.1.3 L.Guan: "NGSSTv1 SST merging methodology" Guan presented an overview of the objective analysis procedures used in the NGSST-v1.0 methodology. Guan demonstrated the importance of understanding input SST data streams before any analysis procedure can be devised. Using TRMM TMI/VIIRS, GMS VISSR and AVHRR data within the October 1999 – September 2000 period, Figure 6 plots the percentage of SST availability as a function of time for each data set. In terms of data coverage, a clear seasonal trend (ranging between ~40-70% coverage) is evident in the infrared data streams due to the seasonal variation in clouds. Regional variations are also evident, with coverage ranging between 30-70%. In contrast, microwave SST data from TMI have good coverage (~75%) throughout the year (highlighting the importance of microwave SST data for the GHRSST-PP). Guan then described the objective analysis scheme used in the NGSST-v1.0 approach. This is based on the use of minimum mean square and cross correlation matrices according to:
obsobsobsestest ACtyxSST φ1_),,( −= (2)
EUR-2nd-GHRSST-PP-workshop-report-v3.0.doc Page 17 of 88 Friday, October 11, 2002
Proceedings of the 2nd GHRSST-PP workshop
)2/exp()1()( 22 rrrC −−= (3) 222
2
∆+
∆+
∆=
Tt
Ly
Lxr (4)
where SSTest is the estimated SST, Φobs is the matrix of the satellite SST observations, A -
1obs is the inverse of autocorrelation matrix between the observations, Cest_obs is the
cross correlation matrix between the estimations and observations, C(r) is the correlation function, L and T are the spatial and temporal decorrelation length scales and ∆x, ∆y, ∆t are the zonal, meridional and temporal distances between estimation and observations.
Oct Nov Dec Jan Feb Mar Apr May Jun Jul Aug Sep 0
10
20
30
40
50
60
70
80
90
100
SST Availability
(%
TRMM MI GMS S-VISSR NOAA AVHRR
Figure 6. Percentage of SST data coverage/availability from AVHRR, S-VISSR and TMI around Japan
during 1999-2000 (L. Guan). Several example data sets generated by the NGSSTv1 method were presented including data from the Asia-Pacific region using the GMS footprint highlighting the increased coverage attainable at high resolutions using the merging technique. An example of the input data and output merged SST for April 24, 2001 is shown in Figure 7 below.
Figure 7. Merged SST in the Kuroshio region derived using the NGSSTv1.0 objective analysis scheme. Also shown are the infrared input SST data set from the GMS and microwave SST derived from TMI. (L.
Guan)
EUR-2nd-GHRSST-PP-workshop-report-v3.0.doc Page 18 of 88 Friday, October 11, 2002
Proceedings of the 2nd GHRSST-PP workshop
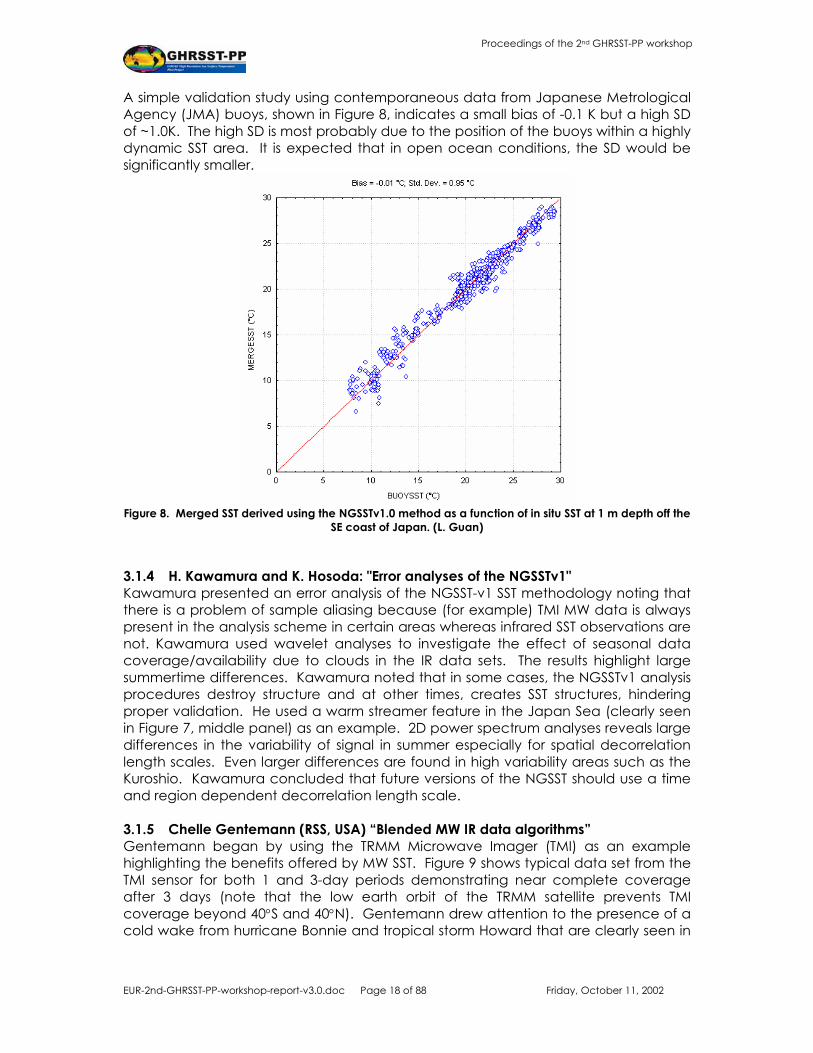
A simple validation study using contemporaneous data from Japanese Metrological Agency (JMA) buoys, shown in Figure 8, indicates a small bias of -0.1 K but a high SD of ~1.0K. The high SD is most probably due to the position of the buoys within a highly dynamic SST area. It is expected that in open ocean conditions, the SD would be significantly smaller.
Figure 8. Merged SST derived using the NGSSTv1.0 method as a function of in situ SST at 1 m depth off the
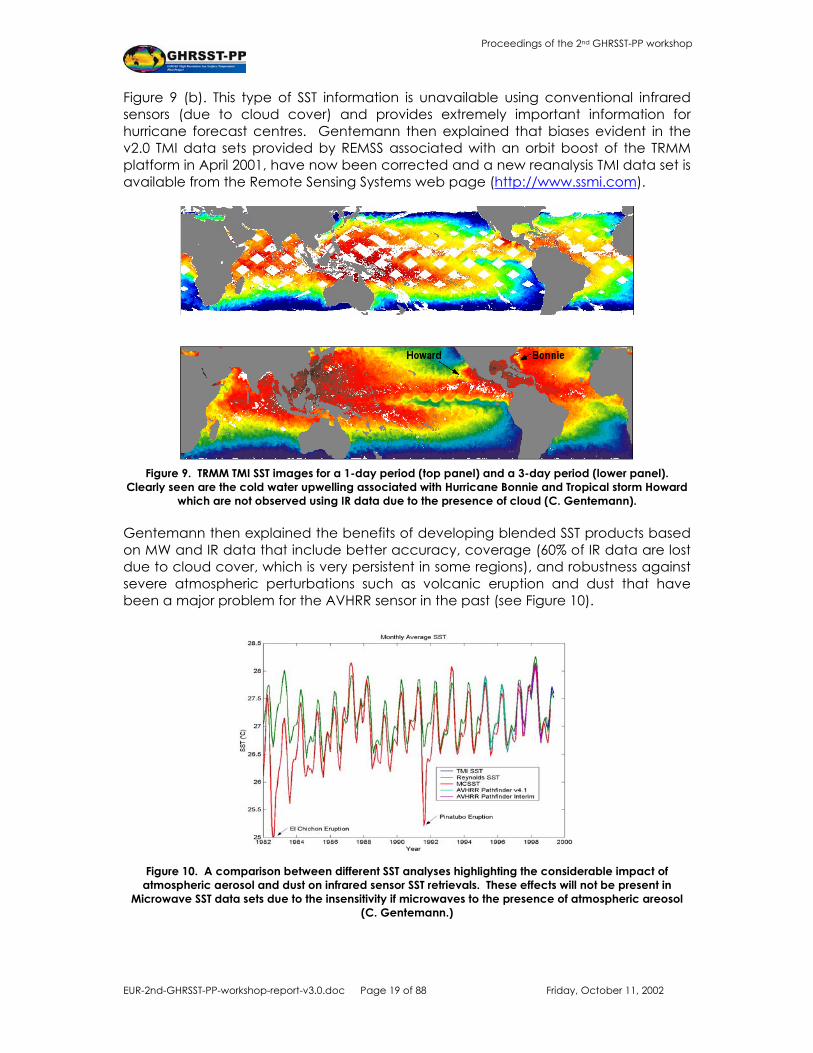
SE coast of Japan. (L. Guan) 3.1.4 H. Kawamura and K. Hosoda: "Error analyses of the NGSSTv1" Kawamura presented an error analysis of the NGSST-v1 SST methodology noting that there is a problem of sample aliasing because (for example) TMI MW data is always present in the analysis scheme in certain areas whereas infrared SST observations are not. Kawamura used wavelet analyses to investigate the effect of seasonal data coverage/availability due to clouds in the IR data sets. The results highlight large summertime differences. Kawamura noted that in some cases, the NGSSTv1 analysis procedures destroy structure and at other times, creates SST structures, hindering proper validation. He used a warm streamer feature in the Japan Sea (clearly seen in Figure 7, middle panel) as an example. 2D power spectrum analyses reveals large differences in the variability of signal in summer especially for spatial decorrelation length scales. Even larger differences are found in high variability areas such as the Kuroshio. Kawamura concluded that future versions of the NGSST should use a time and region dependent decorrelation length scale. 3.1.5 Chelle Gentemann (RSS, USA) “Blended MW IR data algorithms” Gentemann began by using the TRMM Microwave Imager (TMI) as an example highlighting the benefits offered by MW SST. Figure 9 shows typical data set from the TMI sensor for both 1 and 3-day periods demonstrating near complete coverage after 3 days (note that the low earth orbit of the TRMM satellite prevents TMI coverage beyond 40°S and 40°N). Gentemann drew attention to the presence of a cold wake from hurricane Bonnie and tropical storm Howard that are clearly seen in
EUR-2nd-GHRSST-PP-workshop-report-v3.0.doc Page 19 of 88 Friday, October 11, 2002
Proceedings of the 2nd GHRSST-PP workshop
Figure 9 (b). This type of SST information is unavailable using conventional infrared sensors (due to cloud cover) and provides extremely important information for hurricane forecast centres. Gentemann then explained that biases evident in the v2.0 TMI data sets provided by REMSS associated with an orbit boost of the TRMM platform in April 2001, have now been corrected and a new reanalysis TMI data set is available from the Remote Sensing Systems web page (http://www.ssmi.com).
Figure 9. TRMM TMI SST images for a 1-day period (top panel) and a 3-day period (lower panel).
Clearly seen are the cold water upwelling associated with Hurricane Bonnie and Tropical storm Howard which are not observed using IR data due to the presence of cloud (C. Gentemann).
Gentemann then explained the benefits of developing blended SST products based on MW and IR data that include better accuracy, coverage (60% of IR data are lost due to cloud cover, which is very persistent in some regions), and robustness against severe atmospheric perturbations such as volcanic eruption and dust that have been a major problem for the AVHRR sensor in the past (see Figure 10).
Figure 10. A comparison between different SST analyses highlighting the considerable impact of
atmospheric aerosol and dust on infrared sensor SST retrievals. These effects will not be present in Microwave SST data sets due to the insensitivity if microwaves to the presence of atmospheric areosol
(C. Gentemann.)
EUR-2nd-GHRSST-PP-workshop-report-v3.0.doc Page 20 of 88 Friday, October 11, 2002
Proceedings of the 2nd GHRSST-PP workshop
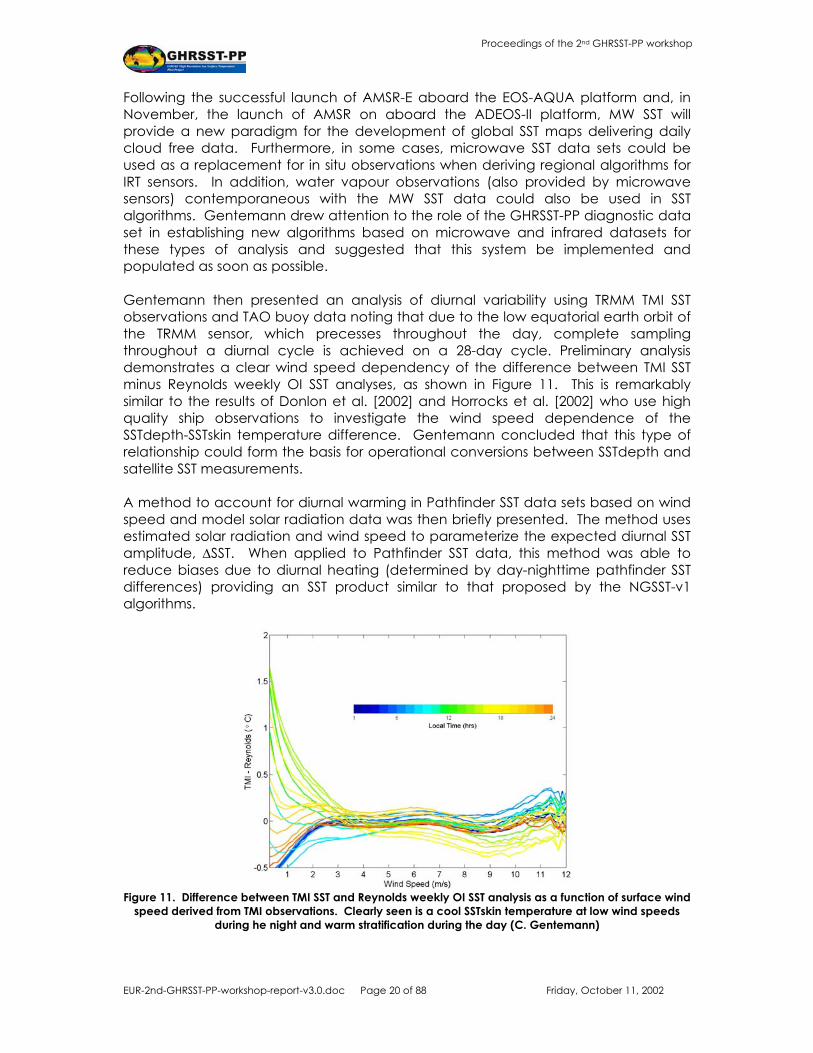
Following the successful launch of AMSR-E aboard the EOS-AQUA platform and, in November, the launch of AMSR on aboard the ADEOS-II platform, MW SST will provide a new paradigm for the development of global SST maps delivering daily cloud free data. Furthermore, in some cases, microwave SST data sets could be used as a replacement for in situ observations when deriving regional algorithms for IRT sensors. In addition, water vapour observations (also provided by microwave sensors) contemporaneous with the MW SST data could also be used in SST algorithms. Gentemann drew attention to the role of the GHRSST-PP diagnostic data set in establishing new algorithms based on microwave and infrared datasets for these types of analysis and suggested that this system be implemented and populated as soon as possible. Gentemann then presented an analysis of diurnal variability using TRMM TMI SST observations and TAO buoy data noting that due to the low equatorial earth orbit of the TRMM sensor, which precesses throughout the day, complete sampling throughout a diurnal cycle is achieved on a 28-day cycle. Preliminary analysis demonstrates a clear wind speed dependency of the difference between TMI SST minus Reynolds weekly OI SST analyses, as shown in Figure 11. This is remarkably similar to the results of Donlon et al. [2002] and Horrocks et al. [2002] who use high quality ship observations to investigate the wind speed dependence of the SSTdepth-SSTskin temperature difference. Gentemann concluded that this type of relationship could form the basis for operational conversions between SSTdepth and satellite SST measurements. A method to account for diurnal warming in Pathfinder SST data sets based on wind speed and model solar radiation data was then briefly presented. The method uses estimated solar radiation and wind speed to parameterize the expected diurnal SST amplitude, ∆SST. When applied to Pathfinder SST data, this method was able to reduce biases due to diurnal heating (determined by day-nighttime pathfinder SST differences) providing an SST product similar to that proposed by the NGSST-v1 algorithms.
Figure 11. Difference between TMI SST and Reynolds weekly OI SST analysis as a function of surface wind
speed derived from TMI observations. Clearly seen is a cool SSTskin temperature at low wind speeds during he night and warm stratification during the day (C. Gentemann)

EUR-2nd-GHRSST-PP-workshop-report-v3.0.doc Page 21 of 88 Friday, October 11, 2002
Proceedings of the 2nd GHRSST-PP workshop
Gentemann then focused on the use of MW data as an input to cloud clearing techniques used to flag cloudy pixels in IR SST data sets. In particular the typically aggressive cloud clearing schemes, such as CLAVR, rejects considerable amounts of clear sky SST data. Using TMI and TRMM VIIRS data, a new technique based on the use of cloud liquid water vapor obtained from the MW signal was presented. The cloud liquid water vapor, when compared to visible waveband reflectance data is shown to provide an excellent cloud mask as shown in Figure 12.
Figure 12. (Top panel) TRMM VIRS 1.6µm data and (bottom panel) contemporaneous TMI cloud liquid
water vapor in February 22-23, 2002. The similarities between the CLW and reflectance data are clearly evident allowing the CLW data to serve as a basic cloud mask (C. Gentemann)
This result is particularly interesting for SST production in an operational context where the pixel-by-pixel calculations and cumbersome statistical tests required by most IR data cloud flagging algorithms are extremely costly. Gentemann concluded that scheme requires further development but it promises to deliver an efficient cloud clearing technique suitable for use in an operational environment. 3.1.6 Pierre LeBorgne (CMS/Meteo France, France)“Confidence levels and
associated error characteristics in the O&SI SAF SST products". LeBorgne began by explaining the O&SI SAF produce SSTsub-skin data products using N16 and GOES-8 data sets. An important component of the data products is the assignment of error statistics as the various modeling groups that use SAF data products require error and confidence data. LeBorgne described a scheme that is used in which “confidence level” is used to define error statistics to each SST pixel based on 2 criteria:
1. The distance (number of pixels) of the nearest cloudy pixel to the pixel in
question 2. The magnitude of difference between the SST derived at the pixel and the
minimum climatology for that particular pixel.

EUR-2nd-GHRSST-PP-workshop-report-v3.0.doc Page 22 of 88 Friday, October 11, 2002
Proceedings of the 2nd GHRSST-PP workshop
Figure 13. SST confidence level determination based on temperature difference (from climatology)
thresholds and pixel distance from the nearest cloudy pixel. (P. LeBorgne). The confidence level determination scheme is summarized in Figure 13 above. A six-point scale is used to attribute a numerical value to each confidence level. A class 5 or “excellent” confidence is assigned when a pixel is far away from cloudy areas but also in good agreement with [local] SST climatology. A “bad” value is assigned when a given pixel close to cloud and significantly different from climatological values. The scheme has been implemented in CMS/Meteo France operations and is functioning well. It has been validated using in situ observations that reveal lower bias errors associated with higher confidence levels (for both AVHRR and GOES data) although standard deviations remain the same, as shown in Figure 14. The use of appropriate confidence levels is an adequate technique to eliminate cloud contaminated pixels according to user’s needs and could be used on a pixel basis in OI schemes.
Figure 14. NOAA 16 day and N16 night mean SST error expressed as a function of SST confidence level for the period Jan-May, 2002. (P. LeBorgne)
A lively discussion focused on how to incorporate these ideas into the GHRSST-PP and generate error statistics for data products. It was concluded that the use of targeted

EUR-2nd-GHRSST-PP-workshop-report-v3.0.doc Page 23 of 88 Friday, October 11, 2002
Proceedings of the 2nd GHRSST-PP workshop
regional diagnostic data sets would be a first start to test the method but a more extensive procedure would be required to consider the position of pixels relative to cloud-contaminated data. It was also decided that MW SST data would be a better than the climatological values currently used in the Meteo France scheme. Finally, LeBorgne noted that Doug May was due to speak at the workshop on similar ideas although was not able to attend the workshop in the end. Further consultation with May and others was required in order to harmonize confidence data within the USA, Europe and Japan. 3.1.7 Alice Stuart Menteth (SOC, UK): “Why the GHRSST-PP should worry about
diurnal stratification” Stuart-Menteth reminded the workshop that the GHRSTT-PP data merging methodology needs to account for SST diurnal variability because complementary satellite and in situ data streams are obtained at different times within a diurnal cycle and, at different depths. An analysis of Pathfinder 18 km SST day-nighttime difference maps was presented to investigate and characterize the spatial and temporal variability of the global diurnal SST signal. Only Pathfinder data corresponding to pixel quality flag 4 and above were used in the analysis. This quality level provides a quoted accuracy that is sufficient to investigate the character of diurnal variability. Pathfinder SST data is derived using an identical algorithm for day and night data and a long time series is available (~10 years). However, this is composed of data obtained by different satellite sensors at different times of the day. Figure 15 shows typical diurnal warming events in the Mediterranean Sea during summer 1997 revealing large areas of warm SST around the western Italian coast and off the western coast of Yugoslavia. Diurnal variations of > 3ºC are clearly visible.
~10,000km2~10,000km2
Figure 15. Diurnal warming in the Mediterranean Sea in 1997 (A. Stuart-Menteth).
Staurt-Menteth noted that monthly mean data are biased towards the mid latitude regions due to the dominance of clouds at other latitudes. Hoverer, when such

EUR-2nd-GHRSST-PP-workshop-report-v3.0.doc Page 24 of 88 Friday, October 11, 2002
Proceedings of the 2nd GHRSST-PP workshop
global monthly average data sets are considered, strong seasonal diurnal SST patterns are evident (see Figure 16).
Figure 16. Monthly mean seasonal distribution of diurnal signal in Pathfinder 18km data. (A. Stuart-Menteth)
However, Pathfinder monthly mean data sets are inconsistent in both space and time due to diurnal signal and orbit drift of the NOAA platforms throughout the mission lifetime. This is presented in Figure 17 where the drift in local overpass time as a function of date of the AVHRR aboard different NOAA satellites.
Local Afternoon Overpass Times of the AVHRR Satellite Series
1987
1988 1993
1994
12:00
13:12
14:24
15:36
16:48
18:00
1986 1988 1990 1992 1994 1996 1998
Year
Aft
erno
on o
verp
ass t
ime
NOAA - 9 NOAA - 11 NOAA - 14
Figure 17 Local afternoon overpass times of the AVHRR satellite series used to construct the Pathfinder
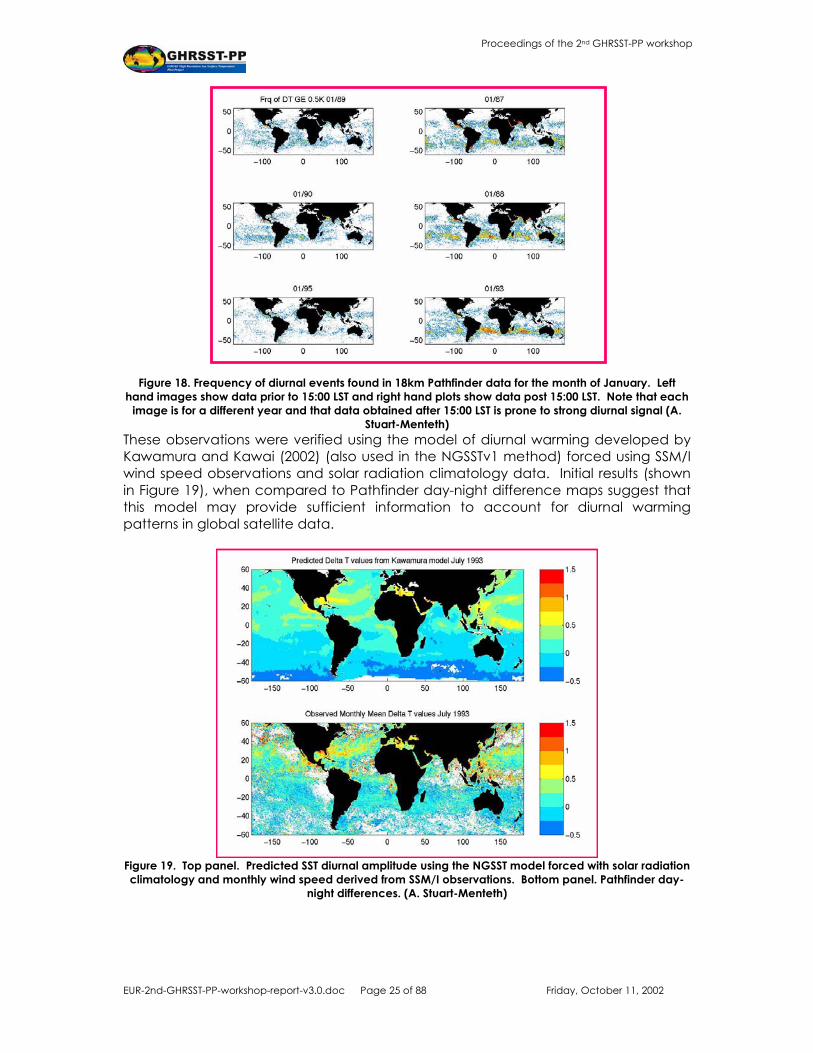
SST data set. (A. Stuart-Menteth) Variations also clearly seen in inter-annual SST maps and are shown to vary according to the local overpass time of the satellite; if local satellite overpass times are greater than 15:00 LST, strong diurnal signals are found in the data (see figure 18).
EUR-2nd-GHRSST-PP-workshop-report-v3.0.doc Page 25 of 88 Friday, October 11, 2002
Proceedings of the 2nd GHRSST-PP workshop
Figure 18. Frequency of diurnal events found in 18km Pathfinder data for the month of January. Left hand images show data prior to 15:00 LST and right hand plots show data post 15:00 LST. Note that each
image is for a different year and that data obtained after 15:00 LST is prone to strong diurnal signal (A. Stuart-Menteth)
These observations were verified using the model of diurnal warming developed by Kawamura and Kawai (2002) (also used in the NGSSTv1 method) forced using SSM/I wind speed observations and solar radiation climatology data. Initial results (shown in Figure 19), when compared to Pathfinder day-night difference maps suggest that this model may provide sufficient information to account for diurnal warming patterns in global satellite data.
Figure 19. Top panel. Predicted SST diurnal amplitude using the NGSST model forced with solar radiation climatology and monthly wind speed derived from SSM/I observations. Bottom panel. Pathfinder day-
night differences. (A. Stuart-Menteth)

EUR-2nd-GHRSST-PP-workshop-report-v3.0.doc Page 26 of 88 Friday, October 11, 2002
Proceedings of the 2nd GHRSST-PP workshop
Stuart-Menteth concluded that there is a clear sampling bias according to the time of day in Pathfinder satellite SST data derived from the AVHRR but it is unclear how to normalize this effect. Clearly, both the phase and the amplitude of the diurnal signal carry important information required by any merging and analysis scheme. More importantly, it was unclear if diurnal warming signals are an “error” to correct or a phenomenon to detect. There was considerable discussion following this presentation that agreed the diurnal signal was indeed a phenomenon to detect and that any method used to normalize its effect should preserve sufficient information in order that a user can reliably and accurately reconstruct the original SST data. One solution was to use a diurnal mask data product that carries phase and amplitude at each pixel location and it was agreed that this should be added to the GHRSST-PP data product specifications.
3.2 Session I Conclusions 1. The NGSST-v1.0 algorithm and basic methodology should form the basis for
SSTdepth products within GHRSST-PP. However, the definition of 1m may be problematic given that diurnal signals are still present at this depth. The use of a “nocturnal constant temperature” was briefly mentioned (and subsequently discussed outside of the Tokyo meeting) and, in principal, this should be used to produce GHRSST-PP depth data products. Modifications to the NGSST approach will be necessary in order to accommodate this change.
2. With the successful launch of EOS-aqua and switch on of AMSR-E, the GHRSST-PP should take maximum advantage of MW SST data sets for (a) cloud clearing, (b) daily “climatology” for error statistics, (c) as a possible surrogate for in situ observations where appropriate, (d) to provide SSTsub-skin data products.
3. The use of contemporaneous SST and wind speed data (e.g., MW sensors such as TMI, AMSR) should be further investigated to establish under what conditions SST data are dominated by high (wind induced) surface roughness (8m/s? 10 m/s? wind speeds).
4. Conversions between SSTskin and SSTsub-skin/depth can be made using empirical relationships based on wind speed thresholds. However, at low wind speeds the technique is not appropriate due to the possibility of a strong diurnal warming during the day or strong nocturnal cooling during the night.
5. The GHRSST-PP Diagnostic data set should be implemented and populated as soon as possible to facilitate the inter-comparison of separate SST and related data sets. This is particularly important for gaining a thorough understanding of different data sets, when using wind speed and solar radiation data to investigate diurnal variability, the computation of error statistics and confidence data and for investigating new cloud clearing techniques.
6. The error categorization scheme proposed by P. LeBorgne could form the foundation for a wider error statistic that can be provided with each GHRSST-PP data set. Further discussion with D. May (FNOMC) is required to ascertain the optimum methodology.
7. Diurnal signals are clearly evident in satellite SST data sets and are currently not considered appropriately. While GHRSST-PP has only minimal interest in dedicated diurnal SST data products (only from the modeling community), it is clearly necessary to account for diurnal temperature signals in each individual

EUR-2nd-GHRSST-PP-workshop-report-v3.0.doc Page 27 of 88 Friday, October 11, 2002
Proceedings of the 2nd GHRSST-PP workshop
data stream before any analysis procedure collectively is used to develop new data products.
8. While there is no current user demand for a diurnal SST product, in order for the GHRSST-PP to properly merge and analyze SST data obtained at different times of the day, a diurnal signal adjustment/normalization scheme is required in order that consistent data products are derived.
9. It was concluded that a diurnal mask product should accompany GHRSST-PP analyzed data products that will carry location, phase and amplitude information. Users can then choose to make use of this additional data as confidence information or ignore it as they require.
EUR-2nd-GHRSST-PP-workshop-report-v3.0.doc Page 28 of 88 Friday, October 11, 2002
Proceedings of the 2nd GHRSST-PP workshop
4 Session 2. Access to SST data streams Session 2 was split into two sections that focused on satellite and in situ data streams respectively. The aim of the session was to discuss which satellite and in situ data are realistically available to the GHRSST-PP and to determine if these were sufficient to execute the project successfully. An important question for the workshop was to determine how data should be accessed within the distributed dynamic dataset (DDD) concept. Presentations were chosen to provide the workshop with the experiences of satellite data sets such as the AVHRR Pathfinder. In terms of in situ observations, the need for in situ radiometer deployments and how the limited resources available can be best used to address the GHRSST-PP need for validation data was discussed in part II.
4.1 Session 2, Part I: Access to satellite data streams. 4.1.1 Ian Robinson (SOC, UK): "Is there a need for a GHRSST-PP dynamic distributed
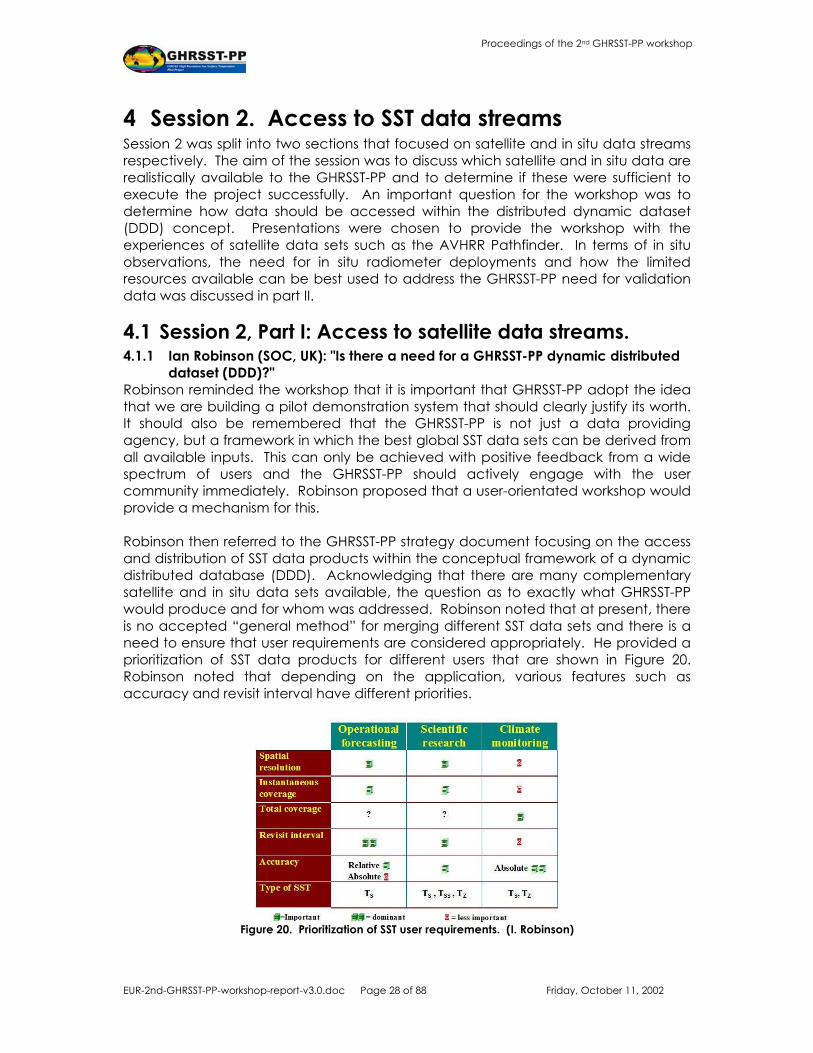
dataset (DDD)?" Robinson reminded the workshop that it is important that GHRSST-PP adopt the idea that we are building a pilot demonstration system that should clearly justify its worth. It should also be remembered that the GHRSST-PP is not just a data providing agency, but a framework in which the best global SST data sets can be derived from all available inputs. This can only be achieved with positive feedback from a wide spectrum of users and the GHRSST-PP should actively engage with the user community immediately. Robinson proposed that a user-orientated workshop would provide a mechanism for this. Robinson then referred to the GHRSST-PP strategy document focusing on the access and distribution of SST data products within the conceptual framework of a dynamic distributed database (DDD). Acknowledging that there are many complementary satellite and in situ data sets available, the question as to exactly what GHRSST-PP would produce and for whom was addressed. Robinson noted that at present, there is no accepted “general method” for merging different SST data sets and there is a need to ensure that user requirements are considered appropriately. He provided a prioritization of SST data products for different users that are shown in Figure 20. Robinson noted that depending on the application, various features such as accuracy and revisit interval have different priorities.
Figure 20. Prioritization of SST user requirements. (I. Robinson)

EUR-2nd-GHRSST-PP-workshop-report-v3.0.doc Page 29 of 88 Friday, October 11, 2002
Proceedings of the 2nd GHRSST-PP workshop
On possible solution is to allow users to select from a list of possible methods and data sets, the most appropriate merging algorithms, data and quality constraints. Different combinations would result in a data product tuned to specific user requirements (e.g., most accurate data at the cost of incomplete fields, data with minimum diurnal warming). Such a system provides considerable flexibility, which is an important issue because the GHRSST-PP should be able to respond to new and emerging data sets but implemented in a way that will facilitate the transition to a long-term operation. Robinson concluded that the DDD is a valid approach especially if it could evolve into a user driven/operational data system with detailed data requirements and specific rules to operate on data to automatically produce new data products for users. Figure 21 provides a schematic overview of the GHRSST-PP DDD concept.
Figure 21. Schematic overview of the Dynamic Distributed Database concept. (I. Robinson)
The limitations of SST sampling capability from different platforms was discussed and Robinson highlighted the considerable benefits of merging microwave and infrared SST to overcome the worst problems of cloud cover affecting current operational satellite data sets. However, there was at present no consensus on how to actually merge the complementary data streams. Using the tools envisaged in the GHRSST-PP (DDS, UIS, DDS, ISDI, R&D), new consensus methods for such problems will emerge. However, this needs to be balanced against the reliability and availability of output data sets that are the key issues for operational agencies. Robinson noted that the ISDI-TAG would provide valuable guidance on these issues. Practically, within the framework of the DDD, well-defined and reliable input and output mechanisms need to be specified so that operational satellite and in situ data sets can be exchanged. For example, it is currently unclear how AATSR, AMSR, MSG or MODIS data will be delivered in NRT to the GHRSST-PP. Robinson concluded, that the installation of dedicated data server nodes may be required so that data exchange between different actors within the GHRSST-PP is effective in terms of cost and time. These are priority areas for the GHRSST-PP Science Team and dialog with the relevant agencies should be initiated immediately.

EUR-2nd-GHRSST-PP-workshop-report-v3.0.doc Page 30 of 88 Friday, October 11, 2002
Proceedings of the 2nd GHRSST-PP workshop
4.1.2 Misako Kachi and Hiroshi Murakami (NASDA, Japan): “Implementation Plan for the ADEOS-II/Aqua SST generation”
Kachi gave a detailed overview of the ADEOS-II/Aqua platform focusing on SST data products from the AMSR and AMSR-E microwave radiometers. Both daytime and nighttime data sets will be available allowing investigations of diurnal variability to be undertaken using global, cloud free coverage (1600 km swath) on a daily basis. The current data processing model will use L1b 10x10 km brightness temperature data to derive L2 SST products at the same resolution. L2 SST and L2 SST projected map products (on request) will be available together with Sea Surface Wind Speeds, Integrated Water Vapor, Precipitation, Integrated Cloud Liquid Water, Sea Ice Concentration, Snow Water Equivalent and Soil Moisture data products. Similar L3 data products (daily and monthly) will be available at a resolution of 0.25 x 0.25 degree in equatorial latitude longitude and polar stereographic projections. Both an operational SST product (Shibata, JMA) and a research SST product (Wentz, REMSS) will be generated. Kachi then reviewed the processing schedule for the AMSR-E shown in Figure 22. L2 near real time SST products should be available within 230 minutes of data reception and L2/3 within 430-1160 minutes after reception. However, NASDA EOC and REMSS should be able to deliver products on a much faster timeframe. Sample products should be available at Launch+2 months and regular products at Launch+6 months. Operational products are foreseen at Launch+12 months (May/June 2003). However for GHRSST-PP a special arrangement is under discussion for a dedicated data feed to selected data centers within the GHRSST-PP framework (see Hiroshi Kawamura’s talk later).
Figure 22. AMSR-E data processing schedule. (M. Kachi)
4.1.3 Gary Wick (U. Colorado, USA): “Skin SST from NPOESS Visible and Infrared
Imager Radiometer Suite (VIIRS)” Wick presented the recent work of Bill Emery (University of Colorado) that was looking beyond the GHRSST-PP timeframe as the VIIRS sensor is expected on line in 2006-2007. However, Wick noted that the presentation was important, stressing that (a) the GHRSST-PP should have a vision for the long-term future and (b) results from preliminary VIIRS studies may be applicable to the GHRSST-PP.

EUR-2nd-GHRSST-PP-workshop-report-v3.0.doc Page 31 of 88 Friday, October 11, 2002
Proceedings of the 2nd GHRSST-PP workshop
Emery et al. have been working with Ratheyon, who are building the VIIRS sensor, investigating radiative transfer simulations in order to better understand the new possibilities for atmospheric corrections using additional VIIRS channels - especially the 4µm and 8.5µm channels. The study was based on repeated runs of the MODTRAN 3.7 radiative transfer model together with over 300 atmospheric profiles derived from radiosonde measurements. VIIRS is designed to retrieve SSTskin but also a SSTdepth product (still in discussion) will probably be specified. A basic dual split window approach is adopted but an additional air mass classification based on warm/cold air temperature thresholds is used to select an appropriate algorithm. An 11µm threshold of 282 K is adopted together with a threshold based on total pricipitable water to define either moist or dry atmosphere SST algorithm coefficients. This approach has been chosen because different VIIRS channels will be used in separate regression relationships depending on the atmospheric characteristics. It is expected that air mass characterization may help improve SSTs by automatic regional algorithms.
Figure 23. Difference between true SSTskin and VIIRS modeled SSTskin (K) during daytime (green line)
and nighttime (black line) as a function of model run. (W. Emery) In particular, the use of the 4µm channel information looks extremely promising. Considering VIIRS (modeled) SSTskin minus true SSTskin for ~300 model runs (shown in Figure 23), an accuracy of 0.3 K is expected at night rising to 0.5 K during the day, both having a 0.35K uncertainty. Wick concluded that radiative transfer simulations should be considered as a means to devise the most appropriate merging and analysis algorithms within the GHRSST-PP. 4.1.4 Kenneth Casey (NOAA, USA) "Toward the development of a global 4km
AVHRR SST dataset". Casey presented the current plans at NOAA to reprocess, in near real time if possible, existing 9km resolution AVHRR Pathfinder data set to 4km resolution. This new product grid would be identical to the MODIS 4km SST products and is important for studies and operations in the coastal zone (e.g., frontal positions, US CoastWatch).

EUR-2nd-GHRSST-PP-workshop-report-v3.0.doc Page 32 of 88 Friday, October 11, 2002
Proceedings of the 2nd GHRSST-PP workshop
Casey noted that an increased spatial resolution a user driven request, especially for monitoring of coral reefs where 9km data sets are too coarse. Casey gave a brief review of the current Pathfinder SST effort that started in 1990 noting fact that the Pathfinder SST algorithms developed by RSMAS at the University of Miami use all available SST retrievals, unlike other MCSST data sets. The process is time consuming and data are available only after a considerable delay (~10 months) from data acquisition by the spacecraft. Of particular interest is the development of a new satellite and in situ “match up” database that has been used to define 8 quality levels for Pathfinder data. Casey noted that GHRSST-PP data should be designed to be consistent over time and in this respect, should be consistent with retrospective Pathfinder data sets. Considerable knowledge has been gained within the existing Pathfinder SST program and the lessons leaned from this effort will be incorporated into the new data set. Pathfinder SST data has been consistently validated using in situ buoy and MAERI spectroradiometer data sets. Matchups demonstrate a small bias although there are several areas for improvement that help justify a reprocessing effort. There is an aerosol bias in Pathfinder data that is addressed by reference to the Reynolds climatological SST weekly average SST data sets (2K differences are flagged as contaminated). Several land mask errors (associated with the use of an old land mask derived for navigational hazards) and geolocation problems could also be addressed. Improvements to the current cloud filtering techniques should be developed, keeping the end use of the data in mind. The current cloud filtering techniques (Figure 24a - JPL "best SST" with only quality level 4 or higher passing as cloud free) tend to be too strict in high gradient frontal regions, but too lenient around cloud edges. An erosion filter (FIgure 24b) can be effective in reducing residual cloud contamination around these cloud edges which would be useful in climatological studies which require strict cloud flagging. However, to identify frontal zones or other SST structures where absolute accuracy is not essential, less lenient approaches may need to be adopted. For example, a lower quality threshold could be selected, allowing more pixels to pass as "cloud-free (a) (b) Figure 24. Effect of the proposed SST erosion cloud filter. (a) Basic cloud clearing algorithm applied to Pathfinder data (b) eroded cloud mask highlighting the conservative nature of the approach (K. Casey)
EUR-2nd-GHRSST-PP-workshop-report-v3.0.doc Page 33 of 88 Friday, October 11, 2002
Proceedings of the 2nd GHRSST-PP workshop
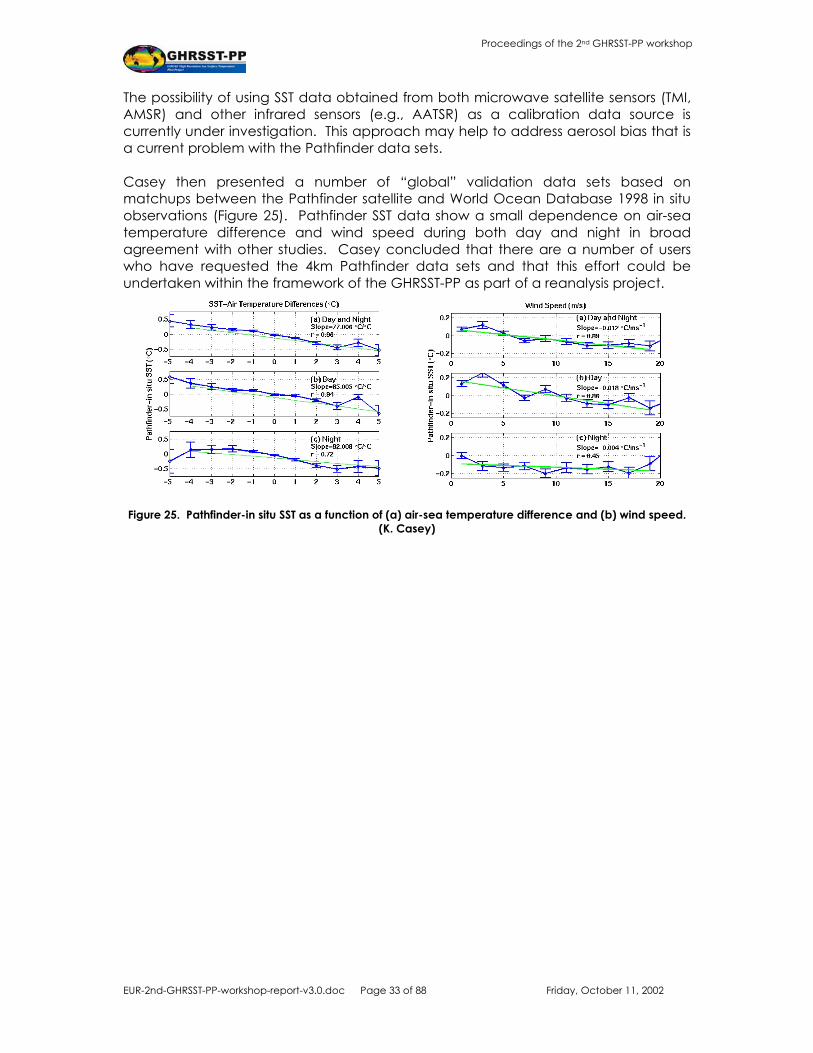
The possibility of using SST data obtained from both microwave satellite sensors (TMI, AMSR) and other infrared sensors (e.g., AATSR) as a calibration data source is currently under investigation. This approach may help to address aerosol bias that is a current problem with the Pathfinder data sets. Casey then presented a number of “global” validation data sets based on matchups between the Pathfinder satellite and World Ocean Database 1998 in situ observations (Figure 25). Pathfinder SST data show a small dependence on air-sea temperature difference and wind speed during both day and night in broad agreement with other studies. Casey concluded that there are a number of users who have requested the 4km Pathfinder data sets and that this effort could be undertaken within the framework of the GHRSST-PP as part of a reanalysis project.
Figure 25. Pathfinder-in situ SST as a function of (a) air-sea temperature difference and (b) wind speed.
(K. Casey)

EUR-2nd-GHRSST-PP-workshop-report-v3.0.doc Page 34 of 88 Friday, October 11, 2002
Proceedings of the 2nd GHRSST-PP workshop
4.2 Session 2 Part II: Access to in situ data streams 4.2.1 Satoshi Sato (Japan Oceanographic Data Center): “International
oceanographic data exchange (IODE) underway sea surface salinity data pilot project activities”
Sato described the International oceanographic data exchange (IODE) underway sea surface salinity data pilot project activities which include data from 62 National Oceanographic Data Centers (NODC). The project feeds the world data center with physical, chemical and biological oceanographic data for each country. A primary purpose of IODE is a long-term archive of global oceanographic data preventing data loss. Currently, the Global ocean data archaeology and rescue (GODAR) project is trying to restore “lost” data archives that are held in paper format (e.g., the western Pacific area through WESTPAC that has much oceanographic data held as paper hard copy only) by reformatting and entry into computer data base systems. This is a continuing effort that began in 1993 and recently digitized data are regularly published as CDROM and via the Internet. Sato continued, noting that Salinity is critical for climate study and the IODE Sea surface salinity pilot project (SSAL-PP) which is a real time data service that aims to integrate various underway salinity and related observations together with dispersed salinity archives and products. The main objectives of the SSAL PP are to
• Improve data access systems • Provide a comprehensive archive of all data and instruments at any time • Standardize and refine quality control procedures • Provide data and information to users in a timely way • Real time and delayed mode data services • Develop global salinity products having a temporal resolution of 10 days and
200km grid squares with salinity to 1psu. There are currently three working groups focused on data collection, transfer processing and data archive and data product specification and generation. http://www.ifremer.fr/sismer/program/gsdc provides more information on the project. Sato concluded that the GHRSST-PP should make use of these data for validation and other studies requiring real time in situ SST measurements. Furthermore, GHRSST-PP could also provide an input into the system and further discussions could establish the best collaboration. 4.2.2 Craig Donlon (European Commission, Italy) “Operational validation of satellite
data using in situ radiometers” Donlon began by noting that the on-going validation of satellite data products is essential to provide proper confidence limits for derived SST data products. A validation strategy has to be cost effective, global in extent to provide adequate coverage of characteristic atmosphere and ocean conditions, and sustained over time. Validation data consists of contemporaneous satellite and in situ observations that are used to examine fundamental issues such as
• The accuracy of the SST algorithm used • The physical processes characterizing the satellite (SST) measurement
EUR-2nd-GHRSST-PP-workshop-report-v3.0.doc Page 35 of 88 Friday, October 11, 2002
Proceedings of the 2nd GHRSST-PP workshop
• The long term performance of the satellite instrument • Any time-space inconsistencies within a satellite-in situ database used to
perform the validation exercise • The stability of SST products with time.
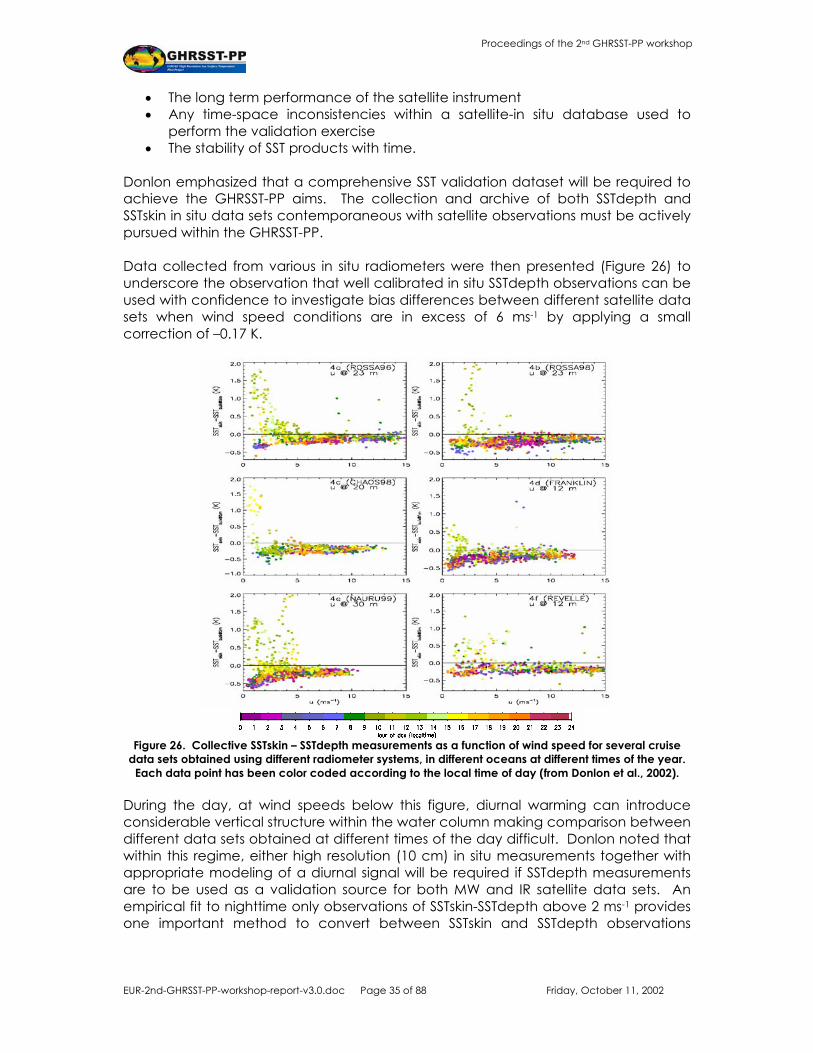
Donlon emphasized that a comprehensive SST validation dataset will be required to achieve the GHRSST-PP aims. The collection and archive of both SSTdepth and SSTskin in situ data sets contemporaneous with satellite observations must be actively pursued within the GHRSST-PP. Data collected from various in situ radiometers were then presented (Figure 26) to underscore the observation that well calibrated in situ SSTdepth observations can be used with confidence to investigate bias differences between different satellite data sets when wind speed conditions are in excess of 6 ms-1 by applying a small correction of –0.17 K.
Figure 26. Collective SSTskin – SSTdepth measurements as a function of wind speed for several cruise
data sets obtained using different radiometer systems, in different oceans at different times of the year. Each data point has been color coded according to the local time of day (from Donlon et al., 2002).
During the day, at wind speeds below this figure, diurnal warming can introduce considerable vertical structure within the water column making comparison between different data sets obtained at different times of the day difficult. Donlon noted that within this regime, either high resolution (10 cm) in situ measurements together with appropriate modeling of a diurnal signal will be required if SSTdepth measurements are to be used as a validation source for both MW and IR satellite data sets. An empirical fit to nighttime only observations of SSTskin-SSTdepth above 2 ms-1 provides one important method to convert between SSTskin and SSTdepth observations

EUR-2nd-GHRSST-PP-workshop-report-v3.0.doc Page 36 of 88 Friday, October 11, 2002
Proceedings of the 2nd GHRSST-PP workshop
(recently corroborated by Horrocks et al) as shown in Figure 27. Nevertheless, the use of in situ radiometers to measure SSTskin contemporaneously with satellite observations is mandatory during the daytime when wind speeds are less than 6 ms-1 and during the nighttime when wind speeds are less than 2 ms-1.
Figure 27. Empirical fit to night-time only data shown in Figure 15. Clearly seen is the different shape of the relationship between SSTskin – SSTdepth and wind speed below 2 ms-1 where convection dominates
heat exchange between the atmosphere and ocean (From Donlon et al., 2002). Donlon then went on to describe the Infrared Autonomous SST radiometer (ISAR) system that has been developed for operational deployments of up to 3 months aboard ships of opportunity. The ISAR is an infrared radiometer designed specifically for the operational in situ validation of the ENVISAT AATSR and other infrared satellite radiometer systems. Figure 28 shows the ISAR instrument installed aboard the M/V Pride of Bilbao operating in the English Channel and Bay of Biscay area.
(A)
(B)
Figure 28. (A) Photograph of ISAR-001 mounted on the Pride of Bilbao using the mounting bracket specifically designed for the ship showing the clear view of the sea surface. Note that the ISAR shutter is in the closed position. (B) SOC technicians during the installation of ISAR-001 aboard the Pride of Bilbao.
Note the compact size of the ISAR instrument. (Photos E. Mason) The ISAR provides a single channel SSTskin measurement in the 9.6-11.5µm waveband and can provide SSTskin data accurate to ±0.1 K rms and is calibrated using two
EUR-2nd-GHRSST-PP-workshop-report-v3.0.doc Page 37 of 88 Friday, October 11, 2002
Proceedings of the 2nd GHRSST-PP workshop
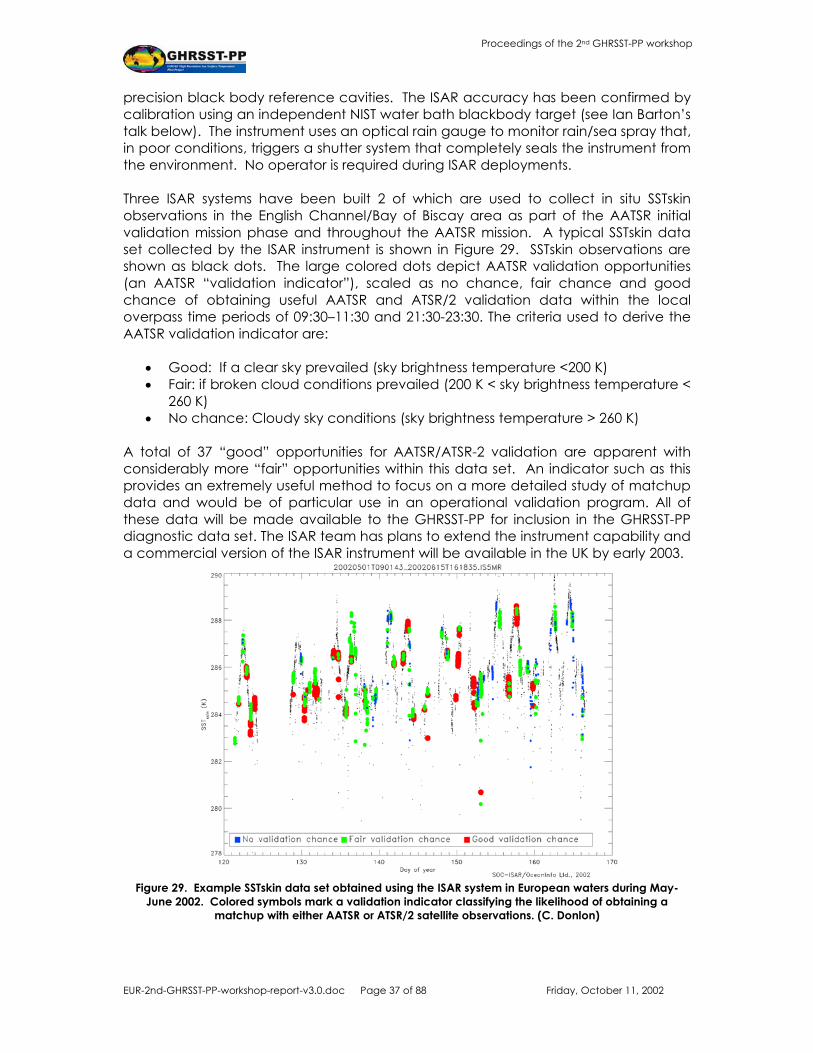
precision black body reference cavities. The ISAR accuracy has been confirmed by calibration using an independent NIST water bath blackbody target (see Ian Barton’s talk below). The instrument uses an optical rain gauge to monitor rain/sea spray that, in poor conditions, triggers a shutter system that completely seals the instrument from the environment. No operator is required during ISAR deployments. Three ISAR systems have been built 2 of which are used to collect in situ SSTskin observations in the English Channel/Bay of Biscay area as part of the AATSR initial validation mission phase and throughout the AATSR mission. A typical SSTskin data set collected by the ISAR instrument is shown in Figure 29. SSTskin observations are shown as black dots. The large colored dots depict AATSR validation opportunities (an AATSR “validation indicator”), scaled as no chance, fair chance and good chance of obtaining useful AATSR and ATSR/2 validation data within the local overpass time periods of 09:30–11:30 and 21:30-23:30. The criteria used to derive the AATSR validation indicator are:
• Good: If a clear sky prevailed (sky brightness temperature <200 K) • Fair: if broken cloud conditions prevailed (200 K < sky brightness temperature <
260 K) • No chance: Cloudy sky conditions (sky brightness temperature > 260 K)
A total of 37 “good” opportunities for AATSR/ATSR-2 validation are apparent with considerably more “fair” opportunities within this data set. An indicator such as this provides an extremely useful method to focus on a more detailed study of matchup data and would be of particular use in an operational validation program. All of these data will be made available to the GHRSST-PP for inclusion in the GHRSST-PP diagnostic data set. The ISAR team has plans to extend the instrument capability and a commercial version of the ISAR instrument will be available in the UK by early 2003.
Figure 29. Example SSTskin data set obtained using the ISAR system in European waters during May-
June 2002. Colored symbols mark a validation indicator classifying the likelihood of obtaining a matchup with either AATSR or ATSR/2 satellite observations. (C. Donlon)
EUR-2nd-GHRSST-PP-workshop-report-v3.0.doc Page 38 of 88 Friday, October 11, 2002
Proceedings of the 2nd GHRSST-PP workshop
Donlon concluded that there is a need for both in situ radiometers and conventional SSTdepth observations that are complementary to each other. Radiometer deployments should where possible be targeted for deployment in low wind speed areas where diurnal warming is expected to have a major influence. In the case of buoy observations, these should be used with care at lower wind speeds. In both cases, adequate calibration data should be available to ensure the quality and accuracy of the in situ observations. 4.2.3 Ian Barton (CSIRO, Australia) “The Miami2 in situ radiometer inter-calibration
exercise and beyond “ Barton began with a number of slides showing radiometer measurements obtained using the DAR-011 instrument during a “classic” diurnal warming cycle. Barton noted that in this example, light winds prevailed throughout the day and a clear bell curve diurnal signal is observed. As a second example, following an initial period of light winds and strong solar radiation, a diurnal thermocline begins to form in the upper water column. However, following a short (~1/2 hour) wind burst, all of the diurnal vertical structure was destroyed in a matter of minutes. In this case, the expected bell curve shape of a diurnal warming event is not observed. As low wind speeds were reinstated, once again a diurnal layer began to form. Barton emphasized that the use of satellite derived wind speeds derived from instantaneous measurements at a specific overpass time will not be able to represent the conditions observed in the second scenario outlined above. He also noted that (for the same reasons), satellite derived wind speeds may not be appropriate when forcing diurnal stratification models. Barton then explained that in situ radiometer data together with other ocean-atmosphere measurements were fundamental to further our understanding of the fine thermal structure of the sea surface – especially in the context of blending traditional SSTdepth observations with satellite MW and IR SST observations. The importance of in situ IR radiometers for process studies and validation of satellite data products within the GHRSST-PP had already been made clear during the previous presentation. However, a major concern was the appropriate calibration of the many varied in situ radiometer systems currently used for satellite validation studies, especially those that are expected to endure long autonomous deployments (e.g., ISAR as described by Craig Donlon). Furthermore, many groups are using their own reference black body calibration systems to maintain their own instrument calibration that may not provide an appropriate reference radiance source (ideally, a single reference radiance source should be used within the community). In response, several experiments over the past 5 years have focused on the inter-calibration of in situ radiometers and calibration black body cavities to ensure their consistency and traceability. The most recent of these was held at the RSMAS, University of Miami drawing 15 international participants, 7 radiometer systems and 4 black body calibration cavities. The workshop comprised of the following components:
• Laboratory calibration of radiometers against NIST standards • Characterization of calibration black-body targets using new NIST TXR • At-sea inter-comparison of infrared radiometers used for SST validation
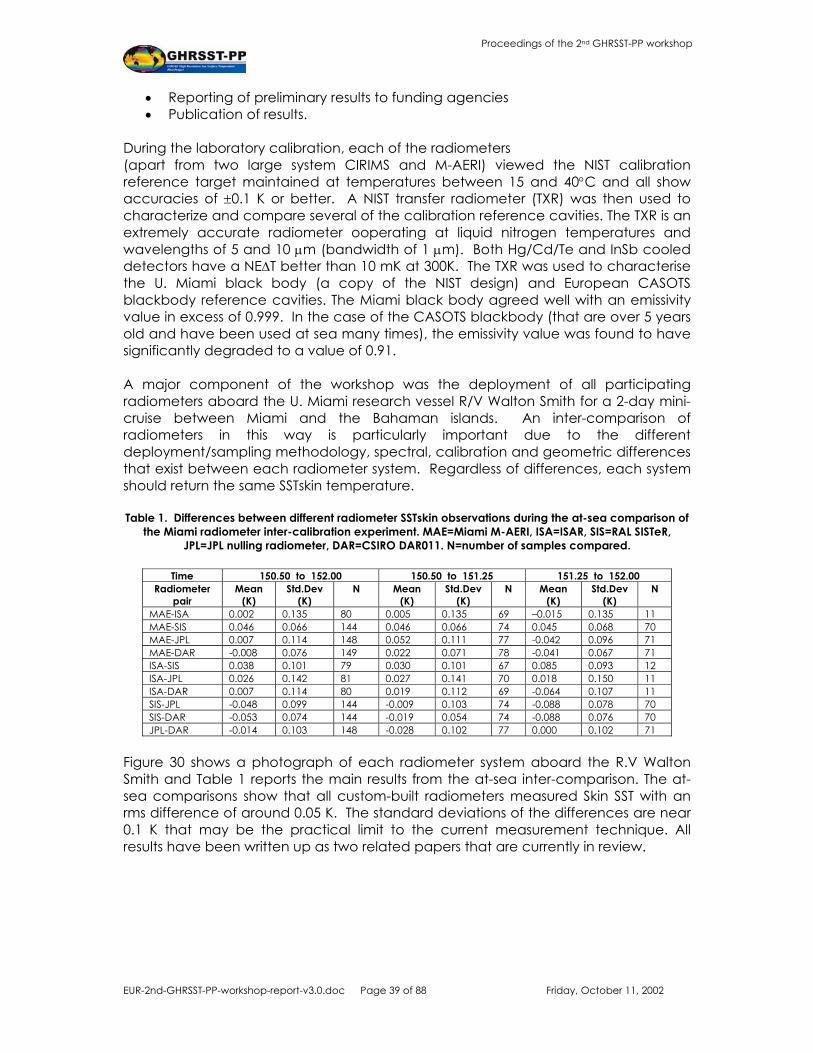
EUR-2nd-GHRSST-PP-workshop-report-v3.0.doc Page 39 of 88 Friday, October 11, 2002
Proceedings of the 2nd GHRSST-PP workshop
• Reporting of preliminary results to funding agencies • Publication of results.
During the laboratory calibration, each of the radiometers (apart from two large system CIRIMS and M-AERI) viewed the NIST calibration reference target maintained at temperatures between 15 and 40°C and all show accuracies of ±0.1 K or better. A NIST transfer radiometer (TXR) was then used to characterize and compare several of the calibration reference cavities. The TXR is an extremely accurate radiometer ooperating at liquid nitrogen temperatures and wavelengths of 5 and 10 µm (bandwidth of 1 µm). Both Hg/Cd/Te and InSb cooled detectors have a NE∆T better than 10 mK at 300K. The TXR was used to characterise the U. Miami black body (a copy of the NIST design) and European CASOTS blackbody reference cavities. The Miami black body agreed well with an emissivity value in excess of 0.999. In the case of the CASOTS blackbody (that are over 5 years old and have been used at sea many times), the emissivity value was found to have significantly degraded to a value of 0.91. A major component of the workshop was the deployment of all participating radiometers aboard the U. Miami research vessel R/V Walton Smith for a 2-day mini-cruise between Miami and the Bahaman islands. An inter-comparison of radiometers in this way is particularly important due to the different deployment/sampling methodology, spectral, calibration and geometric differences that exist between each radiometer system. Regardless of differences, each system should return the same SSTskin temperature. Table 1. Differences between different radiometer SSTskin observations during the at-sea comparison of
the Miami radiometer inter-calibration experiment. MAE=Miami M-AERI, ISA=ISAR, SIS=RAL SISTeR, JPL=JPL nulling radiometer, DAR=CSIRO DAR011. N=number of samples compared.
Time 150.50 to 152.00 150.50 to 151.25 151.25 to 152.00
Radiometer pair
Mean (K)
Std.Dev (K)
N Mean (K)
Std.Dev (K)
N Mean (K)
Std.Dev (K)
N
MAE-ISA 0.002 0.135 80 0.005 0.135 69 –0.015 0.135 11 MAE-SIS 0.046 0.066 144 0.046 0.066 74 0.045 0.068 70 MAE-JPL 0.007 0.114 148 0.052 0.111 77 -0.042 0.096 71 MAE-DAR -0.008 0.076 149 0.022 0.071 78 -0.041 0.067 71 ISA-SIS 0.038 0.101 79 0.030 0.101 67 0.085 0.093 12 ISA-JPL 0.026 0.142 81 0.027 0.141 70 0.018 0.150 11 ISA-DAR 0.007 0.114 80 0.019 0.112 69 -0.064 0.107 11 SIS-JPL -0.048 0.099 144 -0.009 0.103 74 -0.088 0.078 70 SIS-DAR -0.053 0.074 144 -0.019 0.054 74 -0.088 0.076 70 JPL-DAR -0.014 0.103 148 -0.028 0.102 77 0.000 0.102 71
Figure 30 shows a photograph of each radiometer system aboard the R.V Walton Smith and Table 1 reports the main results from the at-sea inter-comparison. The at-sea comparisons show that all custom-built radiometers measured Skin SST with an rms difference of around 0.05 K. The standard deviations of the differences are near 0.1 K that may be the practical limit to the current measurement technique. All results have been written up as two related papers that are currently in review.

EUR-2nd-GHRSST-PP-workshop-report-v3.0.doc Page 40 of 88 Friday, October 11, 2002
Proceedings of the 2nd GHRSST-PP workshop
Figure 17. Photograph showing radiometers deployed aboard the R/V Walton Smith during the 2nd
Miami radiometer inter-calibration exercise. From left to right: SISTeR, ISAR, CIRIMS, M-ARI, DAR-011, Tasco hand held. (M. Reynolds)
Barton concluded that the GHRSST-PP should identify the regular inter-calibration of in situ radiometer systems as a priority task on a 3 year basis or when sufficient new radiometer systems emerge. This will ensure consistency between in situ SSTskin data providers.
4.3 Session 2 Conclusions 1. Within the framework of the DDD, well-defined and reliable input and output
mechanisms need to be specified so that operational satellite and in situ data sets can be exchanged. For example, it is currently unclear how AATSR, AMSR, MSG or MODIS data will be delivered in NRT to the GHRSST-PP. The installation of dedicated data server nodes may be required so that data exchange between different actors within the GHRSST-PP is effective in terms of cost and time. These are priority areas for the GHRSST-PP ST and dialog with the relevant agencies should be initiated immediately.
2. There is a need to agree and validate a suite of “rules” in order to convert SST observations from SSTdepth to SSTskin or SSTsub-skin. A GHRSST-PP sub group called the In situ and Satellite Data Integration Technical Advisory Group (ISDI-TAG) will determine these rules. In particular, the most appropriate method for determining SSTdepth during conditions of strong diurnal stratification is a priority.
3. A GHRSST-PP user workshop should be convened to establish better links between the GHRSST-PP and the user community. GHRSST-PP data products must be utilized by the user community and user feedback obtained if the project is to be viewed as a success.
4. The new AMSR and AMSR-E MW satellite data products will provide unprecedented measurements of SST and other ocean-atmosphere parameters. The GHRSST-PP should plan to make maximum use of these data. Negotiations with NASDA will continue in order that AMSR data can be effectively provided to the GHRSST-PP in a real time operational framework.

EUR-2nd-GHRSST-PP-workshop-report-v3.0.doc Page 41 of 88 Friday, October 11, 2002
Proceedings of the 2nd GHRSST-PP workshop
Both operational (Shibata) and research (Wentz) SST products derived from AMSR-E data should be used within the GHRSST-PP.
5. The GHRSST-PP should be aware of future sensor capability (e.g., VIIRS on NPOESS) and where possible, establish links to instrument and SST algorithm developers. New approaches to SST algorithms may be tested using existing data (e.g., use of characterization techniques to define classes of air mass type used to derive specific SST retrieval coefficients).
6. The GHRSST-PP should build on the experience of the Pathfinder SST project where appropriate and continue collaboration in order to ensure that new 4 km Pathfinder SST data products are compatible with GHRSST-PP data products. This is especially important in the context of developing a GHRSST-PP reanalysis data product and when building SST climatology data as new data sets will be comprised of both MW and IR satellite data.
7. The GHRSST-PP should establish working relationships with other groups and national oceanographic data centers providing real time quality controlled in situ observations. The IODE sea surface salinity pilot project serves as an example. Where possible, GHRSST-PP should make full use of these data and aim to support these groups by making appropriate in situ data held within the DDS system available in return.
8. The GHRSST-PP should scrutinize and build upon the quality control and data standardization procedures used by existing oceanographic data management and archive centers (IODE, PO.DAAC, Ifremer etc.) in order to harmonize procedures and data exchange.
9. The development and deployment of new in situ measurement systems (e.g., ship-based infrared and microwave radiometer systems, dedicated in situ SSTdepth sensors) should be encouraged and supported by the GHRSST-PP, particularly in an operational context operating aboard ships of opportunity. Where these systems are in operation, data exchange and collaboration agreements should be formed to ensure that data are used within the GHRSST-PP DDS system.
10. The limitations of satellite derived wind speed measurements (e.g., how well does a “snapshot” measurement represent the daily wind field) for the forcing of diurnal stratification models should be further investigated.
11. Any in situ measurement used within the GHRSST-PP should have minimum calibration traceability, especially buoy data and radiometer data. The current traceability of calibration for many in situ SSTdepth observations obtained from buoys and ships is inadequate (or more likely non-existent). In situ measurements that do not have verifiable calibration should be treated with caution and appropriately marked as “calibration limited”.
12. The GHRSST-PP should at all possible opportunities promote and support the development of protocols and standards to ensure that all in situ SST observations are linked to properly documented calibration histories. The 2nd Miami radiometer inter-calibration exercise is an example of what can be achieved for in situ radiometer systems and the GHRSST-PP should recommend that a follow on experiment is established during the GHRSST-PP implementation phase.
EUR-2nd-GHRSST-PP-workshop-report-v3.0.doc Page 42 of 88 Friday, October 11, 2002
Proceedings of the 2nd GHRSST-PP workshop
5 Session 3. The GHRSST-PP implementation plan This session was dedicated to further developing the GHRSST-PP implementation plan. The Chair had circulated a v0.2 draft document to all workshop participants that introduced and outlined a structure for the GHRSST-PP implementation plan. The presentations in this session (and in the previous sessions) were selected in order to provide an overview of existing activities that can be written into the GHRSST-PP implementation plan.
5.1 Session 3 Part I: A review, prioritize and formulate the GHRSST-PP Implementation plan
5.1.1 Craig Donlon (EC/JRC, Italy) “Overview of the initial GHRSST-PP
implementation plan” Crag Donlon gave a short review of the initial GHRSST-PP Implementation plan. Donlon noted that the GHRSST-PP Strategy and initial implementation plan provides the scientific justification for the GHRSST-PP but does not describe in detail how the GHRSST-PP project should be implemented. The purpose of the GHRSST-PP Implementation plan is to translate the scientific vision into a tangible and achievable work plan. Donlon suggested that the GHRSST-PP Implementation plan should be split into two parts as follows:
• A preparation phase (2002-mid2003) o Implementation of basic DDD o Implementation of basic DDS o Implementation of basic UIS o Population of DDD and DDS o Testing of data delivery & exchange o Version 1.0 ISDI tools and methods o Development of v1.0 GHRSST-PP SST algorithms o Basic GHRSST-PP algorithms (R&D)
• A demonstration phase (mid2003-mid2005)
o Refinement of GHRSST-PP services and structure o Production of SST products and algorithms (through ISDI) o Delivery of SST products (through DDD and UIS) o Validation of SST products (through DDS) o Evaluation of the GHRSST-PP
Donlon then introduced the concept of work packages (WP), used extensively for project planning and execution. These greatly facilitate the development and subsequent management of a work-plan allowing the GHRSST-PP to be broken down into several interlinked and dependent tasks. WP have clearly defined input and outputs reducing a large project to a set of interrelated tasks that can be assigned to individuals or agencies for implementation. Donlon noted that a criticism of the GHRSST-PP was that is was too large a project for implementation and a clear WP structure will help reduce such criticism.

EUR-2nd-GHRSST-PP-workshop-report-v3.0.doc Page 43 of 88 Friday, October 11, 2002
Proceedings of the 2nd GHRSST-PP workshop
Each GHRSST-PP work package will include the following:
• The task to be completed including input and output parameters (data, personnel, infrastructure etc.)
• How a task will implemented (Overview of methodology) • When the task will be implemented • Who will be responsible and who will execute the work • Where the task work actually be executed • When will the task starts and ends • What other tasks are dependent on the outputs of this task • How this task is linked and dependent on the completion of other tasks • How many staff hours will be required • What the estimated budget for the task is • A number of metrics to assess the execution and deliverables of the task
While this list may appear daunting, Donlon noted that using an appropriately designed format, most WP task descriptions could be completed on a single A4 page. Donlon reminded participants that an initial version (v0.2) of the GHRSST-PP Implementation plan had been circulated and a version 1.0 document should eventually form the main output of this workshop. He noted some key practical aspects of implementing the GHRSST-PP. The GHRSST-PP has made considerable progress since the first workshop. However, if it is to be successful, it needs a central office to formally coordinate the project and a Principal Scientist to oversee the execution of the project. WP leaders, willing and able to take up the challenge and responsibility for specific project components, are also required. WP teams need to be empowered with a clear remit. Funding for the GHRSST-PP was a critical issue, but we cannot expect funding to be raised without a complete and proper specification of the GHRSST-PP implementation. Thus, the Implementation plan is a critical step for the GHRSST-PP and its generation is a priority issue because without this, agencies and institutions have no way to visualize which project components they may agree to fund, implement or participate in. Donlon concluded that developing the GHRSST-PP through consensus opinion was the purpose of this workshop. 5.1.2 Andy Harris (NOAA/NESDIS, USA) “The role of the GHRSST-PP in NOAA/NESDIS”. Harris began stating that NESDIS has several in house projects that will contribute directly to the GHRSST-PP:
• 1 yr project on improving SSTs from GOES-12 • 1 yr demonstration for multi scale SST optimal interpolation • 3 yr project on aerosols and SSTs • 1 yr cloud clearing (CLAVR) optimization • Physical retrieval of SST from AVHRR
He then gave an in depth discussion of the merits associated with the use of radiative transfer (R/T) modeling to derive physically based SST retrieval algorithms. An important advantage of R/T over traditional empirical regression of satellite observations with in situ observations is that the R/T approach provides an algorithm
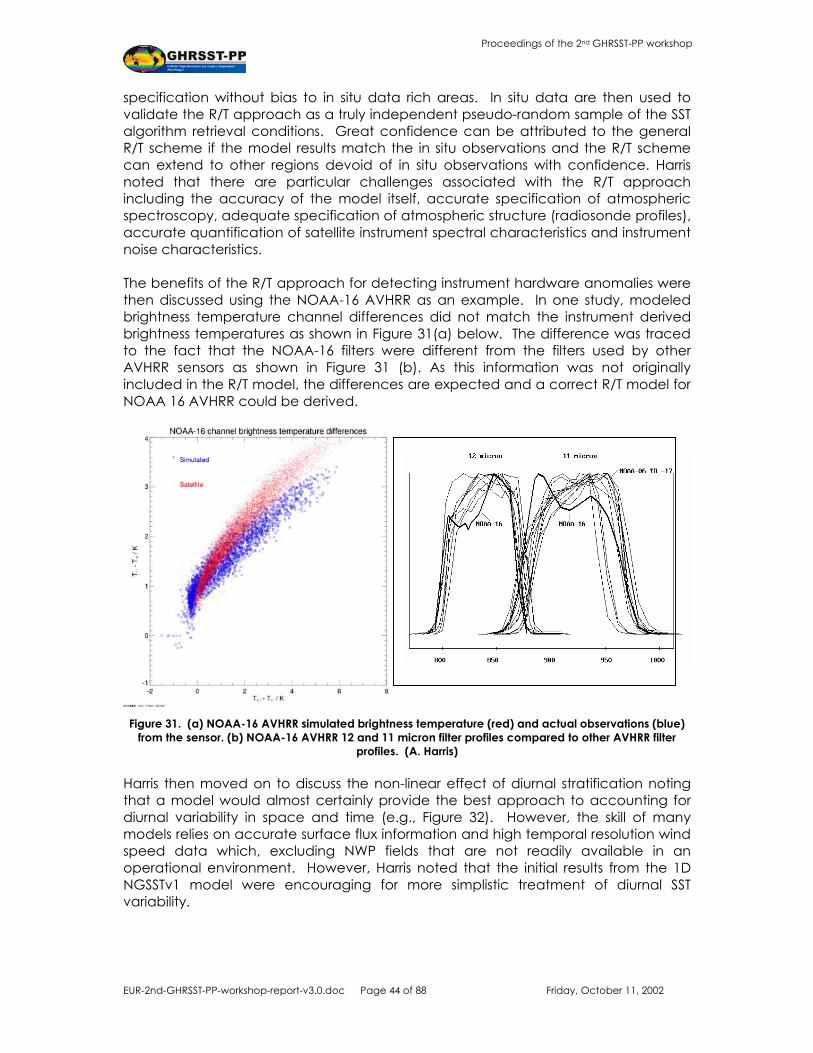
EUR-2nd-GHRSST-PP-workshop-report-v3.0.doc Page 44 of 88 Friday, October 11, 2002
Proceedings of the 2nd GHRSST-PP workshop
specification without bias to in situ data rich areas. In situ data are then used to validate the R/T approach as a truly independent pseudo-random sample of the SST algorithm retrieval conditions. Great confidence can be attributed to the general R/T scheme if the model results match the in situ observations and the R/T scheme can extend to other regions devoid of in situ observations with confidence. Harris noted that there are particular challenges associated with the R/T approach including the accuracy of the model itself, accurate specification of atmospheric spectroscopy, adequate specification of atmospheric structure (radiosonde profiles), accurate quantification of satellite instrument spectral characteristics and instrument noise characteristics. The benefits of the R/T approach for detecting instrument hardware anomalies were then discussed using the NOAA-16 AVHRR as an example. In one study, modeled brightness temperature channel differences did not match the instrument derived brightness temperatures as shown in Figure 31(a) below. The difference was traced to the fact that the NOAA-16 filters were different from the filters used by other AVHRR sensors as shown in Figure 31 (b). As this information was not originally included in the R/T model, the differences are expected and a correct R/T model for NOAA 16 AVHRR could be derived.
Figure 31. (a) NOAA-16 AVHRR simulated brightness temperature (red) and actual observations (blue)
from the sensor. (b) NOAA-16 AVHRR 12 and 11 micron filter profiles compared to other AVHRR filter profiles. (A. Harris)
Harris then moved on to discuss the non-linear effect of diurnal stratification noting that a model would almost certainly provide the best approach to accounting for diurnal variability in space and time (e.g., Figure 32). However, the skill of many models relies on accurate surface flux information and high temporal resolution wind speed data which, excluding NWP fields that are not readily available in an operational environment. However, Harris noted that the initial results from the 1D NGSSTv1 model were encouraging for more simplistic treatment of diurnal SST variability.
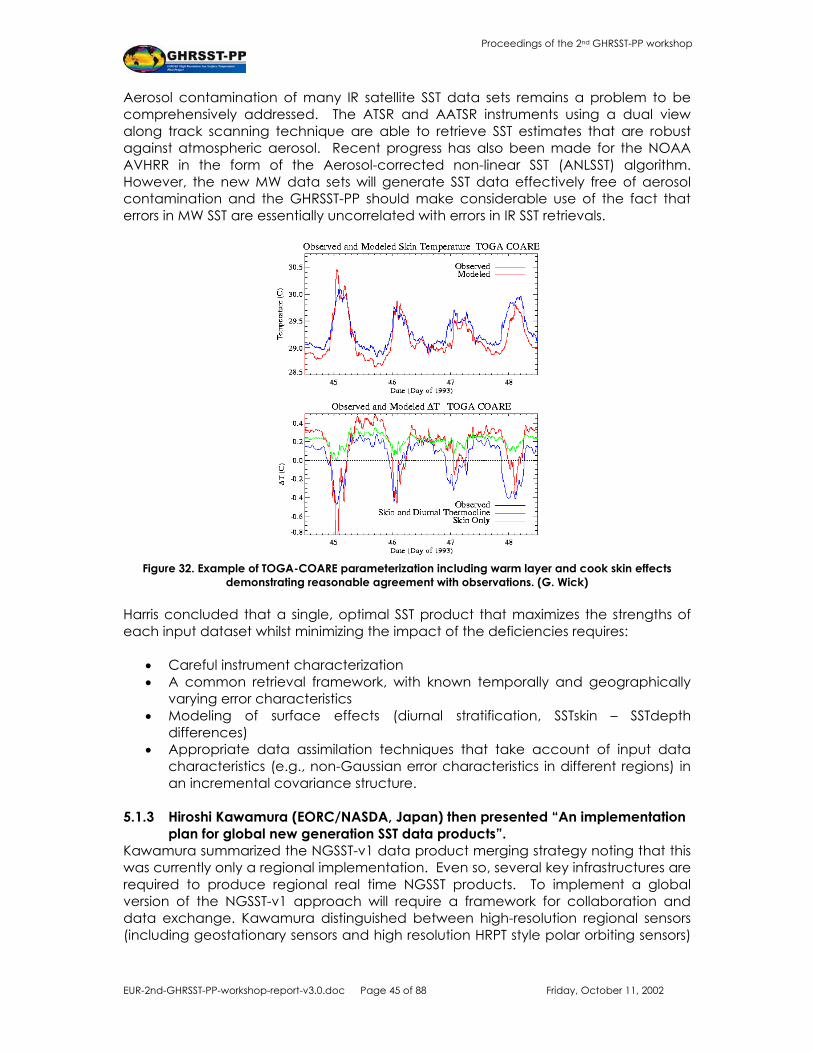
EUR-2nd-GHRSST-PP-workshop-report-v3.0.doc Page 45 of 88 Friday, October 11, 2002
Proceedings of the 2nd GHRSST-PP workshop
Aerosol contamination of many IR satellite SST data sets remains a problem to be comprehensively addressed. The ATSR and AATSR instruments using a dual view along track scanning technique are able to retrieve SST estimates that are robust against atmospheric aerosol. Recent progress has also been made for the NOAA AVHRR in the form of the Aerosol-corrected non-linear SST (ANLSST) algorithm. However, the new MW data sets will generate SST data effectively free of aerosol contamination and the GHRSST-PP should make considerable use of the fact that errors in MW SST are essentially uncorrelated with errors in IR SST retrievals.
Figure 32. Example of TOGA-COARE parameterization including warm layer and cook skin effects
demonstrating reasonable agreement with observations. (G. Wick) Harris concluded that a single, optimal SST product that maximizes the strengths of each input dataset whilst minimizing the impact of the deficiencies requires:
• Careful instrument characterization • A common retrieval framework, with known temporally and geographically
varying error characteristics • Modeling of surface effects (diurnal stratification, SSTskin – SSTdepth
differences) • Appropriate data assimilation techniques that take account of input data
characteristics (e.g., non-Gaussian error characteristics in different regions) in an incremental covariance structure.
5.1.3 Hiroshi Kawamura (EORC/NASDA, Japan) then presented “An implementation
plan for global new generation SST data products”. Kawamura summarized the NGSST-v1 data product merging strategy noting that this was currently only a regional implementation. Even so, several key infrastructures are required to produce regional real time NGSST products. To implement a global version of the NGSST-v1 approach will require a framework for collaboration and data exchange. Kawamura distinguished between high-resolution regional sensors (including geostationary sensors and high resolution HRPT style polar orbiting sensors)
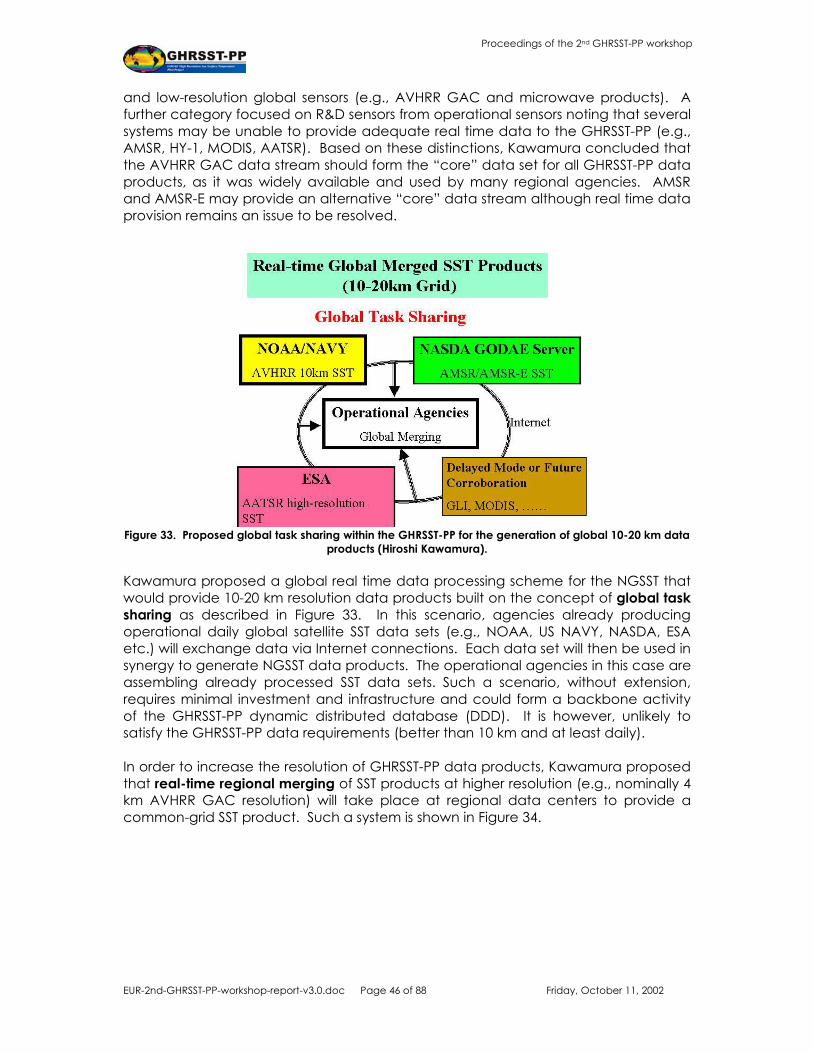
EUR-2nd-GHRSST-PP-workshop-report-v3.0.doc Page 46 of 88 Friday, October 11, 2002
Proceedings of the 2nd GHRSST-PP workshop
and low-resolution global sensors (e.g., AVHRR GAC and microwave products). A further category focused on R&D sensors from operational sensors noting that several systems may be unable to provide adequate real time data to the GHRSST-PP (e.g., AMSR, HY-1, MODIS, AATSR). Based on these distinctions, Kawamura concluded that the AVHRR GAC data stream should form the “core” data set for all GHRSST-PP data products, as it was widely available and used by many regional agencies. AMSR and AMSR-E may provide an alternative “core” data stream although real time data provision remains an issue to be resolved.
Figure 33. Proposed global task sharing within the GHRSST-PP for the generation of global 10-20 km data
products (Hiroshi Kawamura).
Kawamura proposed a global real time data processing scheme for the NGSST that would provide 10-20 km resolution data products built on the concept of global task sharing as described in Figure 33. In this scenario, agencies already producing operational daily global satellite SST data sets (e.g., NOAA, US NAVY, NASDA, ESA etc.) will exchange data via Internet connections. Each data set will then be used in synergy to generate NGSST data products. The operational agencies in this case are assembling already processed SST data sets. Such a scenario, without extension, requires minimal investment and infrastructure and could form a backbone activity of the GHRSST-PP dynamic distributed database (DDD). It is however, unlikely to satisfy the GHRSST-PP data requirements (better than 10 km and at least daily). In order to increase the resolution of GHRSST-PP data products, Kawamura proposed that real-time regional merging of SST products at higher resolution (e.g., nominally 4 km AVHRR GAC resolution) will take place at regional data centers to provide a common-grid SST product. Such a system is shown in Figure 34.
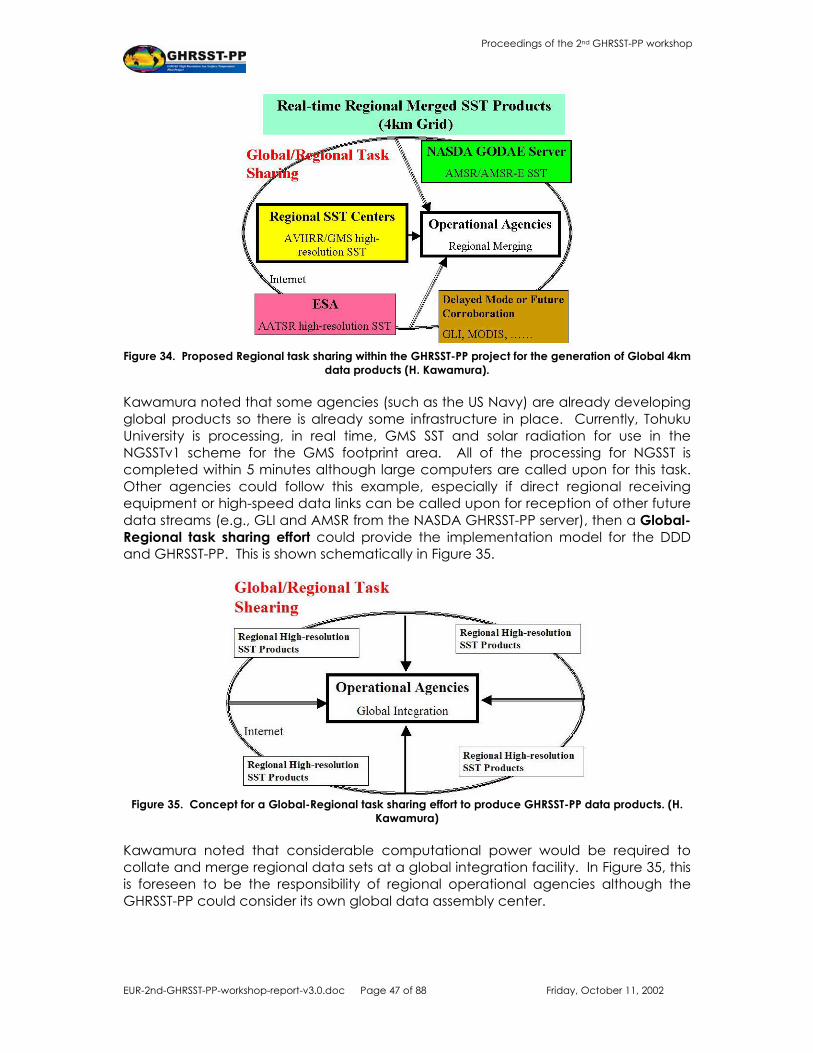
EUR-2nd-GHRSST-PP-workshop-report-v3.0.doc Page 47 of 88 Friday, October 11, 2002
Proceedings of the 2nd GHRSST-PP workshop
Figure 34. Proposed Regional task sharing within the GHRSST-PP project for the generation of Global 4km
data products (H. Kawamura). Kawamura noted that some agencies (such as the US Navy) are already developing global products so there is already some infrastructure in place. Currently, Tohuku University is processing, in real time, GMS SST and solar radiation for use in the NGSSTv1 scheme for the GMS footprint area. All of the processing for NGSST is completed within 5 minutes although large computers are called upon for this task. Other agencies could follow this example, especially if direct regional receiving equipment or high-speed data links can be called upon for reception of other future data streams (e.g., GLI and AMSR from the NASDA GHRSST-PP server), then a Global-Regional task sharing effort could provide the implementation model for the DDD and GHRSST-PP. This is shown schematically in Figure 35.
Figure 35. Concept for a Global-Regional task sharing effort to produce GHRSST-PP data products. (H.
Kawamura) Kawamura noted that considerable computational power would be required to collate and merge regional data sets at a global integration facility. In Figure 35, this is foreseen to be the responsibility of regional operational agencies although the GHRSST-PP could consider its own global data assembly center.

EUR-2nd-GHRSST-PP-workshop-report-v3.0.doc Page 48 of 88 Friday, October 11, 2002
Proceedings of the 2nd GHRSST-PP workshop
5.1.4 Olivier Arino (ESA, Italy) “MEDSPIRATION : an ESA initiative in response to GODAE GHRSST-PP".
Arino gave a brief summary of the ATSR1 and ATSR/2 sensors highlighting the fact that these instruments have been monitoring SST since 1993 and are still operational. He then presented a comparison between the recently launched AATSR and ATSR/2 instruments in the Gulf of Oman showing the detailed (1-2 km wide, several hundred km long) thermal structures characteristic of the area (Figure 36). Note that the ATSR/2 sensor measures the same area of the earth as the AATSR instrument only ½ hour before. Arino noted that the current ENVISAT and AATSR activities are proceeding well and that routine data collection from the AATSR sensor should begin in June/July 2002. A review of the ESA data policy distinguishing between Category 1 data users (research and applications development) and Category 2 data users (Operational and commercial utilization) noting that each Category has different benefits and limitations. Arino suggested that the GHRSST-PP submit a category 1 proposal as a consortium using the ESA web based submission scheme. This would secure AATSR data to GHRSST-PP project scientists and could also include a near real time (NRT) population of GHRSST-PP DDS sites (push feed). NRT average SST (ASST) data products could also be obtained via GTS and 1km global pull feeds to a AATSR data could be possible. The latter would require setting up a server within ESA to provide access to AATSR data in the same way that NASDA propose setting up a dedicated data server for AMSR data products. ESA also hold large regional archives of AVHRR, MSG and MODIS for regional areas that could also be made available to the GHRSST-PP as regional DDS sites (pull feed). This would also aid the collaboration with Japanese and US GHRSST-PP server components for consistent global data products.
Figure 36. (a) ATSR/2 and (b) AATSR 12µm brightness temperature images obtained ½ hour apart in the
Gulf of Oman. (© ESA, 2002).

EUR-2nd-GHRSST-PP-workshop-report-v3.0.doc Page 49 of 88 Friday, October 11, 2002
Proceedings of the 2nd GHRSST-PP workshop
Arino explained that ESA was interested in developing an operational system for integrated SST measurements in regionally specific areas such as the Mediterranean. Some of this work would be important for the GHRSST-PP and will be achieved in tandem with other ESA activities such as the CEOS WGISS “Ocean Test Facility”. In this case, the GHRSST-PP provides a “federated user” and the OTF project could contribute to the implementation of specific GHRSST-PP components such as the User Information Service (UIS). For example, OTF could contribute enhanced GHRSST-PP regional DDS sites, the development and testing of mapping tools, metadata development and advice. The draft OTF work-plan has now been submitted to WGISS and Science Community and could take input from the GHRSST-PP. The ESA Data Users Program (DUP) was then introduced that is designed to develop earth observation application user communities. A main element of the DUP is to support users and European entities to develop and demonstrate applications of information products derived from current and future ESA missions. The GHRSST-PP is a good example of a DUP “community” and under the DUP, ESA propose to fund the GHRSST-PP federated user activities with 1M Euro over a 2-year period. A proposal stating the requirements of the GHRSST-PP should be submitted to the ESA DUP by the end of September 2002 clearly describing:
• Project innovation • Public interest • International dimension • Demonstrate coherency with European national interests and the European
Global Monitoring for Environment and Security (GMES) initiative. • A validation and assessment component should also be included.
The project, nominally termed MEDSPIRATION (although this name is expected to change), would start in June 2003 and run for 2 years. An indicative timeline was given that is shown in Figure 37.
Figure 37. Indicative timetable for ESA DUP project contribution to the GHRSST-PP. (O. Arino)
The main users of the Service (that would have a focus on the Mediterranean and European area) would be the GHRSST-PP as a federated user and the Italian Technical Services. It would deliver a service that provides:
• Daily Sea surface temperature demonstration data products • Ultra-high resolution demonstration products covering the whole
Mediterranean basin (1:200,000 or higher) • Accuracy better than 0.2 K on temperature of the first meter of depth
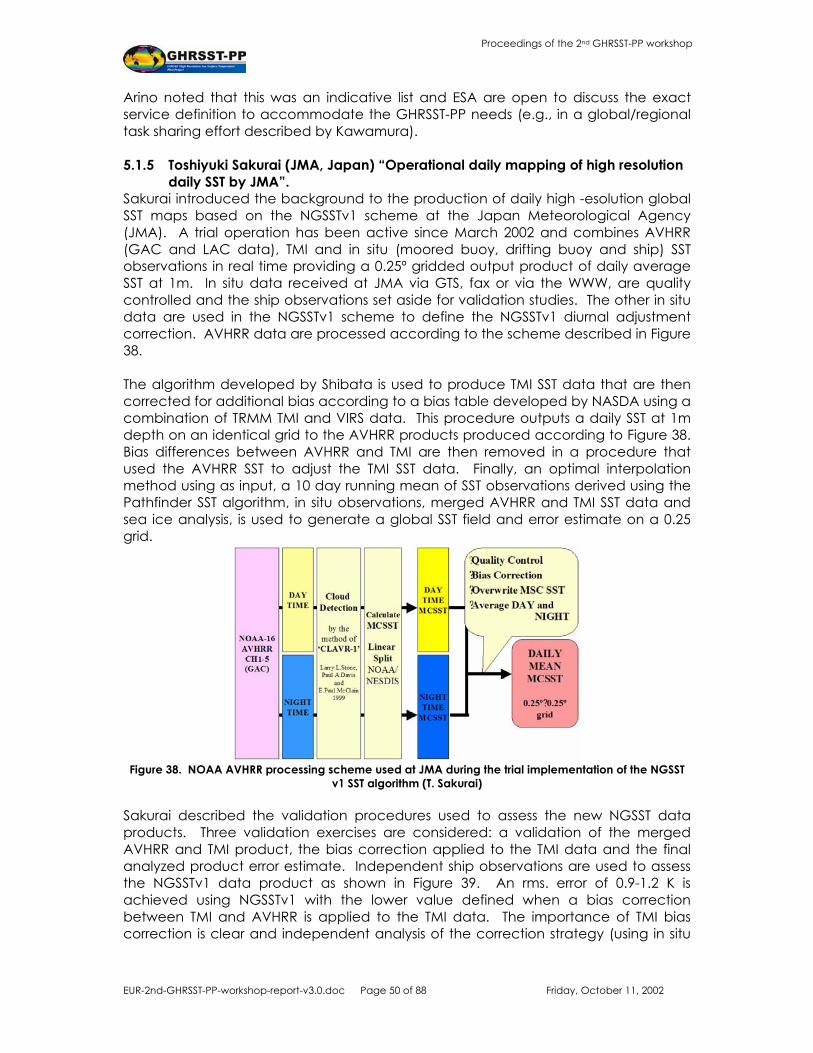
EUR-2nd-GHRSST-PP-workshop-report-v3.0.doc Page 50 of 88 Friday, October 11, 2002
Proceedings of the 2nd GHRSST-PP workshop
Arino noted that this was an indicative list and ESA are open to discuss the exact service definition to accommodate the GHRSST-PP needs (e.g., in a global/regional task sharing effort described by Kawamura). 5.1.5 Toshiyuki Sakurai (JMA, Japan) “Operational daily mapping of high resolution
daily SST by JMA”. Sakurai introduced the background to the production of daily high -esolution global SST maps based on the NGSSTv1 scheme at the Japan Meteorological Agency (JMA). A trial operation has been active since March 2002 and combines AVHRR (GAC and LAC data), TMI and in situ (moored buoy, drifting buoy and ship) SST observations in real time providing a 0.25º gridded output product of daily average SST at 1m. In situ data received at JMA via GTS, fax or via the WWW, are quality controlled and the ship observations set aside for validation studies. The other in situ data are used in the NGSSTv1 scheme to define the NGSSTv1 diurnal adjustment correction. AVHRR data are processed according to the scheme described in Figure 38. The algorithm developed by Shibata is used to produce TMI SST data that are then corrected for additional bias according to a bias table developed by NASDA using a combination of TRMM TMI and VIRS data. This procedure outputs a daily SST at 1m depth on an identical grid to the AVHRR products produced according to Figure 38. Bias differences between AVHRR and TMI are then removed in a procedure that used the AVHRR SST to adjust the TMI SST data. Finally, an optimal interpolation method using as input, a 10 day running mean of SST observations derived using the Pathfinder SST algorithm, in situ observations, merged AVHRR and TMI SST data and sea ice analysis, is used to generate a global SST field and error estimate on a 0.25 grid.
Figure 38. NOAA AVHRR processing scheme used at JMA during the trial implementation of the NGSST
v1 SST algorithm (T. Sakurai) Sakurai described the validation procedures used to assess the new NGSST data products. Three validation exercises are considered: a validation of the merged AVHRR and TMI product, the bias correction applied to the TMI data and the final analyzed product error estimate. Independent ship observations are used to assess the NGSSTv1 data product as shown in Figure 39. An rms. error of 0.9-1.2 K is achieved using NGSSTv1 with the lower value defined when a bias correction between TMI and AVHRR is applied to the TMI data. The importance of TMI bias correction is clear and independent analysis of the correction strategy (using in situ
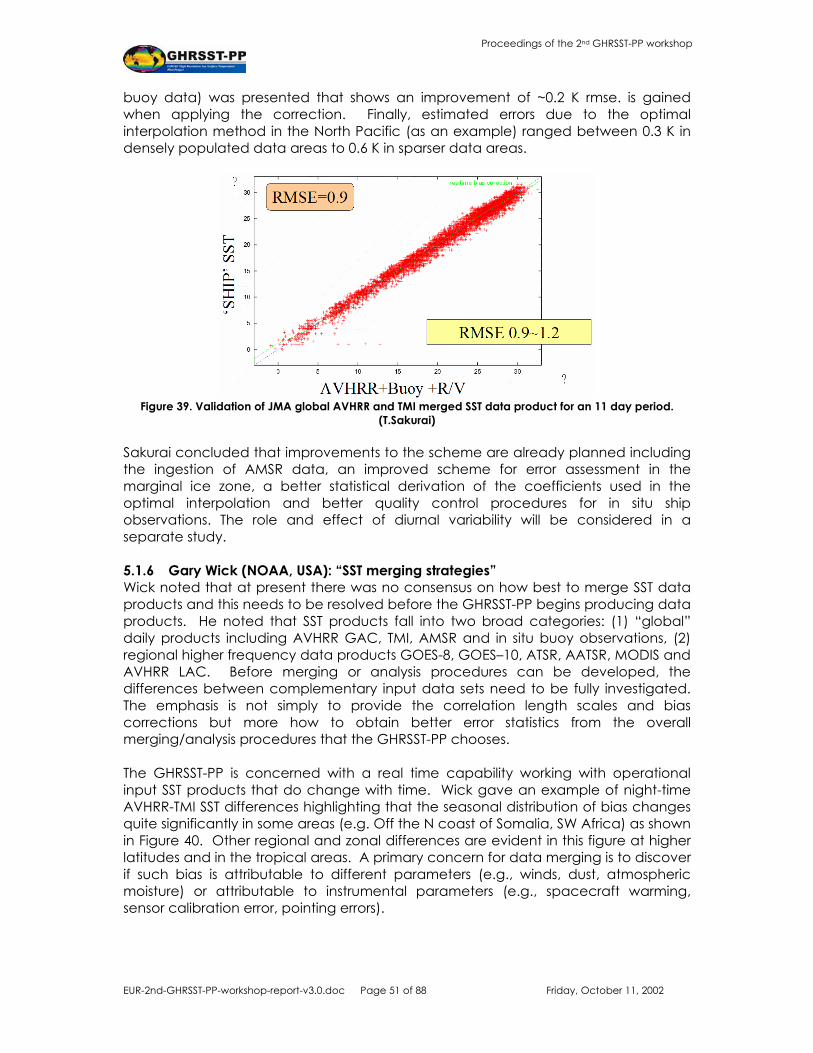
EUR-2nd-GHRSST-PP-workshop-report-v3.0.doc Page 51 of 88 Friday, October 11, 2002
Proceedings of the 2nd GHRSST-PP workshop
buoy data) was presented that shows an improvement of ~0.2 K rmse. is gained when applying the correction. Finally, estimated errors due to the optimal interpolation method in the North Pacific (as an example) ranged between 0.3 K in densely populated data areas to 0.6 K in sparser data areas.
Figure 39. Validation of JMA global AVHRR and TMI merged SST data product for an 11 day period.
(T.Sakurai) Sakurai concluded that improvements to the scheme are already planned including the ingestion of AMSR data, an improved scheme for error assessment in the marginal ice zone, a better statistical derivation of the coefficients used in the optimal interpolation and better quality control procedures for in situ ship observations. The role and effect of diurnal variability will be considered in a separate study. 5.1.6 Gary Wick (NOAA, USA): “SST merging strategies” Wick noted that at present there was no consensus on how best to merge SST data products and this needs to be resolved before the GHRSST-PP begins producing data products. He noted that SST products fall into two broad categories: (1) “global” daily products including AVHRR GAC, TMI, AMSR and in situ buoy observations, (2) regional higher frequency data products GOES-8, GOES–10, ATSR, AATSR, MODIS and AVHRR LAC. Before merging or analysis procedures can be developed, the differences between complementary input data sets need to be fully investigated. The emphasis is not simply to provide the correlation length scales and bias corrections but more how to obtain better error statistics from the overall merging/analysis procedures that the GHRSST-PP chooses. The GHRSST-PP is concerned with a real time capability working with operational input SST products that do change with time. Wick gave an example of night-time AVHRR-TMI SST differences highlighting that the seasonal distribution of bias changes quite significantly in some areas (e.g. Off the N coast of Somalia, SW Africa) as shown in Figure 40. Other regional and zonal differences are evident in this figure at higher latitudes and in the tropical areas. A primary concern for data merging is to discover if such bias is attributable to different parameters (e.g., winds, dust, atmospheric moisture) or attributable to instrumental parameters (e.g., spacecraft warming, sensor calibration error, pointing errors).

EUR-2nd-GHRSST-PP-workshop-report-v3.0.doc Page 52 of 88 Friday, October 11, 2002
Proceedings of the 2nd GHRSST-PP workshop
Figure 40. AVHRR minus TMI regional and seasonal SST differences in 2000. Note that the latitudinal extent of the data is limited by TMI coverage. (a) December-January-February 1999/2000 (b) June-
July-August 2000. (G. Wick). Wick then presented a number of analyses focused on the difference between AVHRR SST (Pathfinder) and TMI SST (Wentz product). As a function of wind speed, the difference changes sign above a wind speed of 10m/s. Further investigation using matchups between TMI and AVHRR with in situ buoy SST measurements reveals that the change in relationship is due to TMI SST having an increasing cool bias at wind speeds > 10 m/s. Wick used several other example to demonstrate how zenith angle corrections, atmospheric water vapor and clouds have an impact on both IR and MW satellite minus SST-buoy SST matchups highlighting the fact that while there are patterns of behavior, these patterns are different for each sensor and are often different in day and night time conditions. Wick then discussed the temporal bias variations that exist in the GOES data streams – the so-called “local satellite midnight” effect where the satellite instrument is affected by thermal cycling within its orbit. Initial SST data analyses from the GOES instruments can give the impression that there is considerable diurnal warming manifest in the data but this is actually a satellite instrument effect (tested using wind speed comparisons). Wick emphasized that such patterns provide the fundamental basis for understanding how to merge data and preserve the information content of each individual data stream used in the merging procedure. Bill Rossow commented that if one considers the (large) rms. differences that exist between AVHRR and TMI SST, many of the relationships exist within the error bars and may just be features associated with the (random) errors. Wick noted that establishing environmental/instrumental dependence of analysis error statistics was arguably the main function of the GHRSST-PP Diagnostic Data Set and that the construction and population of this resource was a priority for the

EUR-2nd-GHRSST-PP-workshop-report-v3.0.doc Page 53 of 88 Friday, October 11, 2002
Proceedings of the 2nd GHRSST-PP workshop
GHRSST-PP. Wick concluded by suggesting a set of key parameters that should be included in the GHRSST-PP DDS derived from TMI, AVHRR and GOES sensors that include
5.2 Conclusions form Session 3 Part 1 1. The GHRSST-PP Implementation plan will be written as two parts: a preparation
phase document and a demonstration phase document. The implementation plan will utilize work package structures that clearly define the relationships between project task and their interactions within the project. The completion of the implementation plan is the most important priority item for the GHRSST-PP Science Team following this workshop.
2. A GHRSST-PP project office is required to coordinate GHRSST-PP activities and to provide a central point of reference for the project. The office should open in early 2003 and be used to coordinate the activities of the GHRSST-PP throughout the implementation period.
3. A GHRSST-PP Principal Investigator should be appointed to lead the project throughout the demonstration phase and beyond.
4. A common SST retrieval framework based on radiative transfer modeling, with known temporally and geographically varying error characteristics, should be pursued by the GHRSST-PP as a parallel activity to initial existing empirical retrieval methodologies.
5. The AVHRR GAC data set will form the “core” data set for the GHRSST-PP. This is based on the wide availability of the data set and the many agencies that are already processing data for regional areas. In the future, AMSR/AMSR-E data may form a second core data set.
6. A regional/global task sharing effort is proposed as the basic implementation plan for the GHRSST-PP. In this model, regional area data sets would be processed by operational agencies to a common data format. Data is then exchanged between each agency and the final regional data products assembled at a global integration facility in order to achieve global coverage. Some data sets are already globally available at several regional centers (e.g., AVHRR) whereas others (e.g., ATSR) are not. This model will facilitate the development of global GHRSST-PP data products while preserving regional and national autonomy in terms of funding and applications. However, agreement must be reached in order for regional data products to be developed according to the same algorithms and data formats within the GHRSST-PP.
7. ESA has offered 1M Euro funding under the ESA data users program (DUP) to the GHRSST-PP as a federated user. A European consortium proposal should be submitted to ESA by the end of September 2002 using appropriate ESA proposal templates that will be provided. The project should focus on the regional European aspects of GHRSST-PP (regional task sharing) but will also
TMI Wind speed Rain SST
AVHRR Cloud WV Wind speed Skin effect
GOES Cloud Solar-zenith angle Water vapour Time of data

EUR-2nd-GHRSST-PP-workshop-report-v3.0.doc Page 54 of 88 Friday, October 11, 2002
Proceedings of the 2nd GHRSST-PP workshop
have considerable International dimensions with other GHRSST-PP regional agencies (e.g., NASDA, US Navy).
8. The GHRSST-PP should explore the synergy benefits of collaboration with the WGISS Ocean Test Facility (OTF) project.
9. The GHRSST-PP should submit an ESA Category 1 proposal to ensure access to AATSR and ATSR data streams from ESA.
10. A priority action for the GHRSST-PP community is to define, implement and populate the GHRSST-PP Diagnostic Data Set (DDS) as soon as possible. The DDS resource is urgently required in order to study and define regional and seasonal biases and to define relationships that exist between different input data streams. Bias and relationship analyses are a pre-cursor to the definition of a suitable data merging and analysis method for the GHRSST-PP.

EUR-2nd-GHRSST-PP-workshop-report-v3.0.doc Page 55 of 88 Friday, October 11, 2002
Proceedings of the 2nd GHRSST-PP workshop
5.3 Session3 Part II: To formalize relationship and commitments to GODAE and other associated projects
Session 3 part 2 was opened by Nick Rayner (UK Met Office) who took the opportunity to remind the workshop of the session objectives and discussion focus including How are GHSST-PP activities best coordinated within the international and national context? How do we stimulate user feedback? What about feedback to data providers: "Is a passive UIS enough?" How can a feedback mechanism be established between the GHRSST-PP and assimilation groups? What are the formal commitments to the GHRSST-PP? [National and international projects] Can we identify major relationships and commitments with data specification and transport routes/mechanisms? [e.g., MERCATOR, CEOS, GOOS, SURFA, OOPC, Reynolds SSTWG]. Rayner suggested that the workshop keep these issues in focus during the session. 5.3.1 Bill Rossow (NASA, USA): "The GEWEX projects of most relevance to the
GHRSST-PP: the Surface Radiation Budget project (SRB), the precipitation project (GPCP) and the SeaFlux activity."
Rossow explained that GHRSST-PP had some activities that were of considerable interest to the Global Energy and Water Cycle Experiment (GEWEX) and collaboration between the two experiments may be mutually beneficial. Rossow urged the workshop to think about the [long-term] climate aspects of the GHRSST-PP products and in particular, noted the need for a reanalysis project if high accuracy data were to be delivered by the project. Currently, there were no obvious GHRSST-PP plans to develop a reanalysis product that could be used to provide such “climate quality” SST data sets. Many SST projects have problems because of the non-standard merging methodologies and a lack of error statistics. Rossow stressed that the GHRSST-PP needs to make sure that input data are not ruined by a poor analysis. An overview of the global energy balance and water cycles in the context of climate was then presented noting that surface fluxes define energy exchange between the atmosphere and ocean. Rossow briefly explained the complex feedback mechanisms that are currently thought to account for the [uneven] distribution of heat within the atmosphere and ocean. While the WCRP have considerable data to look at these issues, spanning over for 20 year in various space-time resolutions, the specification of surface fluxes is not at all clear. In response, GEWEX launched the SeaFlux project to address the inadequacy of current surface flux data and produce the ocean surface fluxes needed for GWEX. Details of the Seaflux project can be found at http://paos.colorado.edu/~curryja/ocean/. The major Seaflux project activity focuses on a number of inter-comparison projects: Bulk flux models, wind speeds, SST, Pixel fluxes of air temperature and humidity and, Global flux products. Both regional and global ocean-atmosphere flux products are calculated using 9 different bulk turbulent flux models, some based on satellite derived input data. Products are validated using high quality in situ observations. Rossow stressed that SST plays an important role in all of these activities and the SeaFlux community has considerable interest in the outcomes of GHRSST-PP. While there is not an overlap between the SeaFlux and GHRSST-PP data products, as
EUR-2nd-GHRSST-PP-workshop-report-v3.0.doc Page 56 of 88 Friday, October 11, 2002
Proceedings of the 2nd GHRSST-PP workshop
SeaFlux uses retrospective data, there will be an overlap for operational production of surface flux fields. One area for collaboration is to work within the GHRSST-PP diagnostic data set (DDS) framework where SeaFlux and GHRSST-PP share several high quality DDS sites. Seaflux already have about 12 “DDS sites” that could be useful to the GHRSST-PP providing good latitudinal coverage and different oceanic regimes. Seaflux should be considered as a user of the GHRST-PP analyzed products but one that may contribute back to the product with validation data sets. Collaboration would be stronger and more important if the GHRSST-PP chose to consider reanalysis SST data products. Finally, Rossow concluded that there was considerable experience within the SeaFlux group and collaboration with GHRSST-PP would be a way to ensure that experiences and pitfalls when working with large volumes of satellite and in situ data sets are exchanged appropriately. 5.3.2 Naoto Matsuura (NASDA, Japan): "ADEOS-II Science Project Status". Matsuura briefly described the varied science projects within the Earth Observation Research Center (EORC) noting that the following were of most importance for the GHRSST-PP:
• TRMM data 98-present • AQUA/AMSR-E Launch May 4,2002ADEOS-II: Launch Nov. 2002 • ALOS: Launch 2004 • GCOM: data 2002 - 2017 (TBD)
Matsuura explained that the ADEOS-II Science Project and scope has several interlinked components that included higher-order Algorithm Development, calibration & validation, Processing System Development that are coordinated by a Science Team. He noted that the ADEOS-II Global Imager (GLI) will provide SST at 1m depth using an algorithm that has already been developed (v0) and tested using MODIS data. A version 1.0 algorithm and software package will be delivered to EOC after 6 months of data reception. Matsuura described the data flow currently planned for the ADEOS-II and AMSR mission. AMSR and AMSR-E products will be provided as either “research products” (based on the Wentz algorithm) or as operational products (based on the Shibata algorithm) which is similar to Figure 22. It is expected that AMSR data will be operationally available 9-12 m after launch although the GHRSST-PP may have access to AMSR data before this time via a dedicated NASDA GHRSST-PP server. Data should be available to Cal/Val PI’s by launch +4 months. Finally, Matsuura noted that the calibration and validation activities for both ADEOS-II and the AMSR missions was complete and that an implementation plan had been written. 5.3.3 Nick Rayner (Hadley Centre, UK): “Climate Requirements for SST data sets: the
AOPC/OOPC SST and Sea Ice Working Group”. Rayner explained that current climate SST products are currently derived from ship data, span ~150 years and are available at monthly or sometimes weekly resolution. Although ship data have some bias problems these are well understood and are accounted for. In contrast, the satellite data record, while data rich, spans only a relatively short time period of ~20 years which is insufficient for almost any climate analysis (e.g., climate change detections, forcing of models, reanalyzes). Within the GODAE demonstration period and indeed for the future, satellite (e.g., AVHRR) data
EUR-2nd-GHRSST-PP-workshop-report-v3.0.doc Page 57 of 88 Friday, October 11, 2002
Proceedings of the 2nd GHRSST-PP workshop
can be used to reconstruct a complete global coverage SST data field although the methodology is rather crude relying on simple bias correction of satellite data based on in situ match ups. The Joint Atmospheric Observations Panel for Climate (AOPC)/Ocean Observations Panel for Climate (OOPC) working group (WG) on SST and Sea Ice have been tasked with ensuring consistency and quality of SST data required by the Global Climate Observing System (GCOS). There are complementary activities to those required by GHRSST-PP and the WG contains several members of the GHRSST-PP Science team providing a link between the two activities. In particular the WG is concerned with:
• Recording and evaluating differences among historical and near real time analyses
• Identification of the sources of these differences • Establishing criteria to be satisfied by analyses to ensure quality and
consistency • Recommending appropriate actions
Rayner noted that the Comprehensive Ocean-Atmosphere Data (COADS) (http://lwf.ncdc.noaa.gov/oa/climate/coads/) data set provides an enormous increase in data volume especially now as it has been merged with other data sets and renamed the International COADS (I-COADS). A workshop was held in Boulder, Colorado, USA that focused on the I-COADS data set from which several key recommendations with respect to SST emerged:
• Bias corrections need to be revisited and bias corrections should be continued forward in time (from 1941) especially an new blends of data are emerging.
• Geostationary satellite and moored buoy data should be used to analyse diurnal cycle Maintain a liaison with GHRSST-PP and a report will be made to the SST WG of this meeting
• VOSClim should be extended (or parallel project initiated) to include buoys such as the IMET
• Recognise that “ideal” SST measurement is a daily average SST at 1 m depth (measured by calibrated hull contact sensor)
• Owing to abundance of data, a good reference period is 1971-2000 • Comparisons of quality control procedures at Met Office, JMA, NOAA &
elsewhere should be commenced using common input data. QC techniques should be further developed and metadata utilised. Time varying statistical QC is required & cross comparison of observations with advanced analyses could help. At present different QC procedures are used in different regions that may manifest as errors. QC procedures should be harmonized and linked to metadata.
• NOAA Pathfinder (and other) temperatures for large lakes should be collated • Sub-monthly analyses of SST since 1950 should be developed: 3-10 days
resolution is required. • JCOMM Expert Team on sea ice should provide recommendations on the
analysis of passive microwave-derived sea ice, etc • Use of satellite Microwave SSTs to develop statistical relationships between SST
and sea ice concentration should be re-assessed owing to possible

EUR-2nd-GHRSST-PP-workshop-report-v3.0.doc Page 58 of 88 Friday, October 11, 2002
Proceedings of the 2nd GHRSST-PP workshop
contamination by sea ice and improvements should be incorporated into analyses
• Cloud-clearing techniques for satellite-based infrared SSTs should be compared
• Regular comparisons of the SST analysis of the Met Office, JMA and NOAA should commence
• All SST analyses need to include gridded fields of analysis error, including bias correction error. Error covariance’s are also needed
• Modern high-quality data at a higher observation frequency than standard synoptic periods should be included
• Metadata – depth information needs to be included in the data base and will be explored.
Rayner made it clear that all SST data should include bias correction errors as well as other errors in data products – especially satellite data. Figure 41 shows bias errors associated with different analyses underlining this issue derived through a difference comparison between the 0Iv2 and HADISST schemes.
Figure 41. Seasonal SST analysis bias differences between OI v2 and HADSST for January and July for the
period 1982 – 1999 (N. Rayner) Rayner explained that satellite data should be processed consistently throughout any time series and there is a need to understand the differences between various input data SST sets (MW, IR, in situ) before new data can be included in climate data sets such as the I-COADS. The impact of transient data derived from satellite sensors that have a finite lifetime should also be investigated, as the effect of bringing different satellite data sets in and out of the climate record will require different procedures. These issues also apply to GHRSST-PP data products. Validation of climate data products will be undertaken using SST 1m depth data and GHRSST-PP should ensure that its data products are compatible with this. There are some climate customers for GHRSST-PP products as they stand, e.g. high-resolution ocean model validation and focus on frontal regions. In these cases, the inclusion of comprehensive error estimates is essential. Information on diurnal cycle may be useful to explore whether or not improvements in representation of convection in AGCMs leads to improvements in climate representation. However, reanalyses and AGCMs need something different e.g. lower (than 4km) resolution,

EUR-2nd-GHRSST-PP-workshop-report-v3.0.doc Page 59 of 88 Friday, October 11, 2002
Proceedings of the 2nd GHRSST-PP workshop
globally complete analyses with an integrated sea ice analysis such as that provided by the HadISST1 and OI.v2. Rayner stressed that “integrated sea ice” means that SST retrievals near to the ice are treated carefully and it is not clear in the current GHRSST-PP strategy where should this be done. It could be considered in a delayed mode [reanalysis] GHRSST-PP product, or by the AOPC/OOPC Working Group, although the Working Group is not funded per se. Rayner suggested that the SST-WG become a partner in Theme II activities and help to create an interpolated version of GHRSST-PP data products with integrated sea ice data.
5.4 Conclusions form Session 3 Part 2 1. The GHRSST-PP should consider the development of a reanalysis SST data
product that can take advantage of all data not available in a real time operational mode. These SST data products could be used to serve the climate community needs and would provide the most accurate SST data products produced by the GHRSST-PP.
2. A formal discussion between the SeaFlux and GHRSST-PP should be initiated with the aim of (a) preventing duplication of activities (b) agreeing common sites of interest within the Diagnostic Data Set (DDS) framework (c) GHRSST-PP providing SeaFlux with timely data for exploration of real time flux generation.
3. The SeaFlux project should be clearly identified in the GHRSST-PP Implementation plan as a key user of GHRSST-PP data products.
4. Many of the AOPC/OOPC WG on SST recommendations are applicable to GHRSST-PP and should be considered accordingly during the implementation of the GHRSST-PP.
5. A report describing the outcomes of the GHRSST-PP 2nd workshop should be made to the AOPC/OOPC WG on SST.
6. Climate data sets (e.g., I-COADS) are concerned with a SST 1m and GHRSST-PP should ensure that its products are compatible with a SST1m product. Validation of GHRSST-PP for climate research should be performed using SST 1m data.
7. The AOPC/OOPC SST WG should be informed and included in all DDS activities.
8. A GHRSST-PP reanalysis product would provide a mechanism to properly entrain additional data that can be used to treat the ice edge and should be considered by the GHRSST-PP.
9. Complementary SST data sets should be as far as possible, treated consistently throughout any SST time series data set that is generated and where procedures/algorithms have changed, this should be clearly documented. Furthermore, following such changes, the entire time series should be reprocessed to provide consistency.
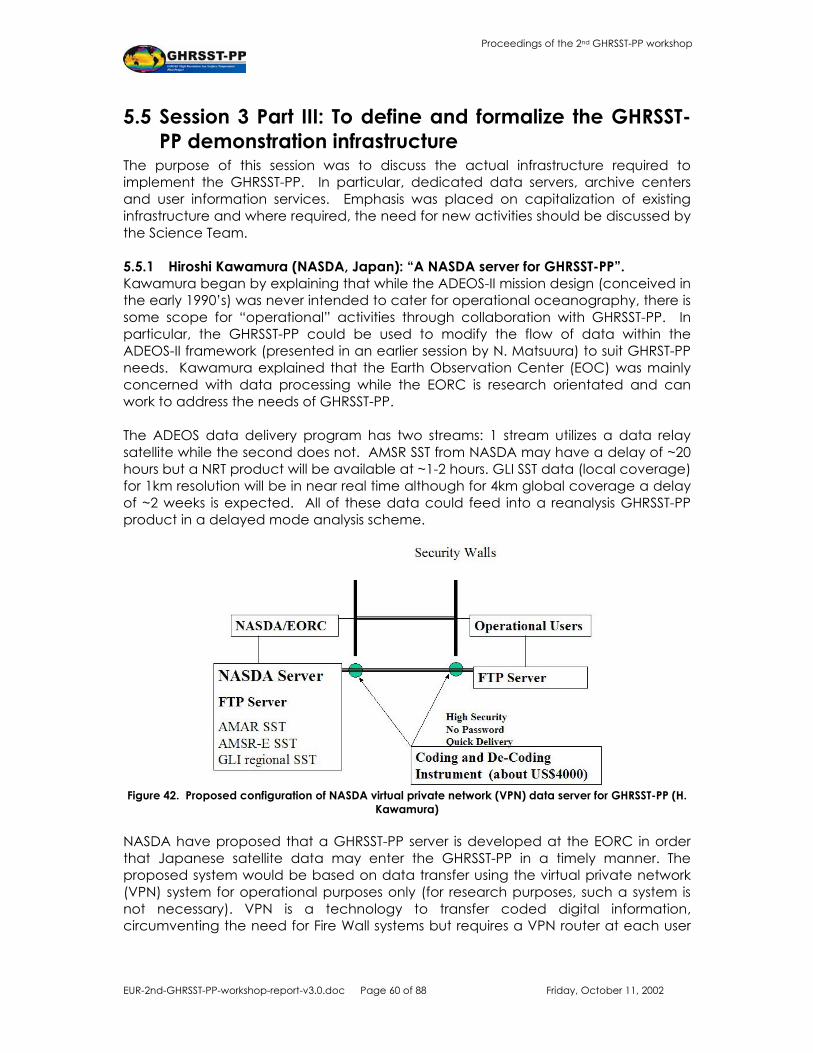
EUR-2nd-GHRSST-PP-workshop-report-v3.0.doc Page 60 of 88 Friday, October 11, 2002
Proceedings of the 2nd GHRSST-PP workshop
5.5 Session 3 Part III: To define and formalize the GHRSST-PP demonstration infrastructure
The purpose of this session was to discuss the actual infrastructure required to implement the GHRSST-PP. In particular, dedicated data servers, archive centers and user information services. Emphasis was placed on capitalization of existing infrastructure and where required, the need for new activities should be discussed by the Science Team. 5.5.1 Hiroshi Kawamura (NASDA, Japan): “A NASDA server for GHRSST-PP”. Kawamura began by explaining that while the ADEOS-II mission design (conceived in the early 1990’s) was never intended to cater for operational oceanography, there is some scope for “operational” activities through collaboration with GHRSST-PP. In particular, the GHRSST-PP could be used to modify the flow of data within the ADEOS-II framework (presented in an earlier session by N. Matsuura) to suit GHRST-PP needs. Kawamura explained that the Earth Observation Center (EOC) was mainly concerned with data processing while the EORC is research orientated and can work to address the needs of GHRSST-PP. The ADEOS data delivery program has two streams: 1 stream utilizes a data relay satellite while the second does not. AMSR SST from NASDA may have a delay of ~20 hours but a NRT product will be available at ~1-2 hours. GLI SST data (local coverage) for 1km resolution will be in near real time although for 4km global coverage a delay of ~2 weeks is expected. All of these data could feed into a reanalysis GHRSST-PP product in a delayed mode analysis scheme.
Figure 42. Proposed configuration of NASDA virtual private network (VPN) data server for GHRSST-PP (H.
Kawamura) NASDA have proposed that a GHRSST-PP server is developed at the EORC in order that Japanese satellite data may enter the GHRSST-PP in a timely manner. The proposed system would be based on data transfer using the virtual private network (VPN) system for operational purposes only (for research purposes, such a system is not necessary). VPN is a technology to transfer coded digital information, circumventing the need for Fire Wall systems but requires a VPN router at each user

EUR-2nd-GHRSST-PP-workshop-report-v3.0.doc Page 61 of 88 Friday, October 11, 2002
Proceedings of the 2nd GHRSST-PP workshop
site. VPN in important because it guarantees quick, easy and safe data transfer to the operational users. In this framework, data, including AMSR, SST, AMSR-E SST and GLI regional SST could be accessed via ftp push feed over the VPN network if appropriate decoder systems were installed at regional operational data processing centers (a decoder costs ~$400 US). The system will serve the generation of global SST maps for GHRSST-PP but more work will be required to serve the diagnostic data set components of the GHRSST-PP in real time if required. However, this could be implemented at regional data centers easing the burden of EORC. Once installed, the VPN system could be used to exchange other data within the framework of the GHRSST-PP. 5.5.2 Jim Cummings (US Navy): “The US-GODAE Monterrey server and the GHRSST-
PP”. Cummings explained the history of the US-GODAE server that is funded by the Office of Naval Research (ONR) located at the Fleet Numerical Meteorology and Oceanography (FNMOC) in Monterey. The development of the server is through a partnership between FNOMC and NOAA Pacific Marine Environmental Lab (PMEL) who have considerable experience of data server systems. Data are readily available to GODAE customers via Internet access. The server hosts both in situ and remotely sensed oceanographic data, atmospheric forcing fields and other data (e.g., bathymetry) that are needed in support of real-time ocean data assimilation experiments. It supports all GODAE participants, as well as the broader oceanographic research community. A large number of data server applications are available at Monterrey including:
• Unidata Local Data Manager (LDM) software and the Internet Data Distribution (IDD) for data push operations.
• Distributed Oceanographic Data System (DODS) now called the Open Data Access Protocol (OPenDAP) for data pull operations.
• A Live Access Server (LAS) for data visualization • Access to all data sets via conventional ftp and http links in original file format
Data sets of interest to the GHRSST-PP currently held at the USGADAE data server include:
• FNMOC atmospheric model data including global forcing fields from the NOGAPS (6 hourly) model and regional 12 hour forcing fields from the COAMPS model for areas near to the continental USA.
• NCEP global forcing fields from the AVN model at 6 hourly resolution • FNMOC ocean observations from the quality control system including AVHRR
GAC and LAC SST, GOES SST, in situ SST, SSM/I sea ice, Altimeter SSHA (Topex, ERS2, GFO), vertical profiler data (XBT, CTD, buoys, Palace floats)
• NAVOCEANO ocean observations including AVHRR LAC and GAC SST, GOES SST
• METEO France/EUMETSAT Ocean and Sea Ice Satellite Application Facility (O&OI SAF) mirrored data
• Argo Global Data Assembly Center (GDAC) containing real-time and delayed mode data from Argo global array profile floats
• Bathymetry and topography (ETOP05, DBDBV, Smith and Sandwell)

EUR-2nd-GHRSST-PP-workshop-report-v3.0.doc Page 62 of 88 Friday, October 11, 2002
Proceedings of the 2nd GHRSST-PP workshop
The strategy for the USGODAE server is to develop LAS technology to provide a framework for data access between remote GODAE sites. GODAE “sister” sites that use LAS and DODS can then present virtual interfaces to the data sets held locally and to the data sets that are held at other sites. Some progress has already been made within the modeling community using this system and Cummings noted that the GHRSST-PP diagnostic data set (DDS) could use this technology immediately. In the future, full support of observational data sets will be given via LAS and the data discovery aspects of DODS/LAS interaction will be improved by looking at metadata libraries and browse catalogs. There will also be a focus on the blending of push and pull data delivery mechanisms (DODS and IDD). Of particular importance is the desire to expand the server to support computational tasks and another strategic area foreseen in the development of the US-GODEA server is in the area of data fusion. The server is already participating in several on-the-fly comparisons between observations and model fields and also in the merging of in situ and remote sensing observations from many distributed sources. In this respect, the server is well poised to act as a global data focus for the GHRSST-PP. Cummings concluded that the server could, and should, be used within the GHRSST-PP project. Additional data storage could be made available to the GHRSST-PP for hosting of satellite data sets or the diagnostic data sets. Furthermore, a global computational facility could be installed to the system for the use of the GHRSST-PP (paid for by the GHRSST-PP) that would provide the computational facility required to generate global maps of SST. In this sense, the Monterey server could form a global data assembly center under the Global/Regional task sharing implementation scenario outlined by Hiroshi Kawamura in an earlier presentation. 5.5.3 Craig Donlon and Simon Pinnock (EC/JRC, Italy): “The GHRSST-PP diagnostic
data set: initial experience”. Donlon reviewed the background of the GHRSST-PP diagnostic data set (DDS) explaining that the DDS is a resource designed for:
• Monitoring and validation of input satellite data streams • For understanding differences between complementary satellite and in situ
data • Evaluating and developing bias correction strategies for SST data sets • Validating GHRSST-PP data products • Developing new data merging strategies, tools and methods.
The DDS provides a manageable repository for relevant satellite and in situ data products in support of all GHRSST-PP activities (especially GHRSST-PP strategic Theme III and IV). This is important because direct use of global satellite data fields is neither efficient nor particularly easy. The basic data format and approach adopted for the DDS was built on the precedent provided by the AVHRR Pathfinder Matchup Data base. Donlon explained that the GHRSST-PP strategy document discusses 3 types of interrelated DDS components:
• High resolution DDS comprising of individual satellite and in situ data matchups, and ~150 globally distributed 200 x 200 km high-resolution DDS sites.

EUR-2nd-GHRSST-PP-workshop-report-v3.0.doc Page 63 of 88 Friday, October 11, 2002
Proceedings of the 2nd GHRSST-PP workshop
• Regional area DDS sites would be fewer in number and cover specific large scale regional areas at a reduced space and time scale (e.g., weekly or monthly average data)
• Global DDS data would consider global analyses data sets. The DDS will probably be implemented as a distributed system linked via a metadata repository and noted that the US-GODAE server was already pioneering much of the technology and connectivity envisaged in the DDS system. These developments and experiences should be harnessed by the GHRSST-PP DDS system. Donlon then explained that a pilot implementation of the GHRSST-PP DDS high resolution system has been implemented at the Joint Research Center in Italy. The hardware implementation system is based on a Linux PC workstation having a 200 Gb RAID array disk, a DLT 800 tape drive, DAT-4 tape drive and, Exabyte EXB-120 jukebox (115 slots, 4 drives). The software implementation uses the HDF file format and an in house metadata repository (called “OceanInfo”). Currently, the pilot DDS system includes the following data: AVHRR-GAC calibrated brightness temperature, ATSR/2 ASST, TMI bmaps_v3 together with selected moored buoy data focussed on the European area. Data sets are stored in HDF 4 format and a DODS interface is currently in preparation. A preliminary description of the file format, metadata structure and data content for HR-DDS sites is in preparation. Following consultation at this workshop, Figure 43 describes the current GHRSST-PP DDS high-resolution sites agreed at the workshop by the GHRSST-PP Science Team.
Figure 43. GHRSST-PP High resolution Diagnostic Data Set (DDS) sites v2.0 (following input from the
GHRSST-PP Science Team in Tokyo, May 2002) (S. Pinnock) Donlon then explained how the pilot DDS system has been used at the JRC to investigate merging of ATSR/2 and AVHRR-GAC data. ATSR/2 ASST data are used to provide a calibration data set for the AVHRR data, effectively replacing the use of in situ buoy data. The pilot DDS data set focuses on European waters and the NE Atlantic. A SSTskin retrieval algorithm (called the Combined AVHRR/ATSR SST, CASST) for the AVHRR-GAC data is derived from a regression between the two data sets which is shown schematically in Figure 44.
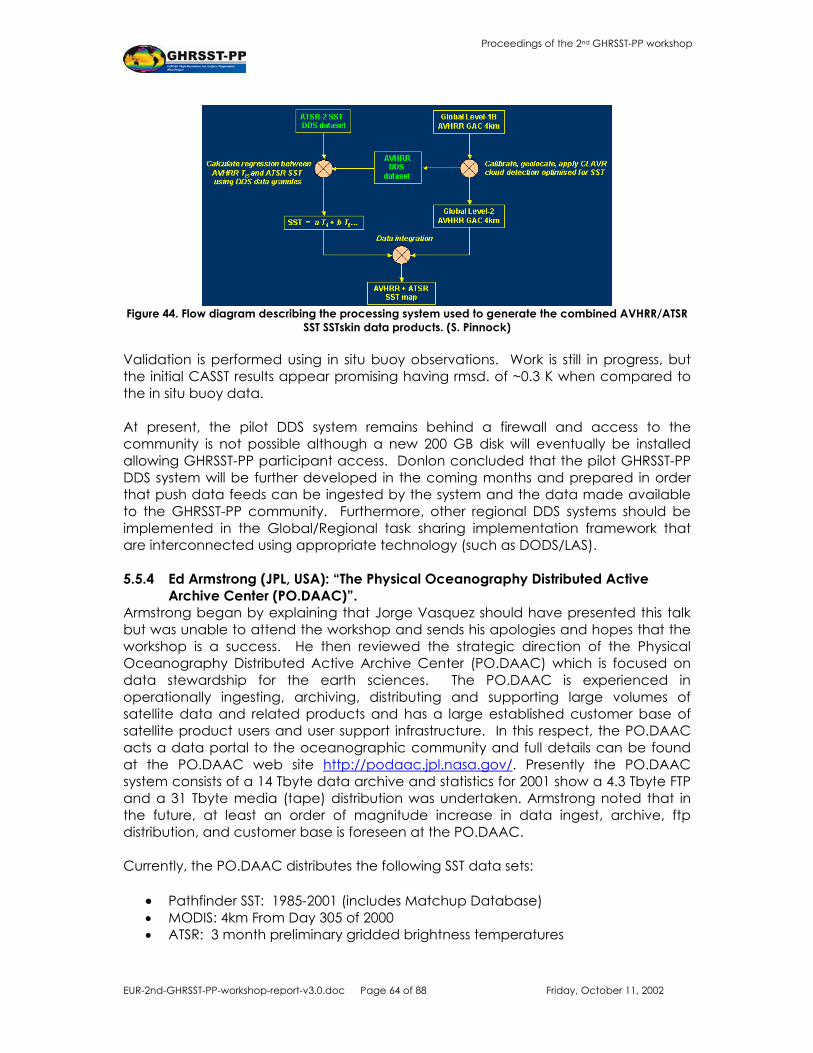
EUR-2nd-GHRSST-PP-workshop-report-v3.0.doc Page 64 of 88 Friday, October 11, 2002
Proceedings of the 2nd GHRSST-PP workshop
Figure 44. Flow diagram describing the processing system used to generate the combined AVHRR/ATSR
SST SSTskin data products. (S. Pinnock) Validation is performed using in situ buoy observations. Work is still in progress, but the initial CASST results appear promising having rmsd. of ~0.3 K when compared to the in situ buoy data. At present, the pilot DDS system remains behind a firewall and access to the community is not possible although a new 200 GB disk will eventually be installed allowing GHRSST-PP participant access. Donlon concluded that the pilot GHRSST-PP DDS system will be further developed in the coming months and prepared in order that push data feeds can be ingested by the system and the data made available to the GHRSST-PP community. Furthermore, other regional DDS systems should be implemented in the Global/Regional task sharing implementation framework that are interconnected using appropriate technology (such as DODS/LAS). 5.5.4 Ed Armstrong (JPL, USA): “The Physical Oceanography Distributed Active
Archive Center (PO.DAAC)”. Armstrong began by explaining that Jorge Vasquez should have presented this talk but was unable to attend the workshop and sends his apologies and hopes that the workshop is a success. He then reviewed the strategic direction of the Physical Oceanography Distributed Active Archive Center (PO.DAAC) which is focused on data stewardship for the earth sciences. The PO.DAAC is experienced in operationally ingesting, archiving, distributing and supporting large volumes of satellite data and related products and has a large established customer base of satellite product users and user support infrastructure. In this respect, the PO.DAAC acts a data portal to the oceanographic community and full details can be found at the PO.DAAC web site http://podaac.jpl.nasa.gov/. Presently the PO.DAAC system consists of a 14 Tbyte data archive and statistics for 2001 show a 4.3 Tbyte FTP and a 31 Tbyte media (tape) distribution was undertaken. Armstrong noted that in the future, at least an order of magnitude increase in data ingest, archive, ftp distribution, and customer base is foreseen at the PO.DAAC. Currently, the PO.DAAC distributes the following SST data sets:
• Pathfinder SST: 1985-2001 (includes Matchup Database) • MODIS: 4km From Day 305 of 2000 • ATSR: 3 month preliminary gridded brightness temperatures
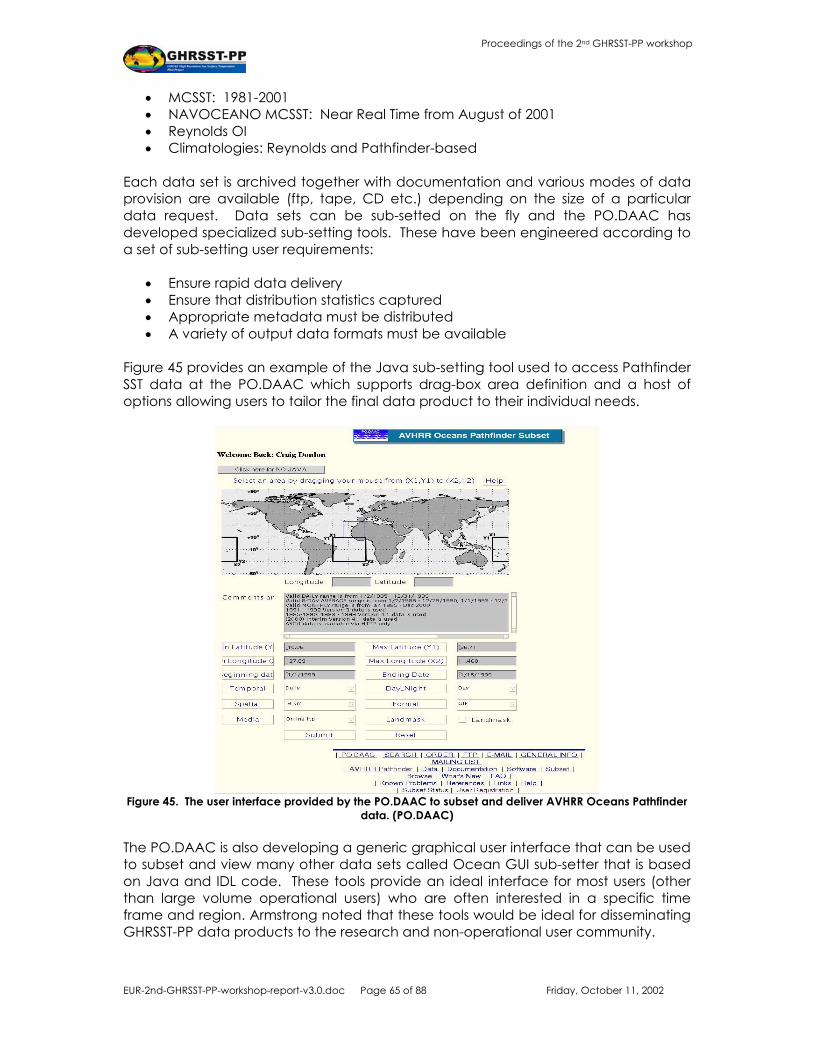
EUR-2nd-GHRSST-PP-workshop-report-v3.0.doc Page 65 of 88 Friday, October 11, 2002
Proceedings of the 2nd GHRSST-PP workshop
• MCSST: 1981-2001 • NAVOCEANO MCSST: Near Real Time from August of 2001 • Reynolds OI • Climatologies: Reynolds and Pathfinder-based
Each data set is archived together with documentation and various modes of data provision are available (ftp, tape, CD etc.) depending on the size of a particular data request. Data sets can be sub-setted on the fly and the PO.DAAC has developed specialized sub-setting tools. These have been engineered according to a set of sub-setting user requirements:
• Ensure rapid data delivery • Ensure that distribution statistics captured • Appropriate metadata must be distributed • A variety of output data formats must be available
Figure 45 provides an example of the Java sub-setting tool used to access Pathfinder SST data at the PO.DAAC which supports drag-box area definition and a host of options allowing users to tailor the final data product to their individual needs.
Figure 45. The user interface provided by the PO.DAAC to subset and deliver AVHRR Oceans Pathfinder
data. (PO.DAAC) The PO.DAAC is also developing a generic graphical user interface that can be used to subset and view many other data sets called Ocean GUI sub-setter that is based on Java and IDL code. These tools provide an ideal interface for most users (other than large volume operational users) who are often interested in a specific time frame and region. Armstrong noted that these tools would be ideal for disseminating GHRSST-PP data products to the research and non-operational user community.

EUR-2nd-GHRSST-PP-workshop-report-v3.0.doc Page 66 of 88 Friday, October 11, 2002
Proceedings of the 2nd GHRSST-PP workshop
Armstrong then described how PO.DAAC science team is actively investigating issues with regard to quality control and data validation/comparison of SST products. Comprehensive inter-comparisons between ATSR/2 and Pathfinder SST have been completed that demonstrate very small differences (~0.1 K) between the two data sets although significant regional differences are evident associated with aerosol contamination. Other comparisons between MODIS SST and AVHRR show more significant deviations although Armstrong noted that the MODIS algorithms were still in development at this time. The PO.DAAC have also completed a basic analysis of SST trends using climatological data from several data sets (JPL, Casey and Reynolds) that all show a significant warming trend over the last 10-year period. This type of study often raises many more questions and in some cases can expose differences between data sets, which is why the PO.DAAC have undertaken the work. Armstrong concluded that the PO.DAAC has a wealth of experience, tools and infrastructure that could provide a significant input to the GHRSST-PP. However, further discussions will be required to ensure that appropriate funding would be available before any commitment could be made to archive and serve significant volumes of GHRSST-PP data products. In the immediate future, a link to the GHRSST-PP web site could be made on the main SST page in order to promote GHRSST-PP activities.
5.6 Conclusions from Session 3 Part 3 1. NASDA is investigating the possibility of installing a dedicated data server for
the GHRSST-PP. The system will be based on Virtual Private Network (VPN) technology requiring operational users to install a dedicated VPN router (~$400 US). The NASDA GHRSST-PP server will serve local coverage GLI SST and global SST data derived from AMNSR and AMSR-E to the operational GHRSST-PP users. The GHRSST-PP should encourage the development of other servers within the European and USA regional areas to serve and exchange regional SST data to the project.
2. The US-GODAE data server system in Monterrey could form a GHRSST-PP Global Data Center (GDAC) and provide the possibility to install a computational facility (funded by the GHRSST-PP). The GHRSST-PP should explore the cost and feasibility of purchasing a PC cluster “supercomputer” that could be installed at Monterrey thereby providing access to all USGODAE data products.
3. A pilot DDS system has been implemented at the Joint Research Center Italy and has been used to develop a combined ATSR/AVHRR-GAC SST algorithm. The system will be expanded and modified in the near future to allow external access to data and services.
4. A version 2.0 set of DDS sites has been agreed (based on the written contributions from workshop delegates) and the structure of DDS files and metadata is fully described in a GHRSST-PP document that will be made available on the GHRSST-PP web site (http://www.ghrsst-pp.org).
5. There is a large user community that is familiar with the JPL PO.DAAC as a first “port of call” to obtain global or regional satellite SST data sets. The GHRSST-PP should work together with the PO.DAAC in order to promote its data products and services. Appropriate WWW links should be set up on the PO.DAAC web site for this purpose.
EUR-2nd-GHRSST-PP-workshop-report-v3.0.doc Page 67 of 88 Friday, October 11, 2002
Proceedings of the 2nd GHRSST-PP workshop
6. The PO.DAAC has considerable experience and tools that would greatly enhance the use of GHRSST-PP data products in the wider community. The GHRSST-PP should work together with the PO.DAAC team in these areas for mutual benefit.
7. Following discussions, it is clear that the PO.DAAC already provides much of the infrastructure and services foreseen in the GHRSST-PP User Information Service (UIS). A discussion should be initiated between the GHRSST-PP and the PO.DAAC in order to establish if the PO.DAAC could act as a data archive and dissemination center for low-volume non-operational users of GHRSST-PP data products.

EUR-2nd-GHRSST-PP-workshop-report-v3.0.doc Page 68 of 88 Friday, October 11, 2002
Proceedings of the 2nd GHRSST-PP workshop
5.7 Session 3 Part IV: Identification of metrics for the GHRSST-PP
Andy Harris (NOAA) led a plenary discussion aimed at identifying suitable Metrics for the GHRSST-PP. Harris noted that the main question concerning the selection of a suitable metric is “How do you know if you are on track to achieving your aims and objectives?” regardless of the task at hand. Harris pointed out that in the case of the GHRSST-PP, if funding can be established, this is a considerable metric in itself emphasizing that metrics do not have to be built on detailed quantative analyses. A second example focused on the goals of individual participants within the GHRSST-PP: are they aligned with the project? Harris noted that these two examples were not easily separated as funding possibilities often define the scope of what is possible (rather than what is desired). The workshop discussed the need for indicators rather than metrics at this [preparation] phase of the project agreeing hat several broad internal measures would be useful as indicator metrics. These should provide a signal that the project was (a) active and (b) developing. It was agreed that securing funding was at this stage, the most critical indicator for the GHRSST-PP. Harris explained that the primary goal of GHRSST-PP was the generation of a new generation of global data products. The GHRST-PP has an obligation to inform users of the derivation and data processing steps used to derive merged and analysed SST data. GHRSST-PP should also clearly state any limitations of the data products. If users begin to acknowledge the implications of the thermal skin-effect and diurnal warming in their particular application by, for example, selecting appropriate GHRSST-PP data products, then the project will have achieved a considerable result. However, the problem is that assessing the relative importance of these type of metrics is extremely difficult. Should simple statistics be used (e.g., number of hits, number of publications, number of downloads), scientific papers using GHRSST-PP data or, simple testimonials from satisfied users? The workshop agreed that feedback from uses was of particular importance but this was difficult to manage. Some projects simply collate e-mails whereas others rely on number of hits to a web-page or download site (although the latter may provide a false impression). Ian Robinson suggested that the need for metrics within the GHRSST-PP should be more focused. For example each component or work-package (WP) within the GHRSST-PP needs an associated metric. These will be different depending on the WP in question. The workshop agreed with this proposal and suggested that each WP should have a clearly stated metric that can be used to assess the progress and outcome [deliverable] of each WP. The workshop discussion had been focused on internal tests for the GHRSST-PP and Harris suggested that it was equally important to establish metrics that consider how well the GHRSST-PP is connected with other parts of GODAE and wider community projects. The workshop agreed that outreach to the community was important especially at this early stage of the project when sufficient awareness is required to leverage funding agencies. A critical ‘mass’ of GHRSST-PP awareness is required and this could be initiated by strengthening links to existing SST projects and initiatives.
EUR-2nd-GHRSST-PP-workshop-report-v3.0.doc Page 69 of 88 Friday, October 11, 2002
Proceedings of the 2nd GHRSST-PP workshop
The workshop noted that a GHRSST-PP web page should be set up immediately and if possible a link to/from the PO.DAAC would be extremely beneficial. Hiroishi Kawamura reminded the workshop that if the GHRSST-PP is to be a success, it must listen to the product users and in particular, the modelers in GODAE. E.g., What do they want and are they satisfied with GHRSST-PP data products? Kawamura noted that sometimes, as new info and data come into the field it takes some time for a proper response to emerge from a diverse and globally distributed community. Harris agreed, using the example that technical and scientific papers often take time to get published and do not always involve the data providers in any analysis.
5.8 Conclusions form Session 3 Part 4 In conclusion, the workshop noted that the following “internal” project indicators/metrics/actions were appropriate but that these would be revised as the project progressed:
• Establish basic national and international funding for the implementation of the GHRSST-PP.
• Collate basic statistics on the use of GHRSST-PP data products • Establish Inter-comparisons between models and other SST data sets with
GHRSST-PP data products. • Establish a basic WWW server for the GHRSST-PP and monitor the usage of the
site • Complete the development and population of the GHRSST-PP high resolution
Diagnostic Data Set • Assess how well new and diverse data sets incorporated into the GHRSST-PP
data products • Report the accuracy of GHRSST-PP data products following validation
analyses • Asses how well new methods for data merging and analysis been successfully
developed, applied and accepted by the scientific community • Deliver v1.0 GHRSST-PP data products • Monitor the number of publications citing GHRSST-PP results methods,
validation studies, data analysis and product use. • Monitor and publish all user feedback response.
EUR-2nd-GHRSST-PP-workshop-report-v3.0.doc Page 70 of 88 Friday, October 11, 2002
Proceedings of the 2nd GHRSST-PP workshop
6 Session 4. Estimate the budget requirements of the GHRSST-PP and to identify the funding sources and mechanisms available to the GHRSST-PP
Ian Barton (CSIRO) presented “Identify the funding sources and mechanisms available to the GHRSST-PP or Baking Choc-Chip Cookies”. Barton noted that implementing the GHRSST-PP was similar to baling cakes; ingredients, cooks, recipes and products are all required to generate a product. In the case of the GHRSST-PP we have satellite and in situ data, as “ingredients”, Scientists and processors as the “cooks”, algorithms for “recipes” and GHRSST-PP products and data archives as the result [cookie]. Barton reminded the workshop that considerable amounts of data are available to the GHRSST-PP; AVHRR is a freely available global source but AATSR/GLI/MODIS and geostationary data sets are restricted data sources that may require resources to obtain access. Microwave SST data are considered an essential data set as these are globally available and the development of a NASDA GHRSST-PP data server for AMSR and AMSR-E data products would mark significant achievement for the GHRSST-PP. Barton emphasized that access to extensive real-time in situ observations is mandatory to add value and substance to the final GHRSST-PP data product and may require funding to secure access. Barton then prioritized the implementation of the GHRSST-PP as follows:
• Of prime importance is the development of appropriate algorithms for the GHRSST-PP to implement. These should be developed as soon as possible by the scientists and researchers working in the GHRSST-PP and focus on delivering the best possible SST data products.
• It is important that the GHRSST-PP community adopts the same algorithms so that they can be implemented at different regional processing sites and deliver identical products for different geographical regions.
• There is also a clear need for a computational facility or a number of regional facilities that can actually implement the GHRSST-PP algorithms and methods to provide the final data products.
• Finally, Data Access and Archive Centers (DAACs) are required in order to make GHRSST-PP data products available to users and to archive the GHRSST products.
Barton noted that while this list is daunting, many of the tasks are already underway, much of this infrastructure already exists and, GHRSST-PP should make maximum use of this, only targeting the funding that is necessary for the successful implementation of project components without an obvious alternative solution. The session Chair was then given to Ian Robinson in order that Barton could continue taking notes throughout the discussion. Robinson noted that there are 3 main areas for funding consideration:
• Where are the costs within each WP? • What activities need "new money"? • What is provided "in kind"?

EUR-2nd-GHRSST-PP-workshop-report-v3.0.doc Page 71 of 88 Friday, October 11, 2002
Proceedings of the 2nd GHRSST-PP workshop
Robinson suggested that the GHRSST-PP needs a clear idea of what all of these costs are but should try to keep the last question small. The project cannot afford to rely on what is available in kind because this may lead to a “null” project. Robinson reminded the workshop that procuring funding for implementation of the GHRSST-PP is also the responsibility of the Science Team, as specified in their Terms of Reference. He then explained that there is already considerable investment and “funding” for the GHRSST-PP including:
• Science Team member institutes funding travel and attendance at meetings. • European Commission, NASDA, ESA, JPL - support for meetings • European Commission, Science Team chair • NASDA NGSST-v1.0 • 1M Euro for implementation of European regional project, ESA • NASDA GHRSST-PP data server • JPL PO.DAAC for User Information Services • European Commission implementation of Diagnostic Data Set • US-GODAE server at Monterrey: host for a GHRSST-PP global computational
facility and data archive • GODAE Office for secretarial support
This list, or “budget sheet” should be extended and used to demonstrate that the GHRSST-PP is already active, securing funding and developing well. In itself, such a budget sheet can be used to leverage additional funding from other agencies. The workshop then discussed several critical areas that will require sustained funding initiatives. These include:
• Continued support for ST members for travel and attendance at meetings. • Continued support for GHRSST-PP ST meetings/workshops, chair, office and
secretarial support • DDS population - server, data preparation, maintenance, documentation • Data transfer costs RDAC: server/processor, IT support. In some cases
supported through an existing project. GDAC: server/processor, IT support, Quality control. Professional coding GHRSST archive, PO.DAAC already supported?
The discussion identified the following activities that would require new money for implementation and support:
• A GHRSST-PP office as the project implementation will be demanding and should be independent of the general GODAE (in a similar fashion to the ARGO project)
• Support and salary for a GHRSST-PP Principal Investigator that should be made both in-kind and new money
• Dedicated national funding for travel for 3-4 potential users • Data transfer between RDACs and the GDAC and • Costs associated with a computational facility • In kind funding through National funding bodies should be able to cover: • Development of merging techniques
EUR-2nd-GHRSST-PP-workshop-report-v3.0.doc Page 72 of 88 Friday, October 11, 2002
Proceedings of the 2nd GHRSST-PP workshop
• Provision of data for research • Data transfer to RDACs • Data transfer to GDAC(s)
The workshop then considered each work package as specified in the v0.2 Implementation plan. The aim was to individually assign responsibility and potential source of funding in each case. The results of this discussion are reported in Table 3 in section 7.

EUR-2nd-GHRSST-PP-workshop-report-v3.0.doc Page 73 of 88 Friday, October 11, 2002
Proceedings of the 2nd GHRSST-PP workshop
7 Final plenary discussion: Removing the barriers to the implementation of the GHRSST-PP
The Chair noted that the workshop had been extremely stimulating and that even after the meeting had closed each evening, considerable discussion had continued. Throughout the workshop, the Chair had been taking notes from all presentations and discussions that were used to produce a v0.3 Implementation plan for the GHRSST-PP. In the first instance, there seems to be an emerging consensus on the products that GHRSST-PP will produce, although the exact data format of the products is not yet defined and is likely to emerge from further discussions. SSTskin, SSTsub-skin and SSTdepth products will be produced by the project. In addition, a diurnal mask product should be defined through further discussion. A set of rules is required to move data from SSTskin, sub-skin and SSTdepth that could be based on wind speed/solar radiation measurements and a simple 1D model of thermal stratification. In situ and satellite data should be processed identically according to agreed GHRSST-PP methods and data product algorithms at regional centers including the generation of error statistics and validation data sets. An In situ and Satellite Integration (ISDI) Technical advisory group (ISDI-TAG) should be convened to provide guidance and recommendations for the rules, methods and algorithms that will be implemented at regional and global data processing and integration centers. Three types of GHRSST-PP SST demonstration products will be produced: merged products, analyzed products and reanalysis products. A summary of GHRSST-PP data product characteristics is provided in Table 2. Merged products consist of L2a collated separate satellite data streams that have been calibrated cleared of cloud re-gridded to a common grid format. Each data set will be produced at the highest spatial and temporal resolution possible and will have variable spatial and temporal resolution. No interpolation or combined analysis will be performed. Merged data products retain all of the error statistics derived from error coding schemes based on in situ data sets (e.g., The scheme implemented by Meteo France) for each pixel in each input data set. These products are volatile, changing as new data arrives in real time but will be consolidated and archived at 6 hourly intervals corresponding to the synoptic Meteorological forecast times. Due to high data volumes and time constraints, only a moderate level of quality control may be possible. These products are expected to serve the ocean modeling community. In contrast, analyzed products are derived from the combined analysis of all merged products produced at 12 hourly intervals corresponding to the synoptic Meteorological forecast times. Analyzed data products have a single output grid together with confidence data including a diurnal signal mask, sea ice mask and a set of confidence flags. Error statistics consist of a mean bias and rms. estimate for each grid point derived from a combination of errors due to the analysis methodology and error coding schemes based on in situ data sets for each pixel in each input data set. A high level of quality control is expected. Analyzed data are permanent data that are initially archived but may be reanalyzed within 7 days of archive as a final delayed mode data set. These products are expected to serve the NWP and ocean modeling community.

EUR-2nd-GHRSST-PP-workshop-report-v3.0.doc Page 74 of 88 Friday, October 11, 2002
Proceedings of the 2nd GHRSST-PP workshop
Finally, reanalysis products are derived in a delayed mode 7-60 days after data reception to take advantage of additional data sources unavailable in real time, particularly in situ observations and satellite data sets. The highest level of quality control will be performed on these data that will be produced at 6 hourly intervals. Reanalyzed products are expected to serve the climate and general user community.
Table 2. Specification of provisional GHRSST-PP data products (to be reviewed by the ISDI-TAG) Characteristic Merged SST Analyzed SST Reanalyzed SST Grid Size Better than 10 km Better than 10 km Better than 10 km Temporal resolution
6 hours 12 hours 6 hours
Delivery timescale Real time Real time 7-28 days following data reception
Accuracy < 0.5 K absolute 0.1 K relative
< 0.5 K absolute) 0.1 K relative
< 0.3 K absolute (target), 0.1 K relative
Error statistics rms. and bias for each input data stream at every grid point
rms. and bias for each output grid point (no input data statistics are retained)
rms. and bias for each output grid point (no input data statistics are retained)
Coverage Regional (Best effort Global)
Global, (Regional extracted)
Global
SSTskin product Yes Yes Yes SSTsub-skin product
Yes Yes Yes
SST1m product Yes Yes Yes Cloud mask For each input
data set Yes Yes
Confidence data No Yes (sea ice information, diurnal warming mask, quality flags)
Yes (sea ice information, diurnal warming mask, quality flags)
Nominal data format
Hdf/GRIB/NetCDF Hdf/GRIB/NetCDF Hdf/GRIB/NetCDF
The Chair then presented an overview of the GHHRSST-PP implementation plan that has emerged from the workshop and was consolidated by an ad hoc group in the evenings during the workshop. Due to the large volumes of data that are considered by the GHRSST-PP and the operational data product delivery constraints, the strategic implementation concept of global/regional task sharing by regional data product assembly centers (RDAC) should be adopted. In this implementation model, RDAC’s are responsible for the generation of regional coverage GHRSST-PP data products typically defined by regional users and applications and/or geostationary satellite data coverage.

EUR-2nd-GHRSST-PP-workshop-report-v3.0.doc Page 75 of 88 Friday, October 11, 2002
Proceedings of the 2nd GHRSST-PP workshop
Regional data products and all ancillary data are then passed to a global data analysis center (GDAC) where they are integrated as global data products using data not necessarily held by the RDAC’s. This latter implementation concept is referred to as global integration. Note that for some satellite and in situ data streams, a natural entry point into the GHRSST-PP is at both a global and regional level (e.g., AVHRR-GAC, AMRS, AMSR-E, TMI and AATSR data). Finally, data generated and maintained at both the global and regional centers is interfaced by a suite of services and tools that collectively provide user information and services. Figure 46 provides a schematic overview of the GHRSST-PP. It proposes an implementation model built on a layered approach following the theme of Moving SST data to applications. The right hand side of Figure 46 describes five distinct activity layers within the GHRSST-PP implementation model as follows:
Global and regional data provision layer. These activities are concerned with the real time ingestion of satellite and in situ data within the GHRSST-PP. They include the provision of specialist satellite data servers (e.g., NASDA AMST server, ESA AATSR server) and the wider and more diverse network of specialist in situ data centers (e.g., CORIOLIS, NDBC). Regional task sharing project layer. These are regional area projects that will implement the GHRSST-PP. Collectively, these projects share the tasks that are required to provide GHRSST-PP global coverage data products and services a strategic implementation concept referred to as “global task sharing”. Regional data assembly, merging and analysis layer. These activities coordinate the outputs of the regional projects into the global task-sharing framework of the GHRSST-PP. They define the necessary outputs (e.g., scope of data coverage) and interfaces (e.g., international data center exchange protocols) to the upper project layers. Global data merging and analysis layer. These activities realize a GODAE specialist data center within the GODAE Measurement Network that provides global SST data products to the GODAE Common in real time. User Application and services layer. These activities provide the necessary data serving and user interaction services required by specialist and non-specialist data users.
The rationale for this model is based on the following:
• It follows a pragmatic approach • Builds on existing capacity • Maintains the GODAE identity • Preserves regional R&D investments and interests • Will capitalize on regional funding • Preserves regional autonomy • Provides a platform for regional actions • Provides a global unifying focus (Project, data and products) • Transfers the product analysis burden off the RDAC to a central facility

EUR-2nd-GHRSST-PP-workshop-report-v3.0.doc Page 76 of 88 Friday, October 11, 2002
Proceedings of the 2nd GHRSST-PP workshop
Figure 46. Schematic diagram describing the Implementation plan for the GHRSST-PP. Figure 46 also introduces the major GHRSST-PP implementation model components and their context within the project. Project components interact with other to deliver a distributed real time demonstration system providing high-resolution SST data sets described in Table 2. A brief summary of each component is provided below. A full description of the GHRSST-PP Implementation plan will be drawn up based on these components and their interaction. 7.1.1 Global operational data provision and servers These are either in preparation or discussion
• NASDA AMSR server [Kawamura et al] • ESA AATSR server [ESA Cat-1 ENVISAT-AO proposal. Donlon et al] • USA GHRSST-PP data server [Cummings et al] • REMSS SSM/I, AMSR and TRMM [Gentemann] • CORIOLIS in situ data [Poliquen] • AOML [Katsaros/Donlon] • Drifter program [Wilson]
7.1.2 Regional data provision and servers Either in preparation or discussion
• MSG [LeBorgne] • GOES [May] • GMS [Kawamura]

EUR-2nd-GHRSST-PP-workshop-report-v3.0.doc Page 77 of 88 Friday, October 11, 2002
Proceedings of the 2nd GHRSST-PP workshop
• TMI [NASDA/REMSS] • EUMETSAT OSI-SAF [LeBorgne] • JMA [Kawamura] • NOAA [Casey] • AATSR [Arino]
7.1.3 Global Telecommunications System (GTS) In situ and satellite data will feed into GDAC and RDAC facilities via the GTS system. 7.1.4 New Generation SST (NGSST) project (Japanese RDAC)
• Leader : Hiroshi Kawamura ([email protected]) Provides a Japanese regional task sharing project and funding to implement services and data delivering the GHRSST-PP Japan RDAC. The regional area covered is that of the GMS geostationary footprint. 7.1.5 Medspiration project (European RDAC)
• Leader: Ian Robinson ([email protected]) Provides a European regional task sharing project and funding to implement services and data delivering the GHRSST-PP European RDAC. The regional area considered is the MSG geostationary footprint Atlantic Ocean and European shelf seas (specifically including the Mediterranean and Baltic). 7.1.6 Cooperative US SST project (USAA RDAC)
• Leader: Provides a US regional task sharing project and funding to implement services and data delivering the GHRSST-PP USA RDAC. The regional area considered is the GOES-E and GOES-W geostationary footprints. 7.1.7 Japan, European and, USA Regional Data Assembly Center (RDAC) The regional Data Assembly Centers (RDAC) describes the GHRSST-PP interface with the Regional task sharing projects. The RDAC will provide GHRSST-PP merged and analyzed regional data products together with ancillary data (including error statistics and validation data) to the Global data analysis center (GDAC) for integration into global data products. The RDAC implements identical in situ and Satellite Data Integration (ISDI) methods and algorithms to those of the GDAC at each facility. The RDAC also implement and host a regional Diagnostic Data Set that is interconnected using OPeNDAP communications technology. Data generated at RDAC facilities can be accessed by the User Information Services (UIS) and/or the Application User Services (AUS) modules. Dedicated data servers (e.g., NASDA AMSR server) will be managed and implemented within the RDAC framework. 7.1.8 Global Data Analysis Center (GDAC)
• Leader:[TBD] A Global Data Analysis Center provides a global focus for the GHRSST-PP. The GDAC is where global data integration and global product production take place. Conceptually, it is the location of the ISDI, the ISDI technical advisory group (ISDI-TAG), a data product computational facility (DPCF), a global Diagnostic Data Set and the GHRSST-PP metadata repository, which collectively, constitute the GHRSST-PP GDAC. Initially, it is foreseen that only one GDAC facility will operate during the lifetime of the GHRSST-PP (probably based at Monterrey and attached to the US
EUR-2nd-GHRSST-PP-workshop-report-v3.0.doc Page 78 of 88 Friday, October 11, 2002
Proceedings of the 2nd GHRSST-PP workshop
GODAE data server) although other facilities could be installed and operate in tandem providing an operational redundancy and GDAC task sharing capability. 7.1.9 In situ and Satellite Data Integration (ISDI)
• Leader: Pierre LeBorgne ([email protected]) The ISDI is responsible for the provision and implementation of GHRSST-PP operational methodology and SST algorithms. It has identical methodological components at both RDAC and GDAC facilities although the exact hardware and software realization may be somewhat different depending on the RDAC infrastructure. The ISDI also includes the GDAC DPCF where global data products will be generated. The ISDI is managed and overseen by the ISDI technical advisory group (ISDI-TAG). 7.1.10 In situ and Satellite Data Integration Technical Advisory Group (ISDI-TAG)
• Leader/Chair: Gary Wick ([email protected]) The ISDI-TAG group is a sub-component of the ISDI system and is responsible for the specification, development and operation of the GHRSST-PP ISDI. In particular, it will ensure the evolution of the ISDI services in a well-managed manner by bringing together GHRTSST-PP scientists and engineers with user applications. Establishing this feedback loop (called the ISDI project control loop) ensures that the ISDI is built on consensus opinions and evolves from a bottom up user perspective. 7.1.11 The Diagnostic Data Set (DDS)
• Leader: Craig Donlon ([email protected]) The DDS system is a distributed archive of small-moderate (e.g., 2x2° latitude longitude or NE Atlantic) areas that are spread in a quasi-regular pattern over the global ocean. It provides the infrastructure to exercise a high degree of quality control ranging from simple inter-comparison of input satellite data streams to the comprehensive validation of output data products and generation of a dedicated match up database. These data provide a time series data set that is built in real time that can be used to evaluate and monitor input data streams and validate GHRSST-PP data products. For reanalysis data products, the DDS system used in a delayed mode will be used to generate the highest accuracy and highest quality data sets. 7.1.12 The Metadata Repository (MDR)
• Leader: Ed Armstrong ([email protected]) The MDR is responsible for the development, implementation and operation of a GHRSST-PP metadata repository system that will be used to document all data transactions at both a regional and a global level in real time. There are two types of metadata to be considered within the GHRSST-PP: discovery metadata and file metadata. Discovery metadata will be archived at GDAC and RDAC facilities and provides a minimal set of data that allows users and scientists to retrieve data files according to generic information (e.g., when data files were created, where the data within the file is located and when it was collected, which sensor the data were derived at etc.). File specific metadata provides information on the data held in a particular data file (e.g., time of data acquisition, calibration data, data format description, etc.). It is foreseen that the MDR system will be automated based on e-mail transactions between data operations and the GDAC-MDR system that is considered the “Master” MDR.
EUR-2nd-GHRSST-PP-workshop-report-v3.0.doc Page 79 of 88 Friday, October 11, 2002
Proceedings of the 2nd GHRSST-PP workshop
7.1.13 The Data Product Computational Facility (DPCF) • Leader: Andy Harris ([email protected])
The DPCF is the hardware and software realization of the ISDI system and is responsible for the real time production of GHRSST-PP data products at a GDAC. It will be a linux Beowolf supercomputer of some 30-60 nodes. It is expected that the DPCF will reside at the US-GODAE server in Monterrey. 7.1.14 The User Information Service (UIS)
• Leader: TBD The UIS provides a general interface for interaction between the GHRSST-PP and general users. It consists of a number of sub-components that are designed to provide easy access to data products using a combination of standard and developing technologies (SSH, SFTP, LAS, DOD etc.) in a Data Serving component (UIS-DS), a project web portal and outreach activities (UIS-WWP), a data archive center (UIS-DAC) and a reanalysis facility that will generate GHRSST-PP Reanalysis data products (UIS-RAN). 7.1.15 GHRST-PP Data Product Serving (UIS-DS)
• Leader: Jorge Vasquez ([email protected]) GHRSST-PP data products will be served from the UIS-DS component using a number of standard and emerging technologies. These include the Live Access Server (LAS), the Open source Project for a Network Data Access Protocol (OPeNDAP, formerly the Distributed Oceanographic Data Server, DODS), the Internet Data Distribution (IDD) service, the Thematic Real time Environmental Data Distribution Service (THREDDS) and secure file transfer and shell access (SFTP,SSH). These services are expected to play a major role in the implementation of GODAE data services in general. The UIS-DS could be a distributed system accessed through the GHRSST-PP web portal. 7.1.16 GHRSST-PP Web portal and Outreach activities (UIS-WWP)
• Leader: Craig Donlon ([email protected]) The WWP provides the first point of call for a user interested in discovering the possibilities that the GHRSST-PP offers. It will provide the link to all UIS services and serve the user community with information describing GHRSST-PP data products, systems, and applications. It will provide basic outreach services that educate and inform users of the strengths and weakness associated with each GHRSST-PP data product. It will provide generic tools for the visualization and file independent access to data products using tools such as the Live Access Server and DODS. It will provide an interface to the GHRSST-PP MDR, report on RDAC and GDAC activities and satellite data stream status. The USI-WWW may be a mirrored service residing at one of several national data centers in order to maximize user access speeds. 7.1.17 Data Access-Archive Center (UIS-DAAC)
• Leader: Jorge Vasquez ([email protected]) The UIS-DAAC is the final long-term data archive and access center for all GHRSST-PP data products. It will be interfaced to the UIS-WWP and be catalogued using the MDR system. 7.1.18 Reanalysis project (UIS-RAN)
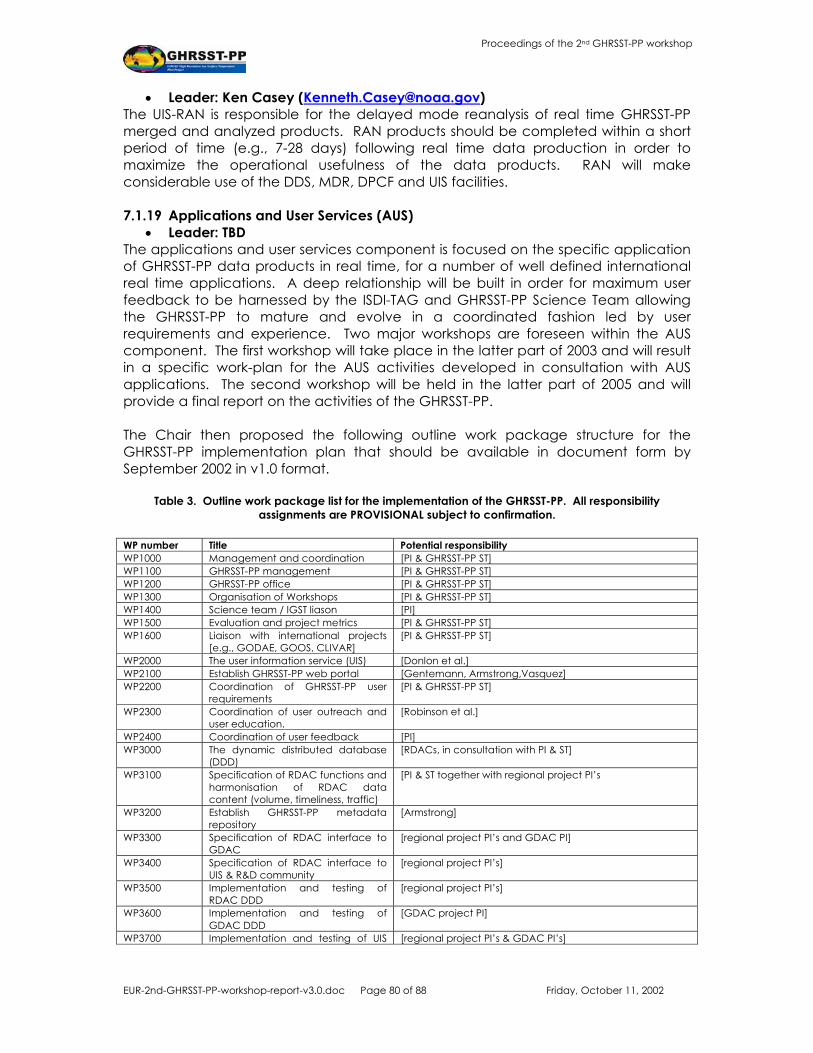
EUR-2nd-GHRSST-PP-workshop-report-v3.0.doc Page 80 of 88 Friday, October 11, 2002
Proceedings of the 2nd GHRSST-PP workshop
• Leader: Ken Casey ([email protected]) The UIS-RAN is responsible for the delayed mode reanalysis of real time GHRSST-PP merged and analyzed products. RAN products should be completed within a short period of time (e.g., 7-28 days) following real time data production in order to maximize the operational usefulness of the data products. RAN will make considerable use of the DDS, MDR, DPCF and UIS facilities. 7.1.19 Applications and User Services (AUS)
• Leader: TBD The applications and user services component is focused on the specific application of GHRSST-PP data products in real time, for a number of well defined international real time applications. A deep relationship will be built in order for maximum user feedback to be harnessed by the ISDI-TAG and GHRSST-PP Science Team allowing the GHRSST-PP to mature and evolve in a coordinated fashion led by user requirements and experience. Two major workshops are foreseen within the AUS component. The first workshop will take place in the latter part of 2003 and will result in a specific work-plan for the AUS activities developed in consultation with AUS applications. The second workshop will be held in the latter part of 2005 and will provide a final report on the activities of the GHRSST-PP. The Chair then proposed the following outline work package structure for the GHRSST-PP implementation plan that should be available in document form by September 2002 in v1.0 format.
Table 3. Outline work package list for the implementation of the GHRSST-PP. All responsibility assignments are PROVISIONAL subject to confirmation.
WP number Title Potential responsibility WP1000 Management and coordination [PI & GHRSST-PP ST] WP1100 GHRSST-PP management [PI & GHRSST-PP ST] WP1200 GHRSST-PP office [PI & GHRSST-PP ST] WP1300 Organisation of Workshops [PI & GHRSST-PP ST] WP1400 Science team / IGST liason [PI] WP1500 Evaluation and project metrics [PI & GHRSST-PP ST] WP1600 Liaison with international projects
[e.g., GODAE, GOOS, CLIVAR] [PI & GHRSST-PP ST]
WP2000 The user information service (UIS) [Donlon et al.] WP2100 Establish GHRSST-PP web portal [Gentemann, Armstrong,Vasquez] WP2200 Coordination of GHRSST-PP user
requirements [PI & GHRSST-PP ST]
WP2300 Coordination of user outreach and user education.
[Robinson et al.]
WP2400 Coordination of user feedback [PI] WP3000 The dynamic distributed database
(DDD) [RDACs, in consultation with PI & ST]
WP3100 Specification of RDAC functions and harmonisation of RDAC data content (volume, timeliness, traffic)
[PI & ST together with regional project PI’s
WP3200 Establish GHRSST-PP metadata repository
[Armstrong]
WP3300 Specification of RDAC interface to GDAC
[regional project PI’s and GDAC PI]
WP3400 Specification of RDAC interface to UIS & R&D community
[regional project PI’s]
WP3500 Implementation and testing of RDAC DDD
[regional project PI’s]
WP3600 Implementation and testing of GDAC DDD
[GDAC project PI]
WP3700 Implementation and testing of UIS [regional project PI’s & GDAC PI’s]

EUR-2nd-GHRSST-PP-workshop-report-v3.0.doc Page 81 of 88 Friday, October 11, 2002
Proceedings of the 2nd GHRSST-PP workshop
DDD WP3800 Establish mirrored data archive with
PO.DAAC/JODC/European DC [Vasquez et al.]
WP4000 The diagnostic data set (DDS). [Donlon et al.] WP4100 Specification of the RDAC DDS
structure and interface to the DDD (file format, volume, access, data I/O metadata...)
[regional project PI’s, GDAC PI]
WP4200 Establish and document DDS Cat 1 and Cat 2 sites and minimum data content (Thematic, validation, algorithm development)
[regional project PI’s, with in situ data providers]
WP4300 Implementation and testing of RDAC DDS.
[regional project PI’s, with in situ data providers]
WP4400 Population and testing of RDAC DDS system
[regional project PI’s]
WP5000 The In situ and Satellite data integration system (ISDI)
[Wick et al.]
WP5100 Specification of GDAC services [PI & GHRSST-PP ST] WP5200 Specification of GDAC GHRSST-PP
computational facility (Beowolf cluster “supercomputer”)
[Harris/Cummings/May]
WP5300 Purchase, installation and maintenance of GDAC system
New money required ~$60K + 0.5 EFT [PI & ST]
WP5400 ISDI-TAG. Specification of (diverse) version 1.0 ISDI tools and methods (skin, sub-skin, depth, error stats, confidence levels and fields, clouds, aerosols, land mask,)
[Wick et al]
WP5500 Implementation of operational 1.0 ISDI tools and methods
[LeBorgne et al.]
WP5600 Validation and testing of GHRSST-PP data and products
[PI, GHRSST-PP ST and regional projects]
WP5700 Specific R&D tasks for the GHRSST-PP (Diurnal thermocline, Clouds, merging, analysis, validation, sea ice, new products)
[Gentemann et al.]
WP5800 Generation of merged and analysed demonstration products Initial harmonisation of approach at GDAC but several product versions that are validated and assessed then move on
[regional projects and GDAC project]
WP5900 Analysis of GHRSST-PP products and services. Initially try 3 or 4 approaches together, validate, inter-compare and refine throughout the project - flexibility
[regional projects and GDAC project]
WP5A00 ISDI metrics [PI & GHRSST-PP ST WP6000 Applications and User Services (AUS) [Robinson et al.] WP6100 Applications and user services
Workshop 1 “Application of a new generation SST products: requirements, applications, specifications...” bringing users together with GHRSST-PP (1 week)
[PI]
WP6200 Applications workshop 2 – “Advances in the application of GHRSST-PP data products and services”
[PI]
WP6300 WP6300: Documentation [All]
7.2 Schedule for the Implementation of the GHRSST-PP A preliminary GHRSST-PP schedule was agreed as follows:
EUR-2nd-GHRSST-PP-workshop-report-v3.0.doc Page 82 of 88 Friday, October 11, 2002
Proceedings of the 2nd GHRSST-PP workshop
• Preparation of a GHRSST-PP Implementation plan by end of September 2002 • GDAC v1.0 by January 2003 • RDAC v1.0 by June 2003 • DDD by June 2003 • ISDI by June 2003 • DDS by June 2003 • Operational phase June 2003-June 2005
8 AOB Olivier Arino (ESA) kindly offered to host the next GHRSST-PP ST and workshop Meeting at ESA Frascati , Italy 2-4th December 2002. The workshop welcomed the offer and agreed that although the time between this workshop and December was short, this would ensure that the GHRSST-PP maintains momentum. Three new members were proposed by the Char for admission to the GHRSTT-PP Science Team based on their contribution to the workshop:
• Andy Harris (NOAA) • Ed Armstrong (JPL, PO.DAAC) • Ken Casey (NOAA)
The Science Team voted unanimously and all three persons were accepted. Finally, the Chair thanked NASDA and the local organization committee led by Himroshi Kawamura and presented Italian Chocolates to the Workshop secretary, Ms. Kadobayashi, in acknowledgement of the excellent support that she had provided to the workshop. The Chair thanked all workshop participants and the meeting was formerly closed.

EUR-2nd-GHRSST-PP-workshop-report-v3.0.doc Page 83 of 88 Friday, October 11, 2002
Proceedings of the 2nd GHRSST-PP workshop
9 ANNEX I: Attendance list for the GHRSST-PP 2nd Workshop
Arino, Olivier ESA/ESRIN Via Galileo Galilei, CP 64 00044 Frascati, Italy Phone: +39 6 941 80 564 Fax: +39 6 941 80 512 E-mail: [email protected] Barton, Ian CSIRO Marine Research PO Box 1538, Hobart, Tasmania 7001, Australia Phone: +61 3 62325481 Fax:+61 3 62325123 E-mail: [email protected] Casey, Kenneth UCAR-NOAA/NESDIS/NODC, E/OC5 1315 East-West Highway Silver Spring MD 20910 Phone: +1 301-713-3272 ext 133 E-mail: [email protected] Cummings, James A. Oceanographer Marine Meteorology Division, Code 7533 Naval Research Laboratory Monterey, California 93943 U.S.A. Phone: +1 (831) 656 1935 Fax: +1 (831) 656 4769 Email: [email protected] Donlon, Craig (Chair) European Commission Joint Research Centre, IMW-Institute for Environment and Sustainability, TP272, I-21020 Ispra (VA), Italy. Phone: +39 0332 786353 Fax: +39 0332 789034 E-mail: [email protected]
Gentemann, Chelle Remote Sensing System 438 First St. Suite 200; Santa Rosa, CA 95401 USA Phone: +1 707-545-2904x14 Fax: +1 707-545-2906 E-mail: [email protected] Guan, Lei Ocean Remote Sensing Institute Ocean University of Qingdao Qingdao, 266003, China Tel: +86 532 2032902 Fax: +86 532 2032909 Email: [email protected] Harris, Andy NOAA/NESDIS ORA, World Weather Building 5200 Auth Road Camp Springs, MD 20746 Phone: +1-301-763-8102 x169 Fax: +1-301-763-8108 E-mail: [email protected] Hosoda, Kohtaro Center for Atmospheric and Oceanic Studies, Graduate School of Science, Tohoku University Sendai 980-8578 Japan Phone:+81-22-217-6747 Fax:+81-22-217-6748 E-mail:[email protected] Kachi, Misako Earth Observation Research Center (EORC) National Space Development Agency of Japan (NASDA) TRITON Square, X-23 1-8-10, Harumi, Chuo-ku, Tokyo, Japan 104-6023 Phone: +81-3-6221-9000 Fax: 81-3-6221-9192 E-Mail: [email protected]

EUR-2nd-GHRSST-PP-workshop-report-v3.0.doc Page 84 of 88 Friday, October 11, 2002
Proceedings of the 2nd GHRSST-PP workshop
Kawai, Yoshimi Center for Atmospheric and Oceanic Studies, Graduate School of Science, Tohoku University Sendai 980-8578 Japan Phone:+81-22-217-6632 Fax:+81-22-217-6748 E-mail:[email protected] Kawamura, Hiroshi Center for Atmospheric and Oceanic Studies, Graduate School of Science, Tohoku University Sendai 980-8578 Japan Phone:+81-22-217-6745 Fax:+81-22-217-6748 E-mail:[email protected] Kurihara, Yukio Office of Marine Prediction, JMA 100-8122 Chiyoda-ku Otemachi 1-3-4 Phone: 03-3212-8341 Ext.5129 Fax: 03-3211-3047 E-mail:[email protected] Le Borgne, Pierre Meteo-France/Centre de Meteorologie Spatiale CMS, B.P. 147,22302 Lannion Cedex, France Phone: +33 2 96 05 67 52 Fax: +33 2 96 05 67 37 E-mail:[email protected] Matsuura, Naoto Earth Observation Research Center (EORC) National Space Development Agency of Japan (NASDA) TRITON Square, X-23 1-8-10, Harumi, Chuo-ku, Tokyo, Japan 104-6023 Phone: +81-3-6221-9000 Fax:+ 81-3-6221-9192 E-mail: [email protected]
Murakami, Hiroshi OCTS/GLI Cal/Val Team, GAIT Earth Observation Research Center (EORC) National Space Development Agency of Japan (NASDA) TRITON Square, X-23 1-8-10, Harumi, Chuo-ku, Tokyo, Japan 104-6023 Phone: +81-3-6221-9000 Fax:+81-3-6221-9192 E-mail: [email protected] Rayner, Nick Met Office Hadley Centre for Climate Prediction and Research Hadley Centre for Climate Prediction and Research, Met Office, London Road, Bracknell, RG12 2SY, UK Phone: +44 1344 854063 Fax: +44 1344 854898 E-mail: [email protected] Robinson, Ian School of Ocean and Earth Science, Southampton Oceanography Centre European Way, Southampton SO14 3ZH,UK. Phone: +44 - 23 8059 3438 Fax: +44 - 23 8059 3059 E-mail: [email protected] Rossow, William B. NASA Goddard Institute for Space Studies 2880 Broadway, New York, NY 10025, USA Phone: +1-212-678-5567 Fax:+1-212-678-5622 E-mail: [email protected] Sakurai Toshiyuki Office of Marine Prediction, JMA 100-8122 Chiyoda-ku Otemachi 1-3-4 Phone:+03-3212-8341 Ext.5127 Fax:+03-3211-3047 E-mail: [email protected] Sato, Satoshi Japan Oceanographic Data Center Hydrographic Department, Japan Coast Guard Mailing Address: 5-3-1, Tsukiji, Chuo-ku, Tokyo,104-0045 JAPAN Phone: +81-3-3541-4295 Fax: +81-3-3545-2885 E-mail: [email protected]

EUR-2nd-GHRSST-PP-workshop-report-v3.0.doc Page 85 of 88 Friday, October 11, 2002
Proceedings of the 2nd GHRSST-PP workshop
Stuart-Menteth, Alice Southampton Oceanography Centre (SOC) SOC, European Way, Southampton, Hampshire, SO14 3ZH, UK Phone: (0044) 2380-596487 E-mail: [email protected] Armstrong, Edward Jet Propulsion Laboratory/California Institute of Technology 300/323 4800 Oak Grove Dr., Pasadena, California, United States Phone: 818 354 6980 Fax: 818 393 6720 E-mail: [email protected] Wick, Gary A. NOAA Environmental Technology Laboratory R/ET6 325 Broadway Boulder, CO 80305 USA Phone:+1 303-497-6322 Fax:+1 303-497-6181 E-mail:[email protected] Yoshida, Takashi Japan Meteorological Agency 100-8122 Chiyoda-ku Otemachi 1-3-4 Japan Phone: 03-3212-8341 Ext.5128 fax: 03-3211-3047 E-mail: [email protected]

EUR-2nd-GHRSST-PP-workshop-report-v3.0.doc Page 86 of 88 Friday, October 11, 2002
Proceedings of the 2nd GHRSST-PP workshop
10 ANNEX II: Agenda 10.1.1 Agenda for Tuesday, 14th May 2002 Location: Harumi Island Triton Square Office Tower-X 5th floor (Meeting room #3) Time Title Leaders 08:30 Registration 09:00 Welcome and local arrangements Hiroshi Kawamura 09:15 Opening of GHRSST-PP workshop (NASDA/EORC) Mr. Matsuura 09:30 Outline of Workshop objectives and summary of the GHRSST-PP plan Craig Donlon
10:00 Session 1. The GHRSST-PP demonstration product definitions including error and confidence data.
10:05 H. Kawamura, Y. Kawai, L. Guan, K. Hosoda, M. Kachi and H. Murakami (Tohoku University, Japan): ”The new generation SST Version 1.0 (NGSSTv1)”
10:15 Y. Kawai:“NGSSTv1 treatment of SST diurnal variations ” 10:25 L.Guan: “NGSSTv1 SST merging methodology” 10:35 H. Kawamura and K. Hosoda: “Error analyses of the NGSSTv1”
Hiroshi Kawamura
10:45 Coffee break 11:00 Chelle Gentemann (RSS, USA) “Blended MW IR data algorithms”
11:20 Pierre LeBorgne (CMS/Meteo France, France): “Confidence levels and associated error characteristics in the O&SI SAF SST products"
11:40 Alice Stuart Menteth (SOC, UK): “Why the GHRSST-PP should worry about diurnal stratification”
12:00 Doug May (NAVO, USA): “NAVO SST retrieval error estimates for operational AVHRR and GOES SST retrievals”
12:20 Session 1: Discussion and conclusions
Andy Harris
12:50 Lunch in the Triton building 14:00 Session 2. Part I: Access to satellite data streams.
14:05 Ian Robinson (SOC, UK): “Is there a need for a GHRSST-PP dynamic distributed dataset (DDD)?”
14:25 Misako Kachi and Hiroshi Murakami (NASDA, Japan): “Implementation Plan for the ADEOS-II/Aqua SST generation”
14:45 Gary Wick (U. Colorado, USA): “Skin SST from NPOESS Visible and Infrared Imager Radiometer Suite”
15:05 Kenneth Casey (NOAA,USA): "Toward the development of a global 4km AVHRR SST dataset"
15:25 Session 2 Part I: Discussion and conclusions
Pierre LeBorgne
15:45 Tea break 16:00 Session 2. Part II: Access to in situ data streams.
16:20 Satoshi Sato (JODC, Japan: “IODE activities related to GHRSST-PP- Underway Sea Surface Salinity Data Pilot Project.”
16:40 Craig Donlon (EC/JRC, Italy): “Operational validation of satellite data using in situ radiometers”
17:00 Ian Barton (CSIRO, Australia: “The Miami2 in situ radiometer inter-calibration exercise and beyond “
17:20 Session 2 Part II: Discussion and conclusions
Ian Barton
17:45 Close

EUR-2nd-GHRSST-PP-workshop-report-v3.0.doc Page 87 of 88 Friday, October 11, 2002
Proceedings of the 2nd GHRSST-PP workshop
10.1.2 Agenda for Wednesday, 15th May 2002 Location: Harumi Island Triton Square Office Tower-X 5th floor (Meeting room #3) Time Title Leaders
08:30 Session 3. Part I: To review, prioritize and formulate the GHRSST-PP Implementation plan
08:35 Craig Donlon (EC/JRC, Italy) “Overview of the initial GHRSST-PP implementation plan”
08:55 Andy Harris (NOAA/NESDIS, USA): "The role of the GHRSST-PP in NOAA/NESDIS"
09:15 Hiroshi Kawamura (EORC/NASDA, Japan) “An implementation plan for global new generation SST data products”
09:35 Olivier Arino (ESA, Italy): “MEDSPIRATION : an ESA initiative in response to GODAE GHRSST-PP”
09:55 Toshiyuki Sakurai (JMA, Japan) “Plan of new SST implementation” 10:15 Gary wick (NOAA, USA): “SST merging strategies” 10:35 Session 3 Part I: Discussion and conclusions
Ian Robinson
11:05 Coffee break
11:20 Session 3. Part II: Formalize relationship and commitments to GODAE and other associated projects
11:25 Bill Rossow (NASA, USA): “The GEWEX projects of most relevance to the GHRSST-PP: the Surface Radiation Budget project (SRB), the precipitation project (GPCP) and the SeaFlux activity.”
11:45 Naoto Matsuura (NASDA, Japan) “ADEOS-II and Aqua/AMSR-E”
12:05 Nick Rayner: (Hadley Centre, UK) and Richard W Reynolds (NCDC, USA): “Climate Requirements for SST data sets: the AOPC/OOPC SST and Sea Ice Working Group”
12:25 Session 3 Part II: Discussion and conclusions
Nick Rayner
12:50 Lunch in the Triton building.
14:00 Session 3. Part III: To define and formalize the GHRSST-PP demonstration infrastructure
14:05 Hiroshi Kawamura and Haruhiko Kawasaki (NASDA, Japan): “NASDA server for GHRSST-PP”
14:25 Jim Cummings (US Navy): “The status of the VOD Hub and DODS/LAS + the US-GODAE Monterrey server and the GHRSST-PP”
14:45 Craig Donlon and Simon Pinnock (EC/JRC, Italy): “The GHRSST-PP diagnostic data set: initial experience”
15:05 Jorge Vasquez (JPL, USA): “The Physical Oceanography Distributed Active Archive Center (PO.DAAC)”
15:25 Session 3 Part III: Discussion and conclusions
Jim Cummings
15:45 Tea break 16:00 Session 3. Part IV: Identify metrics for the GHRSST-PP 17:00 Session 3 Part IV: Discussion and conclusions Andy Harris
17:30 Close

EUR-2nd-GHRSST-PP-workshop-report-v3.0.doc Page 88 of 88 Friday, October 11, 2002
Proceedings of the 2nd GHRSST-PP workshop
10.1.3 Agenda for Thursday, 16th May 2002 Location: Harumi Island Triton Square Office Tower-X 5th floor (Meeting room #3) Time Title Leaders 09:00 Session 4.Part I: Estimate the budget requirements of the GHRSST-PP 10:00 Session 4 Part I: Discussion and conclusions Ian Barton
10:30 Coffee break
11:00 Session 4. Part II: Identify the funding sources and mechanisms available to the GHRSST-PP
12:00 Session 4 Part II: Discussion and conclusions Ian Robinson
12:30 Lunch in the Triton building 14:00 Summary and conclusions from each session 15:00 Discussion: Removing the barriers to the implementation of the GHRSST-PP Craig Donlon
15:45 Tea break 16:00 Actions and task assignment
17:00 GHRSST-PP ESA-AO submission, Science team membership, GHRSST-PP Biarritz presentation, dates and place of next meeting, AOB.
Craig Donlon
17:30 Close