Proceedings from the 2nd Annual TLE TeachLivE TM Conference ...
87
2014 The Second National TLE TeachLivE TM Conference May, 2014, Orlando, FL University of Central Florida Carrie Straub, Ph.D. Lisa Dieker, Ph.D. Michael Hynes, Ph.D. Charles Hughes, Ph.D Proceedings from Ludic Convergence
Transcript of Proceedings from the 2nd Annual TLE TeachLivE TM Conference ...
2014
The Second National TLE TeachLivETM
Conference May, 2014, Orlando, FL University of Central Florida Carrie Straub, Ph.D. Lisa Dieker, Ph.D. Michael Hynes, Ph.D. Charles Hughes, Ph.D
Proceedings from Ludic Convergence
TABLE OF CONTENTS
Second Annual TeachLivE Conference Proceedings 3
TeachLivE for Instructional Coaches: Uses and Takeaways from District and Trainer Perspectives Cherie Behrens and Janice Franceschi Introduction 3 Implementation Procedures and Results 3
How TeachLivE is Helping Kennedy Krieger Build Model Classrooms Linda Brandenburg, Claire Donehower, Deidre Rabuck Abstract 6 Introduction 6 Methods 7 Results 7 Discussion 9
M. Ed. in Educational Leadership Practice & Coaching in TeachLivE: Preliminary Findings Hilary Buckridge and Rosemarye Taylor Introduction 11 Purpose of the Study 11 Procedures 12 Data Analysis 12 Next Steps 13
The Influence of TeachLivE on Anxiety Levels in Preservice and Inservice Mathematics Teachers Heidi Eisenreich and Katie Harshman Abstract 15 Review of the Literature 15 Statement of the Problem and Purpose of the Study 16 Method 16
Measuring Social Presence and Impact of Social Presence in TeachLivE: Ludic Convergence
Aleshia Hayes 20
English Learner (EL) Avatars for Pre‐Service Teachers Michele Regalla, Joyce Nutta, Cynthia Hutchinson, Pam Jones, Nooshan Ashtari, Karen Verkler Introduction 24 Steps and Facilitation 25 The Courses: TSL 4080 and EDG 4410 26 Procedures 26 Coaching Strategies 27 Coaching Takeaways 27
1
Comparison of Feedback Methods for Pre‐Service Teachers Delivering Mathematics Lessons in the TeachLivE Lab Jacqueline Rodriguez Abstract 29 Background 29 Research Questions 30 Method 30 Results 31 Discussion 32 Overall Impact 32
A Comparison of Virtual Learning Environments on the Social Responses for Children with Autism Eleazar Vasquez III, Carrie Straub, Arjun Nagendran, Matthew Todd Marino, Gregory Welch, Charlie Hughes, Morgan Russell, Aaron Koch, Lauren Delisio, Athira Alias, Melissa Paz, Kelly Schaffer, Jessica Silva Introduction 35 Method 36 Results and Discussion 36
Dissertations
Examining Potential Teacher Bias of Hispanic Males with Emotional Disturbances in Virtual Settings Angel Lopez, Jr.
Individualized Clinical Coaching in an Interactive Virtual Reality to Increase Fidelity of Implementation of Discrete Trial Teaching Vince Garland
Title Walker (via Vasquez)
Other Research: PVA study ...
Technical Report Year 1 Results Abstract Using Virtual Rehearsal in TLE TeachLivE™ Mixed Reality Classroom Simulator
to Determine the Effects on the Performance of Mathematics Teachers Virtual Reality Desktop Simulations Method Results Discussion
2
TeachLivE for Instructional Coaches: Uses and Takeaways from District and Trainer Perspectives
Cherie Behrens University of Central Florida
Janice C. Franceschi The School District of Osceola County,
Florida
Introduction
Guiding research indicates that for instructional coaches to positively affect the teaching practices of teachers, coaches need professional development to ensure they are more knowledgeable and skilled than the teachers they are coaching (Dole, 2004; Marsh et al., 2008). Thus, Janice Franceschi, the Director of Professional Development, and Assistant Superintendent Lissette Brizendine, of the School District of Osceola County, met to discuss the kind of professional development desired based on the results of their district coaches' needs assessment and national, federal, Race to the Top, state and district priorities. Priority examples entail the Learning Forward Standards and Florida's State Board of Education Strategic Plan Goals, which include concentrated efforts in promoting student achievement and long-term success. Considering that a growing body of research indicates that coaches can significantly and positively impact student achievement through the teachers they coach, Franceschi and Brizendine began planning tailored professional development based on the outlined needs (Bean et al., 2010). They consulted Cherie Behrens, a University of Central Florida lecturer with a history of impacting student success at district and state levels. Cherie's work drew upon her creation of the first state-approved, graduate-level, instructional coaching course combined with her coaching experiences to develop a several-day, needs-tailored, Instructional Coaching Series.
The three full-day, train-the-trainer professional development offerings were held for district coaches this academic year on February tenth, March tenth and April seventh from 8:30 am to 3:30 pm each day; however, a few site-based coaches also attended to take advantage of extra space available. In order for the attending coaches to receive in-service points, they were required to attend all three training days and develop an implementation plan. The format of the trainings were whole group, small group, and one-on-one, with differentiated instruction provided based on in-the-moment formative assessment measures.
A major component of the Instructional Coaching Series involved the use of an innovative, Bill & Melinda Gates-funded technology called TLE TeachLivE™ (TeachLivE). TeachLivE was the most impactful technology utilized during the sessions according to data collected from the coaches. TeachLivE is a classroom simulator used to better train educators. The TeachLivE simulator is populated with specifically designed avatars that interact with educators. Using differentiated learning techniques and a formative assessment feedback model, TeachLivE provides each user or user groups with a different experience that changes based on the actions of the educator(s) in the simulation.
Implementation Procedures and Results
For every instructional coaching session, TeachLivE provided coaches with a center to further hone their abilities coaching a resistant teacher (an area in which school-based coaches, in a December 2013 survey, reported to struggle), practicing what was learned in the sessions,
3
utilizing "look for" documents for further coaching conversations and more in an unpredictable but realistic way, using a mixed-reality environment. Research suggests that effective coaches must provide a specialized kind of feedback to teachers, feedback that involves non-judgmental and reflection-inducing comments or questions based on data collected watching a teacher teach and listening to the comments a teacher makes (Knight, 2011). This specialized feedback, referred to as "coaching feedback", aims to cause and promote teacher reflection; evoke positive changes in teaching behaviors, pedagogical and content knowledge; and impact overall teaching practices. Thus, time in TeachLivE enabled teachers to strengthen their coaching feedback skills and overall coaching abilities.
Formative data collected after the first session in TeachLivE demonstrated that many of the coaches needed more practice coaching a resistant teacher. So, instead of choosing a different simulation in TeachLivE for the next session, coaches received another opportunity to practice coaching the resistant teacher with more supportive measures, including a model by Cherie on how to coach the resistant teacher using the language templates the coaches were given and encouraged to use. This kind of flexibility allowed the group to better meet its mastery goals. After Cherie modeled coaching, the entire group talked about the session and Cherie gave them more resources about success with resistant teachers. After the coaches had opportunities to coach the resistant teacher, Cherie alone or with the coach's PLC (if they were comfortable with the group watching) would provide feedback and coach the participant to stronger coaching. Here are data from coaches about this particular experience: "TeachLivE—got so much more this time around! Loved the model coaching done at the beginning and the coaching at the end. Very reflective. Cherie's comments were very helpful and useful”—Debbie; "Great experience, must utilize more coaching language, it's a great experience”—no name; "Being in the hot seat was a challenge, but what challenges you grows you! The feedback was immediate and valuable and I am so glad that I had the opportunity to practice. Having my peers in there with me also was encouraging and I believe we all learned in this process”—Joyce.
A snapshot of the TeachLivE center activities over the course of the Instructional Coaching Series:
Day One: Coaches used their resources (including articles that provided guidance for successful coaching with resistant teachers), plus coaching language stems, to coach a resistant teacher* named Ms. Adkins in TeachLivE. Ms. Adkins used the identical language reported by coaches in the December 2013 survey to replicate, as closely as possible, what coaches are hearing at schools from resistant teachers. Cherie also drew upon her experiences to inform Ms. Adkins’ language, in order to enable what philosopher Samuel Taylor Coleridge refers to as "a suspension of disbelief."
*Resistant teachers may resist change, coaching, school initiatives, etc.
Day Two: Cherie modeled coaching Ms. Adkins, the resistant teacher, in the whole group meeting first and then, in rotations, coaches individually coached Ms. Adkins while Cherie observed. Afterwards, Cherie provided feedback to optimize their coaching alone or with additional input from the individual's Professional Learning Community (PLC) who watched the coaching occur.
4
Day Three: The coaches watched Cherie act as a struggling teacher and marked observations on a “look-for” document to have data-focused coaching conversations later on. Afterwards, Cherie and the instructional coaches discussed how to coach the teacher, triage the teacher’s needs so as to not overwhelm the teacher, etc. In their following center, the instructional coaches role-played with each other as if they were coaching the struggling teacher, Cherie, they had observed in TeachLivE.
Overall, TeachLivE enabled coaches with opportunities to practice and strengthen their coaching skills in closely realistic settings. Thus, TeachLivE was an excellent pairing for this professional development series. After receiving such positive results using TeachLivE, the School District of Osceola County became a partner with TeachLivE and have since installed TeachLivE at their professional development headquarters for further use.
References
Bean, R.M., Draper, J.A., Hall, V., Vandermolen, J., & Zigmond, N. (2010). Coaches and coaching in Reading First schools: A reality check. The Elementary School Journal, 111(1), 87–114.
Dole, J.A. (2004). The changing role of the reading specialist in school reform. The Reading Teacher, 57(5), 462–471.
Knight, J. (2010). Unmistakable impact: A partnership approach for dramatically improving instruction. Corwin Press.
Marsh, J.A., McCombs, J., Lockwood, J.R., Martorell, F., Gershwin, D., Naftel, S., & Rand, E. (2008). Florida’s middle school reading coaches: What do they do? Are they effective? Research brief. RAND Corporation.
Citation:
Behrens, C., & Franceschi, J. (2014, May). TeachLivE for instructional coaches: Uses and takeaways from district and trainer perspectives. In Straub, C., Dieker, L., Hynes, M., & Hughes, C. (2014). Proceedings from Ludic Convergence: The Second National TLE TeachLivE™ Conference. Orlando, FL: University of Central Florida.
5
How TeachLivE is Helping Kennedy Krieger Build Model Classrooms
Linda Brandenburg Claire Donehower Deidre Rabuck Kennedy Krieger Institute
Abstract
Kennedy Krieger School Programs are part of the Special Education department of Kennedy Krieger Institute, a research and rehabilitation hospital affiliated with Johns Hopkins Medical Institutions in Baltimore, Maryland. The school programs include a K-8 program, a high school program, and two specialized programs for students with autism spectrum disorders (ASD). The Kennedy Krieger School Programs began implementing the Model Classroom Program to accomplish two goals: first, to assess a teacher’s implementation of best practices in the classroom, providing individualized professional development through ongoing feedback and coaching in the areas collaboratively targeted by the teacher and the coach for improvement; second, to evaluate the aggregate of individual teacher performance in order to better determine the need for programmatic initiatives in the school. Ongoing professional development is essential for keeping educators informed and helping them feel confident as they gain experience in the classroom. The goal of this project was to add TeachLivE to the coaching component of the Model Classroom Program. Providing teachers with the opportunity to practice target behaviors in the mixed-reality simulator, receive immediate coaching and feedback, and then practice again within the same lab session, proved to be a valuable tool in facilitating their acquisition of the target behaviors.
Introduction: Context, Research Problem, Review of Literature
There are several core concepts or beliefs that support the implementation of the Model Classroom Program. These include the belief that teacher effectiveness is the key to positive outcomes for students, and that the variables used to identify teacher effectiveness must be clearly defined. Additionally, teacher effectiveness continually improves in quality with supervision, evaluation, and ongoing communication and feedback to assess the effectiveness of the interventions through coaching (Fixen et al., 2005). Such a program of improvement of teacher effectiveness will be labor-intensive, requiring real commitment from the teachers involved, the coaches, supervisors and administrators (Reinke, Lewis-Palmer, & Merrell, 2008).
The Model Classroom is composed of elements that lead to student success in learning. The environment for effective instruction must be structured with a physical setup that keeps the students engaged and comfortable, and provide a comprehensive, understandable schedule, with visual supports as needed (McGill et al., 2003). Lesson planning must relate to meaningful curriculum, and lessons must be delivered by a well-managed staff and with appropriate collaboration with paraeducators and related service providers. Effective teacher behaviors align with effective classroom and behavior management, and include the use of an ongoing data collection system with clearly identified targets to be evaluated (Espin & Yell, 1994).
In order for research-based practices to be successfully implemented into classroom settings, the components of implementation science must be present: exploration, installation, initial implementation, full implementation (Odom, Cox, & Brock, 2013). The smooth flow of teacher behaviors is essential, and the coaching model (i.e., installation and implementation) provides the teacher with an assessment as well as feedback about their ability to implement best
6
practices. Using a repeated, structured measure to evaluate the teacher, the program includes individualizing target interventions and striking a balance between the fidelity of implementation and the flexibility needed for each teacher, students, and classroom environment. The feedback is ongoing and progress is monitored continuously, with appropriate reinforcement or reward provided to the teachers as they demonstrate success in implementing the program.
The goal of this project was to utilize the TeachLivE lab to allow teachers to practice some of the target behaviors identified in the Model Classroom Program. Target behaviors included: opportunities to respond (Sutherland & Wehby, 2001), error correction (Barbetta, Heron, & Heward, 1993), and praise rates (Cameron & Pierce, 1994), including the ratio of specific to general praise (Musti-Rao & Haydon, 2011). Teachers were observed in their classrooms, given feedback and coaching, participated in scheduled lab time for teaching the avatars, got immediate feedback from the coach, and then had the opportunity to teach again within the same lab session.
Methods
Fifteen teachers were selected from our four school programs to participate in TeachLivE lab sessions. The teachers had a range of teaching experience from one year to 10 plus years in the classroom. During each session, two to three teachers and at least one coach (e.g., administrator, supervisor, etc.) were present. The participating teachers were provided with a lesson plan and lesson materials prior to the TeachLivE session. Teachers who were new to the lab were given a brief demonstration of how to interact with the students and move around the classroom. The format of the sessions was consistent from one session to the next.
1. Teacher 1 would teach for five to seven minutes.2. Teacher 1 would receive feedback from coaches and other teachers.3. Teacher 2 would teach for five to seven minutes.4. Teacher 2 would receive feedback from coaches and other teachers.5. Teacher 3 (if applicable) would teach for five to seven minutes.6. Teacher 3 (if applicable) would receive feedback from coaches and other teachers.7. Each teacher would have a chance to apply the feedback and teach a second time followed
by brief feedback from coaches and other teachers.
During each teaching trial, quantitative data was collected on the teacher’s pacing(providing students with opportunities to respond), praise rates, praise specificity, and error correction. Qualitative data was collected on other teaching variables (e.g., content knowledge, building rapport with students, managing off task behavior, etc.). For many teachers, this data was collected in their classroom prior to the lab session(s) and following the lab session(s) to determine whether or not the target behaviors were generalized into the classroom environment.
Results
In general, there were positive results both within the TeachLivE sessions (between teaching trials) and from TeachLivE into the classroom. The examples below illustrate some of the positive results from the first year of this partnership.
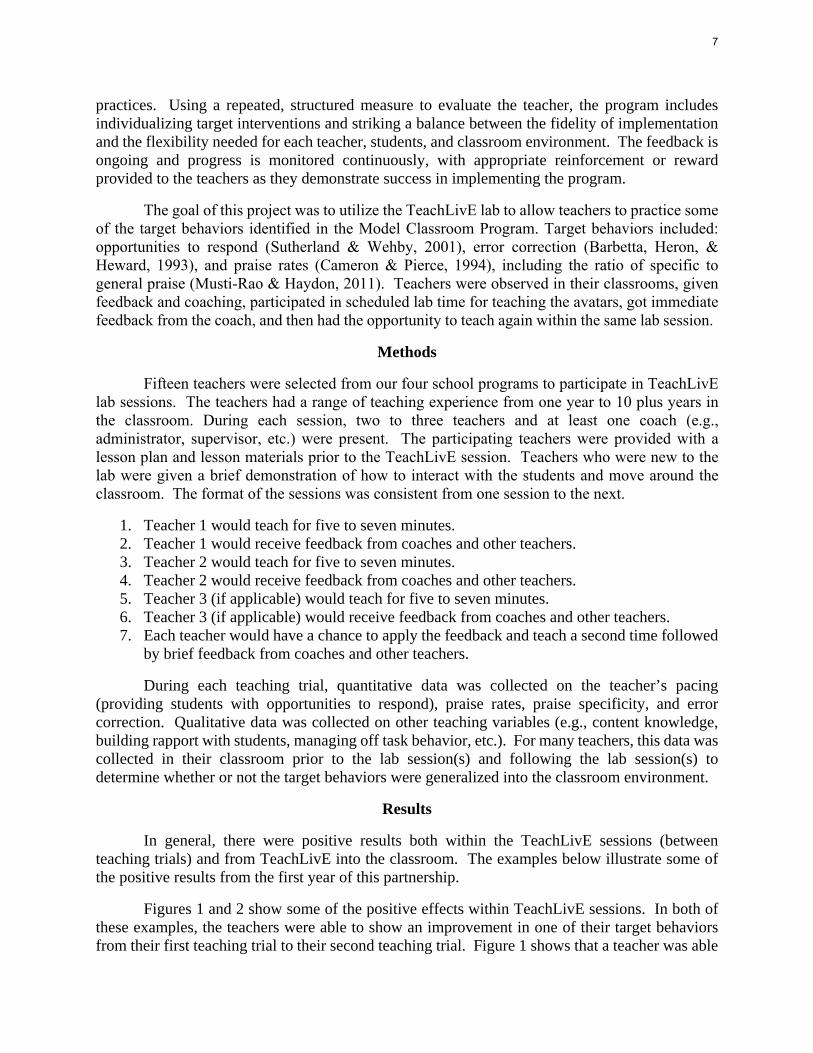
Figures 1 and 2 show some of the positive effects within TeachLivE sessions. In both of these examples, the teachers were able to show an improvement in one of their target behaviors from their first teaching trial to their second teaching trial. Figure 1 shows that a teacher was able
7
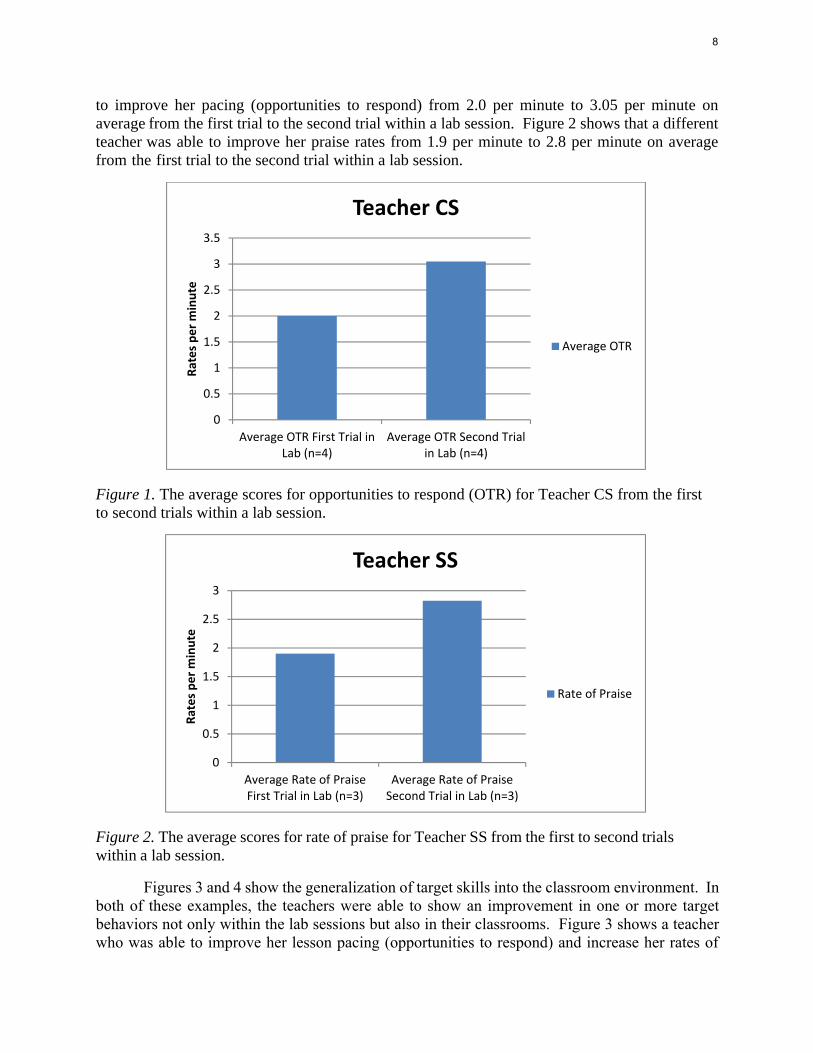
to improve her pacing (opportunities to respond) from 2.0 per minute to 3.05 per minute on average from the first trial to the second trial within a lab session. Figure 2 shows that a different teacher was able to improve her praise rates from 1.9 per minute to 2.8 per minute on average from the first trial to the second trial within a lab session.
Figure 1. The average scores for opportunities to respond (OTR) for Teacher CS from the first to second trials within a lab session.
Figure 2. The average scores for rate of praise for Teacher SS from the first to second trials within a lab session.
Figures 3 and 4 show the generalization of target skills into the classroom environment. In both of these examples, the teachers were able to show an improvement in one or more target behaviors not only within the lab sessions but also in their classrooms. Figure 3 shows a teacher who was able to improve her lesson pacing (opportunities to respond) and increase her rates of
0
0.5
1
1.5
2
2.5
3
3.5
Average OTR First Trial inLab (n=4)
Average OTR Second Trialin Lab (n=4)
Rates per minute
Teacher CS
Average OTR
0
0.5
1
1.5
2
2.5
3
Average Rate of PraiseFirst Trial in Lab (n=3)
Average Rate of PraiseSecond Trial in Lab (n=3)
Rates per minute
Teacher SS
Rate of Praise
8
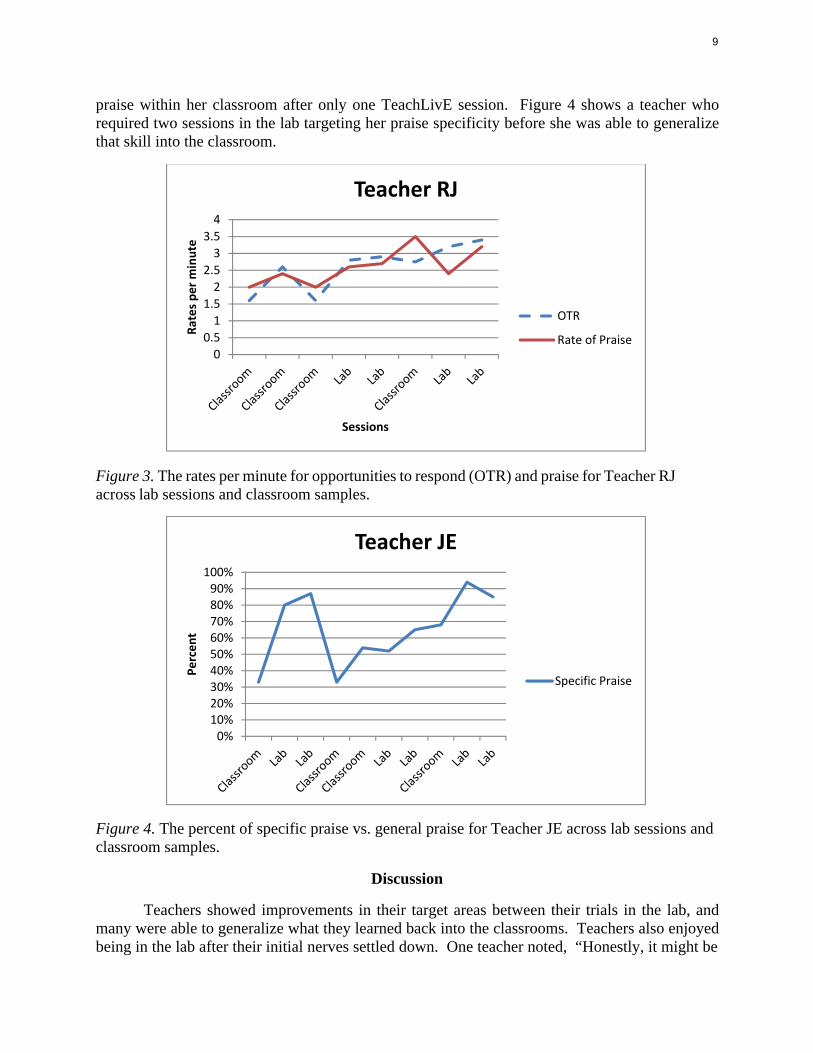
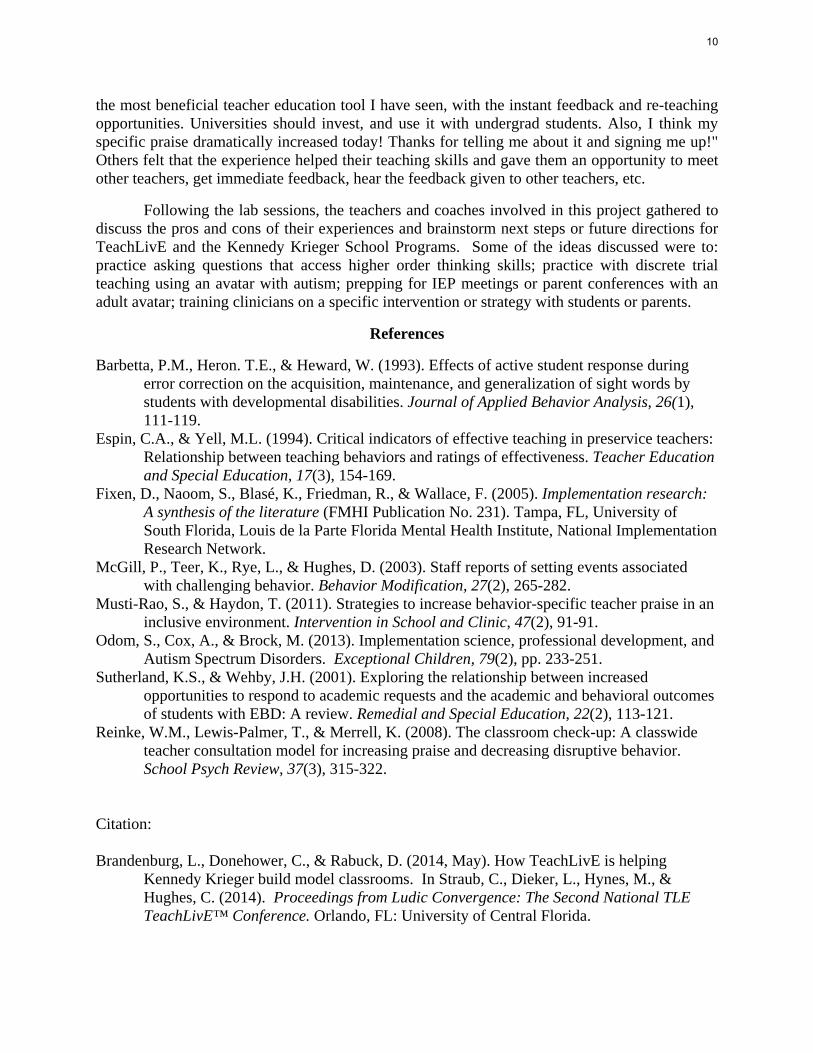
praise within her classroom after only one TeachLivE session. Figure 4 shows a teacher who required two sessions in the lab targeting her praise specificity before she was able to generalize that skill into the classroom.
Figure 3. The rates per minute for opportunities to respond (OTR) and praise for Teacher RJ across lab sessions and classroom samples.
Figure 4. The percent of specific praise vs. general praise for Teacher JE across lab sessions and classroom samples.
Discussion
Teachers showed improvements in their target areas between their trials in the lab, and many were able to generalize what they learned back into the classrooms. Teachers also enjoyed being in the lab after their initial nerves settled down. One teacher noted, “Honestly, it might be
0
0.5
1
1.5
2
2.5
3
3.5
4
Rates per minute
Sessions
Teacher RJ
OTR
Rate of Praise
0%10%20%30%40%50%60%70%80%90%
100%
Percent
Teacher JE
Specific Praise
9
the most beneficial teacher education tool I have seen, with the instant feedback and re-teaching opportunities. Universities should invest, and use it with undergrad students. Also, I think my specific praise dramatically increased today! Thanks for telling me about it and signing me up!" Others felt that the experience helped their teaching skills and gave them an opportunity to meet other teachers, get immediate feedback, hear the feedback given to other teachers, etc.
Following the lab sessions, the teachers and coaches involved in this project gathered to discuss the pros and cons of their experiences and brainstorm next steps or future directions for TeachLivE and the Kennedy Krieger School Programs. Some of the ideas discussed were to: practice asking questions that access higher order thinking skills; practice with discrete trial teaching using an avatar with autism; prepping for IEP meetings or parent conferences with an adult avatar; training clinicians on a specific intervention or strategy with students or parents.
References
Barbetta, P.M., Heron. T.E., & Heward, W. (1993). Effects of active student response during error correction on the acquisition, maintenance, and generalization of sight words by students with developmental disabilities. Journal of Applied Behavior Analysis, 26(1), 111-119.
Espin, C.A., & Yell, M.L. (1994). Critical indicators of effective teaching in preservice teachers: Relationship between teaching behaviors and ratings of effectiveness. Teacher Education and Special Education, 17(3), 154-169.
Fixen, D., Naoom, S., Blasé, K., Friedman, R., & Wallace, F. (2005). Implementation research: A synthesis of the literature (FMHI Publication No. 231). Tampa, FL, University of South Florida, Louis de la Parte Florida Mental Health Institute, National Implementation Research Network.
McGill, P., Teer, K., Rye, L., & Hughes, D. (2003). Staff reports of setting events associated with challenging behavior. Behavior Modification, 27(2), 265-282.
Musti-Rao, S., & Haydon, T. (2011). Strategies to increase behavior-specific teacher praise in an inclusive environment. Intervention in School and Clinic, 47(2), 91-91.
Odom, S., Cox, A., & Brock, M. (2013). Implementation science, professional development, and Autism Spectrum Disorders. Exceptional Children, 79(2), pp. 233-251.
Sutherland, K.S., & Wehby, J.H. (2001). Exploring the relationship between increased opportunities to respond to academic requests and the academic and behavioral outcomes of students with EBD: A review. Remedial and Special Education, 22(2), 113-121.
Reinke, W.M., Lewis-Palmer, T., & Merrell, K. (2008). The classroom check-up: A classwide teacher consultation model for increasing praise and decreasing disruptive behavior. School Psych Review, 37(3), 315-322.
Citation:
Brandenburg, L., Donehower, C., & Rabuck, D. (2014, May). How TeachLivE is helping Kennedy Krieger build model classrooms. In Straub, C., Dieker, L., Hynes, M., & Hughes, C. (2014). Proceedings from Ludic Convergence: The Second National TLE TeachLivE™ Conference. Orlando, FL: University of Central Florida.
10
M. Ed. in Educational Leadership Practice & Coaching in TeachLivE: Preliminary Findings
Hilary Buckridge Orange County Public Schools, Florida
Rosemarye Taylor University of Central Florida
Introduction
Utilizing multimedia methods and virtual environments are now part of educational preparation programs for surgical medical programs, flight simulators, and military combat training situations, and believed by researchers to become a part of the educator preparation programs, meeting the needs of the Generation M population in academic settings (Dieker et al., 2012). TeachLivE virtual education simulation technology, originally designed for teacher education simulation with student-avatars, has expanded to include educational leadership simulations utilizing adult parent and teacher avatars.
The M. Ed. in Educational Leadership at the University of Central Florida began incorporating the mixed reality resource of TeachLivE during the fall semester of 2013. Two experiences are provided. One is a parent conference and one is a post-observation conference with a teacher. Educational Leadership master’s degree students need preparation and practice with feedback in communicating with parents and in providing post-observation feedback to teachers in an administrative capacity before entering the administrative internship. By maximizing mixed reality technology of TeachLivE with side-by-side coaching, practice situations of administrative-level parent conferencing and teacher conferencing are available. Feedback from this practice is intended to scaffold students to the administrative internship experience. This power of the sequencing of instruction through scaffolding is the guided and independent practice model, using realistic scenarios and simulation practice with students (Taylor, 2010).
Purpose of the Study
The purpose of the study is to ascertain the effectiveness of mixed reality experiences using TeachLivE for students in the M. Ed. program in Educational Leadership. The use of avatars and virtual teaching provides authentic practice where mistakes are not impacting real students, and through reflective practice, feedback and coaching, novice educators can deepen their practice (Dieker et al., 2008).
The second purpose is to determine the perceived value of the coaching feedback received immediately following the mixed reality experiences and if the experiences were perceived to be valuable later in the M. Ed. program after completion of the administrative internship. Leadership through coaching in Hersey’s situational leadership model as cited by Bolman and Deal (2008) is effective in high relationship and high task situations where the followers are willing and motivated to learn.
Research questions addressed in these proceedings follow.
1. To what extent do Educational Leadership M. Ed. students believe the TeachLivE parentconference and teacher post observation conference simulation experiences to be helpfulin developing their communications skills with parents and teachers?
11
2. To what extent do Educational Leadership M. Ed. students believe the post observationfeedback was helpful in developing their communications skills with parents and teachers?
Procedures
Scenarios are written in which the interactor (who directs the avatars) and the students have reviewed in preparation for the experiences. For each of the two experiences, students receive immediate coaching from an expert who gives supportive but direct feedback on the experience. Students then write a reflection on the experience and submit to their instructor. Coaching is a shaping of behavior by observing performance, offering guidance, and recommending specific practice to emphasize (Owens & Valesky, 2011).
The researcher is collecting qualitative data documenting students’ perception of the value of the TeachLivE experience and the coaching feedback to provide authentic virtual rehearsals as a future school administrator in the two experiences: communicating with parents and teachers through conferencing. Reflections on the experience will also be analyzed for themes and commonalities in 2015 and are not addressed in these proceedings.
Data collection began in the fall semester 2013 with the M. Ed. Educational Leadership students enrolled in the face-to-face courses only, coinciding with the Supervision and Parent & Community coursework. The mixed reality experience is part of the scaffolded instruction process taking theoretical research based knowledge, and providing specific targeted skills practice before entering into live situations during the internship. Students receive an orientation to the TeachLivE experience during class, and are provided a copy of each of the four possible scenarios. Students sign up in pairs for 30-minute blocks in the simulation lab. Each student receives 10 minutes of TeachLivE interaction time followed by 5 minutes of immediate coaching. Next, the student observes in the partner’s session.
Faculty and/or an expert coach provide just-in-time feedback/coaching at the conclusion of the 10-minute interaction. This practice aligns with the review of over 8,000 studies led by Hattie (1992) as cited in Marzano (2003) to indicate that the most powerful single modification that enhances student performance and deep learning is feedback. To be most impactful, feedback must have two characteristics; it must be timely and specific (Marzano 2003); these characteristics are employed with these students.
After completion of a two-semester administrative internship, and practice with teachers and parents, the M. Ed. Educational Leadership students will complete an exit survey. Two items related to the impact of TeachLivE have been added and results will be analyzed.
Data Analysis
Initial data was gathered from the fall semester of 2013 Supervision course, Post Teacher Observation Conference N=13 and the spring semester of 2014 Community and School course, Parent Conference N=17. The feedback form had five items with a Likert scale with values from one to five with five being the most positive. The items relate to how beneficial the experience was, whether the experience should be continued in the M. Ed. Program, perception of improving speaking confidence, helpfulness of immediate feedback, and the extent to which the experience was realistic. An open-ended item was also completed but is not a part of this preliminary analysis.
12
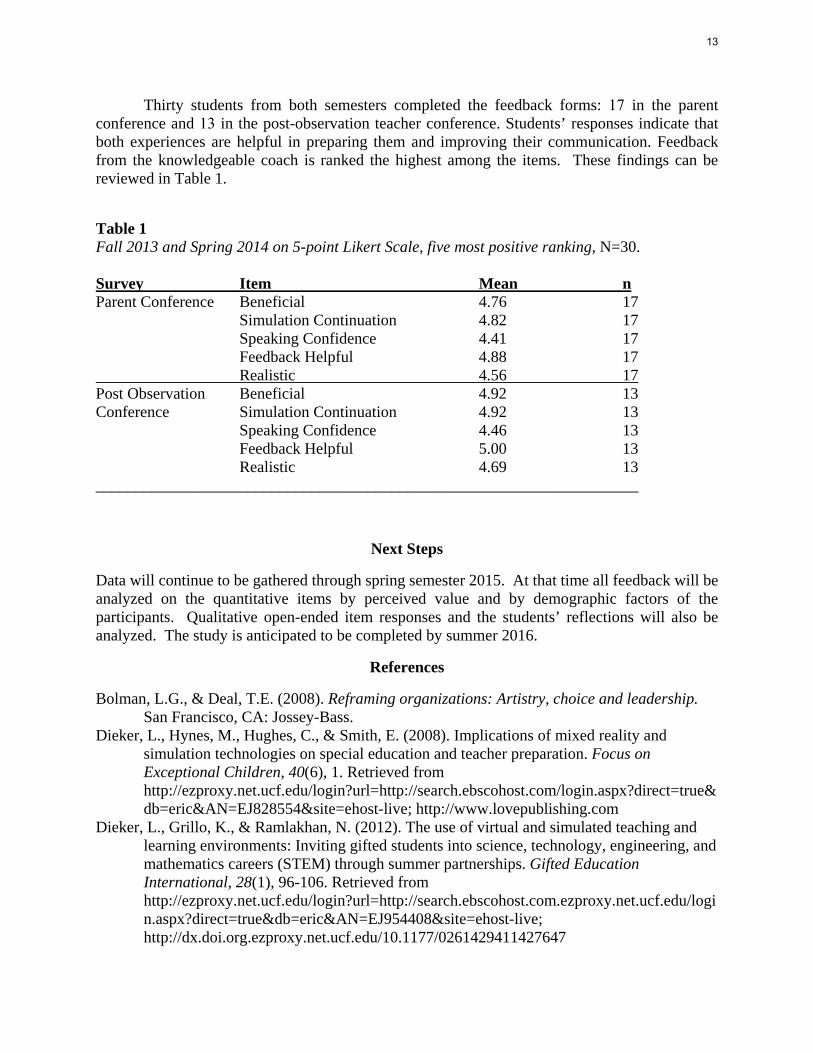
Thirty students from both semesters completed the feedback forms: 17 in the parent conference and 13 in the post-observation teacher conference. Students’ responses indicate that both experiences are helpful in preparing them and improving their communication. Feedback from the knowledgeable coach is ranked the highest among the items. These findings can be reviewed in Table 1.
Table 1 Fall 2013 and Spring 2014 on 5-point Likert Scale, five most positive ranking, N=30.
Survey Item Mean n Parent Conference Beneficial 4.76 17
Simulation Continuation 4.82 17 Speaking Confidence 4.41 17 Feedback Helpful 4.88 17 Realistic 4.56 17
Post Observation Beneficial 4.92 13 Conference Simulation Continuation 4.92 13
Speaking Confidence 4.46 13 Feedback Helpful 5.00 13 Realistic 4.69 13
____________________________________________________________________
Next Steps
Data will continue to be gathered through spring semester 2015. At that time all feedback will be analyzed on the quantitative items by perceived value and by demographic factors of the participants. Qualitative open-ended item responses and the students’ reflections will also be analyzed. The study is anticipated to be completed by summer 2016.
References
Bolman, L.G., & Deal, T.E. (2008). Reframing organizations: Artistry, choice and leadership. San Francisco, CA: Jossey-Bass.
Dieker, L., Hynes, M., Hughes, C., & Smith, E. (2008). Implications of mixed reality and simulation technologies on special education and teacher preparation. Focus on Exceptional Children, 40(6), 1. Retrieved from http://ezproxy.net.ucf.edu/login?url=http://search.ebscohost.com/login.aspx?direct=true& db=eric&AN=EJ828554&site=ehost-live; http://www.lovepublishing.com
Dieker, L., Grillo, K., & Ramlakhan, N. (2012). The use of virtual and simulated teaching and learning environments: Inviting gifted students into science, technology, engineering, and mathematics careers (STEM) through summer partnerships. Gifted Education International, 28(1), 96-106. Retrieved from http://ezproxy.net.ucf.edu/login?url=http://search.ebscohost.com.ezproxy.net.ucf.edu/login.aspx?direct=true&db=eric&AN=EJ954408&site=ehost-live; http://dx.doi.org.ezproxy.net.ucf.edu/10.1177/0261429411427647
13
Marzano, R.J. (2003). What works in schools: translating research into action. Alexandria, VA: Association for Supervision and Curriculum Development.
Taylor, R. (2010). Leading learning change student achievement today!. Thousand Oaks, CA: Corwin.
Citation:
Buckridge, H., & Taylor, R. (2014, May). M. Ed. in educational leadership practice & coaching in TeachLivE: Preliminary findings. In Straub, C., Dieker, L., Hynes, M., & Hughes, C. (2014). Proceedings from Ludic Convergence: The Second National TLE TeachLivE™ Conference. Orlando, FL: University of Central Florida.
14
The Influence of TeachLivE on Anxiety Levels in Preservice and Inservice Mathematics Teachers
Heidi Eisenreich Katie HarshmanUniversity of Central Florida
Abstract
Doctoral students conducted a research project in Spring 2014 using a galvanic skin response device to measure anxiety levels of preservice and inservice teachers during interaction with the TeachLivE students. Preliminary results will be discussed.
Review of the Literature
School districts criticize teacher preparation programs with claims that new teachers are not prepared to enter the classroom. However, colleges and universities are not always able to place prospective teachers in internships due to accountability requirements for teachers. Virtual classroom environments could aid in teacher preparation. In these environments, pre-service teachers are able to practice playing the role of student or teacher in order to prepare to enter the classroom. Programs such as TeachLivE offer a mixed-reality experience in which teachers are able to deliver instruction and manage behavior without the worry of putting children at risk. These types of environments also offer the added benefit of immediate feedback from the instructor, and the ability to revise any issues and reteach as many times as needed.
TeachLivE, developed at the University of Central Florida, is a virtual classroom that provides pre-service and in-service teachers with an environment in which to practice their pedagogy without placing real students at risk (About TeachLivE, 2013). The participant faces a large screen and stands in front of student-avatars controlled by a specifically-trained actor in a remote location. Depending on the objectives of the experience, the actor impersonates typically developing or not typically developing students. Participants are able to present new content, review content, practice behavior management skills, practice a specific technique such as scaffolding, and perform many other daily tasks that a teacher would experience. If a teacher is not successful in a session, he or she may go back and practice repeatedly, without risking the education of a real student. A teacher may step away from the screen to face the entire class, or walk forward and lean in to interact with individual students (Andreasen & Haciomeroglu, 2009).
Doctoral students conducted an experimental study to determine the influence of TeachLivE on pre-service and in-service mathematics teachers’ anxiety levels using the Zung Anxiety Self-Assessment Scale (Zung, 1971) and a Galvanic Skin Response (GSR) device.
The Shimmer GSR is a wireless stress level-monitoring device that uses two electrodes placed on the fingers to measure the user’s skin conductance (Handri, Nomura, Kurosawa, Yajima, Ogawa, & Fukumura, 2010). The device sends data to a coordinator via wireless technology called ZigBee, and the coordinator sends data to a computer, where it can be analyzed using a variety of applications (Villarejo, Zapirain, & Zorrilla, 2012).
A major advantage of virtual classrooms is the receipt of immediate feedback. “Feedback is essential to learning, and recent research suggests that the most effective feedback is immediate rather than delayed” (Scheeler, McKinnon, & Stout, 2012, p. 77). In conventional
15
programs, interns video record lessons, submit them for review at the next class meeting, and may not receive feedback for a week or more. Virtual classrooms alone allow for immediate feedback, as the professor is typically in the room or observing via the Internet. These programs can be coupled with other technologies such as bug-in-ear, providing better teacher preparedness.
Statement of the Problem and Purpose of the Study
Colleges and universities struggle to place prospective teachers in internships due to accountability requirements for teachers. The literature supports the effectiveness of virtual classrooms such as TeachLivE. The purpose of this study is to gain information regarding anxiety levels of pre-service and in-service teachers in TeachLivE—specifically, to determine if anxiety levels decrease with extended time in TeachLivE according to the GSR device, and if the post scores from the student-responded anxiety survey instrument vary among students who play video games at different levels (never, rarely, sometimes, and frequently). Since the research on TeachLivE is limited, we will be adding to a small pool of articles on TeachLivE. The majority of articles surrounding TeachLivE focus on the inner workings of the system. The few research studies obtained utilized TeachLivE in special education and teacher preparation. As this is a first experiment, there are no previous findings. However, researchers expect to find anxiety levels decrease after pre-service and in-service teachers interact with TeachLivE student-avatars.
Method
Research Questions
1. Do anxiety levels decrease with extended time in TeachLivE according to the GSR device?2. Do the post scores from the student-responded anxiety survey instrument vary among
students who play video games at different levels (never, rarely, sometimes, andfrequently)?
Research Design
This study utilizes a one-group pretest-posttest quasi-experimental research design (Gall, Gall, & Borg, 2007) with volunteer participants. Before collecting data, the researchers obtained approval from the institutional review board (IRB), and requested permission from course leaders to use their students. After discussing the research study, ourse leaders decided to allow students to replace one assignment with participation in our research. The researchers then went to the classes to discuss the research study with the pre-service and in-service teachers, explained confidentiality, and made it clear that participants could opt out of the study at any time.
Population and Sampling
Researchers used convenience sampling, choosing readily available participants (Gall et al., 2007). The treatment group included 23 Mathematics Education students, 3 undergraduate and 20 graduate, enrolled in a math methods course at the University of Central Florida. Participants included 8 males and 15 females; 19 had no teaching experience prior to this school year. Participants took a pretest and posttest and were not randomly assigned. Participation was voluntary, as leaders for the methods course are doctorate-level mathematics educators at the University of Central Florida. Researchers completed this study as part of the doctoral program.
16
Data Collection Procedures
In order to determine how TeachLivE affected anxiety levels of research participants, the researchers: (i) administered a pretest; (ii) administered the treatment; (iii) administered a posttest. The pretest was administered immediately preceding the treatment. The treatment was administered immediately after the pretest, and the posttest was administered immediately after the treatment. All three steps were completed within one day.
Instrument
The instrument chosen for this study was the Zung Anxiety Self-Assessment Scale, which students completed before and after interaction in the TeachLivE simulation. Researchers added up the raw scores given by authors of the Zung Anxiety Scale with the following interpretation: below 45 = within normal range; 45-59 = minimal to moderate anxiety; 60-74 = severe anxiety; 75 and over = most extreme anxiety.
Researchers also placed a GSR device on the participants for two minutes prior to interaction in the simulation to establish a baseline. Participants then interacted with the TeachLivE students for five minutes and data was collected wirelessly via the GSR. Researchers chose the GSR Device because it “detects whether there has been an effort or a different situation from being relaxed with a success rate of 90.97%” (Villarejo et al., 2012, p. 6099).
Data Analysis/Statistical Procedures
The researchers conducted an analysis of variance (ANOVA) for repeated measures to determine whether the anxiety levels measured by the GSR decreased with extended time in the TeachLivE simulation (Gall et al., 2007). Since Mauchly’s test of Sphericity was violated, we used Greenhouse-Geisser results. It was significant at the .05 level, indicating that over time in the simulation, students’ anxiety levels decreased. Our eta squared was .416, considered a very large effect size. This indicated that the students’ anxiety levels were affected by being in the TeachLivE simulation, in particular from minute two to minute three.
Though we found no statistical significance between student-reported post anxiety scores in relation to the amount of time spent playing video games, we did notice a difference in the means (Never: M = 36.5, Rarely: M = 31.29, Sometimes: M = 30.25, and Frequently: M = 30.33). All anxiety scores fall within the normal range of anxiety, but the data shows students that played video games more often had lower anxiety than students who played them less often.
Limitations
A possible limitation lies in the research design. Quasi-experimental research suffers threats to internal validity such as statistical analysis, meaning posttest score differences are due to pre-existing group differences. Since the study utilized convenience and voluntary sampling, selection bias and generalization issues were possible. Another limitation was the small sample size of 23, and only 14 had useable GSR data. Further, of the 14, we were concerned with the validity of results because the GSR device may not have had time to fully dry between sessions. In the future, it would be better to have multiple devices to allow the sensors time to fully dry.
17
Pretest and posttest questions were identical, so students already knew the questions the second time around, and this could have affected their self-reported anxiety for the posttest. Bias may also exist in self-reported anxiety levels. Some students had a high anxiety level at the start of the simulation, as measured by the GSR device. Specifically, starting anxiety levels ranged from 300 to 2400. Upon completion of the treatment, final readings ranged from 199 to 1300.
Implications
Anxiety levels drop significantly from minute two (the first minute of the simulation) to minute three. This could imply that students are more anxious before the simulation, and relax once they enter and begin talking to the avatars. There are many possible explanations for this: students do not know what to expect before the simulation, and they feel more at ease once they begin speaking with the TeachLivE avatars, etc. Students who never play video games could be more anxious in the TeachLivE simulation because they are not used to simulated environments.
Future research should include repetitions of the study with different preservice teacher samples, and should also include a control group to determine the effect of the use of the GSR device. Repeated findings would give much stronger evidence of their validity and the findings would be more generalizable (Gall et al., 2007).
References
About TeachLivE. (2013). Retrieved November 15, 2013, from http://srealserver.eecs.ucf.edu/teachlive/about/about-teachlive/.
Andreasen, J. B., & Haciomeroglu, E. S. (2009). Teacher training in virtual environments. Paper presented at the Annual Meeting of the North American Chapter of the International Group for the Psychology of Mathematics Education, OMNI Hotel, Atlanta, GA. Retrieved from http://www.allacademic.com/meta/p369936_index.html
Gall, M.D., Gall, J.P., & Borg, W.R. (2006). Educational research: An introduction (8th ed.). Boston: MA: Allyn & Bacon.
Handri, S., Nomura, S., Kurosawa, Y., Yajima, K., Ogawa, N., & Fukumura, Y. (2010). User evaluation of student’s physiological response towards e-learning courses material by using GSR sensor. Proceedings of 9th IEEE/ACIS International Conference on Computer and Information Science; Yamagata, Japan.
Scheeler, M.C., McKinnon, K., & Stout, J. (2012). Effects of immediate feedback delivered via webcam and bug-in-ear technology on preservice teacher performance. Teacher Education and Special Education, 35(1), 77-90.
Villarejo, M. V., Zapirain, B. G., & Zorrilla, A. M. (2012). A stress sensor based on Galvanic Skin Response (GSR) controlled by ZigBee. Sensors, 12(5), 6075-6101.
Zung, W. W. (1971). A rating instrument for anxiety disorders. Psychosomatics, 12(6), 371-379.
Citation:
Eisenreich, H., & Harshman, K. (2014, May). The influence of TeachLivE on anxiety levels in preservice and inservice mathematics teachers. In Straub, C., Dieker, L., Hynes, M., & Hughes, C. (2014). Proceedings from Ludic Convergence: The Second National TLE TeachLivE™ Conference. Orlando, FL: University of Central Florida.
18
Measuring Social Presence and Impact of Social Presence in TeachLivE: Ludic Convergence
Aleshia Taylor Hayes University of Central Florida
Education technology is a growing multi-billion-dollar industry (Booker, 2013). Expansion of online and virtual platforms including MOOCs (e.g., Coursera and edX), Khan Academy, and Virtual School, is becoming pervasive in both urban and rural school districts (Allen & Seaman, 2013; Allen & Seaman, 2014). The research summarized in this paper is meant to examine the interpersonal connections in Virtual Learning Environments (VLEs) and is intended to inform practitioners in education as they analyze the benefits and costs of emerging platforms for education. TeachLivE is a mixed reality classroom that focuses on virtual rehearsal of interpersonal skills to mastery (Hayes, Straub, Dieker, Hynes, & Hughes, 2013; Dieker, Hughes, Rodríguez, Lingnugaris-Kraft, Hynes, & Hughes, 2014; Sawchuck, 2011).
This research has been iterated in multiple pilots and has evolved over time. This progression has culminated in establishing a need to draw a clear distinction between presence and social presence, as the focus on the learning and the experience is primarily about the social interaction. Presence, specifically physical presence, is summarized as the experience of “being there” in a virtual environment (Minsky, 1980; Sheridan, 1994; Witmer & Singer, 1998). The International Society for Presence Research has synthesized the definitions of presence to “when part or all of a person’s perception is directed toward objects, events, and/or people created by the technology, and away from objects, events, and/or people in the physical world. Note that the person’s perception is not directed toward the technology itself but the objects, events and/or people the technology creates.” Social presence, on the other hand, can be summarized as the sense of feeling connected to another consciousness, and is not necessarily contingent on physical proximity. The current research has synthesized social presence to a “sense of mutuality in which a user feels connected with another entity based on interactions that transcend the medium” (Bailenson, Aharoni, Beall, Guadagno, Dimov, & Blascovich, 2004; Burgoon & Harms, 2002; Lombard & Ditton, 2000). This is not to marginalize the research that has concluded that there is a relationship between social presence and presence, but instead to build upon it by isolating the variables that are most relevant to the topic of social learning.
This paper continues by outlining future research that can add clarity to the decisions made by educators, administrators, and policy makers. Further, the value of social presence in VLEs is being investigated. Finally, the approaches to measuring social presence are being examined. The participants of this research are practicing teachers who intend to improve their pedagogy by immersing themselves in TeachLivE virtual rehearsals of classroom teaching. This exploration of the perceptions and learning outcomes of teachers in a VLE reveals trends that should inform decisions about VLE elements that provide the greatest benefit.
Over the course of this research, presence has become a smaller construct, while social presence has emerged as the relevant construct. Much of the research highlights the importance of physical presence for learning physical tasks (Patel, Bailenson, Jung, Diankov, & Bajcsy, 2006). The literature and the pilot both suggest a symbiotic relationship among social presence, engagement, learning of social behaviors, and presence. Initially, the Witmer and Singer (1998) presence questionnaire was administered to participants teaching in both their classroom and,
19
subsequently, in TeachLivE. This revealed a transfer of learning from TeachLivE to the teacher’s actual classrooms and high ratings of presence in which participants reported feeling like they are “there” in class with the virtual students (Hayes et al., 2013).
The initial findings from pilot one supported what the developers and users of the system intuitively believed, that the participants experienced presence. This, however, induced another research question: How much presence, and what does the sense of presence actually do to learning? Further, the researcher found that the data from the presence instrument was too subjective to draw meaningful conclusions about each experience in relation to another.
Further literature review revealed that the subjectivity of presence instruments was a common contention among researchers (Bailenson et al., 2004; Biocca, Harms, & Burgoon, 2003; Slater, 2004). In “How Colorful Was Your Day,” Mel Slater stated it most directly: “[R]esearchers interested in studying the concept called presence might find a way to abandon the easy but ultimately useless employment of questionnaires, and search for a better way to capture this elusive concept…There are many responses to a VE experience— gross behavioral, eye movements, measurable physiological responses, what people say in interviews, how people respond to questionnaires. Why elevate just one of these to be the preeminent position that it now has? Is it only because it is the easiest approach to take?” (2004). This review of pilot one also highlighted the absence of the critical construct, social presence (Hayes, Hardin, & Hughes, 2013; Zhao, 2003).
The second pilot included qualitative and quantitative measures for both presence and social presence as constructs. While the learning still included the social behaviors of delivering specific praise and asking higher order questions, the participants shifted from being teachers in K12 classrooms to being aspiring college professors. One of the outcomes of this second pilot was the creation of a behavioral coding sheet that reflected empirical observation and the social presence literature. The research also revealed contradictions between behavioral measures of social presence and the self-report, in which participants who behaved as if they were engaged and connected to the virtual students reported that they did not feel connected or engaged.
The inconsistencies between the behavioral measure and the subjective measure demanded the inclusion of a more objective measure. Consistent with the literature, the objective measure that will be added to the study is physiological data, by way of participant heart rate (Meehan, Insko, Whitton, & Brooks, 2002; Meehan, Razzaque, Insko, Whitton, & Brooks, 2005). Heart rate was determined to be most appropriate for this research as it is an established measure for stress, engagement, and social presence. The behavioral measures include a tally of behaviors that literature and empirical research indicate social presence while the participant is teaching in the virtual classroom (Bailenson, Yee, Merget, & Schroeder, 2006; Serby, 2011). Similarly, the physiological measures are taken during the participants’ virtual rehearsal. Finally, the subjective measures will be the social presence instrument and the presence instrument that participants complete after the immersive experience.
The final step of this leg of the research will be to integrate physiological, behavioral, and subjective measures of presence. The intent of this synthesis will be to investigate any potential correlations between these different measures. Additional research in this area will explore the implications of physical changes to the experience of presence and social presence. This may yield analysis of the constructs’ possible mediating or moderating effects on one another as well as on learning outcomes.
20
References
Allen, E., & Seaman, J. (2014). Grade change, tracking online education in the United States. (Ed.): Sloan Consortium; Babson Survey Research Group; Pearson Foundation.
Allen, E., & Seaman, J. (2013). Changing course: Ten years of tracking online education in the United States. In S. Consortium (Ed.): Sloan Consortium; Babson Survey Research Group; Pearson Foundation.
Bailenson, J. N., Aharoni, E., Beall, A. C., Guadagno, R. E., Dimov, A., & Blascovich, J. (2004). Comparing behavioral and self-report measures of embodied agents’ social presence in immersive virtual environments. Paper presented at the Proceedings of the 7th Annual International Workshop on PRESENCE, Valencia, Spain.
Bailenson, J. N., Yee, N., Merget, D., & Schroeder, R. (2006). The effect of behavioral realism and form realism of real-time avatar faces on verbal disclosure, nonverbal disclosure, emotion recognition, and copresence in dyadic interaction. Presence: Teleoperators and Virtual Environments, 15(4), 359-372.
Biocca, F., & Harms, C. (2002). Defining and measuring social presence: Contribution to the networked minds theory and measure. Proceedings of PRESENCE, 2002.
Biocca, F., Harms, C., & Burgoon, J. K. (2003). Toward a more robust theory and measure of social presence: Review and suggested criteria. Presence: Teleoperators and Virtual Environments, 12(5), 456-480. doi: 10.1162/105474603322761270
Booker, E. (2013, January 1). Education tech investments surpassed $1 billion in 2012. InformationWeek. Retrieved from http://www.informationweek.com/software/education-tech-investments-surpassed-$1-billion-in-2012/d/d-id/1108366?
Dieker, L., Hughes, C. E., Rodríguez, J., Lingnugaris-Kraft, B., Hynes, M., & Hughes, C.E. (2014). The future of simulated environments in teacher education: Current potential and future possibilities. Teacher Education and Special Education, 37(1), 12-33.
Hayes, A., Hardin, S., & Hughes, C. E. (2013). Perceived presence’s role on learning outcomes in a mixed reality classroom of simulated students. Paper presented at the Human Comupter Interaction International, Las Vegas, Nevada.
Hayes, A.T., Straub, C.L., Dieker, L.A., Hughes, C. E., & Hynes, M.C. (2013). Ludic learning: Exploration of TLE TeachLivE and effective teacher training. Int. J. Gaming Comput. Mediat. Simul., 5(2), 20-33. doi: 10.4018/jgcms.2013040102
ISPR. (2000). The concept of presence: explication statement. International Society for Presence Research. Retrieved 6, 2013, from http://ispr.info/
Lombard, M., Ditton, T.B., Crane, D., Davis, B., Gil-Egui, G., Horvath, K., & Park, S. (2000). Measuring presence: A literature-based approach to the development of a standardized paper-and-pencil instrument. In Third International Workshop on Presence, DELFT, the Netherlands (Vol. 240).
Meehan, M., Insko, B., Whitton, M., & Brooks, F. (2002). Physiological measures of presence in stressful virtual environments. Paper presented at the SIGGRAPH '02: Proceedings of the 29th Annual Conference on Computer Graphics and Interactive Techniques, San Antonio, Texas.
Meehan, M., Razzaque, S., Insko, B., Whitton, M., & Brooks, F., Jr. (2005). Review of four studies on the use of physiological reaction as a measure of presence in stressful virtual environments. Applied Psychophysiology and Biofeedback, 30(3), 239-258. doi: 10.1007/s10484-005-6381-3
21
Minsky, M. (1980). Telepresence. Omni. Patel, K., Bailenson, J., Jung, S.-H., Diankov, R., & Bajcsy, R. (2006). The effects of fully
immersive virtual reality on the learning of physical tasks. Paper presented at the 9th International Workshop on Presence, Cleveland, Ohio.
Sawchuck, S. (2011). Virtual students are used to train teachers. Education Week. Retrieved from http://www.edweek.org/ew/articles/2011/01/05/15simulate_ep.h30.html
Serby, T. (2011). Willing suspension of disbelief: A study in online learning through simulation, and its potential for deeper learning in higher education. [Feature Article]. The Liverpool Law Review, 32(2), 181-195. doi: 10.1007/s10991-011-9095-z
Sheridan, T. B. (1994, 2-5 Oct 1994). Further musings on the psychophysics of presence. Paper presented at the Humans, Information and Technology 1994 IEEE International Conference (Vol. 2, pp. 1073-1077).
Slater, M. (2004). How colorful was your day? Why questionnaires cannot assess presence in virtual environments. Presence: Teleoperators and Virtual Environments, 13(4), 484-493. doi: citeulike-article-id:3680729.
Witmer, B.G., & Singer, M.J. (1998). Measuring presence in virtual environments: A presence questionnaire. [Article]. Presence: Teleoperators & Virtual Environments, 7(3), 225-240. doi: 10.1162/105474698565686
Zhao, S. (2003). Toward a taxonomy of copresence. Presence: Teleoperators and Virtual Environments, 12(5), 445-455.
Citation:
Hayes, A. (2014, May). Measuring social presence and impact of social presence in TeachLivE: ludic convergence. In Straub, C., Dieker, L., Hynes, M., & Hughes, C. (2014). Proceedings from Ludic Convergence: The Second National TLE TeachLivE™ Conference. Orlando, FL: University of Central Florida.
22
English Learner (EL) Avatars for Pre-Service Teachers
Michele RegallaJoyce A. Nutta
Nooshan AshtariKaren Verkler
Introduction
Teacher education institutions throughout the United States are preparing candidates for an increasingly diverse student population. Predominant among this changing population are English learners (ELs), projected to represent a quarter of K-12 students by 2025 (Goldenberg, 2008). Once the purview of English as a Second Language (ESL) specialists alone, English learners in the twenty-first century need all teachers to be equipped to support ELs’ academic subject achievement and language development.
The College of Education and Human Performance of the University of Central Florida has addressed the need to prepare teacher candidates of all subjects and grade levels to educate ELs in a comprehensive, systemic manner. Through implementing the One Plus Model of EL Infusion (Nutta, Mokhtari, & Strebel, 2012), the college has incorporated practice teaching cases of three ELs throughout various teacher preparation courses including: a dedicated course about teaching ELs (required of all teacher candidates), a foundational course, a general methods course, and subject-specific methods courses.
The EL infusion coordinator developed the cases studied throughout the infusion program after a year of weekly observation in an ESL classroom, interviews, and the collection of spoken and written language data of 40 students. Using the language data, and audio-recorded interviews with three students, the coordinator developed the cases of Edith, a newcomer from Mexico with a very minimal level of English proficiency, Edgar, an intermediate level English learner who left Puerto Rico eight months prior, and Tasir, and advanced English learner in the seventh grade who arrived in the US from Egypt in the third grade. Faculty teaching courses referencing the three cases provide links to multimedia case descriptions, including language samples and audio-recorded interviews with students representing each level of English proficiency (for a detailed description of the cases, see Nutta, Strebel, Mokhtari, Mihai, & Crevecoeur-Bryant, 2014).
Over a three-year period, references to the cases expanded into more course activities and assignments, with candidates developing a concrete sense of what Edith, Edgar, and Tasir could comprehend and express in English. Most courses involved curriculum development, lesson planning and implementation, and creation of assessments embedded in the three cases, requiring adaptations for Edith, Edgar, and Tasir. Faculty and candidates found the cases relatable, memorable, and actionable, and candidates came to know the cases so well across multiple courses that they often brought them up even before their instructors did.
As these cases took hold in the teacher preparation curriculum, plans for the widespread application of the TeachLivE program using five native-speaker avatars (Ed, Sean, Kevin, CJ, and Maria) were in motion. The TeachLivE inventors approached the EL infusion coordinator to discuss the possibility of creating EL avatars, and an 18-month process of developing avatars for Edith, Edgar, and Tasir began.
Cynthia J. HutchinsonPam Jones
Development of the avatars drew upon audio recordings and transcriptions of EL interviews and read-aloud sessions, informal and formal writing samples, video recordings of ELs
23
participating in the ESL class and interacting socially with each other and with the teacher during breaks, and published research on second language acquisition (see Ellis, 2008) and learner language (see Gass, Behney, & Plonsky, 2013). Through these data, the avatar developers were able to accurately and authentically represent the comprehension ability and expressive capacity of each avatar, portraying the typical developmental patterns and common errors for each level of English proficiency.
The beginning student, Edith, can understand simple yes/no and either/or questions about the here and now (Teacher asks, “Is this Italy?” or “Is this Italy or Germany?” while pointing to Germany on a map); the intermediate student, Edgar, can understand more complex questions, including those that refer to the past and future (“How did President Hoover try to fight the Great Depression?”); and the advanced EL, Tasir, can understand most questions unless they are asked too quickly, with too much undefined academic language, or with infrequently used or idiomatic expressions. Expressive abilities and tendencies for Edith include frequently used one-word and short chunk phrases (“table” or “I like”) and reverting to Spanish when communication breaks down. Edgar can express himself in English with more complex phrases and sentences, but he makes frequent grammatical errors (“What the man doing in the picture?” “My brother, she five year old.”), and Tasir sounds very much like a native speaker, with no traces of foreign accent. She struggles with academic language, however, in her spoken and written expression, as well as in listening and reading comprehension.
The EL avatars have supercharged the teaching cases by giving candidates the opportunity to interact with Edith, Edgar, and Tasir. Teacher candidates are taught to modify the language of their questions for Edith, Edgar, and Tasir using a questioning strategy called leveled questions (Nutta et al., 2014) and have the opportunity to practice their leveled questioning strategies with the EL avatars. No story, no video, and no microteaching experience can equal the immediate feedback received in real-time interaction with ELs at different levels of English proficiency. Candidates learn that even the best laid plans for level-appropriate questions can be challenged by unfamiliar words or sentence structures and that through interactional modifications (Ellis, 2008) in their communication with the avatars they can not only make instruction comprehensible but can also help build English language proficiency in their EL students.
Steps and Facilitation
TeachLivE’s EL avatars have provided astonishing opportunities for pre-service and in-service teachers in the College of Education and Human Performance to practice teaching skills. Currently, two of the core courses offered in multiple sections each semester utilize TeachLivE for the purpose of teacher preparation and practice. TSL4080 “Theories and Practices of Teaching ESOL Students in Schools” and EDG4410 “Teaching Strategies and Classroom Management” are pioneers of the vast possibilities TeachLivE has to offer our teachers in training. This paper will focus on students who participated with TeachLivE in EDG4410.
The Courses: TSL 4080 and EDG 4410
In the course dedicated to teaching ELs, TSL4080, teacher candidates are introduced to the world of English instruction, become familiar with different levels of proficiency, and learn about various approaches they can pursue to meet their ELs’ needs. Prior to meeting and interacting with the avatars, teacher candidates are introduced to Edith, Edgar and Tasir's cases, and learn about how each avatar represents a level of proficiency and background they will encounter as
24
teachers in their mainstream classrooms. An hour-long leveled questions and verbal tasks workshop precedes the TeachLivE session to give the students more practice opportunities and knowledge on the types of questions they can ask ELs at different levels.
The general methods course, EDG 4410, is the second exposure to the EL teaching cases. The junior-level course is required of all elementary and secondary education majors. In the course, the teacher candidates explore instructional, organizational, and classroom management strategies to create effective learning environments. Included in the course requirements are a required 15-hour service-learning field experience and two microteaching sessions. Microteaching is a training technique whereby the participant reviews a recording of the lesson in order to conduct a "post-mortem." Participants find out what works, which aspects fall short, and what needs to be done to enhance their teaching technique. Invented in the mid-1960s at Stanford University by Dr. Dwight W. Allen, microteaching has been used successfully for several decades now, as a way to help teachers and teacher candidates acquire new skills (Peterson, 2000).
As the teacher candidates create their lesson plans for the microteaching sessions, they meet the three EL students, Edith, Edgar and Tasir, in the teaching cases via an online module. The lesson plans must contain ESOL accommodations for each EL with a detailed explanation of each accommodation and why the accommodation would help the EL at his or her level of language proficiency.
Procedures
After the microteaching session with their peers pretending to be K-12 students, the teacher candidates were given the opportunity to teach the lesson again in TeachLivE with the three EL avatars included in a class of five avatars. In preparation for the mixed-reality experience, the teacher candidates submitted their lesson plans electronically to TeachLivE. The teacher candidates were given an appointment for a 5- to 10-minute time slot. The sessions took place in the TeachLivE lab with TESOL experts who observed and coached the teacher candidates. The coaches included two professors of ESOL education and one teacher educator who was trained by the ESOL professors in specific ESOL strategies. The three coaches rotated the observations using a rubric designed to indicate the strategies observed. After teaching the lesson, teacher candidates discussed their lessons with the TESOL experts and received feedback on their performance and recommendations on how they could improve their teaching skills. After the experience they were asked to write a reflection answering the following questions:
How did you feel going into the lesson, knowing that at least one EL would be in the class? How did you feel when an EL student reacted to you? Why do you think you felt that way? Did you facilitate the interaction by using a planned EL strategy? If so, which strategy did
you use? Was it successful? How do you know? Explain. Did you feel prepared to interact with the EL student? Explain.
Coaching Strategies
While observing the teacher candidates, coaches focused on the candidates’ use of ESOL strategies using a rubric designed to indicate the ESOL strategies observed. The rubric consisted of a list of ESOL strategies called “show and tell” strategies. The coaches indicated on the rubric which show and tell strategies were observed, and wrote comments about each strategy. Show strategies are defined as strategies that provide nonverbal support for ESOL students in order to
25
enhance their comprehension of verbal input. Tell strategies (verbal support) are those that involve the modification of the actual verbal or written input to enhance ESOL student comprehension (Nutta et al., 2014). Show and tell strategies can be used alone or in combination with one another. The show strategies observed most frequently included uses of visual materials such as photos, homemade pictures, posters, charts, graphs, and other realistic objects. The tell strategies observed most frequently included repetition of key words or phrases, rephrasing, simplification of the language of questions, and slower speech.
Coaching Takeaways
In conferencing with candidates after their lesson presentations and reading the feedback from their written reflections, students shared their overall experiences and impressions of their self-efficacy in communicating with the ESOL students. In terms of their overall experience with TeachLivE, candidates overwhelming stated that the experience was very realistic and an excellent tool for teachers in training. Many candidates stated that every student in education should be required to use TeachLivE and others asked if they would have additional opportunities to do so. Regarding their self-efficacy with ESOL students, the participants remarked that they felt confident in their ability to interact with Edgar and Tasir, the intermediate and advanced ESOL students, but communicating with Edith, the ESOL student with the lowest English proficiency, was more challenging than they had imagined. Many candidates reported that they wished they had planned more strategies for Edith and for more individual interaction with all of the ESOL students. Finally, candidates reported that after their experience with TeachLivE, they learned the importance of using visuals, slowing their speech, and adjusting their questions to the appropriate level for their ESOL students.
Coaches agreed with candidate feedback in terms of their self-efficacy. Many candidates included visuals in their lessons, but far more were needed. Some students relied only on verbal presentation for their entire lesson. Others did not engage ELs in the lesson if they did not actively participate. Finally, some candidates struggled with the pacing and amount of speech. Common observations included speaking too quickly, asking too many questions, or providing extremely wordy explanations for beginner or intermediate ELs.
References
Bureau of Student Achievement through Language Acquisition (1990). Consent decree. Retrieved from http://www.fldoe.org/aala/cdpage2.asp
Ellis, R. (2008). The study of second language acquisition. Oxford: Oxford University Press. Gass, S.M., Behney, J., & Plonsky, L. (2013). Second language acquisition: An introductory
course. New York: Routledge. Goldenberg, C. (2008). Teaching English language learners: What the research does and does not
say. American Educator, 32(2): 11-23, 42-43. Nutta, J.W., Mokhtari, K., & Strebel, C. (2012). Preparing every teacher to reach English learners:
A practical guide for teacher educators. Cambridge, MA: Harvard Education Press.Nutta, J., Strebel, C., Mokhtari, K., Mihai, F., & Crevecoeur-Bryant, E. (2014). Educating English
learners: What every classroom teacher needs to know. Cambridge, MA: Harvard Education Press.
Peterson, K.D. (2000). Teacher evaluation: a comprehensive guide to new directions and practices. Thousand Oaks, CA: Corwin Press.
English learner (EL) avatars for pre-service teachers. In Straub, C., Dieker, L., Hynes, M., & Hughes, C. (2014). Proceedings from Ludic Convergence: The Second National TLE TeachLivE™ Conference. Orlando, FL: University of Central Florida.
26

Citation:
Regalla, M., Nutta, J.A., Hutchinson, C.J., Jones, P., Ashtari, N., & Verkler, K. (2014, May). English learner (EL) avatars for pre-service teachers. In Straub, C., Dieker, L., Hynes, M., & Hughes, C. (2014). Proceedings from Ludic Convergence: The Second National TLE TeachLivE™ Conference. Orlando, FL: University of Central Florida.
27
Comparison of Feedback Methods for Pre-Service Teachers Delivering Mathematics Lessons in the TeachLivE Lab
Jacqueline Rodriguez College of William and Mary
Abstract
Teacher preparation and development has recently come under much scrutiny due to a wave of accountability measures put in place to focus on increased student outcomes. In order to prepare teachers for the accountability they will face in the classroom, teacher preparation programs are required to provide increased practice opportunities to pre-service teachers. School-based administrators and the other educational leaders recognize that practical experience in the classroom, including internships, helps to prepare new teachers for their roles in the classroom (Markow, Moessner, & Horowitz, 2006). Nevertheless, with accountability tied to high stakes testing, increased practice in the public school classrooms is more difficult because teachers and administrators alike are concerned with pre-service teachers’ impact on student performance data. Therefore, strategic and careful considerations must be given to alternatives to the traditional brick-and-mortar classroom.
Background
Effective preparation programs not only provide practice opportunities for pre-service teachers, but they incorporate feedback to ensure pre-service teachers’ implementation of skills acquired (Simonson et al., 2010). Feedback increases the likelihood of acquisition, implementation, and maintenance of skills across time and condition. Feedback methods have morphed with the changing generation of learners and newly developed technologies. Whereas face-to-face classroom observations were the norm in teaching practicums and yearly evaluations, new methods of feedback allow observers to participate in the process at a distance, all the while maintaining synchronicity of feedback. Bug-in-ear (BIE) technology allows observers to provide immediate, corrective feedback to teachers via voiceover internet protocols (VOIP). Many institutes of higher education and school-based administrators have considered using BIE technology for supervision and observation because it allows a teacher to immediately change a teaching technique instead of practicing an incorrect technique until delayed feedback is provided (Scheeler, McAfee, Ruhl, & Lee, 2006) while not causing any disruption to the classroom (Scheeler et al., 2009).
The use of praise to increase specific academic and social behaviors has a long history of significant effects (Partin, Robertson, Maggin, Oliver, & Wehby, 2010; Simonsen, Myers, & DeLuca, 2010). Praise can be used to motivate and reinforce desirable behaviors (Partin et al., 2010; Skinner, 1953). General and specific praise differ in their explicitness in explaining the reinforced behavior. In order for praise to be specific, the behavior must be explicitly defined for the student and praise must arise directly after the occurrence of the behavior (Simonsen et al., 2010). Similarly, general praise is verbal positive feedback, without the explicitness of the desired behavior (Simonsen et al., 2010).
Another effective strategy that has been found to increase positive academic behavior and decrease disruptive social behavior is the condition of increased opportunities to respond correctly
28
to questions (Partin et al., 2010). The use of questioning in the classroom can increase engagement and discussion (Brophy & Good, 1986), can be used to assess student learning (Stronge, 2007), and has been connected to facilitating discourse on content-specific understanding in math (Piccolo, Harbaugh, Carter, Capraro, M., & Capraro, R., 2008) and science (Chin, 2006). Additionally, Sutherland, Adler, and Gunther (2003) associated increased opportunities to respond through questioning to increases in outcomes for students with disabilities and students from culturally and linguistically diverse backgrounds.
Research Questions
This study sought to determine if the after action review cycle (AARC) and corrective feedback delivered via bug-in-ear (BIE) demonstrated an impact in the virtual teaching environment. Therefore, the following three research questions were examined:
1. To what extent does the After Action Review Cycle (AARC) compared to Bug-In-Ear(BIE) feedback impact the frequency of academic questions asked by the participant?
2. To what extent does the After Action Review Cycle (AARC) compared to Bug-In-Ear(BIE) feedback impact the frequency of general praise disseminated by the participant?
3. To what extent does the After Action Review Cycle (AARC) compared to Bug-In-Ear(BIE) feedback impact the frequency of specific praise disseminated by the participant?
Method
Participants
Participant recruitment took place in an undergraduate behavior management course in the College of Education of a large southeastern university. All students were shown a presentation highlighting the study purpose, qualifications for participation, and perceived value of participation. Participation in the study was limited to pre-service undergraduate, exceptional education majors or minors completing their Internship I practicum. Students were required to commit to a minimum of 13 teaching sessions in the virtual teaching lab on campus. Prior instruction or introduction to lab disqualified participation in the study. Three students were recruited as participants; however, the study sustained one case of attrition, which occurred before the intervention began. Of the two remaining participants, both were female, with an age range of 21 to 24. Participants received copies of the institutional review board's informed consent, and schedules and procedures for the teaching sessions.
Setting and Materials
Interviews, training, and teaching sessions occurred in the same virtual teaching lab. The lab, called TeachLivE, was located in a college of education building on the main campus of the university.
Design
An alternating treatment design (ATD) was used to evaluate and compare the effects of the AARC and BIE feedback methods on teacher questioning and praise. Alternating treatments is defined as rapidly alternating two or more treatments at random (Horner, 2005).
29
Data collection
The participants in this study were naïve to the behaviors being measured: academic questioning and praise. Participants were given 10 minutes to teach a mathematics lesson focused at the secondary level, specifically on middle school curriculum from the sixth to seventh grade. Participants were sent the lesson plan via email 48 hours in advance to provide time for review. They were also allowed to make amendments to the procedures in the plan, but they were not permitted to change the lesson plan objectives. Both participants chose to use the lesson plans “as is” without making any noticeable changes to the teaching procedures.
Lesson plans were drawn from various educational agencies including: Discovery Education, The Annenberg Learner’s Insights into Algebra, and the Public Broadcasting System. Lessons focused on the sixth to seventh grade National Council of Teachers of Mathematics standards. The study parameters required participants to teach a 10-minute direct instruction lesson in mathematics.
The AARC required the student to spend five minutes with the researcher to discuss the session. Based on critical components for feedback reviewed in Simonsen et al. (2010) and Colvin et al. (2009), the researcher would use specific examples throughout the session to discuss when appropriate questioning occurred, and when there were missed opportunities for questioning based on student feedback and interactions. Then the researcher and the participant would review the lesson plan to identify alternate areas where questioning was appropriate. An identical procedure was used to discuss general and specific praise.
The BIE feedback method requires the student to adapt their teaching in real time. The teacher must multi-task their interaction with the curriculum, with the students, and with the researcher-prompted feedback. Feedback during this intervention was delivered synchronously, supporting only rapid, short statements to illicit student responses, for example, “Ask Marcus to define perimeter,” or “Remember to praise Maria for effort”. Participants receiving BIE feedback did not participate in a five-minute review after the session.
Inter-observer agreement
An experienced teacher in the surrounding school system acted as inter-rater observer. The teacher has over 10 years of combined experience teaching secondary and elementary students. Agreement across behaviors was calculated by dividing the number of agreements minus the number of disagreements, by the total number of agreements and multiplying by 100%. In total, inter-observer agreement was collected on (61%) intervention sessions, with a mean agreement of 97.5% across participants on the occurrence of questions and praise.
Inter-observer agreement was also collected for treatment integrity. Agreement data was collected on 61% of AARC sessions using a checklist. Treatment integrity was 95.8% across all sessions.
Results
Three research questions were examined throughout this study: To what extent does the After Action Review Cycle (AARC) compared to Bug-In-Ear (BIE) feedback impact the frequency of academic questions asked by the participant? To what extent does the After Action
30
Review Cycle (AARC) compared to Bug-In-Ear (BIE) feedback impact the frequency of general praise disseminated by the participant? To what extent does the After Action Review Cycle (AARC) compared to Bug-In-Ear (BIE) feedback impact the frequency of specific praise disseminated by the participant?
“Percentage of non-overlapping data (PND) is the most critical statistic to report when comparing conditions with the ATD” (Gast, 2010, p. 352). Whereas variability in data paths is very important in other single subject designs, ATD is most interested in the changes in one data point that results in the superiority of one of the conditions. Scruggs and Mastropieri (1998, 2001) suggest using a range of PND scores to define effective treatments. Scores above 90 are considered very effective, while scores between 70 and 90 are considered effective; scores between 50 and 70 are considered questionable, while scores below 50 are considered ineffective (Scruggs & Mastropieri, 2001).
Results of this study indicated that across participants, BIE was the most effective treatment to increase general praise in the classroom (M PND = 100%). Effectiveness (Scruggs & Mastropieri, 2001) of BIE treatment to increase specific praise across participants was questionable (M PND = 62.5%), as was BIE treatment to increase academic questioning (M PND = 50%). When examining each participant, BIE treatment was highly effective in increasing general praise (M PND = 100%), and effective in increasing specific praise (M PND = 75%) for Participant 2.
Discussion
Limitations
Replication of this study would require researchers to consider several limitations to the current study. This study did not include a baseline for all participants or a maintenance period to determine worth of the intervention. Further proceduralizing of the feedback provided to the participant during both interventions will control for variability of the personnel providing the feedback. Coaching to a criterion and collecting data on whether the participant met the criteria may provide a more comprehensive picture of the effectiveness of the intervention.
Carryover effect is a confounding factor in multitreatment designs. In future studies, the study schedule should be spaced out to provide consistent, ample time in between sessions. Although multiple treatment sessions occurred on the same day, this study did not find any carryover effect. Finally, results of this study were marred by teaching behaviors not controlled during participant recruitment. For example, managing classroom behavior was assumed as both participants were synchronously enrolled in a behavior management course during the course of the study. However, managing off-task and disorderly behavior disrupted the flow of the lesson, causing periods ranging from two to five minutes that the participant spent remediating a student, and asked less than five content related questions with little to no opportunity for student praise.
Overall Impact
Although a clear separation of treatment effects was demonstrated in assessing general praise, there is not enough evidence to suggest that either treatment was more effective in increasing specific praise or questioning. Furthermore, the discreet values indicate a nominal
31
change in the frequency of general praise. There is not enough data to suggest a more effective feedback method when evaluating AARC versus BIE for pre-service teachers.
References
Brophy, J. (1986). Teacher influences on student achievement. American Psychologist, 41(10), 1069-1077.
Brophy J., & Good, T. (1986). Teacher behavior and student achievement. In M.C. Wittrock (Ed.), Handbook of research on teaching (3rd ed.). New York: McMillan.
Burnett, P. C. Elementary students' preferences for teacher praise. Journal of Classroom Interaction, 36(1), 16-23.
Chin, C., (2006) Classroom interaction in science: Teacher questioning and feedback to student responses. International Journal of Science Education, 28(11), 1315-1346.
Colvin, G., Flannery, K., Sugai, G., & Monegan, J. (2009). Using observational data to provide performance feedback to teachers: A high school case study. Preventing School Failure, 53(2), 95-104.
Dieker, L., Hynes, M., Hughes, C.E., & Smith, E. (2008). Implications of mixed reality and simulation technologies on special education and teacher preparation. Focus on Exceptional Children, 40(6), 1-20.
Fawcett, S.B., (1991). Social validity: A note on methodology. Journal of Applied Behavior analysis, 24(2), 235-239.
Gast, D.L. (2010). Single subject research methodology in behavioral sciences. New York: Routledge.
Horner, R.H., Carr, E.G., Halle, J., McGee, G., Odom, S., & Wolery, M. (2005). The use of single subject research to identify evidence-based practice in special education. Exceptional Children, 71, 165-179.
Markow, D., Moessner, C., & Horowitz, H. (Project Directors). (2006). The MetLife survey of the American teacher. Retrieved April 1, 2011, from http://www.metlife.com/about/corporate-profile/citizenship/metlife-foundation/metlife-survey-of-the-american-teacher.html?WT.mc_id=vu1101.
Mortenson, B. P., & Witt, J. C. (1998). The use of weekly performance feedback to increase teacher implementation of a prereferral academic intervention. School Psychology Review, 27, 613-627.
Noell, G.H., Witt, J.C., Gilbertson, D.N., Ranier, D.D., & Freeland, J.T. (1997). Increasing teacher intervention implementation in general education settings through consultation and performance feedback. School Psychology Quarterly, 12, 77-88.
Noell, G.H., Witt, J.C., LaFleur, B.P., Ranier, D.D., & Levelle, J. (2000) Increasing intervention implementation in general education following consultation: A comparison of two follow- up strategies. Journal of Applied Behavior Analysis 33(3) 123-134.
Partin, T., Robertson, R. E., Maggin, D. M., Oliver, R. M., & Wehby, J. H. (2010). Using teacher praise and opportunities to respond to promote appropriate student behavior. Preventing School Failure, 54(3), 172-178.
Piccolo, D.L., Harbaugh, A. P., Carter, T.A., Capraro, M. , & Capraro, R., (2008). Quality of instruction: Examining discourse in middle school mathematics instruction. Journal of Advanced Academics, 19(3), 376-410.
32
Scheeler, M., Bruno, K., Grubb, E., & Seavey, T. (2009). Generalizing teaching techniques from university to K-12 classrooms: Teaching preservice teachers to use what they learn. Journal of Behavioral Education, 18(3), 189-210. doi:10.1007/s10864-009-9088-3
Scheeler, M. C., & Lee, D. L. (2002). Using technology to deliver immediate corrective feedback to teachers. Journal of Behavioral Education, 11, 231–241.
Scheeler, M., McAfee, J. K., Ruhl, K. L., & Lee, D. L. (2006). Effects of Corrective Feedback Delivered via Wireless Technology on Preservice Teacher Performance and Student Behavior. Teacher Education and Special Education, 29(1), 12-25.
Scheeler, M. C., Ruhl, K. L., & McAfee, J. K. (2004). Providing performance feedback to teachers: A review. Teacher Education and Special Education, 27, 396–407.
Scruggs, T. E., & Mastropieri, M.A., (2001). How to summarize single subject-participant research: Ideas and applications, Exceptionality, 9(4), 227-244.
Simonsen, B., Myers, D., & DeLuca, C. (2010). Teaching teachers to use prompts, opportunities to respond, and specific praise. Teacher Education and Special Education, 33(4), 300-318.
Stronge, J.H. (2007). Qualities of effective teachers. (2nd ed.) Alexandria: Association for Supervision and Curriculum Development.
Sutherland, K. S., Alder, N., & Gunther, P. L. (2003). The effect of varying rates of opportunities to respond to academic requests on the classroom behavior of students with EBD. Journal of Emotional and Behavioral Disorders, 11, 239-248.
Citation:
Rodriguez, J. (2014, May). Comparison of feedback methods for pre-service teachers delivering mathematics lessons in the TeachLivE lab. In Straub, C., Dieker, L., Hynes, M., & Hughes, C. (2014). Proceedings from Ludic Convergence: The Second National TLE TeachLivE™ Conference. Orlando, FL: University of Central Florida.
33
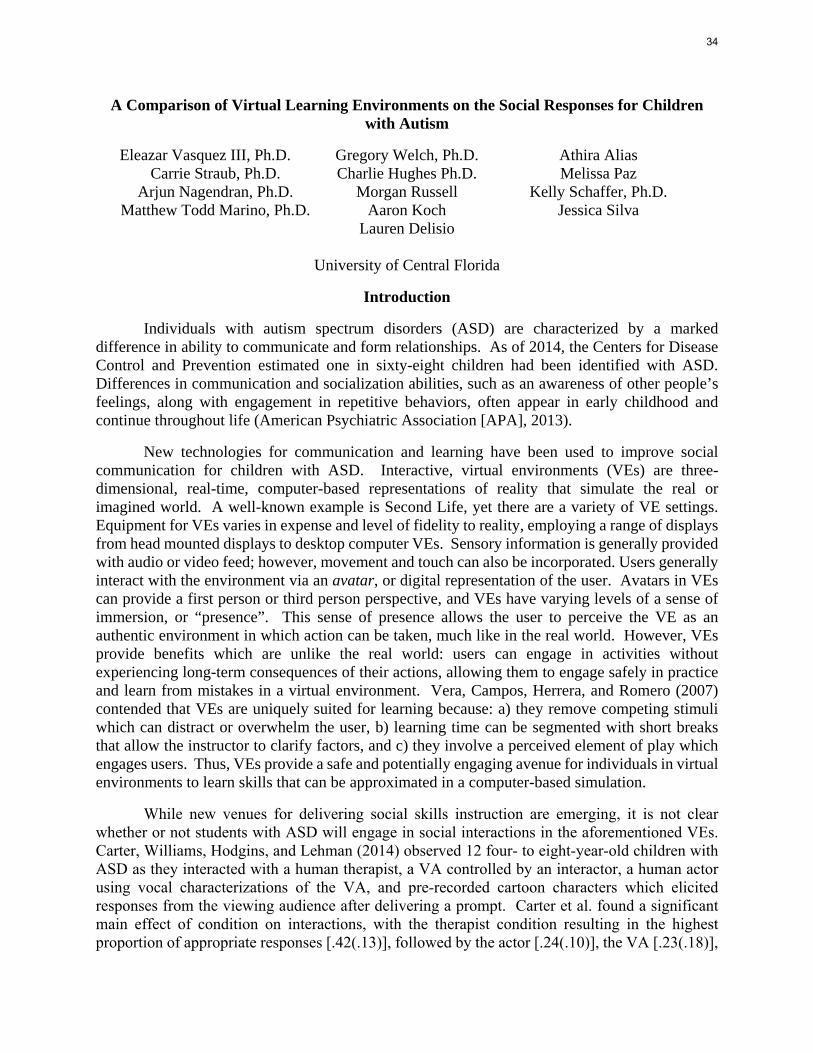
A Comparison of Virtual Learning Environments on the Social Responses for Children with Autism
Eleazar Vasquez III, Ph.D. Carrie Straub, Ph.D.
Arjun Nagendran, Ph.D. Matthew Todd Marino, Ph.D.
Gregory Welch, Ph.D. Charlie Hughes Ph.D.
Morgan Russell Aaron Koch
Lauren Delisio
Athira Alias Melissa Paz
Kelly Schaffer, Ph.D. Jessica Silva
University of Central Florida
Introduction
Individuals with autism spectrum disorders (ASD) are characterized by a marked difference in ability to communicate and form relationships. As of 2014, the Centers for Disease Control and Prevention estimated one in sixty-eight children had been identified with ASD. Differences in communication and socialization abilities, such as an awareness of other people’s feelings, along with engagement in repetitive behaviors, often appear in early childhood and continue throughout life (American Psychiatric Association [APA], 2013).
New technologies for communication and learning have been used to improve social communication for children with ASD. Interactive, virtual environments (VEs) are three-dimensional, real-time, computer-based representations of reality that simulate the real or imagined world. A well-known example is Second Life, yet there are a variety of VE settings. Equipment for VEs varies in expense and level of fidelity to reality, employing a range of displays from head mounted displays to desktop computer VEs. Sensory information is generally provided with audio or video feed; however, movement and touch can also be incorporated. Users generally interact with the environment via an avatar, or digital representation of the user. Avatars in VEs can provide a first person or third person perspective, and VEs have varying levels of a sense of immersion, or “presence”. This sense of presence allows the user to perceive the VE as an authentic environment in which action can be taken, much like in the real world. However, VEs provide benefits which are unlike the real world: users can engage in activities without experiencing long-term consequences of their actions, allowing them to engage safely in practice and learn from mistakes in a virtual environment. Vera, Campos, Herrera, and Romero (2007) contended that VEs are uniquely suited for learning because: a) they remove competing stimuli which can distract or overwhelm the user, b) learning time can be segmented with short breaks that allow the instructor to clarify factors, and c) they involve a perceived element of play which engages users. Thus, VEs provide a safe and potentially engaging avenue for individuals in virtual environments to learn skills that can be approximated in a computer-based simulation.
While new venues for delivering social skills instruction are emerging, it is not clear whether or not students with ASD will engage in social interactions in the aforementioned VEs. Carter, Williams, Hodgins, and Lehman (2014) observed 12 four- to eight-year-old children with ASD as they interacted with a human therapist, a VA controlled by an interactor, a human actor using vocal characterizations of the VA, and pre-recorded cartoon characters which elicited responses from the viewing audience after delivering a prompt. Carter et al. found a significant main effect of condition on interactions, with the therapist condition resulting in the highest proportion of appropriate responses [.42(.13)], followed by the actor [.24(.10)], the VA [.23(.18)],
34
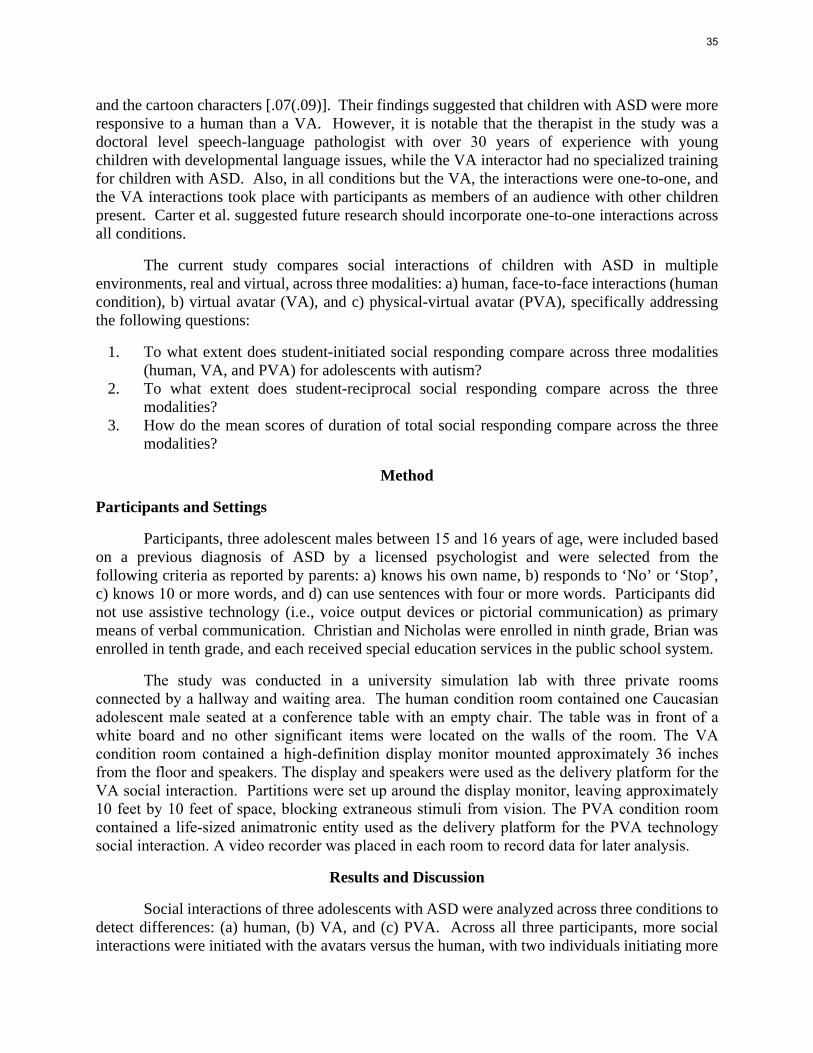
and the cartoon characters [.07(.09)]. Their findings suggested that children with ASD were more responsive to a human than a VA. However, it is notable that the therapist in the study was a doctoral level speech-language pathologist with over 30 years of experience with young children with developmental language issues, while the VA interactor had no specialized training for children with ASD. Also, in all conditions but the VA, the interactions were one-to-one, and the VA interactions took place with participants as members of an audience with other children present. Carter et al. suggested future research should incorporate one-to-one interactions across all conditions.
The current study compares social interactions of children with ASD in multiple environments, real and virtual, across three modalities: a) human, face-to-face interactions (human condition), b) virtual avatar (VA), and c) physical-virtual avatar (PVA), specifically addressing the following questions:
1. To what extent does student-initiated social responding compare across three modalities(human, VA, and PVA) for adolescents with autism?
2. To what extent does student-reciprocal social responding compare across the threemodalities?
3. How do the mean scores of duration of total social responding compare across the threemodalities?
Method
Participants and Settings
Participants, three adolescent males between 15 and 16 years of age, were included based on a previous diagnosis of ASD by a licensed psychologist and were selected from the following criteria as reported by parents: a) knows his own name, b) responds to ‘No’ or ‘Stop’, c) knows 10 or more words, and d) can use sentences with four or more words. Participants didnot use assistive technology (i.e., voice output devices or pictorial communication) as primary means of verbal communication. Christian and Nicholas were enrolled in ninth grade, Brian was enrolled in tenth grade, and each received special education services in the public school system.
The study was conducted in a university simulation lab with three private rooms connected by a hallway and waiting area. The human condition room contained one Caucasian adolescent male seated at a conference table with an empty chair. The table was in front of a white board and no other significant items were located on the walls of the room. The VA condition room contained a high-definition display monitor mounted approximately 36 inches from the floor and speakers. The display and speakers were used as the delivery platform for the VA social interaction. Partitions were set up around the display monitor, leaving approximately 10 feet by 10 feet of space, blocking extraneous stimuli from vision. The PVA condition room contained a life-sized animatronic entity used as the delivery platform for the PVA technology social interaction. A video recorder was placed in each room to record data for later analysis.
Results and Discussion
Social interactions of three adolescents with ASD were analyzed across three conditions to detect differences: (a) human, (b) VA, and (c) PVA. Across all three participants, more social interactions were initiated with the avatars versus the human, with two individuals initiating more
35
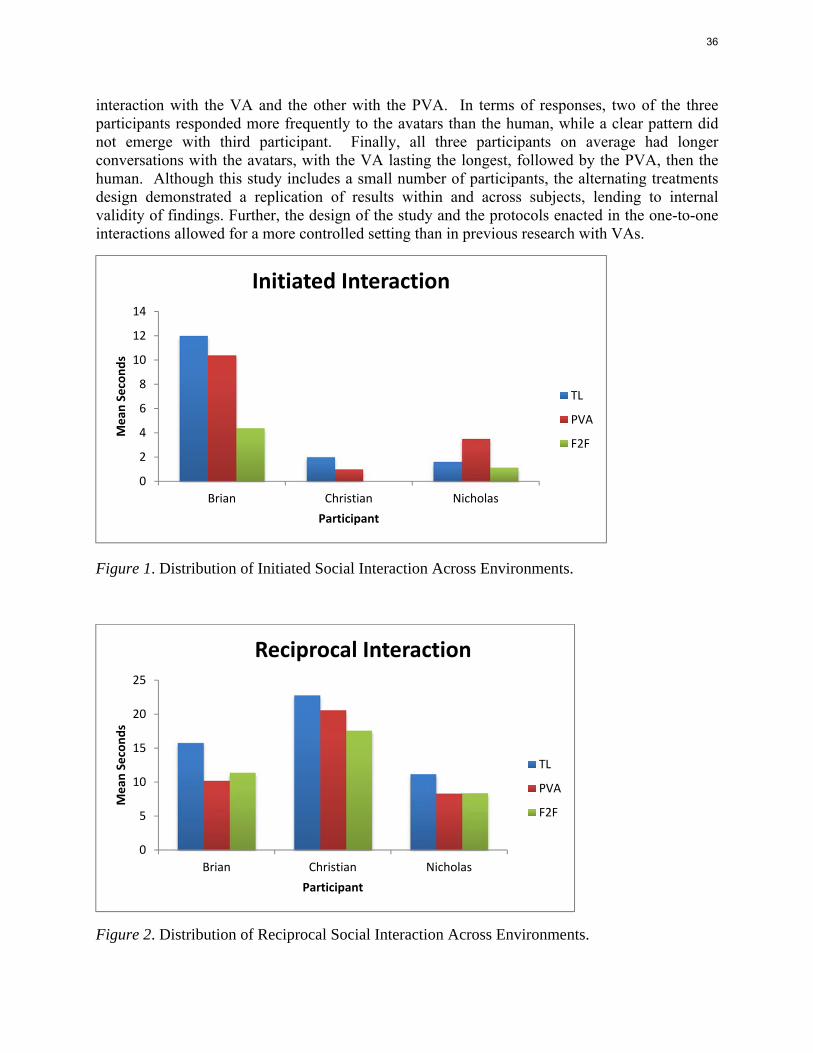
interaction with the VA and the other with the PVA. In terms of responses, two of the three participants responded more frequently to the avatars than the human, while a clear pattern did not emerge with third participant. Finally, all three participants on average had longer conversations with the avatars, with the VA lasting the longest, followed by the PVA, then the human. Although this study includes a small number of participants, the alternating treatments design demonstrated a replication of results within and across subjects, lending to internal validity of findings. Further, the design of the study and the protocols enacted in the one-to-one interactions allowed for a more controlled setting than in previous research with VAs.
Figure 1. Distribution of Initiated Social Interaction Across Environments.
Figure 2. Distribution of Reciprocal Social Interaction Across Environments.
0
2
4
6
8
10
12
14
Brian Christian Nicholas
Mean
Seconds
Participant
Initiated Interaction
TL
PVA
F2F
0
5
10
15
20
25
Brian Christian Nicholas
Mean
Seconds
Participant
Reciprocal Interaction
TL
PVA
F2F
36
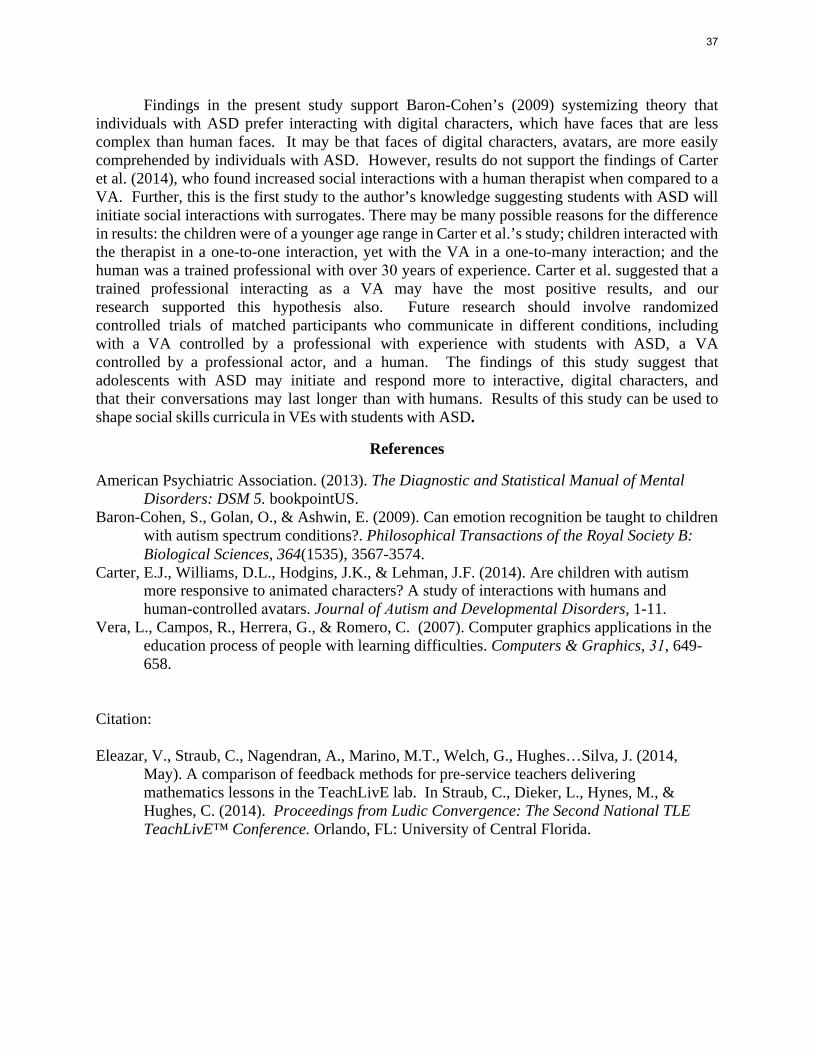
Findings in the present study support Baron-Cohen’s (2009) systemizing theory that individuals with ASD prefer interacting with digital characters, which have faces that are less complex than human faces. It may be that faces of digital characters, avatars, are more easily comprehended by individuals with ASD. However, results do not support the findings of Carter et al. (2014), who found increased social interactions with a human therapist when compared to a VA. Further, this is the first study to the author’s knowledge suggesting students with ASD will initiate social interactions with surrogates. There may be many possible reasons for the difference in results: the children were of a younger age range in Carter et al.’s study; children interacted with the therapist in a one-to-one interaction, yet with the VA in a one-to-many interaction; and the human was a trained professional with over 30 years of experience. Carter et al. suggested that a trained professional interacting as a VA may have the most positive results, and our research supported this hypothesis also. Future research should involve randomized controlled trials of matched participants who communicate in different conditions, including with a VA controlled by a professional with experience with students with ASD, a VA controlled by a professional actor, and a human. The findings of this study suggest that adolescents with ASD may initiate and respond more to interactive, digital characters, and that their conversations may last longer than with humans. Results of this study can be used to shape social skills curricula in VEs with students with ASD.
References
American Psychiatric Association. (2013). The Diagnostic and Statistical Manual of Mental Disorders: DSM 5. bookpointUS.
Baron-Cohen, S., Golan, O., & Ashwin, E. (2009). Can emotion recognition be taught to children with autism spectrum conditions?. Philosophical Transactions of the Royal Society B: Biological Sciences, 364(1535), 3567-3574.
Carter, E.J., Williams, D.L., Hodgins, J.K., & Lehman, J.F. (2014). Are children with autism more responsive to animated characters? A study of interactions with humans and human-controlled avatars. Journal of Autism and Developmental Disorders, 1-11.
Vera, L., Campos, R., Herrera, G., & Romero, C. (2007). Computer graphics applications in the education process of people with learning difficulties. Computers & Graphics, 31, 649-658.
Citation:
Eleazar, V., Straub, C., Nagendran, A., Marino, M.T., Welch, G., Hughes…Silva, J. (2014, May). A comparison of feedback methods for pre-service teachers delivering mathematics lessons in the TeachLivE lab. In Straub, C., Dieker, L., Hynes, M., & Hughes, C. (2014). Proceedings from Ludic Convergence: The Second National TLE TeachLivE™ Conference. Orlando, FL: University of Central Florida.
37
2014TeachLivENationalResearchProject
Year 1 Findings University of Central Florida
Carrie Straub, Ph.D.
Lisa Dieker, Ph.D.
Michael Hynes, Ph.D.
Charles Hughes, Ph.D
38
Using Virtual Rehearsal in TLE TeachLivE™ Mixed Reality Classroom Simulator to Determine the Effects on the Performance of Mathematics Teachers
This research project was supported by funding from the Bill & Melinda Gates Foundation.
Abstract
A quasi-experimental, pre-post group design was used to examine the effects of repeated virtual rehearsal sessions in a mixed-reality computer simulated environment, TLE TeachLivE™ classroom simulator. At 10 sites across the nation, 157 middle school mathematics teachers received four levels of innovative professional development, including computer simulation, synchronous online instruction, and lesson resources based on the Common Core State Standards (CCSS). Teachers were observed in the TLE TeachLivE™ (TeachLivE) classroom simulator and in their regular classrooms to determine the effects of treatment. Trained observers (a) collected pre-post frequency counts of teacher behavior on questioning, wait time, and feedback; scored teacher classroom practice on modified sub-constructs of the Danielson Framework for Teaching; and (c) took qualitative field notes. Teachers responded to questionnaires covering demographic information and their experiences in the classroom simulator. Student level data were collected pre-post on a 10-item academic assessment using items from the eighth grade 2011 National Assessment of Educational Progress. From an analysis of the data, the researchers found that four 10-minute professional learning sessions in the TeachLivE classroom simulator improved targeted teaching behaviors while experiencing the simulator scenarios, and those improvements transferred into the teachers’ original classroom settings. Results from this study validate emerging research in the field of teacher education and simulation that suggests that professional learning in mixed-reality simulated classrooms can be effective in impacting teacher practice.
EFFECTS OF VIRTUAL REHEARSAL39
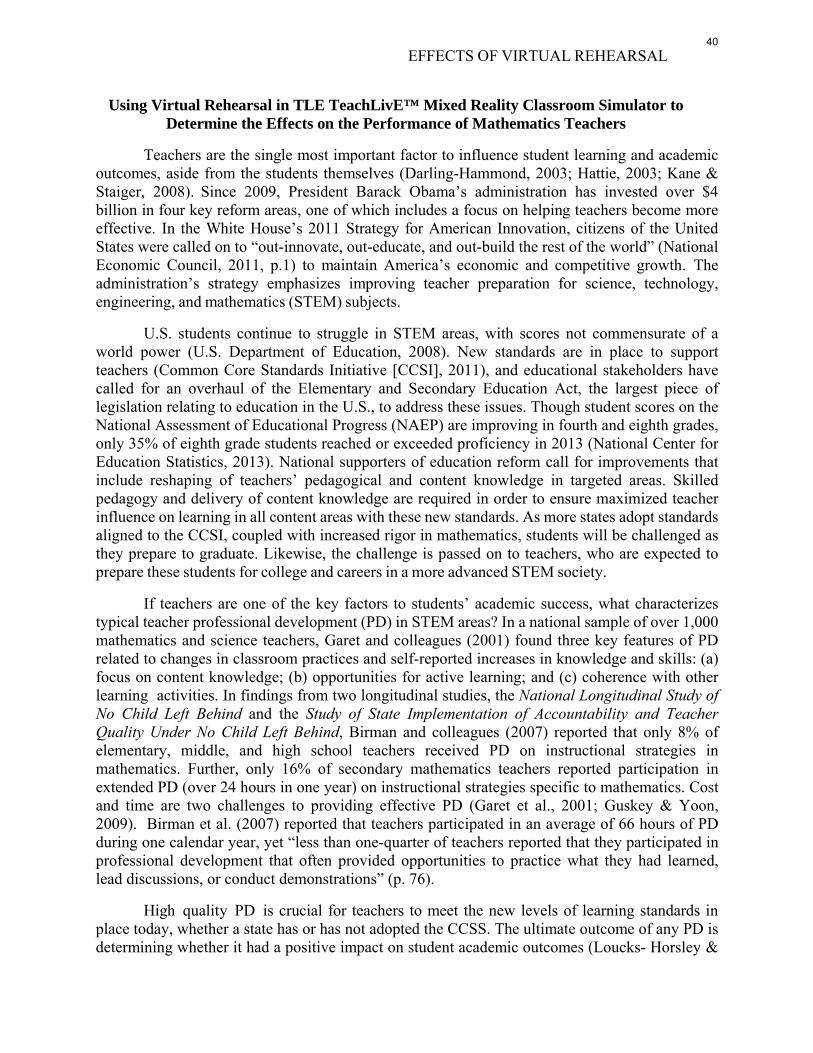
Using Virtual Rehearsal in TLE TeachLivE™ Mixed Reality Classroom Simulator to Determine the Effects on the Performance of Mathematics Teachers
Teachers are the single most important factor to influence student learning and academic outcomes, aside from the students themselves (Darling-Hammond, 2003; Hattie, 2003; Kane & Staiger, 2008). Since 2009, President Barack Obama’s administration has invested over $4 billion in four key reform areas, one of which includes a focus on helping teachers become more effective. In the White House’s 2011 Strategy for American Innovation, citizens of the United States were called on to “out-innovate, out-educate, and out-build the rest of the world” (National Economic Council, 2011, p.1) to maintain America’s economic and competitive growth. The administration’s strategy emphasizes improving teacher preparation for science, technology, engineering, and mathematics (STEM) subjects.
U.S. students continue to struggle in STEM areas, with scores not commensurate of a world power (U.S. Department of Education, 2008). New standards are in place to support teachers (Common Core Standards Initiative [CCSI], 2011), and educational stakeholders have called for an overhaul of the Elementary and Secondary Education Act, the largest piece of legislation relating to education in the U.S., to address these issues. Though student scores on the National Assessment of Educational Progress (NAEP) are improving in fourth and eighth grades, only 35% of eighth grade students reached or exceeded proficiency in 2013 (National Center for Education Statistics, 2013). National supporters of education reform call for improvements that include reshaping of teachers’ pedagogical and content knowledge in targeted areas. Skilled pedagogy and delivery of content knowledge are required in order to ensure maximized teacher influence on learning in all content areas with these new standards. As more states adopt standards aligned to the CCSI, coupled with increased rigor in mathematics, students will be challenged as they prepare to graduate. Likewise, the challenge is passed on to teachers, who are expected to prepare these students for college and careers in a more advanced STEM society.
If teachers are one of the key factors to students’ academic success, what characterizes typical teacher professional development (PD) in STEM areas? In a national sample of over 1,000 mathematics and science teachers, Garet and colleagues (2001) found three key features of PD related to changes in classroom practices and self-reported increases in knowledge and skills: (a) focus on content knowledge; (b) opportunities for active learning; and (c) coherence with other learning activities. In findings from two longitudinal studies, the National Longitudinal Study of No Child Left Behind and the Study of State Implementation of Accountability and Teacher Quality Under No Child Left Behind, Birman and colleagues (2007) reported that only 8% of elementary, middle, and high school teachers received PD on instructional strategies in mathematics. Further, only 16% of secondary mathematics teachers reported participation in extended PD (over 24 hours in one year) on instructional strategies specific to mathematics. Cost and time are two challenges to providing effective PD (Garet et al., 2001; Guskey & Yoon, 2009). Birman et al. (2007) reported that teachers participated in an average of 66 hours of PD during one calendar year, yet “less than one-quarter of teachers reported that they participated in professional development that often provided opportunities to practice what they had learned, lead discussions, or conduct demonstrations” (p. 76).
High quality PD is crucial for teachers to meet the new levels of learning standards in place today, whether a state has or has not adopted the CCSS. The ultimate outcome of any PD is determining whether it had a positive impact on student academic outcomes (Loucks- Horsley &
EFFECTS OF VIRTUAL REHEARSAL40
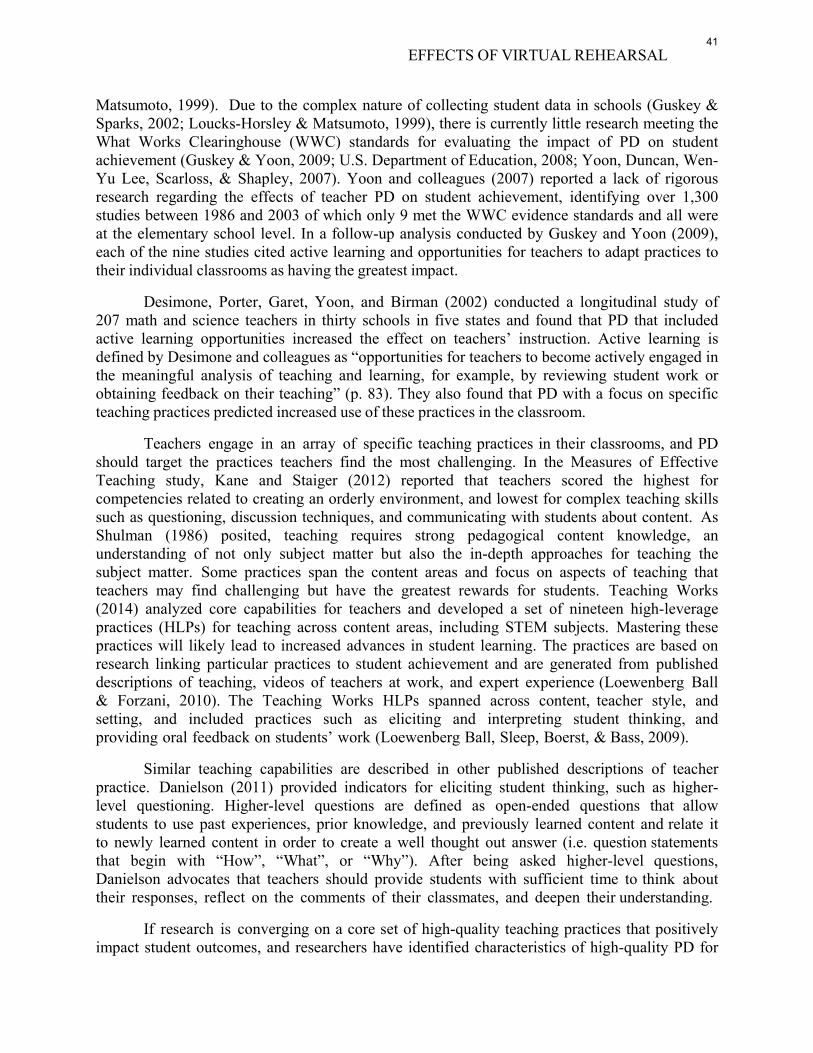
Matsumoto, 1999). Due to the complex nature of collecting student data in schools (Guskey & Sparks, 2002; Loucks-Horsley & Matsumoto, 1999), there is currently little research meeting the What Works Clearinghouse (WWC) standards for evaluating the impact of PD on student achievement (Guskey & Yoon, 2009; U.S. Department of Education, 2008; Yoon, Duncan, Wen- Yu Lee, Scarloss, & Shapley, 2007). Yoon and colleagues (2007) reported a lack of rigorous research regarding the effects of teacher PD on student achievement, identifying over 1,300 studies between 1986 and 2003 of which only 9 met the WWC evidence standards and all were at the elementary school level. In a follow-up analysis conducted by Guskey and Yoon (2009), each of the nine studies cited active learning and opportunities for teachers to adapt practices to their individual classrooms as having the greatest impact.
Desimone, Porter, Garet, Yoon, and Birman (2002) conducted a longitudinal study of 207 math and science teachers in thirty schools in five states and found that PD that included active learning opportunities increased the effect on teachers’ instruction. Active learning is defined by Desimone and colleagues as “opportunities for teachers to become actively engaged in the meaningful analysis of teaching and learning, for example, by reviewing student work or obtaining feedback on their teaching” (p. 83). They also found that PD with a focus on specific teaching practices predicted increased use of these practices in the classroom.
Teachers engage in an array of specific teaching practices in their classrooms, and PD should target the practices teachers find the most challenging. In the Measures of Effective Teaching study, Kane and Staiger (2012) reported that teachers scored the highest for competencies related to creating an orderly environment, and lowest for complex teaching skills such as questioning, discussion techniques, and communicating with students about content. As Shulman (1986) posited, teaching requires strong pedagogical content knowledge, an understanding of not only subject matter but also the in-depth approaches for teaching the subject matter. Some practices span the content areas and focus on aspects of teaching that teachers may find challenging but have the greatest rewards for students. Teaching Works (2014) analyzed core capabilities for teachers and developed a set of nineteen high-leverage practices (HLPs) for teaching across content areas, including STEM subjects. Mastering these practices will likely lead to increased advances in student learning. The practices are based on research linking particular practices to student achievement and are generated from published descriptions of teaching, videos of teachers at work, and expert experience (Loewenberg Ball & Forzani, 2010). The Teaching Works HLPs spanned across content, teacher style, and setting, and included practices such as eliciting and interpreting student thinking, and providing oral feedback on students’ work (Loewenberg Ball, Sleep, Boerst, & Bass, 2009).
Similar teaching capabilities are described in other published descriptions of teacher practice. Danielson (2011) provided indicators for eliciting student thinking, such as higher- level questioning. Higher-level questions are defined as open-ended questions that allow students to use past experiences, prior knowledge, and previously learned content and relate it to newly learned content in order to create a well thought out answer (i.e. question statements that begin with “How”, “What”, or “Why”). After being asked higher-level questions, Danielson advocates that teachers should provide students with sufficient time to think about their responses, reflect on the comments of their classmates, and deepen their understanding.
If research is converging on a core set of high-quality teaching practices that positively impact student outcomes, and researchers have identified characteristics of high-quality PD for
EFFECTS OF VIRTUAL REHEARSAL41
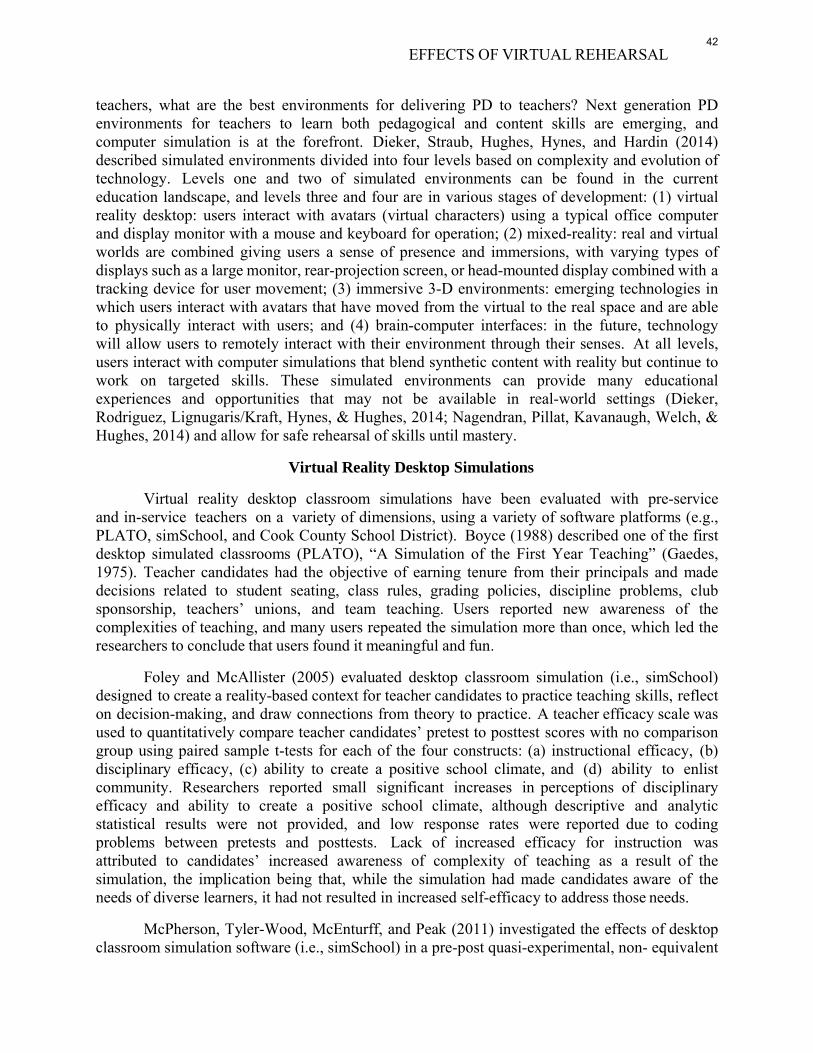
teachers, what are the best environments for delivering PD to teachers? Next generation PD environments for teachers to learn both pedagogical and content skills are emerging, and computer simulation is at the forefront. Dieker, Straub, Hughes, Hynes, and Hardin (2014) described simulated environments divided into four levels based on complexity and evolution of technology. Levels one and two of simulated environments can be found in the current education landscape, and levels three and four are in various stages of development: (1) virtual reality desktop: users interact with avatars (virtual characters) using a typical office computer and display monitor with a mouse and keyboard for operation; (2) mixed-reality: real and virtual worlds are combined giving users a sense of presence and immersions, with varying types of displays such as a large monitor, rear-projection screen, or head-mounted display combined with a tracking device for user movement; (3) immersive 3-D environments: emerging technologies in which users interact with avatars that have moved from the virtual to the real space and are able to physically interact with users; and (4) brain-computer interfaces: in the future, technology will allow users to remotely interact with their environment through their senses. At all levels, users interact with computer simulations that blend synthetic content with reality but continue to work on targeted skills. These simulated environments can provide many educational experiences and opportunities that may not be available in real-world settings (Dieker, Rodriguez, Lignugaris/Kraft, Hynes, & Hughes, 2014; Nagendran, Pillat, Kavanaugh, Welch, & Hughes, 2014) and allow for safe rehearsal of skills until mastery.
Virtual Reality Desktop Simulations
Virtual reality desktop classroom simulations have been evaluated with pre-service and in-service teachers on a variety of dimensions, using a variety of software platforms (e.g., PLATO, simSchool, and Cook County School District). Boyce (1988) described one of the first desktop simulated classrooms (PLATO), “A Simulation of the First Year Teaching” (Gaedes, 1975). Teacher candidates had the objective of earning tenure from their principals and made decisions related to student seating, class rules, grading policies, discipline problems, club sponsorship, teachers’ unions, and team teaching. Users reported new awareness of the complexities of teaching, and many users repeated the simulation more than once, which led the researchers to conclude that users found it meaningful and fun.
Foley and McAllister (2005) evaluated desktop classroom simulation (i.e., simSchool) designed to create a reality-based context for teacher candidates to practice teaching skills, reflect on decision-making, and draw connections from theory to practice. A teacher efficacy scale was used to quantitatively compare teacher candidates’ pretest to posttest scores with no comparison group using paired sample t-tests for each of the four constructs: (a) instructional efficacy, (b) disciplinary efficacy, (c) ability to create a positive school climate, and (d) ability to enlist community. Researchers reported small significant increases in perceptions of disciplinary efficacy and ability to create a positive school climate, although descriptive and analytic statistical results were not provided, and low response rates were reported due to coding problems between pretests and posttests. Lack of increased efficacy for instruction was attributed to candidates’ increased awareness of complexity of teaching as a result of the simulation, the implication being that, while the simulation had made candidates aware of the needs of diverse learners, it had not resulted in increased self-efficacy to address those needs.
McPherson, Tyler-Wood, McEnturff, and Peak (2011) investigated the effects of desktop classroom simulation software (i.e., simSchool) in a pre-post quasi-experimental, non- equivalent
EFFECTS OF VIRTUAL REHEARSAL42
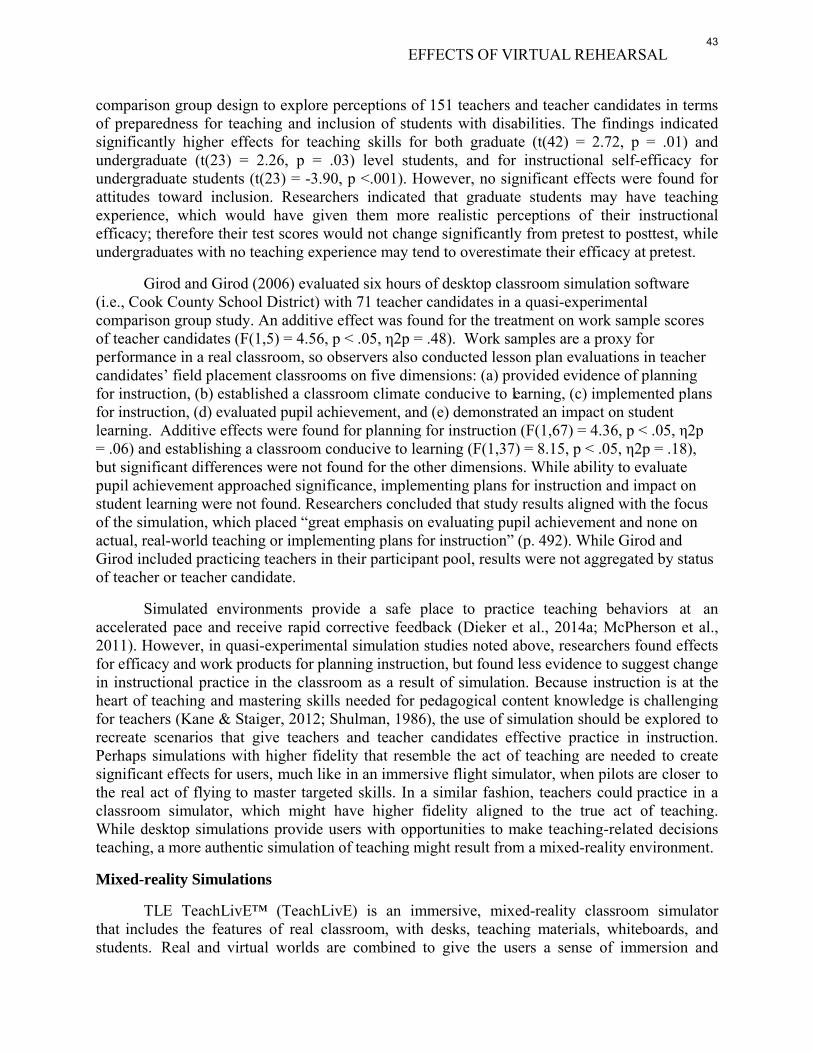
comparison group design to explore perceptions of 151 teachers and teacher candidates in terms of preparedness for teaching and inclusion of students with disabilities. The findings indicated significantly higher effects for teaching skills for both graduate (t(42) = 2.72, p = .01) and undergraduate (t(23) = 2.26, p = .03) level students, and for instructional self-efficacy for undergraduate students (t(23) = -3.90, p <.001). However, no significant effects were found for attitudes toward inclusion. Researchers indicated that graduate students may have teaching experience, which would have given them more realistic perceptions of their instructional efficacy; therefore their test scores would not change significantly from pretest to posttest, while undergraduates with no teaching experience may tend to overestimate their efficacy at pretest.
Girod and Girod (2006) evaluated six hours of desktop classroom simulation software (i.e., Cook County School District) with 71 teacher candidates in a quasi-experimental comparison group study. An additive effect was found for the treatment on work sample scores of teacher candidates (F(1,5) = 4.56, p < .05, η2p = .48). Work samples are a proxy for performance in a real classroom, so observers also conducted lesson plan evaluations in teacher candidates’ field placement classrooms on five dimensions: (a) provided evidence of planning for instruction, (b) established a classroom climate conducive to learning, (c) implemented plans for instruction, (d) evaluated pupil achievement, and (e) demonstrated an impact on student learning. Additive effects were found for planning for instruction (F(1,67) = 4.36, p < .05, η2p = .06) and establishing a classroom conducive to learning (F(1,37) = 8.15, p < .05, η2p = .18), but significant differences were not found for the other dimensions. While ability to evaluate pupil achievement approached significance, implementing plans for instruction and impact on student learning were not found. Researchers concluded that study results aligned with the focus of the simulation, which placed “great emphasis on evaluating pupil achievement and none on actual, real-world teaching or implementing plans for instruction” (p. 492). While Girod and Girod included practicing teachers in their participant pool, results were not aggregated by status of teacher or teacher candidate.
Simulated environments provide a safe place to practice teaching behaviors at an accelerated pace and receive rapid corrective feedback (Dieker et al., 2014a; McPherson et al., 2011). However, in quasi-experimental simulation studies noted above, researchers found effects for efficacy and work products for planning instruction, but found less evidence to suggest change in instructional practice in the classroom as a result of simulation. Because instruction is at the heart of teaching and mastering skills needed for pedagogical content knowledge is challenging for teachers (Kane & Staiger, 2012; Shulman, 1986), the use of simulation should be explored to recreate scenarios that give teachers and teacher candidates effective practice in instruction. Perhaps simulations with higher fidelity that resemble the act of teaching are needed to create significant effects for users, much like in an immersive flight simulator, when pilots are closer to the real act of flying to master targeted skills. In a similar fashion, teachers could practice in a classroom simulator, which might have higher fidelity aligned to the true act of teaching. While desktop simulations provide users with opportunities to make teaching-related decisions teaching, a more authentic simulation of teaching might result from a mixed-reality environment.
Mixed-reality Simulations
TLE TeachLivE™ (TeachLivE) is an immersive, mixed-reality classroom simulator that includes the features of real classroom, with desks, teaching materials, whiteboards, and students. Real and virtual worlds are combined to give the users a sense of immersion and
EFFECTS OF VIRTUAL REHEARSAL43
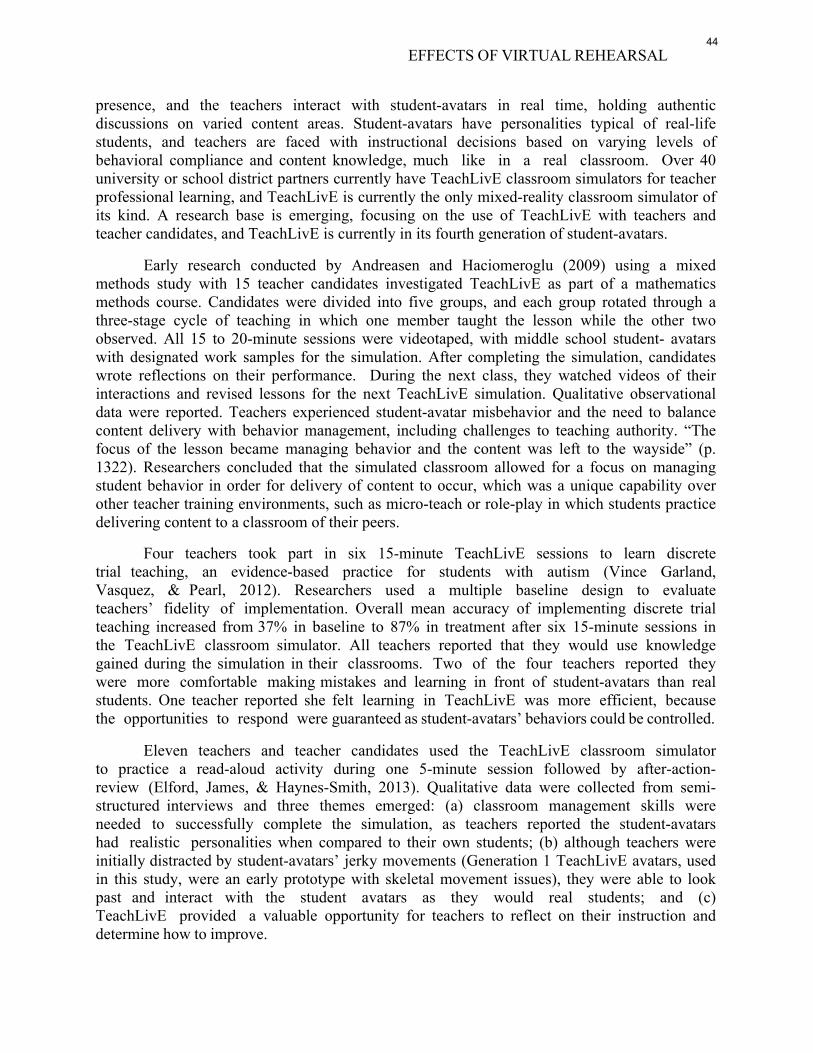
presence, and the teachers interact with student-avatars in real time, holding authentic discussions on varied content areas. Student-avatars have personalities typical of real-life students, and teachers are faced with instructional decisions based on varying levels of behavioral compliance and content knowledge, much like in a real classroom. Over 40 university or school district partners currently have TeachLivE classroom simulators for teacher professional learning, and TeachLivE is currently the only mixed-reality classroom simulator of its kind. A research base is emerging, focusing on the use of TeachLivE with teachers and teacher candidates, and TeachLivE is currently in its fourth generation of student-avatars.
Early research conducted by Andreasen and Haciomeroglu (2009) using a mixed methods study with 15 teacher candidates investigated TeachLivE as part of a mathematics methods course. Candidates were divided into five groups, and each group rotated through a three-stage cycle of teaching in which one member taught the lesson while the other two observed. All 15 to 20-minute sessions were videotaped, with middle school student- avatars with designated work samples for the simulation. After completing the simulation, candidates wrote reflections on their performance. During the next class, they watched videos of their interactions and revised lessons for the next TeachLivE simulation. Qualitative observational data were reported. Teachers experienced student-avatar misbehavior and the need to balance content delivery with behavior management, including challenges to teaching authority. “The focus of the lesson became managing behavior and the content was left to the wayside” (p. 1322). Researchers concluded that the simulated classroom allowed for a focus on managing student behavior in order for delivery of content to occur, which was a unique capability over other teacher training environments, such as micro-teach or role-play in which students practice delivering content to a classroom of their peers.
Four teachers took part in six 15-minute TeachLivE sessions to learn discrete trial teaching, an evidence-based practice for students with autism (Vince Garland, Vasquez, & Pearl, 2012). Researchers used a multiple baseline design to evaluate teachers’ fidelity of implementation. Overall mean accuracy of implementing discrete trial teaching increased from 37% in baseline to 87% in treatment after six 15-minute sessions in the TeachLivE classroom simulator. All teachers reported that they would use knowledge gained during the simulation in their classrooms. Two of the four teachers reported they were more comfortable making mistakes and learning in front of student-avatars than real students. One teacher reported she felt learning in TeachLivE was more efficient, because the opportunities to respond were guaranteed as student-avatars’ behaviors could be controlled.
Eleven teachers and teacher candidates used the TeachLivE classroom simulator to practice a read-aloud activity during one 5-minute session followed by after-action-review (Elford, James, & Haynes-Smith, 2013). Qualitative data were collected from semi-structured interviews and three themes emerged: (a) classroom management skills were needed to successfully complete the simulation, as teachers reported the student-avatars had realistic personalities when compared to their own students; (b) although teachers were initially distracted by student-avatars’ jerky movements (Generation 1 TeachLivE avatars, used in this study, were an early prototype with skeletal movement issues), they were able to look past and interact with the student avatars as they would real students; and (c) TeachLivE provided a valuable opportunity for teachers to reflect on their instruction and determine how to improve.
EFFECTS OF VIRTUAL REHEARSAL44
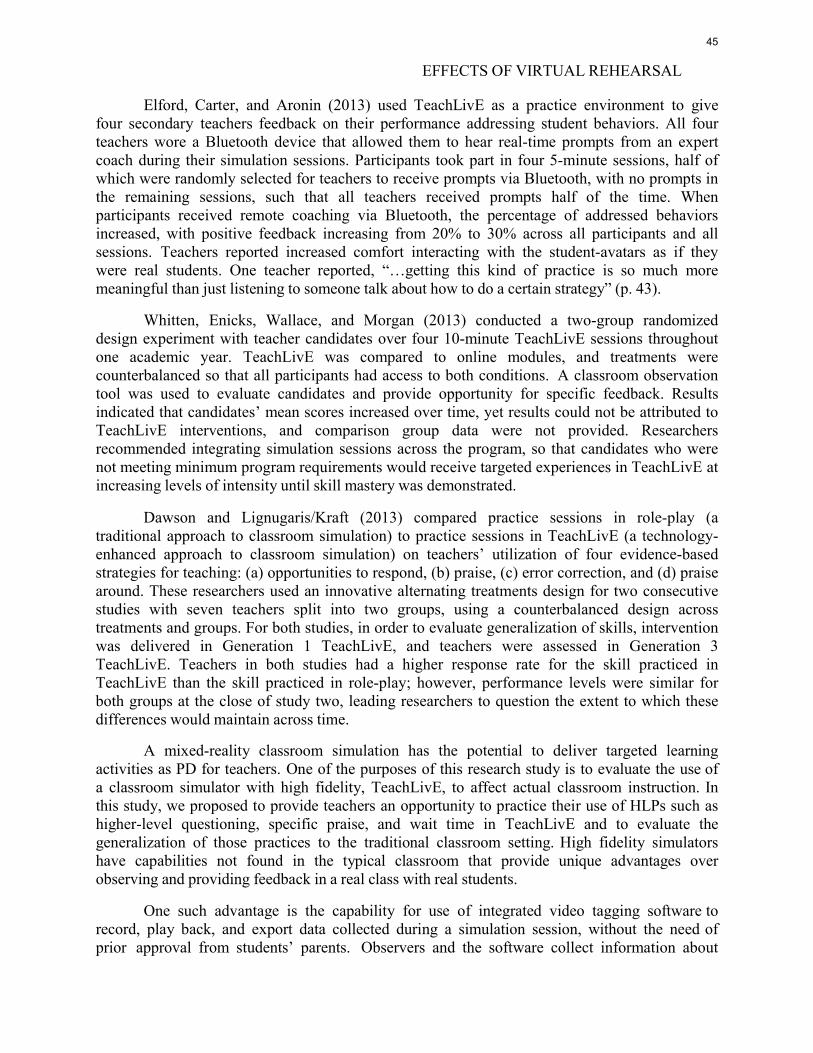
Elford, Carter, and Aronin (2013) used TeachLivE as a practice environment to give four secondary teachers feedback on their performance addressing student behaviors. All four teachers wore a Bluetooth device that allowed them to hear real-time prompts from an expert coach during their simulation sessions. Participants took part in four 5-minute sessions, half of which were randomly selected for teachers to receive prompts via Bluetooth, with no prompts in the remaining sessions, such that all teachers received prompts half of the time. When participants received remote coaching via Bluetooth, the percentage of addressed behaviors increased, with positive feedback increasing from 20% to 30% across all participants and all sessions. Teachers reported increased comfort interacting with the student-avatars as if they were real students. One teacher reported, “…getting this kind of practice is so much more meaningful than just listening to someone talk about how to do a certain strategy” (p. 43).
Whitten, Enicks, Wallace, and Morgan (2013) conducted a two-group randomized design experiment with teacher candidates over four 10-minute TeachLivE sessions throughout one academic year. TeachLivE was compared to online modules, and treatments were counterbalanced so that all participants had access to both conditions. A classroom observation tool was used to evaluate candidates and provide opportunity for specific feedback. Results indicated that candidates’ mean scores increased over time, yet results could not be attributed to TeachLivE interventions, and comparison group data were not provided. Researchers recommended integrating simulation sessions across the program, so that candidates who were not meeting minimum program requirements would receive targeted experiences in TeachLivE at increasing levels of intensity until skill mastery was demonstrated.
Dawson and Lignugaris/Kraft (2013) compared practice sessions in role-play (a traditional approach to classroom simulation) to practice sessions in TeachLivE (a technology- enhanced approach to classroom simulation) on teachers’ utilization of four evidence-based strategies for teaching: (a) opportunities to respond, (b) praise, (c) error correction, and (d) praise around. These researchers used an innovative alternating treatments design for two consecutive studies with seven teachers split into two groups, using a counterbalanced design across treatments and groups. For both studies, in order to evaluate generalization of skills, intervention was delivered in Generation 1 TeachLivE, and teachers were assessed in Generation 3 TeachLivE. Teachers in both studies had a higher response rate for the skill practiced in TeachLivE than the skill practiced in role-play; however, performance levels were similar for both groups at the close of study two, leading researchers to question the extent to which these differences would maintain across time.
A mixed-reality classroom simulation has the potential to deliver targeted learning activities as PD for teachers. One of the purposes of this research study is to evaluate the use of a classroom simulator with high fidelity, TeachLivE, to affect actual classroom instruction. In this study, we proposed to provide teachers an opportunity to practice their use of HLPs such as higher-level questioning, specific praise, and wait time in TeachLivE and to evaluate the generalization of those practices to the traditional classroom setting. High fidelity simulators have capabilities not found in the typical classroom that provide unique advantages over observing and providing feedback in a real class with real students.
One such advantage is the capability for use of integrated video tagging software to record, play back, and export data collected during a simulation session, without the need of prior approval from students’ parents. Observers and the software collect information about
EFFECTS OF VIRTUAL REHEARSAL
45
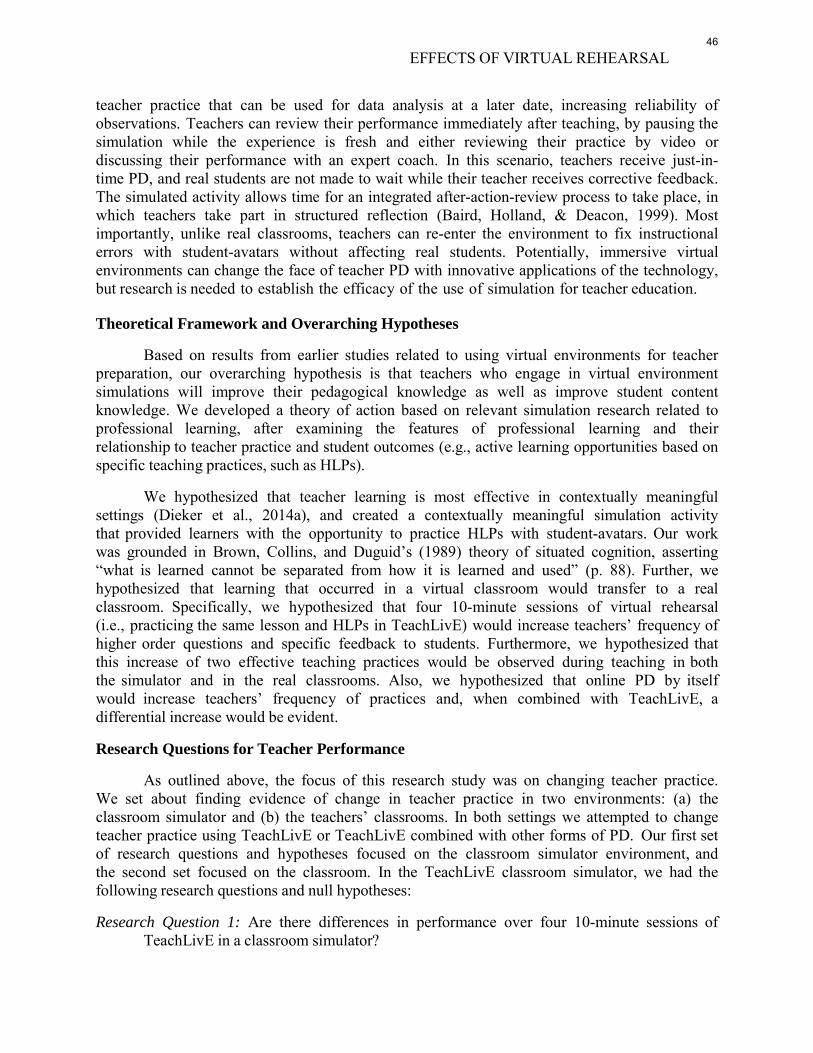
teacher practice that can be used for data analysis at a later date, increasing reliability of observations. Teachers can review their performance immediately after teaching, by pausing the simulation while the experience is fresh and either reviewing their practice by video or discussing their performance with an expert coach. In this scenario, teachers receive just-in- time PD, and real students are not made to wait while their teacher receives corrective feedback. The simulated activity allows time for an integrated after-action-review process to take place, in which teachers take part in structured reflection (Baird, Holland, & Deacon, 1999). Most importantly, unlike real classrooms, teachers can re-enter the environment to fix instructional errors with student-avatars without affecting real students. Potentially, immersive virtual environments can change the face of teacher PD with innovative applications of the technology, but research is needed to establish the efficacy of the use of simulation for teacher education.
Theoretical Framework and Overarching Hypotheses
Based on results from earlier studies related to using virtual environments for teacher preparation, our overarching hypothesis is that teachers who engage in virtual environment simulations will improve their pedagogical knowledge as well as improve student content knowledge. We developed a theory of action based on relevant simulation research related to professional learning, after examining the features of professional learning and their relationship to teacher practice and student outcomes (e.g., active learning opportunities based on specific teaching practices, such as HLPs).
We hypothesized that teacher learning is most effective in contextually meaningful settings (Dieker et al., 2014a), and created a contextually meaningful simulation activity that provided learners with the opportunity to practice HLPs with student-avatars. Our work was grounded in Brown, Collins, and Duguid’s (1989) theory of situated cognition, asserting “what is learned cannot be separated from how it is learned and used” (p. 88). Further, we hypothesized that learning that occurred in a virtual classroom would transfer to a real classroom. Specifically, we hypothesized that four 10-minute sessions of virtual rehearsal (i.e., practicing the same lesson and HLPs in TeachLivE) would increase teachers’ frequency of higher order questions and specific feedback to students. Furthermore, we hypothesized that this increase of two effective teaching practices would be observed during teaching in both the simulator and in the real classrooms. Also, we hypothesized that online PD by itself would increase teachers’ frequency of practices and, when combined with TeachLivE, a differential increase would be evident.
Research Questions for Teacher Performance
As outlined above, the focus of this research study was on changing teacher practice. We set about finding evidence of change in teacher practice in two environments: (a) the classroom simulator and (b) the teachers’ classrooms. In both settings we attempted to change teacher practice using TeachLivE or TeachLivE combined with other forms of PD. Our first set of research questions and hypotheses focused on the classroom simulator environment, and the second set focused on the classroom. In the TeachLivE classroom simulator, we had the following research questions and null hypotheses:
Research Question 1: Are there differences in performance over four 10-minute sessions of TeachLivE in a classroom simulator?
EFFECTS OF VIRTUAL REHEARSAL46
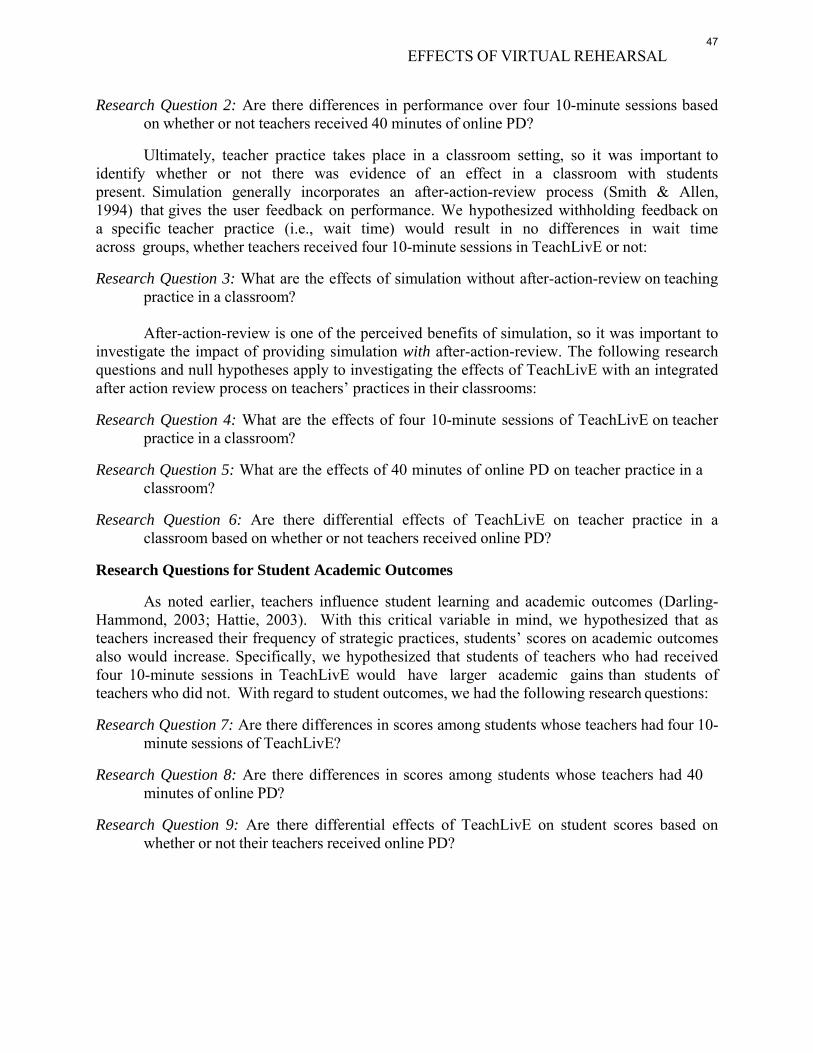
Research Question 2: Are there differences in performance over four 10-minute sessions based on whether or not teachers received 40 minutes of online PD?
Ultimately, teacher practice takes place in a classroom setting, so it was important to identify whether or not there was evidence of an effect in a classroom with students present. Simulation generally incorporates an after-action-review process (Smith & Allen, 1994) that gives the user feedback on performance. We hypothesized withholding feedback on a specific teacher practice (i.e., wait time) would result in no differences in wait time across groups, whether teachers received four 10-minute sessions in TeachLivE or not:
Research Question 3: What are the effects of simulation without after-action-review on teaching practice in a classroom?
After-action-review is one of the perceived benefits of simulation, so it was important to investigate the impact of providing simulation with after-action-review. The following research questions and null hypotheses apply to investigating the effects of TeachLivE with an integrated after action review process on teachers’ practices in their classrooms:
Research Question 4: What are the effects of four 10-minute sessions of TeachLivE on teacher practice in a classroom?
Research Question 5: What are the effects of 40 minutes of online PD on teacher practice in a classroom?
Research Question 6: Are there differential effects of TeachLivE on teacher practice in a classroom based on whether or not teachers received online PD?
Research Questions for Student Academic Outcomes
As noted earlier, teachers influence student learning and academic outcomes (Darling- Hammond, 2003; Hattie, 2003). With this critical variable in mind, we hypothesized that as teachers increased their frequency of strategic practices, students’ scores on academic outcomes also would increase. Specifically, we hypothesized that students of teachers who had received four 10-minute sessions in TeachLivE would have larger academic gains than students of teachers who did not. With regard to student outcomes, we had the following research questions:
Research Question 7: Are there differences in scores among students whose teachers had four 10-minute sessions of TeachLivE?
Research Question 8: Are there differences in scores among students whose teachers had 40 minutes of online PD?
Research Question 9: Are there differential effects of TeachLivE on student scores based on whether or not their teachers received online PD?
EFFECTS OF VIRTUAL REHEARSAL47
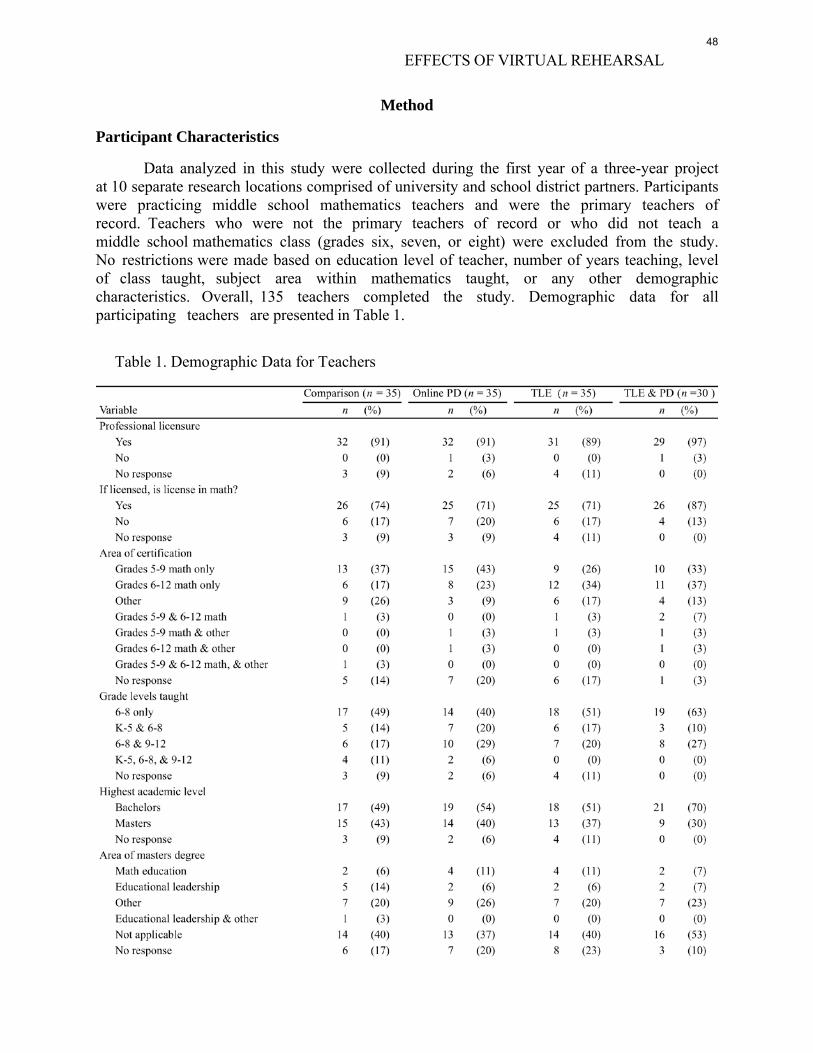
Method
Participant Characteristics
Data analyzed in this study were collected during the first year of a three-year project at 10 separate research locations comprised of university and school district partners. Participants were practicing middle school mathematics teachers and were the primary teachers of record. Teachers who were not the primary teachers of record or who did not teach a middle school mathematics class (grades six, seven, or eight) were excluded from the study. No restrictions were made based on education level of teacher, number of years teaching, level of class taught, subject area within mathematics taught, or any other demographic characteristics. Overall, 135 teachers completed the study. Demographic data for all participating teachers are presented in Table 1.
Table 1. Demographic Data for Teachers
EFFECTS OF VIRTUAL REHEARSAL48
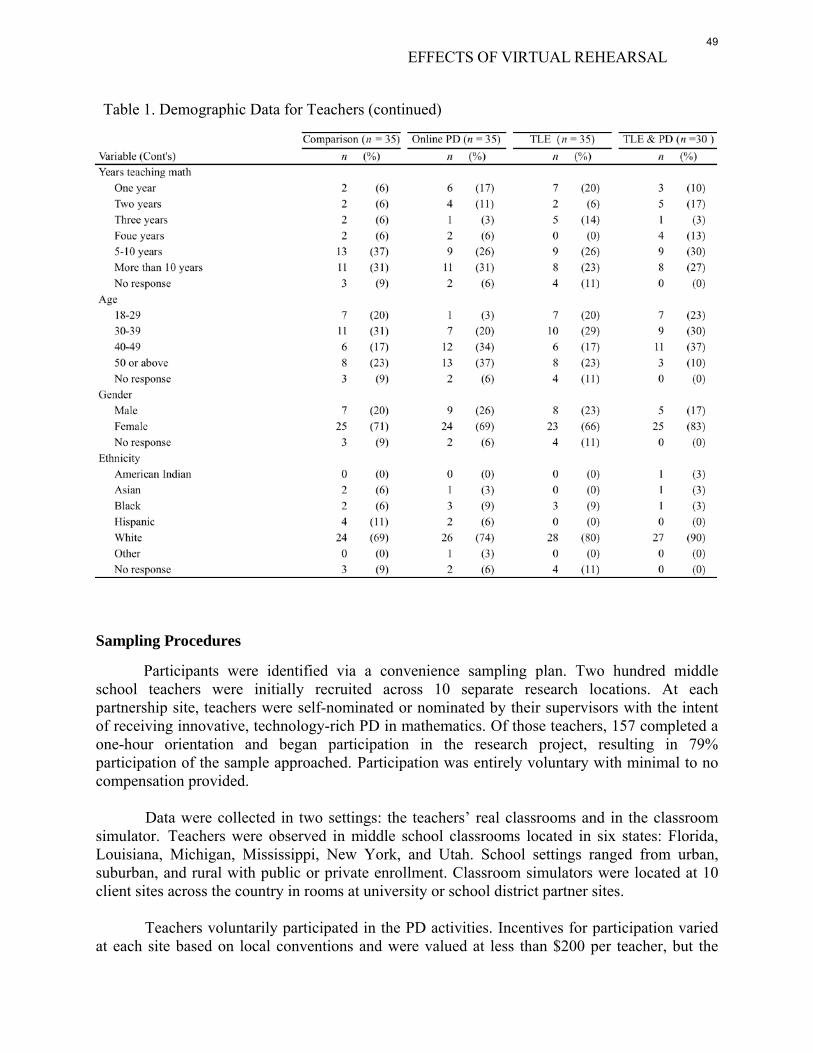
EFFECTS OF VIRTUAL REHEARSAL
Table 1. Demographic Data for Teachers (continued)
Sampling Procedures
Participants were identified via a convenience sampling plan. Two hundred middle school teachers were initially recruited across 10 separate research locations. At each partnership site, teachers were self-nominated or nominated by their supervisors with the intent of receiving innovative, technology-rich PD in mathematics. Of those teachers, 157 completed a one-hour orientation and began participation in the research project, resulting in 79% participation of the sample approached. Participation was entirely voluntary with minimal to no compensation provided.
Data were collected in two settings: the teachers’ real classrooms and in the classroom simulator. Teachers were observed in middle school classrooms located in six states: Florida, Louisiana, Michigan, Mississippi, New York, and Utah. School settings ranged from urban, suburban, and rural with public or private enrollment. Classroom simulators were located at 10 client sites across the country in rooms at university or school district partner sites.
Teachers voluntarily participated in the PD activities. Incentives for participation varied at each site based on local conventions and were valued at less than $200 per teacher, but the
49
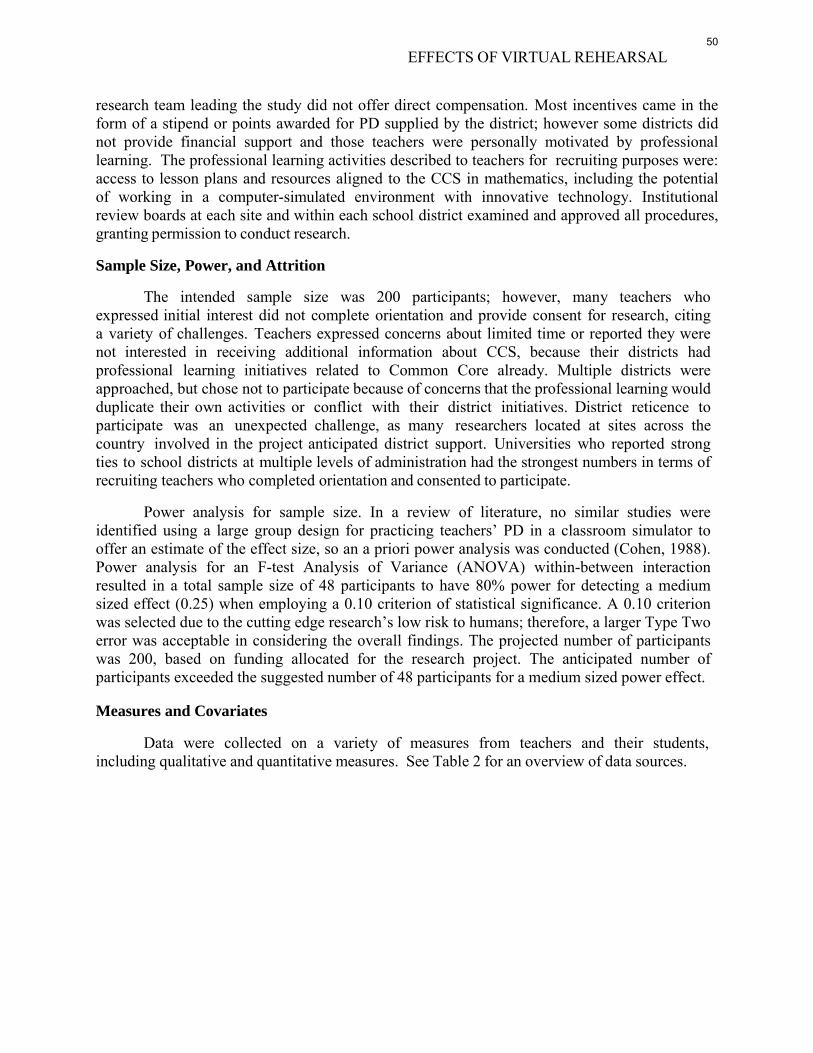
EFFECTS OF VIRTUAL REHEARSAL
research team leading the study did not offer direct compensation. Most incentives came in the form of a stipend or points awarded for PD supplied by the district; however some districts did not provide financial support and those teachers were personally motivated by professional learning. The professional learning activities described to teachers for recruiting purposes were: access to lesson plans and resources aligned to the CCS in mathematics, including the potential of working in a computer-simulated environment with innovative technology. Institutional review boards at each site and within each school district examined and approved all procedures, granting permission to conduct research.
Sample Size, Power, and Attrition
The intended sample size was 200 participants; however, many teachers who expressed initial interest did not complete orientation and provide consent for research, citing a variety of challenges. Teachers expressed concerns about limited time or reported they were not interested in receiving additional information about CCS, because their districts had professional learning initiatives related to Common Core already. Multiple districts were approached, but chose not to participate because of concerns that the professional learning would duplicate their own activities or conflict with their district initiatives. District reticence to participate was an unexpected challenge, as many researchers located at sites across the country involved in the project anticipated district support. Universities who reported strong ties to school districts at multiple levels of administration had the strongest numbers in terms of recruiting teachers who completed orientation and consented to participate.
Power analysis for sample size. In a review of literature, no similar studies were identified using a large group design for practicing teachers’ PD in a classroom simulator to offer an estimate of the effect size, so an a priori power analysis was conducted (Cohen, 1988). Power analysis for an F-test Analysis of Variance (ANOVA) within-between interaction resulted in a total sample size of 48 participants to have 80% power for detecting a medium sized effect (0.25) when employing a 0.10 criterion of statistical significance. A 0.10 criterion was selected due to the cutting edge research’s low risk to humans; therefore, a larger Type Two error was acceptable in considering the overall findings. The projected number of participants was 200, based on funding allocated for the research project. The anticipated number of participants exceeded the suggested number of 48 participants for a medium sized power effect.
Measures and Covariates
Data were collected on a variety of measures from teachers and their students, including qualitative and quantitative measures. See Table 2 for an overview of data sources.
50
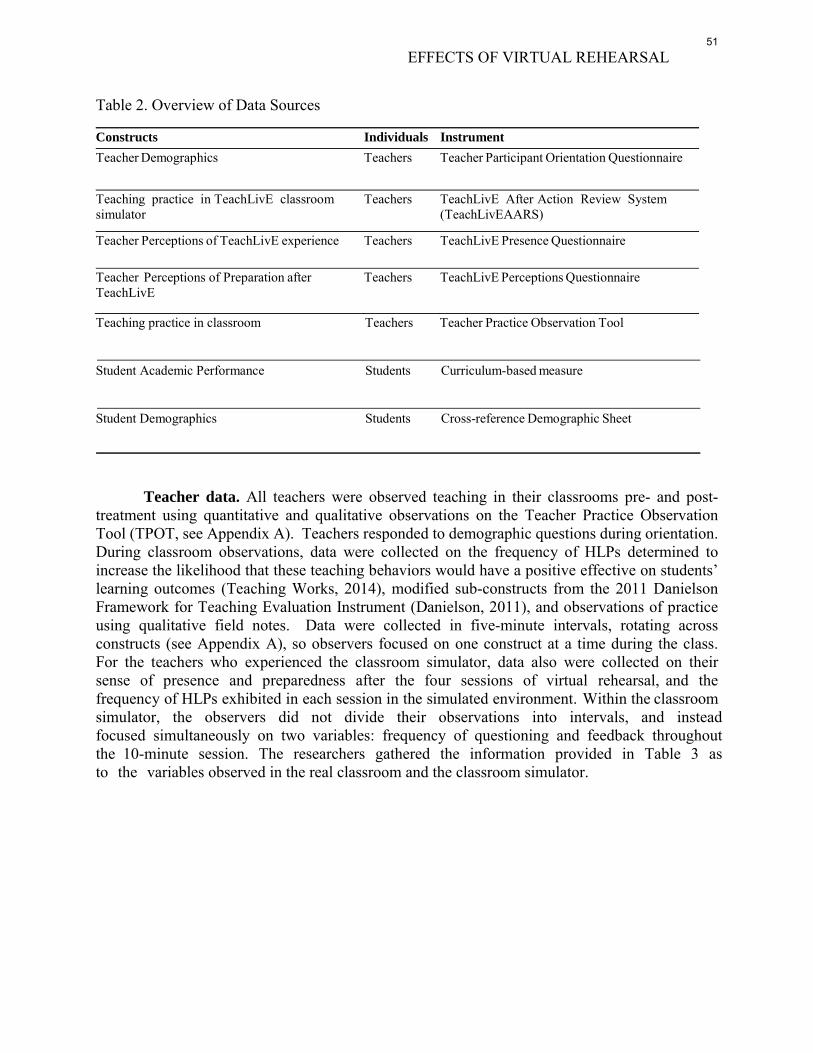
EFFECTS OF VIRTUAL REHEARSAL
Table 2. Overview of Data Sources
Constructs Individuals InstrumentTeacher Demographics Teachers Teacher Participant Orientation Questionnaire
Teaching practice in TeachLivE classroom simulator
Teachers TeachLivE After Action Review System (TeachLivEAARS)
Teacher Perceptions of TeachLivE experience Teachers TeachLivE Presence Questionnaire
Teacher Perceptions of Preparation after TeachLivE
Teachers TeachLivE Perceptions Questionnaire
Teaching practice in classroom Teachers Teacher Practice Observation Tool
Student Academic Performance Students Curriculum-based measure
Student Demographics Students Cross-reference Demographic Sheet
Teacher data. All teachers were observed teaching in their classrooms pre- and post- treatment using quantitative and qualitative observations on the Teacher Practice Observation Tool (TPOT, see Appendix A). Teachers responded to demographic questions during orientation. During classroom observations, data were collected on the frequency of HLPs determined to increase the likelihood that these teaching behaviors would have a positive effective on students’ learning outcomes (Teaching Works, 2014), modified sub-constructs from the 2011 Danielson Framework for Teaching Evaluation Instrument (Danielson, 2011), and observations of practice using qualitative field notes. Data were collected in five-minute intervals, rotating across constructs (see Appendix A), so observers focused on one construct at a time during the class. For the teachers who experienced the classroom simulator, data also were collected on their sense of presence and preparedness after the four sessions of virtual rehearsal, and the frequency of HLPs exhibited in each session in the simulated environment. Within the classroom simulator, the observers did not divide their observations into intervals, and instead focused simultaneously on two variables: frequency of questioning and feedback throughout the 10-minute session. The researchers gathered the information provided in Table 3 as to the variables observed in the real classroom and the classroom simulator.
51
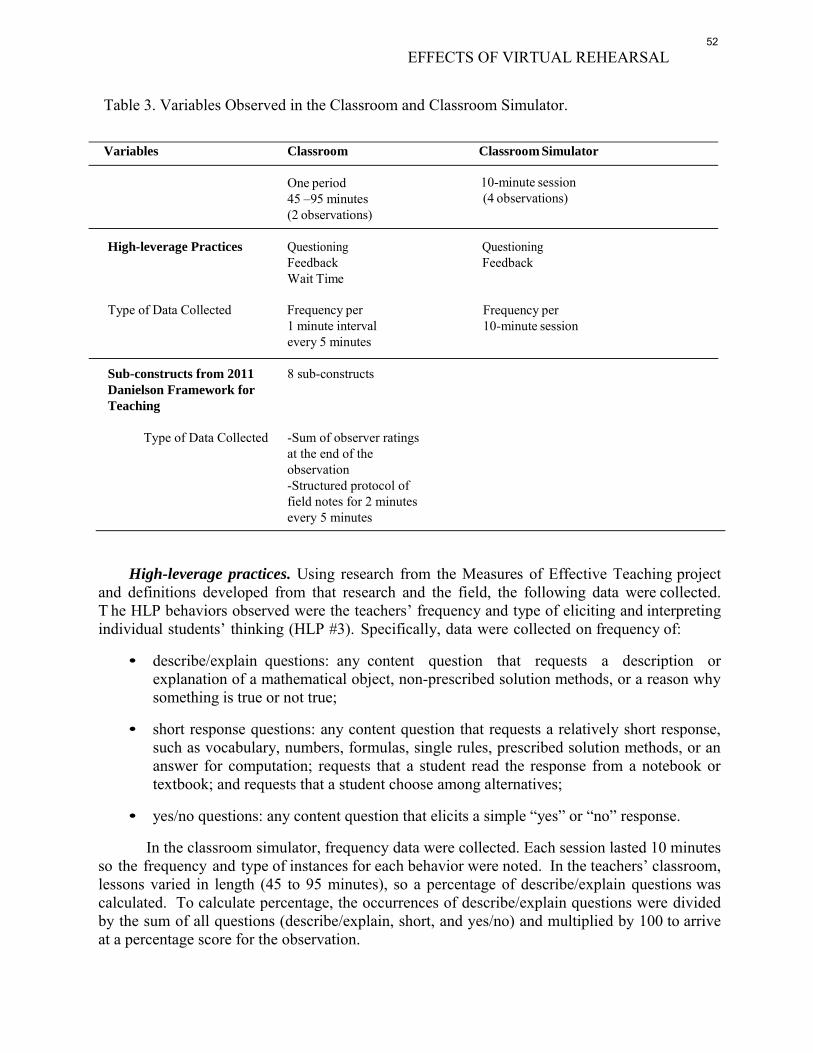
EFFECTS OF VIRTUAL REHEARSAL
Table 3. Variables Observed in the Classroom and Classroom Simulator.
Variables Classroom Classroom Simulator
One period 45 –95 minutes (2 observations)
10-minute session (4 observations)
High-leverage Practices Questioning Feedback Wait Time
Questioning Feedback
Type of Data Collected Frequency per 1 minute interval every 5 minutes
Sub-constructs from 2011 8 sub-constructs Danielson Framework for Teaching
Type of Data Collected -Sum of observer ratings at the end of the observation -Structured protocol of field notes for 2 minutes every 5 minutes
Frequency per 10-minute session
High-leverage practices. Using research from the Measures of Effective Teaching project and definitions developed from that research and the field, the following data were collected. T he HLP behaviors observed were the teachers’ frequency and type of eliciting and interpreting individual students’ thinking (HLP #3). Specifically, data were collected on frequency of:
• describe/explain questions: any content question that requests a description orexplanation of a mathematical object, non-prescribed solution methods, or a reason whysomething is true or not true;
• short response questions: any content question that requests a relatively short response,such as vocabulary, numbers, formulas, single rules, prescribed solution methods, or ananswer for computation; requests that a student read the response from a notebook ortextbook; and requests that a student choose among alternatives;
• yes/no questions: any content question that elicits a simple “yes” or “no” response.
In the classroom simulator, frequency data were collected. Each session lasted 10 minutes so the frequency and type of instances for each behavior were noted. In the teachers’ classroom, lessons varied in length (45 to 95 minutes), so a percentage of describe/explain questions was calculated. To calculate percentage, the occurrences of describe/explain questions were divided by the sum of all questions (describe/explain, short, and yes/no) and multiplied by 100 to arrive at a percentage score for the observation.
52
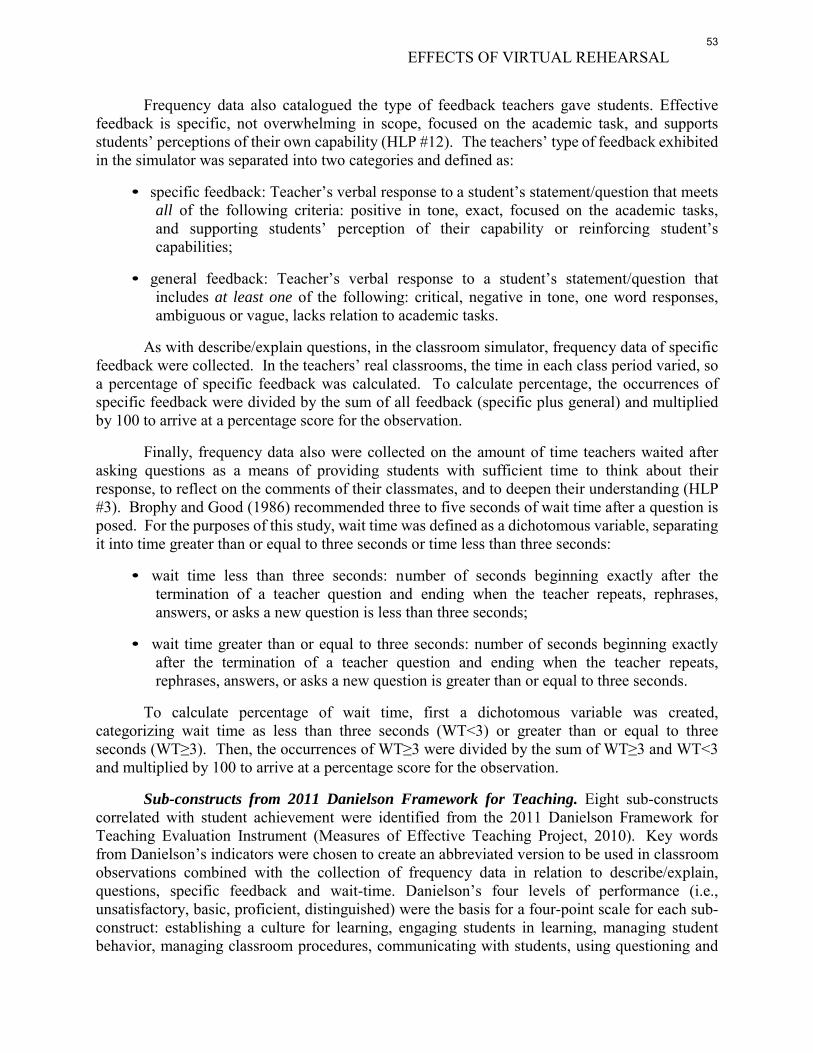
EFFECTS OF VIRTUAL REHEARSAL
Frequency data also catalogued the type of feedback teachers gave students. Effective feedback is specific, not overwhelming in scope, focused on the academic task, and supports students’ perceptions of their own capability (HLP #12). The teachers’ type of feedback exhibited in the simulator was separated into two categories and defined as:
• specific feedback: Teacher’s verbal response to a student’s statement/question that meetsall of the following criteria: positive in tone, exact, focused on the academic tasks, and supporting students’ perception of their capability or reinforcing student’s capabilities;
• general feedback: Teacher’s verbal response to a student’s statement/question thatincludes at least one of the following: critical, negative in tone, one word responses, ambiguous or vague, lacks relation to academic tasks.
As with describe/explain questions, in the classroom simulator, frequency data of specific feedback were collected. In the teachers’ real classrooms, the time in each class period varied, so a percentage of specific feedback was calculated. To calculate percentage, the occurrences of specific feedback were divided by the sum of all feedback (specific plus general) and multiplied by 100 to arrive at a percentage score for the observation.
Finally, frequency data also were collected on the amount of time teachers waited after asking questions as a means of providing students with sufficient time to think about their response, to reflect on the comments of their classmates, and to deepen their understanding (HLP #3). Brophy and Good (1986) recommended three to five seconds of wait time after a question is posed. For the purposes of this study, wait time was defined as a dichotomous variable, separating it into time greater than or equal to three seconds or time less than three seconds:
• wait time less than three seconds: number of seconds beginning exactly after thetermination of a teacher question and ending when the teacher repeats, rephrases, answers, or asks a new question is less than three seconds;
• wait time greater than or equal to three seconds: number of seconds beginning exactlyafter the termination of a teacher question and ending when the teacher repeats, rephrases, answers, or asks a new question is greater than or equal to three seconds.
To calculate percentage of wait time, first a dichotomous variable was created, categorizing wait time as less than three seconds (WT<3) or greater than or equal to three seconds (WT≥3). Then, the occurrences of WT≥3 were divided by the sum of WT≥3 and WT<3 and multiplied by 100 to arrive at a percentage score for the observation.
Sub-constructs from 2011 Danielson Framework for Teaching. Eight sub-constructs correlated with student achievement were identified from the 2011 Danielson Framework for Teaching Evaluation Instrument (Measures of Effective Teaching Project, 2010). Key words from Danielson’s indicators were chosen to create an abbreviated version to be used in classroom observations combined with the collection of frequency data in relation to describe/explain, questions, specific feedback and wait-time. Danielson’s four levels of performance (i.e., unsatisfactory, basic, proficient, distinguished) were the basis for a four-point scale for each sub- construct: establishing a culture for learning, engaging students in learning, managing student behavior, managing classroom procedures, communicating with students, using questioning and
53
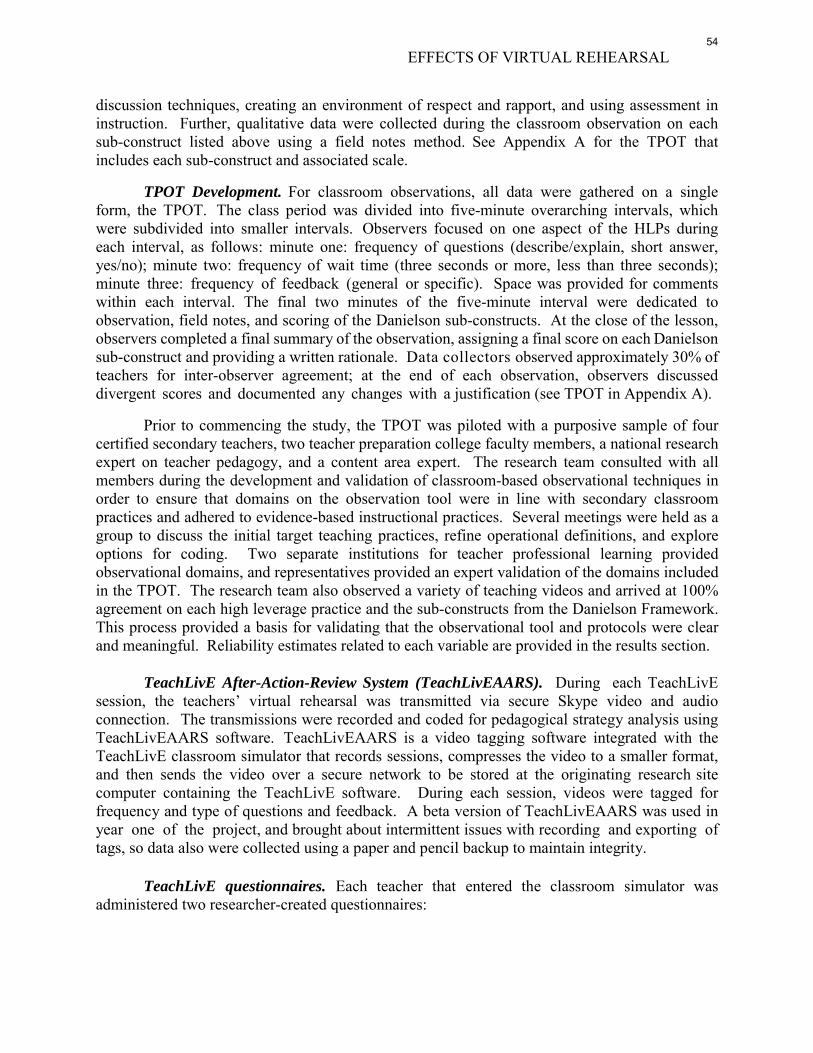
EFFECTS OF VIRTUAL REHEARSAL
discussion techniques, creating an environment of respect and rapport, and using assessment in instruction. Further, qualitative data were collected during the classroom observation on each sub-construct listed above using a field notes method. See Appendix A for the TPOT that includes each sub-construct and associated scale.
TPOT Development. For classroom observations, all data were gathered on a single form, the TPOT. The class period was divided into five-minute overarching intervals, which were subdivided into smaller intervals. Observers focused on one aspect of the HLPs during each interval, as follows: minute one: frequency of questions (describe/explain, short answer, yes/no); minute two: frequency of wait time (three seconds or more, less than three seconds); minute three: frequency of feedback (general or specific). Space was provided for comments within each interval. The final two minutes of the five-minute interval were dedicated to observation, field notes, and scoring of the Danielson sub-constructs. At the close of the lesson, observers completed a final summary of the observation, assigning a final score on each Danielson sub-construct and providing a written rationale. Data collectors observed approximately 30% of teachers for inter-observer agreement; at the end of each observation, observers discussed divergent scores and documented any changes with a justification (see TPOT in Appendix A).
Prior to commencing the study, the TPOT was piloted with a purposive sample of four certified secondary teachers, two teacher preparation college faculty members, a national research expert on teacher pedagogy, and a content area expert. The research team consulted with all members during the development and validation of classroom-based observational techniques in order to ensure that domains on the observation tool were in line with secondary classroom practices and adhered to evidence-based instructional practices. Several meetings were held as a group to discuss the initial target teaching practices, refine operational definitions, and explore options for coding. Two separate institutions for teacher professional learning provided observational domains, and representatives provided an expert validation of the domains included in the TPOT. The research team also observed a variety of teaching videos and arrived at 100% agreement on each high leverage practice and the sub-constructs from the Danielson Framework. This process provided a basis for validating that the observational tool and protocols were clear and meaningful. Reliability estimates related to each variable are provided in the results section.
TeachLivE After-Action-Review System (TeachLivEAARS). During each TeachLivE session, the teachers’ virtual rehearsal was transmitted via secure Skype video and audio connection. The transmissions were recorded and coded for pedagogical strategy analysis using TeachLivEAARS software. TeachLivEAARS is a video tagging software integrated with the TeachLivE classroom simulator that records sessions, compresses the video to a smaller format, and then sends the video over a secure network to be stored at the originating research site computer containing the TeachLivE software. During each session, videos were tagged for frequency and type of questions and feedback. A beta version of TeachLivEAARS was used in year one of the project, and brought about intermittent issues with recording and exporting of tags, so data also were collected using a paper and pencil backup to maintain integrity.
TeachLivE questionnaires. Each teacher that entered the classroom simulator was administered two researcher-created questionnaires:
54
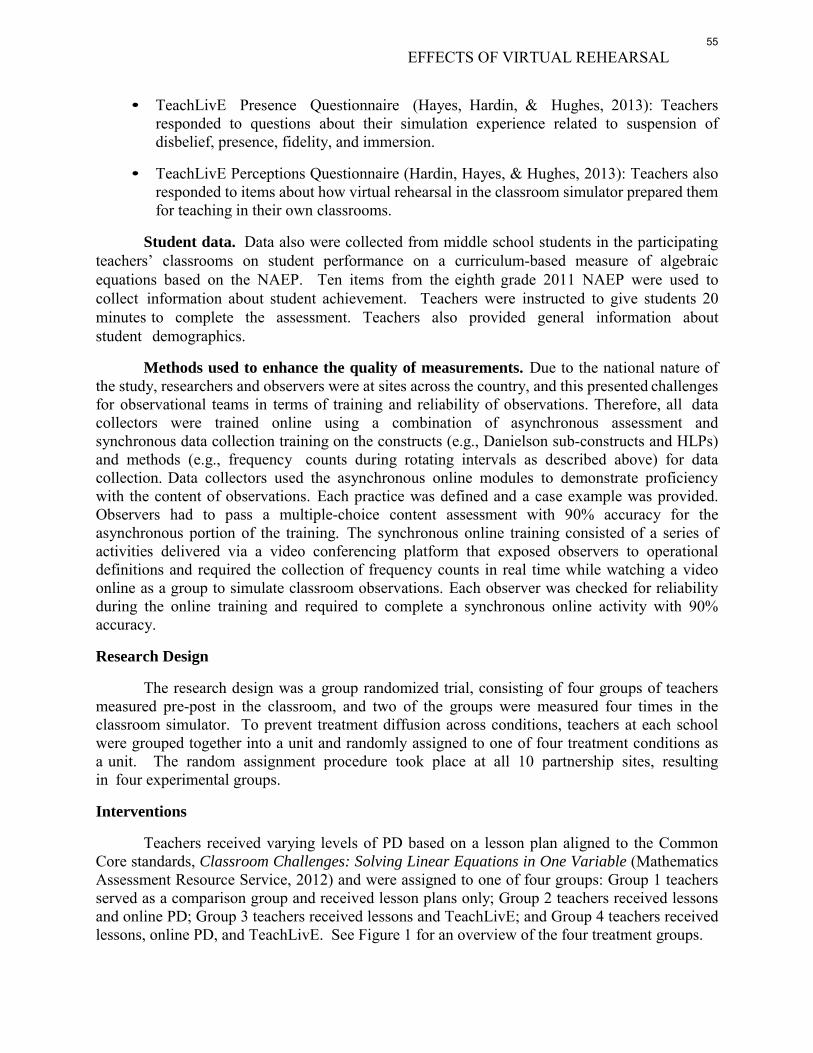
EFFECTS OF VIRTUAL REHEARSAL
• TeachLivE Presence Questionnaire (Hayes, Hardin, & Hughes, 2013): Teachersresponded to questions about their simulation experience related to suspension ofdisbelief, presence, fidelity, and immersion.
• TeachLivE Perceptions Questionnaire (Hardin, Hayes, & Hughes, 2013): Teachers alsoresponded to items about how virtual rehearsal in the classroom simulator prepared themfor teaching in their own classrooms.
Student data. Data also were collected from middle school students in the participating teachers’ classrooms on student performance on a curriculum-based measure of algebraic equations based on the NAEP. Ten items from the eighth grade 2011 NAEP were used to collect information about student achievement. Teachers were instructed to give students 20 minutes to complete the assessment. Teachers also provided general information about student demographics.
Methods used to enhance the quality of measurements. Due to the national nature of the study, researchers and observers were at sites across the country, and this presented challenges for observational teams in terms of training and reliability of observations. Therefore, all data collectors were trained online using a combination of asynchronous assessment and synchronous data collection training on the constructs (e.g., Danielson sub-constructs and HLPs) and methods (e.g., frequency counts during rotating intervals as described above) for data collection. Data collectors used the asynchronous online modules to demonstrate proficiency with the content of observations. Each practice was defined and a case example was provided. Observers had to pass a multiple-choice content assessment with 90% accuracy for the asynchronous portion of the training. The synchronous online training consisted of a series of activities delivered via a video conferencing platform that exposed observers to operational definitions and required the collection of frequency counts in real time while watching a video online as a group to simulate classroom observations. Each observer was checked for reliability during the online training and required to complete a synchronous online activity with 90% accuracy.
Research Design
The research design was a group randomized trial, consisting of four groups of teachers measured pre-post in the classroom, and two of the groups were measured four times in the classroom simulator. To prevent treatment diffusion across conditions, teachers at each school were grouped together into a unit and randomly assigned to one of four treatment conditions as a unit. The random assignment procedure took place at all 10 partnership sites, resulting in four experimental groups.
Interventions
Teachers received varying levels of PD based on a lesson plan aligned to the Common Core standards, Classroom Challenges: Solving Linear Equations in One Variable (Mathematics Assessment Resource Service, 2012) and were assigned to one of four groups: Group 1 teachers served as a comparison group and received lesson plans only; Group 2 teachers received lessons and online PD; Group 3 teachers received lessons and TeachLivE; and Group 4 teachers received lessons, online PD, and TeachLivE. See Figure 1 for an overview of the four treatment groups.
55
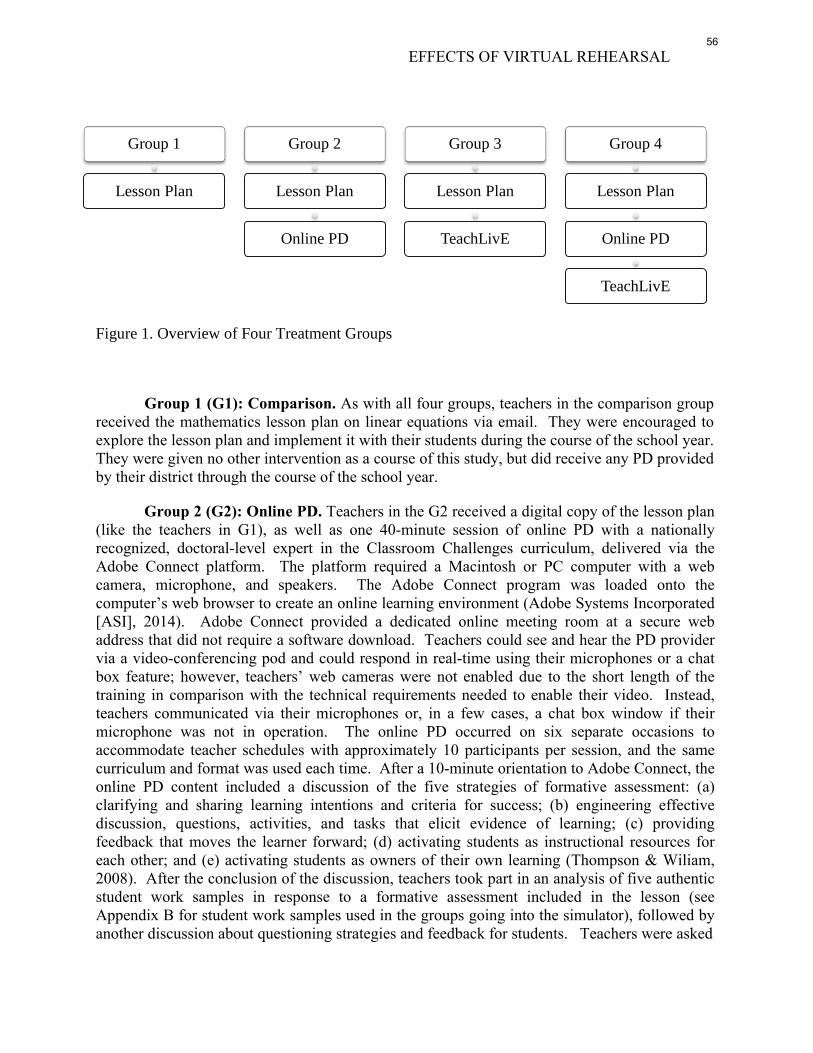
Figure 1. Overview of Four Treatment Groups
Group 1
Lesson Plan
Group 2
Lesson Plan
Online PD
Group 3
Lesson Plan
TeachLivE
Group 4
Lesson Plan
Online PD
TeachLivE
Group 1 (G1): Comparison. As with all four groups, teachers in the comparison group received the mathematics lesson plan on linear equations via email. They were encouraged to explore the lesson plan and implement it with their students during the course of the school year. They were given no other intervention as a course of this study, but did receive any PD provided by their district through the course of the school year.
Group 2 (G2): Online PD. Teachers in the G2 received a digital copy of the lesson plan (like the teachers in G1), as well as one 40-minute session of online PD with a nationally recognized, doctoral-level expert in the Classroom Challenges curriculum, delivered via the Adobe Connect platform. The platform required a Macintosh or PC computer with a web camera, microphone, and speakers. The Adobe Connect program was loaded onto the computer’s web browser to create an online learning environment (Adobe Systems Incorporated [ASI], 2014). Adobe Connect provided a dedicated online meeting room at a secure web address that did not require a software download. Teachers could see and hear the PD provider via a video-conferencing pod and could respond in real-time using their microphones or a chat box feature; however, teachers’ web cameras were not enabled due to the short length of the training in comparison with the technical requirements needed to enable their video. Instead, teachers communicated via their microphones or, in a few cases, a chat box window if their microphone was not in operation. The online PD occurred on six separate occasions to accommodate teacher schedules with approximately 10 participants per session, and the same curriculum and format was used each time. After a 10-minute orientation to Adobe Connect, the online PD content included a discussion of the five strategies of formative assessment: (a) clarifying and sharing learning intentions and criteria for success; (b) engineering effective discussion, questions, activities, and tasks that elicit evidence of learning; (c) providing feedback that moves the learner forward; (d) activating students as instructional resources for each other; and (e) activating students as owners of their own learning (Thompson & Wiliam, 2008). After the conclusion of the discussion, teachers took part in an analysis of five authentic student work samples in response to a formative assessment included in the lesson (see Appendix B for student work samples used in the groups going into the simulator), followed by another discussion about questioning strategies and feedback for students. Teachers were asked
EFFECTS OF VIRTUAL REHEARSAL56
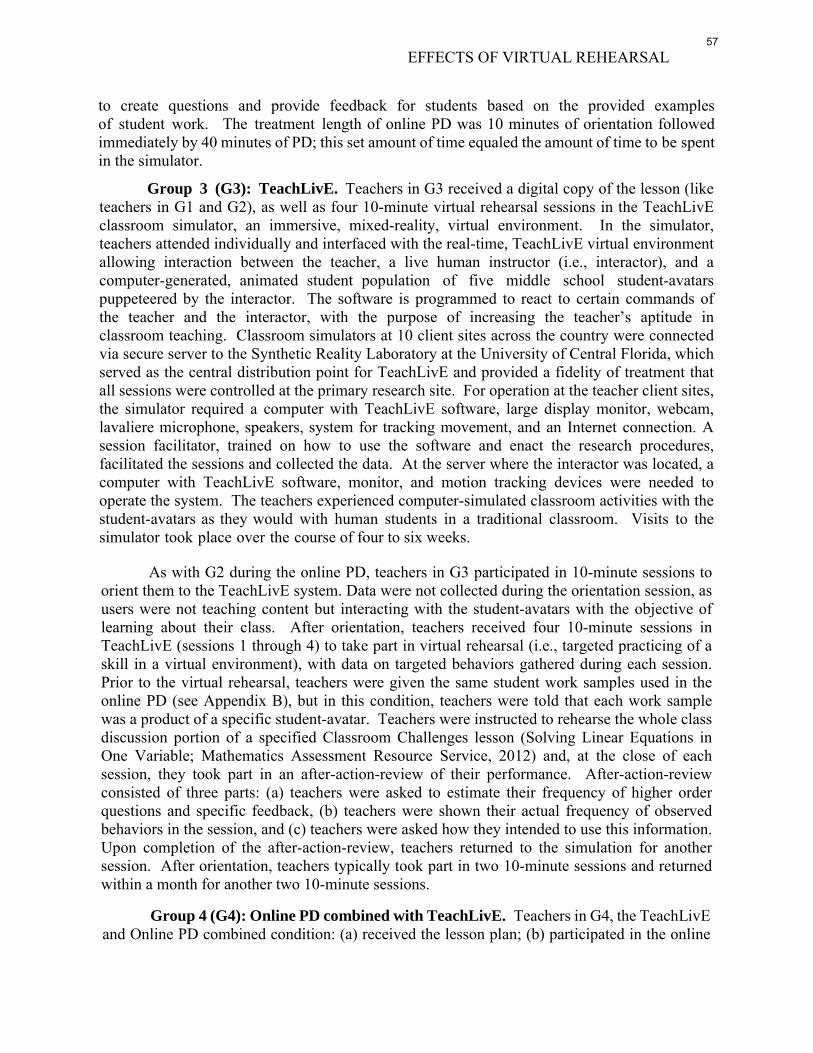
EFFECTS OF VIRTUAL REHEARSAL
to create questions and provide feedback for students based on the provided examples of student work. The treatment length of online PD was 10 minutes of orientation followed immediately by 40 minutes of PD; this set amount of time equaled the amount of time to be spent in the simulator.
Group 3 (G3): TeachLivE. Teachers in G3 received a digital copy of the lesson (like teachers in G1 and G2), as well as four 10-minute virtual rehearsal sessions in the TeachLivE classroom simulator, an immersive, mixed-reality, virtual environment. In the simulator, teachers attended individually and interfaced with the real-time, TeachLivE virtual environment allowing interaction between the teacher, a live human instructor (i.e., interactor), and a computer-generated, animated student population of five middle school student-avatars puppeteered by the interactor. The software is programmed to react to certain commands of the teacher and the interactor, with the purpose of increasing the teacher’s aptitude in classroom teaching. Classroom simulators at 10 client sites across the country were connected via secure server to the Synthetic Reality Laboratory at the University of Central Florida, which served as the central distribution point for TeachLivE and provided a fidelity of treatment that all sessions were controlled at the primary research site. For operation at the teacher client sites, the simulator required a computer with TeachLivE software, large display monitor, webcam, lavaliere microphone, speakers, system for tracking movement, and an Internet connection. A session facilitator, trained on how to use the software and enact the research procedures, facilitated the sessions and collected the data. At the server where the interactor was located, a computer with TeachLivE software, monitor, and motion tracking devices were needed to operate the system. The teachers experienced computer-simulated classroom activities with the student-avatars as they would with human students in a traditional classroom. Visits to the simulator took place over the course of four to six weeks.
As with G2 during the online PD, teachers in G3 participated in 10-minute sessions to orient them to the TeachLivE system. Data were not collected during the orientation session, as users were not teaching content but interacting with the student-avatars with the objective of learning about their class. After orientation, teachers received four 10-minute sessions in TeachLivE (sessions 1 through 4) to take part in virtual rehearsal (i.e., targeted practicing of a skill in a virtual environment), with data on targeted behaviors gathered during each session. Prior to the virtual rehearsal, teachers were given the same student work samples used in the online PD (see Appendix B), but in this condition, teachers were told that each work sample was a product of a specific student-avatar. Teachers were instructed to rehearse the whole class discussion portion of a specified Classroom Challenges lesson (Solving Linear Equations in One Variable; Mathematics Assessment Resource Service, 2012) and, at the close of each session, they took part in an after-action-review of their performance. After-action-review consisted of three parts: (a) teachers were asked to estimate their frequency of higher order questions and specific feedback, (b) teachers were shown their actual frequency of observed behaviors in the session, and (c) teachers were asked how they intended to use this information. Upon completion of the after-action-review, teachers returned to the simulation for another session. After orientation, teachers typically took part in two 10-minute sessions and returned within a month for another two 10-minute sessions.
Group 4 (G4): Online PD combined with TeachLivE. Teachers in G4, the TeachLivE and Online PD combined condition: (a) received the lesson plan; (b) participated in the online
57
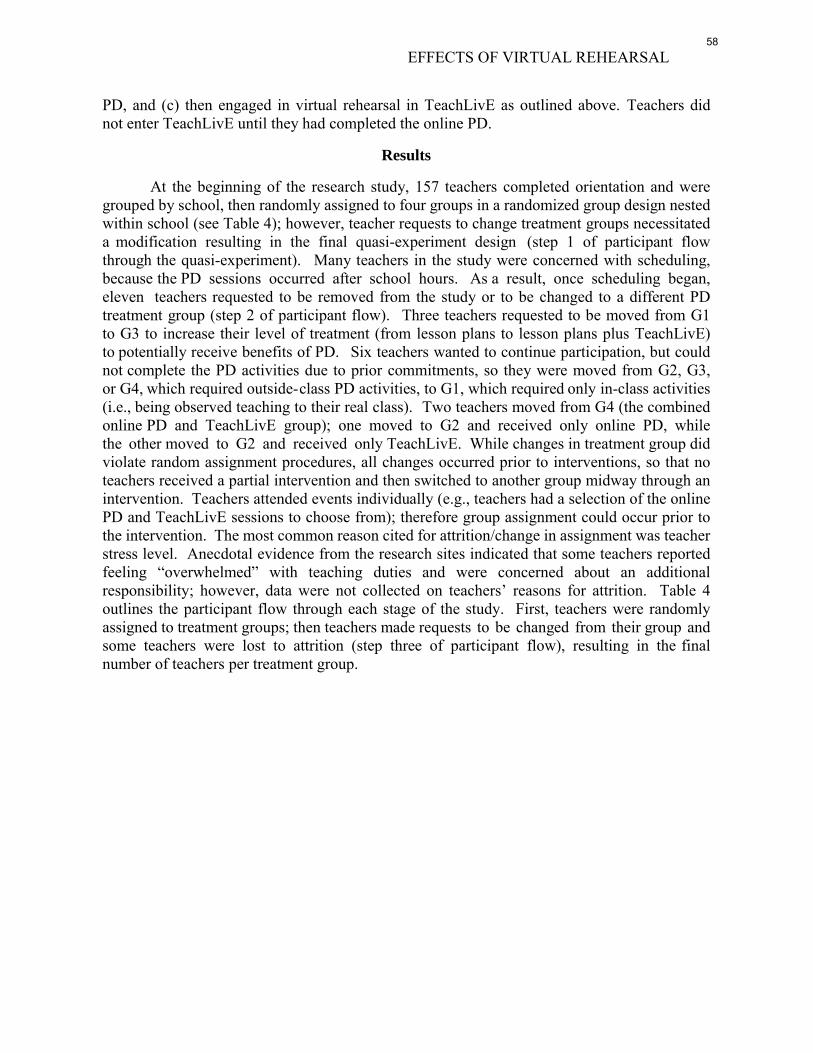
EFFECTS OF VIRTUAL REHEARSAL
PD, and (c) then engaged in virtual rehearsal in TeachLivE as outlined above. Teachers did not enter TeachLivE until they had completed the online PD.
Results
At the beginning of the research study, 157 teachers completed orientation and were grouped by school, then randomly assigned to four groups in a randomized group design nested within school (see Table 4); however, teacher requests to change treatment groups necessitated a modification resulting in the final quasi-experiment design (step 1 of participant flow through the quasi-experiment). Many teachers in the study were concerned with scheduling, because the PD sessions occurred after school hours. As a result, once scheduling began, eleven teachers requested to be removed from the study or to be changed to a different PD treatment group (step 2 of participant flow). Three teachers requested to be moved from G1 to G3 to increase their level of treatment (from lesson plans to lesson plans plus TeachLivE) to potentially receive benefits of PD. Six teachers wanted to continue participation, but could not complete the PD activities due to prior commitments, so they were moved from G2, G3, or G4, which required outside-class PD activities, to G1, which required only in-class activities (i.e., being observed teaching to their real class). Two teachers moved from G4 (the combined online PD and TeachLivE group); one moved to G2 and received only online PD, while the other moved to G2 and received only TeachLivE. While changes in treatment group did violate random assignment procedures, all changes occurred prior to interventions, so that no teachers received a partial intervention and then switched to another group midway through an intervention. Teachers attended events individually (e.g., teachers had a selection of the online PD and TeachLivE sessions to choose from); therefore group assignment could occur prior to the intervention. The most common reason cited for attrition/change in assignment was teacher stress level. Anecdotal evidence from the research sites indicated that some teachers reported feeling “overwhelmed” with teaching duties and were concerned about an additional responsibility; however, data were not collected on teachers’ reasons for attrition. Table 4 outlines the participant flow through each stage of the study. First, teachers were randomly assigned to treatment groups; then teachers made requests to be changed from their group and some teachers were lost to attrition (step three of participant flow), resulting in the final number of teachers per treatment group.
58
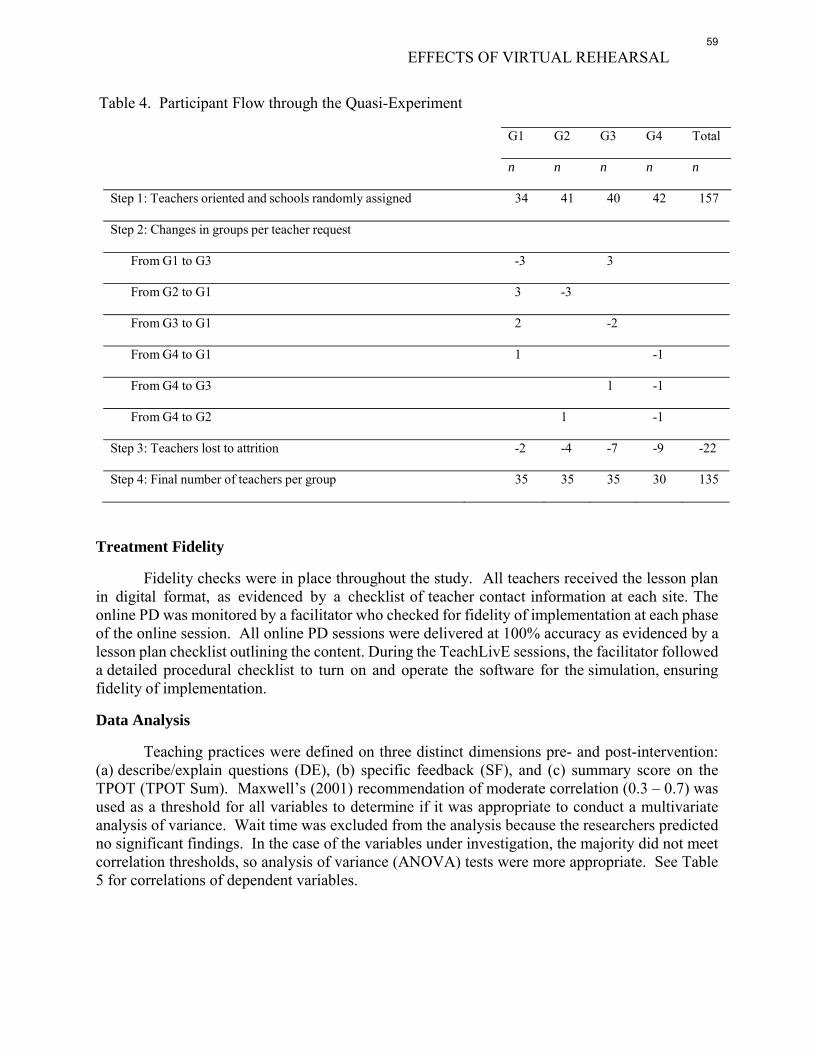
EFFECTS OF VIRTUAL REHEARSAL
Table 4. Participant Flow through the Quasi-Experiment
G1 G2 G3 G4 Total
n n n n n
Step 1: Teachers oriented and schools randomly assigned 34 41 40 42 157
Step 2: Changes in groups per teacher request
From G1 to G3 -3 3
From G2 to G1 3 -3
From G3 to G1 2 -2
From G4 to G1 1 -1
From G4 to G3 1 -1
From G4 to G2 1 -1
Step 3: Teachers lost to attrition -2 -4 -7 -9 -22
Step 4: Final number of teachers per group 35 35 35 30 135
Treatment Fidelity
Fidelity checks were in place throughout the study. All teachers received the lesson plan in digital format, as evidenced by a checklist of teacher contact information at each site. The online PD was monitored by a facilitator who checked for fidelity of implementation at each phase of the online session. All online PD sessions were delivered at 100% accuracy as evidenced by a lesson plan checklist outlining the content. During the TeachLivE sessions, the facilitator followed a detailed procedural checklist to turn on and operate the software for the simulation, ensuring fidelity of implementation.
Data Analysis
Teaching practices were defined on three distinct dimensions pre- and post-intervention: (a) describe/explain questions (DE), (b) specific feedback (SF), and (c) summary score on the TPOT (TPOT Sum). Maxwell’s (2001) recommendation of moderate correlation (0.3 – 0.7) was used as a threshold for all variables to determine if it was appropriate to conduct a multivariate analysis of variance. Wait time was excluded from the analysis because the researchers predicted no significant findings. In the case of the variables under investigation, the majority did not meet correlation thresholds, so analysis of variance (ANOVA) tests were more appropriate. See Table 5 for correlations of dependent variables.
59
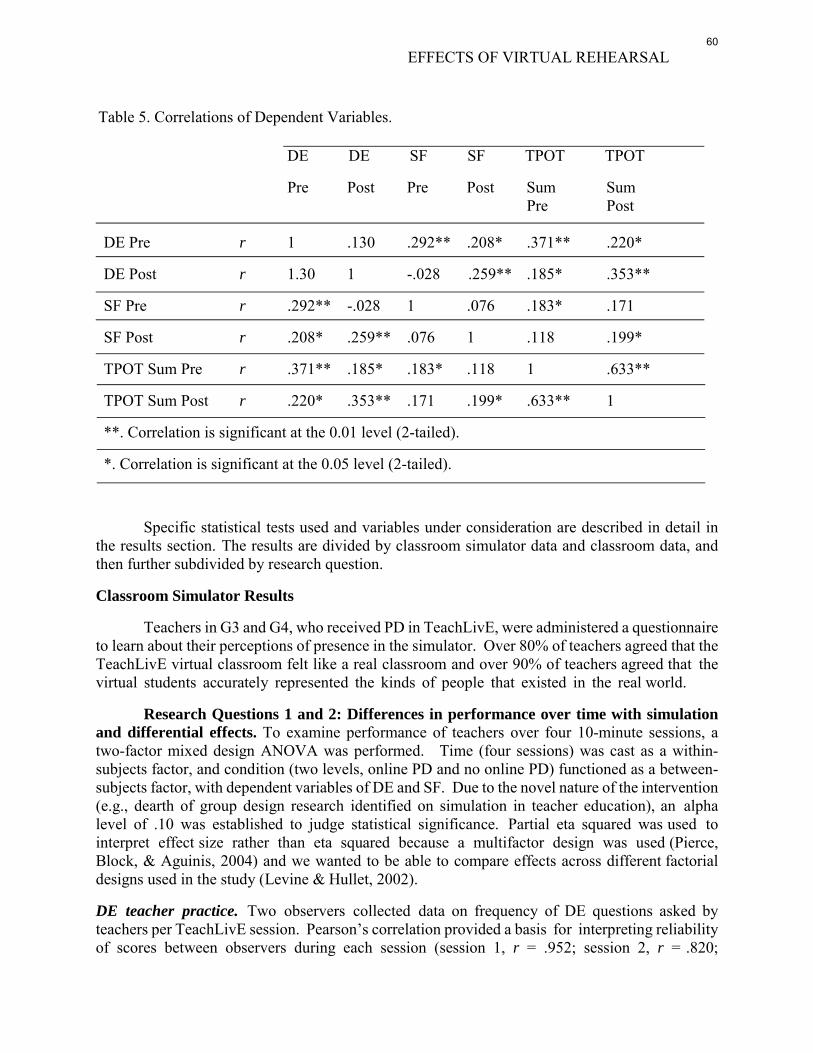
EFFECTS OF VIRTUAL REHEARSAL
Table 5. Correlations of Dependent Variables.
DE DE SF SF TPOT TPOT
Pre Post Pre Post Sum Sum Pre Post
DE Pre r 1 .130 .292** .208* .371** .220*
DE Post r 1.30 1 -.028 .259** .185* .353**
SF Pre r .292** -.028 1 .076 .183* .171
SF Post r .208* .259** .076 1 .118 .199*
TPOT Sum Pre r .371** .185* .183* .118 1 .633**
TPOT Sum Post r .220* .353** .171 .199* .633** 1
**. Correlation is significant at the 0.01 level (2-tailed).
*. Correlation is significant at the 0.05 level (2-tailed).
Specific statistical tests used and variables under consideration are described in detail in the results section. The results are divided by classroom simulator data and classroom data, and then further subdivided by research question.
Classroom Simulator Results
Teachers in G3 and G4, who received PD in TeachLivE, were administered a questionnaire to learn about their perceptions of presence in the simulator. Over 80% of teachers agreed that the TeachLivE virtual classroom felt like a real classroom and over 90% of teachers agreed that the virtual students accurately represented the kinds of people that existed in the real world.
Research Questions 1 and 2: Differences in performance over time with simulation and differential effects. To examine performance of teachers over four 10-minute sessions, a two-factor mixed design ANOVA was performed. Time (four sessions) was cast as a within-subjects factor, and condition (two levels, online PD and no online PD) functioned as a between-subjects factor, with dependent variables of DE and SF. Due to the novel nature of the intervention (e.g., dearth of group design research identified on simulation in teacher education), an alpha level of .10 was established to judge statistical significance. Partial eta squared was used to interpret effect size rather than eta squared because a multifactor design was used (Pierce, Block, & Aguinis, 2004) and we wanted to be able to compare effects across different factorial designs used in the study (Levine & Hullet, 2002).
DE teacher practice. Two observers collected data on frequency of DE questions asked by teachers per TeachLivE session. Pearson’s correlation provided a basis for interpreting reliability of scores between observers during each session (session 1, r = .952; session 2, r = .820;
60
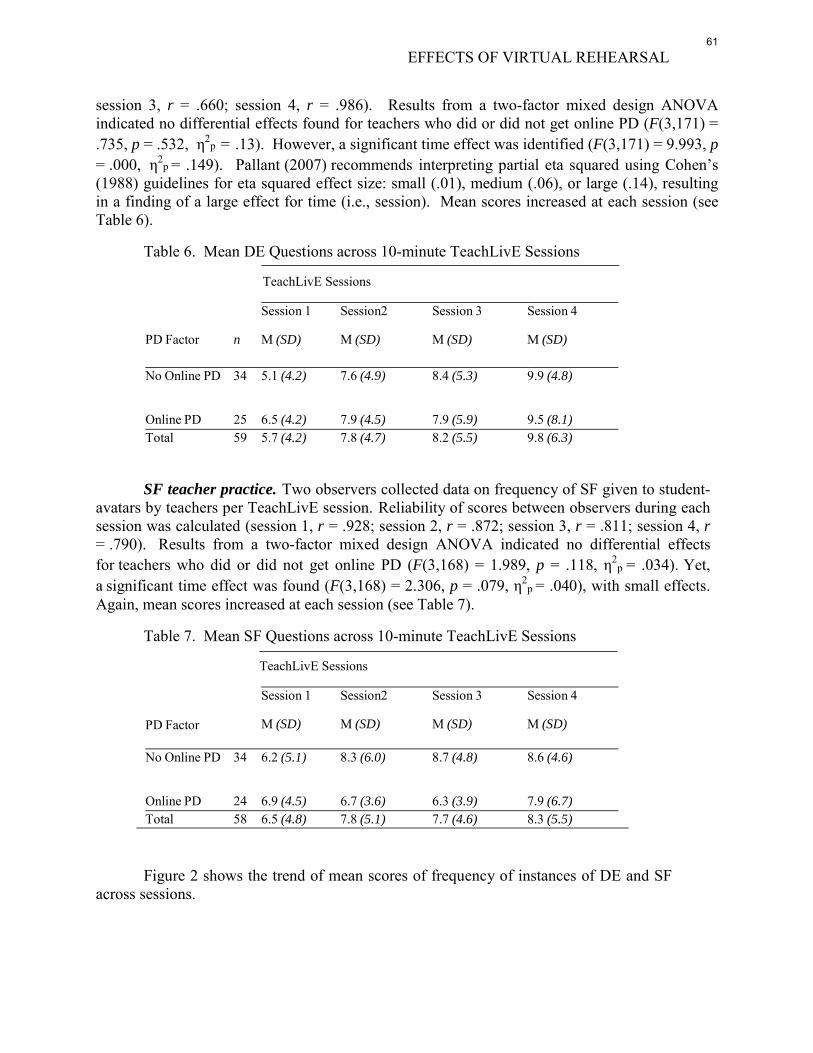
EFFECTS OF VIRTUAL REHEARSAL
session 3, r = .660; session 4, r = .986). Results from a two-factor mixed design ANOVA indicated no differential effects found for teachers who did or did not get online PD (F(3,171) = .735, p = .532, η2
p = .13). However, a significant time effect was identified (F(3,171) = 9.993, p = .000, η2
p = .149). Pallant (2007) recommends interpreting partial eta squared using Cohen’s (1988) guidelines for eta squared effect size: small (.01), medium (.06), or large (.14), resulting in a finding of a large effect for time (i.e., session). Mean scores increased at each session (see Table 6).
Table 6. Mean DE Questions across 10-minute TeachLivE Sessions
TeachLivE Sessions
PD Factor n
Session 1
M (SD)
Session2
M (SD)
Session 3
M (SD)
Session 4
M (SD)
No Online PD 34 5.1 (4.2) 7.6 (4.9) 8.4 (5.3) 9.9 (4.8)
Online PD 25 6.5 (4.2) 7.9 (4.5) 7.9 (5.9) 9.5 (8.1) Total 59 5.7 (4.2) 7.8 (4.7) 8.2 (5.5) 9.8 (6.3)
SF teacher practice. Two observers collected data on frequency of SF given to student- avatars by teachers per TeachLivE session. Reliability of scores between observers during each session was calculated (session 1, r = .928; session 2, r = .872; session 3, r = .811; session 4, r = .790). Results from a two-factor mixed design ANOVA indicated no differential effects for teachers who did or did not get online PD (F(3,168) = 1.989, p = .118, η2
p = .034). Yet, a significant time effect was found (F(3,168) = 2.306, p = .079, η2
p = .040), with small effects. Again, mean scores increased at each session (see Table 7).
Table 7. Mean SF Questions across 10-minute TeachLivE Sessions
TeachLivE Sessions
PD Factor
Session 1
M (SD)
Session2
M (SD)
Session 3
M (SD)
Session 4
M (SD)
No Online PD 34 6.2 (5.1) 8.3 (6.0) 8.7 (4.8) 8.6 (4.6)
Online PD 24 6.9 (4.5) 6.7 (3.6) 6.3 (3.9) 7.9 (6.7) Total 58 6.5 (4.8) 7.8 (5.1) 7.7 (4.6) 8.3 (5.5)
Figure 2 shows the trend of mean scores of frequency of instances of DE and SF across sessions.
61
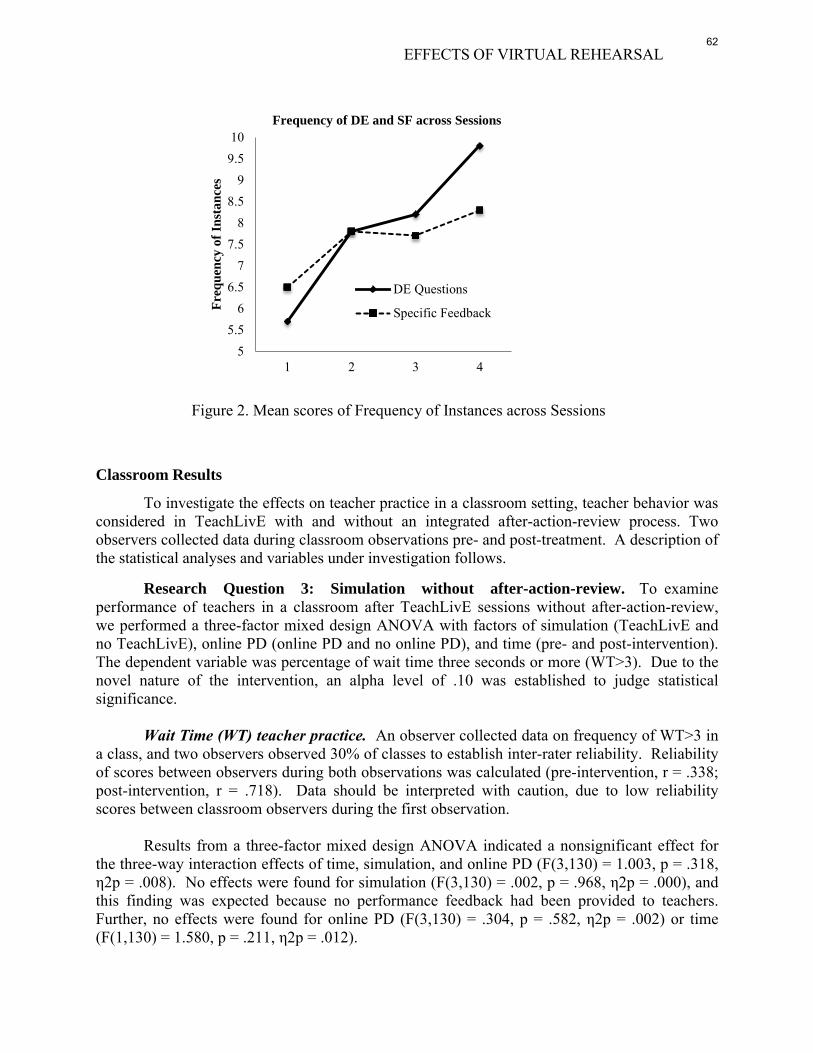
Figure 2. Mean scores of Frequency of Instances across Sessions
Classroom Results
To investigate the effects on teacher practice in a classroom setting, teacher behavior was considered in TeachLivE with and without an integrated after-action-review process. Two observers collected data during classroom observations pre- and post-treatment. A description of the statistical analyses and variables under investigation follows.
Research Question 3: Simulation without after-action-review. To examine performance of teachers in a classroom after TeachLivE sessions without after-action-review, we performed a three-factor mixed design ANOVA with factors of simulation (TeachLivE and no TeachLivE), online PD (online PD and no online PD), and time (pre- and post-intervention). The dependent variable was percentage of wait time three seconds or more (WT>3). Due to the novel nature of the intervention, an alpha level of .10 was established to judge statistical significance.
Wait Time (WT) teacher practice. An observer collected data on frequency of WT>3 in a class, and two observers observed 30% of classes to establish inter-rater reliability. Reliability of scores between observers during both observations was calculated (pre-intervention, r = .338; post-intervention, r = .718). Data should be interpreted with caution, due to low reliability scores between classroom observers during the first observation.
Results from a three-factor mixed design ANOVA indicated a nonsignificant effect for the three-way interaction effects of time, simulation, and online PD (F(3,130) = 1.003, p = .318, η2p = .008). No effects were found for simulation (F(3,130) = .002, p = .968, η2p = .000), and this finding was expected because no performance feedback had been provided to teachers. Further, no effects were found for online PD (F(3,130) = .304, p = .582, η2p = .002) or time (F(1,130) = 1.580, p = .211, η2p = .012).
55.5
66.5
77.5
88.5
99.510
1 2 3 4
Freq
uenc
y of
Inst
ance
s
Frequency of DE and SF across Sessions
DE Questions
Specific Feedback
EFFECTS OF VIRTUAL REHEARSAL62
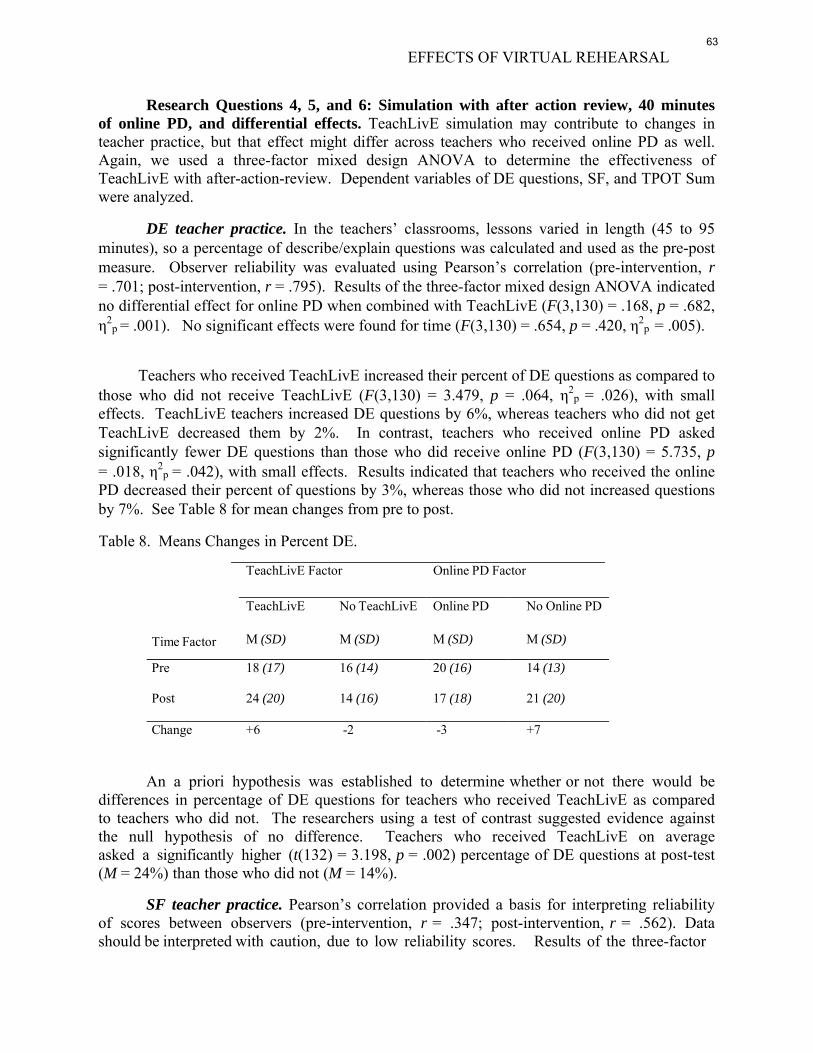
EFFECTS OF VIRTUAL REHEARSAL
Research Questions 4, 5, and 6: Simulation with after action review, 40 minutes of online PD, and differential effects. TeachLivE simulation may contribute to changes in teacher practice, but that effect might differ across teachers who received online PD as well. Again, we used a three-factor mixed design ANOVA to determine the effectiveness of TeachLivE with after-action-review. Dependent variables of DE questions, SF, and TPOT Sum were analyzed.
DE teacher practice. In the teachers’ classrooms, lessons varied in length (45 to 95 minutes), so a percentage of describe/explain questions was calculated and used as the pre-post measure. Observer reliability was evaluated using Pearson’s correlation (pre-intervention, r = .701; post-intervention, r = .795). Results of the three-factor mixed design ANOVA indicated no differential effect for online PD when combined with TeachLivE (F(3,130) = .168, p = .682, η2
p = .001). No significant effects were found for time (F(3,130) = .654, p = .420, η2p = .005).
Teachers who received TeachLivE increased their percent of DE questions as compared to those who did not receive TeachLivE (F(3,130) = 3.479, p = .064, η2
p = .026), with small effects. TeachLivE teachers increased DE questions by 6%, whereas teachers who did not get TeachLivE decreased them by 2%. In contrast, teachers who received online PD asked significantly fewer DE questions than those who did receive online PD (F(3,130) = 5.735, p = .018, η2
p = .042), with small effects. Results indicated that teachers who received the online PD decreased their percent of questions by 3%, whereas those who did not increased questions by 7%. See Table 8 for mean changes from pre to post.
Table 8. Means Changes in Percent DE.
TeachLivE Factor Online PD Factor
Time Factor
TeachLivE
M (SD)
No TeachLivE
M (SD)
Online PD
M (SD)
No Online PD
M (SD)
Pre 18 (17) 16 (14) 20 (16) 14 (13)
Post 24 (20) 14 (16) 17 (18) 21 (20)
Change +6 -2 -3 +7
An a priori hypothesis was established to determine whether or not there would be differences in percentage of DE questions for teachers who received TeachLivE as compared to teachers who did not. The researchers using a test of contrast suggested evidence against the null hypothesis of no difference. Teachers who received TeachLivE on average asked a significantly higher (t(132) = 3.198, p = .002) percentage of DE questions at post-test (M = 24%) than those who did not (M = 14%).
SF teacher practice. Pearson’s correlation provided a basis for interpreting reliability of scores between observers (pre-intervention, r = .347; post-intervention, r = .562). Data should be interpreted with caution, due to low reliability scores. Results of the three-factor
63
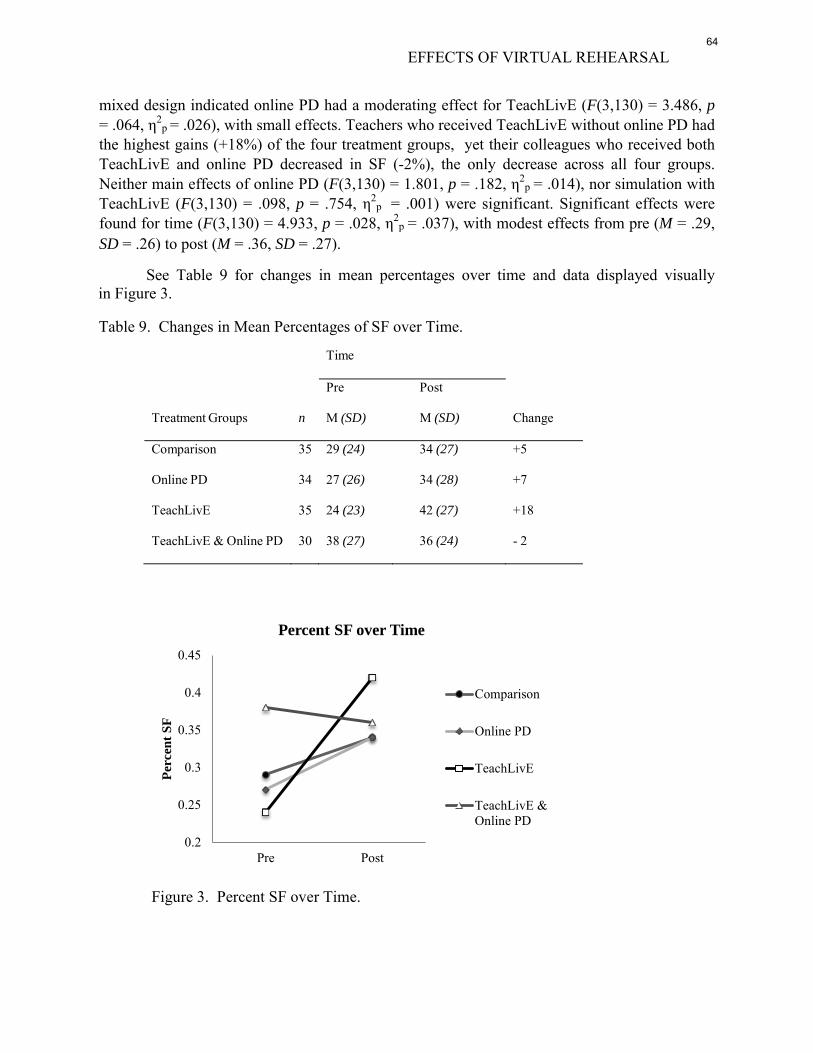
EFFECTS OF VIRTUAL REHEARSAL
mixed design indicated online PD had a moderating effect for TeachLivE (F(3,130) = 3.486, p = .064, η2
p = .026), with small effects. Teachers who received TeachLivE without online PD had the highest gains (+18%) of the four treatment groups, yet their colleagues who received both TeachLivE and online PD decreased in SF (-2%), the only decrease across all four groups. Neither main effects of online PD (F(3,130) = 1.801, p = .182, η2
p = .014), nor simulation with TeachLivE (F(3,130) = .098, p = .754, η2
p = .001) were significant. Significant effects were found for time (F(3,130) = 4.933, p = .028, η2
p = .037), with modest effects from pre (M = .29, SD = .26) to post (M = .36, SD = .27).
See Table 9 for changes in mean percentages over time and data displayed visually in Figure 3.
Table 9. Changes in Mean Percentages of SF over Time.
Time
Pre Post
Treatment Groups n M (SD) M (SD) Change
Comparison 35 29 (24) 34 (27) +5
Online PD 34 27 (26) 34 (28) +7
TeachLivE 35 24 (23) 42 (27) +18
TeachLivE & Online PD 30 38 (27) 36 (24) - 2
0.2
0.25
0.3
0.35
0.4
0.45
Pre Post
Perc
ent S
F
Percent SF over Time
Comparison
Online PD
TeachLivE
TeachLivE &Online PD
Figure 3. Percent SF over Time.
64
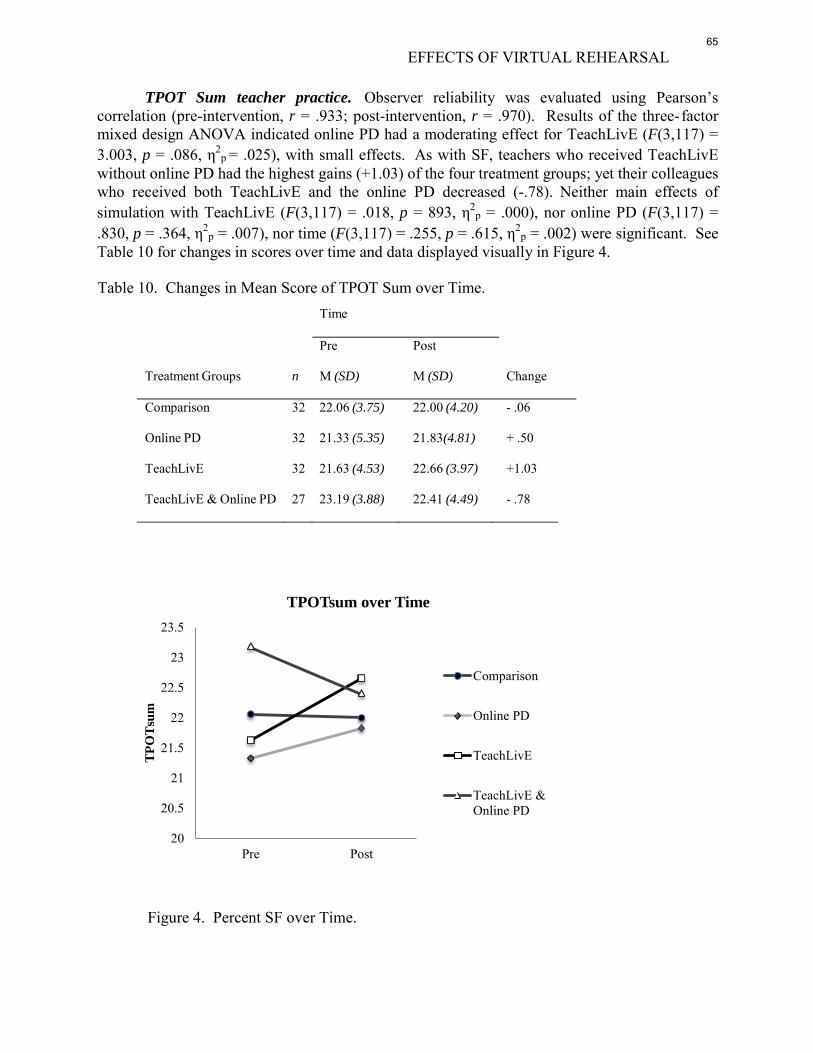
EFFECTS OF VIRTUAL REHEARSAL
TPOT Sum teacher practice. Observer reliability was evaluated using Pearson’s correlation (pre-intervention, r = .933; post-intervention, r = .970). Results of the three- factor mixed design ANOVA indicated online PD had a moderating effect for TeachLivE (F(3,117) = 3.003, p = .086, η2
p = .025), with small effects. As with SF, teachers who received TeachLivE without online PD had the highest gains (+1.03) of the four treatment groups; yet their colleagues who received both TeachLivE and the online PD decreased (-.78). Neither main effects of simulation with TeachLivE (F(3,117) = .018, p = 893, η2
p = .000), nor online PD (F(3,117) = .830, p = .364, η2
p = .007), nor time (F(3,117) = .255, p = .615, η2p = .002) were significant. See
Table 10 for changes in scores over time and data displayed visually in Figure 4.
Table 10. Changes in Mean Score of TPOT Sum over Time.
Time
Pre Post
Treatment Groups n M (SD) M (SD) Change
Comparison 32 22.06 (3.75) 22.00 (4.20) - .06
Online PD 32 21.33 (5.35) 21.83(4.81) + .50
TeachLivE 32 21.63 (4.53) 22.66 (3.97) +1.03
TeachLivE & Online PD 27 23.19 (3.88) 22.41 (4.49) - .78
20
20.5
21
21.5
22
22.5
23
23.5
Pre Post
TPO
Tsu
m
TPOTsum over Time
Comparison
Online PD
TeachLivE
TeachLivE &Online PD
Figure 4. Percent SF over Time.
65
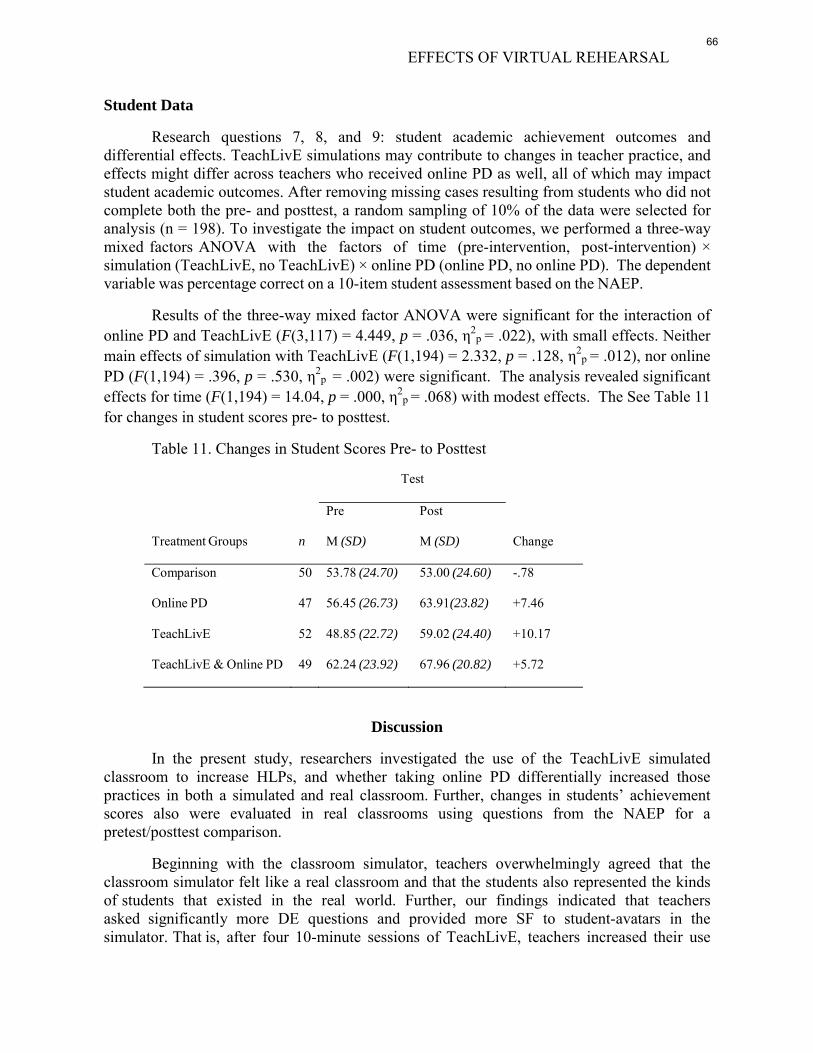
EFFECTS OF VIRTUAL REHEARSAL
Student Data
Research questions 7, 8, and 9: student academic achievement outcomes and differential effects. TeachLivE simulations may contribute to changes in teacher practice, and effects might differ across teachers who received online PD as well, all of which may impact student academic outcomes. After removing missing cases resulting from students who did not complete both the pre- and posttest, a random sampling of 10% of the data were selected for analysis (n = 198). To investigate the impact on student outcomes, we performed a three-way mixed factors ANOVA with the factors of time (pre-intervention, post-intervention) × simulation (TeachLivE, no TeachLivE) × online PD (online PD, no online PD). The dependent variable was percentage correct on a 10-item student assessment based on the NAEP.
Results of the three-way mixed factor ANOVA were significant for the interaction of online PD and TeachLivE (F(3,117) = 4.449, p = .036, η2
p = .022), with small effects. Neither main effects of simulation with TeachLivE (F(1,194) = 2.332, p = .128, η2
p = .012), nor online PD (F(1,194) = .396, p = .530, η2
p = .002) were significant. The analysis revealed significant effects for time (F(1,194) = 14.04, p = .000, η2
p = .068) with modest effects. The See Table 11 for changes in student scores pre- to posttest.
Table 11. Changes in Student Scores Pre- to Posttest
Test
Pre Post
Treatment Groups n M (SD) M (SD) Change
Comparison 50 53.78 (24.70) 53.00 (24.60) -.78
Online PD 47 56.45 (26.73) 63.91(23.82) +7.46
TeachLivE 52 48.85 (22.72) 59.02 (24.40) +10.17
TeachLivE & Online PD 49 62.24 (23.92) 67.96 (20.82) +5.72
Discussion
In the present study, researchers investigated the use of the TeachLivE simulated classroom to increase HLPs, and whether taking online PD differentially increased those practices in both a simulated and real classroom. Further, changes in students’ achievement scores also were evaluated in real classrooms using questions from the NAEP for a pretest/posttest comparison.
Beginning with the classroom simulator, teachers overwhelmingly agreed that the classroom simulator felt like a real classroom and that the students also represented the kinds of students that existed in the real world. Further, our findings indicated that teachers asked significantly more DE questions and provided more SF to student-avatars in the simulator. That is, after four 10-minute sessions of TeachLivE, teachers increased their use
66
EFFECTS OF VIRTUAL REHEARSAL
of HLPs in the simulator, regardless of whether or not they had 40 minutes of additional online PD.
Results from the simulated classroom were reflected in the real classroom. In classes with real students, after four 10-minute sessions in TeachLivE teachers asked significantly (F(3,130) = 3.479, p = .064, η2
p = .026) more DE questions than comparison groups, regardless of whether or not they had online PD. Although main effects for TeachLivE were not found for SF, TeachLivE combined with online PD produced a differential effect. Teachers who received TeachLivE without online PD had the highest percent of SF across all four groups, while their counterparts who received online PD decreased their scores, the largest decrease across all four groups. Despite a change, teachers’ SF observed in the classrooms should be interpreted with caution due to low reliability of observer scores. On a general measure of teacher performance in the classroom, all teachers improved significantly from pre- to post- observation. As with SF, teachers who received TeachLivE without online PD had the highest gains (+1.03) of the four treatment groups, yet their colleagues who received both TeachLivE and the online PD decreased (-.78), the largest decrease across all four groups. As predicted, teachers who received TeachLivE with no after-action-review on WT>3 did not differ significantly in their amount of WT. That is, by withholding feedback (after-action-review) from teachers after a simulation, their performance did not change.
Finally, in terms of student achievement data, all students’ scores increased significantly from pretest to posttest on 10 items from the NAEP assessment, which was expected as a result of instruction over the course of the year. However, differential effects of TeachLivE combined with online PD, seen in teachers’ SF and the general performance measure, were also echoed in the student achievement scores. Students of teachers who received the combined treatment scored lower than those whose teachers received TeachLivE only.
Taken as a whole, results from this study validate emerging research in the field that suggests that professional learning in mixed-reality simulated classrooms can be effective. We found support for our overarching hypothesis that virtual rehearsal in TeachLivE would increase teachers’ frequency of higher order questions and specific feedback to students, and that this increase also would be observed in their classrooms. Teachers who took part in a series of sessions in TeachLivE increased their instances of teaching practices in the simulator, similar to studies conducted earlier (e.g., Dawson & Lignugaris/Kraft, 2103; Elford et al., 2013; Vince Garland et al.; 2012). The current study extends the literature by demonstrating effects that extend HLPs for teachers from simulated classrooms to real classrooms.
The researchers hypothesized that online PD combined with TeachLivE would result in a differential increase, yet teachers who received both online PD and TeachLivE actually decreased their instances of HLPs. This finding was unanticipated. It is possible that although the content of the online PD and TeachLivE sessions were similar, teachers attempted to incorporate knowledge from the online PD into their virtual rehearsal, essentially working from a more complicated or divergent set of mental objectives for the simulation, resulting in a less effective simulation. Future research is needed to determine how to combine an array of PD that will make the strongest impact.
67
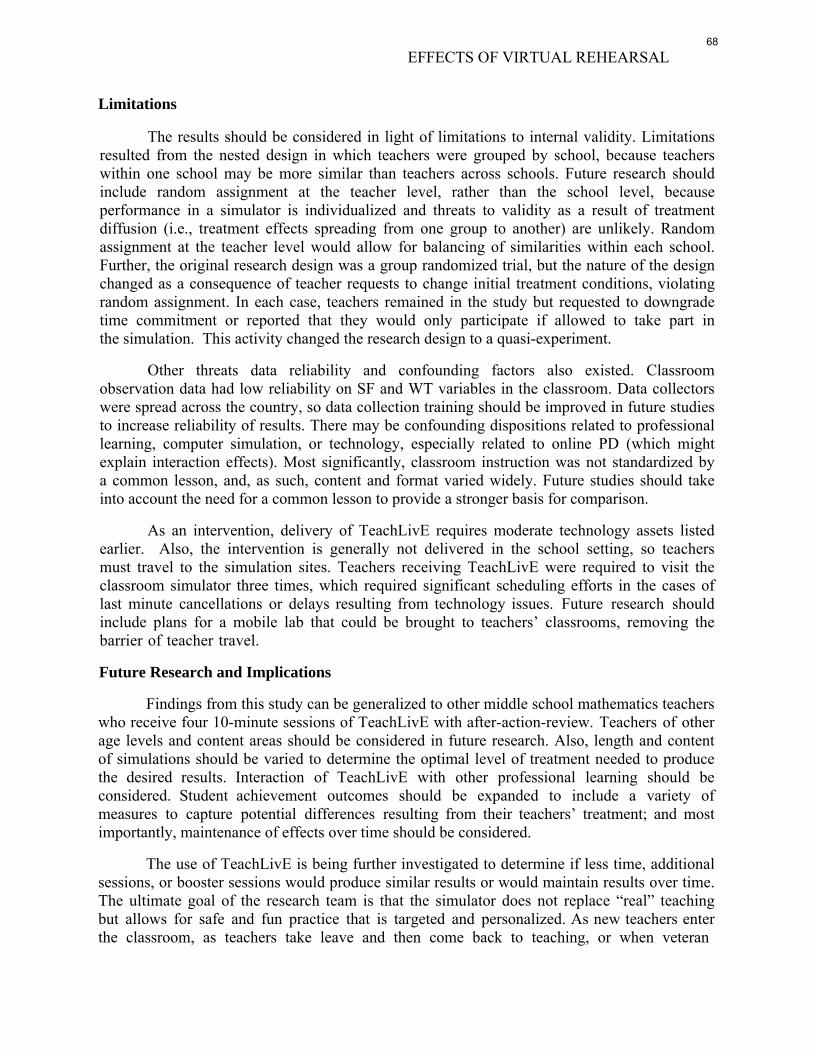
EFFECTS OF VIRTUAL REHEARSAL
Limitations
The results should be considered in light of limitations to internal validity. Limitations resulted from the nested design in which teachers were grouped by school, because teachers within one school may be more similar than teachers across schools. Future research should include random assignment at the teacher level, rather than the school level, because performance in a simulator is individualized and threats to validity as a result of treatment diffusion (i.e., treatment effects spreading from one group to another) are unlikely. Random assignment at the teacher level would allow for balancing of similarities within each school. Further, the original research design was a group randomized trial, but the nature of the design changed as a consequence of teacher requests to change initial treatment conditions, violating random assignment. In each case, teachers remained in the study but requested to downgrade time commitment or reported that they would only participate if allowed to take part in the simulation. This activity changed the research design to a quasi-experiment.
Other threats data reliability and confounding factors also existed. Classroom observation data had low reliability on SF and WT variables in the classroom. Data collectors were spread across the country, so data collection training should be improved in future studies to increase reliability of results. There may be confounding dispositions related to professional learning, computer simulation, or technology, especially related to online PD (which might explain interaction effects). Most significantly, classroom instruction was not standardized by a common lesson, and, as such, content and format varied widely. Future studies should take into account the need for a common lesson to provide a stronger basis for comparison.
As an intervention, delivery of TeachLivE requires moderate technology assets listed earlier. Also, the intervention is generally not delivered in the school setting, so teachers must travel to the simulation sites. Teachers receiving TeachLivE were required to visit the classroom simulator three times, which required significant scheduling efforts in the cases of last minute cancellations or delays resulting from technology issues. Future research should include plans for a mobile lab that could be brought to teachers’ classrooms, removing the barrier of teacher travel.
Future Research and Implications
Findings from this study can be generalized to other middle school mathematics teachers who receive four 10-minute sessions of TeachLivE with after-action-review. Teachers of other age levels and content areas should be considered in future research. Also, length and content of simulations should be varied to determine the optimal level of treatment needed to produce the desired results. Interaction of TeachLivE with other professional learning should be considered. Student achievement outcomes should be expanded to include a variety of measures to capture potential differences resulting from their teachers’ treatment; and most importantly, maintenance of effects over time should be considered.
The use of TeachLivE is being further investigated to determine if less time, additional sessions, or booster sessions would produce similar results or would maintain results over time. The ultimate goal of the research team is that the simulator does not replace “real” teaching but allows for safe and fun practice that is targeted and personalized. As new teachers enter the classroom, as teachers take leave and then come back to teaching, or when veteran
68
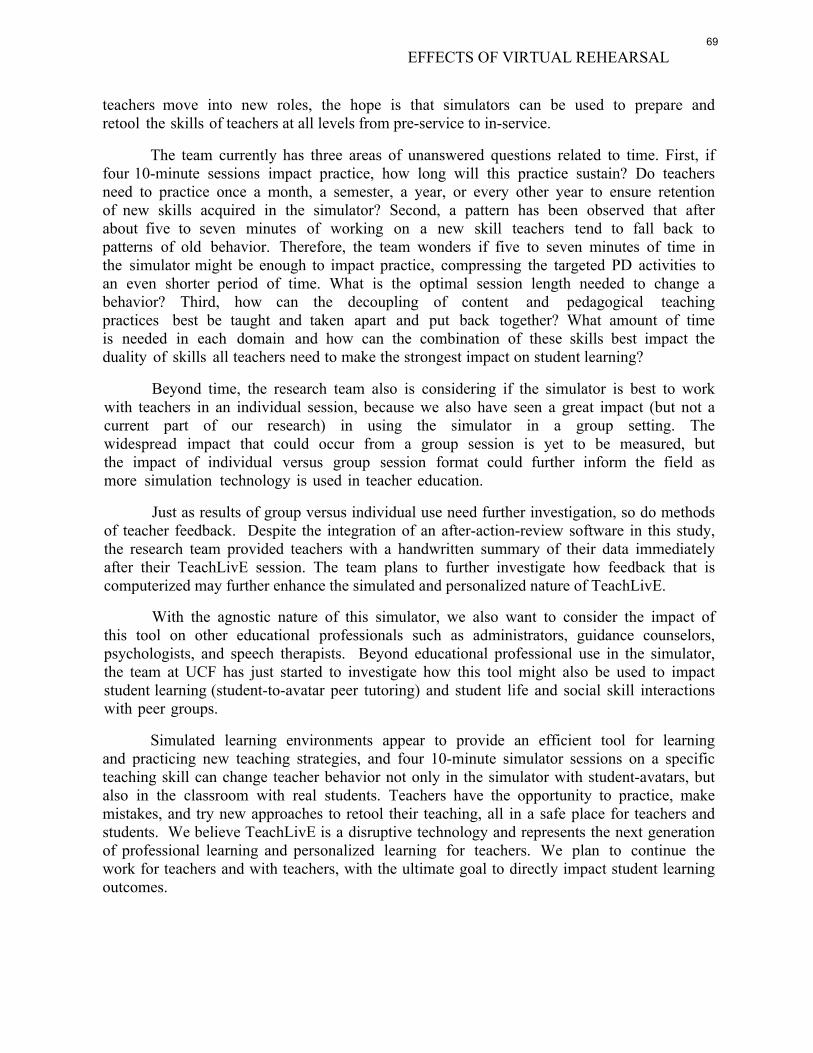
EFFECTS OF VIRTUAL REHEARSAL
teachers move into new roles, the hope is that simulators can be used to prepare and retool the skills of teachers at all levels from pre-service to in-service.
The team currently has three areas of unanswered questions related to time. First, if four 10-minute sessions impact practice, how long will this practice sustain? Do teachers need to practice once a month, a semester, a year, or every other year to ensure retention of new skills acquired in the simulator? Second, a pattern has been observed that after about five to seven minutes of working on a new skill teachers tend to fall back to patterns of old behavior. Therefore, the team wonders if five to seven minutes of time in the simulator might be enough to impact practice, compressing the targeted PD activities to an even shorter period of time. What is the optimal session length needed to change a behavior? Third, how can the decoupling of content and pedagogical teaching practices best be taught and taken apart and put back together? What amount of time is needed in each domain and how can the combination of these skills best impact the duality of skills all teachers need to make the strongest impact on student learning?
Beyond time, the research team also is considering if the simulator is best to work with teachers in an individual session, because we also have seen a great impact (but not a current part of our research) in using the simulator in a group setting. The widespread impact that could occur from a group session is yet to be measured, but the impact of individual versus group session format could further inform the field as more simulation technology is used in teacher education.
Just as results of group versus individual use need further investigation, so do methods of teacher feedback. Despite the integration of an after-action-review software in this study, the research team provided teachers with a handwritten summary of their data immediately after their TeachLivE session. The team plans to further investigate how feedback that is computerized may further enhance the simulated and personalized nature of TeachLivE.
With the agnostic nature of this simulator, we also want to consider the impact of this tool on other educational professionals such as administrators, guidance counselors, psychologists, and speech therapists. Beyond educational professional use in the simulator, the team at UCF has just started to investigate how this tool might also be used to impact student learning (student-to-avatar peer tutoring) and student life and social skill interactions with peer groups.
Simulated learning environments appear to provide an efficient tool for learning and practicing new teaching strategies, and four 10-minute simulator sessions on a specific teaching skill can change teacher behavior not only in the simulator with student-avatars, but also in the classroom with real students. Teachers have the opportunity to practice, make mistakes, and try new approaches to retool their teaching, all in a safe place for teachers and students. We believe TeachLivE is a disruptive technology and represents the next generation of professional learning and personalized learning for teachers. We plan to continue the work for teachers and with teachers, with the ultimate goal to directly impact student learning outcomes.
69
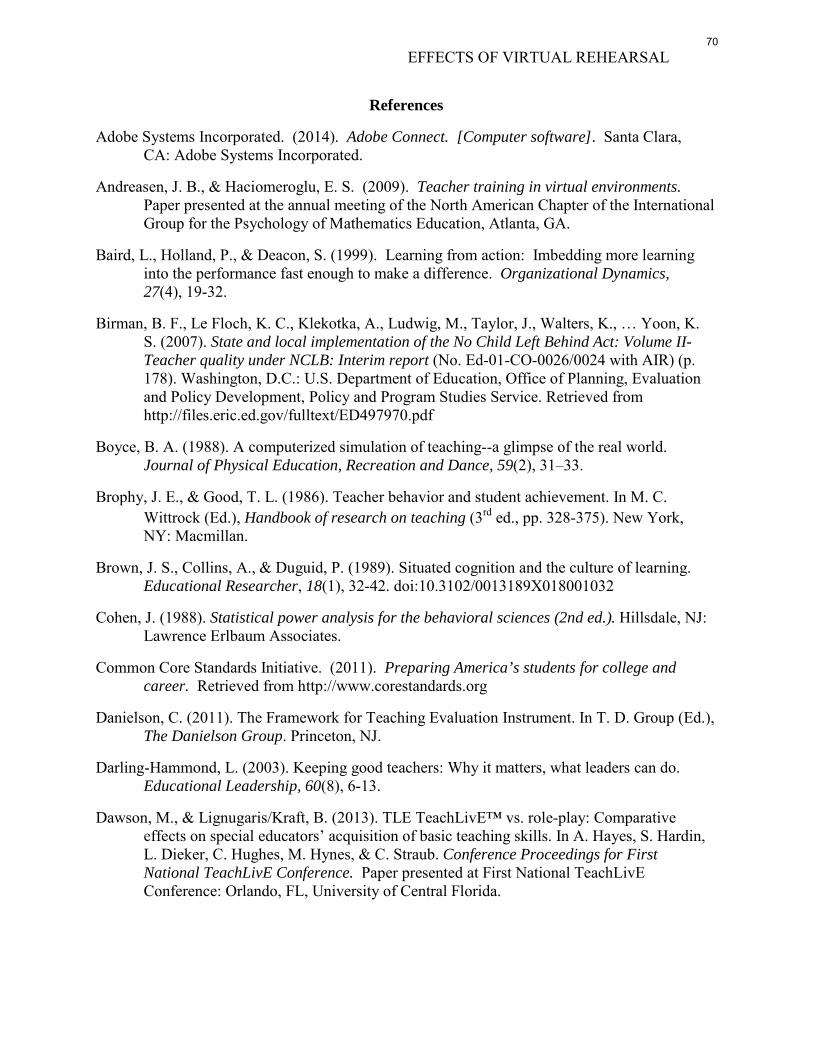
EFFECTS OF VIRTUAL REHEARSAL
References
Adobe Systems Incorporated. (2014). Adobe Connect. [Computer software]. Santa Clara, CA: Adobe Systems Incorporated.
Andreasen, J. B., & Haciomeroglu, E. S. (2009). Teacher training in virtual environments. Paper presented at the annual meeting of the North American Chapter of the International Group for the Psychology of Mathematics Education, Atlanta, GA.
Baird, L., Holland, P., & Deacon, S. (1999). Learning from action: Imbedding more learning into the performance fast enough to make a difference. Organizational Dynamics, 27(4), 19-32.
Birman, B. F., Le Floch, K. C., Klekotka, A., Ludwig, M., Taylor, J., Walters, K., … Yoon, K. S. (2007). State and local implementation of the No Child Left Behind Act: Volume II- Teacher quality under NCLB: Interim report (No. Ed-01-CO-0026/0024 with AIR) (p. 178). Washington, D.C.: U.S. Department of Education, Office of Planning, Evaluation and Policy Development, Policy and Program Studies Service. Retrieved from http://files.eric.ed.gov/fulltext/ED497970.pdf
Boyce, B. A. (1988). A computerized simulation of teaching--a glimpse of the real world. Journal of Physical Education, Recreation and Dance, 59(2), 31–33.
Brophy, J. E., & Good, T. L. (1986). Teacher behavior and student achievement. In M. C. Wittrock (Ed.), Handbook of research on teaching (3rd ed., pp. 328-375). New York, NY: Macmillan.
Brown, J. S., Collins, A., & Duguid, P. (1989). Situated cognition and the culture of learning. Educational Researcher, 18(1), 32-42. doi:10.3102/0013189X018001032
Cohen, J. (1988). Statistical power analysis for the behavioral sciences (2nd ed.). Hillsdale, NJ: Lawrence Erlbaum Associates.
Common Core Standards Initiative. (2011). Preparing America’s students for college and career. Retrieved from http://www.corestandards.org
Danielson, C. (2011). The Framework for Teaching Evaluation Instrument. In T. D. Group (Ed.), The Danielson Group. Princeton, NJ.
Darling-Hammond, L. (2003). Keeping good teachers: Why it matters, what leaders can do. Educational Leadership, 60(8), 6-13.
Dawson, M., & Lignugaris/Kraft, B. (2013). TLE TeachLivE™ vs. role-play: Comparative effects on special educators’ acquisition of basic teaching skills. In A. Hayes, S. Hardin, L. Dieker, C. Hughes, M. Hynes, & C. Straub. Conference Proceedings for First National TeachLivE Conference. Paper presented at First National TeachLivE Conference: Orlando, FL, University of Central Florida.
70
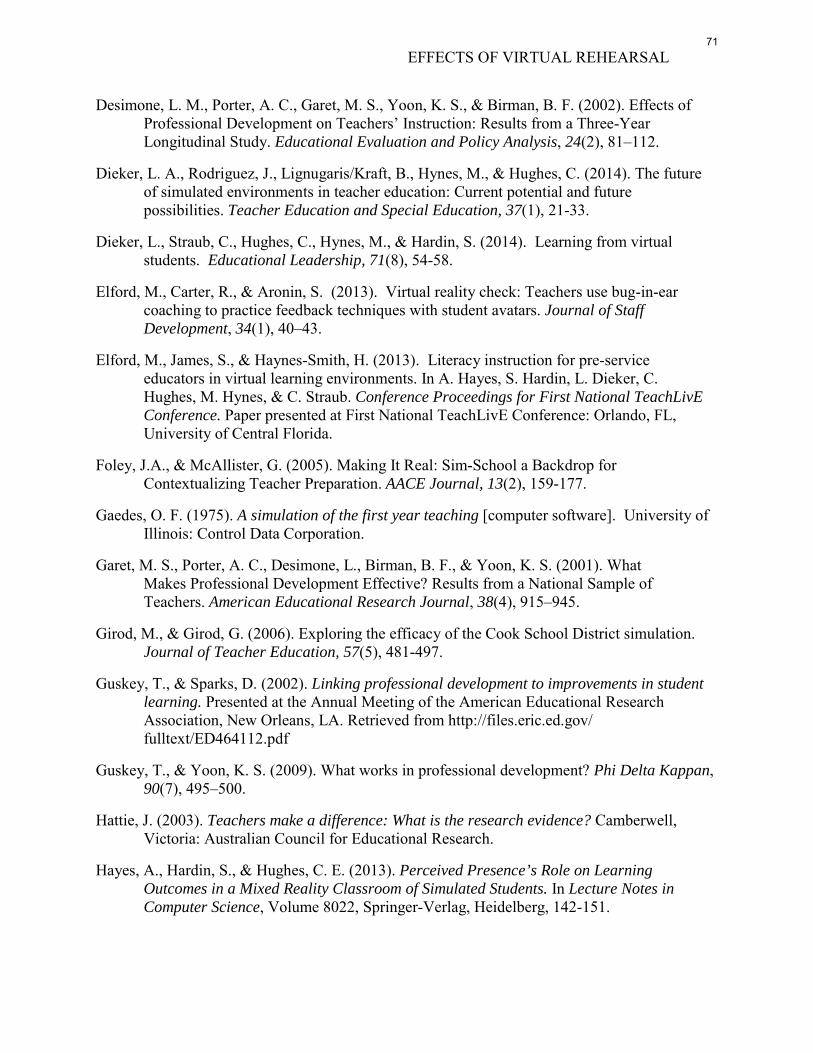
EFFECTS OF VIRTUAL REHEARSAL
Desimone, L. M., Porter, A. C., Garet, M. S., Yoon, K. S., & Birman, B. F. (2002). Effects of Professional Development on Teachers’ Instruction: Results from a Three-Year Longitudinal Study. Educational Evaluation and Policy Analysis, 24(2), 81–112.
Dieker, L. A., Rodriguez, J., Lignugaris/Kraft, B., Hynes, M., & Hughes, C. (2014). The future of simulated environments in teacher education: Current potential and future possibilities. Teacher Education and Special Education, 37(1), 21-33.
Dieker, L., Straub, C., Hughes, C., Hynes, M., & Hardin, S. (2014). Learning from virtual students. Educational Leadership, 71(8), 54-58.
Elford, M., Carter, R., & Aronin, S. (2013). Virtual reality check: Teachers use bug-in-ear coaching to practice feedback techniques with student avatars. Journal of Staff Development, 34(1), 40–43.
Elford, M., James, S., & Haynes-Smith, H. (2013). Literacy instruction for pre-service educators in virtual learning environments. In A. Hayes, S. Hardin, L. Dieker, C. Hughes, M. Hynes, & C. Straub. Conference Proceedings for First National TeachLivE Conference. Paper presented at First National TeachLivE Conference: Orlando, FL, University of Central Florida.
Foley, J.A., & McAllister, G. (2005). Making It Real: Sim-School a Backdrop for Contextualizing Teacher Preparation. AACE Journal, 13(2), 159-177.
Gaedes, O. F. (1975). A simulation of the first year teaching [computer software]. University of Illinois: Control Data Corporation.
Garet, M. S., Porter, A. C., Desimone, L., Birman, B. F., & Yoon, K. S. (2001). What Makes Professional Development Effective? Results from a National Sample of Teachers. American Educational Research Journal, 38(4), 915–945.
Girod, M., & Girod, G. (2006). Exploring the efficacy of the Cook School District simulation. Journal of Teacher Education, 57(5), 481-497.
Guskey, T., & Sparks, D. (2002). Linking professional development to improvements in student learning. Presented at the Annual Meeting of the American Educational Research Association, New Orleans, LA. Retrieved from http://files.eric.ed.gov/ fulltext/ED464112.pdf
Guskey, T., & Yoon, K. S. (2009). What works in professional development? Phi Delta Kappan, 90(7), 495–500.
Hattie, J. (2003). Teachers make a difference: What is the research evidence? Camberwell, Victoria: Australian Council for Educational Research.
Hayes, A., Hardin, S., & Hughes, C. E. (2013). Perceived Presence’s Role on Learning Outcomes in a Mixed Reality Classroom of Simulated Students. In Lecture Notes in Computer Science, Volume 8022, Springer-Verlag, Heidelberg, 142-151.
71
EFFECTS OF VIRTUAL REHEARSAL
Kane, T. J., & Staiger, D.O. (2008). Estimating teacher impacts on student achievement: An experimental evaluation. (Working Paper No. 14607). Retrieved from National Bureau of Economic Research website: http://www.nber.org/papers/w14607
Kane, T. J., & Staiger, D.O. (2012). Gathering feedback for teaching: Combining high-quality observations with student surveys and achievement gains. Seattle, WA: Bill & Melinda Gates Foundation.
Levine, T., & Hullett, C. (2002). Eta squared, partial eta squared, and misreporting of effect size in communication research. Human Communication Research, 28(4), 612-625.
Loewenberg Ball, D. & Forzani, F. (2010). Teaching skillful teaching. Educational Leadership, 68(4), 40-45.
Loewenberg Ball, D., Sleep, L., Boerst, T. A., & Bass, H. (2009). Combining the development of practice and the practice of development in teacher education. The Elementary School Journal, 109(5), 458–474. doi:10.1086/599340
Loucks-Horsley, S., & Matsumoto, C. (1999). Research on professional development for teachers of mathematics and science: The state of the scene. School Science and Mathematics, 99(5), 258-271.
Mathematics Assessment Resource Service. (2012). Solving linear equations in one variable [Lesson plan]. Retrieved from http://map.mathshell.org/ materials/download.php?fileid=1286
Maxwell, S. (2001). When to Use MANOVA and Significant MANOVAs and Insignificant ANOVAs or Vice Versa. Journal of Consumer Psychology, 10(1/2), 29-30.
Measures of Effective Teaching Project. (2010). Danielson’s Framework for Teaching for classroom observations. Retrieved from http://metproject.org/resources/ Danielson%20FFT_10_29_10.pdf
McPherson, R., Tyler-Wood, T., McEnturff, A., Peak, P. (2011). Using a computerized classroom simulation to prepare re-service teachers. Journal of Technology and Teacher Education,19(1), 93-110.
Nagendran, A., Pillat, R., Kavanaugh, A., Welch, G., Hughes C. E. (2014). AMITIES: Avatar- mediated interactive training and individualized experiences system. Presence: Teleoperators and Virtual Environments, 23(2).
National Center for Education Statistics. (2013). NAEP questions tool. Retrieved from http://nces.ed.gov/nationsreportcard/itmrlsx/search.aspx?subject=mathematics.
National Economic Council, Council of Economic Advisers, and Office of Science and Technology Policy (2011). A strategy for American innovation: Securing our economic growth and prosperity. The White House: Washington, D.C.
Pallant, J. (2007). SPSS Survival Manual. New York: McGraw-Hill Education.
72
EFFECTS OF VIRTUAL REHEARSAL
Pierce, C. A., Block, R. A., & Aguinis, H. (2004). Cautionary note on reporting eta-squared values from multifactor ANOVA designs. Educational and Psychological Measurement, 64(6), 916-924.
Shulman, L. S. (1986). Those who understand: Knowledge growth in teaching. Educational Researcher, 15(2), 4-31.
Smith, R., & Allen, G. (1994). After action review in military training simulations. In Proceedings of the 26th conference on Winter simulation (WSC '94), Mani S. Manivannan and Jeffrey D. Tew (Eds.). Society for Computer Simulation International, San Diego, CA, USA, 845-849
Teaching Works (2014). High Leverage Practices. Retrieved from: http:// www.teachingworks.org/ work-of-teaching/high-leverage-practices#sthash. I4xK7DG4.dpuf
Thompson, M., & Wiliam, D. (2008). Tight but loose: A conceptual framework for scaling up school reforms. In E.C. Wiley (Ed.), Tight but Loose: Scaling up Teacher Professional Development in Diverse Contexts. ETS: Princeton, NJ.
U.S. Department of Education. (2008). Foundations for success: The final report of the National Mathematics Advisory Panel. Washington, D.C. Retrieved from http://www2.ed.gov/ about/bdscomm/list/mathpanel/report/final-report.pdf
Vince Garland, K., Vasquez, E., & Pearl, C. (2012). Efficacy of individualized coaching in a virtual classroom for increasing teachers’ fidelity of implementation of discrete trial teaching. Education and Training in Autism and Developmental Disabilities, 47(4), 502- 515.
Whitten, E., Enicks, A., Wallace, L., & Morgan, D. (2013). Study of a mixed reality virtual environment used to increase teacher effectiveness in a pre-service preparation program. In A. Hayes, S. Hardin, L. Dieker, C. Hughes, M. Hynes, & C. Straub. Conference Proceedings for First National TeachLivE Conference. Paper presented at First National TeachLivE Conference: Orlando, FL, University of Central Florida.
Yoon, K. S., Duncan, T., Wen-Yu Lee, S., Scarloss, B., & Shapley, K. L. (2007). Reviewing the evidence on how teacher professional development affects student achievement (No. Rel 2007-No. 033) (p. 55). Washington, D.C.: US Department of Education, Institute of Education Sciences, National Center for Education Evaluation and Regional Assistance, Regional Educational Laboratory Southwest. Retrieved from http://ies.ed.gov/ncee/edlabs/regions/southwest/pdf/rel_2007033.pdf
73
Appendix A
Teacher Practice Observation Tool
74
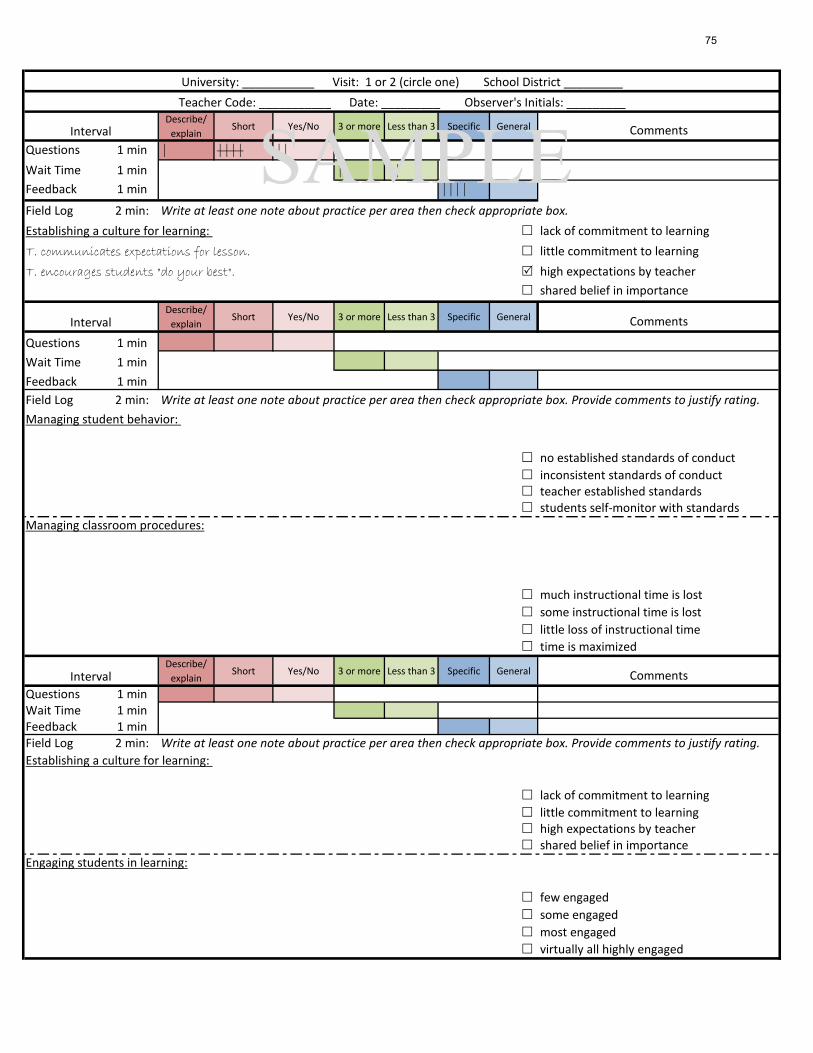
Describe/ explain
Short Yes/No 3 or more Less than 3 Specific General CommentsQuestions 1 min | |||| ||
Wait Time 1 min | ||
Feedback 1 min ||||
Field Log 2 min: Write at least one note about practice per area then check appropriate box.Establishing a culture for learning: lack of commitment to learningT. communicates expectations for lesson. little commitment to learningT. encourages students "do your best". high expectations by teacher
shared belief in importanceDescribe/
explainShort Yes/No 3 or more Less than 3 Specific General Comments
Questions 1 minWait Time 1 minFeedback 1 minField Log 2 min: Write at least one note about practice per area then check appropriate box. Provide comments to justify rating. Managing student behavior:
no established standards of conduct inconsistent standards of conduct teacher established standards students self-monitor with standards
Managing classroom procedures:
much instructional time is lost some instructional time is lost little loss of instructional time time is maximized
Describe/ explain
Short Yes/No 3 or more Less than 3 Specific General CommentsQuestions 1 minWait Time 1 minFeedback 1 minField Log 2 min: Write at least one note about practice per area then check appropriate box. Provide comments to justify rating. Establishing a culture for learning:
lack of commitment to learning little commitment to learning high expectations by teacher shared belief in importance
Engaging students in learning:
few engaged some engaged most engaged virtually all highly engaged
University: ___________ Visit: 1 or 2 (circle one) School District _________Teacher Code: ___________ Date: _________ Observer's Initials: _________
Interval
Interval
Interval
SAMPLE
75
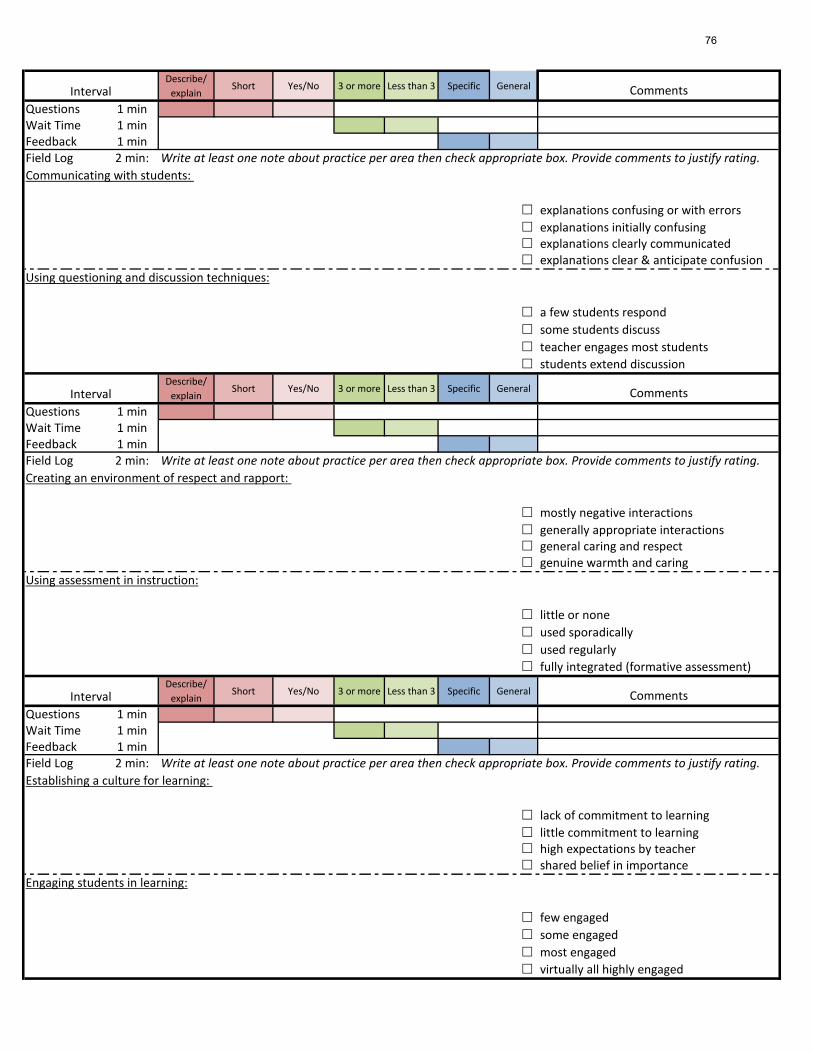
Describe/ explain
Short Yes/No 3 or more Less than 3 Specific General CommentsQuestions 1 minWait Time 1 minFeedback 1 minField Log 2 min: Write at least one note about practice per area then check appropriate box. Provide comments to justify rating. Communicating with students:
explanations confusing or with errors explanations initially confusing explanations clearly communicated explanations clear & anticipate confusion
Using questioning and discussion techniques:
a few students respond some students discuss teacher engages most students students extend discussion
Describe/ explain
Short Yes/No 3 or more Less than 3 Specific General CommentsQuestions 1 minWait Time 1 minFeedback 1 minField Log 2 min: Write at least one note about practice per area then check appropriate box. Provide comments to justify rating. Creating an environment of respect and rapport:
mostly negative interactions generally appropriate interactions general caring and respect genuine warmth and caring
Using assessment in instruction:
little or none used sporadically used regularly fully integrated (formative assessment)
Describe/ explain
Short Yes/No 3 or more Less than 3 Specific General CommentsQuestions 1 minWait Time 1 minFeedback 1 minField Log 2 min: Write at least one note about practice per area then check appropriate box. Provide comments to justify rating. Establishing a culture for learning:
lack of commitment to learning little commitment to learning high expectations by teacher shared belief in importance
Engaging students in learning:
few engaged some engaged most engaged virtually all highly engaged
Interval
Interval
Interval
76
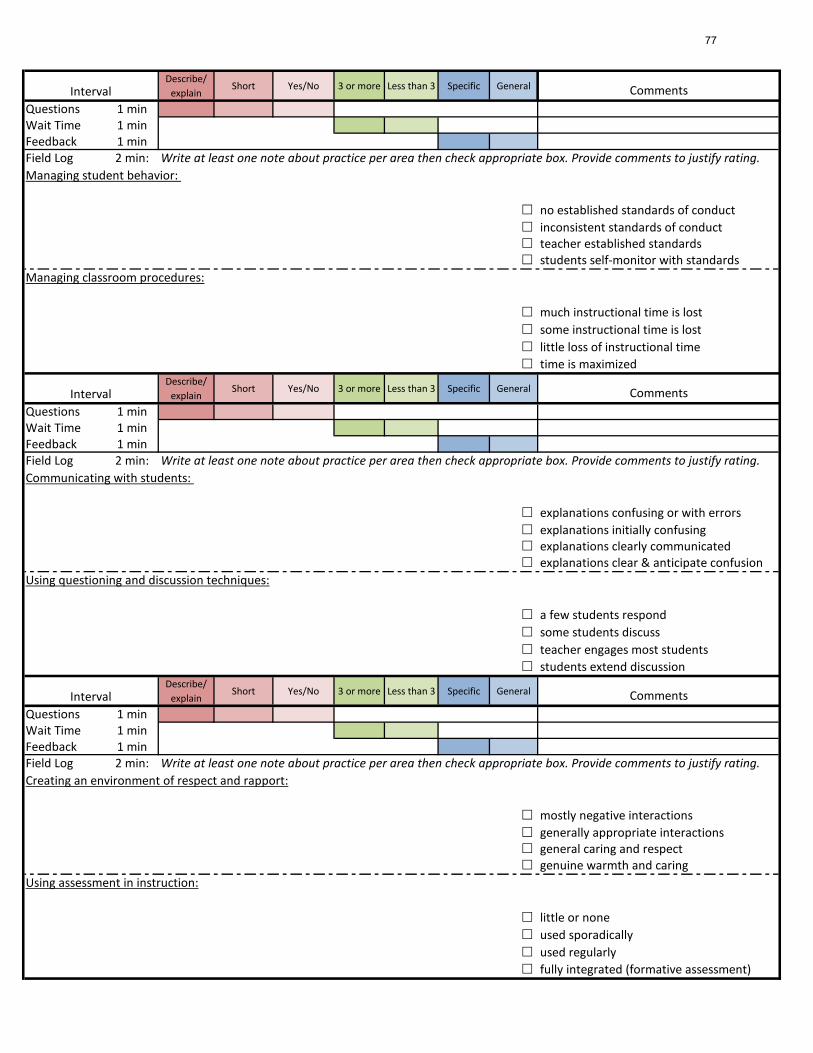
Describe/ explain
Short Yes/No 3 or more Less than 3 Specific General CommentsQuestions 1 minWait Time 1 minFeedback 1 minField Log 2 min: Write at least one note about practice per area then check appropriate box. Provide comments to justify rating. Managing student behavior:
no established standards of conduct inconsistent standards of conduct teacher established standards students self-monitor with standards
Managing classroom procedures:
much instructional time is lost some instructional time is lost little loss of instructional time time is maximized
Describe/ explain
Short Yes/No 3 or more Less than 3 Specific General CommentsQuestions 1 minWait Time 1 minFeedback 1 minField Log 2 min: Write at least one note about practice per area then check appropriate box. Provide comments to justify rating. Communicating with students:
explanations confusing or with errors explanations initially confusing explanations clearly communicated explanations clear & anticipate confusion
Using questioning and discussion techniques:
a few students respond some students discuss teacher engages most students students extend discussion
Describe/ explain
Short Yes/No 3 or more Less than 3 Specific General CommentsQuestions 1 minWait Time 1 minFeedback 1 minField Log 2 min: Write at least one note about practice per area then check appropriate box. Provide comments to justify rating. Creating an environment of respect and rapport:
mostly negative interactions generally appropriate interactions general caring and respect genuine warmth and caring
Using assessment in instruction:
little or none used sporadically used regularly fully integrated (formative assessment)
Interval
Interval
Interval
77
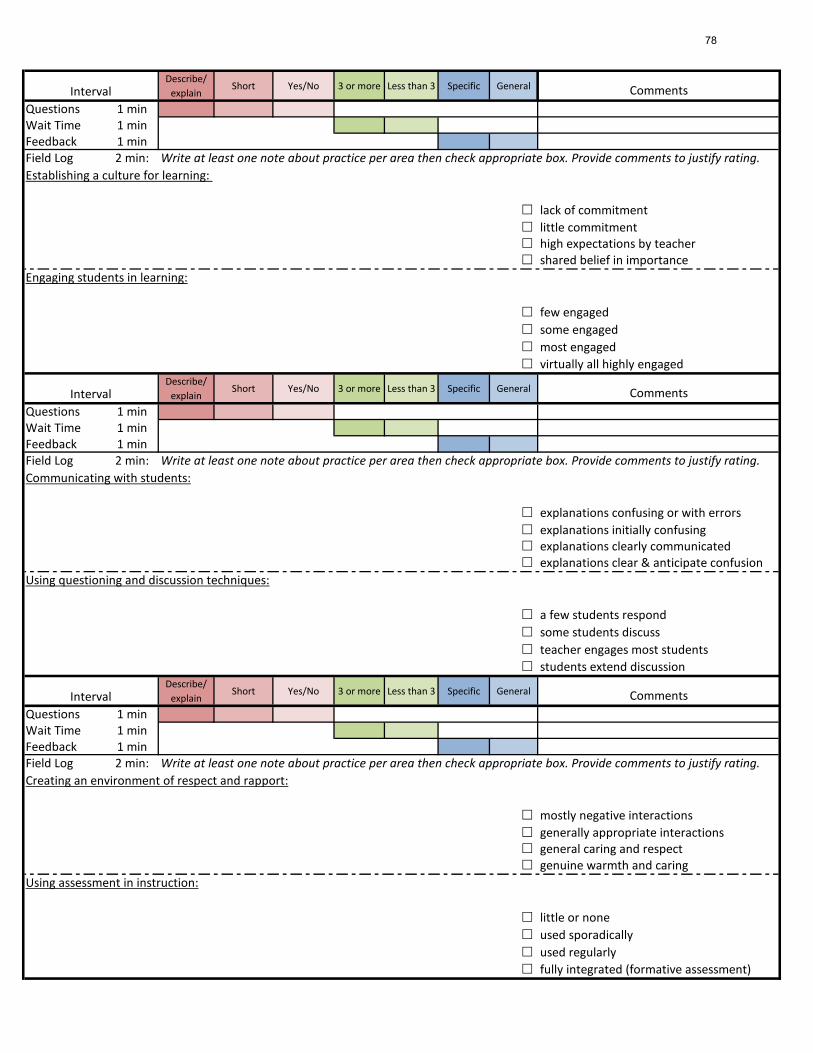
Describe/ explain
Short Yes/No 3 or more Less than 3 Specific General CommentsQuestions 1 minWait Time 1 minFeedback 1 minField Log 2 min: Write at least one note about practice per area then check appropriate box. Provide comments to justify rating. Establishing a culture for learning:
lack of commitment little commitment high expectations by teacher shared belief in importance
Engaging students in learning:
few engaged some engaged most engaged virtually all highly engaged
Describe/ explain
Short Yes/No 3 or more Less than 3 Specific General CommentsQuestions 1 minWait Time 1 minFeedback 1 minField Log 2 min: Write at least one note about practice per area then check appropriate box. Provide comments to justify rating. Communicating with students:
explanations confusing or with errors explanations initially confusing explanations clearly communicated explanations clear & anticipate confusion
Using questioning and discussion techniques:
a few students respond some students discuss teacher engages most students students extend discussion
Describe/ explain
Short Yes/No 3 or more Less than 3 Specific General CommentsQuestions 1 minWait Time 1 minFeedback 1 minField Log 2 min: Write at least one note about practice per area then check appropriate box. Provide comments to justify rating. Creating an environment of respect and rapport:
mostly negative interactions generally appropriate interactions general caring and respect genuine warmth and caring
Using assessment in instruction:
little or none used sporadically used regularly fully integrated (formative assessment)
Interval
Interval
Interval
78
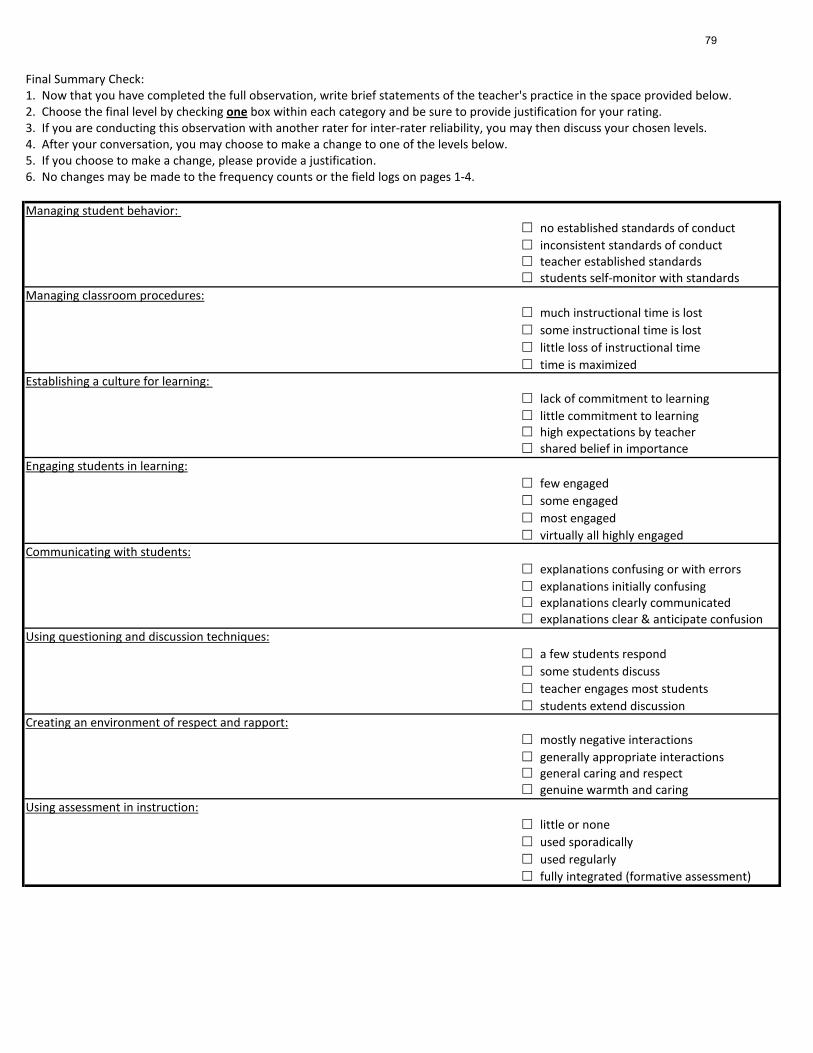
Final Summary Check:1. Now that you have completed the full observation, write brief statements of the teacher's practice in the space provided below.2. Choose the final level by checking one box within each category and be sure to provide justification for your rating.3. If you are conducting this observation with another rater for inter-rater reliability, you may then discuss your chosen levels.4. After your conversation, you may choose to make a change to one of the levels below.5. If you choose to make a change, please provide a justification.6. No changes may be made to the frequency counts or the field logs on pages 1-4.
Managing student behavior: no established standards of conduct inconsistent standards of conduct teacher established standards students self-monitor with standards
Managing classroom procedures: much instructional time is lost some instructional time is lost little loss of instructional time time is maximized
Establishing a culture for learning: lack of commitment to learning little commitment to learning high expectations by teacher shared belief in importance
Engaging students in learning: few engaged some engaged most engaged virtually all highly engaged
Communicating with students: explanations confusing or with errors explanations initially confusing explanations clearly communicated explanations clear & anticipate confusion
Using questioning and discussion techniques: a few students respond some students discuss teacher engages most students students extend discussion
Creating an environment of respect and rapport: mostly negative interactions generally appropriate interactions general caring and respect genuine warmth and caring
Using assessment in instruction: little or none used sporadically used regularly fully integrated (formative assessment)
79
Appendix B
Student Work Samples
80
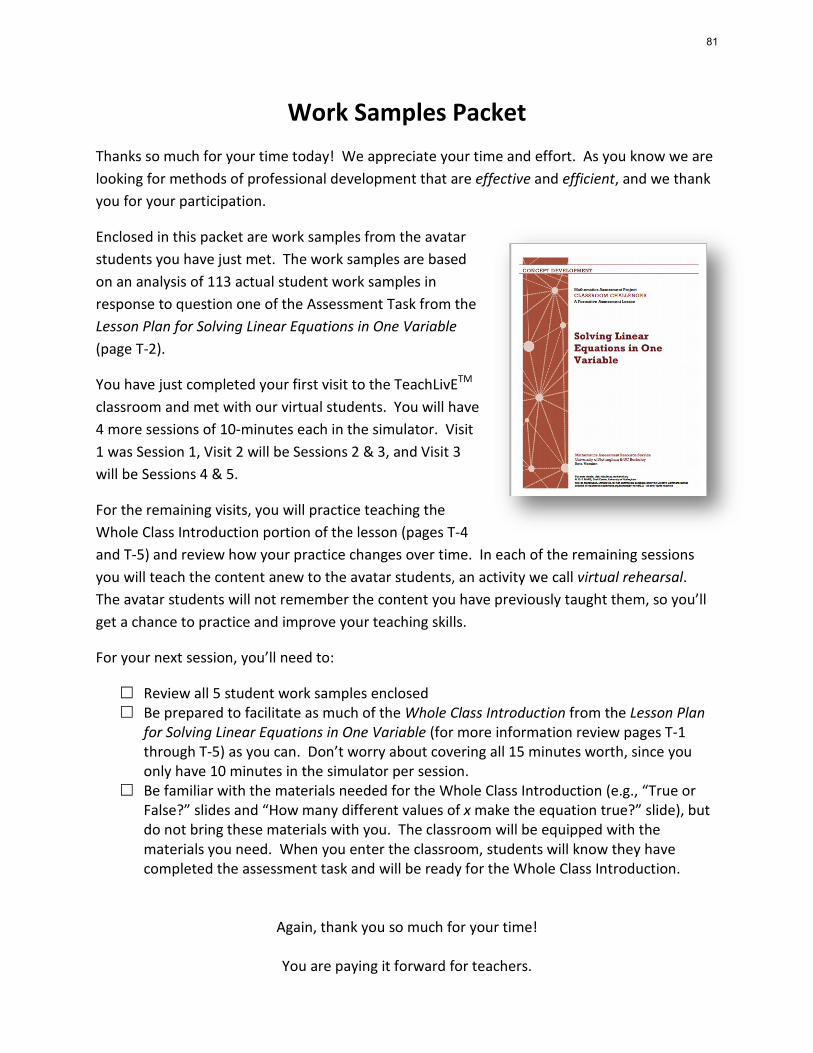
Work Samples Packet Thanks so much for your time today! We appreciate your time and effort. As you know we are looking for methods of professional development that are effective and efficient, and we thank you for your participation.
Enclosed in this packet are work samples from the avatar students you have just met. The work samples are based on an analysis of 113 actual student work samples in response to question one of the Assessment Task from the Lesson Plan for Solving Linear Equations in One Variable (page T-2).
You have just completed your first visit to the TeachLivETM classroom and met with our virtual students. You will have 4 more sessions of 10-minutes each in the simulator. Visit 1 was Session 1, Visit 2 will be Sessions 2 & 3, and Visit 3 will be Sessions 4 & 5.
For the remaining visits, you will practice teaching the Whole Class Introduction portion of the lesson (pages T-4 and T-5) and review how your practice changes over time. In each of the remaining sessions you will teach the content anew to the avatar students, an activity we call virtual rehearsal. The avatar students will not remember the content you have previously taught them, so you’ll get a chance to practice and improve your teaching skills.
For your next session, you’ll need to:
Review all 5 student work samples enclosed Be prepared to facilitate as much of the Whole Class Introduction from the Lesson Plan
for Solving Linear Equations in One Variable (for more information review pages T-1 through T-5) as you can. Don’t worry about covering all 15 minutes worth, since you only have 10 minutes in the simulator per session.
Be familiar with the materials needed for the Whole Class Introduction (e.g., “True or False?” slides and “How many different values of x make the equation true?” slide), but do not bring these materials with you. The classroom will be equipped with the materials you need. When you enter the classroom, students will know they have completed the assessment task and will be ready for the Whole Class Introduction.
Again, thank you so much for your time!
You are paying it forward for teachers.
81
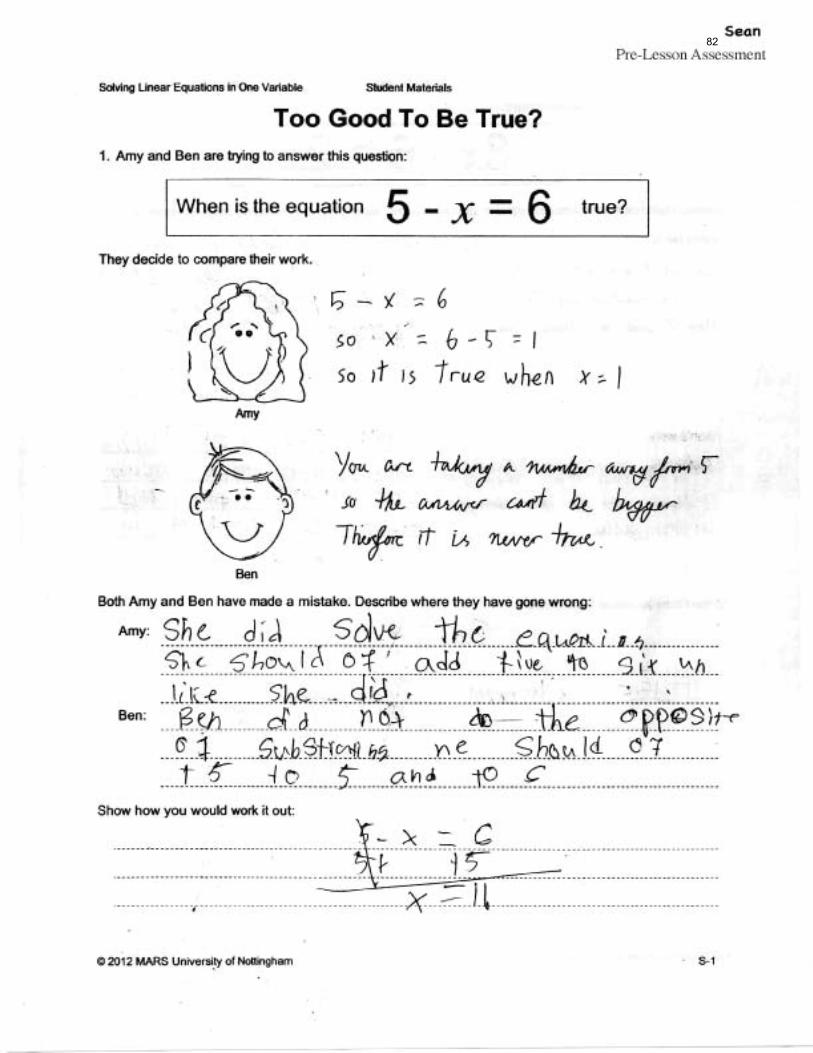
82
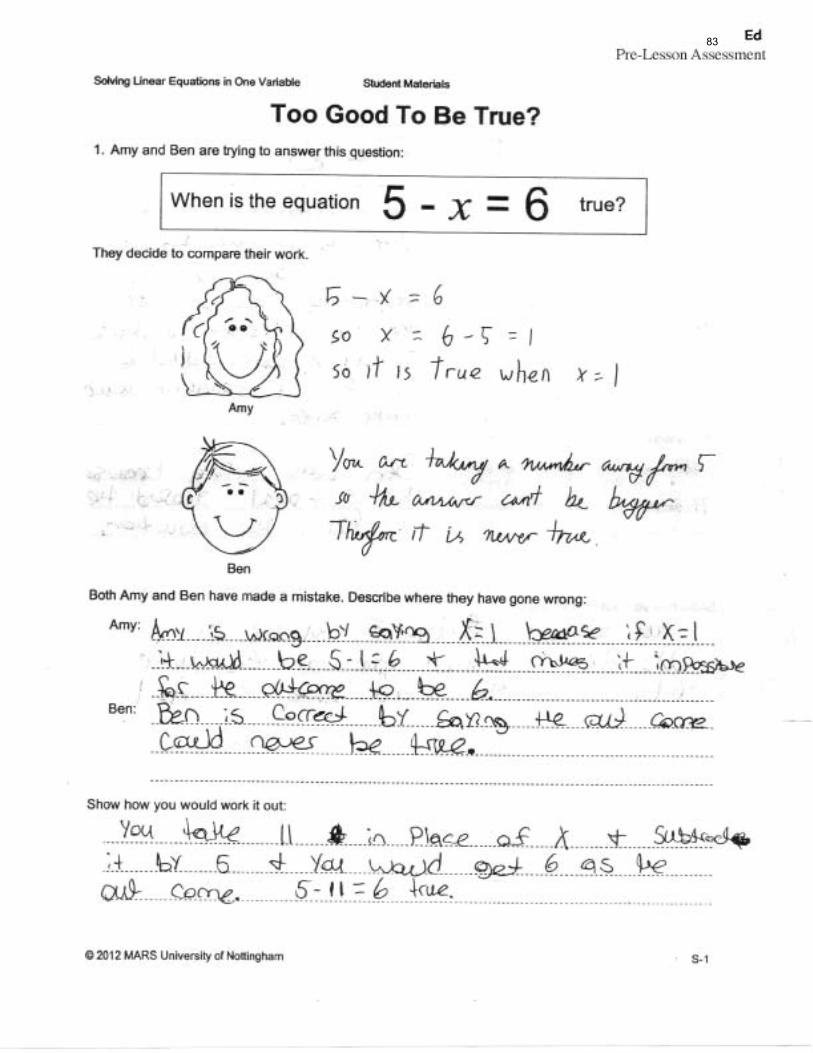
83
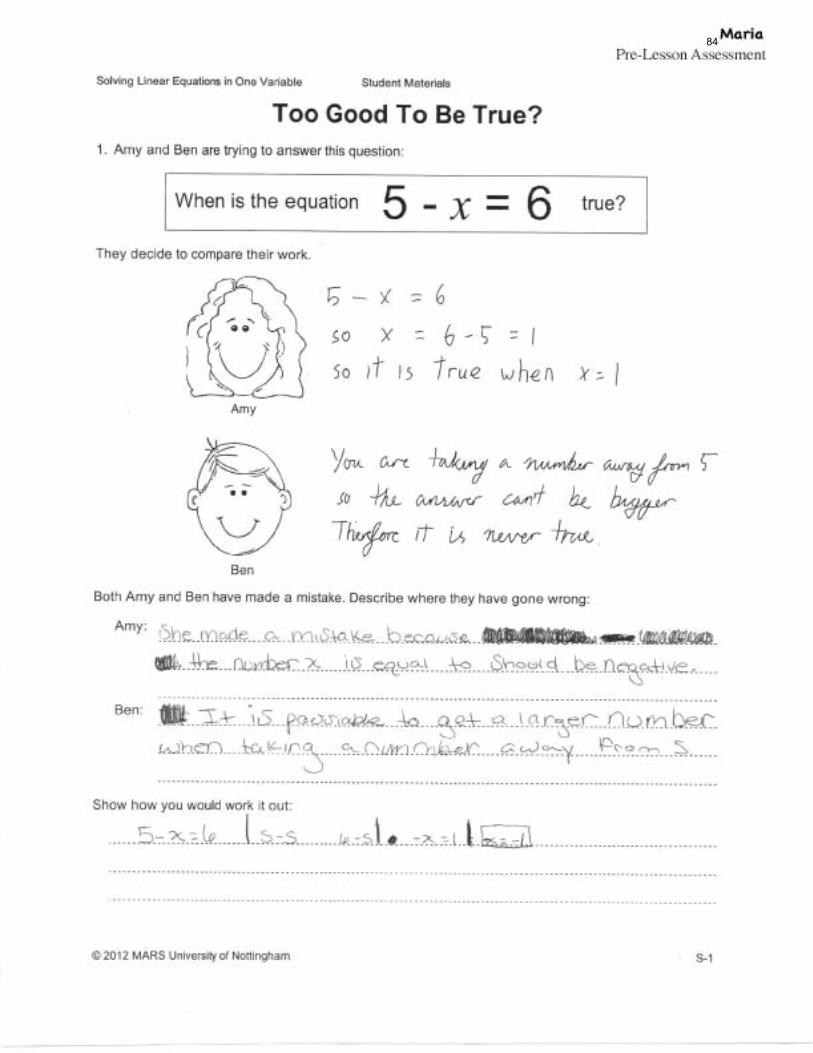
84
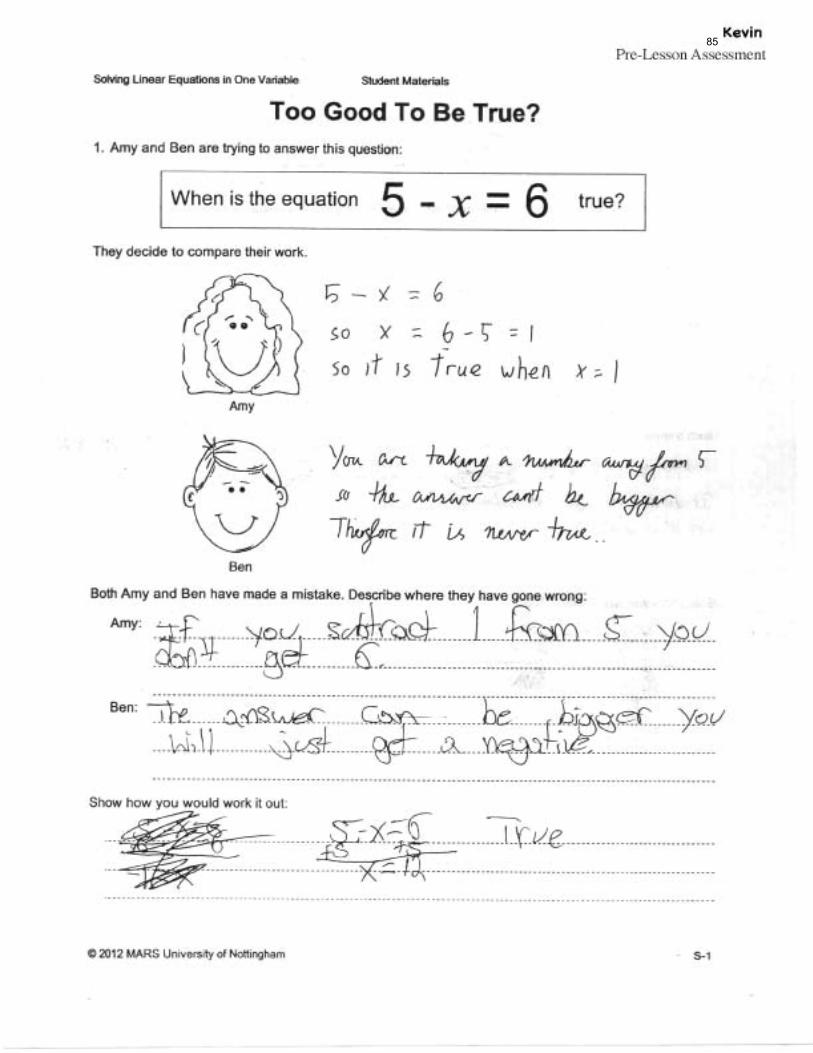
85
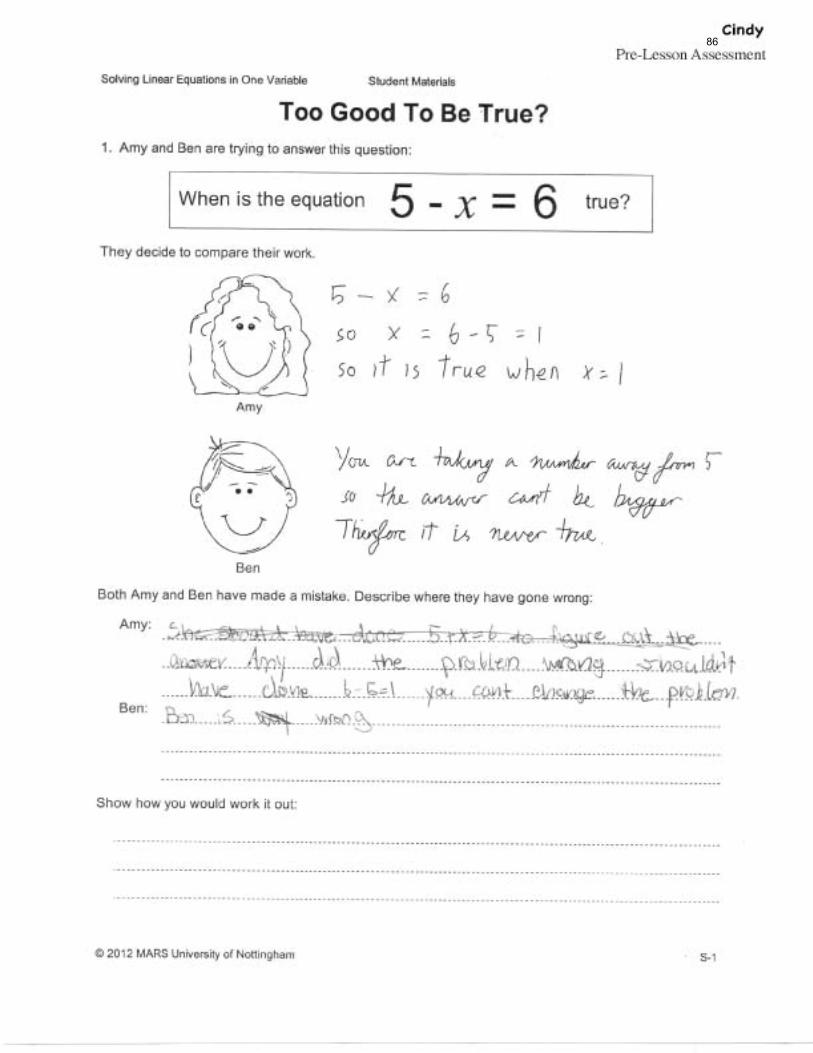
86