PROCEEDING, SEMINAR NASIONAL KEBUMIAN KE-10 … · proceeding, seminar nasional kebumian ke-10...
20
PROCEEDING, SEMINAR NASIONAL KEBUMIAN KE-10 PERAN PENELITIAN ILMU KEBUMIAN DALAM PEMBANGUNAN INFRASTRUKTUR DI INDONESIA 13 – 14 SEPTEMBER 2017; GRHA SABHA PRAMANA 431 LITHO-SEISMIC CLASSIFICATION BASED ON ELASTIC ROCK PARAMETERS: CASE STUDY – SOUTH PECIKO FIELD OFFSHORE MAHAKAM DELTA Santika Satya Widita 1 Didiek Budhy Prabowo 2 Hilfan Khairy 2 1 Geophysics Sub-department, Universitas Gadjah Mada 2 Total E&P Indonésie ABSTRACT Simultaneous seismic inversion was performed using the PSTM (Pre-stack Time Migration) data from Peciko field which is located at offshore Mahakam PSC. The study concentrated in the Peciko Main Zone area with 3km of burial depth. Five wells data which stand on the deltaic environment are used for this study. Sedimentary rocks are mostly found on the study area. The main objective of this study is to analyze the probability of facies in the study area based on lithology classification from elastic rock parameters that gained from seismic inversion IP (P-Impedance) and PR (Poisson Ratio). Every lithology such as sandstone, shale, or carbonate has its own different physical characteristic and can be distinguished by using well data (density and sonic log) and seismic inversion data (IP and PR cubes). Besides, cross-plot between IP and PR can also be the tools to differentiate fluid inside the formation, such as gas- or water-bearing sand reservoir. The analysis of lithology classification which based on the elastic rock parameter showed the information that can be used to more understand the lithology probabilities in the study area, also geological model. Distinguish the lithologies in the study area is quite challenging due to the depth of burial which is relatively deep and increase the compaction among the rocks. It impacted the result of seismic inversion IP and PR which shown a less correlation between those two elastic parameters therefore hardly to do the upscaling. In the other side, deltaic and shelf environment have contrast lithology which made it as one of the challenges that need to be resolved in this study. Cross-plot between IP and PR showed the lithology classification that fitted with its real model then the Probability Density Function (PDF) is used as the statistical approach to determine the facies’ probability. The result can be used for future well development. Keywords: Simultaneous Seismic Inversion, Poisson Ratio, P-Impedance, PDF 1. Introduction Seismic reservoir characteristic is started with feasibility study based on the log data which done to understand if the elastic rock parameters (IP and PR) are able to differentiate the lithology below the surface. Meanwhile, the inversion process can be used as the estimation of elastic rock properties which derived from seismic data. The inversion result can be transformed into the qualitative and quantitative of reservoir properties such as facies, porosity, volume of clay, etc. The technique that will be used for transforming the inversion result into the reservoir properties is called as litho-seismic classification and will be applied on this study. South Peciko is one of the Mahakam PSC which is discovered in 1983, with gas as its product. It locates on the offshore of prolific Kutai basin at Mahakam delta, East Kalimantan, Indonesia (Figure 1a). Upper Miocene fluvial and deltaic front environment are the depositional environments of South Peciko field. Peciko Main Zone is deposited in the delta front to pro-delta environment which consists of mouth-bar stacking (Lambert, 2003). Simultaneous seismic inversion was performed using the PSTM (Pre-stack Time Migration) angle stacks (Near, Mid, Far, Ultra-Far angle stack), resulted the Poisson Ratio (PR) and Acoustic Impedance (IP) cube. Five wells were also used in this study to correlate with seismic data (Figure 1b). Cross-plot between IP and PR cubes could distinguish the lithologies due to its elastic rocks characteristic. Burial of Peciko Main Zone is relatively deep, thus crossplot of elastic
Transcript of PROCEEDING, SEMINAR NASIONAL KEBUMIAN KE-10 … · proceeding, seminar nasional kebumian ke-10...

PROCEEDING, SEMINAR NASIONAL KEBUMIAN KE-10 PERAN PENELITIAN ILMU KEBUMIAN DALAM PEMBANGUNAN INFRASTRUKTUR DI INDONESIA
13 – 14 SEPTEMBER 2017; GRHA SABHA PRAMANA
431
LITHO-SEISMIC CLASSIFICATION BASED ON ELASTIC ROCK PARAMETERS: CASE
STUDY – SOUTH PECIKO FIELD OFFSHORE MAHAKAM DELTA
Santika Satya Widita1
Didiek Budhy Prabowo2
Hilfan Khairy2 1 Geophysics Sub-department, Universitas Gadjah Mada
2 Total E&P Indonésie
ABSTRACT
Simultaneous seismic inversion was performed using the PSTM (Pre-stack Time Migration) data from
Peciko field which is located at offshore Mahakam PSC. The study concentrated in the Peciko Main
Zone area with 3km of burial depth. Five wells data which stand on the deltaic environment are used
for this study. Sedimentary rocks are mostly found on the study area. The main objective of this study
is to analyze the probability of facies in the study area based on lithology classification from elastic
rock parameters that gained from seismic inversion IP (P-Impedance) and PR (Poisson Ratio). Every
lithology such as sandstone, shale, or carbonate has its own different physical characteristic and can be
distinguished by using well data (density and sonic log) and seismic inversion data (IP and PR cubes).
Besides, cross-plot between IP and PR can also be the tools to differentiate fluid inside the formation,
such as gas- or water-bearing sand reservoir. The analysis of lithology classification which based on
the elastic rock parameter showed the information that can be used to more understand the lithology
probabilities in the study area, also geological model. Distinguish the lithologies in the study area is
quite challenging due to the depth of burial which is relatively deep and increase the compaction
among the rocks. It impacted the result of seismic inversion IP and PR which shown a less correlation
between those two elastic parameters therefore hardly to do the upscaling. In the other side, deltaic and
shelf environment have contrast lithology which made it as one of the challenges that need to be
resolved in this study. Cross-plot between IP and PR showed the lithology classification that fitted
with its real model then the Probability Density Function (PDF) is used as the statistical approach to
determine the facies’ probability. The result can be used for future well development.
Keywords: Simultaneous Seismic Inversion, Poisson Ratio, P-Impedance, PDF
1. Introduction
Seismic reservoir characteristic is started with feasibility study based on the log data
which done to understand if the elastic rock parameters (IP and PR) are able to differentiate
the lithology below the surface. Meanwhile, the inversion process can be used as the
estimation of elastic rock properties which derived from seismic data. The inversion result can
be transformed into the qualitative and quantitative of reservoir properties such as facies,
porosity, volume of clay, etc. The technique that will be used for transforming the inversion
result into the reservoir properties is called as litho-seismic classification and will be applied
on this study.
South Peciko is one of the Mahakam PSC which is discovered in 1983, with gas as its
product. It locates on the offshore of prolific Kutai basin at Mahakam delta, East Kalimantan,
Indonesia (Figure 1a). Upper Miocene fluvial and deltaic front environment are the
depositional environments of South Peciko field. Peciko Main Zone is deposited in the delta
front to pro-delta environment which consists of mouth-bar stacking (Lambert, 2003).
Simultaneous seismic inversion was performed using the PSTM (Pre-stack Time
Migration) angle stacks (Near, Mid, Far, Ultra-Far angle stack), resulted the Poisson Ratio
(PR) and Acoustic Impedance (IP) cube. Five wells were also used in this study to correlate
with seismic data (Figure 1b).
Cross-plot between IP and PR cubes could distinguish the lithologies due to its elastic
rocks characteristic. Burial of Peciko Main Zone is relatively deep, thus crossplot of elastic

PROCEEDING, SEMINAR NASIONAL KEBUMIAN KE-10 PERAN PENELITIAN ILMU KEBUMIAN DALAM PEMBANGUNAN INFRASTRUKTUR DI INDONESIA
13 – 14 SEPTEMBER 2017; GRHA SABHA PRAMANA
432
rock parameters (IP and PR) was quite difficult to separate the overlap facies which made this
issue as one of the challenges at this study.
The main objective is to analyze the probability of sandstone in the study area based
on lithology classification from elastic rock parameters that gained from seismic inversion IP
(P-Impedance) and PR (Poisson Ratio).
2. Methodology
The analysis was start with quality control of seismic data using four angle stacks (near,
mid, far, ultra-far stack) and compared each aligned, synthetics and residual seismic section.
Theoretically, if the aligned and synthetics seismic data are matched, the residual seismic data
will be shown a lower value. The analysis was done to the marker Beta until the end of well
trajectory.
Well data with density and sonic log (P wave velocity (Vp) and S wave velocity (Vs))
that was already filtered with low cut frequency (0 – 2 Hz) in order to remove the background
burial trend was used to generate the petro-elastic parameters IP and PR, which this process is
called as Detrending. These parameters based on the log scale will be crossed plot with color
coded lithologies sand, shale, and limestone to know the separation between each lithologies.
Good quality of sand will be shown by the low IP and PR, while limestone showed high IP
and PR but shale corresponded to high IP – low PR or/and low IP – high PR.
Log data was also filtered at the seismic scale with the seismic bandwidth frequency or
bandpass filter (6 – 30 Hz) and crossed plot with color code the upscaled lithology to match
the log data with seismic upscale. Then seismic inversion IP and PR cubes were also
detrended by using the bandpass filter frequency and crossed plot with color code the
upscaled lithology.
These cross-plots from log scale and seismic scale then compared to know the separation
between each lithologies. From the cross-plot result, Probability Density Function (PDF) map
could be generated as the operator for litho-seismic classification. The PDF map showed
probabilities of certain lithology in the IP and PR domain. The PDF operator is built based on
discriminant analysis called probabilistic Bayesian methodology which allows the operator to
characterize uncertainties by computing probability to discriminate each facies (Hand, 1981;
Choliq M. T., 2014)
The simplified workflow of the litho-seismic classification study is explained on the
Figure 2. The previous steps which include the removing the background burial trend at the
well log data and the inverted impedance cubes will be continued into the next four main
steps in the workflow.
The first step is crossplot between P-Impedance (IP) and Poisson Ratio (PR) generates
from the detrended elastic log with the color code is lithology sandstone, limestone, shale
or/and other facies. Theoretically, lithologies on the crossplot between two elastic rock
parameters should be able to be discriminated, but in this study, Figure 3 shows the inability
of IP and PR crossplot to discriminate of each lithologies. This case happened due to the well
data which could not determine the elastic rock parameters since there was only one well that
has the sonic log and density log (well B-1) while three other wells only have the predicted
sonic and density log (well N-14, P-1, and T-1)
Second step is crossplot between IP and PR generates from the inverted seismic cubes and
using the upscaled lithology as the color code. This crossplot is a tool to make sure the
separation between each lithologies is still valid. The lithology is upscaled into the seismic
resolution and inverted elastic rock parameter IP, PR are extracted along the well. On this
study, crossplot between inverted IP and PR showed a good separation between each
lithologies in seismic scale which could be observed on Figure 4.
PROCEEDING, SEMINAR NASIONAL KEBUMIAN KE-10 PERAN PENELITIAN ILMU KEBUMIAN DALAM PEMBANGUNAN INFRASTRUKTUR DI INDONESIA
13 – 14 SEPTEMBER 2017; GRHA SABHA PRAMANA
433
Litho-seismic classification is required an operator to obtain the reservoir property, which
one of the operators is called as Probability Density Function (PDF), and on the third step,
PDF map is generate as the operator for this study (Figure 5a). The probability of each
lithologies is showed on the PDF map by taking the account of density at each lithologies
which lies on the crossplot. Then this PDF map will be extrapolated therefor the possible
value of inverted IP, PR around the study area could be covered and presented in 3D volumes
or cubes (Figure 5b). The result of PDF map as the operation for litho-seismic classification.
The last step is computation of lithology probability cubes which requires the lithology
PDF operator on the inverted seismic cube. The result of this workflow is lithology
probability cube such as sandstone, limestone, or shale probability cube.
3. Result
When the lithology probability cube once made, quality control of wells, section and map
layer must be done. The good quality data is showed by the ability of each lithology to
discriminate, such as separation between sandstone and limestone or other lithology. Quality
control that has been done at the first was the extraction of the lithology probability along the
well and it will be compared with the lithology that recorded at wells (or called as Litho-log).
The analysis was made on each well data and has been checked on the well which do not have
any information about sonic and density log or refers to blind well (M-1). Result of B-1, N-14
and T-1 showed some good lithology probabilities even though some interval of depth
showed the questionable and doubtable result which can be seen at Figure 6 for well B-1,
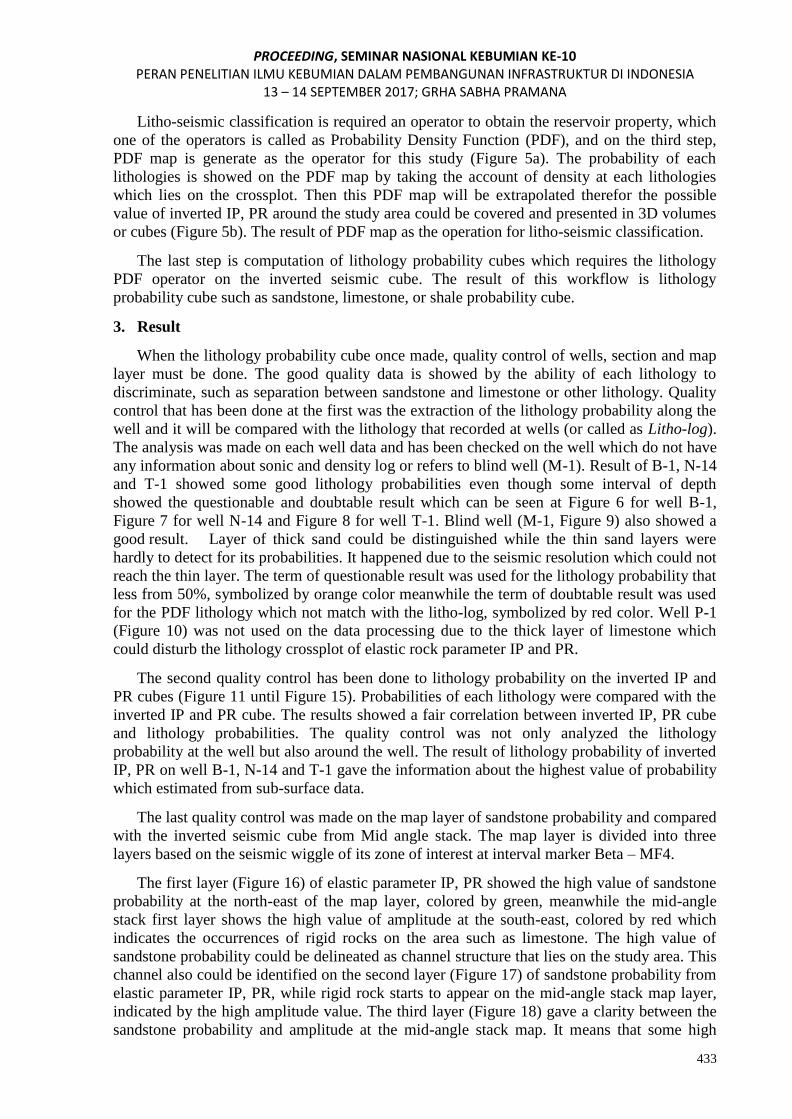
Figure 7 for well N-14 and Figure 8 for well T-1. Blind well (M-1, Figure 9) also showed a
good result. Layer of thick sand could be distinguished while the thin sand layers were
hardly to detect for its probabilities. It happened due to the seismic resolution which could not
reach the thin layer. The term of questionable result was used for the lithology probability that
less from 50%, symbolized by orange color meanwhile the term of doubtable result was used
for the PDF lithology which not match with the litho-log, symbolized by red color. Well P-1
(Figure 10) was not used on the data processing due to the thick layer of limestone which
could disturb the lithology crossplot of elastic rock parameter IP and PR.
The second quality control has been done to lithology probability on the inverted IP and
PR cubes (Figure 11 until Figure 15). Probabilities of each lithology were compared with the
inverted IP and PR cube. The results showed a fair correlation between inverted IP, PR cube
and lithology probabilities. The quality control was not only analyzed the lithology
probability at the well but also around the well. The result of lithology probability of inverted
IP, PR on well B-1, N-14 and T-1 gave the information about the highest value of probability
which estimated from sub-surface data.
The last quality control was made on the map layer of sandstone probability and compared
with the inverted seismic cube from Mid angle stack. The map layer is divided into three
layers based on the seismic wiggle of its zone of interest at interval marker Beta – MF4.
The first layer (Figure 16) of elastic parameter IP, PR showed the high value of sandstone
probability at the north-east of the map layer, colored by green, meanwhile the mid-angle
stack first layer shows the high value of amplitude at the south-east, colored by red which
indicates the occurrences of rigid rocks on the area such as limestone. The high value of
sandstone probability could be delineated as channel structure that lies on the study area. This
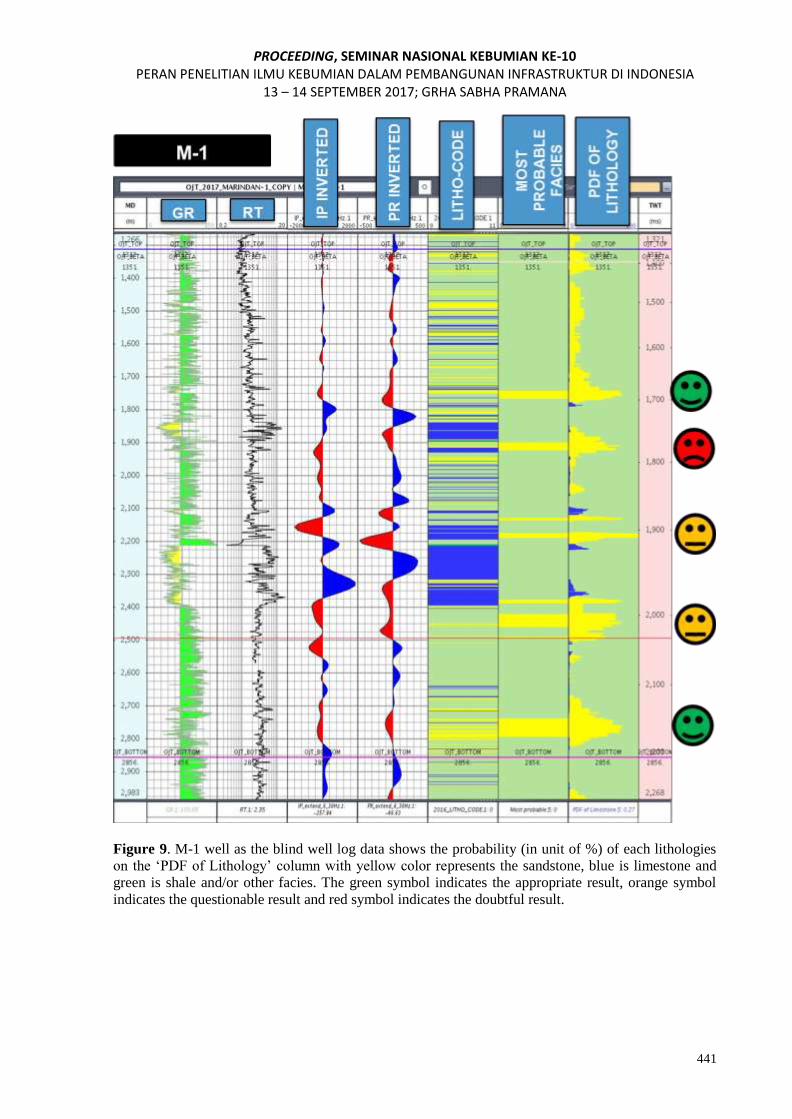
channel also could be identified on the second layer (Figure 17) of sandstone probability from
elastic parameter IP, PR, while rigid rock starts to appear on the mid-angle stack map layer,
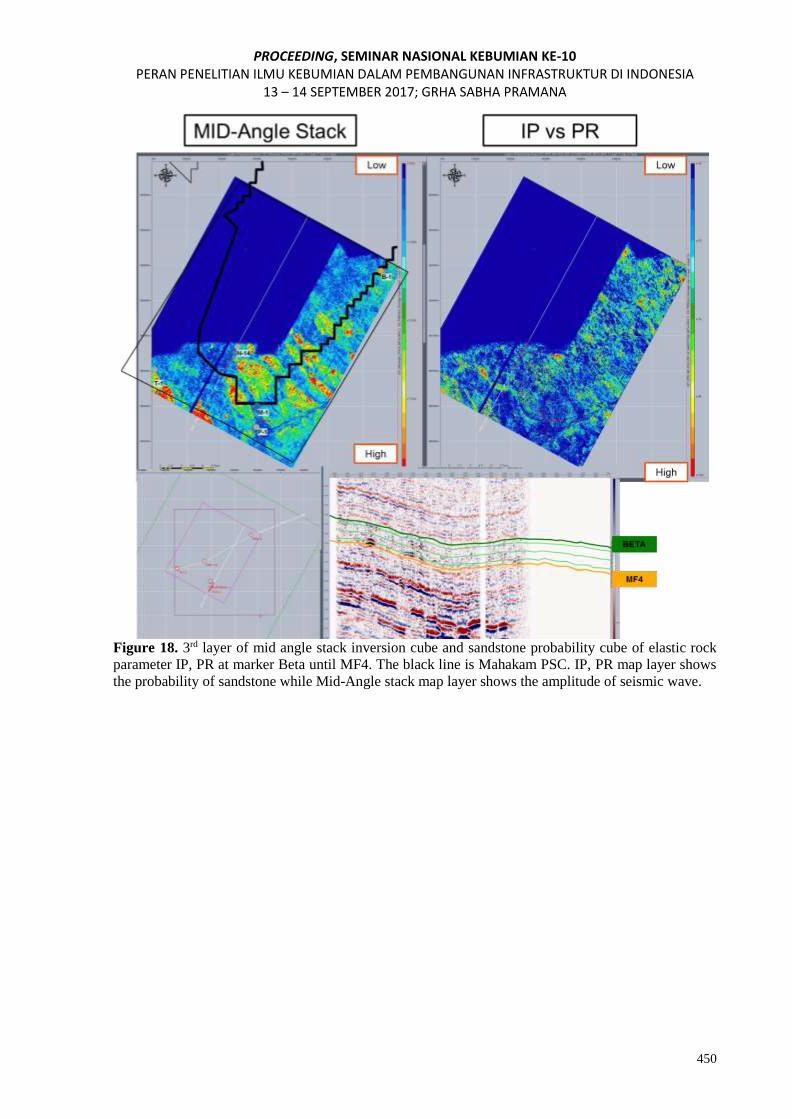
indicated by the high amplitude value. The third layer (Figure 18) gave a clarity between the
sandstone probability and amplitude at the mid-angle stack map. It means that some high

PROCEEDING, SEMINAR NASIONAL KEBUMIAN KE-10 PERAN PENELITIAN ILMU KEBUMIAN DALAM PEMBANGUNAN INFRASTRUKTUR DI INDONESIA
13 – 14 SEPTEMBER 2017; GRHA SABHA PRAMANA
434
value of sandstone probability lies between the rigid rocks that shows at the third layer of
mid-angle stack map, such as limestone. Analysis of the sandstone probability could be more
reliable with the addition of other supporting data in order to know the channel spreading.
4. Conclusions
Litho-seismic classification based on elastic rock parameter is an approach to understand
the lithology information such as sand probability. This approach is useful as subsurface
interpretation and as a guide to map the reservoir therefor the future well development can be
planned. It also helps the interpreter to know the occurrence of sandstone at sub-surface and
gives the geological information not only around the well but also in terms of 3D cubes. The
limitation of this study occurs due to the vertical resolution of seismic data which cannot
detect the thin layer, therefore the sandstone probability still hardly to define the thin layer at
the sub-surface. This study can still be continued into the advance analysis with using the
other supporting data.
Acknowledgments
The author would like to give the highest gratitude to Total E&P Indonesie for its permission
to publish this paper, and to Mr. Didiek Budhy Prabowo, Mr. Hilfan Khairy and Mr. M.
Adam Cepi from Total E&P Indonesie for their guidance during this study.
References Choliq, M. T., Yuh, S., Beele, M., Schulbaum, L., Vallon, G., 2014 . Seismic reservoir
characterization based on litho-seismic classification constrained by wells to detect gas-
bearing sands in Peciko Main Zone, Mahakam Delta, in: Proceedings of the International
Geosciences Conference and Exhibition, IPA, 38th Annual Convention. Jakarta
Hand, D. J., 1981, Discrimination and Classification: Wiley Series in Probabilities and Mathematical
Statisitics. John Wiley & Sons, Chicester
Lambert, B., B. C. Duval, Y. Grosjean, I. M. Umar, and P. Zaugg, 2003, The Peciko case history:
Impact of an evolving geologic model on the dramatic increase of gas reserves in the
Mahakam Delta, in M. T. Halbouty, ed., Giant oil and gas fields of the decade 1990– 1999,
AAPG Memoir 78, p. 297– 320.

PROCEEDING, SEMINAR NASIONAL KEBUMIAN KE-10 PERAN PENELITIAN ILMU KEBUMIAN DALAM PEMBANGUNAN INFRASTRUKTUR DI INDONESIA
13 – 14 SEPTEMBER 2017; GRHA SABHA PRAMANA
435
Figure 1. The study area of Peciko field is showed by the yellow square (a) and followed with the well
distribution at the study area (b)

PROCEEDING, SEMINAR NASIONAL KEBUMIAN KE-10 PERAN PENELITIAN ILMU KEBUMIAN DALAM PEMBANGUNAN INFRASTRUKTUR DI INDONESIA
13 – 14 SEPTEMBER 2017; GRHA SABHA PRAMANA
436
Figure 2. The simplified Litho-seismic classification workflow, where this process is intended to find
the operator that distinguish each lithologies in form of PDF map and will be applied on the inverted
seismic cube (modified from Choliq, M. T., 2014)
Figure 3. Crossplot of well data from elastic rock parameter P-Impedance (IP) and Poisson Ratio (PR)
at log scale after detrending with color code from lithology interpretation (before upscale). Each
lithologies is still overlapping and scattering around the crossplot.

PROCEEDING, SEMINAR NASIONAL KEBUMIAN KE-10 PERAN PENELITIAN ILMU KEBUMIAN DALAM PEMBANGUNAN INFRASTRUKTUR DI INDONESIA
13 – 14 SEPTEMBER 2017; GRHA SABHA PRAMANA
437
Figure 4. Crossplot of well data at seismic scale (a) and crossplot of inverted IP, PR data at seismic
scale by using the bandpass filter (6-30Hz) and upscaled lithology. Each lithologies has already
separated even though some points are still overlapping.
Figure 5. the PDF (Probability Density Function) operator for each lithologies from elastic parameter
IP, PR before extrapolating (a) and after extrapolating (b) which the probability is measured at unit %
meanwhile the colors that are showed at the most probable facies represents the lithologies (yellow for
sandstone, blue for limestone and green for shale or/and other facies)

PROCEEDING, SEMINAR NASIONAL KEBUMIAN KE-10 PERAN PENELITIAN ILMU KEBUMIAN DALAM PEMBANGUNAN INFRASTRUKTUR DI INDONESIA
13 – 14 SEPTEMBER 2017; GRHA SABHA PRAMANA
438
Figure 6. B-1 well as the reference well log data shows the probability (in unit of %) of each
lithologies on the ‘PDF of Lithology’ column with yellow color represents the sandstone, blue is
limestone and green is shale and/or other facies. The green symbol indicates the appropriate result,
orange symbol indicates the questionable result and red symbol indicates the doubtful result.

PROCEEDING, SEMINAR NASIONAL KEBUMIAN KE-10 PERAN PENELITIAN ILMU KEBUMIAN DALAM PEMBANGUNAN INFRASTRUKTUR DI INDONESIA
13 – 14 SEPTEMBER 2017; GRHA SABHA PRAMANA
439
Figure 7. N-14 well data shows the probability (in unit of %) of each lithologies on the ‘PDF of
Lithology’ column with yellow color represents the sandstone, blue is limestone and green is shale
and/or other facies. The green symbol indicates the appropriate result, orange symbol indicates the
questionable result and red symbol indicates the doubtful result.

PROCEEDING, SEMINAR NASIONAL KEBUMIAN KE-10 PERAN PENELITIAN ILMU KEBUMIAN DALAM PEMBANGUNAN INFRASTRUKTUR DI INDONESIA
13 – 14 SEPTEMBER 2017; GRHA SABHA PRAMANA
440
Figure 8. T-1 well data shows the probability (in unit of %) of each lithologies on the ‘PDF of
Lithology’ column with yellow color represents the sandstone, blue is limestone and green is shale
and/or other facies. The green symbol indicates the appropriate result, orange symbol indicates the
questionable result and red symbol indicates the doubtful result.
PROCEEDING, SEMINAR NASIONAL KEBUMIAN KE-10 PERAN PENELITIAN ILMU KEBUMIAN DALAM PEMBANGUNAN INFRASTRUKTUR DI INDONESIA
13 – 14 SEPTEMBER 2017; GRHA SABHA PRAMANA
441
Figure 9. M-1 well as the blind well log data shows the probability (in unit of %) of each lithologies
on the ‘PDF of Lithology’ column with yellow color represents the sandstone, blue is limestone and
green is shale and/or other facies. The green symbol indicates the appropriate result, orange symbol
indicates the questionable result and red symbol indicates the doubtful result.

PROCEEDING, SEMINAR NASIONAL KEBUMIAN KE-10 PERAN PENELITIAN ILMU KEBUMIAN DALAM PEMBANGUNAN INFRASTRUKTUR DI INDONESIA
13 – 14 SEPTEMBER 2017; GRHA SABHA PRAMANA
442
Figure 10. P-1 well data shows the probability (in unit of %) of each lithologies on the ‘PDF of
Lithology’ column with yellow color represents the sandstone, blue is limestone and green is shale
and/or other facies. The green symbol indicates the appropriate result, orange symbol indicates the
questionable result and red symbol indicates the doubtful result.

PROCEEDING, SEMINAR NASIONAL KEBUMIAN KE-10 PERAN PENELITIAN ILMU KEBUMIAN DALAM PEMBANGUNAN INFRASTRUKTUR DI INDONESIA
13 – 14 SEPTEMBER 2017; GRHA SABHA PRAMANA
443
Figure 11. Seismic section around reference well B-1 of inversion IP, PR cubes, lithology probability cubes (PDF of Sandstone and PDF of Limestone) and
the most probable facies cubes. Black line on the inset map represents the section and the blue line represents delineation of Mahakam delta. Pink circle
indicates the high probability of sandstone which confirmed on the most probable facies cubes.

PROCEEDING, SEMINAR NASIONAL KEBUMIAN KE-10 PERAN PENELITIAN ILMU KEBUMIAN DALAM PEMBANGUNAN INFRASTRUKTUR DI INDONESIA
13 – 14 SEPTEMBER 2017; GRHA SABHA PRAMANA
Figure 12. Seismic section around N-14 well of inversion IP, PR cubes, lithology probability cubes (PDF of Sandstone and PDF of Limestone) and the most
probable facies cubes. Black line on the inset map represents the section and the blue line represents delineation of Mahakam delta. Pink circle indicates the
high probability of sandstone and orange circle indicates the high probability of limestone which confirmed on the most probable facies cubes.

PROCEEDING, SEMINAR NASIONAL KEBUMIAN KE-10 PERAN PENELITIAN ILMU KEBUMIAN DALAM PEMBANGUNAN INFRASTRUKTUR DI INDONESIA
13 – 14 SEPTEMBER 2017; GRHA SABHA PRAMANA
445
Figure 13. Seismic section around T-1 well of inversion IP, PR cubes, lithology probability cubes (PDF of Sandstone and PDF of Limestone) and the most
probable facies cubes. Black line on the inset map represents the section and the blue line represents delineation of Mahakam delta. Pink circle indicates the
high probability of sandstone which confirmed on the most probable facies cubes.

PROCEEDING, SEMINAR NASIONAL KEBUMIAN KE-10 PERAN PENELITIAN ILMU KEBUMIAN DALAM PEMBANGUNAN INFRASTRUKTUR DI INDONESIA
13 – 14 SEPTEMBER 2017; GRHA SABHA PRAMANA
446
Figure 14. Seismic section around blind well M-1 of inversion IP, PR cubes, lithology probability cubes (PDF of Sandstone and PDF of Limestone) and the
most probable facies cubes. Black line on the inset map represents the section and the blue line represents delineation of Mahakam delta. Orange circle
indicates the high probability of limestone which confirmed on the most probable facies cubes. While, pink circle indicates the high probability of sandstone
but there was no sign of high probability of sandstone on the most probable facies cube.

PROCEEDING, SEMINAR NASIONAL KEBUMIAN KE-10 PERAN PENELITIAN ILMU KEBUMIAN DALAM PEMBANGUNAN INFRASTRUKTUR DI INDONESIA
13 – 14 SEPTEMBER 2017; GRHA SABHA PRAMANA
447
Figure 15. Seismic section around P-1 well of inversion IP, PR cubes, lithology probability cubes (PDF of Sandstone and PDF of Limestone) and the most
probable facies cubes. Black line on the inset map represents the section and the blue line represents delineation of Mahakam delta. Pink circle indicates the
high probability of sandstone which confirmed on the most probable facies cubes. While, orange circle indicates the high probability of limestone but
unconfirmed on the most probable facies cube.

PROCEEDING, SEMINAR NASIONAL KEBUMIAN KE-10 PERAN PENELITIAN ILMU KEBUMIAN DALAM PEMBANGUNAN INFRASTRUKTUR DI INDONESIA
13 – 14 SEPTEMBER 2017; GRHA SABHA PRAMANA
Figure 16. 1st layer of mid angle stack inversion cube and sandstone probability cube of elastic rock
parameter IP, PR at marker Beta until MF4. The black line is Mahakam PSC. IP, PR map layer shows
the probability of sandstone while Mid-Angle stack map layer shows the amplitude of seismic wave.
PROCEEDING, SEMINAR NASIONAL KEBUMIAN KE-10 PERAN PENELITIAN ILMU KEBUMIAN DALAM PEMBANGUNAN INFRASTRUKTUR DI INDONESIA
13 – 14 SEPTEMBER 2017; GRHA SABHA PRAMANA
449
Figure 17. 2nd layer of mid angle stack inversion cube and sandstone probability cube of elastic rock
parameter IP, PR at marker Beta until MF4. The black line is Mahakam PSC. IP, PR map layer shows
the probability of sandstone while Mid-Angle stack map layer shows the amplitude of seismic wave.
PROCEEDING, SEMINAR NASIONAL KEBUMIAN KE-10 PERAN PENELITIAN ILMU KEBUMIAN DALAM PEMBANGUNAN INFRASTRUKTUR DI INDONESIA
13 – 14 SEPTEMBER 2017; GRHA SABHA PRAMANA
450
Figure 18. 3rd layer of mid angle stack inversion cube and sandstone probability cube of elastic rock
parameter IP, PR at marker Beta until MF4. The black line is Mahakam PSC. IP, PR map layer shows
the probability of sandstone while Mid-Angle stack map layer shows the amplitude of seismic wave.