
Proceeding of Brunei International Conference on Engineering and Technology 2012


PROCEEDING
The 5th International Conference on Low Carbon Asia & Beyond - ICLCA 2019
Jointly Held With The 4th International Conference on Chemical
Engineering, Food and Biotechnology – ICCFB 2019
Transformation towards Smart, Resilient & Sustainable Communities
October 15 - 17, 2019,Ho Chi Minh City, Vietnam

EDITORS
Jeng Shiun LIM, UTM, MY
Nor Alafiza YUNUS, UTM, MY
Hoang Anh HOANG , HCMUT, VN

Proceedings of
The 5th International Conference on Low Carbon Asia & Beyond - ICLCA 2019 &
The 4th International Conference on Chemical Engineering, Food and Biotechnology -
ICCFB 2019
Vietnam, Malaysia
ISBN: 978-604-67-1372-2
ISBN 978-88-95608-67-9; ISSN 2283-9216
Page i
CONTENT
Urban Community Garden: Drivers and Motivations
Wan Nurul Mardiah Wan Mohd Rani*, Ramona Abd Rahim, Siti Zalita Ad Talib,
Nurul Azreen Azlan, Siti Uzairiah Mohd Tobi, Syuhaida Ismail
…………1
Effects of Technological Parameters of Enzyme Treatment on the Protein
Extraction Yield from Defatted Peanut Meal
Hien Thi Nguyen*, Van Viet Man Le
…………7
Rural Web as a Tool to Project Trajectories for Green Economy
Nazia Khalida Sulaiman*, Mohamad Fadhli Rashid, Siti Hajar Misnan, Ibrahim
Ngah
…………13
Inactivation of A. hydrophila in sterilized striped-catfish pond water at
different phage-to-host ratios
Hoang A. Hoang*, Tran T.T. Xuan
…………19
Assessment on the Reality of the Development of Land Fund in the Area
of Phu Vang District, Thua Thien Hue Province
Cuong Le Dinh*, Song Toan Pham Phu, Takeshi Fujiwara
…………25
Health Risk Assessment of Glyphosate at Grape Farms, Tuy Phong
District, Binh Thuan Province
Nam V. Thai*, Nguyen T. Trinh
…………31
Synthesis Nano- Xonotlite from Rice Husk Ash
Tran Tan Viet *, Tran Thi Thuy Hang, Truong Thi Thuy
…………37
Technological Confidence of Higher Education Institutions(Heis) Towards
E-Learning
Rhoda M. Lilan*, Jhonalyn G. Bautista
…………43
Simulation System of Flow Through Butterfly Valves to Mix Ethanol and
Gasoline for Producing Gasohol Using CFD Solidworks Software
Ung Hai Tran*, Phat Duy Thanh Le
…………49
Preliminary study of carbon nanotubes formation from methane over
stainless steel in chemical vapor deposition system
Cong-Danh Nguyen, Tu-Doanh Tieu, Thanh-Sinh Do, Hong-Tham Nguyen-Thi,
Duong Thai, Ke-Thanh Ngo-Vo, Huu-Luong Nguyen, Van-Cattien Nguyen,
Tuyet-Mai Tran-Thuy*
…………55

Proceedings of
The 5th International Conference on Low Carbon Asia & Beyond - ICLCA 2019 &
The 4th International Conference on Chemical Engineering, Food and Biotechnology -
ICCFB 2019
Vietnam, Malaysia
ISBN: 978-604-67-1372-2
ISBN 978-88-95608-67-9; ISSN 2283-9216
Page ii
Magnetite Fe3O4 nanoparticles: wet-chemical synthesis for therapeutic
applications
Ngoc Do Quyen Chau*, Trung Dang-Bao*
…………61
Chemical Constituents and Bioactivities of Ethyl Acetate Extract from
Tacca leontopetaloides (L) Kuntze Leaves
Minh-Tam K Nguyen*, Mong-Ngoc Pham, Cong-Tin Van, Mai-Trinh Le, Thuc-Vi
M. Tran
…………67
Catalytic Removal of Formaldehyde in Humid Condition Using Nano-Sized
Noble Metal Supported on Ceria-Granular Carbon at Room Temperature
Bien Cong Trung, Le Nguyen Quang Tu , Ngo Thanh An, Nguyen Quang Long*
…………72
Investigation of activity of Edwardsiella ictaluri bacteriophages at different
conditions
Tran T.T. Xuan*, Hoang A. Hoang*
…………78
Recovery of indium from waste streams by using supported liquid
membranes with strip dispersion
Ngan Thi Tuyet Dang*, Da-Ming Wang, Kien Trung Tran
…………83
Pretreatment of Lignocellulosic Biomass for Value-Added Products: A
Brief Review
Phung K. Le*, Hieu H.T. Pham, Trinh K.T. Nguyen, Viet T. Tran
…………89
The Induction of Beta vulgaris L. Adventitious Roots In In Vitro Culture for
Betalains
Thuy Tien T. Le, Cam Tu H.Nguyen, Minh V. Tran
…………96

Page 1
Proceedings of
The 5th International Conference on Low Carbon Asia & Beyond - ICLCA 2019 &
The 4th International Conference on Chemical Engineering, Food and
Biotechnology - ICCFB 2019
Vietnam, Malaysia.
ISBN: 978-604-67-1372-2
ISBN 978-88-95608-67-9; ISSN 2283-9216
Urban Community Garden: Drivers and Motivations
Wan Nurul Mardiah Wan Mohd Rani* a, Ramona Abd Rahim b, Siti Zalita Ad Talib c,
Nurul Azreen Azlan a,, Siti Uzairiah Mohd Tobi a, Syuhaida Ismail a
a Razak Faculty of Technology and Informatics, Universiti Teknologi Malaysia, Jalan Sultan Yahya Petra, 50410, Kuala
Lumpur, Malaysia b Faculty of Social Science and Humanities, Universiti Teknologi Malaysia, Jalan Sultan Yayha Petra, 50410, Kuala Lumpur,
Malaysia c University Lab Management Unit, Universiti Teknologi Malaysia, Jalan Sultan Yayha Petra, 50410, Kuala Lumpur, Malaysia
Community garden has gained much popularity in urban areas owing to its potential that it may bring to the
environment, economy, and social development. Greening the cities with urban garden and farming activities is
one of the means that help cities to improve urban resilience, as well as improve the food security of the urban
community. Such effort directly supports the interlinked principles of New Urban Agenda and addresses the
Sustainable Development Goal 11 (Sustainable Cities and Communities), 13 (Climate Action), and 15 (Life of
Land). Traditionally, gardens have always played a significant role in achieving a sustainable community.
Furthermore, community gardening has the potential to achieve resilience at different levels: individual, social
group as well as the natural environment. Today, the awareness of the expected benefits of community garden
continue to increase. Previous studies highlighted that the majority of the urban community has initiated
community gardens as a mean to overcome food shortage, stress relief, and boost sense of community. This
paper examines the drivers and motivations on the involvement in the community garden in an urban setting.
The drivers and motivations are evaluated based on a questionnaire survey and guided interview with selected
participants of Sungai Bunus Community Garden, Kuala Lumpur. Findings of the study indicated that through
active involvement in gardening activities increases sense of community, enhances gardening skills, improve
food security and most important, motivate to start own garden for self-consumption. Also, majority of the
respondents associated the benefits of the activity to satisfy their personal benefits related to gardening activities
i.e. to explore new ideas on gardening (88 %), to find solutions (84 %), resources (80 %) and reinforcement of
existing knowledge (72 %). Indirectly, the community garden has successfully unified the urban community
within the vicinity, inculcate healthy lifestyle through gardening, contribute to carbon reduction in Kuala Lumpur
and support the Sustainable Development Goals. Hence, such community garden needs to be advocated to
provide further impact and collectively strengthen the sustainability and improve the people’s awareness of the
human-nature relationship.
1. Introduction
Community garden has gained much popularity in urban areas owing to its potential that it may bring to the
environment, economy, and social development. Greening the cities with urban garden and farming activities is
one of the means that help cities to improve urban resilience, as well as improve the food security of the urban
community. Such effort directly supports the interlinked principles of New Urban Agenda and addresses the
Sustainable Development Goal 11 (Sustainable Cities and Communities), 13 (Climate Action), and 15 (Life of
Land). Community resilience is referred to the ability of communities to survive, adapt to, and recover from loss
and disruptions that may affect their daily lives (Nursey-Bray et al., 2014). Traditionally, gardens have always
played a significant role in community resilience. Rural communities, in particular, have relied on compound and
backyard gardens for food shortages during the economic and political crisis. Rezai et al. (2016) pointed out
that urban agriculture has gained popularity in Malaysia due to its potential to provide urban dwellers access to

Page 2
fresh produce at low cost. Today, the awareness of the expected benefits of a community garden continues to
increase. Previous studies have highlighted that the majority of the urban community initiated community
gardens as a mean to overcome food shortage, stress relief, and boost sense of community. This paper
examines the drivers and motivations of the community garden participation in an urban setting with specific
focus on Sungai Bunus Community Garden, Kuala Lumpur as part of the effort to rejuvenate the
abandoned/unused land along the riverbank of Sungai Bunus.
2. Literature review
2.1. Understanding urban community garden
Community gardens are distinguished from a private garden in terms of its ownership, authority and access,
where it reflects the sense of a public garden (Ferris et al., 2001). Community garden as defined by Glover from
Beilin and Hunter (2011) states that it is a piece of land where people from a community able to produce food
or grow flowers for personal use. It has collective benefits thus the community share the resources. These
gardens are collectively operated by a group of people or a community from various setting such as-
neighbourhood, institutions, hospitals, prisons, faith community, organizations etc. and contribute to individuals
from all age, ethnicity, and socioeconomic status (Draper and Freedman, 2010). The concept of community
garden became widespread during the two world wars in order to overcome war-time food shortage in Europe,
UK and America (Egli et al., 2016). These gardens were an important initiative taken by the communities in
order to supply of rations, food and necessary nutrients. Today, community gardens not only serve the purpose
as an alternative food supply but also provide the opportunity for income generation and outdoor activities as
well. Indirectly, they create interaction among communities and sense of belonging to the place (Agustina and
Beilin, 2012).
2.2. Types of community garden
Allotment gardens are the first variation of urban garden where individual gardeners rent plots owned by local
municipality which have well-defined contract and aim for reducing poverty. Later other types of community
gardens were popularized which shifted the emphasis from food production and supply to bringing communities
together, educating the community, relieving stress, strengthening sense of community and resilience.
Community gardens include neighbourhood gardens, institutional gardens, mixed and specialized production
gardens etc. (Trendov, 2018). Ferris et al. (2001) identified eight categories of community gardens while
conducting research on community gardens in San Francisco and considered these typology comprise most
types of gardens worldwide. Among the category of community gardens are as follows:
i. Leisure gardens- These are the most common types of community gardens initiated in a
neighbourhood for recreation and leisure purpose.
ii. Child and school gardens- School gardens are built and maintained by the students which are
important platform for educational activity (part of science curriculum) as well as food production.
iii. Entrepreneurial gardens- In disadvantaged neighbourhood community gardens are built to alleviate
poverty and social exclusion by providing opportunity to generate income for the participants.
iv. Crime diversion gardens/Work and training gardens- These community gardens are used to divert
young people from negative activities in addition to encourage training and income opportunity.
v. Healing and therapy gardens/Quiet gardens- These gardens are part of treatment or healing, managed
by hospital community that offers community care, rehabilitation program and memorials.
vi. Neighbourhood pocket parks- A civic park created voluntarily by neighbourhood community in a
reclaimed unused or under used land which is open for residents and public as well.
vii. Ecological restoration gardens/parks- The community parks that are established from the social
objective of restoring a place to its natural form to control the ecological balance. These gardens involve
voluntary approach as well as scientific expertise.
viii. Demonstration gardens- Some of the community gardens are part of research on sustainable
agriculture or organic food, which also serve the purpose of teaching residents about composting and
water conservation.
Along this line, the Sungai Bunus Community Garden falls under three categories listed above; (i)
neighbourhood pocket park, (ii) ecological restoration garden and (iii) demonstration garden.
2.3. Benefits of community garden
Urban community garden has many benefits not only confined to food security, environment and economy, but
also in societal wellbeing by positively influencing individual emotional experience and social community

Page 3
integration (Egli et al., 2016). Improvement to food security is one of the most cited benefit of community
gardens. According to Corrigan (2011) community, gardening and producing food within neighbourhood can
overcome unequal food distribution problems and ensure nutritious food to everyone. Community gardens
establish economic stability through producing foods and creating provision for selling production in local
markets and encouraging community supported agriculture and food processing microenterprises (Corrigan,
2011). On health related benefits, urban community farming promotes fresh fruits and vegetables consumption
among participants as well as community members that increase positive dietary habit (McVey et al., 2018).
Moreover, gardening encourages outdoor physical activity among youth and adults which lead to improved
physical fitness (Draper and Freedman, 2010). Urban community gardens are often an alternative for public
parks for socialisation, where community members can enjoy nature and enrich personal perspectives (Draper
and Freedman, 2010). Community gardens is also often act as public space that require collaboration and
negotiation (He and Zhu, 2018).
With regards to community sustainability and resilience, community gardens are often created by group of
people in network to leverage power by creating strong connection (Ghose and Pettygrove, 2014). These
gardens enhance collective efficiency of participants by encouraging to share resources inside and outside the
community network which bring together people from different social background and strengthen sense of
community (Draper and Freedman, 2010). Community gardening provide opportunity to youth for participatory
learning and enhance academic and social skills. Additionally engaging young people in gardening activities
result in lower crime rate and maintain favourable neighbourhood environment (Draper and Freedman, 2010).
In terms of social and cultural aspects, studies in US show that gardeners experience significant connection
with their gardens that indicate social attachment with the place and community. They appreciate the experience
of gardening and take pride in their neighbourhood (Petrovic et al., 2019). Community gardens reflect the
participants’ culture through the produced plants, activities, events held, design and helps preserve cultural
diversity (Draper and Freedman, 2010). Gardening activities require interaction and cohesion which help
strengthen urban community resilience (Shimpo et al., 2019). By strengthening community resilience urban
gardens help accomplish SDG 11 of making cities and communities sustainable. Overall, community gardens
have the potential to establish social empowerment and improve social cohesion (McVey et al., 2018).
Often, urban community gardens are managed by spontaneous participation of the members of the community
where people from different background come together and gardening activity serve in diverse manner for each
individual. For some people, gardens provide economic benefit and supply healthy food, on the other hand, it
also boosts sense of ownership and pride and relieves stress (Egli et al., 2016). In terms of governance, in
Europe and US, these agricultural zone in urban areas are legitimized by government that indicates these
community gardens are maintained by both bottom-up and top-down approach (He and Zhu, 2018). Also,
community gardens contribute to restore ecological balance by bringing back biodiversity; birds and insect
species in city centre, flood mitigation through infiltration and greens that cool the air in high density areas
(Middle et al., 2014). Furthermore, community gardening have the potential to achieve sustainability at different
levels of individual, social group and natural environment (Okvat and Zautra, 2011). Gardening activities in
unused lands rejuvenate the place as well as benefit the society. Also, urban community gardens play important
role in community recovery after disasters or extreme conditions by creating opportunities to collaborate and
building networks within community members.
3. Methodology
This paper assesses the drivers and motivations on the involvement in the community garden in an urban
setting. The drivers and motivations are determined based on a questionnaire survey and in-depth interview
with selected participants of Sungai Bunus Community Garden, Kuala Lumpur. The potentials of this community
garden are evaluated based on a questionnaire survey and guided interviews with selected participants of
Sungai Bunus Community Garden, Kuala Lumpur. Twenty-five participants of the community garden responded
to the questionnaire survey which were distributed after their gardening sessions and eight participants were
interviewed. The questionnaire survey gathered information on their perceptions towards community garden,
the motivation of their involvement and the perceived change of before and after their involvement in gardening
activities.
4. Findings and discussion
Sungai Bunus Community Garden, initiated in 2017 aimed to rejuvenate the abandoned Sungai Bunus riverbank
and to improve the water quality of Sungai Bunus River, a 9-kilometre stretch river that flows in Kuala Lumpur.
Through partnerships with various organisations and corporate agencies located at the vicinity of the site, the
garden was progressively developed by these committed volunteers. Among the main active partners of Sungai
Page 4
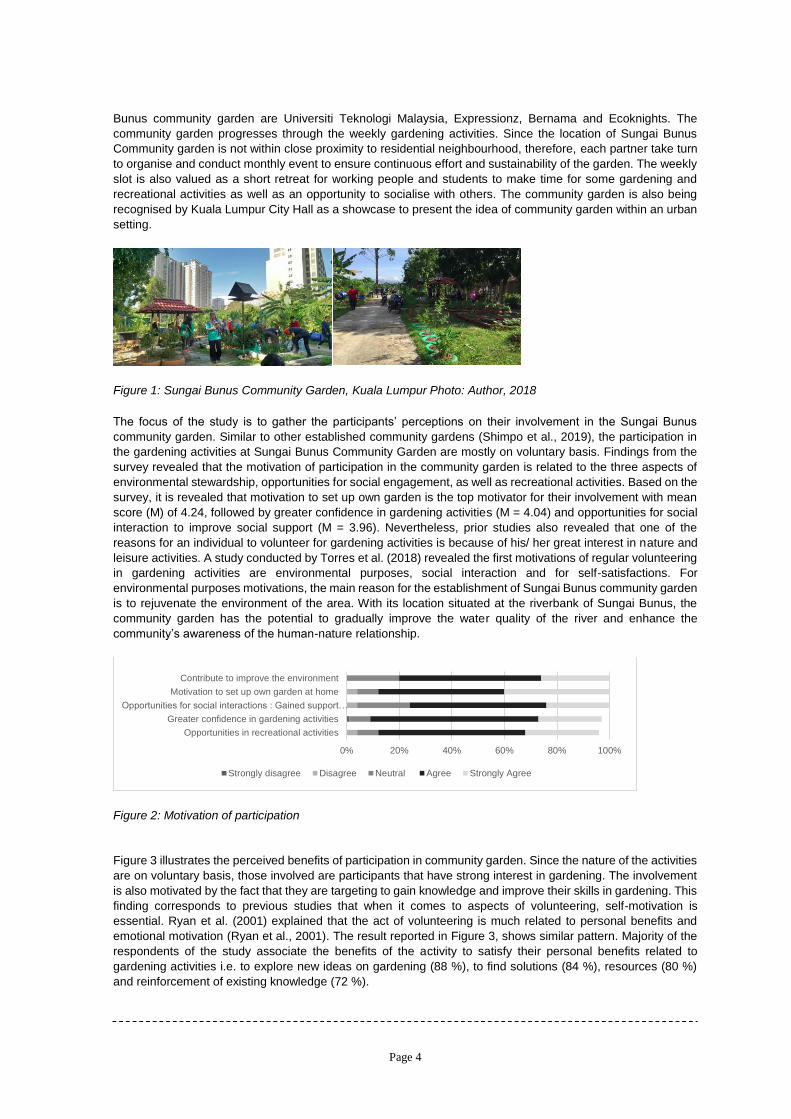
Bunus community garden are Universiti Teknologi Malaysia, Expressionz, Bernama and Ecoknights. The
community garden progresses through the weekly gardening activities. Since the location of Sungai Bunus
Community garden is not within close proximity to residential neighbourhood, therefore, each partner take turn
to organise and conduct monthly event to ensure continuous effort and sustainability of the garden. The weekly
slot is also valued as a short retreat for working people and students to make time for some gardening and
recreational activities as well as an opportunity to socialise with others. The community garden is also being
recognised by Kuala Lumpur City Hall as a showcase to present the idea of community garden within an urban
setting.
Figure 1: Sungai Bunus Community Garden, Kuala Lumpur Photo: Author, 2018
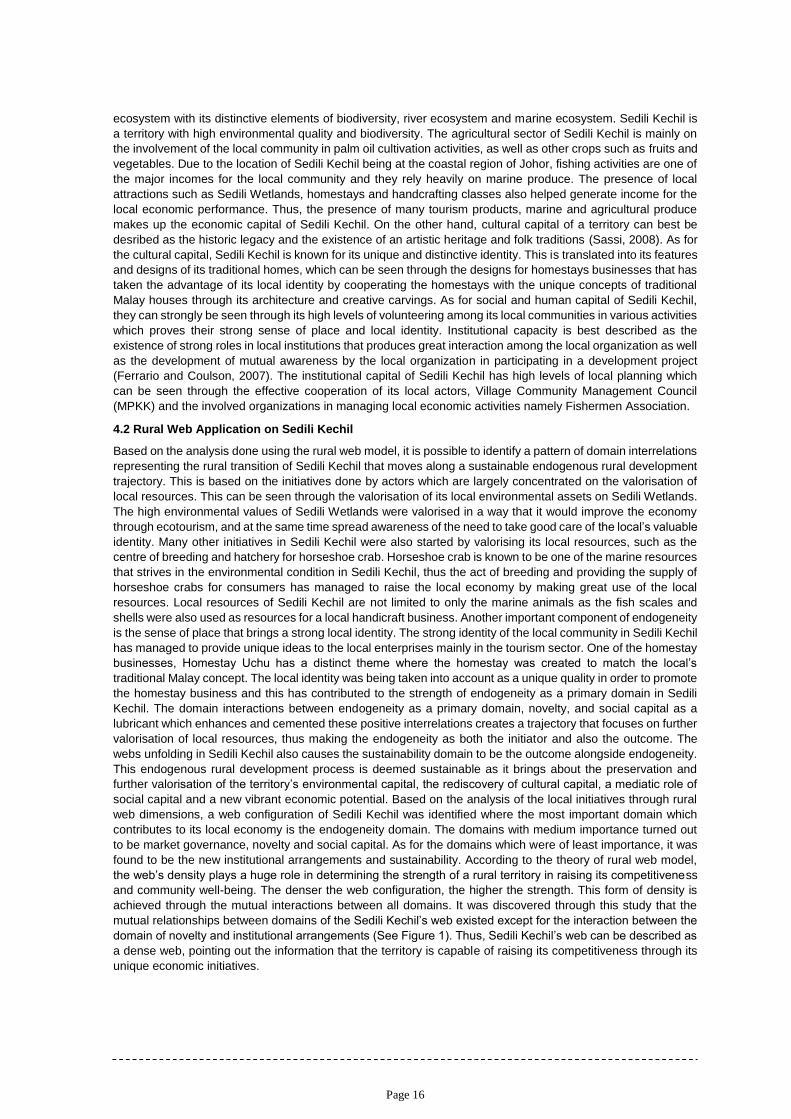
The focus of the study is to gather the participants’ perceptions on their involvement in the Sungai Bunus
community garden. Similar to other established community gardens (Shimpo et al., 2019), the participation in
the gardening activities at Sungai Bunus Community Garden are mostly on voluntary basis. Findings from the
survey revealed that the motivation of participation in the community garden is related to the three aspects of
environmental stewardship, opportunities for social engagement, as well as recreational activities. Based on the
survey, it is revealed that motivation to set up own garden is the top motivator for their involvement with mean
score (M) of 4.24, followed by greater confidence in gardening activities (M = 4.04) and opportunities for social
interaction to improve social support (M = 3.96). Nevertheless, prior studies also revealed that one of the
reasons for an individual to volunteer for gardening activities is because of his/ her great interest in nature and
leisure activities. A study conducted by Torres et al. (2018) revealed the first motivations of regular volunteering
in gardening activities are environmental purposes, social interaction and for self-satisfactions. For
environmental purposes motivations, the main reason for the establishment of Sungai Bunus community garden
is to rejuvenate the environment of the area. With its location situated at the riverbank of Sungai Bunus, the
community garden has the potential to gradually improve the water quality of the river and enhance the
community’s awareness of the human-nature relationship.
Figure 2: Motivation of participation
Figure 3 illustrates the perceived benefits of participation in community garden. Since the nature of the activities
are on voluntary basis, those involved are participants that have strong interest in gardening. The involvement
is also motivated by the fact that they are targeting to gain knowledge and improve their skills in gardening. This
finding corresponds to previous studies that when it comes to aspects of volunteering, self-motivation is
essential. Ryan et al. (2001) explained that the act of volunteering is much related to personal benefits and
emotional motivation (Ryan et al., 2001). The result reported in Figure 3, shows similar pattern. Majority of the
respondents of the study associate the benefits of the activity to satisfy their personal benefits related to
gardening activities i.e. to explore new ideas on gardening (88 %), to find solutions (84 %), resources (80 %)
and reinforcement of existing knowledge (72 %).
0% 20% 40% 60% 80% 100%
Opportunities in recreational activities
Greater confidence in gardening activities
Opportunities for social interactions : Gained support…
Motivation to set up own garden at home
Contribute to improve the environment
Strongly disagree Disagree Neutral Agree Strongly Agree

Page 5
Figure 3: Benefits of participation in Community Garden
During the interview sessions, most of the interviewees indicated that they improved their knowledge and skills
in gardening after few gardening sessions with Sungai Bunus Community Garden. More than 70% of the
participants have reported that it gave them positive impact on various aspects of gardening. Their knowledge
on types of plants, planting method, composting process and the use of organic fertilizer have improved. With
reference to Table 1, on the scale from 1 to 4, improved on knowledge of composting was reported as the best
progression (before M = 1.91, after M = 3.48). This has resulted to improved quantity and quality of harvests
that contributes to higher self-satisfaction among the participants. It has also become the motivator to attract
more volunteers to be involved in developing and supporting the community garden that translates to stronger
sense of attachment. Similar to the study conducted by Veen et al. (2015), the sense of attachment developed
towards the community garden is a positive indication of growing community development. Knowledge and skill
exchange during the gardening activities are well acknowledged by the participants.
Table 1: Impact of participation in Community Garden (Before and after)
Before After
Type of plants 1.96 3.44
Knowledge on Planting method 2.32 3.48
Knowledge of Composting 1.91 3.48
Knowledge on fertilizer (organic) 2.20 3.40
Based on the interviews with selected participants, there are some concerns raised on the issue of funding the
community garden. As the garden is on voluntary terms, financial resources are limited. Current funding is also
based on contributions by the partner organisations/ agencies and support from Kuala Lumpur City Hall, through
its Local Agenda 21 Unit. The sustainability of the community garden is still questionable as the funding is only
on short term basis. Some participants have expressed that the garden need to produce more harvest (to be
sold) in order to sustain the community garden in the long run.
5. Conclusion
This study has highlighted the factors that motivate the involvement of the community in an urban setting. Sungai
Bunus Community Garden is a unique one because of its location and nature of participation. Participants of
the community garden are among working populations with mutual interest in gardening activities that aimed at
the same cause. Based on voluntary basis, participants are committed at sustaining the garden through the
weekly gardening activities. With the support and recognition from Local Agenda 21 Unit, Kuala Lumpur City
Hall, participants felt appreciated and motivated to further progress in the development of the community garden.
The most obvious finding emerged from this study is that participation in the community garden brings a lot of
benefit to the personal and social well-being as well as environmental preservation. Findings of the study
indicate that such community garden needs to be further advocated. Indirectly, the community garden has
successfully unified the urban community within the vicinity, inculcate healthy lifestyle through gardening,
contribute to carbon reduction in Kuala Lumpur and support the Sustainable Development Goals. Also, there is
a need to research the effectiveness of community gardens as a means to promote environmental changes,
social, health, and economic benefits. However, the information presented in this study is only limited to the
community garden of Sungai Bunus. Findings may vary if applied in a different category of community garden
i.e. community garden within residential neighbourhood where the participants would be the local residents
within the neighbourhood.
84% 80% 88%72%
0%
50%
100%
Answers to my questions Resources I can use Ideas I can try Reinforcement of existingknowledge
Yes No

Page 6
Acknowledgment
The authors would like to express gratitude to Local Agenda 21, Kuala Lumpur City Hall for the opportunity to
become one of the partners in the establishment of Sungai Bunus Community Garden. Also, thanks to all
partners that have directly and indirectly contributed to this project. The authors would also like to acknowledge
Universiti Teknologi Malaysia under the Knowledge Transfer Grant (KTP-NMG: Grant No
S.K130000.0856.4Y175) in supporting the project and the publication of this research.
References
Agustina I., Beilin R., 2012, Community gardens: Space for interactions and adaptations, Procedia - Social and
Behavioral Sciences, 36, 439-448.
Beilin R., Hunter A., 2011, Co-constructing the sustainable city: How indicators help us “grow” more than just
food in community gardens, Local Environment, 16(6), 523-538.
Corrigan M.P., 2011, Growing what you eat: Developing community gardens in Baltimore, Maryland, Applied
Geography, 31(4), 1232-1241.
Draper C., Freedman D., 2010, Review and analysis of the benefits, purposes, and motivations associated with
community gardening in the United States, Journal of Community Practice, 18(4), 458-492.
Egli V., Oliver M., Tautolo E.S., 2016, The development of a model of community garden benefits to wellbeing,
Prev Med Rep, 3, 348-352.
Ferris J., Norman C., Sempik J., 2001, People, land and sustainability: Community gardens and the social
dimension of sustainable development, Social Policy & Administration, 35(5), 559-568.
Ghose R., Pettygrove M., 2014, Actors and networks in urban community garden development, Geoforum, 53,
93-103.
He B., Zhu J., 2018, Constructing community gardens? Residents’ attitude and behaviour towards edible
landscapes in emerging urban communities of China, Urban Forestry & Urban Greening, 34, 54-165.
McVey D., Nash R., 2018, The motivations and experiences of community garden participants in Edinburgh
Scotland, Regional Studies, Regional Science, 5(1), 40-56.
Middle I., Dzidic P., Buckley A., Bennett D., Tye M., Jones R., 2014, Integrating community gardens into public
parks: An innovative approach for providing ecosystem services in urban areas, Urban Forestry & Urban
Greening, 13(4), 638-645.
Nursey-Bray M., Parnell E., Ankeny R.A., Bray H., Rudd D., 2014, Community gardens as pathways to
community resilience? Reflections on a pilot study in Adelaide, South Australia, South Australian
Geographical Journal, 113,13-28.
Okvat H.A., Zautra A.J., 2011, Community gardening: A parsimonious path to individual, community, and
environmental resilience, American Journal of Community Psychology, 47(3-4), 374-387.
Petrovic N., Simpson T., Orlove B., Dowd-Uribe B., 2019, Environmental and social dimensions of community
gardens in East Harlem, Landscape and Urban Planning, 183, 36-49.
Rezai G., Shamsudin M.N., Mohamed Z., 2016, Urban Agriculture: A way forward to food and nutrition security
in Malaysia, Procedia - Social and Behavioral Sciences, 216, 39-45.
Ryan R.L., Kaplan R., Grese R.E., 2001, Predicting volunteer commitment in environmental stewardship
programmes, Journal of Environmental Planning and Management, 44(5), 629-648.
Shimpo N., Wesener A., McWilliam W., 2019, How community gardens may contribute to community resilience
following an earthquake, Urban Forestry & Urban Greening, 38, 124-132.
Torres A., Prévot A., Nadot S., 2018, Small but powerful: The importance of French community gardens for
residents, Landscape and Urban Planning, 180, 5-14.
Trendov N.M., 2018, Comparative study on the motivations that drive urban community gardens in Central
Eastern Europe, Annals of Agrarian Science, 16(1), 85-89.
Veen E.J., Bock B.B., Van den Berg W., Visser A.J., Wiskerke J.S.C., 2015, Community gardening and social
cohesion: Different design, different motivations, The International Journal of Justice and Sustainability,
21(10), 1271-1287.

Page 7
Proceedings of
The 5th International Conference on Low Carbon Asia & Beyond - ICLCA 2019 &
The 4th International Conference on Chemical Engineering, Food and
Biotechnology - ICCFB 2019
Vietnam, Malaysia
ISBN: 978-604-67-1372-2
Effects of Technological Parameters of Enzyme Treatment on
The Protein Extraction Yield from Defatted Peanut Meal
Hien T. Nguyen*, Man V.V. Le
Department of Food Technology, Ho Chi Minh City University of Technology, Vietnam National University – Ho Chi Minh
City (VNU-HCM), Vietnam 268 Ly Thuong Kiet, Ho Chi Minh City, Vietnam.
In the process of producing protein concentrate and protein isolate from plants, protein extraction is a decisive
process affecting the product recovery performance. In this study, defatted peanut meal was used as raw
material for protein extraction. Viscozyme L with cellulase activity was used to treat defatted peanut meal to
support the protein extraction process. Effects of enzyme concentration, treatment time, initial pH of peanut
mixture and water and enzyme-treatment temperature on protein extraction efficiency were examined. The
results showed that the enzyme treatment process improved the extraction yield of peanut protein. With
cellulase concentration of 30 U/g, 120 min treatment time, initial suspension pH of 4.5 and enzyme-treatment
temperature of 45 °C, protein extraction yield reached 74.3 %; this value increased by 17.2 % compared to the
control sample without enzyme treatment. In addition, the use of enzyme did not alter the protein composition
of extract compared to the control sample.
1. Introduction
Peanut is an important oil plant in Vietnam and many other countries in the world. Defatted peanut meal, a by-
product of edible peanut oil production, is a cheap and rich source of protein. In Vietnam, defatted peanut meal
is usually used to produce animal feed or soy sauce. The protein content of defatted peanut meal is around 47
– 55 %, and peanut protein contains various essential amino acids (USDA-NAL., 2005). In developed countries,
defatted peanut meal is used to product protein concentrate and protein isolate. Peanut protein extraction
product is a good source of protein both for human consumption and for food industry as potential technical
substances (Yu et al., 2007).
In the production of protein concentrate and isolate, extraction is a critical process due to its great impact on the
product yield and quality. Protein is located inside the plant cells and protected by cell walls. Therefore, the
destruction of cell walls will increase the protein extraction yield. Alkali is often used as the conventional solvent
in peanut protein extraction. The chemical composition of cell walls is 90 % polysaccharide, of which cellulose
is the main component (de Vries and Visser, 2001). Therefore, the usage of enzyme product for cell wall
hydrolysis will considerably improve the protein extraction yield (Rosenthal et al., 2001). However, there are
only a few published researches about using cellulase to assist protein extraction process.
In this study, cellulase was used to assist the protein extraction process from defatted peanut meal. The
objective of this study was to investigate the effect of technological parameter of enzyme treatment, such as
cellulase concentration, time, pH and temperature on extraction yield.
2. Material and Methods
2.1 Defatted peanut meal
Peanut variety of Arachis hypogaea VD1 was used in the present work. The peanut was provided by the
Research Institute for Oil and Oil Plants (Ho Chi Minh City, Vietnam).
Defatted peanut meal processing: the peanut was soaked in 0.5 % NaOH solution for 5 min to remove the silk
sheath, followed by drying at 55 °C to a moisture content of 7 %, then pulverised and passed through a 355 μm
sieve. The peanut meal was defatted by the Soxhlet method (AOAC 960.39, 2000), and the total lipid content

Page 8
in the meal was less than 2 %. Finally, the obtained product was crushed and then passed through a 355 μm
sieve. The defatted peanut meal was kept at 4 °C for use in all experiments. The defatted peanut meal contains
9 % moisture, 36 % crude protein and 2 % crude lipid.
2.2 Cellulase
Viscoenzyme L preparation (liquid) is a mixture of cellulase and hemicellulase, provided by Novoenzymes
(Denmark). This product is produced from Aspergillus aculeatus mold.
Viscoenzyme L has the optimum pH of 4.0 to 6.5, and optimum temperature of 40 °C to 55 °C. The enzyme
activity is 102 ± 0.5 U/mL, in which 1 U is the amount of enzyme necessary to hydrolyse carboxymethyl cellulose
into glucose with the reaction speed of 1 µmol glucose/min).
2.3 Experiment design
Based on the results of the study about protein extraction from plants with enzyme treatment (Rosset et al.,
2014), the protein extraction from defatted peanut meal was proceeded as followed: Mixed the peanut meal with
distilled water in 250 mL beaker with material/solvent ratio of 1/20 (w/v), then used HCl 2 N solution to adjust
pH of the mixture to the chosen values. The amount of defatted peanut meal in each beaker was 5 g per 100
mL distilled water. Next, the mixture was heated in a thermostatic tank to the suitable temperatures and the
enzyme was added with the chosen amount. The enzyme treatment was performed following the procedure in
Table 1. When the enzyme treatment ended, the pH was adjusted to 9.0 with NaOH 2N. Finally, the mixture
was centrifuged at 3000 rpm in 20 minutes to collect the supernatant, which was crude protein extract. The
control samples were proceeded similarly to experiment samples but without adding enzyme.
Table 1: Experiment design for investigating the effect of technological parameters in enzyme treatment to
protein extraction yield from defatted peanut meal
Changing variables Fixed variables
1 Enzyme concentration: 0; 10; 20; 30; 40 (U/g material dry weight)
pH: 4.5
Temperatures: 45 °C
Processing time: 60 min
2 Enzyme treatment time: 0; 30; 60; 90; 120; 150 (minutes)
Enzyme concentration: from results of experiment 1
pH: 4.5
Temperatures: 45 °C
3 pH of suspension samples: 4.0; 4.5; 5.0; 5.5; 6.0.
Enzyme concentration: from results of experiment 1
Enzyme treatment time: from results of experiment 2
Temperatures: 45 °C
4 Enzyme treatment temperatures: 40; 45; 50; 55; 60 (°C)
Enzyme concentration: from results of experiment 1
Enzyme treatment time: from results of experiment 2
pH of suspension samples: from results of experiment 3
2.4 Analytical, calculation and data analysis methods
Crude protein content was determined by Kjeldahl method (AOAC 984.13, 2000), the total nitrogen content is
multiplied with 5.47 to calculate the crude protein content.
The particle size distribution of the material particles at the end of the protein extraction was determined by laser
scattering method on the Horiba device, model LA 920 (Japan) according to the procedure proposed by Hong
et al. (2002).
The protein profile in the extract was analysed by electrophoresis on sodium dodecyl sulphate polyacrylamide
gel (SDS-PAGE) according to the procedure in Laemmli (1970).
Protein yield was calculated by the following Eq (1):
𝐻 =𝐶𝑝𝑉
𝑚𝑝100% (1)
where Cp = protein concentration in the extract (g/L); V = extract volume (L); mp = protein content in the defatted
peanut meal (g) used in the protein extraction.

Page 9
Each experiment was carried out in triplicate, and the results were presented as mean ± standard deviations.
One-way analysis of variance was performed with the Statgraphics plus software (version 3.2). The
experimental results were compared by Multiple range tests with p = 0.05
3. Results and Discussion
3.1 Effect of enzyme concentration on protein extraction yield
Results from Figure 1a showed that control samples without enzyme addition had the lowest protein extraction
yield (57.7 ± 0.4 %). When the enzyme concentration increased from 0 to 30 U/g, the yield also increased 17
%. However, there was no statistically significant difference in extraction yield when the enzyme concentration
increased from 30 to 40 U/g. As explained in the introduction section, protein is located inside the plant cells.
Moreover, protein is often connected with other molecular like polysaccharide (de Vries and Visser, 2001). The
cellulase in Viscoenzyme preparation hydrolysed the cellulose that constructed the plant cell walls, and as a
result increased the protein extraction yield. The cellulase and hemicellulase also hydrolysed the connection
between protein and cellulose or hemicellulose, which helped releasing the protein molecular and making the
protein more soluble. Jung et al. (2006) used IndiAge Super L preparation which had cellulase activity and pH
7.0 to extract soybean protein. With the amount of enzyme preparation 5 % compared to material, the protein
extracted increase 9.2 % compared to control samples. However, Rosenthal et al. (2001) found that enzyme
treatment of soybean meal with different enzymes (cellulase, hemicellulase and pectinase) reduced the protein
extraction yield compared to control samples. This was caused by the pH, which was adjusted at 4 - 5 for both
enzyme treatment and protein extraction; this pH range was optimal for enzyme activity but could increase
protein denaturation. In our study, the enzyme treatment was done at pH 4.5 but the pH of the suspension
peanut meal was adjusted to 9.0 when extracting protein. This pH adjustment between acidic pH for enzyme
treatment and alkalic pH for protein extraction was necessary when using enzyme preparation with acidic pH to
assist the peanut protein extraction.
Figure 1: (a) Effect of cellulase concentration on protein extraction yield; (b) Effect of enzyme treatment time on
peanut protein extraction yield
From the results of this experiment, the enzyme concentration of 30 U/g was chosen to investigate the effects of other technological parameters of subsequent experiments.
3.2 Effect of enzyme treatment time on protein extraction yield
The results from Figure 1b showed that protein extraction yield was peaked at 74.3 ± 0.9 % when enzyme
treatment time reached 120 minutes. If enzyme treatment time increased further from 120 minutes to 150
minutes, the corresponding protein extraction yield had no statistically significant difference (p > 0.05). As a
result, 120 minutes was the suitable time for enzyme treatment of peanut meal with Viscoenzyme L preparation.
Guan and Yao (2008) also used Viscoenzyme L preparation to assist protein extraction of defatted rice bran
and found that suitable treatment time is 60 minutes. The enzyme treatment time is different between materials
because of the amount and distinct structure of cellulose in each material.
3.3 Effect of pH on protein extraction yield
From the results shown in Figure 2a, the protein extraction yield reached maximum value at 74.3 ± 0.9 % at pH
4.5. When the pH increased or decreased from 4.5, the protein extraction yields always reduced. These results
were in accordance with the theory of enzyme catalytic activity. Every enzyme has an optimal pH for a particular
substrate; at any non-optimal pH, the catalytic activity of the enzyme is reduced.
57.7
63.066.1
67.6 67.9
50
55
60
65
70
75
80
0 10 20 30 40
Extr
acti
on y
ield
(%
)
Enzyme concentration (U/g)
50.0
60.5
67.6
71.774.3 75.3
50
55
60
65
70
75
80
0 30 60 90 120 150
Extr
acti
on y
ield
(%
)
Enzyme treatment time (min)
a b

Page 10
The results from our study was similar with the conclusion from another study that also used Viscoenzyme L to
assist protein extraction from defatted soybean meal; the extraction yield was peaked at pH 4.6 (Rosset et al.,
2014). The pH value of 4.5 was chosen to investigate the effect of other technological parameter in remain
experiments.
(a) (b)
Figure 2: (a) Effect of pH on peanut protein extraction yield; (b) Effect of temperature on protein extraction yield
3.4 Effect of temperatures on protein extraction yield
The results from Figure 2b shows that the protein extraction yield was peaked at 74.3 ± 0.8 % when temperature
was 45 °C. At other temperatures apart from 45 °C, the extraction yields always reduced. This could be
explained that the Viscoenzyme L preparation hydrolysed cellulose more efficiently at the optimally catalytic
temperature (45 °C), and thus improved the protein release from plant cells into solvent. Moreover, Yu et al.
(2007) concluded that enzyme treatment at high temperatures could denature protein and reduce the solubility
of protein in solvent.
In conclusion, the temperature suitable for enzyme treatment of defatted peanut suspension with Viscozyme L
preparation to assist protein extraction was 45 °C.
The solid phase at the end of the protein extraction process was photographed with electronic microscope
(Figure 3). Both the samples with enzyme treatment and the control samples without enzyme treatment had
starch granules on the surface. The granules in the samples without enzyme treatment (Figure 3a) had intact
structure, the cells were only damaged lightly. On the opposite, in the samples with enzyme treatment (Figure
3b), the cells were not intact, and the cell walls were destroyed.
Figure 3: Photos of material particles surface at the end of protein extraction with electronic microscope: (a)
Samples without enzyme treatment; (b) Samples with enzyme treatment
Figure 4 presents the particle size distribution at the end of the protein extraction process. The samples with
enzyme treatment had the largest particle segment of approximately 700 µm; while the samples without enzyme
treatment had the largest particle segment of 900 µm. The mean size of sample with and without enzyme
treatment was 104 µm and 137 µm respectively. These results showed that enzyme treatment effectively
reduced particle size and thus increased the contact surface between particles and solvent, which resulted in
63.5
74.3
56.6 55.1
50.6
50
55
60
65
70
75
80
4 4.5 5 5.5 6
Extr
acti
on y
ield
(%
)
pH
60.6
74.3
70.6
61.158.7
50
55
60
65
70
75
80
40 45 50 55 60
Extr
acti
on y
ield
(%
)
Temperature (oC)
a b

Page 11
increase in protein extraction yield. In our knowledge, there are not many published studies about the particle
size reduction when using enzyme preparation to assist protein extraction from plant cells.
Figure 4: Particle size distribution of material at the end of protein extraction: () Samples without enzyme
treatment; () Samples with enzyme treatment
The protein profile of the protein extract was presented in Figure 5. The protein segment of samples with and
without enzyme treatment were similar. Peanut variety VD1 in this study had protein segments with molecular
weight ranges from 10 to 70 KDa. Shefcheck et al. (2006) also reported similar results with peanut variety
Arachis hypogaea (Shefcheck et al., 2006). However, some previous studies discovered protein with molecular
weight higher than 70 KDa on other peanut varieties but their physicochemical properties still not published
(Javaid et al., 2004). Almost all the peanut protein with molecular weight higher than 70 KDa is hetero-multimeric
proteins (Shefcheck et al., 2006).
Figure 5: Electrophoresis on polyacrylamide gel of peanut protein extract
0
1
2
3
4
5
6
0 200 400 600 800 1000
Rat
io (
%)
Size (µm)

Page 12
4. Conclusion
Treatment of defatted peanut meal with cellulase enzyme had considerably increased the protein extraction
yield but had not changed the protein profile of protein extract compared to conventional protein extraction
methods. The usage of cellulase preparation was an effective method to improve the protein extraction yield
from defatted peanut meal.
References
de Vries R.P., Visser J., 2001, Aspergillus enzymes involved in degradation of plant cell wall polysaccharides,
Microbiology and Molecular Biology Reviews, 65, 497-522.
Guan X., Yao H., 2008, Optimization of Viscozyme L-assisted extraction of oat bran protein using response
surface methodology, Food Chemistry, 106, 345-351.
Hong K., Nakayama K., Park S.Y., 2002, Effects of protective colloids on the preparation of poly(lactide)/poly
(butylene succinate) microcapsules, European Polymer Journal, 38, 305-311.
Jung S., Lamsal B.P., Stepien V., Johnson L.A., Murphy P.A., 2006, Functionality of soy protein produced by
enzyme-assisted extraction, Journal of the American Oil Chemists' Society, 83, 71-78.
Laemmli U.K., 1970, Cleavage of structural proteins during the assembly of the head of Bacteriophage T4,
Nature, 227, 680-685.
Rosenthal A., Pyle D.L., Niranjan K., Gilmour S., Trinca L., 2001, Combined effect of operational variables and
enzyme activity on aqueous enzymatic extraction of oil and protein from soybean, Enzyme and Microbial
Technology, 28, 499-509.
Rosset M.F., Acquaro V.R., Beleia A.D.P., 2014, Protein Extraction from Defatted Soybean Flour with
Viscozyme L Pretreatment, Journal of Food Processing and Preservation, 38, 784-790.
USDA-NAL., 2005, USDA Nutrient Database for Standard Reference: United States Department of Agricultural-
National Agricultural Library.
Yu J., Ahmedna M., Goktepe I., 2007, Peanut protein concentrate: Production and functional properties as
affected by processing, Food Chemistry, 103, 121-129.

Page 13
Proceedings of
The 5th International Conference on Low Carbon Asia & Beyond - ICLCA 2019 &
The 4th International Conference on Chemical Engineering, Food and
Biotechnology - ICCFB 2019
Vietnam, Malaysia
ISBN: 978-604-67-1372-2
ISBN 978-88-95608-67-9; ISSN 2283-9216
Rural Web as A Tool to Project Trajectories For Green
Economy
Nazia Khalida Sulaimana*, Mohamad Fadhli Rashida, Siti Hajar Misnana, Ibrahim
Ngaha
aDepartment of Urban and Regional Planning, Faculty of Built Environment and
Surveying, Universiti Teknologi Malaysia (UTM), 81310 Johor, Malaysia
Malaysia has set a target by looking at green growth as an important game changer in the Eleventh Malaysia
Plan and there has been initiatives and directions made in efforts of transitioning towards a green economy.
Rural development plays a strong role in achieving this target as it would involve primary production sectors of
agriculture and forestry. A shift towards green economy in rural areas is vital as it would contribute to a resilient,
low-carbon, resource-efficient, and socially inclusive environment for the rural community. Thus, there is a need
to understand the transitional process towards green economy in order to project greener development
trajectories for rural areas in Malaysia. Rural web is a tool to highlight the differing responses to the squeeze on
rural economies that would enable the stakeholders to reflect on current and future development trajectories. It
is a comprehensive theoretical framework composed by the interrelations and mutuality that exist between
actors, resources, activities, sectors and places within rural areas. This paper presents the application of the
rural web dimensions in analysing the rural dynamics and development trajectories of Kampung Sedili Kechil.
This paper also shares the potential for a green economy for Kampung Sedili Kechil. The study area was found
to be moving along a sustainable endogenous development pathway which valorises its natural resources for
economic purposes. It was also found that the initiatives done in Kampung Sedili Kechil were fulfilling green
characteristics.
1. Introduction
According to the Eleventh Malaysia Plan, Malaysia has set a target and an intention to shift from the conventional
ways to greener trajectories by looking at green economy as an important element in ensuring sustainability of
the nation’s natural resources, minimising pollution, and strengthening the security of energy, food and water
supply (Ministry of Economic Affairs Malaysia, 2018). Many countries all over the world have started embarking
on green economy and green growth plans and strategies. This global green initiative resulted from the need to
focus on the link between the economy and environment as issues of poverty, environmental degradation,
inequality and climate change became a significant global concern. New consensus on sustainable development
were then brought by global leaders through the signing of Sustainable Development Goals (SDGs) and Paris
Agreement specifically to address these concerns and consequently, green economy emerges as an economic
planning that would best reflect its transformational visions (Green Economy Coalition, 2012). In order to pursue
the national target of green growth, rural development can be seen as an important area of importance. Rural
development is a process of social, economic, environmental and cultural transformation that targets the well-
being of the people living in the rural areas (Ministry of Rural Development Malaysia, 2019).
2. Research background
Green economy can be defined as “An economy that results in improved human well-being and reduced
inequalities over the long term, while not exposing future generations to significant environmental risks and
ecological scarcities” (UNEP, 2015). Basically, green economy is an economy that encourages economic
opportunities which are not in any way could interrupt the sustainability of the environment and social well-being

Page 14
apart from also providing new-forms of socio-economic opportunities that promotes environmental objectives
(ENRD, 2017a). The sustainability of any region is highly dependent on its policies and performance of any
country could only be improved by its key strategies (Fan et al., 2019). Thus, the greening of any economy starts
with making green initiatives for the region.
2.1 Transitioning to a green rural economy
The transition to green rural economy is about improving people’s lives and livelihoods in rural areas, balancing
natural resource use with maintaining incomes, and trading the risks of making a change with the opportunities
that change will bring. There are many practical examples of activities and initiatives which embrace the
principles of the green economy in rural areas. Taking an example from Sweden, ‘Suderbyn Permaculture
Ecovillage’ is an initiative that serves as a model for rethinking rural development in terms of living in an
environmentally friendly manner, patterns of consumption, ethical financing for developments and interactions
with wider society. The decisions for the project was taken on the basis of a communal consensus approach in
order to ensure participatory governance. Entrepreneurial activities of the ecovillage also have a focus on social
entrepreneurship and green businesses, instead of financial profit. The initiative has managed to plant
Sweden’s largest permaculture forest food garden which is a space-efficient perennial garden of edible plants
in order to provide the locals with food, avoid waste and ensuring food is purchased in bulk from local farmers
and wholesalers (ENRD, 2017b). Among many others, the goals necessary for rural areas to move to a green
economy is through the transition towards a low-carbon economy and increasing practices of sustainable
farming and forestry. Promoting the right initiatives for rural areas can be about strengthening existing good
practice or more fundamental changes to the way the rural economies operate thus it is important to take note
on the key features and characteristics that would best support the transition to a green economy (see Table 1).
Table 1: Initiatives that supports transition to green rural economy (ENRD, 2017a)
Key Features Characteristics
Respond to demand Demand-driven, responds to gaps in the market, social concerns or economic
opportunities
Target environmental
objectives
Clear, tangible and economically sustainable environmental objectives
Balance economic and
social objectives
Takes systematic approach, including the economic and social benefits that can
be achieved
Innovate Involves new products, new services, new technologies, new business models
and/or smart adaptations or combinations of old ones
Involve multiple actors Engages and motivates key people from all relevant spheres (public, private and
community) from production to consumption
Lever in public and private
support
Explores a variety of funding sources and seek to avoid dependency on grants
Evolve Projects grow, evolve and adapt to changing environments and their own
successes and failures
Enable future learning Environmental, economic and social objectives are clearly specified and
monitored, enabling results-based learning for the future
Communicate results Communicates their successes and achievements, to encourage others
Change mindsets Demonstrates that there need not be any conflict between economic,
environmental and social objectives.
2.2 Rural Web
Instead of being a result of direct policy interventions, processes of rural development are being shaped by the
creative patterns called the rural web. Rural web is a tool to study the different responses that has arisen through
the squeeze of economy in rural areas. The role of rural web is to enhance and mobilise different territorial
capitals towards a sustainable rural development. The rural web can be used as an explanatory scheme, a
concept and also a tool for exploring, analysing and interpreting the dynamics that defines rural territories,
supporting the idea that every territory has its own dynamics (Milone & Ventura, 2010). As the rural web tool
highlights the different responses to the squeeze of economy in rural areas, it suggests that every region is
responding differently through its own intertwined institutions of society and economy (Paddock & Marsden,
2015). Defined as a collection of individuals, resources, activities and processes that interacts with each other
within a territory, the rural web consists of six theoretical dimensions that seeks to improve the quality of life in
rural areas (See Table 2). The interrelationships between these six dimensions will create synergies when they

Page 15
reinforce each other mutually (Pakeltienė, 2015). Through rural web analysis, the acknowledging of interplay
between all six dimensions will help to generate knowledge on how to achieve a set of strategies for a greener
rural development. Therefore, any positive interrelations between the six dimensions would indicate a greater
coherence with the logic of a green economy while the absence of interrelation points out the missing links that
hinders the transition towards a greener rural economy.
Table 2: Dimensions of sustainable development, rural web and its characteristics
Dimensions of
Sustainable
Development
Dimensions of Rural
Web
Characteristics of Rural Web Dimension
Economic Endogeneity The degree to which rural economies are:
i. built upon local resources
ii. organised according to local models of resource combination
iii. strengthened through the distribution and reinvestment of
produced wealth within the local/regional constellation
Novelty New insights, practices, artefacts and/or combinations (of resources,
technological procedures, bodies of knowledge, etc.) that carry the
promise that specific constellations function better.
Market Governance Institutional capacities to control and strengthen existing markets
and/or to construct new ones
Social Social Capital The norms and networks that enable people to act collectively or, more
specifically, the ability of individuals, groups, organisations or
institutions to engage in networks, cooperate and employ social
relations for common purpose and benefit
New Institutional
Arrangements
New institutional constellations that solve coordination problems and
support cooperation among rural actors
Environmental Sustainability The existence of the social and ecological conditions necessary to
support human life at a certain level of wellbeing through future
generations
3. Methodology
The collection of primary data for case study region was done through a questionnaire based survey and in
depth interviews towards 90 respondents of Kampung Sedili Kechil which consists of the local villagers, head
of the village, and local business owners. The data collection was done to draw the respondent’s demographic
profile, structural characteristics and key elements of the study area in order to identify the rural web and its
dynamics. Open coding were used for the gathered data and SWOT analysis was conducted taking into account
of seven territorial capitals The territorial capitals of the study area were analysed with the purpose of finding
out the evolutional dynamics triggered by the local initiatives in the territory The description of the territorial
capitals and its evolution would reflect the formation of the rural web in ways that it emerges, thus producing
effects that would provide a progressive structuring of the territory’s web. The findings were found through
qualitative analysis in order to use subjective judgements for an exploratory research mainly through in depth
interviews, due to the unquantifiable information collected. The case study area is a village called Sedili Kechil,
located in Tanjung Sedili which is a coastal region in Kota Tinggi District, Johor. Located by the bank of the
Sedili Kechil river, Sedili Kechil is about 40 km from the city. Despite being located at a coastline, the economic
activities of the local population are diverse. Sources of income for local population in Sedili Kechil ranges from
fishing and small enterprises to cultivation of palm oil and development of tourism products.
4. Findings
4.1 Territorial Capitals of Sedili Kechil
According to the Bryden’s theory, the rural regions have an economic development that depends on the way a
mixture of its immobile resources which are tangible and less tangible interact with each other locally (Terluin,
2003). These resources are also conceptualized as territorial capitals, consisting of environmental, economic,
human, cultural, social, institutional and symbolic capitals (Milone & Ventura, 2010). The environmental capital
is local assets that are purely natural without the creation of human action, also consisting of the resulting
product of the interaction between nature and man (Giaime, 2011). The environmental capital of Sedili Kechil is
the beauty of its natural scenery, the location of the village, which is situated along the coast, its mangrove forest
Page 16
ecosystem with its distinctive elements of biodiversity, river ecosystem and marine ecosystem. Sedili Kechil is
a territory with high environmental quality and biodiversity. The agricultural sector of Sedili Kechil is mainly on
the involvement of the local community in palm oil cultivation activities, as well as other crops such as fruits and
vegetables. Due to the location of Sedili Kechil being at the coastal region of Johor, fishing activities are one of
the major incomes for the local community and they rely heavily on marine produce. The presence of local
attractions such as Sedili Wetlands, homestays and handcrafting classes also helped generate income for the
local economic performance. Thus, the presence of many tourism products, marine and agricultural produce
makes up the economic capital of Sedili Kechil. On the other hand, cultural capital of a territory can best be
desribed as the historic legacy and the existence of an artistic heritage and folk traditions (Sassi, 2008). As for
the cultural capital, Sedili Kechil is known for its unique and distinctive identity. This is translated into its features
and designs of its traditional homes, which can be seen through the designs for homestays businesses that has
taken the advantage of its local identity by cooperating the homestays with the unique concepts of traditional
Malay houses through its architecture and creative carvings. As for social and human capital of Sedili Kechil,
they can strongly be seen through its high levels of volunteering among its local communities in various activities
which proves their strong sense of place and local identity. Institutional capacity is best described as the
existence of strong roles in local institutions that produces great interaction among the local organization as well
as the development of mutual awareness by the local organization in participating in a development project
(Ferrario and Coulson, 2007). The institutional capital of Sedili Kechil has high levels of local planning which
can be seen through the effective cooperation of its local actors, Village Community Management Council
(MPKK) and the involved organizations in managing local economic activities namely Fishermen Association.
4.2 Rural Web Application on Sedili Kechil
Based on the analysis done using the rural web model, it is possible to identify a pattern of domain interrelations
representing the rural transition of Sedili Kechil that moves along a sustainable endogenous rural development
trajectory. This is based on the initiatives done by actors which are largely concentrated on the valorisation of
local resources. This can be seen through the valorisation of its local environmental assets on Sedili Wetlands.
The high environmental values of Sedili Wetlands were valorised in a way that it would improve the economy
through ecotourism, and at the same time spread awareness of the need to take good care of the local’s valuable
identity. Many other initiatives in Sedili Kechil were also started by valorising its local resources, such as the
centre of breeding and hatchery for horseshoe crab. Horseshoe crab is known to be one of the marine resources
that strives in the environmental condition in Sedili Kechil, thus the act of breeding and providing the supply of
horseshoe crabs for consumers has managed to raise the local economy by making great use of the local
resources. Local resources of Sedili Kechil are not limited to only the marine animals as the fish scales and
shells were also used as resources for a local handicraft business. Another important component of endogeneity
is the sense of place that brings a strong local identity. The strong identity of the local community in Sedili Kechil
has managed to provide unique ideas to the local enterprises mainly in the tourism sector. One of the homestay
businesses, Homestay Uchu has a distinct theme where the homestay was created to match the local’s
traditional Malay concept. The local identity was being taken into account as a unique quality in order to promote
the homestay business and this has contributed to the strength of endogeneity as a primary domain in Sedili
Kechil. The domain interactions between endogeneity as a primary domain, novelty, and social capital as a
lubricant which enhances and cemented these positive interrelations creates a trajectory that focuses on further
valorisation of local resources, thus making the endogeneity as both the initiator and also the outcome. The
webs unfolding in Sedili Kechil also causes the sustainability domain to be the outcome alongside endogeneity.
This endogenous rural development process is deemed sustainable as it brings about the preservation and
further valorisation of the territory’s environmental capital, the rediscovery of cultural capital, a mediatic role of
social capital and a new vibrant economic potential. Based on the analysis of the local initiatives through rural
web dimensions, a web configuration of Sedili Kechil was identified where the most important domain which
contributes to its local economy is the endogeneity domain. The domains with medium importance turned out
to be market governance, novelty and social capital. As for the domains which were of least importance, it was
found to be the new institutional arrangements and sustainability. According to the theory of rural web model,
the web’s density plays a huge role in determining the strength of a rural territory in raising its competitiveness
and community well-being. The denser the web configuration, the higher the strength. This form of density is
achieved through the mutual interactions between all domains. It was discovered through this study that the
mutual relationships between domains of the Sedili Kechil’s web existed except for the interaction between the
domain of novelty and institutional arrangements (See Figure 1). Thus, Sedili Kechil’s web can be described as
a dense web, pointing out the information that the territory is capable of raising its competitiveness through its
unique economic initiatives.

Page 17
Figure 1: Sedili Kechil’s rural web configuration
4.3 Potential of Green Economy in Sedili Kechil
The initiatives done in Sedili Kechil towards raising its competitiveness reflects the characteristics of how green
initiatives would appear, thus raising the potential of a green economy in the territory. This was achieved in
Sedili Kechil through its responds to gaps in the market, social concerns and economic opportunities. The
sustainable use of environmental capital such as ecotourism in Sedili Kechil also targets environmental
objectives, besides also balancing its economic and social objectives for the village through creation of income
and motivating the collective efforts of its community. Multiple actors were also involved in the economic
activities in Sedili Kechil where an example of this would be the Sedili Wetlands which was initiated by the
state’s regional development agency and enriched by the local community. The achievement of Sedili Kechil’s
initiatives in relation to the characteristics of a green rural initiatives is scored with positive (+), negative (-) and
not related (0) as a means to assess its green potential. The initiatives in Sedili Kecil were found to be mostly
positive towards fulfilling a green characteristic. However, the locally owned palm oil weighing and collection
centre did not fulfil green characteristics and was assessed as negative since it failed to target environmental
objectives and it did not change mind sets (See Table 3). Such initiative did not encourage the locals to address
the environmental impacts caused by the planting of palm oil trees in the village. It was found that the ease of
access to a weighing and collection centre possesses higher effect towards environmental degradation
compared to the economic value it initially plans to contribute.
Table 3: Matrix of initiatives strengthening Sedili Kechil’s web and green characteristics
Key Characteristics of
a Green Rural Initiative
Sedili Kechil’s initiatives
Sedili
Wetlands
Centre of Breeding
and Hatchery for
Horseshoe Crab
Locally Owned
Palm Oil Weighing
and Collection
Centre
Malay
Traditional
Concept
Homestay
Marine
Handicraft
Workshops
Respond to demand + + + + +
Target environmental
objectives
+ + _ 0 +
Balance economic and
social objectives
+ + + + +
Innovate + + 0 + +
Involve multiple actors + + + 0 +
Lever in public and
private support
+ + + + +
Evolve + + 0 + +
Enable future learning + + 0 + +
Communicate results + + 0 0 +
Change mindsets + + - + +

Page 18
5. Conclusion
It is known that the concept of rural web has been well accepted in rural planning as a comprehensive framework
that is able to synthesize the extensive body of theoretical and empirical work of rural development. In addition
to that, the rural web model also can be used in many different studies in order to better plan for the well-being
of rural community. One of its many valuable contributions to rural planning is it represents new ways of directing
the pathways for new paradigm of rural development, which coincides with the principles of a green economy.
By using the concept of rural web as a tool to move towards a green rural economy, the provision of green
economic strategies for rural areas in Malaysia could be proactively planned out and concrete recommendations
highly relevant for policy analysis can be derived.
Acknowledgments
The authors would like to acknowledge Government of Malaysia, State Economic Planning Unit of Johor, and
Universiti Teknologi Malaysia for this project - Factor for Differences in Economic Performance of Rural Areas
in Johor, Malaysia (Vot No. Q.J130000.2421.03G95).
References
ENRD, 2017a, Green economy opportunities for rural Europe, Publications Office of the European Union,
Luxembourg.
ENRD, 2017b, Transition to greener rural, Publications Office of the European Union, Luxembourg.
Fan Y.V., Lee C.T., Lim J.S., Klemes J.J., Le P.T.K., 2019, Cross-disciplinary approaches towards smart,
resilient and sustainable circular economy, Journal of Cleaner Production, 232, 1482-1491.
Ferrario C., Coulson A., 2007, “Institutional thickness”: Local governance and economic development in
Birmingham England, International Journal of Urban and Regional Research, 31, 591‐615.
Giaime B., 2011, Weaving the rural web: The dynamics of rural development in Lunigiana, Quaderni Sismondi,
12.
Green Economy Coalition, 2012, The green economy pocketbook, Green Economy Coalition, London.
Milone P., Ventura F., 2010, Networking the rural: The future of green regions in Europe, Van Gorcum, Assen,
30-48.
Ministry of Economic Affairs Malaysia, 2018, Mid-term review of the eleventh Malaysia plan 2016-2020.
Ministry of Rural Development Malaysia, 2019, Rural Development Policy 2030, Putrajaya.
Paddock J., Marsden T., 2015, Revisiting evolving webs of agri-food and rural development in the UK: The case
of Devon and Shetland, Constructing a New Framework for Rural Development, 22, 301-324.
Pakeltienė R., 2015, “Rural web” method for revealing a potential of rural development synergy, Management
theory and studies for rural business and infrastructure development, 37, 562–575.
Sassi M., 2008, Model of rural development and new challenges of territorial planning, Economics and Agri-
Food Law, 1, 55–70.
Terluin I.J., 2003, Differences in economic development in rural regions of advanced countries: An overview
and critical analysis of theories, Journal of Rural Studies, 3, 327–344.
UNEP, 2015, Uncovering pathways towards an inclusive green economy, 302.
Van der Ploeg J.D., Marsden T., 2018, Unfolding webs: The dynamic of regional rural development, Royal Van
Gorcum, Assen.
Page 19
Proceedings of
The 5th International Conference on Low Carbon Asia & Beyond - ICLCA 2019 &
The 4th International Conference on Chemical Engineering, Food and
Biotechnology - ICCFB 2019
Vietnam, Malaysia
ISBN: 978-604-67-1372-2
ISBN 978-88-95608-67-9; ISSN 2283-9216
Inactivation of A. hydrophila in sterilized striped-catfish pond
water at different phage-to-host ratios
Hoang A. Hoang*, Tran T.T. Xuan
Department of Biotechnology, Faculty of Chemical Engineering,
Ho Chi Minh City University of Technology, Vietnam National University – Ho Chi Minh City (VNU-HCM), 268 Ly Thuong Kiet
St., District 10, HCMC, Vietnam
Disease outbreaks and antibiotic resistance crisis are considered as major challenges to confront the
sustainable development of striped catfish farming in the Mekong Delta - Vietnam (MKDVN). One of the most
common disease types is hemorrhagic septicemia caused by Aeromonas hydrophila bacteria with a high fatality
rate. It recently shows an inadequate control due to antibiotics resistance of A. hydrophila in stripped catfish.
This has led to the following alarming results of output reduction, export loss, community health and environment
risk. Phage therapy is the therapeutic use of phages (that are virus infecting only bacteria) to prevent and treat
pathogenic bacterial infections. Aim of this study was to investigate effect of different phage-to-host ratios (or
multiplicity of infection – MOI) of about 0.5, 3.0, and 20.0 on inactivation of A. hydrophila in sterilized striped-
catfish pond water. It resulted in different concentrations of the host bacteria and phages.
1. Introduction
In Vietnam, fisheries is a key national economic sector that produces 4–5% of the national Gross Domestic
Product (GDP). Vietnamese fishery products are exported to more than 140 countries and territories in five
continents earning over US$7.9 billion in 2016. The Mekong Delta in Vietnam (MKDVN) has traditionally been
the major region of aquaculture produce accounting for over 52% of national aquaculture crop, and 65% of
aquaculture export. Striped catfish (Pangasianodon hypohthalmus) is the native freshwater catfish of the
MKDVN. By 2016, striped catfish is the highest item of fish-produce exports in Vietnam accounting for 23%. The
striped catfish farming covers an area of close to 6,000 hectares and harvests over 1.2 million tones. However,
many problems confront sustainable development of the striped catfish farming in the MKDVN, in which disease
outbreaks and antibiotic resistance crisis are considered as major challenges. In 2015, over 730ha (12% of the
total farming surface devoted to striped catfish) in the four provinces of An Giang, Dong Thap, Hau Giang and
Vinh Long were bacterial infected. One of the most common types is hemorrhagic septicemia (32%) caused by
Aeromonas hydrophila bacteria with a high fatality rate (Dang & Nguyen, 2010). Antibiotics are commonly used
as a measure of prevention and treatment of the bacterial infection on farms. However, it recently shows an
inadequate control due to antibiotics resistance of A. hydrophila in stripped catfish. Quach et al. (2014) has
shown that antibiotic resistance ratio of A. hydrophila isolates in ill striped catfish in the MKDVN was 100% for
certain kinds of antibiotics, i.e., ampicillin, amoxicillin, cefalexin, trimethoprim/sunfamethoxazol, was 93% for
tetracyclin and 63% for florfenicol. This has led to the following alarming results of output reduction, export loss,
community health and environment risk. Due to these adverse impacts, there is an urgent need to come up with
more effective solutions as a replacement of antibiotics in fisheries industry in the region.
Bacteriophages (or phages) are virus infecting only bacteria, hence they are non-toxic for human, animal and
plant cells. In addition, phages own a high host specificity meaning they are not harmful for useful bacteria in
environment as well as in human and animal digestion systems. Phage therapy is the therapeutic use of phages
to prevent and treat pathogenic bacterial infections. The therapy became available since 1930s, but the method
has only gained serious attention in the aqua industry in the last thirty years, especially in the face of wide
spreading of antibiotic resistances in bacteria. Phage therapy has shown its efficacy in treatment of bacterial
diseases in fish and shellfish in several cases, such as Edwardsiella tarda causing edwardsiellosis in Loach

Page 20
(Wu et al., 1981; Wu & Chao, 1982), Lactococcus spp. causing lactococcosis in Yellowtail (Nakai et al., 1999),
Aeromonas salmonicida causing Furnunculosis in brook trout, rainbow trout, Atlantic salmon (Imbeault et al.,
2006), A. hydrophila causing tail and fin rot in Loach (Wu et al., 1981; Jun et al., 2013). Phage therapy against
various kinds of fish and shellfish pathogens have been reviewed by Richards (2014). However, until now, to
the best of my knowledge, there is no research of phage therapy to Aeromonas hydrophila infection in striped
catfish.
One of the most parameters that needs to be considered in phage production and also in phage therapy is molar
ratio of phage-to-bacteria. It is also called as multiplicity of infection (or MOI). Tran et al. (2018) showed a high
activation of A. hydrophila by phage at MOI of 50. However, a lower MOI value than 1 will have some
advantages. First, it will avoid damaging host cells before replication of newly generated phages (Asami et al.,
1997). Second, it will lower the production cost when a small volume (low concentration) of inoculum phage is
required. To clarify this point, aim of this study was to investigate effect of different MOI values of about 0.1, 1.0,
and 10.0 on inactivation of A. hydrophila in sterilized striped-catfish pond water.
2. Materials and methods
2.1 Preparation of bacterial stock
The host bacterial strain A. hydrophila CA.1.2T was provided by Prof. Dang Thi Hoang Oanh (Can Tho
University, Vietnam). This strain was previously isolated from ill striped catfish in the MKDVN. The bacterial
strain was recovered from glycerol stock preserved at -80 oC by culturing on TSA and then incubated at 28 oC
for 24 h. Pure bacterial strain was cultured in TSB medium at 30 oC for 24 h. Bacterial cells was harvested by
centrifugation at 4,000 rpm for 3 minutes and washed 2 times with 0.85% NaCl solution after discarded medium.
Bacteria density was determined by culturing on TSA and count number of colonies after 24 hours. The
concentration of A. hydrophila CA.1.2T was about 109 – 1010 CFU/mL.
2.2 Phage production
Phage TG25P was used in this study. Phage stock was prepared in SM buffer [100 mM NaCl, 10 mM MgSO4,
0.01% gelatin, and 50 mM Tris-HCl (pH 7.5)] at concentration of 109 – 1010 PFU/mL. Protocol of phage stock
preparation was shown elsewhere (Hoang et al., 2014). Next, phage-containing product was obtained from
fermentation of host bacteria in culture mainly containing molasses and yeast extract (not shown details in this
study).
2.3 Challenge test in pond water
Inactivation of A. hydrophila CA.1.2T cells in a striped catfish pond water sample by TG25P phage was
examined. The bacterial culture was shaken at 30 oC, 120 rpm in TSB until its OD600 of 0.1 (~107 CFU mL-1)
was achieved. The culture was centrifuged at 10,000 xg, 4 oC, 5 min to obtain a pellet. The pellet was suspended
in the same volume of sterilized pond water. The centrifugation and suspension were repeated to discard
residuals of TSB. The final pellet was suspended and serially diluted in sterilized pond water to obtain a bacterial
concentration of ~105 CFU mL-1. The solution was divided into six aliquots, each of 70 mL in 250-ml Erlenmeyer
flask. The first three aliquots were mixed with TG25P phage-containing product at a multiplicity of infection (MOI)
of 0.5, 3.0, 20; and the other three aliquots were added by respectively volumes of product containing denatured
phages (no lytic activity of phages). In addition, three 70-mL aliquots of sterilized pond water were prepared in
250-ml Erlenmeyer flasks and added by respective volumes of TG25P phage-containing product as above (no
host bacteria contained in these three flasks). All the mixtures were incubated at 30 oC. Sampling was performed
at different intervals. In case of the mixture of host bacteria and phage, each sample was divided into two
aliquots. One aliquot was serially diluted and spread onto Trypticase Soy Agar (TSA) to estimate bacterial
concentration. To the other aliquot, the phage titer was estimated by serial dilution and the double agar-layer
method, as described elsewhere (Hoang et al., 2014). In case of no phage addition, the sample was serially
diluted and spread onto TSA to estimate bacterial concentration. In case of no host bacteria addition, the phage
titer was estimated as described above. The experiment was conducted in triplicate.
3. Results
3.1. Phage-containing product
Phage production in a standard condition was shown earlier (Tran et al., 2018). In this study, a phage-containing product was obtained from a fermentation of host bacteria in culture mainly containing molasses and yeast extract. The product has phage concentration of about 10^9 PFU/mL (Figure 1).

Page 21
Figure 1. Phage-containing products
3.2. Inactivation of A. hydrophila in pond water by phage at different MOIs
Fig. 2 shows a time course of host cells during the experiment. At MOI = 0.5, the first 2 h of incubation, almost
no change of host bacterial count was seen for both experiment (with or without phages). The host bacterial
count in the challenge with TG25P decreased (about 1 log) in the next 5 h of incubation in the run with phages.
However, after 7 h, in the run without phages, an increase of bacterial count appears and maintains at about
log 5-6. In the negative control (host cells without phages), a similar increase also maintains for 48 h. Compare
to the phage concentration shown in Fig. 3 at MOI = 0.5, an increase of approximately 1 log appears in the run
with phage mixture. In the run without phages, phage concentration maintains stable for 48 h indicating a high
stability of phage activity in sterilized striped catfish pond water.
In the run with MOI = 3.0, a different of approximately 1 log between runs with or without phages appeared after
6 h (Fig. 2) respectively to about 1.5 log change of phage concentration (Fig. 3). In the run with MOI = 20, a
sudden increase (about 3.5 log) of bacterial count appears at the run with phages. The bacterial count starts to
increase after 6h and reaches stable at about 15 h. In the control run (without phages), bacterial count sharply
increases (3 log) and reaches stable at 10 h. Together with lysing host cells, phage particles were also newly
generated. Phage titer increased during the first 2 h and then keep stable (Fig. 3). In the control (phage without
0
1
2
3
4
5
6
7
8
0 10 20 30 40 50Bac
teri
al c
on
c. (
logC
FU/m
L)
Time (h)
MOI = 0.5
0
1
2
3
4
5
6
7
8
0 10 20 30 40 50Bac
teri
al c
on
c. (
logC
FU/m
L)
Time (h)
MOI = 3
Figure 2. Time course of host cells during the
challenge test in striped catfish pond water at
30 oC and different MOIs. Bacterial cell count of
A. hydrophila in a mixture with TG25P (closed
diamond) and without phage (closed triangle).
No host bacteria were added (closed circle).
0
1
2
3
4
5
6
7
8
0 10 20 30 40 50
Bac
teri
al c
on
c. (
logC
FU/m
L)
Time (h)
MOI = 20

Page 22
host cells), phage titer was almost stable during 48 h, indicating the stability of TG25P in striped catfish pond
water.
Different from Tran et al. (2018) when phage stock in SM buffer was used in the test, in this study, phage-
containing product produced in a culture involving molasses and yeast extract. A rich-nutrient condition much
supported growth of host bacteria. A higher increase appeared when a higher volume of phage-containing
product used.
4. Discussion
In terms of production cost of striped catfish, antibiotics are the third highest item of expense (2.5%).
Nevertheless, it has been estimated that even 1% fall in expenditure on antibiotics (of the total 2.5%) would
alone generate a saving of approximate USD 13Millions to the fisheries industry in Vietnam (Nguyen & Vo,
2014). The low-price phage product is expected to reduce antibiotic expenditure. This is due to: (1) phages
replicate extremely fast, and only a small dosage is needed at the beginning; (2) phages can be produced from
simple fermentation process with low-cost materials (Richard, 2014). Diseases such as hemorrhagic septicemia
can lead to significant and widespread damages. In 2014 and in the four MKDVN provinces of An Giang, Dong
Thap, Vinh Long and Hau Giang alone, 730 hectares causing damages of approximate USD 170Million (Nguyen
& Vo, 2014). As such the technologies identified in the study are expected to assist in the search for treatments
to lower the high fatality rate, financial losses and risks for the fisheries industry, not only in Vietnam but also in
other countries in the Mekong Sub-region.
0
1
2
3
4
5
6
7
8
0 10 20 30 40 50
Ph
age
tite
r (l
ogP
FU/m
L)
Time (h)
MOI = 0.5
0
1
2
3
4
5
6
7
8
0 10 20 30 40 50
Ph
age
tite
r (l
ogP
FU/m
L)
Time (h)
MOI = 3
0
1
2
3
4
5
6
7
8
0 10 20 30 40 50
Ph
age
tite
r (l
ogP
FU/m
L)
Time (h)
MOI = 20
Figure 3. Time course of phages during the
challenge test in striped catfish pond water at
30 oC and different MOIs. Phage titer in the
mixture with (closed diamond) and without host
cells (triangle). No phage was added (closed
circle).

Page 23
The phage therapy has been developed and applied only in some developed countries. However, phage solution
is still produced by expensive materials and stored at laboratory condition. In order to apply the phage therapy
on striped catfish farms, the kind of ‘science’ data need to be developed to ‘engineering’ data. In other words,
products containing respective phages need to be produced from low-cost materials. In this study, a low-cost
phage product was investigated its ability to inactivate the host bacteria. This is the first study on usage of this
kind of phage product on in vitro trial.
MOI is one of the most parameters that needs to be considered in phage production and also in phage therapy
is molar ratio of phage-to-bacteria. In this study, three different MOI values were examined their effect on
inactivation of host cells. A higher MOI value was more effective than a lower MOI value in terms of inactivation
of host cells in the first hours. However, after 10h, bacterial counts in phage-host cases were almost the same,
while bacterial count in host-only cases was higher when a higher MOI value used. The study also indicated
growth of phage resistant bacterial strains to TG25P phage. The regular emergence of phage-resistant bacteria
is one of the major challenges of phage therapy (Labrie et al., 2010; Oliveira et al., 2012; Mateus et al., 2014).
An effective way to tackle the problem is to apply a phage cocktail (a mixture of different phages showing
different types of host bacterial receptors) to inactivate phage-resistant bacteria. The previous studies
interestingly indicate that when the host bacteria are resistant to phage infection, the bacterial receptors change
resulting in less toxic properties (Fillippov et al., 2011; León & Bastías, 2015). This may have meanings in control
of bacterial diseases on fish farms using phage therapy. In the future studies, an in vivo trial of inactivation of
host bacteria by phages will be conducted.
Acknowledgment
This research is funded by International Foundation of Science (Sweden) under grant number I-2-A-5847-2.
References
Asami K, Xing XH, Tanji Y & Unno H (1997) Synchronized disruption of Escherichia coli cells by T4
phage infection. Journal of fermentation and bioengineering, 83(6), 511-516
Dang THO, Nguyen TP. Detection of Edwardsiella ictaluri causing white spots in the internal organs of striped
catfish Pangasianodon hypophthalmus by using polymerase chain reaction technique Journal of Science –
Can Tho University 2010; 13: 151-59 (in Vietnamese)
Filippov, A.A., Sergueev, K.V., He, Y., Huang, X.Z., Gnade, B.T., Mueller, A.J., Fernandez-Prada, C.M., and
Nikolich, M.P. (2011) Bacteriophage-resistant mutants in Yersinia pestis: identification of phage receptors
and attenuation for mice. PloS. One., 6, e25486.
Hoang, HA, Abe, M, and Nakasaki, K (2014) A novel colorimetric method for the detection of Escherichia coli
using cytochrome c peroxidase-encoding bacteriophage. FEMS. Microbiol. Lett., 352, 97-103.
Jun, JW, Kim, JH, Shin, SP, Han, JE, Chai, JY, and Park, SC (2013) Protective effects of the Aeromonas phages
pAh1-C and pAh6-C against mass mortality of the cyprinid loach (Misgurnus anguillicaudatus) caused by
Aeromonas hydrophila. Aquaculture., 416-417, 289-295.
Labrie SJ, Samson JE, Moineau S. Bacteriophage resistance mechanisms. Nature Reviews Microbiology.
2010;8:317–27. Available from: DOI:10.1038/nrmicro2315.
León, M., and Bastías, R. (2015) Virulence reduction in bacteriophage resistant bacteria. Front. Microbiol., 6,
343.
Mateus L, Costa L, Silva YJ, Pereira C, Cunha A, Almeida A. Efciency of phage cocktail in the inactivation of
Vibrio in aquaculture. Aquaculture (Amsterdam, Netherlands). 2014;424:167–73. Available from:
DOI:10.1016/j.aquaculture.2014.01.00
Nakai, T., Sugimoto, R., Park, K.H., Matsuoka, S., Mori, K., Nishioka, T., and Maruyama, K. (1999) Protective
effects of bacteriophage on experimental Lactococcus garvieae infection in yellowtail. Dis. Aquat. Organ.,
37, 33-41.
Nguyen V.T. & Vo T.D. (2014) Market of Vietnamese striped catfish – distribution, cost and solution,
J of Sci – Can Tho University, Session D, 32: 38-44 (in Vietnamese)
Oliveira J, Castilho F, Cunha A, Pereira MJ. Bacteriophage therapy as a bacterial control strategy in aquaculture.
Aquaculture International. 2012; 20:879–910. Available from: DOI: 10.1007/s10499-012-9515-7.
Quach, VCT, Tu, TD, and Dang, PHH (2014) The current status antimicrobial resistance in Edwardsiella ictaluri
and Aeromonas hydrophila cause disease on the striped catfish farmed in the Mekong Delta. J. Sci. – Can
Tho University, Special Issue: Aquaculture 2, 7-14 (2014) (in Vietnamese).
Richards, GP (2014) Bacteriophage remediation of bacterial pathogens in aquaculture: a review of the
technology, Bacteriophage. DOI:10.4161/21597081.2014.975540.
Tran T.T. Xuan, Hoang, H. A., & Tam, L. (2018). Stability and activity of TG25P phage in control of Aeromonas
hydrophila in striped catfish pond water. Science and Technology Development Journal, 21(2), 64-70.

Page 24
Wu, J.L., and Chao, W.J. (1982) Isolation and application of a new bacteriophages, ɸET-1, which infects
Edwardsiella tarda, the pathogen of edwardsiellosis. CAPD. Fisheries. Series. 8, 8-17.
Wu, J.L., Lin, H.M., Jan, L., Hsu, Y.L. (1981) Chang LH, Biological control of fish bacterial pathogen, Aeromonas
hydrophila by bacteriophage AH 1. Fish. Pathol., 15, 271-276.

Page 25
Proceedings of
The 5th International Conference on Low Carbon Asia & Beyond - ICLCA 2019 &
The 4th International Conference on Chemical Engineering, Food and
Biotechnology - ICCFB 2019
Vietnam, Malaysia
ISBN: 978-604-67-1372-2
ISBN 978-88-95608-67-9; ISSN 2283-9216
Assessment on the Reality of the Development of Land Fund
in the Area of Phu Vang District, Thua Thien Hue Province
Cuong Le Dinha,c,*, Song Toan Pham Phub, Takeshi Fujiwarac
aUniversity of Agriculture and Forestry, Hue University, 530000, Vietnam bThe University of Danang – University of Technology and Education, 48 Cao Thang Road, Hai Chau District, Danang City,
550000, Vietnam. cGraduate School of Environmental and Life Science, Okayama University, 700-8530, Japan
Phu Vang is a coastal and lagoon district of Thua Thien Hue province with great potential for marine economic
development. Recently, urbanisation had taken place strongly in the district, accompanied by an increase in
demand for the land fund. This led to a need for an assessment on the reality of development of land fund in
the area of Phu Vang district. In this study, the questionnaire and interview surveys were conducted with random
90 households and 12 administrative staffs, combined with document review between January and June in 2017
in area of research. Then statistical methods were used for description, analysis, comparison, and assessment.
From 2014 to 2016, 67 projects with total areas of 61.88 ha of land were implemented for land fund development
(LFD). It emerges that LFD was affected considerably by policies to attract investment, price of real estate, state
budget and comprehensive planning as well as had significantly positive impacts on infrastructure.
1. Introduction and literature review
Worldwide, studies on land use have played an essential role in social development planning and has
substantially contributed to nature conservation. Many studies mentioned about the predictions on land use
change (LUC) basing on the models. Notably, a study on simulation of LUC in the urban areas in Hong Kong
offered positive alternatives for future urban renewal based on different policy directions. This study has
significantly contributed to the making-decision process of land use planning (LUP) (Zheng et al., 2015).
Moreover, researchers made many enhancements to the existing LUC models. A researcher enhanced the
existing land use and land cover change (LULC) models by combining a Conversion of land use and its effects
at small regional extent (CLUE-S) model with a Markov model in Beijing. The results indicated good consistency
between predicted results and actual land use situations according to a Kappa statistic (Han et al., 2015).
Apart from the prediction of LUC, a plethora of studies reported the effects of LUC to the environment and
society. A study analysed econometric-based projections of future land use change to capture changes around
1260 protected areas, from 2001 to 2051, under different land use policies and crop prices in America. This
study showed that urban expansion was the major threat in diminishing conservation value and likely to continue
to threaten protected areas (Martinuzzi et al., 2015).
A study examined consequences and impacts of land acquisition in China. The results showed that land
acquisition resulted in increasing social tension and injustice that may pose a potential threat to stability
and sustainable development (Ding, 2007). Another article studied the land acquisition for infrastructure,
industries and various services and the process of displacing people from their normal activities. The results
showed that despite necessity of land acquisition for industrialization, there was a lack of proper compensation
and rehabilitation programme that determined success of land acquisition (Sarkar, 2007). In Chisumbanje,
Zimbabwe, a study assessed the local livelihood implications of land acquisitions for biofuel development. The
findings of study showed that displaced households argued the costs incurred from biofuel development
outweighed benefits derived (Thondhlana, 2015). In Vietnam, a survey of 430 officials, organisations, and people

Page 26
was conducted to assess present status of LFD in Yen Bai city, Vietnam. Basing on these results, implications in
policy, financial, and planning were recommended in order to promote LFD work (Ho et al., 2016).
In general, the above studies mentioned, researched and evaluated the LUC, LUP and LFD other topics that were
related to LFD in a host of areas. Despite a variety of above-mentioning studies, it would be a big challenge if
people want to apply approaches in many parts of the world to a specific country (Zevenbergen et al., 2015).
Therefore, this led to a need for intensive study in a specific area for LFD. There was no specific study on LFD in
Phu Vang district. In addition, a clean land fund for various projects has gradually become urgent with strong
urbanization in the researched area in recent years. Therefore, this study was conducted on the status of LFD in
Phu Vang district with the aim to examine the reality of LFD; impacts of LFD on socio-economic development;
factors that effected LFD as well as propose the solutions on improving the LFD in the area of Phu Vang.
2. Methodology of the study
There were two main stages in conducting this study. They were a collection of data and analyses of data. In
terms of collecting data, this research used a questionnaire, interview, and document review. To be specific,
data collection was conducted on the reality of LFD in the researched area. Moreover, 12 officers who worked
in the government offices were interviewed in order to assess the effect of some factors which affected the task
of LFD. Additionally, 90 organisations, individuals and households crucially that were compensated for land
clearance were interviewed to assess the effect of the task of the LFD to the economic and social development
in the area of Phu Vang district (Ho et al., 2016).
After that, the data were analysed by using descriptive statistics.
Using the methodology on analysis in the descriptive statistics to total up the particularities of the objects
following the group of objects, the average weight and the frequency of appearance by Excel software.
Using Likert measure (Likert, 1932) to assess the groups of factors which affected the LFD by five levels:
very high, high, medium, low and very low which correspond to 5, 4, 3, 2 and 1, respectively. The range of
value corresponding to the level of impact on LFD was identified as follows: very large: ≥4.20; large: <4.20
and ≥3.4; average: from <3.4 and ≥2.6; small: <2.6 and ≥1.8; very small: <1.80.
The method for calculating the range of value corresponds to the level of impact on LFD (Likert, 1932):
𝑅𝑎𝑛𝑔𝑒 𝑜𝑓 𝑣𝑎𝑙𝑢𝑒 =𝑀𝑎𝑥𝑖𝑚𝑢𝑚 − 𝑀𝑖𝑛𝑖𝑚𝑢𝑚
𝑛=
5 − 1
5= 0.8 (1)
The magnitude of impact was calculated as a mean of weights on the Likert scale.
3. Result of research and discussion
3.1. The result of the development of land fund in the researched area
The results of LFD between 2014 and 2016 in Phu Vang district with a variety of purposes of creating land fund
were illustrated in Table 1. Overall, 67 projects were developed with an auction of 61.88 ha of land.
In addition to this, the area of land used for LFD mainly came from agricultural land, with a total area of 42.69
ha compared with 19.19 ha of other lands. This was mainly because recovery of agricultural land had a low cost
and simpler procedure compared with that of other sources of land.
Table 1: The result of the development of land fund in the period from 2014 to 2016
[Source: List of projects implementing compensation, support and resettlement in Phu Vang district]
LFD for residential land and serving the public accounted for the largest number of projects and total area. A total of
30 projects were developed, and 20.98 ha of land was recovered to build the new residential areas in the period
between 2014 and 2016. This showed the tendency of quite strong urbanization in Phu Vang district over the years.
Moreover, an auction of residential land had a tremendously important role in the state budget. A large amount of
Purpose of creating a land fund Number of
projects
Total
area(ha)
Agricultural
Land (ha)
Other
(ha)
Residential land 30 20.98 16.53 4.45
Other purposes 37 40.9 26.16 14.74
- Land for construction of non-business facilities 5 1.86 1.55 0.31
- Land for non-agricultural production and business 6 15.93 15.9 0.03
- Land used for public purposes 25 15.83 6.81 9.02
- Land for national defense or security purposes 1 7.28 1.9 5.38
Total 67 61.88 42.69 19.19

Page 27
annual state budget came from the auction of land. This was the reason why there were usually projects of LFD for
residential area annually.
Besides, there were 25 projects with the recovery of 15.83 ha of land for public purposes in the same period. The
vast majority of these projects were the extension of provincial roads and national highways as well as the
development of an electric grid. They contributed positively to Phu Vang district's infrastructure and the aim of 100
% indigenous people using the national electricity network in 2020. Therefore, the quality of life of local people
would be increased enormously.
Although there were only six projects for non-agricultural production and business, these projects used 15.93 ha of
land mainly converting from agricultural land (15.9 ha). Production and business performed a fundamental role in the
socio-economic development of each locality. Consequently, the ground clearance for production and business,
namely trading petroleum, textile and mineral exploitation not only yielded revenue for the state budget but also
combatted unemployment in the local region.
During the study period, there was only one project of land recovery for national defence and security. It was the
construction of a training centre of police of Thua Thien Hue Province with a total area of 7.28 ha of land. Most of the
area was converted from unused land (5.25 ha). This enhanced the efficiency of land use (most of the area was
converted from unused land) in the local area as well as strengthened security for Phu Vang district. As a result, social
order and peace of mind of homegrown people would be boosted.
3.2. Assessment of the effect of the factors on the development of the land fund.
3.2.1. Group of policy factors
In this group, two factors had a considerable influence on the LFD: land policy and policies to attract investment.
To be specific, the policies to attract investment had an average value of 4.33 (Figure 1a). Likewise, Ho et al.
(2016) also proved the significantly important role of these policies for LFD by the value of 4.4. According to
Likert scale, this value represents the significant influence on the LFD. As a result, the policy of attracting
investment was a key factor determining the effectiveness of LFD. Developing the policy of attracting investment
through various forms of reasonable support for capital, tax and land use fees for investment projects should be
a primary duty to create the most favourable conditions for LFD.
(a) (b)
(c) (d)
Figure 1: (a) The influence of the policy factors group on the work of land fund development; (b) Financial factors
on the work of land fund development; (c) Planning factors on the work of land fund development; and (d) Impact
of land fund development on socio-economic development
Figure 1a shows that land policy had an average value of 4.08. This value demonstrated the quite utmost
importance of land policies to LFD. For this reason, the land policy should be received proper attention,
4.084.33
2.922.42
0
1
2
3
4
5
Land policy Policies toattract
investment
Supportingpolicies
Social policies
4.42 4.5
3.17
2.42
0
1
2
3
4
5
Price of realestate
Governmentbudget
Loan Other fundingsources
4.25 4.08 4
0
1
2
3
4
5
Comprehensiveplanning
Land useplanning
Urban planningnorm
3.32.94
3.283.98
0
1
2
3
4
People'sincome
Jobopportunities
People'sspiritual life
Infrastructure

Page 28
remarkably land policy related to the conversion of land use purposes in order to maximise the potential of the
land resource in the localities and ensure the sustainable development on three aspects of the economy, society
and environment in the local area.
In terms of supporting policies and other social policies, the average value was 2.92 and 2.42, respectively. This
represented the low and moderate impacts of these policies on LFD. In order to enhance the efficiency of LFD,
supportive policies and other social policies should be introduced after having coordination between the
industries: Natural resources and environment management; Agriculture; Construction and Trade as well as
consulting with specialists.
3.2.2. Group of financial factors
In Figure 1b, the two most prominent elements were the price of real estate and the state budget. Specifically,
the price of real estate had a value of 4.42, and the state budget had a value of 4.5. These results reflected an
exceedingly important role of the price of real estate and the government budget on LFD. This was the reason
for the great interest in the land price and the state budget of specialists as well as leaders during the process
of implementing LFD. Whereas, Ho et al. (2016) did not mention the government budget criteria, which is one
of the most influencing factors of LFD in Yen Bai city. Nevertheless, groups of researchers revealed the price of
real estate as the most important factor to LFD by the value of 4.57.
Regarding the government budget, disbursement is a vitally important work. The LFD centre of Phu Vang district
needs to propose new and specific models to the disbursement of compensation, supports and resettlement in
the localities so that projects will not be delayed because of slow disbursement, causing loss of resources for
not only society but also local individuals.
To develop land fund, study, evaluating and constructing governmental land prices which are suitable to the
actual conditions in the locality will help the compensation and ground clearance work to be carried out on
schedule. Additionally, the LFD centre should coordinate with the natural resources and environment division to
propose compensation and support measures by the actual value of the property of the people but still obeying
the law. This is a critical, sensitive issue due to the interests of many parties.
The funding borrowing from financial institutions had a value of 3.17. This indicated an average level of influence
of this factor on the LFD. Typically, the loan is only considered if there will be any problems in disbursement.
Hence, if the disbursement is well conducted, the value of this factor may decrease.
The value of the impact of the other funding sources was 2.42. This value illustrated the influence of other
funding sources on LFD was at a small scale.
3.2.3. Group of planning factors
Figure 1c indicates that the comprehensive planning elements and LUP have a high value of impact, namely 4.24
for the comprehensive planning, 4.08 for LUP and 4.0 for the urban planning norms. The correlation between the
comprehensive plan for socio-economic development and LFD was presented in the same level in Yen Bai city
(Ho et al., 2016). This was a very high value, showing a critical role of the comprehensive planning on LFD. It also
stated that during the implementation of LFD, there was a need for research on the comprehensive plan for LFD.
The other two factors were LUP and urban planning norms with a value of 4.08 and 4.0, respectively. This
represented a major impact on the LFD of these two factors. Furthermore, these two factors were directly
affected by the comprehensive plan. For this reason, these two factors played a vital role in LFD.
Under those circumstances, urban planning norms should be considered when implementing LFD, especially
for localities with relatively developed infrastructure including Thuan an town and Phu Da town of Phu Vang
district. This will inevitably guarantee the provisions of the law in those areas.
In terms of planning factors, to promote the efficiency of LFD, planners should pay attention to the calculation
of land use efficiency when preparing LUP schemes in localities, thereby allocating appropriate land use plans
and avoiding waste. Before planning, planners should consult the experts and the results of specialised scientific
researches that have been published in the area for planning to achieve optimal results.
3.3. Assessment on the effect of the development of a land fund to the economic, social development of Phu Vang District, Thua Thien Hue Province.
The survey was conducted with 90 inhabitants, households and the organisations in the area of Phu Vang
district on the effect of LFD to the economic and social development. The assessment was based on four factors:
inhabitants’ income; job opportunities; the people’s spiritual life and infrastructure.
Generally, the infrastructure made the most significant changes during the study period with a very high value
of 4.33. The figure for the remaining factors were approximately 3.0, reflecting the average impact of LFD on
people's incomes, employment opportunities and community’s spiritual life.

Page 29
3.3.1. Assessing the impact of land fund development on people's incomes
The results of this study showed that 34.44 % of respondents claimed that their income increased due to the
LFD. There were 5.56 % of interviewees thought that their income increased enormously as a result of LFD. A
possible explanation for this would be the widening of the road created more opportunities for business and
trade, bringing about considerable revenue. A large number of respondents (47.78 %) underlined that their
income remained almost unchanged after LFD. These were households that were not dependent on local
income sources but tend to seek employment through labour export, the salary of government and pension.
(a) (b)
(c) (d)
Figure 5: (a) Impact of land fund development on people's income; (b) Impact of land fund development on
employment opportunities; (c) Impact of land fund development on people's spiritual life; (d) Impact of land
fund development on infrastructure
3.3.2. Assessing the impact of land fund development on job opportunities
The job opportunities for employment of 29 interviewees, accounting for 32.22 %, decreased because of LFD.
These interviewees were mainly from agricultural families who were not trained to change their occupations
after land recovery. Eighteen respondents, accounting for 20 %, believed that their income increased after LFD.
In addition to this, seven respondents stated that they found the job more easily after LFD. These people came
from small home-based business or were construction workers in the localities.
The vast majority of people thought that their job opportunities remained unchanged after LFD. The main reason
was that these people had done a same job for many years, so it was exceedingly difficult to change jobs that
had been deeply embedded in their mind. This correlate favourable well with Ho et al. (2016) that LFD has not
created job opportunities like as expectation of people.
3.3.3. Assessing the impact of land fund development on people's spiritual life
A proportion of 24.44 % of interviewees argued that LFD produced positive changes in culture and forms of
entertainment. This was simply because there were projects to serve the community, for examples, projects of
the construction of cultural houses and development of cultural infrastructure. These projects had ensured the
basic cultural needs of people living in localities where access to recreational facilities had been limited.
Noticeably, most people thought that their spiritual life had not changed significantly when LFD was carried out.
Most of the interviewed people (58.89 %) pointed out that although the facilities for cultural and community
5.56%
34.44%
47.78%
8.89%
3.33%7.78%
20.00%
35.56%
32.22%
4.44%
7.78%
24.44%
58.89%
5.56%
3.33%
31.11%
42.22%
20.00%
6.67%
Significantly improved Improved Unchanged Worsened Significantly worsened

Page 30
activities had been developed the spiritual life of people would be unchanged owing to the low content of the
spiritual activities.
By contrast, 56.98 % interviewees affirmed that their spiritual life has been improved due to LFD in Yen Bai city
(Ho et al., 2016). This illustrated that LFD might contribute differently to people’ spiritual life in distinctive areas.
3.3.4. Assessing the impact of land fund development on infrastructure
42.44 % interviewees contended that the infrastructure had positively improved. This would be the result of up to
15.83 ha of land was used for LFD projects that served the community. These were transport, irrigation and
energy projects. In addition, 31.11 % of respondents noted that the infrastructure had been significantly positively
changed. This was mainly because of the expansion of the existing road systems, for instances, provincial roads 10A
and 49B as well as The Asian Development Bank’s power grid projects. These results are scarcely distinguishable
from (Ho et al., 2016) that 51.40 % interviewees supposed that infrastructure is better due to LFD.
However, there were 18 people who considered the infrastructure to be untouched. These people lived in areas which
had relatively good infrastructure with Phu Thuong commune, Phu Da town as examples.
Moreover, there were six citizens (6.67 %) highlighted that the infrastructure had been deteriorated over time.
This was as a result of the expansion of provincial roads and highways which affected the infrastructure of
the residential areas. For example, the vehicles transporting materials had damaged inter-village and inter-
commune roads with smoke, dust fall and rock fall. These factors had a negative impact on the families of
those six people.
4. Conclusion
LFD served principally to the new inhabitant zones and the other public purposes. An additional finding was a
vast majority of interviewees recognised that LFD created the noticeably positive changes to the infrastructure.
Moreover, LFD was most seriously affected by policies to attract investment, price of real estate, state budget,
as well as comprehensive planning.
In the light of this study, the findings suggested that local authorities of Phu Vang district should examine
carefully the group of planning factors including comprehensive planning, land use planning and urban planning
norm as well as policies to attract investment, price of real estate and disbursement of the state budget for LFD.
However, it remains to be further clarified whether these findings in Phu Vang district could be applied to other
areas with a different scale, namely Thua Thien Hue province, Hue city or even Vietnam.
References
Committee P.V.P.S., 2014, List of projects implementing compensation, support & resettlement in Phu Vang
district, Phu Vang district, Thua Thien Hue province, Vietnam.
Committee P.V.P.S., 2015, List of projects implementing compensation, support & resettlement in Phu Vang
district, Phu Vang district, Thua Thien Hue province, Vietnam.
Committee P.V.P.S., 2016, List of projects implementing compensation, support & resettlement in Phu Vang
district, Phu Vang district, Thua Thien Hue province, Vietnam.
Ding C., 2007, Policy and praxis of land acquisition in China, Land Use Policy, 24(1), 1-13, DOI:
https://doi.org/10.1016/j.landusepol.2005.09.002
Han H., Yang C., Song J., 2015, Scenario simulation and the prediction of land use and land cover change in
Beijing, China.
Ho T.L.T., Vu T.T., Phan T.T.H., 2016, Assessment of present status of land fund development in Yen Bai city,
Yen Bai province, Agriculture and rural development, 19, 10-17.
Likert R., 1932, A technique for the measurement of attitudes, Archives of Psychology, 22 140, 55-55.
Martinuzzi S., Radeloff V.C., Joppa L.N., Hamilton C.M., Helmers D.P., Plantinga A.J., Lewis D.J., 2015,
Scenarios of future land use change around United States’ protected areas, Biological Conservation, 184,
446-455, DOI: https://doi.org/10.1016/j.biocon.2015.02.015
Sarkar A., 2007, Development and displacement: Land acquisition in West Bengal, Economic and Political
Weekly, 42(16), 1435-1442.
Thondhlana G., 2015, Land acquisition for and local livelihood implications of biofuel development in Zimbabwe,
Land Use Policy, 49, 11-19, DOI: https://doi.org/10.1016/j.landusepol.2015.06.025
Zevenbergen J., Vries W.D., Bennett R.M., 2015, Advances in responsible land administration: Taylor & Francis.
Zheng H.W., Shen G.Q., Wang H., Hong J., 2015, Simulating land use change in urban renewal areas: A case
study in Hong Kong, Habitat International, 46, 23-34, DOI: https://doi.org/10.1016/j.habitatint.2014.10.008

Page 31
Proceedings of
The 5th International Conference on Low Carbon Asia & Beyond - ICLCA 2019 &
The 4th International Conference on Chemical Engineering, Food and
Biotechnology - ICCFB 2019
Vietnam, Malaysia
ISBN: 978-604-67-1372-2
Health risk assessment of Glyphosate at grape farms, Tuy
Phong District, Binh Thuan Province, Vietnam
Nam V. Thai*, Nguyen T. Trinh
Ho Chi Minh City University of Technology (HUTECH), 475A Dien Bien Phu Street, Ward 25, BinhThanh District, Ho Chi
Minh City, Vietnam
Glyphosate was recently determined as probably carcinogenic to humans due to the most heavily used pesticide
in the world. Glyphosate has been much used in agricultural cultivation in Vietnam and there are no
recommendations and studies related to health risks. This study aimed to (1) determine glyphosate residues in
soil, groundwater, and fruit at grape farms in Tuy Phong district, and (2) assess the health risks of glyphosate
residues to children, farmers in the study area. To achieve the objectives, the study conducted farmer surveys
and collected samples at all 12 grape farms, then analyzed glyphosate residues by GC-MS/MS method. Health
risk assessment to farmers and children was carried out by the guideline of WHO based on analyzed and
surveyed results. Results show that glyphosate has no acute toxicity to users, but the accumulation of
glyphosate in grapes, soil, and groundwater exceeds in 5 - 200 times higher than the European allowable limit,
highest in groundwater. The pathway of glyphosate intake into the body is likely to cause a high level of cancer
risk through the use of groundwater, accounting for 98.3 - 99.3 % of the total risk. Health risk of farmers is
assessed as highly concerned, needed minimizing solutions.
1. Introduction
In the past decade, the use of glyphosate herbicide has become popular and now it is one of the most used
herbicides in the world (US EPA, 2017). After being sprayed, glyphosate is quickly absorbed in the soil and then
enters groundwater and surface water (US EPA, 2016). The increase of widespread glyphosate usage leads to
genetic plant modification and human health effects (US EPA, 2017). Glyphosate residues are found in many
types of samples including plant samples (EC, 2008). The maximum allowable concentration of glyphosate in
US drinking water is 0.7 mg/L (Thompson et al.,1989).
Recently, public opinion is very interested in the issue of farmers abusing glyphosate herbicides in agricultural
production. The amount of herbicides used by farmers increased by 20 - 30 % compared to 5 years ago, notably
farmers using the concentration of herbicides increased from 1 to 2 times higher than the warning dose. The
European Food Safety Agency and the International Agency for Research on Cancer have been much
controversy in allowing use of glyphosate (Vogel, 2015). Glyphosate became the focus of world opinion since
March 2015, when IARC under the World Health Organization announced the classification conclusion for
glyphosate as a group 2A, which is high carcinogenicity (Luan, 2016).
Research has shown that glyphosate after being sprayed, remains in the air, water, food and can be absorbed
to the human body through food chains. Mladinic et al. (2009) reported about experiments on lymphocytic cell
lines of human and animal that showed an increase in the number of small nuclei (one of the signs of DNA
destruction). Accordingly, the hypotheses about the ability to cause mutations at the telomere have set by
scientists. Research in the laboratory also provides evidence of the risk of causing strange cancers in male mice
such as renal tubular carcinoma, rare liver cancer and the ability to promote the development of T47D cell lines
through impact on estrogen receptor. Over the years, there have been many allegations from countries about
the dangers of glyphosate, typically in 2015, more than 30,000 doctors and medical professionals in the Union
Federation of Health Professionals of Argentina asked for glyphosate to be banned because this chemical

Page 32
causes the increase of miscarriage, birth defects, skin diseases, respiratory diseases and neurological diseases
in this country (US EPA, 2015).
Glyphosate can disrupt the endocrine system and cause adverse effects in the developmental stages. In
Colombia and Ecuador, the high rate of genetic modification and miscarriage in women during the season of
glyphosate spraying was observed (Thompson et al., 1989). In Paraguay, women living within one kilometre
radius of glyphosate spray fields faced up with risks of birth defects (Thongprakaisang et al., 2013). Recently,
the special commission of EU includes 30 members was set up to evaluate the grant license process of
glyphosate extension in Europe. The US EPA (2017) finalized an environmental risk assessment of glyphosate
to determine whether should continue to use glyphosate.
In Vietnam, farmers have been increasing glyphosate usage by 20 - 30 % compared to 5 years ago. The dose
is higher 1 - 2 times of recommended amount. The glyphosate contents in leaf samples, stems and food showed
that all analytical samples had glyphosate contents exceeding the allowable standard of European regulations
from 10 to 13,790 times, highest in stems and dry leaves (Nam and Tam, 2018). There are no studies related
to assessing the health risks of glyphosate in agricultural production in Vietnam.
The grape growing area in Binh Thuan province was selected for this study. Grape is the main crops of Binh
Thuan, with total area about 21,000 ha, total production about 400,000 tons, accounting for 73.2 % of the area
and 76.9 % of national production. Glyphosate has mainly been used as weedkiller at grape farms.
A survey of 12 grape farms was conducted in Tuy Phong district, Binh Thuan province. Investigating and
surveying the situation of glyphosate usage: weedkiller types, dosage, use methods, collection and handling of
packages containing glyphosate after using; how to handle excess glyphosate to assess the impact on farmers'
health through sociological surveys. Then, based on the data collected and the analysis of glyphosate residues
in soil, groundwater and grapes, we assessed health risks according to the guidelines of the World Health
Organization (WHO) (Tran, 2008). Based on risk-assessment approaches, Pinedo et al. (2017) proposed
measures to manage and reduce health risk of total petroleum hydrocarbons. In this paper, from the findings of
health risk assessment at grape farms, some risk management measures are taken into account.
2. Experimental
2.1 Research objects
The whole of 12 grape-growing farms in Tuy Phong district, Binh Thuan province was surveyed.
Herbicides containing glyphosate such as Grassad 480SL (Dau Trau brand) and BN-Kocan 480SL (Khung Long
brand) were investigated.
2.2 Research methods
2.2.1 Sociological survey and field survey
An open and closed question system was used in accordance with the actual situation related to habits, glyphosate dosage, how to dispose of the packaging and residues of glyphosate after spraying, the amount of soil that can be contacted, the amount groundwater used and the amount of grapes consumed. The health effects before, during and after spraying on farmers were also recorded (acute effects). These are important information as input data for the risk assessment model. Interviewers were farm owners. Health risk assessment consists of three groups: two groups of children (sensitive to toxicants) and adults.
2.2.2 Sampling
Soil samples were collected at 30 cm depth following the guidance on soil quality - sampling - guidance on sampling techniques (TCVN 7538-2:2005). Groundwater sampling was carried out based on the guidance on water quality - sampling - guidance on the design of sampling programmes and sampling techniques (TCVN 6663-1:2011). Bunches of grapes were collected in zigzag shape for grape samples according to the guidance on fresh fruits – sampling method on the field (TCVN 9017 – 2011).
2.2.3 Glyphosate analysis
Glyphosate in samples were analysed by GC-MS/MS, which has high reliability, high accuracy, recovery, repeatability and reproducibility of the method according to the regulations of AOAC Official Methods of Analysis (Nam and Tam, 2016).
2.2.4. Health risk assessment
a. Health risk assessment model
To develop a health risk assessment model for the study area, the method proposed by the World Health
Organization (Human health risk assessment toolkit: Chemical hazards) and the US Environmental Protection
Agency (US EPA, 2016) was applied. The steps are conducted as follows:

Page 33
Step 1: hazard identification
The study's risk is glyphosate, which is classified as the group 2A that may cause cancer under the World Cancer Organization (IARC). Therefore, determination of risk level is presented in Eq (1).
Ri = SF × CDIi (1)
where i corresponds to three pathways that glyphosate can enter the human body by using groundwater, contacting with soil and eating grapes.
The total risk according to three pathways is calculated by Eq (2).
Rtotal risk = Rsoil + Rgroundwater + Rgrapes (2)
SF: slope factor (mg/kg/day)-1, SFglyphosate = 0.00062 (mg/kg.day)-1 through oral (Department of health, 2017).
Step 2: exposure scenarios
Exposure scenarios were developed by possible exposure pathways (glyphosate in soil, groundwater, and
grapes to human body); the correlation between the exposed residents and the potential toxicity of glyphosate
was assessed.
Step 3: exposure assessment
Applying the formula to calculate the level of exposure by the exposure pathway through gastrointestinal for
different residents in the study area (Tran, 2008). Exposure pathways and related data were cited from published
sources and the results of direct survey as follows:
Random exposure with contaminated soil/dirt through gastrointestinal is presented in Eq (3).
Eq (4) shows gastrointestinal exposure to the use of contaminated water for cooking (using well water in the study area).
Exposure when eating grapes through gastrointestinal (Eq 5).
Step 4: risk characteristics
Evaluation of the ability to harm human health through calculated values. Glyphosate is a substance belonging
to the group 2A, which can cause cancer risk according to Eq (1).
CDI: Daily intake of glyphosate to the body per day (mg/kg.d). In this case, CDIs, CDIdw and CDIp were
calculated in Step 3.
Eq 2 calculates the total risk from carcinogens according to three exposure pathways. Risk characteristics are
summarized and summed for assessing qualitative and quantitative risk levels according to the following rating
scale:
• R <10-6: Low risk of cancer, acceptable
• 10-6 < R <10-4: Average cancer risk, may or may not have a reduced decision, more research is needed
• R > 10-4: High risk of cancer, mitigation measures are needed
3. Results and discussion
3.1 The status of use and glyphosate effects to farmer's health
All farmers often sprayed herbicides containing glyphosate when the grass had just developed. Farmers also
added that the use of herbicides was partly based on their production experience, so 100 % of grape farms used
𝐶𝐷𝐼𝑠 =𝐶𝑠 × 𝑆𝐼𝑅 × 𝐶𝐹 × 𝐹𝐼 × 𝐴𝐵𝑆𝑠 × 𝐸𝐹 × 𝐸𝐷
𝐵𝑊 × 𝐴𝑇
(3)
𝐶𝐷𝐼𝑑𝑤 =𝐶𝑤 × 𝑊𝐼𝑅 × 𝐹𝐼 × 𝐴𝐵𝑆𝑠 × 𝐸𝐹 × 𝐸𝐷
𝐵𝑊 × 𝐴𝑇
(4)
𝐶𝐷𝐼𝑝 =𝐶𝑃𝑧 × 𝑃𝐼𝑅𝑧 × 𝐹𝐼𝑧 × 𝐴𝐵𝑆𝑠 × 𝐸𝐹 × 𝐸𝐷
𝐵𝑊 × 𝐴𝑇
(5)

Page 34
the exceeding dosage of manufacturer's regulations. Based on the survey results, the glyphosate herbicide
dosage was chosen to add more at most 30 cc (accounting for 45 %), the lowest was from 30 to 50 cc,
accounting for 11 % and the dosage was higher 50 cc, accounting for 22 % of total grape farms. This leads to
increase glyphosate residues in the environment and agricultural products. The isolation time of herbicides after
spraying from 2 weeks to 1 month is relatively ensured and follows the manufacturer's recommendations.
Although attended to training courses about the use of pesticides, farmers often did not record guidelines.
Pesticide containers after use were designed to gather in dumping places, and then taken away for destruction.
However, the fact of the survey showed that pesticide packaging was thrown indiscriminately on the farm
ground.
Most farmers used underground water sources for daily activities such as eating, bathing, using for irrigation,
and diluting herbicides accounting for 82 % of surveyed farms. The average amount of groundwater consumed
monthly from 1,000 m3 to 2,000 m3. Herbicide washing water was directly dumped into the ground, so the
groundwater source is likely to be greatly affected.
Survey results show that 92 % of surveyed farmers have never suffered from acute poisoning or skin diseases,
only one farmer (8 %) had ever experienced vomiting when he smelled herbicides.
According to previous research results, glyphosate can break the endocrine system and cause adverse effects
in developmental stages, the high rate of genetic modification, and miscarriage for women in Colombia and
Ecuador (Luan, 2016). Danish scientists also discovered glyphosate residues in groundwater in fields sprayed
with herbicide (Thonprakaisang et al., 2013). The carcinogenic mechanism of glyphosate has also been
explained through immunological and neurotoxic tests (acute and subcutaneous toxicity) based on four studies
in mice showing that glyphosate increases the cancer incidence (US EPA, 2016). This shows that although the
use of glyphosate at grape farms in Tuy Phong district has not caused yet any cases of acute poisoning, the
widespread use and frequent contact with glyphosate from the environment and food may be chronic poisoning
to farmers. The next content assesses the details of glyphosate residues in the component environment and in
grapes.
3.2 Health risk assessment of glyphosate in the study area
The values of Cmax and Caverage of glyphosate residues in the environment and grapes at 12 farms in our previous study (Nam and Tam, 2018) are shown in Table 1.
Table 1: Content of glyphosate (Cmax and Caverage) in soil, water and grapes
No Exposure pathways Cmax Caverage EU standard Vietnam standard
1 Soil (mg/kg) 1.30 0.625 ± 0.339 - 0.1 2 Groundwater (µg/L) 19.1 5.08 ± 3.81 0.1 - 3 Grapes (mg/kg) 0.14 0.041 ± 0.054 0.1 0.1
Glyphosate residues in soil exceeded 5 - 13 times higher than the allowable level of the Vietnam standard,
QCVN 15: 2008/BTNMT, exceeded 10 - 191 times compared with 0.1 (µg/L) of the EU allowable standard in
groundwater. Two grape samples had glyphosate residue levels higher 1.4 times compared with the EU
allowable limit. This is a serious warning for policy makers and authorities in Vietnam.
3.2.1. Exposure assessment
Eq(3) – Eq(5) were applied to calculate CDI for three groups (adults, children 6 – 12 years old and 1 – 6 years
old) with two cases, the greatest risk (Cmax) and average risk (Caverage) throughout life for carcinogens.
The results in Table 2 show that exposure concentrations of glyphosate through gastrointestinal from the use of
contaminated groundwater and grapes were highest in the adult group and lowest in the 1 – 6 years old group.
Specifically, the exposure concentration in the adult group ranges from 7.48 to 66.5 times higher than the lowest
group. The reason is that adults contact directly with groundwater for crop cultivation, breath glyphosate polluted
air through spraying, and eat more grape than children. Exposure concentrations by three pathways at maximum
concentrations were 2.1 to 3.4 times higher than average concentrations. The main entry pathway of glyphosate
into the human body is through the use of groundwater, followed by contact with contaminated soil and the use
of grapes.

Page 35
Table 2: Glyphosate exposure concentrations through gastrointestinal from soil, groundwater and grapes
Exposure pathway Soil (CDIs) (mg/kg/d)
Groundwater (CDIdw) (mg/kg/d)
Grapes (CDIp) (mg/kg/d)
Exposure residents Cmax Caverage Cmax Caverage Cmax Caverage
Children 1-6 years old 3.83×10⁻⁴ 1.84×10⁻⁴ 0.0298 0.00794 1.58×10⁻⁵ 4.59×10⁻⁶ Children 6-12 years old 1.27×10⁻⁴ 6.09×10⁻⁵ 0.0395 0.0105 1.51×10⁻⁴ 4.39×10⁻⁵ Adults 3.59×10⁻⁴ 1.72×10⁻⁴ 0.2230 0.0594 1.05×10⁻³ 3.05×10⁻⁴
3.2.2 Risk assessment
The results of risk assessment through gastrointestinal are presented in Table 3.
Table 3: The characteristics of cancer risk of glyphosate through gastrointestinal at a high risk
Residents R (Risk) - Cmax R (Risk) – Caverage Comment
The characteristics of cancer risk of glyphosate through gastrointestinal from groundwater (Rgroundwater)
Children 1-6 years old 1.85*10-5 4.92*10-6 Cancer risk in average level, may not need to be
reduced, need more research Children 6-12 years old 2.45*10-5 6.52*10-6
Adults (Farmers) 1.38*10-4 3.68*10-5 High risk, need to make solutions
The characteristics of cancer risk of glyphosate through gastrointestinal from three pathways (Rtotal risk)
Children 1-6 years old 1.87*10-5 5.04*10-6 Cancer risk in average level, may not need to be
reduced, need more research Children 6-12 years old 2.47*10-5 6.58*10-6
Adults (Farmers) 1.39*10-4 3.71*10-5 High risk, need to make solutions
The cancer risk of glyphosate through gastrointestinal from soil and grapes intake was low, acceptable, even in
the case of maximum concentrations.
The risk of glyphosate when ingested through groundwater from two groups of children in the case of moderate
concentrations is acceptable. However, in the case of maximum concentration at high risk level, there should
be preventive measures.
The pathway of glyphosate into the human body is likely to cause a high level of cancer risk through by using
groundwater, accounting for 98.3 - 99.3 % of the total risk. Through the results of toxicological and epidemiology
studies from previous studies, it is shown that people in the study area may have renal tubular carcinoma (Anh,
2016), rare liver cancer by the quickly destroyed DNA and chromosomes on animal cells (Luan, 2016), genetic
modification and high miscarriage in women (Thonprakaisang et al., 2013).
The highest health risk is identified for adults and the lowest group is 1 – 6 years old children. For adults, the
cancer risk is high, needs to make solutions to minimize. Glyphosate intake to adults though other contact
pathways (contaminated clothing, using bare hands when opening herbicides packing or rinsing bottles, direct
contact with polluted air, etc.) may increase the current level of risk. These results provide an assessment
method and the risk levels can be referenced as a comparative value when conducting different solutions.
4. Conclusion
The survey results of 12 grape farms in Tuy Phong district showed that all farms used herbicides with
glyphosate. Farmers here rinsed and discharged diluted water directly into the soil and surface water.
Glyphosate residues were found much higher than the allowable standard in soil, groundwater, and grapes,
especially 10 – 191 times higher than the EU allowable standard for all 12 groundwater samples.
The cancer risk of glyphosate from soil and grapes for all three groups was low, acceptable, even in the case of
maximum concentrations. The pathway of glyphosate into the human body is likely to cause a high level of
cancer risk through by using groundwater, accounting for 98.3 - 99.3 % of the total risk to adults. Children due
to less work in the grape farms, the risk is only average level, more research is needed.
Vietnamese regulatory authorities, especially the Ministry of Natural Resources and Environment, need to
establish standards to control glyphosate in the environment and food, improve the quality of agricultural and
food products and protect human health. Groundwater for agriculture in here needs treating in proper methods
and controlling water quality before usage.

Page 36
References
Anh D.N., 2016, Controversy about the carcinogenic risk of glyphosate, Vietnam Journal of Science
<www.vjsonline.org/news/tranh-c%C3%A3i-v%E1%BB%81-nguy-c%C6%A1-g%C3%A2y-ung-
th%C6%B0-c%E1%BB%A7a-glyphosate> accessed 16.05.2018.
AOAC International, 2000, AOAC Official Method 2000.05, Determination of glyphosate and aminomethyl
phosphonic acide (AMPA) in crop.
Center for food safety, 2015, Glyphosate and cancer risk: Frequently asked questions
<www.centerforfoodsafety.org/fact-sheets/3920/glyphosate-and-cancer-risk-frequently-asked-questions>
accessed 12.04.2019.
Department of Health, 2017, Toxicological summary for glyphosate, Health based guidance for water, Health
Risk Assessment Unit, Environmental Health Division.
EU scientists advise higher safety limits on glyphosate weedkiller <www.euractiv.com/section/science-
policymaking/news/eu-scientists-advise-higher-safety-limits-on-glyphosate-weedkiller/>accessed
05.03.2019.
Luan N.C., 2016, Carcinogenic herbicides – glyphosate usage: How to understand correctly
<ruybangtim.com/thuoc-diet-co-gay-ung-thu-glyphosate-nhung-dieu-can-hieu-dung/>accessed 24.03.2019.
Mladinic M., Berend S., Vrdoljak A., Kopjar N., Radic B., Zeljezic D., 2009, Evaluation of genome damage and
its relation to oxidative stress induced by glyphosate in human lymphocytes in vitro, Environmental and
Molecular Mutagenesis, 50(9), 800-807.
Nam T.V., Thao T.T.P., Thu P.T.X., 2018, Effect of the use and glyphosate residues in grape growing farms in
Binh Thuan province, Proceedings of Conference of Science and Technology 2018 – HUTECH, Science
and Technology Publisher.
Nam T.V., Tam L.V., 2018, Developing method to determine glyphosate content by GC-MS/MS method,
Application to evaluate glyphosate residues in the environment and food, Conference "Impact of
environment, labor and nutrition on health", Ministry of Science and Technology Vietnam.
Pinedo J., Ibanez R., Irabien A., 2012, Risk assessment of total petroleum hydrocarbons (TPHs) factions,
Chemical Engineering Transactions, 28, 61–66.
The Council of the European Union, 1998, Council Directive 98/83/EC on the quality of water intended for human
consumption, 32-54.
Thompson D.G., Crowell J.E., Daniels R.J., Staznik B., MacDonald L.M., 1989, Liquid chromatographic method
for quantitation of glyphosate and metabolite residues in organic and mineral soils, stream sediments,
Journal of the Association of Official Analytical Chemistry, 72(2), 355-360.
Thongprakaisang S., Thiantanawat A., Rangkadilok N., Suriyo T., Satayavivad J., 2013, Glyphosate induces
human breast cancer cells growth via estrogen receptors, Food and Chemical Toxicology, 12, 129-136.
Tran L.T.H., 2008, Health risk assessment and ecological risk assessment, Scientific and Technical Publisher,
Ho Chi Minh City, Vietnam.
US EPA, 2016, Glyphosate issue paper: Evaluation of carcinogenic potential, EPA’s Office of Pesticide
Programs.
US EPA, 2017, Glyphosate, Draft Human Health Risk Assessment in Support of Registration Review, United
States Environmental Protection Agency, Washington D.C.
Vogel G, 2015, Popular herbicide doesn’t cause cancer, European Union agency says, Science.

Page 37
Proceedings of
The 5th International Conference on Low Carbon Asia & Beyond - ICLCA 2019 &
The 4th International Conference on Chemical Engineering, Food and
Biotechnology - ICCFB 2019
Vietnam, Malaysia
ISBN: 978-604-67-1372-2
Synthesis Nano- Xonotlite from Rice Husk Ash
Tran Tan Viet*, Tran Thi Thuy Hang, Truong Thi Thuy
Ho Chi Minh City University of Technology, 268 Ly Thuong Kiet Dist.10 Hochiminh City Vietnam
Nano- Xonotlite, (Ca6Si6O17(OH)2) material was prepared from rice husk ash, as the source for SiO2 and CaO
using sol-gel method. Rice husk ash after pre-treatment and CaO powder was mixed together in 100ml distilled
water with vatious molar ratio of rice husk ash/CaO. The mixed solution was place in the autoclave and heated
at 200°C for 10 hours. From the XRD results, molar ratio Ca / Si = 0.7 exhibited that xonotlite is the major phase.
The xonotlite crystals have a fairly uniform length from 5µm - 8µm and the thickness are 10-15 nm was obtained
at this condition. In addition, some analysis method have been conducted such as TGA, FT-IR, SEM, TEM to
investigate the characteristic of this material.
1. Introduction
Synthesis of calcium silicate hydrate under the hydrothermal condition has been extensively studied to
manufacture some functional materials. Under different hydrothermal conditions, varieties of calcium silicate
hydrate with different structures can be prepared, such as amorphous calcium silicate hydrate and crystalline
calcium silicate hydrate (CCSH). Amorphous calcium silicate hydrate, for example, calcium silicate hydration
gel (C-S-H gel), consists of monomer silicate anions with silanol groups (Spudulis et al., 2013). Crystalline
calcium silicate hydrate, for example, tobermorite and xonotlite, is built up of layers of Ca polyhedra and
condensed by wollastonite - type silicate chains on both sides. These materials are widely used in electric power,
metallurgy, petroleum, chemical, building materials in the fields of furnace, piping, reactor and other insulation.
The use of insulation materials in the world is being considered and growing more and more, especially for
markets with large consumption demand such as USA, Japan, China, Germany, etc. The technology of
producing high-temperature and non-baked materials has been known since the 1920s, when the product was
an autoclave concrete. Studies have shown that the structure of high pressure and high temperature concrete
materials is predominantly in the form of tobermorite. However, with this structure, the autoclave concrete
material has the disadvantages of low critical temperature, high hardness, easy to crack. So researchers have
found the structure of a new CCSH material is also produced under similar conditions, but in addition to the
typical tobermorite structure is xonotlite mineral structure. The formation of these minerals is mainly based on
the CaO/SiO2 ratio of the material involved, the temperature and the pressure of the production process.
An important material for synthesizing CCSH is a silica source that determines the quality and cost of
synthetic materials. For Vietnam, the source of silica from rice husk ash is an agricultural waste product with a
huge annual reserve generated from the heating of rice husk, which will be a suitable source of materials for the
insulation industry Because of abundant reserves, stable quality, low cost. However, the exploitation of this
material source still has many disadvantages that need to be researched to be able to be applied to industrial
production. In this study, nano- xonotlite material was prepared from rice husk ash, as the source for SiO2 and
limestone, source for CaO using sol-gel method under specific hydrothermal conditions and samples were
characterized by several methods.
2. Material and Methods
2.1 Material
Rice husk was collected at Vinh Bình, An Giang province, Vietnam. Amorphous silica was synthesis from rice
husk ash by precipitation method. NaOH, HCl was purchased from Sigma-Aldrich

Page 38
2.2 Method
a) Synthesis silica form rice husk ash
First, a mixture of rice husk ash and 1.5 N HCl was applied in a reactor at 90°C to remove the metal oxide.
The rice husk ash and diluted acid are then filtered, washed several times with distilled water and dried to
prepare the silica extraction. 10g rice husk ash was treated with diluted acid with 100 ml NaOH 3N in a 3-neck
flask at 90°C to extract silica from rice husk ash. Then to the gelatinization stage, during the gelatinization
process, it is necessary to add 2.5- N HCl solution and mix well at room temperature to ensure that the
precipitated silica particles have sufficient time to coagulate with to form a long chain silica. After the silicate gel
solution is completely gelatinized, the silica gel mixture will be aged at 50°C for 20 hours for complete gelation
and stable stabilization of the silica molecule. Silica has an amorphous structure obtained after the silica gel is
filtered, washed several times with distilled water to dissolve the NaCl salts produced during gelatinization and
drying at 120oC for 24 hours.
b) Synthesis CCSH
The nano-xonotlite crystals were prepared by hydrothermal reaction in autoclave with different molar ratio
C/S equal to 0.7, 1.0, 1.5. According to the reaction between CaO and SiO2 by hydrothermal method, the water:
solids ratio of the mixture is approximately 15:1. The reaction were conducted in the Teflon reactor. Put teflon
reactor into the autoclave and heated at different temperatures of 10h to investigate the formation of post-
reaction xonotlite minerals. After that, the autoclave was cooled to room temperature quickly. The specimens
were removed from Teflon reactor and then washed with distilled water several times. The powdered xonotlite
obtained after the sample was dried at 105°C for 6h.
3. Results and discussion
CCSH materials was synthesized at vary different molar ratio Ca/Si to assess the effect of this parameter
on the formation of CCSH. The molar ratio of the mixture of materials used in all syntheses was provided in
Table 1:
Table 1. Synthesis sample at different Ca/Si ratio.
Sample Molar ratio Ca/Si Temperature, time
M1 0.7 200o
C, 10h
M2 1.0 200o
C, 10h
M3 1.5 200o
C, 10h
Material properties were analyzed by analytical methods such as X-ray diffraction analysis (XRD), FT-IR,
scanning electron microscope analysis (SEM), transmission electron microscope (TEM), thermalgravimetric
analysis (TGA)
3.1 X-ray diffraction analysis (XRD)
The XRD diffraction analysis method is used to determine the composition of the crystal formations that may
be present in the post-synthesis material. The main compounds are observed in Fig. 1 is xonotlite and
tobermorite mineral. Sample M1 with hydrothermal in condition 200 oC, 10h at C/S molar ratio is 0.7 has the
appearance of Ca(OH)2 remain at angle 2θ = 34.078 o, 54.351 oBesides that, peak CaCO3 remain appears
with very small intensity at angle 29.378o. As can be seen in Fig. 3-4, xonotlite and tobermorite are also the
main mineral but they has very low intensity, and the signal of peaks is broader then its of sample M1. The
powder synthesized under C/S molar ratio at 1.0 has signal of CaCO3 at angle 2θ = 25o, 27o, 32.9 o, 47.2 o, 48.42
o Furthermore, peak of Foshagite mineral appear at 27.29o and signal of Afwillite at 44o. Data of Fig. 3
represents for sample M3 with C/S molar ratio of 1.5, the main substance is Ca(OH)2 and CaCO3. But, the data
has peak Xonotlite at 49.573o, Tobermorite at 300 angle. Following the increasing of C/S molar ratio, intensity
of peak of CCSH mineral has decreased. With XRD results of sample M1, xonotlite insulation material was
synthesized at 200oC with Ca/Si ratio = 0.7, water/solid ratio = 15 in 10h completely corresponding to XRD
results of the sample taken in 4h by Edmundas Spudulis and colleagues (Spudulis et al., 2013). However, the
results of XRD peaks were much lower than the results of XRD peak in this research, because the reaction time
they conducted only lasted 4 hours compared to 8 hours of the sample M1. The fact that, the molar ratio of Ca/Si

Page 39
has significant effect on the formation of CCSH. With the molar ratio of Ca/Si equal to 0.7, CCSH material as
tobermorite and xonotlite are forming successfully. When increasing this ratio, xonotlite and tobermorite mineral
have decreased intensity.
3.2 Thermalgravimetric Analysis
The CCSH synthesized under conditions of Ca/Si equals to 0.7 is confirmed as well by the data of thermal
analysis for the sample M1, which are provided in Fig. 4. Initially, at the start of the analysis site, the temperature
was about 35 °C, the sample mass was 100%. The TG curve of specimen M1 presents that there was amount
of weight loss in specimen when heat up to 800 °C by 8.379% total. DTG curve presents the peak at 55.16 °C,
there is presumably resulted from the loss of bound and free water, which is observed of temperature from 50-
150 oC. At 431.14 oC, there is presumably resulting from decomposition of Ca(OH)2. The volume of samples
continued to decrease when heating from 600 to 700°C, and received a peak heat at 643.11 °C. At this
temperature the dehydration of the crystal begins to occur, which is a typical process of xonotlite before being
completely transformed into wollastonite. This proves that the sample being analyzed is mainly xonotlite. The
presence of not only xonotlite, but also of tobermorite in the sample M1 is shown by exothermal effect of
crystallization of wollastonite with its maximum at 781.58 °C (Vakifahmetoglu, 2014).
Figure 1. XRD pattern of sample M1 with molar ratio Ca/Si = 0.7

Page 40
Figure 2. XRD pattern of sample M2 with molar ratio Ca/Si = 1.0
Figure 3. XRD pattern of sample M3 with molar ratio Ca/Si= 1.5
Figure 4. TGA analysis of sample M1
3.3 Fourier Transform Infrared Spectroscopy (FT-IR) Analysis
Figure 5. FT-IR analysis of sample M1

Page 41
The result of infrared spectrum analysis of sample M1 is show in Figure 5. The occurrence of oscillating signals
of OH- groups of adsorbed water at 3445.43 cm-1 and oscillation of water molecules adsorbed at the material
surface at 1635.16 cm-1. The results were compared with photos of infrared spectra of natural xonotlite, a sharp
signal of oscillation OH- at 3613.29 cm-1 characteristic for OH- group adsorbed of natural xonotlite (a small
amount) (Haastrup et al., 2014). The Si-O elongated oscillation bands are set at 973.5 cm-1, with a shoulder at
1202.54 cm-1 (peak at 1202.54 cm-1 is the characteristic peak of the SiO2 double chains in xonotlite (Shaw et
al., 2000)). Si-O-Si bending oscillator is placed at 671.31 cm-1 strip. Carbonate impurities CO3-2 in the natural
spectrum 11 tobermorite is detected by a wide band at 1454.13 cm-1 (Chen et al., 2017). Infrared spectra of
reactive samples in 10 hours have quite correlated results with the infrared spectrum of natural xonotlite.
However, there are still indications of calcite impurities in the sample corresponding to the peaks in the
tobermorite infrared spectrum in negligible amounts. Spectral results also showed that the OH group appeared
on the surface of the material at the peak of 1635 cm-1, but the peaks were not sharp, so it was impossible to
conclude that the water-absorbing material was weak or strong.
3.4 Scanning Electron Microscopy – SEM
Samples M1 with molar ratio Ca/Si = 0.7 give the most uniform xonotlite fibers, the xonotlite fibers were clearly
shaped. The phenomenon of spherical agglomeration remains but not much, this indicates tobermorite mineral
exist in the sample. The fibers of crystal are long and some of them have a typical needle of the xonotlite mineral
crystal. The crystals have a fairly uniform length from 5µm - 8µm.
Figure 6. SEM image of calcium silicate in sample M1 with magnification of 5000 (left) and 15000 (right)
3.5 Transmission Electron Microscopic (TEM) Analysis
With the image of SEM scan, the morphology of difference types of CCSH are not clearly. The following TEM
images show obviously the thickness and length of calcium silicate phases. In Fig. 7, there are two type of
CCSH mineral. The thicker crystalline is presumably as tobermorite, and the needle-like rod is xonotlite mineral.
Some agglomerated sphere can be CaO excessive. Following Fig. 8, the thickness of xonotlite are 10-15 nm
and the thickness of tobermo`rite are 85-90 nm.

Page 42
Figure 7. TEM images of calcium silicate in sample M1 with magnification of 10000 (left) and 30000 (right)
Figure 8. TEM images of calcium silicate in sample M1 with magnification of 5000 (left) and 100000 (right)
4. Conclusions
The nano xonotlite were successfully synthesized from treated rice husk ash and limestone by hydrothermal
method at 200 °C with molar ratio Ca / Si = 0.7. The molar ratio of Ca/Si plays an important role in the formation
of CCSH during hydrothermal reaction. When increasing this ratio, xonotlite and tobermorite mineral have
decreased. In the best reaction condition (200 °C with molar ratio Ca / Si = 0.7, reaction time =10h) the thickness
of xonotlite are 10-15 nm and the thickness of tobermorite are 85-90 nm.
References
Chen, M., Lu L., Wang S., Zhao P., Zhang W., and Zhang S., 2017, Investigation on the formation of tobermorite
in calcium silicate board and its influence factors under autoclaved curing, Construction and Building
Materials, 143: 280-88.
Haastrup S., Yu D., and Yue Y., 2018, Impact of minor iron content on crystal structure and properties of porous
calcium silicates during synthesis, Materials Chemistry and Physics, 205: 180-85.
Shaw S., Henderson C., and Komanschek B., 2000, Dehydration/recrystallization mechanisms, energetics, and
kinetics of hydrated calcium silicate minerals: an in situ TGA/DSC and synchrotron radiation SAXS/WAXS
study, Chemical Geology, 167: 141-49.
Spudulis E., Šavareika V., and Špokauskas A., 2013, Influence of hydrothermal synthesis condition on xonotlite
crystal morphology, Materials Science, 19, 190-96.
Vakifahmetoglu C., 2014, Zeolite decorated highly porous acicular calcium silicate ceramics, Ceramics
International, 40, 11925-32.

Page 43
Proceedings of
The 5th International Conference on Low Carbon Asia & Beyond - ICLCA 2019 &
The 4th International Conference on Chemical Engineering, Food and
Biotechnology - ICCFB 2019
Vietnam, Malaysia
ISBN: 978-604-67-1372-2
ISBN 978-88-95608-67-9; ISSN 2283-9216
Technological Confidence of Higher Education Institutions
(HEIs) Towards e-Learning
Rhoda M. Lilan*, Jhonalyn G. Bautista
Don Mariano Marcos Memorial State University, Bacnotan, La Union, Philippines
This paper investigated how different individual- teachers and students, pertaining to their technological
confidence in their ICT skills towards e-Learning readiness. The data were gathered from selected six Higher
Educational Institutions in La Union, Philippines (n=1800) through an online survey questionnaire from August
2018 to October of 2018. Results revealed that the mean perception of teacher respondents (4.47) was
significantly higher than that of the student respondents (4.21). Nevertheless, both respondents perceived that
there was very high technological confidence of HEIs in the province as to their basic computer skills,
internet/online skills and use of software applications. This implicated that teachers are working into a way of
teaching students the easiest way through the integration of technologies and innovations towards teaching.
However, the used variables could explain only little of the variance indicating that these predictors might not
be the most relevant factors in the implementation of e-Learning in the province. Despite these challenges,
Higher Educational Institutions in La Union are progressing beyond simple technology applications to leveraging
and embedding various sources of online pedagogy, social, and collaborative Internet learning solutions for
learning and educational purposes.
1. Introduction
Knowledge and expertise are key elements to success. To remain competitive and profitable, organizations thus
require a workforce that is rapidly updated with new knowledge and skills, and one way of ensuring this is to
use various e-learning solutions.
The concept of technology confidence can be based from the work of Bandura (1997) on the concept of self-
efficiency. Thus, technology confidence refers both to the teachers’ perceived likelihood of success on using
ICT for educational purposes and on how far the students perceives success as being under the control of his
or her teacher. According to the research of Keller (1987), which also based on the concept of Bandura (1997),
confidence has different components: interest (refers to the attention factors in the environment; relevance
(refers to goal-oriented activities); expectancy (refers to one’s own expectation for learning).
The growth of technology addresses the gaps in teaching and learning. E-learning is the use of technology to
enhance teaching and learning activities. Technology-based e-learning encompasses the use of the internet
and other important technologies to produce materials for learning, teach learners, and also regulate courses in
an organization (Fry, 2001).
According to Tao, et al., (2006), e-Learning as a new platform for learning, centered on electronic networks has
allowed learners to receive individualized support and also to have learning schedules that is more suitable to
them as well as separate from other learners. This facilitates a high interaction and collaboration level between
instructors or teachers and peers than traditional environment for learning. As information technology (IT) becomes more robust and easier to use, it increasingly permeates academic
activities in higher education. The use of technology in education, commonly defined as e-learning, has become
a standard component in many courses. Technology applications are not limited to the classroom. They are
also replacing some classroom sessions with virtual sessions or fully replacing classroom courses with online
courses. E-learning in academics which is characterized by the use of multimedia constructs will make the
process of learning more interesting and enjoyable (Liaw and Huang, 2003).
.

Page 44
The use of educational technologies to improve services, quality, and opportunities for learning has been
evolving steadily over the last three decades. E-Learning has grown remarkably in numbers of applications,
diversity of technologies and variety of pedagogies. The development and integration of new instructional
strategies and tools for learning have brought about fundamental changes in the way educators approach
teaching and students approach learning.
In today’s educational environments, teachers and students easily access to computers. To integrate technology
into education, teachers’ as well as students’ acceptance and skills of using computers is particularly vital.
Transforming the traditional educational practices through e-Learning seems very distant in many developing
countries because educational institutions of higher learning are constrained by information and communication
technology (ICT) infrastructure and general trends of inadequate structural support and incentives (Bhuasiri, et
al., 2012).
To meet the needs of all stake holders, educational institutions endeavour to the advances in web-based
learning (Lion, 2010). In 2012, the Commission on Higher Education (CHED) of the Philippine Government thru
its CHED Memorandum Order No. 46, ordered the promotion and adoption of learner-centered learning. Higher
Education Institutions in the Philippines were mandated to change the curriculum to Outcomes-Based
Education. This is the essence of e-Learning. This initiative is promising but issues arise on the readiness of
state universities and colleges in adopting such change. Thus, this paper aimed to determine the technological
confidence of students and teachers’ readiness towards e-Learning and test the significant difference of their
responses.
2. Related Literatures
E-learning is a rich and multifaceted concept, as it is the endowment of education and training via the World
Wide Web for students. Within these higher educations, virtual learning environments (VLE), learning
management systems (LMS), web-based trainings (WBT) and other E-learning applications and educational
technologies are accessible to all type of individuals. Agendas of schools and educational institutions have
recognized e-Learning as having the prospect to transform people, knowledge, skills and performance.
The previous work of Sangra, et al. (2012) defined e-Learning as an approach to teaching and learning,
representing all or part of the educational model applied, that is based on the use of electronic media and
devices as tools for improving access to training, communication and interaction and that facilitates the adoption
of new ways of understanding and developing learning. Moreover, Alonso, et al. (2005) stressed that e-Learning
as the use of new multimedia technologies and the Internet to improve the quality of learning by facilitating
access to resources and services, as well as remote exchange and collaboration can also its definition.
The utilization of e-learning, organizational learning, and knowledge management leads to the improved
organizational success in the growing knowledge economy. The appropriateness of e-learning, organizational
learning, and knowledge management is influential for the learning organizations to serve practitioners and
researchers, increase business performance, sustain competitiveness, and fulfil expected accomplishment in
the learning organizations (Kasemsap, 2016).
Ala-Mutka (2011) believed that technologies are increasingly being used in society and the economy, and this
is transforming ways of working, studying, communicating, accessing information, or spending leisure time,
among others. Internet and especially social technologies are used for various purposes by different groups of
citizens and are also being appropriated for new social activities. Through online spaces, citizens can access
resources, follow, interact, and create and share with other people globally. People from all age groups are
participating in different types of online networked activities, which can support work, learning and citizenship.
Thus, the author of this paper believed that students as well as teachers’ technological confidence are factors
to be considered in the success towards e-Learning implementation in Higher Education Institutions in La Union.
3. Methodology
This study made use of the descriptive design method of research to describe the perception of the respondents
in terms of HEIs e-learning technological confidence readiness. This design is considered appropriate in this
study because it enabled the researchers to gather information that could achieve on the objectives and goals
of the study through the standardized collection procedures based on highly structured research instruments
and well-defined study concepts and related variables. This assessment was achieved by the use of an online
survey-questionnaire. To avoid bias information obtained from the respondents, the researchers equally divided
the respondents’ specialization from IT and non-IT for both teachers and students. The study covered six (6)
HEIs in the province of La Union, Philippines namely: Don Mariano Marcos Memorial State University
(DMMMSU) - North La Union Campus, DMMMSU - Mid La Union Campus, DMMMSU - South La Union
Campus, Saint Louis College, Lorma Colleges and Union Christian College from August 2018 to October 2018.
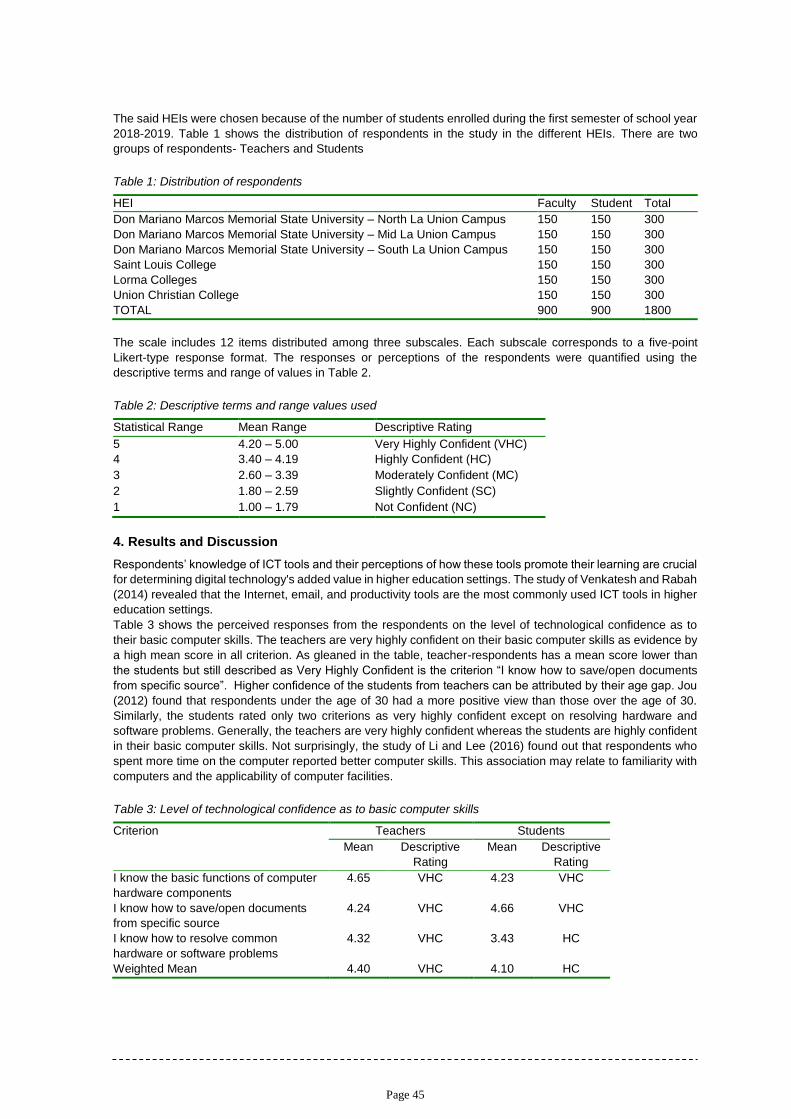
Page 45
The said HEIs were chosen because of the number of students enrolled during the first semester of school year
2018-2019. Table 1 shows the distribution of respondents in the study in the different HEIs. There are two
groups of respondents- Teachers and Students
Table 1: Distribution of respondents
HEI Faculty Student Total
Don Mariano Marcos Memorial State University – North La Union Campus 150 150 300
Don Mariano Marcos Memorial State University – Mid La Union Campus 150 150 300
Don Mariano Marcos Memorial State University – South La Union Campus 150 150 300
Saint Louis College 150 150 300
Lorma Colleges 150 150 300
Union Christian College 150 150 300
TOTAL 900 900 1800
The scale includes 12 items distributed among three subscales. Each subscale corresponds to a five-point
Likert-type response format. The responses or perceptions of the respondents were quantified using the
descriptive terms and range of values in Table 2.
Table 2: Descriptive terms and range values used
Statistical Range Mean Range Descriptive Rating
5 4.20 – 5.00 Very Highly Confident (VHC)
4 3.40 – 4.19 Highly Confident (HC)
3 2.60 – 3.39 Moderately Confident (MC)
2 1.80 – 2.59 Slightly Confident (SC)
1 1.00 – 1.79 Not Confident (NC)
4. Results and Discussion
Respondents’ knowledge of ICT tools and their perceptions of how these tools promote their learning are crucial
for determining digital technology's added value in higher education settings. The study of Venkatesh and Rabah
(2014) revealed that the Internet, email, and productivity tools are the most commonly used ICT tools in higher
education settings.
Table 3 shows the perceived responses from the respondents on the level of technological confidence as to
their basic computer skills. The teachers are very highly confident on their basic computer skills as evidence by
a high mean score in all criterion. As gleaned in the table, teacher-respondents has a mean score lower than
the students but still described as Very Highly Confident is the criterion “I know how to save/open documents
from specific source”. Higher confidence of the students from teachers can be attributed by their age gap. Jou
(2012) found that respondents under the age of 30 had a more positive view than those over the age of 30.
Similarly, the students rated only two criterions as very highly confident except on resolving hardware and
software problems. Generally, the teachers are very highly confident whereas the students are highly confident
in their basic computer skills. Not surprisingly, the study of Li and Lee (2016) found out that respondents who
spent more time on the computer reported better computer skills. This association may relate to familiarity with
computers and the applicability of computer facilities.
Table 3: Level of technological confidence as to basic computer skills
Criterion Teachers Students
Mean Descriptive
Rating
Mean Descriptive
Rating
I know the basic functions of computer
hardware components
4.65 VHC 4.23 VHC
I know how to save/open documents
from specific source
4.24 VHC 4.66 VHC
I know how to resolve common
hardware or software problems
4.32 VHC 3.43 HC
Weighted Mean 4.40 VHC 4.10 HC
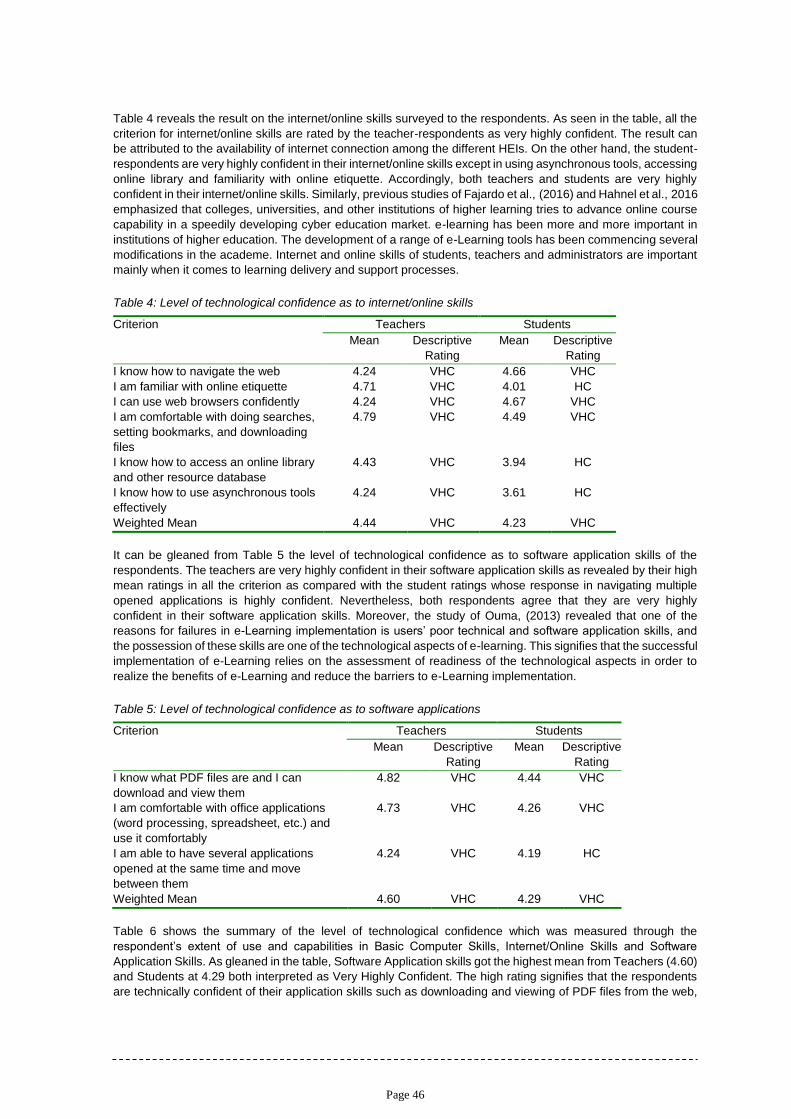
Page 46
Table 4 reveals the result on the internet/online skills surveyed to the respondents. As seen in the table, all the
criterion for internet/online skills are rated by the teacher-respondents as very highly confident. The result can
be attributed to the availability of internet connection among the different HEIs. On the other hand, the student-
respondents are very highly confident in their internet/online skills except in using asynchronous tools, accessing
online library and familiarity with online etiquette. Accordingly, both teachers and students are very highly
confident in their internet/online skills. Similarly, previous studies of Fajardo et al., (2016) and Hahnel et al., 2016
emphasized that colleges, universities, and other institutions of higher learning tries to advance online course
capability in a speedily developing cyber education market. e-learning has been more and more important in
institutions of higher education. The development of a range of e-Learning tools has been commencing several
modifications in the academe. Internet and online skills of students, teachers and administrators are important
mainly when it comes to learning delivery and support processes.
Table 4: Level of technological confidence as to internet/online skills
Criterion Teachers Students
Mean Descriptive
Rating
Mean Descriptive
Rating
I know how to navigate the web 4.24 VHC 4.66 VHC
I am familiar with online etiquette 4.71 VHC 4.01 HC
I can use web browsers confidently 4.24 VHC 4.67 VHC
I am comfortable with doing searches,
setting bookmarks, and downloading
files
4.79 VHC 4.49 VHC
I know how to access an online library
and other resource database
4.43 VHC 3.94 HC
I know how to use asynchronous tools
effectively
4.24 VHC 3.61 HC
Weighted Mean 4.44 VHC 4.23 VHC
It can be gleaned from Table 5 the level of technological confidence as to software application skills of the
respondents. The teachers are very highly confident in their software application skills as revealed by their high
mean ratings in all the criterion as compared with the student ratings whose response in navigating multiple
opened applications is highly confident. Nevertheless, both respondents agree that they are very highly
confident in their software application skills. Moreover, the study of Ouma, (2013) revealed that one of the
reasons for failures in e-Learning implementation is users’ poor technical and software application skills, and
the possession of these skills are one of the technological aspects of e-learning. This signifies that the successful
implementation of e-Learning relies on the assessment of readiness of the technological aspects in order to
realize the benefits of e-Learning and reduce the barriers to e-Learning implementation.
Table 5: Level of technological confidence as to software applications
Criterion Teachers Students
Mean Descriptive
Rating
Mean Descriptive
Rating
I know what PDF files are and I can
download and view them
4.82 VHC 4.44 VHC
I am comfortable with office applications
(word processing, spreadsheet, etc.) and
use it comfortably
4.73 VHC 4.26 VHC
I am able to have several applications
opened at the same time and move
between them
4.24 VHC 4.19 HC
Weighted Mean 4.60 VHC 4.29 VHC
Table 6 shows the summary of the level of technological confidence which was measured through the
respondent’s extent of use and capabilities in Basic Computer Skills, Internet/Online Skills and Software
Application Skills. As gleaned in the table, Software Application skills got the highest mean from Teachers (4.60)
and Students at 4.29 both interpreted as Very Highly Confident. The high rating signifies that the respondents
are technically confident of their application skills such as downloading and viewing of PDF files from the web,

Page 47
comfortable with the use of MS office applications, and can simultaneously open and move several applications
at the same time. However, basic computer skills got the lowest mean of 4.40 and 4.10 from the teachers and
student respondents respectively. Despite that they are the lowest, still they are interpreted as Highly Confident
and Very Highly Confident. The result revealed that respondents are skilled and knowledgeable in the basic
functions of computer component including saving/opening documents to/from a hard disk or other removable
storage device and skilled to resolve common hardware or software problems and can access a technical
support in case a problem is encountered. The level of technological confidence of result revealed that both the
teachers and students were rated as Very Highly Confident in all the key area indicators implying that the six
Higher Education Institutions in La Union are ready for e-Learning. The changes brought about with effective
use of technology will lead to new concepts and potential to improve higher education teaching and learning
process.
Table 6: Summary on the level of technological confidence
Criterion Teachers Students
Mean Descriptive
Rating
Mean Descriptive
Rating
Basic computer skills 4.40 VHC 4.10 HC
Internet/online skills 4.44 VHC 4.23 VHC
Software application skills 4.60 VHC 4.29 VHC
Weighted Mean 4.47 VHC 4.21 VHC
Table 7 presents the t-test using two sample assuming equal variances with alpha =.05. Result shows that the
computed t-value of 4.59 is higher than the critical t-value of 1.65 (one-tail) which implies that the mean
perception of teacher respondents was significantly higher than that of the student respondents (p=0.0000032)
Nevertheless, both respondents perceived that there was very high technological confidence of HEIs in the
province as to their basic computer skills, internet/online skills and use of software applications. Technological
confidence of both teachers and the learners is one of the important factors in the success of an e-learning
system because e-Learning, by definition, relies on the teacher and learner’s skills and access to technology.
Consequently, technological readiness can be seen as those factors that must be accomplished before e-
learning can be implemented such as the available hardware and software, whereby the successful
implementation of e-learning relies on a high level of ICT infrastructure readiness and users’ technical skill
readiness (Ouma ,2013).
Table 7: t-Test: Two sample assuming equal variances
Teachers Students
Mean 4.47 4.21
Variance 0.15 0.32
Observations 900 900
Pooled Variance 0.23
Hypothesized Mean Difference 0
Df 1798
t Stat 4.59
P(T<=t) one-tail 3.27
t Critical one-tail 1.65
P(T<=t) two-tail 6.55
t Critical two-tail 1.97
5. Conclusions
This study highlighted the significant relationship between teachers and students' e-Learning skills. Teachers
are more likely to be more technologically confident than those of the students. To integrate technology into
education, teachers’ as well as students’ acceptance and skills of using computers is particularly vital. So, it
would definitely be fascinating to integrate e-learning as a standard device in the instruction of university
students.
Understanding the perceptions of students and teachers concerning the usefulness of technology use and their
proficiency and knowledge of specific types of ICT tools are both influential and critical to the success or failure
of integration of ICT in higher education settings.

Page 48
Acknowledgments
The authors wish to thank all the respondents; the school administration and colleagues for the assistance.
References
Ala-Mutka K., 2011, Mapping digital competence: Towards a conceptual understanding, Publications Office of
the European Union.
Alonso F., Lopez G., Manrique D., Viñes, J., 2005, An instruction model for web-based e-Learning education
with a blended learning process approach, British Journal Education Technology, 217-235.
Bandura A., 1997, Self-efficacy: The exercise of control, New York: W.H. Freeman.
Bhuasin W., Xaymoungkhoun O., Zo H., Rho J.J., Ciganek A.P., 2012, Critical success factors for e-Learning
in developing countries: A comparative analysis between ICT experts and faculty, Computers and Education,
58(2), 843-855.
Dublin L., 2003, If you only look under the street lamps…or nine e-Learning myths, The e-Learning developers,
http://www.eLearningguild.com.
Fajardo I., Villalta E., Salmerón L., 2015, Are really digital natives so good? Relationship between digital skills
and digital reading, Anales De Psicología / Annals of Psychology, 32(1), 89-97, DOI:
https://doi.org/10.6018/analesps.32.1.185571
Fry K., 2001, e-Learning markets and providers: Some issues and prospects, Education Training 233-239.
Hahnel C., Goldhammer F., Naumann J., Kröhne U., 2016, Effects of linear reading, basic computer skills,
evaluating online information, and navigation on reading digital text, Computers in Human Behavior, 55,
486–500, DOI: https://doi.org/10.1016/j.chb.2015.09.042.
Kasemsap K., 2016, The roles of e-Learning, organizational learning and knowledge management in the
learning organizations, Civil and Environmental Engineering: Concepts, Methodologies, Tools, and
Applications, 1198-1228.
Keller J.M., 1987, Development and use of the ARCS model of instructional design, Journal of Instructional
Development, 10(3), 2-10.
Kurunasaari M., Tynjala P., Piirainen, A., 2018, Graduating physiotherapy students’ conceptions of their own
Competence, Vocations and Learning, 11(1), 1-18.
Li L.Y., Lee L.Y., 2016, Computer literacy and online learning attitude toward GSOE students in distance
Education Programs
Liaw S.S., Huang H.M., 2003, Exploring the World Wide Web for on-line learning: A perspective from Taiwan,
Educational Technology, 43(3), 27-32.
Lion R.W., Stark G., 2010, “A glance at institutional support for faculty teaching in an online learning
environment”, Educause Quarterly, 33(3), 23-39.
Ouma G., Awuor F., 2013, Evaluation of e-Learning readiness in secondary schools in Kenya, World Applied
Programming, 3(10), 493-503.
Railean E.A., 2016, Innovation and creativity in applied learning theory and design: A Frontier Research in
Pedagogy, Handbook of Research on Applied Learning Theory and Design in Modern Education.
Sangra A., Vlachopoulos D., Cabrera N., 2012, Building an inclusive definition of e-Learning: An approach to
the conceptual framework, International Review of Research in Open & Distance Learning, 13(2), 145-159.
Tao Y.H., Yeh C.R., Sun S.I., 2006, Improving training needs assessment processes via the internet: System
design and qualitative study, Internet Research, 16(4), 427-449.

Page 49
Proceedings of
The 5th International Conference on Low Carbon Asia & Beyond - ICLCA 2019 &
The 4th International Conference on Chemical Engineering, Food and
Biotechnology - ICCFB 2019
Vietnam, Malaysia
ISBN: 978-604-67-1372-2
ISBN 978-88-95608-67-9; ISSN 2283-9216
Simulation System of Butterfly Valves to Mix Ethanol and
Gasoline to Produce Gasohol using CFD SOLIDWORKS
Software
Ung Hai Tran*, Phat Duy Thanh Le
Ho Chi Minh City University of Technology, 268 Ly Thuong Kiet Dist.10 Hochiminh City Vietnam
Correspoding author: [email protected]
Production of biofuel such as gasohol and biodiesel require mixing and reacting equipment which should have
high efficiency, ease of installation, low capital and operation cost. Using cavitation phenomena is one of means
to achieve those. Butterfly valves which are cheap, available, wide operational range were chosen for the above
purposes. The turbulent flow and cavitation after butterfly valves were investigated using SOLIDWORKS CFD
software. The mixing performance of ethanol and gasoline streams to make gasohol with given concentration
was the target of this simulation. The output constrains were deviation in volume fraction, head pressure and
size of the system. The valve actuator’s angle, distance from ethanol intake pipe, the gap between valves and
valves’ relative position were chosen as variables. The simulation results proposed optimized configuration of
two butterfly valve for mixing gasoline and ethanol in 4” pipe system.
1. Introduction
Nowadays, a majority of energy from fossil fuel is experienced an increasing deplete due to the growing demand
of these fuels. The renewable biofuels such as biodiesel and gasohol become a cure for this problem. Biodiesel
production has been booming (Roslindawati et al., 2017). The enhanced oxygen content biodiesel will attain
greener emission in future (Phoon et al., 2017). The gasohol has also been broadly applied for better
sustainability and greener emission. Mixing ethanol and gasoline is one of key factors in producing gasohol.
There are many kinds of mixer like agitator, circulation pump, static mixer and noble gas stripping, in which
inline mixer shows much advantage because of simple structure, reliability of homogeneous concentration and
low power consumption. Inline mixer can use static mixer pipe, venturi pipe, and orifice plate. Using orifice plate
for this purpose shown good performance in both equipment and power consumption aspect (Ung et al., 2017).
In this simulation research, the system of two butterfly valves was used for mixing ethanol and gasoline. The
availability and low cost of butterfly valves promise high performance of this mixing system in producing gasohol
due to low installation cost, low power consumption, free of space and high mixing efficiency. Firstly, construction
and installation expenses depend on number of valves, length of pipes and consumed power of pump resulting
in reducing the cost by using as fewer valves as possible; moreover, shortened pipes are better for lower cost
of construction, operation and maintenance; costs of pump depending on the amount of required inlet hydraulic
pressure. Secondly, operation expenses include the pump power and maintenance. As the lower the installation
cost, the higher the operation cost because proper pumping section for better efficiency and higher required
inlet pressure. Therefore, balancing the two costs is one of the goals in this research. Thirdly, the size of the
equipment including pump, valves and pipes, are also essential for limited-space blending stations. As a result,
the size is considered to be a criterion of design. Lastly, mixing efficiency are the most crucial criteria. The
concentration of ethanol in gasohol in volume fraction must meet the specification after optimizing these
previous costs to ensure the quality of gasohol.

Page 50
2. Research methodology
The research was conducted in 2 phases: firstly, designing butterfly valve mixing system then secondly, fluid
flow simulation in SOLIDWORKS. The valve design is broken into many parts, including flange, body, upper
lever, lower lever, upper stem, lower stem, disc, rubber, opener-closer, lids, pipes, for sizing and calculating
purposes, then, the parts are drawn separately with precision. The designed parts are assembled to be a
complete butterfly valve by mates for joining the parts. Fluid flow simulation of the assemble: The assemble is
added the flow simulation package with desired conditions. The boundary conditions contain inlets volume flow
of gasoline and ethanol, and outlet pressure which is atmospheric pressure. Analysing results and calculating
for storage: results are tracking for pressure and concentration of gasoline through pipes’ length, then the
information is operated to create figures for research. Therefore, the process is optimized by different variables
and storage is designed by regulations.
The model was chosen among turbulence models such as Reynolds-averaged Navier–Stokes (RANS), Large
eddy simulation (LES), Detached eddy simulations (DES) which are most popular used models though there
are a few more method which are Direct numerical simulation, Coherent vortex simulation, Probability density
function (PDF) methods, Vortex method, Vorticity confinement method and Linear eddy model (Lumley, 1978).
Some models were tried as first then Reynolds-Averaged Navier-Stokes was used in this research.
There are many discretization methods like the finite volume method (FVM), the finite element method (FEM),
the finite difference method (FDM), the boundary element method and the spectral element method are common
approach used in CFD codes (Randall, 2002; Randall, 2007). The finite volume method was chosen based on
simulation performance. High-resolution schemes were used because shocks or discontinuities were present in
fluid flow after butterfly valves.
3. Results and discussion
3.1. Variables
There are many variables to be considered for optimizing that affect the goals: Disc’s rotation angle, Ethanol
inlet distance to valve, Volume fraction of ethanol, Velocity of fluid flow, Gap between two valves, Position angle
of the valve to each other and to the ethanol pipe. Matrices of sequences relating to these variables and goals
has been made. There are two outputs, which are the main concerns, need to be analysed: Volume fraction and
pressure. Volume fraction deviation charts show the pace of case study to converge to a desired state, this is
the most important value because it is the targeted efficiency of the system. Then, pressure graphs display the
inlet required pressure and pressure drop through valves, this determines the installation and operation costs
for pump system. In addition, sizing the system, which is mostly the length of pipe, is also essential due to the
conservation in space. Starting by a normal fluid flow of velocity of 2.5 m/s for gasoline in Pipe-3 ½ of which OD
is 4 in and velocity of ethanol depends on the chosen Ethanol/gasoline ratio of 20.
3.2. Results of one valve system
The advantages of a one-valve blending system are economical due to the low in installing cost and small
required area for placement. However, the head pressure may be higher than that of two-valve system,
moreover, the efficiency of blending may be lower. The typical pattern of flow pressure is shown in Figure 1.
The inlet pipe withstands the highest pressure of over 150000 Pa for instance. The first drop is due to the
charged ethanol, then, through valve, the second drop which is a vacuum pressure right after the valve is more
significant due to a free of bottleneck. Figure 1b shows the pattern of volume fraction trend line by pipe length.
(a) (b)
Figure 1: (a) 9d90o pressure drop by 20 trajectories; (b) Patterns of one-valve system typical volume fraction
trend line
Pre
ssure
[P
a]
Fra
ction o
f gasolin
e
Length [m] Length [m]

Page 51
(a) (b)
Figure 2: (a) Effects of valve’s angle and inlet distance to E number; (b) Deviation of volume fraction with various
velocity and pressure
In Figure 2a, the changes of inlet pressure are manipulated by various pairs of valve’s open degree and inlet
gap. With 20° open, the flows are unstable, result in different value of pressure with no specific rules. However,
when the valve is open to 30° and higher, flows are more stable and inlet pressure value remains approximately
the same despite inlet distance. From 40° and above, the pressure value stays at roughly 150000 Pa. In
summary, required inlet pressure considerably depends on open degrees, the lower the angle, the lower the
inlet pressure value. However, inlet distance is not a significant variable as there is little deviation in pressure of
the inlet pipe. Therefore, further studies will leave the inlet distance out of concern (fixed at 15 d), remaining
only the valve angle to be considered.
Figure 2b shows that all the combination of velocity and E-ratio meets a desired deviation of 0.01 at 4 m. As
shown on the line chart, the faster the flow, the lower the deviation due to the high load of particles. However,
differences in ethanol content have little influence on the volume fraction. Therefore, balancing the velocity could
be more efficient in the mixing process due to the restriction of inlet pressure required.
(a) (b)
Figure 3: (a) Deviation of volume fraction of gasoline for an inlet distance of 3d; (b) Volume fraction with actuator
of 50° and different inlet distances
In Figure 3a, taking a fixed inlet distance of 3d, various cases with open degrees are simulated. Throughout 11
m of pipe length, the deviation getting closer to 0, however, different open could change the pace of the
convergence. The higher of open angle results in the faster convergence to the desired volume fraction, which
decreases the deviation of approximately 0. Therefore, small open such as 20° and 30° could meet a deviation
of 0.02 at about 3 m long, while that of another open is dramatically higher, over 8 m for an openness of 80° to
converge to 0.02 for instance. The Figure 3b shows the convergence of volume fraction through the pipe’s
length, researched by different inlet distances with a constant open of 50°. Overall, the trend line is similar to
the previous graph, however, not much difference in each line in comparison. All the lines meet at 0.03 of
deviation values at 4 m of pipe length and converged at 11 m with an approximately same value of the deviation.
3.3. Results for two valves system
In Figure 4a, the first valve actuator is controlled as a constant while that of the second one is differed. As a
result, the volume fraction eventually converges to the desired value, however, there are various trends due to
a variety of valve angle combinations. The deviation of a 50°x40° has the quickest convergence rate, for
instance, while that of the 50°x70° is slower. Moreover, to reach a 0.002 deviation of volume fraction, the 40°
Inle
t P
ressure
[P
a]
Devia
tion
Devia
tion
Devia
tion
Length [m]
Ethanol inlet distance [d=4 inches]
Length [m] Length [m]

Page 52
meets the desired value at 6 m, followed by 7 m, 8 m and over 9 m of 50°, 60° and 70° of the second valve
angle respectively. In Figure 4b, changing the first valve open angle experience the same deal with that of the
first one. A 40°x50° combo will meet a deviation of 0.002 at nearly 6 m length, following by 50°x50°, 60°x50°
and 70°x50° in order of increasing in length.
Figure 4: (a) Volume fraction deviation by changes of actuator in the second valve; (b) Volume fraction deviation
with the changes of actuator in the first valve
In Figure 5a, inlet diameter is fixed at 15d, leaving the actuators of two valves are variables. As shown in the
chart, inlet pressure gradually decreased when valves are slowly opened. For example, with 40°-actuator of the
first valve, increasing the second valve degree will lower the pressure value, from about 190000 Pa for the
40°x40° case to over 150000 Pa for the 40°x70°. The same pattern happens when fixing the second valve
actuator, for instance, from approximately 190000 Pa of 40°x40° to just over 150000 Pa of 70°x40°. Due to
lower head pressure, a 50°x50° angle pair is chosen for further studies.
Figure 5: (a) Pressure affected by different actuators' angles of two valves; (b) Volume fraction affected by gaps
and actuators' angles
Figure 5b shows that two impressive line are 20d-50x60 (first valve 50° and second valve 60°) and 20d50x50.
As a result, the longer the gap could improve the efficiency for convergence, however, the system will take more
space to install. Therefore, the gap of 20 d and a 50x60 valve combination is chosen for further experiments.
The Figure 6a shows that although experiencing fluctuation, there is no significant change in terms of pressure
with this study. The highest pressure gap is about 170000 Pa, which belongs to the 40x50 of the gap 10d. In
summary, length could affect the volume fraction, but not for pressure. Rotating valves’ position can give better
result in mixing efficiency. While the 90°x0° could meet a deviation of 0.001 at only above 3 m, a combination
of 90°x90° could lower that value to even 1E-5. However, the 45°x0° is not as effective as the others as shown
in Figure 6b. Although there are significant changes in volume fraction convergence, the pressure seems stable
when valves are rotated. In Figure 7a, the biggest gap belongs to the 45°st with about 130 kPa for a 0°nd to
145 kPa when the second valve turn to 90°. The volume fraction of the 90° first valve is much better than others,
while the pressure is higher, which is up to over 145 kPa, however, not too considerable. Therefore, my decision
for the optimal position is 90°x0° as it has the most impressive efficiency. Figure 7b shows that the two-valve
system surpass the one-valve in blending efficiency by reaching 0.005 deviation of approximately 5 m, while
that of one-valve is at nearly 7 m.
Length [m]
Length [m]
(a) (b)
(a) (b)
Length [m] Actuator angle of the first valve
Devia
tion
Devia
tion
Pre
ssure
[P
a]
Devia
tion

Page 53
Figure 6: (a) Different gaps and valves' angle effect on fraction pressure; (b) Influence of valves positions to
volume deviation
Figure 7: (a) Valve positioning affects head pressure's value; (b) Volume fraction's comparisons of two valves
50°x60° and one valve 40°
3.4. Optimization
The pressure influenced by various actuators of two valves is as same pattern as previous results shown in
Figure 8a. While in Figure 8b, various combos of actuators in both valves are conducted. Two outstanding
combinations are 50°x50° and 50°x60°, which have nearly the same line trend. The two line could reach critically
low deviation, followed by the 50°x40°. It seems that the first valve with 50° is an optimum variable, while the
second valve could be 50° or 60° depending on the pressure inlet.
Figure 8: (a) Pressure influenced by various actuators; (b) Volume fraction deviation by different valves of two
valves angle
Figure 9a shows the comparison of pressure drop by 4 cases: the optimized 50°x60°, the normal 50°x60°, a
one valve 50° and one valve optimized 50°. The pressure declines from left to right, however, not a much in
(a) (b)
(a) (b)
(a) (b)
Length [m] Length [m]
Length [m] Second valve position
Length [m] First valve actuator
Pre
ssure
[P
a]
Devia
tion
Pre
ssure
[P
a]
Devia
tion
Pre
ssure
[P
a]
Devia
tion

Page 54
value. In terms of deviation as shown in Figure 9b, a one valve 50° is not much to be considered, while with an
optimum position of valve, the one-valve could reach the deviation of a two valves combination. Finally, the
ultimate combination is 50°x60° which could reach a desirable depth of deviation, 1E-5.
Figure 9: (a) Comparison of inlet pressure between one and two valves; optimized and normal positions; (b)
Comparison of volume fraction deviation between one and two valves; optimized and normal position
4. Conclusions
The ultimate goals are higher blending efficiency, lower the head pressure and reducing in length of the system.
By initial study, there are six factors affecting the goals which are a distance from inlet ethanol pipe to valve,
open angle of the disc, the gap between valves, E number, valve positioning and intake velocity. In the relations
between inlet distance and actuator angle, pressure is critically depended on the angle of the disc, the lower the
angle, the higher the pressure. Regarding volume fraction concentration, the value is still heavily influenced by
the disc’s angle, the lower the angle, the faster the convergence. In contrast, distance from inlet ethanol to the
valve is not as effective. To conclude, actuator angle has great impact on goals, but inlet distance is not. For
the influence of E number and gasoline velocity on mixing system, the results show that the higher the velocity,
the higher the pressure and the same matter for E number, however, the increasing pressure is not considerable.
With two-valve model, after fixing the value of the velocity, inlet distance and E number, the remaining variables
are two valves position, gap and open degree. The required pressure values should be acceptable in all cases
(lower than 200 kPa), therefore, the 50x50 pairs are as effective as other lower-degree pair, additionally, its
pressure is just above 140 kPa, thus, it was chosen. Furthermore, at 10d gap between two valves, the deviation
converges faster than that of the others. Therefore, the 10d was chosen as a fixed gap. One more reason is
that the size of the system should not be too large to be restricted in placement. The final study is on valves
position and there are two pairs of position are impressively optimum in volume fraction is the 90x90 and the
90x0. Regarding these two, the 90x0 has lower head pressure, so it becomes as an optimized position. Finally,
the simulation shows that the 50x60 has nearly the same pattern as that of 50x50 but with a lower inlet pressure.
Acknowledgments
We would like to thank Ho Chi Minh City University which funded this research and all colleagues supported us
to complete this study.
References
Anderson J.D., Wendt J., 1995, Computational fluid dynamics, 206, McGraw-Hill, New York.
Lumley J.L., 1979, Computational modelling of turbulent flows, In Advances in Applied Mechanics, 18, 123-176.
LeVeque R.J., 2002, Finite volume methods for hyperbolic problems, 31, Cambridge university press, UK.
LeVeque, R.J., 2007, Finite difference methods for ordinary and partial differential equations: Steady-state and
time-dependent problems, Society for Industrial and Applied Mathematics, Philadelphia.
Ung Hai Tran, An Quang Thieu, 2017, Fluid flow analysis under orifice mounted on pipeline for production of
gasohol in Vietnam, SEATUC.
Haron R., Mat R., Abdullah T.A.T., Rahman R.A., 2018, Overview on utilization of biodiesel by-product for
biohydrogen production, Journal of Cleaner Production, 172, 314-324.
Phoon L.Y., Mustaffa A.A., Hashim H., Mat R., Manan Z.A., Yunus N.A., 2017, Performance and emission
characteristics of green diesel blends containing diethyl-succinate and 1-octanol, Journal of Cleaner
Production, 161, 192-1202.
(a) (b)
Length [m] Valves combination
Pre
ssure
[P
a]
Devia
tion

Page 55
Proceedings of
The 5th International Conference on Low Carbon Asia & Beyond - ICLCA 2019 &
The 4th International Conference on Chemical Engineering, Food and
Biotechnology - ICCFB 2019
Vietnam, Malaysia
ISBN: 978-604-67-1372-2
ISBN 978-88-95608-67-9; ISSN 2283-9216
Preliminary study of carbon nanotubes formation from
methane over stainless steel in chemical vapor deposition
system
Cong-Danh Nguyen a, b, Tu-Doanh Tieu a, Thanh-Sinh Do a, Hong-Tham Nguyen-Thi a, Duong
Thai a, Ke-Thanh Ngo-Vo a, Huu-Luong Nguyen c, Van-Cattien Nguyen d,
Tuyet-Mai Tran-Thuy b,* a The Research Laboratories of Saigon High-Tech-Park, Lot I3, N2 Street, District 9, Ho Chi Minh City b Faculty of Chemical Engineering, Ho Chi Minh City University of Technology, VNU-HCM,
268 Ly Thuong Kiet, District 10, Ho Chi Minh City, Vietnam c Vietnam Petroleum Institute, D1 Street, High Tech Park, Tan Phu Ward, District 9, Ho Chi Minh City, Vietnam d Ntherma corporation, 458 S Hillview Dr, Milpitas, CA 95035, USA
This work reported the formation of carbon nanotubes from methane gas, over commercial stainless steel
catalyst in chemical vapor deposition system. Morphology of as-prepared carbon at various reaction
temperatures was observed by SEM images. Besides, SEM-EDX analysis presented amount of carbon
increases with increase of reaction temperature: very few of carbon granules were recorded at 750 0C, but 30
at.% (atomic percent) of carbon was detected at 950 0C (the granular diameter is less than 250 nm).
Interestingly, carbon nanotubes with a diameter of 20 – 40 nm and a length of 200 – 400 nm were observed at
850 0C evidencing the reaction temperature controls the carbon morphology from the initial seeds. The atomic
percentages of O and Al were unchanged (in the range of 17 – 28 at.% and 13 at.%) while atomic amounts of
Cr and Fe decreased with increasing reaction temperature. However, molar ratios of Cr/Fe kept constant at 0.3
at different reaction temperatures probably associated to the growth of carbon on the Cr-Fe active site.
Keywords: Carbon nanotubes, CVD system, methane, stainless steel catalyst
1. Introduction
The availability of shale gas on the market has progressed potential application of methane gas (CH4) in
chemical and manufacturing sectors. Many recent studies in utilization of CH4 in dry (Margossian et al. 2017)
and steam reforming (Angeli et al. 2014) to produce clean H2, an attractive alternative to support energy
consumption without environmental impact. Besides carbon-rich sources to prepare carbon nanotubes (CNTs),
like carbon monoxide, ethanol, toluene, benzene and ethylene, others of acetylene and CH4 are commonly
important carbon supplies. Chemical vapor deposition (CVD) system with an assistance of heterogeneous
catalysts (CCVD) has been considered as an current standard technique to synthesized CNTs at low
temperature. Hydrolysis of acetylene (Liu et al. 2004) and ethylene forward CNTs (Plata et al. 2010) over metal
catalysts in a CVD system were usually carried out at about 600–950 0C and 650–850 0C, respectively.
Considering on thermo-dynamic area, G of decomposition of acetylene and ethylene are already negative at
200 0C while that of CH4 is favor at above 600 0C (Tessonnier and Su 2011). The stable structure of CH4 should
be concerned in fabricate CNTs in CCVD system. Catalysts for CNTs development in CVD system were
reported as metal active cites, for instance, Ni, Co, Mo, Fe and alloys supported on Al2O3, SiO2, MgO, etc.,
(Wen et al. 2007). It was reported that the crystallinity of CNTs from decomposition of C2H2 at 950 0C follows a
sequence of Fe/SiO2 > Ni/ SiO2 > Co/ SiO2 (Lee et al. 2002) while that process run well at 800 0C over Fe-
Mo/MgO catalyst (Liu et al. 2004). Fe-Mo alloy supported on Al2O3 was also reported an excellent performance

Page 56
in preparation of CNTs from CH4 at 900 0C (Li et al. 2001). This revealed that Fe metal is an vital site to produce
CNTs from hydrolysis of hydrocarbon. Moreover, catalysts for fabrication of CNTs with a CVD system were
prepared as complicated processes. Many works reported the ability of CNT growth from acetylene (Camilli et
al. 2011; Pakdee et al. 2017) or from plastic post-consumer wastes (Panahi et al. 2019) over stainless steel
(SS) substrate in CDV at 700 – 850 0C. However, studying the growth of CNTs on SS catalyst from stable
structure of methane has not been reported. This work will attempt to synthesize carbon nanotubes from CH4 in
the aid of commercial stainless steel substrate in CVD system. The preliminary experiment will study the impact
of reaction temperature on morphologies of carbon formation. Scanning electron microscope (SEM) will be used
to observe the formation of CNTs, as well as to analyze percentage of carbon on surface of SS substrate via
SEM-EDX technique.
2. Material and Methods
2.1 Material
Pure CH4 (99.999%) and Ar (99.999%) considered as carbon source and carrier gas, respectively were supplied
from Air Liquide Vietnam.
FeCrAl alloy substrate (obtained from Goodfellow, Oakdale, PA, USA) (Oye et al. 2010) was prepared with a square of 5.0 cm x 5.0 cm, and 0.5 mm of thickness for studying the formation of carbon in a CVD system. The substrate was ultrasonicated in acetone for 15 min, then in isopropanol for 15 min, and finally blown dry with nitrogen for ready as catalyst in this study. The pre-treated FeCrAl sample was noted as stainless steel (SS) substrate.
2.2 Synthesis of CNTs in CVD system
A thermal CVD apparatus (CNCVD-200TH, ULVAC) was used to synthesize carbon nanotubes. In the CVD
apparatus, only SS substrate was heated from room temperature (RT) to desired reaction temperature at a fast
rate (100 0C/min). Vacuum pump was operated during heating and reaction to ensure low pressure in the
reactor. Argon flow was conducted in CVD system during heating up to prepare a clean vacuum medium. At a
desired reaction temperature, a mixture of 10 vol.% of methane in argon as a feeding flow was conducted to
CVD system (at 1000 mL/min of Ar flow) and kept there for 60 minutes. After that, switching off reactant flow
and turning on argon valve to cool reactor down to RT will be run. The SS substrate after reaction was collected
and noted as C-750, C-850 and C-950 for carbon formation at reaction temperature at 750, 850 and 950 0C,
respectively.
The morphology and element analysis of the synthesized carbon are examined with a field emission scanning
electron microscope (FE-SEM; Hitachi S-4800, Japan)
3. Results and discussion
Surface analysis of bare SS foil was observed in the Fig. 1. The SEM images showed a fair smooth surface
composed from 52 at.% of Fe, 16 at.% of Cr and 13 at.% of Al (Table 1). The presence of Fe and Cr elements
on the surface of FeCrAl substrate consisting to the composition of commercial stainless steel (Huang et al.
2004). Therefore, SS substrate as catalyst was used instead of the FeCrAl alloy to observe the formation of
carbon from CH4 in Ar flow.
Figure 1: SEM images of stainless steel foil at high (a) and low magnifications (b)
(a) (b)

Page 57
Effect of reaction temperature on morphologies of carbon was presented in Figure 2, 3 and Figure 4. There are
some carbon granules were detected at 750 0C of reaction temperature from SEM images (Figure 2a & b). The
SEM image at low magnification of sample C-750 is almost similar to that of SS sample (Figure 1b and Figure
2b). Increasing reaction temperature to 850 0C resulted many carbon tubes whose 20 – 40 nm of diameter and
200 – 400 nm of length revealed the formation of carbon nanotubes (Figure 3a). The image of C-850 at low
magnification showed a huge carbon with long tail (Figure 3b) suggesting the prior development of carbon along
the length axis. Many un-uniform spheres of carbon that diameter is less than 250 nm was detected at 950 0C
of reaction temperature indicating a preferable growth of carbon in three dimensions (Figure 4a). SEM image
of C-950 at low magnification confirmed full coverage of carbon on SS substrate at 950 0C. Moreover, the lack
of carbon nanotube from C-950 sample demonstrated a favorable growth of carbon along the width axis. It is
proposed that long tail of carbon on C-850 sample will be only developed from initial carbon seed at suitable
reaction temperature.
Figure 2: SEM images of C-750 at high (a) and low magnifications (b)
Figure 3: SEM images of C-850 at high (a) and low magnification (b)
Table 1 showed the atomic content of elements from SEM-EDX analysis. Clearly, amount of carbon increased
from 4 to 10 at.% with increasing reaction temperature from 750 to 850 0C. There is about 30 at.% of carbon
observed at 950 0C of reaction temperature (Table 1). That is consistent to full coverage of carbon spheres over
SS substrate (Figure 4b).
The percentages of O and Al elements are in the similar range of 17 – 28 at.% and 13 at.%, respectively
while amounts of Cr and Fe decreased in increase of reaction temperature. Interestingly, the molar ratio of Cr/Fe
kept constant value at 0.3 before and after growth of carbon indicating that the Cr-Fe sites on SS substrate
were relative to the formation of carbon from CH4/Ar via CVD method. In comparison to C-750 sample,
lengthening of carbon tail over C-850 revealed the formation CNTs on initial carbon seed was catalyzed by Cr-
Fe sites. Detection of carbon spheres at 950 0C of reaction temperature demonstrated clearly the impact of
reaction temperature on formation of carbon morphologies over SS catalyst.
(a) (b)
(a) (b)

Page 58
Figure 4: SEM images of C-950 at high (a) and low magnifications (b)
SEM mapping analysis in Figure 5 presented well spatial distribution of C, Fe, Al, Cr and O elements on C-850
samples catalyst suggesting good formation of carbon on SS catalyst at 850 0C of reaction temperature.
Our study showed preliminary work of fabrication of carbon nanotubes from CH4 reactant with a CVD system.
The optimal conditions in manufacture of carbon nanotubes over Fe-Cr sites are at 10 vol.% of CH4 in Ar feeding
flow (1000 mL/min of Ar flow), at 850 0C of reaction temperature in a CVD system.
(a) (b)
(b) (c)
(a)

Page 59
Figure 5: EDX mapping analysis of C-850 (a-f)
Table 1: Atomic percentage of elements from SEM-EDX
Sample C Fe O Al Cr
SS 1.4 52.3 17.1 13.4 15.8
C-750 3.9 48.3 21.1 12.3 14.7
C-850 10.2 42.6 20.8 13.7 12.7
C-950 30.3 22.1 28.0 13.0 6.6
4. Conclusions
In this research, carbon formation from hydrolysis of stable structure - CH4 over stainless steel catalyst was
studied in CVD reactor under Ar flow. The reaction temperature is in the range of 750 - 950 oC. Noticeable
effect of reaction temperature on formation of carbon morphologies was analyzed by SEM images and ESM-
EDX technique . Our preliminary work proved that 850 0C is more suitable reaction temperature to produce
carbon nanotubes from CH4 in Ar flow. About 10 at.% of CNTs was detected at 850 0C and 30% of granular
carbon was observed at 950 0C. Moreover, active site for the growth of nanotube carbon and granular carbon
may regard with Fe-Cr sites on FeCrAl alloy substrate.
Acknowledgments
The authors gratefully acknowledge the financial supports from the annual projects of The Research
Laboratories of Saigon High Tech Park in 2019 according to decision No. 102/QĐ -KCNC of Management Board
of Saigon High Tech Park and contract No. 01/2019/HĐNVTX-KCNC-TTRD and from Ho Chi Minh City
University of Technology – VNU-HCM.
References
Angeli S. D., Monteleone G., Giaconia A., and Lemonidou A. A., 2014, State-of-the-art catalysts for CH4 steam
reforming at low temperature, International Journal of Hydrogen Energy, 39: 1979-97.
Camilli L., Scarselli M., Gobbo S. D., Castrucci P., Nanni F., Gautron E., Lefrant S., and Crescenzi M. D., 2011,
The synthesis and characterization of carbon nanotubes grown by chemical vapor deposition using a
stainless steel catalyst, Carbon, 49: 3307-15.
Huang, C. A., Hsu F. Y., and Yao S. J., 2004, Microstructure analysis of the martensitic stainless steel surface
fine-cut by the wire electrode discharge machining (WEDM), Materials Science and Engineering: A, 371:
119-26.
Lee C. J., Park J., and Jeong A. Y., 2002, Catalyst effect on carbon nanotubes synthesized by thermal chemical
vapor deposition, Chemical Physics Letters, 360: 250-55.
Li Y., Liu J., Wang Y., and Wang Z. L., 2001, Preparation of Monodispersed Fe−Mo Nanoparticles as the
Catalyst for CVD Synthesis of Carbon Nanotubes, Chemistry of materials, 13: 1008-14.
(d) (e) (f)

Page 60
Liu B. C. , Lyu S. C., Jung S. I., Kang H. K., Yang C-W, Park J. W., Park C. Y., and Lee C. J., 2004, Single-
walled carbon nanotubes produced by catalytic chemical vapor deposition of acetylene over Fe–Mo/MgO
catalyst, Chemical Physics Letters, 383: 104-08.
Margossian T., Larmier K., Kim S. M., Krumeich F., Fedorov A., Chen P., Muller C. R., and Coperet C., 2017,
Molecularly tailored nickel precursor and support yield a stable methane dry reforming catalyst with superior
metal utilization, Journal of the American Chemical Society, 139: 6919-27.
Oye, M. M., Yim S., Fu A., Schwanfelder K., Meyyappan M., and Nguyen V. C., 2010, Surface smoothness
effect for the direct growth of carbon nanotubes on bulk FeCrAl metal substrates, Journal of nanoscience
and nanotechnology, 10: 4082-88.
Pakdee, U., Chiangga S., Suwannatus S., and Limsuwan P., 2017, Growth of MWCNTs on flexible stainless
steels without additional catalysts, Journal of Nanomaterials, 2017.
Panahi A., Wei Z., Song G., and Levendis Y.s A., 2019, Influence of Stainless-Steel Catalyst Substrate Type
and Pretreatment on Growing Carbon Nanotubes from Waste Postconsumer Plastics, Industrial &
Engineering Chemistry Research, 58: 3009-23.
Plata, D. L., Meshot E. R., Reddy C. M., A., Hart J., and Gschwend P. M., 2010, Multiple Alkynes React with
Ethylene To Enhance Carbon Nanotube Synthesis, Suggesting a Polymerization-like Formation Mechanism,
ACS Nano, 4: 7185-92.
Tessonnier J‐P, and Su D. S., 2011, Recent progress on the growth mechanism of carbon nanotubes: a review,
ChemSusChem, 4: 824-47.
Wen Q., Qian W., Wei F., Liu Y., Ning G., and Zhang Q., 2007, CO2-assisted SWNT growth on porous catalysts',
Chemistry of materials, 19: 1226-30.

Page 61
Proceedings of
The 5th International Conference on Low Carbon Asia & Beyond - ICLCA 2019 &
The 4th International Conference on Chemical Engineering, Food and
Biotechnology - ICCFB 2019
Vietnam, Malaysia
ISBN: 978-604-67-1372-2
ISBN 978-88-95608-67-9; ISSN 2283-9216
Magnetite Fe3O4 nanoparticles: wet-chemical synthesis for
therapeutic applications
Ngoc Do Quyen Chau*, Trung Dang-Bao*
Faculty of Chemical Engineering, Ho Chi Minh City University of Technology, VNU-HCM, 268 Ly Thuong Kiet, District 10,
Ho Chi Minh City, Vietnam
N.D.Q.C. [email protected]
T.D.-B. [email protected]
Among various superparamagnetic materials, magnetite Fe3O4 nanoparticles are the most frequently used for
biomedical applications thanks to their excellent magnetic performance, biodegradability, biocompatibility and
low toxicity. Fe3O4 nanoparticles possess a large surface area facilitating ready modifications with targeted
agents which can be utilized for drug and gene delivery systems. In this field, small nanoparticles with uniform
shapes correlated to various synthetic methods must be complied. Our efforts focus on the wet-chemical
synthesis of Fe3O4 magnetic nanoparticles involving co-precipitation, thermal decomposition and solvothermal
process with advantages and drawbacks of each method. In addition, requirements of Fe3O4 nanoparticles as
nanocarriers for therapeutic purposes and achievements of magnetic drug targeting will be also described.
1. Introduction
Over the past few decades, magnetic nanoparticles consisting of metals (Fe, Ni, Co) and corresponding metal
oxides, ferrites (MFe2O4 with M = Ni, Co, Cu) and Fe-based alloys have attracted intensive interests in catalysis
(Govan and Gun’ko, 2014), pharmaceutical and biomedical applications (Reddy et al., 2012). Among these
materials, Fe3O4 magnetic nanoparticles with appropriate surface chemistry have gained tremendous attractions
in biomedicine, such as diagnostic imaging, tissue repair, therapeutic delivery, hyperthermia, and theranostics.
Thanks to their unique capabilities, their biocompatibility, their stability, and their negligible side effects in cancer
therapy, Fe3O4 nanoparticles with proper surface modification or conjugation with various targeting biomolecules
have been extensively used nowadays for therapeutic applications.
The fabrication of magnetic nanoparticles can be categorized by either top-down or bottom-up approaches
(Nikam et al. 2018). Top-down approach in which bulk materials are divided into nano-objects requires harsh
conditions (high temperature and pressure) and produces non-uniform nanoparticles with surface defects. In
contrast, the latter one mainly based on wet-chemical synthesis permits to tune size, morphology and crystalline
structure of Fe3O4 nanoparticles associated to their instinct properties (such as optical, electronic, magnetic and
surface properties). According to this approach, the reaction parameters are of vital importance including nature
and concentration of precursor, temperature and heating method, ligands and additives, solvents, etc. This
paper aims to discuss recent advances in the wet-chemical synthesis of Fe3O4 magnetic nanoparticles and their
applications in drug and gene delivery systems.
2. Wet-chemical synthesis of Fe3O4 nanoparticles
Magnetite Fe3O4 nanoparticles have been frequently synthesized by physical, chemical or biological
approaches. In general, the wet-chemical methods are preferred aiming at easily controlling size, shape and
composition of nanoparticles, involving co-precipitation, thermal decomposition and solvothermal synthesis as
discussed in this section.

Page 62
2.1 Co-precipitation
Co-precipitation from an aqueous solution of Fe2+/Fe3+ salts to prepare Fe3O4 nanoparticles is the most typical route, with the pioneering work of Massart as reported in 1981 (Massart, 1981). In this research, a mixture of ferric chloride and ferrous chloride was performed in aqueous ammonia solution. The black precipitates were separated from solution by centrifugation or an external magnet and then re-dispersed in alkaline or acidic media. In fact, the Fe2+ and Fe3+ salts in alkaline media react and then produce hydroxides precipitates. Simultaneously, Fe3O4 is yielded, accompanying with the loss of H2O molecules as described in the Eq(1) (Mahmoud et al., 2013). Up to present, this method has been widely applied in the preparation of Fe3O4 nanoparticles thanks to its simplicity, reproducibility and the addition of less hazardous reagents.
[Fe3+(OH)3Fe2+(OH)2Fe3+]n nFe3O4 + nH2O (1)
According to the similar strategy, Ghafoor and Ata synthesized Fe3O4 nanoparticles coming from FeCl2.4H2O and FeCl3.6H2O in deoxygenated water (adding concentrated HCl). The nanoparticles formation was performed by dropping NaOH solution under vigorous stirring at 80 oC under N2 atmosphere. The as-prepared magnetic nanoparticles were isolated from solution by applying the external magnetic field (Ghafoor and Ata, 2017). Liu and co-workers used FeSO4.H2O and Fe2(SO4)3 (2:1 molar ratio) as iron precursors to fabricate Fe3O4 nanoparticles by adding ammonia aqueous solution under N2 protection at 50 oC (Liu et al., 2016). On the other hands, the influence of ultrasonic auxiliary in co-precipitation process was studied as evidenced that obtained Fe3O4 nanoparticles have mean diameter of 24 nm without ultrasonic waves and 16 nm in the ultrasonic assistance (Rezayan et al., 2016). The effect of various iron precursors on particle size was observed (by XRD, SEM and TEM; see Table 1) that explained based on the double layer theory associated to the size of counterpart anions (Yazdani and Seddigh, 2016). Furthermore, the increase of saturation magnetization (Ms) (analyzed by VSM) exhibits the increase of particle size. However, morphology of obtained magnetite nanoparticles seems to be independent to such iron precursors.
Table 1: Specifications of Fe3O4 nanoparticles using various iron precursors (Yazdani and Seddigh, 2016)
Precursors Ionic strength Size (nm)
XRD
Size (nm)
SEM
Size (nm)
TEM
Ms (emu/g)
VSM
FeCl2.4H2O, FeCl3.6H2O 1.9 10.03 41.74 11.92 53.38
FeCl2.4H2O, Fe2(SO4)3 2.8 6.6 36.64 35.1
FeCl2.4H2O, Fe(NO3)3.9H2O 1.9 8.86 42.6 51.5
FeSO4.7H2O, FeCl3.6H2O 2.0 8.7 42.4 51.2
FeSO4.7H2O, Fe2(SO4)3 2.9 5.1 26.32 5.12 30.5
FeSO4.7H2O, Fe(NO3)3.9H2O 2.0 8.23 40.06 43.5
With the aim to simplify the co-precipitation method, Zhang et al. reported the similar procedure without inert gas protection: the aqueous solution of FeCl2.4H2O and FeCl3.6H2O (molar ratio of 1.6:1) was adjusted to pH 11 using 1 M NaOH solution and then dispersed in the presence of ultrasonic waves. Sodium citrate was employed acting as stabilizing agents permitting to obtain Fe3O4 magnetic fluid (Zhang et al., 2012). The use of stabilizers/modifiers in the preparation of metal nanoparticles is necessary to prevent the aggregation as reported by Radoń and co-workers. The magnetite Fe3O4 nanoparticles were modified by different organic
compounds, indicating the different crystallite size (at the range of 2.912.2 nm as summarized in Table 2), structure, morphology and optical band-gap energy (Radoń et al., 2017). As clearly that the organic modifiers allow obtaining the smaller nanoparticles (except Fe3O4 - glycol) compared to unmodified Fe3O4 nanoparticles.
Table 2: The average crystallinity volume size and size of Fe3O4 nanoparticles (Radoń et al., 2017)
Sample Crystallinity volume size
(nm)
Particle size
(nm)
Fe3O4 10.6 9.6 2.0
Fe3O4 – glycol 12.2 10.8 2.7
Fe3O4 – PVP 9.2 9.2 2.3
Fe3O4 – tartrate 2.9 -
Fe3O4 – citrate 5.5 5.1 0.8
Fe3O4 – dextrin 8.4 6.9 1.4
5.1 Thermal decomposition
Normally, metal nanoparticles synthesized in aqueous and volatile solvents are poly-dispersive, agglomerative
and poor in crystallinity. In contrast, thermal decomposition processes which metal precursors are heated up to
their decomposition temperatures in high-boiling solvents, permit to obtain metal nanoparticles with mono-

Page 63
crystallinity, mono-disperse in size and shape (Nikam et al., 2018). According to this approach, the preparation
of metal nanoparticles generally coming from corresponding organometallic compounds has been employed in
an organic solvent at high temperature and under inert atmosphere. Note that, the addition of surface stabilizing
agents cannot be ignored.
Sun et al. reported the synthesis of Fe3O4 nanoparticles using iron (III) acetylacetonate (Fe(acac)3) as starting
precursors, oleic acid and oleylamine as surfactants in various organic solvents. The spherical nanoparticles
were obtained with the mean size of 4 nm (phenyl ether, 265 oC, 30 min) and 6 nm (benzyl ether, 300 oC, 30
min), indicating that the increase of working temperature resulted in the increase of particle size (Sun et al.,
2004). Similarly, Fe(acac)3 was chosen as the iron precursor to prepare Fe3O4 nanoparticles using benzyl ether
solvent and the capping ligands such as oleylamine (19 nm in mean diameter) (Saei et al., 2014), oleic acid and
oleylamine (5.8 nm in mean diameter) (Ge et al., 2016). Thermal decomposition of Fe(acac)3 in polyethylene
glycol (PEG) and polyethylenimine (PEI) permits to achieve the stable colloidal solution of Fe3O4 nanoparticles
coated by PEG and PEI (Huang et al., 2017). The diameter of nanoparticles (at the range of 914 nm) could be
controlled by changing PEI amount, temperature and time. Besides Fe(acac)3, Fe3O4 nanoparticles could be
produced coming from iron(III) oxalate (Fe2(C2O4)3.6H2O) in tri-n-dodecylamine (spherical nanoparticles of 6 nm
in mean diameter) (Cavelius et al., 2012), iron oleate complex in 1-octadecene (spherical nanoparticles of 15.8
nm in mean diameter) (Huang et al., 2015), iron carboxylate in 1-octadecene (825 nm in the range of particle
size) (Li et al., 2017) and pentacarbonyl iron in 1-octadecene (Lin and Doong, 2017).
Thermal decomposition process permits to prepare high-quality Fe3O4 nanoparticles; however, this method still
possesses some drawbacks such as expensive metallic precursors and solvents, harsh reaction conditions,
thus interfering to scale up the production.
2.2 Solvothermal synthesis
Chemical reaction carried out in organic solvents, under elevated temperature (1001000 oC) and high pressure
(110,000 bar) in a closed vessel (autoclave) is known as solvothermal synthesis (Nikam et al., 2018). In this
method, metal nanoparticles are highly selective and reproducible in purity, crystallinity and morphology.
The pioneering work of Deng et al. reported the solvothermal method to synthesize single-crystalline Fe3O4
microspheres: FeCl3.6H2O was dissolved in ethylene glycol (EG) and followed by adding sodium acetate
(NaOAc) and polyethylene glycol (PEG), the mixture was then heated at 200 oC for 872 h in a Teflon-lined
stainless steel autoclave (Deng et al., 2005). The particle size increases in the range of 200800 nm with the
increase of reaction time. Similarly, spherical magnetic Fe3O4 nanoparticles were also fabricated by a modified
solvothermal method indicating mean diameters of 130 nm (Shi et al., 2011), 290 20 nm (Li et al., 2016).
According to the preparation of Fe3O4 nanoparticles from FeCl3.6H2O in EG, the addition of some base anions
such as NaOAc and NaOH facilitates the reduction of Fe3+. In contrast, oxalate and citrate anions with strong
coordination ability favor the stable iron complexes preventing the formation of Fe(OH)3 and then Fe3O4
nanoparticles (Jamshidiyan et al., 2017). In this study, the effect of sodium salts including NaOAc, Na2CO3, a
mixture of NaOAc and Na3Cit (trisodium citrate), a mixture of NaOAc and Na2C2O4 on the structure and optical
properties of magnetic Fe3O4 nanoparticles was evaluated by XRF, XRD, FT-IR and SEM. Sizes and shapes of
metal oxides can be controlled by reaction parameters (such as ratio of ligand and metal precursor, temperature,
pressure, time, etc.) (Nikam et al., 2018). For instance, He and co-workers presented the sizes, morphologies
and magnetic performances of sodium acetate oriented hollow/mesoporous Fe3O4 nanoparticles obtained by
adjusting reaction time and molar ratio of reactants (He et al., 2018). Magnetic Fe3O4 nanoparticles were
synthesized with different shapes as described in Table 3: cubes and octahedra (using FeSO4.7H2O, EG and
KOH as a capping agent) and spheres (FeCl3.6H2O, EG and ammonium acetate as a capping agent). Besides,
the effect of KOH concentration (0.5, 1.0, 1.5 and 5.0 M) on the shape of nanoparticles was found that the
formation of octahedra is predominant at higher KOH concentration (Fatima et al., 2018). By the same approach,
Ooi et al. reported the solvothermal synthesis of octahedral Fe3O4 nanoparticles coming from FeCl3.6H2O in EG
(solvent), oleylamine and 1,3-diaminopropane (organic surfactants) and NaOAc (steric stabilizing agent) (Ooi et
al., 2015). The Fe3O4 octahedrons were produced in high yield (>85%) with edge lengths of 90 nm as evidenced
by SEM, HR-TEM, XRD and XPS techniques.

Page 64
Table 3: Morphologies of Fe3O4 nanoparticles depending on the reaction conditions (Fatima et al., 2018)
Synthesis conditions Sphere Cube Transformation undergoing
(Cube Octahedron) Octahedron
Iron precursor FeCl3.6H2O FeSO4.7H2O FeSO4.7H2O FeSO4.7H2O FeSO4.7H2O
Ammonium acetate 1 M - - - -
KOH - 0.5 M 1 M 1.5 M 5 M
Size 216.6 nm 158.5 nm 160 nm 581.2 nm 4.9 m
Instead of using organic solvents, aqueous iron solutions could be applied to prepare metal nanoparticles under
similar conditions as called for hydrothermal method. Lei and co-workers studied the synthesis of octahedral
Fe3O4 (with edge lengths of 500 nm) by dissolving FeSO4.7H2O in deionized water in the presence of -
propylene glycol and NaOH. The mixture was performed in a Teflon-lined stainless-steel autoclave by heating
up 200 oC (a speed of 10 oC/min) and remaining this temperature for 20 h (Lei et al., 2017). Briefly,
solvothermal/hydrothermal methods permit to synthesize mono-disperse and uniform shape Fe3O4
nanoparticles but being difficult in scaling up by reason of high temperature and high pressure.
3. Therapeutic applications of Fe3O4 nanoparticles: Magnetic drug targeting
3.1 Requirements of Fe3O4 nanoparticles as carriers in therapeutic applications
In general, for therapeutic purpose, the safety issues of nanocarriers depend on their physicochemical
properties, such as surface charges, shape, size, composition, functional groups, and coating materials. These
characteristics of magnetic nanoparticles need to be carefully investigated to ensure their biocompatibility,
nontoxicity, biodegradability, and a good biodistribution in term of biomedical applications. The main advantages
of using Fe3O4 nanoparticles for nanomedicine are their easy preparation, small sizes, good stability, low toxicity,
facile surface modification and functionalization with biomolecules, strong biocompatibility in comparison to
other inorganic nanoparticles, and their unique magnetic performance. There are several factors that strongly
affect the ability of drug and gene delivery of Fe3O4 nanoparticles, such as the size, charge as well as surface
chemistry (Chouly et al., 1996) although the iron oxide nanoparticles have already been approved by the Food
and Drug Administration.
3.2 Fe3O4 nanoparticles for targeting drug/gene delivery systems
To enhance biocompatibility as well as to significantly increase the blood circulation time, Fe3O4 nanoparticles
carriers can be coated either with natural polysaccharides, such as chitosan, dextran, starch, carbon, gelatin,
or with synthetic polymers, amphiphilic polymeric surfactants such as polyethylene glycol (PEG) derivatives
(Prabha and Raj, 2016), polyvinyl alcohol (Aliabadi et al., 2017), polyacrylic acid (Xu et al., 2012),
polyethyleneimine (PEI) (Ma et al., 2017), etc. Moreover, by coating Fe3O4 nanoparticles with various
compounds like polymer, silica, graphene oxide, carbon, etc., the agglomeration of Fe3O4 nanoparticles which
can lead to the increasing of size can be controlled. In term of biodegradability, after endocytosis, Fe3O4
nanoparticles can be degraded in endosomes, then releasing iron ions.
After being modified with a variety of coating materials, Fe3O4 nanoparticles will be conjugated with drugs or
biomolecules, and then reach the target sites under the external magnetic field through the enhanced
permeability and retention (Hudson, 2016). Thus, the drug doses and potential side effects to healthy tissues
will be minimized with the improvement of treatment efficacy. Moreover, by modulating the coating surface, the
Fe3O4 nanocarriers are used not only to targeted deliver drug but also to combine the chemophotothermal
therapy (Du et al., 2016), magnetic resonance imaging (Rezayan et al., 2016), and other therapeutic methods
(Ge et al., 2016). The loading drugs could be released under external stimuli, such as pH-responsive trigger
(Saha et al., 2017), near-infrared laser-triggered (Deng et al., 2017), sensitivity with temperature, reactive-
oxygen-species-mediated cytotoxicity, etc.
For example, doxorubicin (DOX), an anthracycline antibiotic, is a well-known drug model which is widely used
in targeted drug delivery. Huang et al. reported a modified PEG and PEI coatings of Fe3O4 nanoparticles, and
then folic acid (FA) was functionalized and DOX was then loaded on the nanoparticles to form DOX@FA– Fe3O4
magnetic nanoparticles (Huang et al., 2017).
In term of chemo-gene delivery, the group of Li has synthesized the magnetic Fe3O4@mSiO2 nanoparticles and
then modified them with PEI and FA with the purpose of co-delivery of plasmid-expressing small hairpin RNA
(shRNA) against vascular endothelial growth factor (VEGF shRNA) and DOX (Li et al., 2016). The systems have
a high biocompatibility and no toxicity on Hela cells or normal cells. The results showed that by combination of
gene and drug factors, the uptake of DOX in tumor cells was increased, and a synergistic treatment effect was
recorded. Moreover, the silencing effect of VEGF expression displayed a higher targeted gene – silencing effect

Page 65
thanks to the presence of FA. Hence, Li et al. have produced an outstanding drug and gene co-delivery system
that lead to a possibility of superimposed treatment for combination of gene and drug therapy for tumor cells.
4. Conclusions
Magnetite Fe3O4 nanoparticles are currently of great interest in pharmaceutical and biomedical applications
thanks to their biocompatibility, low toxicity and magnetic property. Depending on the purposes, the coating
materials on the surface of magnetic nanoparticles will be wisely chosen to proceed. Indeed, to be use in
nanomedicine, especially in drug and gene delivery, the physicochemical properties and the pharmacokinetic
profile of nanocarriers need to be investigated deeply. By physical or chemical interaction, a diversity of
biomolecules can be attached or encapsulated or conjugated onto Fe3O4 nanoparticles together with the
magnetic intrinsic property, this type of magnetic nanoparticles can provide maximum synergistic effects in
biomedicine. Furthermore, nano-size of Fe3O4 should be controlled in the range of 10200 nm permitting their
steadily circulation in blood. Among various synthetic approaches of Fe3O4 nanoparticles as previously
discussed, co-precipitation seems to be the most suitable method for the utilization in drug/gene delivery
(obtaining small nanoparticles, using less hazardous reagents, low-cost and easily handling) compared to
thermal decomposition (dangerous materials and harsh conditions) and solvothermal synthesis (large mean
particle size and harsh conditions).
References
Aliabadi M., Shagholani H., lehi A.Y., 2017, Synthesis of a novel biocompatible nanocomposite of graphene
oxide and magnetic nanoparticles for drug delivery, International Journal of Biological Macromolecules, 98,
287–291.
Cavelius C., Moh K., Mathur S., 2012, Chemically designed growth of monodisperse iron oxide nanocrystals,
Crystal Growth & Design, 12, 59485955.
Chouly C., Pouliquen D., Lucet I., Jeune P., Pellet J.J., 1996, Development of superparamagnetic nanoparticles
for MRI: effect of particles size, charge and surface nature on biodistribution, Journal Microencapsulation,
13, 245–255.
Deng H., Li X., Peng Q., Wang X., Chen J., Li Y., 2005, Monodisperse magnetic single-crystal ferrite
microspheres, Angewandte Chemie International Edition, 44, 2782–2785.
Deng L., Li Q., Al-Rehili S., Omar H., Almalik A., Alshamsan A., Zhang J., Khashab N.M., 2016, Hybrid iron
oxide-graphene oxide-polysaccharides microcapsule: A micro-matryoshka for on-demand drug release and
antitumor therapy in vivo, ACS Applied Materials & Interfaces, 8, 6859–6868.
Du B., Cao X., Zhao F., Su X., Wang Y., Yan X., Jia S., Zhou J., Yao H., 2016, Multimodal imaging-guided,
dual-targeted photothermal therapy for cancer, Journal of Material Chemistry B, 4, 2038–2050.
Fatima H., Lee. D.-W., Yun H.J., Kim K.-S., 2018, Shape-controlled synthesis of magnetic Fe3O4 nanoparticles
with different iron precursors and capping agents, RSC Advances, 8, 2291722923.
Ge R., Li X., Lin M., Wang D., Li S., Liu S., Tang Q., Liu Y., Jiang J., Liu L., Sun H., Zhang H., Yang B., 2016,
Fe3O4@polydopamine composite theranostic superparticles employing preassembled Fe3O4 nanoparticles
as the core, ACS Applied Materials & Interfaces, 8, 2294222952.
Ghafoor S., Ata S., 2017, Synthesis of carboxyl-modified Fe3O4@SiO2 nanoparticles and their utilization for the
remediation of cadmium and nickel from aqueous solution, Journal of the Chilean Chemical Society, 62,
3588–3592.
Govan J., Gun’ko Y.K., 2014, Recent advances in the applications of magnetic nanoparticles as a support for
homogeneous catalysts, Nanomaterials, 4, 222241.
He Q., Liu J., Liang J., Liu X., Ding Z., Tuo D., Li W., 2018, Sodium acetate orientated hollow/mesoporous
magnetite nanoparticles: facile synthesis, characterization and formation mechanism, Applied Sciences, 8,
292306.
Huang R.-Y., Chiang P.-H., Hsiao W.-C., Chuang C.-C., Chang C.-W., 2015, Redox-sensitive polymer/SPIO
nanocomplexes for efficient magnetofection and MR imaging of human cancer cells, Langmuir, 31, 6523–
6531.
Huang Y., Mao K., Zhang B., Zhao Y., 2017, Superparamagnetic iron oxide nanoparticles conjugated with folic
acid for dual target-specific drug delivery and MRI in cancer theranostics. Materials Science and
Engineering: C, 70, 763–771.
Hudson R., 2016, Coupling the magnetic and heat dissipative properties of Fe3O4 particles to enable
applications in catalysis, drug delivery, tissue destruction and remote biological interfacing, RSC Advances,
6, 4262–4270.

Page 66
Jamshidiyan M., Shirani A.S., Alahyarizadeh G.H., 2017, Solvothermal synthesis and characterization of
magnetic Fe3O4 nanoparticle by different sodium salt sources, Materials Science-Poland, 35, 5057.
Lei W., Liu Y., Si X., Xu J., Du W., Yang J., Zhou T., Lin J., 2017, Synthesis and magnetic properties of
octahedral Fe3O4 via a one-pot hydrothermal route, Physics Letters A, 381, 314318.
Li B., Fan H., Zhao Q., Wang C., 2016, Synthesis, characterization and cytotoxicity of novel multifunctional
Fe3O4@SiO2@GdVO4:Dy3+ core-shell nanocomposite as a drug carrier, Materials, 9, 149155.
Li T., Shen X., Geng Y., Chen Z., Li L., Li S., Yang H., Wu C., Zeng H., Liu Y., 2016, Folate-functionalized
magnetic-mesoporous silica nanoparticles for drug/gene codelivery to potentiate the antitumor efficacy, ACS
Applied Materials & Interfaces, 8, 13748–13758.
Li W., Troyer L.D., Lee S.S., Wu J., Kim C., Lafferty B.J., Catalano J.G., Fortner J.D., 2017, Engineering
nanoscale iron oxides for uranyl sorption and separation: Optimization of particle core size and bilayer
surface coatings, ACS Applied Materials & Interfaces, 9, 13163–13172.
Lin F., Doong R., 2017, Catalytic nanoreactors of Au@Fe3O4 yolk-shell nanostructures with various Au sizes for
efficient nitroarene reduction, The Journal of Physical Chemistry C, 121, 7844–7853.
Liu P., Zhang K., Zhang R., Yin H., Zhou Y., Ai S., 2016, A colorimetric assay of DNA methyltransferase activity
based on the keypad lock of duplex DNA modified meso-SiO2@Fe3O4, Analytica Chimica Acta, 920, 80–85.
Ma P., Xiao H., Yu C., Liu J., Cheng Z., Song H., Zhang X., Li C., Wang J., Gu Z., Lin J., 2017, Enhanced
cisplatin chemotherapy by iron oxide nanocarrier-mediated generation of highly toxic reactive oxygen
species, Nano Letters, 17, 928–937.
Mahmoud M.E., Abdelwahab M.S., Fathallah E.M., 2013, Design of novel nano-sorbents based on nano-
magnetic iron oxide–bound-nanosilicon oxide–immobilized-triethylenetetramine for implementation in water
treatment of heavy metals, Chemical Engineering Journal, 223, 318–327.
Massart R., 1981, Preparation of aqueous magnetic liquids in alkaline and acidic media, IEEE Transactions
Magnetics, 17, 1247–1248.
Nikam A.V., Prasad B.L.V., Kulkarni A.A., 2018, Wet chemical synthesis of metal oxide nanoparticles: a review,
CrystEngComm, 20, 50915107.
Ooi F., DuChene J.S., Qiu J., Graham J.O., Engelhard M.H., Cao G., Gai Z., Wei W.D., 2015, A facile
solvothermal synthesis of octahedral Fe3O4 nanoparticles, Small, 11, 26492653.
Prabha G., Raj V., 2016, Formation and characterization of β-cyclodextrin (β-Cd)-polyethyleneglycol (PEG)-
polyethyleneimine (PEI) coated Fe3O4 nanoparticles for loading and releasing 5-Fluorouracil drug,
Biomedicine & Pharmacotherapy, 80, 173–182.
Radoń A., Drygala A., Hawelek L., Lukowiec D., 2017, Structure and optical properties of Fe3O4 nanoparticles
synthesized by co-precipitation method with different organic modifiers, Materials Characterization, 131,
148156.
Reddy L.H., Arias J.L., Nicolas J., Couvreur P., 2012, Magnetic nanoparticles: design and characterization,
toxicity and biocompatibility, pharmaceutical and biomedical applications, Chemical Reviews, 112,
58185878.
Rezayan A.H., Mousavi M., Kheirjou S., Amoabediny G., Ardestani M.S., Mohammadnejad J., 2016,
Monodisperse magnetite (Fe3O4) nanoparticles modified with water soluble polymers for the diagnosis of
breast cancer by MRI method, Journal of Magnetism and Magnetic Materials, 420, 210–217.
Saei A.A., Barzegari A., Majd M.H., Asgari D., Omidi Y., 2014, Fe3O4 nanoparticles engineered for plasmid DNA
delivery to Escherichia coli, Journal of Nanoparticle Research, 16, 25212531.
Saha A., Mohanta S.C., Deka K., Deb P., Devi P.S., 2017, Surface-engineered multifunctional Eu:Gd2O3
nanoplates for targeted and pH-responsive drug delivery and imaging applications, ACS Applied Materials
& Interfaces, 9, 4126–4141.
Shi J., Liu D., Tong L., Yang X., Yang H., 2011, Magnetic and photoluminescence properties of
Fe3O4@SiO2@YP1−xVxO4:Dy3+ nanocomposites, Journal of Alloys and Compounds, 509, 1021110216.
Sun S., Zeng H., Robinson D.B., Raoux S., Rice P.M., Wang S.X., Li G., 2004, Monodisperse MFe2O4 (M = Fe,
Co, Mn) nanoparticles, Journal of the American Chemical Society, 126, 273279.
Xu Y.-Y., Zhou M., Geng H.-J., Haoa J.-J., Oua Q.-Q., Qi S.-D., Chena H., Chen X.-G., 2012, A simplified
method for synthesis of Fe3O4 PAA nanoparticles and its application for the removal of basic dyes. Applied
Surface Science, 258, 3897902.
Yazdani F., Seddigh M., 2016, Magnetite nanoparticles synthesized by co-precipitation method; the effects of
various iron anions on specifications, Materials Chemistry and Physics, 184, 318323.
Zhang S., Zhou Y., Nie W.Y., Song, L.Y., 2012, Preparation of Fe3O4/chitosan/poly(acrylic acid) composite
particles and its application in adsorbing copper ion (II), Cellulose, 19, 2081–2091.
Page 67
Proceedings of
The 5th International Conference on Low Carbon Asia & Beyond - ICLCA 2019 &
The 4th International Conference on Chemical Engineering, Food and
Biotechnology - ICCFB 2019
Vietnam, Malaysia
ISBN: 978-604-67-1372-2
ISBN 978-88-95608-67-9; ISSN 2283-9216
Chemical Constituents and Bioactivities of Ethyl Acetate
Extract from Tacca leontopetaloides (L) Kuntze Leaves
Minh-Tam K Nguyena*, Mong-Ngoc Phama, Cong-Tin Vana, Mai-Trinh Lea, Thuc-Vi
M. Trana
a Faculty of Chemical Engineering, University of Technology, VNU-HCM, Vietnam
Corresponding author: [email protected]
This research was carried out to analyse total polyphenol, flavonoid, saponin and reducing sugar contents as well as in vitro bioactivities of ethyl acetate extract obtained from Tacca leontopetaloides leaves. The results indicated that this fractionated extract contained high level of bioactive compounds and showed high anti-inflammatory capacity in vitro. In addition, ethyl acetate extract was against all of the tested microorganisms, especially against Fusarium oxysporum and Candida tropicalis.
1. Introduction
Tacca leontopetaloides (L) Kuntze tubers have been used for years in An Giang province, Vietnam as source
of starch but in-depth investigations on either its aerial parts chemical compositions or bioactivities remain
limited.
Therefore, based on medico-ethnobotanical knowledge about possible uses of Tacca leontopetaloides, this
study aimed at obtaining and evaluating biological properties of various extracts from Tacca leontopetaloides
leaves and choosing the best fraction for further research.
2. Material and Methods
2.1 Materials
Fresh leaves of Tacca leontopetaloides were collected in Tinh Bien District, An Giang Province. The leaves
were shade dried for three days before being grounded into powder.
2.2 Experimental Set-up
Preparation of the extracts
An amount of 20 g Tacca leontopetaloides leaf powder was extracted three times, each time with 100 ml
of ethanol 96% in 24 hours at room temperature. The ethanol extract (EtOH) was removed fats by shaking
with n-hexane (n-Hex); then the undissolved part was extracted with different organic solvents in
increasing polarity order [ethyl acetate (EtOAc), n-butanol (n-BuOH) and water] to get respective extracts.
The solvent was then evaporated in a rotary evaporator at 40 oC for dried extracts which were stored at -
20 oC in air-tight screw-capped glass vials until used for bioassays.
DPPH radical scavenging assay
This assay was conducted according to the method prescribed by Rao (1996) with some modifications
(Sreejayan & Rao, 1996). An amount of 100 μl DPPH solution (6 mM) and 100 μl of various
concentrations of the extracts or standard solution (ascorbic acid) were added into 2800 μl of methanol.
The mixtures were incubated at 370C for 30 min. Absorbance of each solution was measured at 517 nm
by UV-VIS spectrophotometer. The radical scavenging activity of samples was calculated as the percent
DPPH radical scavenging effect. IC50 value is calculated by GraphPad Prism via the base line of
inhibition percentage (base line established from 6 different concentrations).
Scavenging of ABTS radical cation

Page 68
This assay was conducted according to the method prescribed by Rao (1996) with some modifications
(Sreejayan & Rao, 1996). An amount of 100 μl DPPH solution (6 mM) and 100 μl of various
concentrations of the extracts or standard solution (ascorbic acid) were added into 2800 μl of methanol.
The mixtures were incubated at 370C for 30 min. Absorbance of each solution was measured at 517 nm
by UV-VIS spectrophotometer. The radical scavenging activity of samples was calculated as the percent
DPPH radical scavenging effect. IC50 value is calculated by GraphPad Prism via the base line of
inhibition percentage (base line established from 6 different concentrations).
Antimicrobial bioassay
Antimicrobial activities of extracts were tested against reference strains including Gram-negative bacteria
(Escherichia coli ATCC 25922, Pseudomonas aeruginosa ATCC 27853 and Salmonella enterica var
Typhimurium ATCC 14028), Gram-positive bacteria (Enterococcus faecalis ATCC 29212, Staphylococcus
aureus ATCC 25923 and methicillin-resistant Staphylococcus aureus ATCC 43300), yeasts (Candida
albicans ATCC 10231, Candida tropicalis ATCC 750) and moulds isolated from plants (Aspergillus niger
and Fusarium oxysporum). The disk-diffusion agar method was used and inhibitory zone diameters of
extracts were determined.
Anti-inflammatory activities
Protein denaturation has been documented to correlate with the occurrence of the inflammatory response
and employed as in vitro screening model for anti-inflammatory compounds (Chandra et al., 2012). Some
modifications were applied to study anti-inflammatory activity of Tacca leontopetaloides. Egg albumin
protein was used. The reaction mixture was consisting of 1 mL extracts’ solution or standard solution
(diclofenac sodium), 1 mL of 0.5% albumin and 1 mL of saline buffer (pH 6.4). The sample were incubated
at 37 ºC for 15 min and then heated to 70 ºC for 5 min, after cooling the samples the turbidity was
measured at 660 nm. The experiment was performed in triplicate. The Percentage inhibition of protein
denaturation was calculated as follows: Percentage inhibition = [1 - (A1 - A2) / A0] x 100 where A0 was
the absorbance of the control and A1 was the absorbance in the presence of the extract, A2 was the
absorbance without albumin.
Total polyphenol content determination
The amount of total phenols in EtOAc extract was determined using Folin-Ciocalteu reagent according to
the method of Singleton with some modifications. Gallic acid was used as a positive control. Samples (40
μL) were introduced into test cuvettes, and then 0.2 mL of Folin-Ciocalteu's reagent and 0.6 mL of sodium
carbonate (20%) were added. The absorbance of all samples was measured at 760 nm using the UV
spectrophotometer after incubating at 30°Cf or 1.5 h. Results were expressed as milligrams of gallic acid
equivalent (GAE) per 100 g dry extract. Each assay was performed in triplicate.
Total flavonoid content determination
Aluminium chloride colorimetric method was used for flavonoid determination (Zhishen, 1999) with some
modifications. 0.5 mL of sample solution was mixed with 2 mL of distilled water. 150 μL of sodium nitrite
was added. After 5 min, 150 μL of aluminium chloride (10%) was added and allowed to stand for 1 min.
Then, 1 mL of sodium hydroxide was added and the mixture was shaken to mix well. The absorbance was
measured at 510 nm using UV spectrophotometer.
Total saponin content determination
Total saponins (SP) were determined by the method of Hiai et al. (1976) with some modifications. 0.1 mL
of sample was mixed with 0.1 mL of vanillin reagent (8% vanillin in methanol) and then 1 mL of 72%
aqueous H2SO4 was added. The mixture was heated in a water bath at 60◦C for 10 min followed by
cooled in ice for 5 min and then it was kept at room temperature. The intensity of the colour developed
due to the presence of saponin was measured as optical density in a spectrophotometer 538 nm.
Oleanolic acid was used as a standard and the results obtained were expressed as mg oleanolic acid equivalent per 100 g of dried extract.
Total reducing sugars content determination
Total reducing sugars content was determined by the method of Miller et al. (1959) using DNS with some
modifications. The DNS method is a colorimetric technique that consists of a redox reaction between the
3,5-dinitrosalicyclic acid and the reducing sugars present in the sample. The reducing power of these
sugars comes from their carbonyl group, which can be oxidized to the carboxyl group by mild oxidizing
agents, while the DNS (yellow) is reduced to 3-amino-5-nitrosalicylic acid (red-brown) which can be
quantified by spectrophotometry at 540 nm, wavelength of maximum absorbance. The intensity of the
colour is proportional to the concentration of sugars. The reaction is carried out in an alkaline medium.

Page 69
3. Results and Discussion
3.1 Bioactivities of extracts from Tacca leontopetaloides leaves
All of the three extracts from Tacca leontopetaloides showed significant antioxidant activity in two different
methods of antioxidant assays tested (Table 1). The highest DPPH scavenging activity was observed in EtOAC
(IC50 = 70.13 ± 2.2 μg/ml). Similar trend was observed in scavenging activity of ABTS: EtOAC extract was also
the best (IC50 = 70.13 ± 2.2 μg/ml).
Table 1: Antioxidant activities of the fractionated extracts from Tacca leontopetaloides
IC50 (µg/ml)
DPPH ABTS
Hexane 633.91 ± 3.9 714.02 ± 4.0
EtOAc 70.13 ± 2.2 42.77 ± 0.1
n-BuOH 339.61 ± 13.2 239.49 ± 2.5
Water 612.76 ± 17.1 645.69 ± 9.9
Vitamin C 44.09 ± 0.8 27.05 ± 1.4
Antimicrobial activities of all extracts were relatively lower than that of standard antibiotic Gentamicin (Table 2).
Only hexane and EtOAc extracts showed the inhibitory zone against bacteria. Hexane extracts could not resist
two Gram-negative bacteria (S. enterica and P. aeruginosa) whereas the EtOAc extract did have activities on
all tested bacteria though those were lower than the ones of Gentamicin.
Table 2: Inhibitory zone diameters of the fractionated extracts from Tacca leontopetaloides
Diameter (mm)
Gentamicin Hexane EtOAc
(0.5 mg/mL)
E. coli 22 - 11
P. aeruginosa 30 - 15
S. enterica 23 10 12
E. faecalis 20 10 18
S. aureus 26 11 15
MRSA 21 11 16
From the above data, it could be inferred that EtOAc extract had the highest bioactivity because it contained the
most bioactive compounds. Therefore, this fraction was used for further study.
5.2 Bioactivities of EtOAc extract from Tacca leontopetaloides leaves
The data reported in Table 3 presents the antifungal activity of the EtOAc extract of Tacca leontopetaloides
leaves. The results indicated that the EtOAc extract was less effective than Itraconazole in inhibiting 3 of 4
tested strains but performed rather good activity against Fusarium oxysporum.
Table 3: Inhibitory zone diameters of the EtOH extract from Tacca leontopetaloides
Diameter (mm)
Itraconazole EtOAc
(4 mg/mL)
Candida albicans 23 12
Candida tropicalis 22 14
Aspergillus niger 19 12
Fusarium oxysporum - 20
The in vitro anti-inflammatory effect of EtOAc extract was evaluated against denaturation of egg albumin. The
results are showed in Table 4. The effect of diclofenac sodium was found to be 2.1 times less than that of EtOAc
extract by comparing their IC50 values (23.60 ± 0.1 mg/mL and 11.11 ± 0.5 mg/mL respectively).

Page 70
Table 4: Anti-inflammatory activity of EtOAc extract from Tacca leontopetaloides
IC50 (mg/ml)
Diclofenac sodium 23.60 ± 0.1
EtOAc extract 11.11 ± 0.5
3.2 Total Phenolic, Flavonoid, Saponin and Reducing sugar Contents
The amounts of total bioactive compounds in the EtOAC were detected by colourimetric methods, and the
results are summarised in Table 5. The total amount phenolics and another bioactive compounds could explaine
the strong bioactivities of Tacca leontopetaloides EtOAc extract.
Table 5: Total bioactive compounds in EtOAc extract from Tacca leontopetaloides leaves
% in EtOAC extract
Amount in dried weight
(mg/100g)
Total phenolic content 77.89 ± 0.32 2441.8 ± 17.10
Total flavonoid content 12.28 ± 0.13 384.88 ± 4.12
Total saponin content 19.15 ± 0.57 600.33 ± 17.87
Total reducing sugar content 11.09 ± 0.51 347.66 ± 15.96
4. Conclusions
Among extracts obtained from Tacca leontopetaloides leaves, the ethyl acetate extract demonstrated the
highest bioactivities especially significant anti-inflammatory activity and exhibited high total phenolic content.
Acknowledgments
This research was financially supported by Vietnam National University at Hochiminh city under grant coded
C2018-20-19.
References
Abdel-Aziz, A. M. E., 1990, Steroidal sapogenins from Tacca leontopetaloides, Planta medica 56(2), 218-221.
Andrews, J. M., 2001, Determination of minimum inhibitory concentrations, Journal of Antimicrobial
Chemotherapy 48(1), 5-16.
Balouiri, M., 2016, Methods for in vitro evaluating antimicrobial activity: A review, Journal of Pharmaceutical
Analysis 6, 1-79.
Borokini, T. I., 2012, Phytochemical Screening of Tacca leontopetaloides (L.) Kuntze Collected from Four
Geographical Locations in Nigeria, International Journal of Modern Botany 2 (4): p. 97-102.
Brand-Williams, W., 1995, Use of a free radical method to evaluate antioxidant activity, LWT - Food Science
and Technology 28(1), 5-30.
Chandra, S. C., 2012, Evaluation of in vitro anti-inflammatory activity of coffee against the denaturation of
protein, Asian Pacific Journal of Tropical Biomedicine 2(1), S178-S180.
Chen, Z., 1987, Steroidal bitter principles from Tacca plantaginea structures of taccalonolide A and B,
Tetrahedron letters 28(15), 1673-1675.
Habila, J. D., 2011, Comparative evaluation of phytochemicals, antioxidant and antimicrobial activity of four
medicinal plants native to northern Nigeria, Australian Journal of Basic and Applied Sciences 5(5), 537-543.
Hiai, S., 1976, Color reaction of some sapogenins and saponins with vanillin and sulfuric acid, Planta Medica
29(02), 116-122.
Jiang, J. J., 2014, Phytochemical and Pharmacological Studies of the Genus Tacca: A Review, Tropical Journal
of Pharmaceutical Research 13 (4), 635-648.
Lim, T. K. Tacca leontopetaloides. Edible Medicinal and Non-Medicinal Plants 10, 2016, 301-307.
Meena, K. L., 2010, Tacca leontopetaloides (Linn.) O. Kuntze (Taccaceae) – A new record to the flora of
Rajasthan, Indian Journal of Natural Products and Resources 1(4), 512-514.
Miean, K. H., 2001, Flavonoid (myricetin, quercetin, kaempferol, luteolin, and apigenin) content of edible tropical
plants, Journal of agricultural and food chemistry 49(6):3106-3112.
Miller, G. L., 1959, Use of dinitrosalicylic acid reagent for determination of reducing sugar, Analytical chemistry
31(3):426-428.
Mühlbauer, A., 2003, Five novel taccalonolides from the roots of the Vietnamese plant Tacca paxiana, Helvetica
chimica acta 86(6), 2065-2072.

Page 71
Nandwani, D., 2008, Medicinal plants and traditional knowledge in the Northern Mariana Islands, Journal of
Applied Biosciences 8(2), 323-330.
Park, Y., 2007, 1H and 13C‐NMR data of hydroxyflavone derivatives, Magnetic Resonance in chemistry 45(8),
674-679.
Perez, G., 2001, Anti-inflammatory activity of compounds isolated from plants, The Scientific World Journal 1,
713-784.
Pham, H. Y., 2016 Spirostanol saponins from Tacca vietnamensis and their anti-inflammatory activity,
Bioorganic & medicinal chemistry letters 26(15), 3780-3784.
Re, R., 1999, Antioxidant activity applying an improved ABTS radical cation decolorization assay, Free radical
biology and medicine 26(9-10), 1231-1237.
Scheuer, P. J., 1963, The constituents of Tacca leontopetaloides. Lloydia 26, 133-140.
Shimamura, T. Applicability of the DPPH Assay for evaluating the Antioxidant Capacity of Food Additives –
Inter-laboratory Evaluation Study. Analytical Sciences 30, 2014, 717-721.
Soobrattee, M. A., 2005., Phenolics as potential antioxidant therapeutic agents: mechanism and actions,
Mutation Research / Fundamental and Molecular Mechanisms of Mutagenesis 579(1-2), 200-213.
Tran, H. Q., 2012, Diarylheptanoid glycosides from Tacca plantaginea and their effects on NF-κB activation and
PPAR transcriptional activity, Bioorganic & medicinal chemistry letters 22(21), 6681-6687.
Wang, Q., 2010, Antibacterial activity and mechanism of luteolin on Staphylococcus aureus, Wei Sheng Wu
Xue Bao 50(9), 1180-1184.
Wojdyło, A., 2007, Antioxidant activity and phenolic compounds in 32 selected herbs, Food chemistry 105(3),
940-949.

Page 72
Proceedings of
The 5th International Conference on Low Carbon Asia & Beyond - ICLCA 2019 &
The 4th International Conference on Chemical Engineering, Food and
Biotechnology - ICCFB 2019
Vietnam, Malaysia
ISBN: 978-604-67-1372-2
ISBN 978-88-95608-67-9; ISSN 2283-9216
Catalytic Removal of Formaldehyde in Humid Condition Using
Nano-Sized Noble Metal Supported on Ceria-Granular
Carbon at Room Temperature
Bien Cong Trung, Le Nguyen Quang Tu, Ngo Thanh An, Nguyen Quang Long*
Faculty of Chemical Engineering, Ho Chi Minh City University of Technology, Vietnam
Noble metal (Au, Pd, and Au-Pd) was supported on ceria/granular carbon (CeO2/GC) by metal-sol method and
used for adsorption and catalytic oxidation of formaldehyde which is a major indoor air pollutant. The crystal
characteristic, surface properties, morphology and the actual metal content on the catalysts were evaluated.
The catalyst’s stability and the concentration of CO2 in the outlet stream were also investigated. The 0.5%Au-
0.27%Pd/CeO2/GC catalyst exhibited superior catalytic activity and stability toward formaldehyde oxidation at
room temperature. The formaldehyde removal efficiency was kept nearly at 83 % for a reaction time of 10 h with
a high formaldehyde concentration of 3,278 ppmv, relative humidity of 77 % and GHSV of 30,600 h-1.
1. Introduction
Formaldehyde (HCHO) is recognized as one of the major air pollutants in the indoor environment and widely
derived from wooden furniture and decorating materials (Nie et al., 2016). Formaldehyde pollution has attracted
much attention due to its carcinogenicity and teratogenicity (Lu et al., 2017). It is well known that long-term
exposure to air containing HCHO, even from exposure to very low concentrations at ppm level, may cause
serious health problems (Tan et al., 2015). Thus, the removal of HCHO is of significant practical interest to
improve our indoor air quality. Catalytic oxidation of HCHO is an efficient and environmentally friendly approach
to its removal (Huang et al., 2016).
Supported noble metals (e.g., Au, Pd, Pt) have been proposed as efficient heterogeneous catalysts for HCHO
oxidation at low temperature (<100 °C). Several catalysts have been developed such as Au/TiO2 (Ma et al.,
2016), Au/MnO2 (Pang et al., 2016), Pd/TiO2 (Huang et al., 2011) and Pt/TiO2 (Qi et al, 2016). Au-based
catalysts have been found to have promising catalytic activities with HCHO conversion at low temperature (Li
et al., 2011).
On the other hands, water vapor can be present in the gas stream from the atmosphere or formed as a reaction
product. Wu et al. (2014) reported that the competitive adsorption between the organic compound and H2O
molecules on the active sites results typically in lower catalytic activity with nickel oxide catalysts supported on
ɣ-Al2O3, SBA-15 and TiO2. Soares et al. (2016) have reported that humidity has a significant effect on the
oxidation of ethyl and butyl acetate with cryptomelane-type manganese oxide catalyst. Wu et al. (2000)
concluded that water vapor reduced the activity only slightly due to the hydrophobicity of activated carbon (AC)
with Pt/AC catalysts. The activated carbon can utilize for volatile organic compounds (VOCs) removal by
adsorption (Iovino et al., 2013).
In this work, monometallic Au/Pd and bimetallic Au-Pd supported on CeO2/Granular carbon catalyst were
prepared using a metal sol method. The catalytic activity for formaldehyde removal by combined adsorption and
catalytic oxidation at room temperature was investigated. The catalysts were characterized by XRD, BET, SEM,
TEM methods. The catalyst’s stability with/without moisture was also evaluated.
Page 73
2. Materials and methods
2.1 Material preparation and characterization
The particles size of commercial granular carbon (GC) was comprised between 0.5 and 1 mm (supplied by
TRABAC Joint Stock Corporation). CeO2 supported on GC was prepared by a one-step-impregnation method
with an excess of solvent (C2H5OH solution and distilled water, with molar ratio C2H5OH/H2O of 5/3). An
appropriate amount of GC used as support was stirred in 100 mL of solvent at room temperature in 15 min in
the reaction vessel. The adequate amounts of Ce(NO3)3·6H2O (99.5 %, from Acros) was dissolved in 60 mL
solvent and was slowly added (2 mL/min) to the above reaction vessel to have CeO2 loading of 20 wt%. The
decomposition of the cerium precursor to having CeO2/GC was practiced under flowing N2 (50 mL/min) at 623
K for 5 h (heating rate of 5 K/min).
The monometallic Au and Pd and bimetallic Au-Pd supported on CeO2/GC were synthesized by chemical
reduction method (metal sol method). Firstly, a suitable amount of polyvinyl alcohol (PVA) solution (1 wt%) was
added to an aqueous HAuCl4 0.4 mg/mL or/and PdCl2 0.4 mg/mL under vigorous stirring. Then, a freshly
prepared solution of NaBH4 (molar ratio NaBH4/M = 4) was slowly added dropwise into the mixture. After that,
5 g of GC was added after the pH of the mixture was adjusted to 4 using HCl/NH4OH solution. The mixture
solution was stirred and vacuumed at 50 °C for drying, then the mixture washed until no Cl− was detected by
AgNO3 solution. After that, the sample was dried at 100 °C for 12 h. The mass ratio of PVA/metal atoms of
bimetallic Au-Pd catalysts was maintained and the molar ratio of Au:Pd was 1:1. All chemicals were purchased
from Acros/Fisher and used without further purification.
The loading contents of Au on 0.5%Au/CeO2/GC and 0.5%Au-0.27%Pd/CeO2/GC catalysts were 0.5%. The
loading contents of Pd on 0.5%Pd/CeO2/GC and 0.5%Au-0.27%Pd/CeO2/GC catalysts were 0.5% and 0.27%.
The crystalline structure of the samples was measured by powder X-Ray Diffraction (XRD, Advance D8
diffractometer), with Cu Kα radiation (λ = 1.5418 Å) operated at 40 kV. The surface morphology of each catalyst
and GC was observed by scanning electron microscope (SEM, JEOL – JSM 5500) operated at 10 kV. BET
(Brunauer‐Emmett‐Teller), the surface area data was recorded on NOVA 2200e, Quantachrome Instruments
version 10.0. The size and the size distribution of noble metals particles were obtained using transmission
electron microscopy (TEM, JEOL – JEM 1400) operated at 100 kV.
2.2 Formaldehyde removal test
The efficiency for formaldehyde removal of the combination adsorption-catalysis in this experiments was
processed under atmospheric pressure in a U-shaped glass reaction vessel (internal diameter of 12 mm) and
operated in continuous mode. The N2 gas (99.99 %) and O2 (99.9 %) purchased from Phu-Thinh company and
formaldehyde (37 wt% in H2O) purchased from Sigma Aldrich were used in the experiments. Catalysts (0.2 g)
are deposited on a glass wool layer in the vessel. Each catalyst was pre-treated under flowing N2 (6 L/h) at 200
°C in 1 h before use. The gaseous feed was received by passing model air (80 % N2 and 20 % O2, v/v) through
two parallel saturators, one containing formaldehyde in a thermostat bath and the other containing distilled H2O.
Both were kept at the suitable temperatures to ensure that the formaldehyde concentration in the gaseous feed
was 3,278 ppmv for the wet condition, and H2O vapor content of 23.7 mg/L (relative humidity 77 % at 25 °C) for
the wet condition. The total flow rate of gaseous feed was 150 mL/min, corresponding to gas hourly space
velocity (GHSV) about 30,600 h-1. The formaldehyde removal efficiency of the catalyst was evaluated at room
temperature. The effluent gas was recorded by an online Gas Chromatograph HP-5890plus with a flame
ionization detector (FID) and HP-Plot/Q (30 m x 0.53 mm) column. The CO2 in the output stream was recorded
by a CO2 monitor (Alphasense sensor technology company, UK). In particular, the 6-way valve system allows
the operating different processes without changing the pipeline of the system. The HCHO removal efficiency
was calculated according to Eq(1) as follows:
[HCHO]Formaldehyde removal (%) = 100 - ×100
[HCHO]o (1)
Where [HCHO] and [HCHO]o are the areas of the gas chromatograph result’s peak of the formaldehyde at a
reaction time (t) and the beginning (t = 0).

Page 74
3. Results and discussion
3.1 Characterization results
10 20 30 40 50 60 70 80
GC
CeO2/GC
0.5%Au/CeO2/GC
0.5%Au-0.27%Pd/CeO2/GC
Inte
nsit
y (
a.u
.)
2(degree)
Au
Figure 1: XRD patterns of GC, CeO2/GC, 0.5%Au/CeO2/GC and 0.5%Au-0.27%Pd/CeO2/GC.
The X-ray diffraction pattern recorded for the as-prepared samples is shown in Figure 1. The GC exhibited a
unique broad peak at 2 from 24.3° to 26.3°, and peak at 43.4° corresponding to the Miller indices (002) and
(101) in all samples (Li et al., 2007). All the reflections on the XRD pattern can be indexed to that of ceria
according to the literature pattern (JCPDS card No. 34-0394). The diffraction peaks correspond to the (111),
(200), (220), and (311) planes, represent the face-centered cubic structure (FCC) in all catalysts (Peng et al.,
2005). For 0.5%Au/CeO2/GC sample, the peaks at 37.9° and 44.2° corresponding to the Miller indices (111)
and (200) represent the face-centered cubic structure of gold (JCPDS card No. 04-0784) (Jha and Prasad,
2011). Finally, for the 0.5%Au-0.27%Pd/CeO2/GC sample, no peaks corresponding to Au and Pd can be
observed in the XRD spectra, indicating that Au and Pd nanoparticles are high dispersion and their crystal size
are very small, as observed in the TEM images (Figure 3).
The BET surface area of GC was 728 m2/g whereas the BET surface area of CeO2/GC, 0.5%Au/CeO2/GC,
0.5%Pd/CeO2/GC and 0.5%Au-0.27%Pd/CeO2/GC were 685 m2/g, 625 m2/g, 593 m2/g and 568 m2/g. It can be
seen that the chemical reduction method (metal sol method) can be used to deposit noble metal (Au, Pd, and
Au-Pd) on the ceria/granular carbon. After adding noble metal (Au, Pd, and Au-Pd) on CeO2/GC the BET surface
area decreased (Liu et al., 2014).
Figure 2: SEM images of (a) GC, (b) CeO2/GC, (c) 0.5%Au/CeO2/GC, (d) 0.5%Pd/CeO2/GC and (e) 0.5%Au-
0.27%Pd/CeO2/GC
(c) (d) (e)
(a) (b)

Page 75
SEM images of noble metal (Au, Pd, and Au-Pd) synthesized on CeO2/GC are shown in Figure 2. The GC
surface is smooth and includes stacked carbon plates. The granular carbon image measured by this SEM
method is similar to results reported by Yan et al., (2019). The well-dispersed metal layer was observed on the
surface of M/CeO2/GC (M = Au, Pd, and Au-Pd), which was due to the pore being blocked by surface deposition
of ceria and metal M, thereby decreasing BET surface area.
TEM analysis of the monometallic Au/Pd and bimetallic Au-Pd catalysts supported on CeO2/GC is shown in
Figure 3. All the catalyst samples showed spherical particles dispersed on the support CeO2/GC. The shape of
the Au nanoparticles determined by TEM method has the similar results as previous study (Minh et al., 2018),
while the shape of the Pd particles was also the similar as previous study (Tu et al., 2019). The Au nanoparticles
of monometallic 0.5%Au/CeO2/GC showed an average size of particles of 6 ± 2 nm. Pd nanoparticles of
0.5%Pd/CeO2/GC revealed an average size of 30 ± 5 nm whereas Au-Pd nanoparticles of 0.5%Au-
0.27%Pd/CeO2/GC showed 3 ± 2 nm particles. These results indicate that the size of AuPd particles decreased
when Au and Pd were both supported on the ceria/granular carbon in the bimetallic catalyst.
Figure 3: TEM images of (a) 0.5%Au/CeO2/GC, (b) 0.5%Pd/CeO2/GC and (c) 0.5%Au-0.27%Pd/CeO2/GC
3.2 Formaldehyde removal efficiency
Figure 4: Formaldehyde removal efficiency by combined adsorption-catalysis over different materials at room
temperature
The HCHO removal efficiency of samples GC, CeO2/GC, 0.5%Au/CeO2/GC, 0.5%Pd/CeO2/GC and 0.5%Au-
0.27%Pd/CeO2/GC by dual-functional adsorbent/catalysts under high humidity condition (Relative humidity (RH)
about 77 %), at room temperature are shown in Figure 4. The formaldehyde removal efficiency of the
0.5%Au/CeO2/GC, 0.5%Pd/CeO2/GC and 0.5%Au-0.27%Pd/CeO2/GC samples by combined adsorption-
catalysis are higher than the granular carbon and CeO2/GC samples. Furthermore, formaldehyde removal
efficiency by GC and CeO2/GC was almost similar. Therefore, the HCHO removal efficiency of the
0.5%Au/CeO2/GC, 0.5%Pd/CeO2/GC and 0.5%Au-0.27%Pd/CeO2/GC samples by combined adsorption-
catalysis. While the HCHO removal efficiency of GC and CeO2/GC samples was only adsorption. In particular,
the HCHO removal efficiency of 0.5%Au-0.27%Pd/CeO2/GC sample was 83.6 % at room temperature by
adsorption and oxidation.
With the best formaldehyde removal efficiency, the 0.5%Au-0.27%Pd/CeO2/GC catalyst was selected to analyze
the stability, water-resistance test. It can be seen that despite the high humidity condition (RH = 77 %), the
HCHO removal efficiency of 0.5%Au-0.27%Pd/CeO2/GC was not significantly changed (Figure 5). The
(a) (b) Au
CeO2
CeO2
Pd
(c)
0
20
40
60
80
100
0 20 40 60 80 100 120 140
Fo
rmald
ehyde
reductio
n
(%)
Time (min)
GC
CeO2/GC
0.5%Au/CeO2/GC
0.5%Pd/CeO2/GC
0.5%Au-0.27%Pd/CeO2/GC
AuPd
CeO2

Page 76
hydrophobicity of GC may be suitable explanation for the phenomena observed in this work. This result is similar
to results reported by Wu et al., (2000). Notably, the oxidation activity of the 0.5%Au-0.27%Pd/CeO2/GC catalyst
was almost constant after reaction for 10 h. The carbon dioxide concentration in the reactor’s output stream
corresponds to the formaldehyde concentration reduction. No other organic compounds (except HCHO) have
been detected by our Gas Chromatograph.
Figure 5: Stability, H2O resistance test, and CO2 concentration after the reaction of the 0.5%Au-
0.27%Pd/CeO2/GC for formaldehyde removal by catalytic oxidation at room temperature
4. Conclusions
The nano-sized monometallic Au/Pd and bimetallic Au-Pd supported on CeO2/GC have been successfully
synthesized by chemical reduction method (metal-sol method). The formaldehyde removal efficiency of
materials by a combination of adsorption and oxidation at room temperature was investigated. The stability,
water-resistance of the catalyst, and carbon dioxide concentration in the outlet stream after the reaction were
studied. The catalyst of 0.5%Au-0.27%Pd/CeO2/GC had the best formaldehyde removal efficiency in this study
and the stable of good catalyst, this result may be due to the smaller size of AuPd particles when Au and Pd
were both supported on the CeO2/GC, and the water vapour reduced the formaldehyde removal efficiency only
slightly due to the hydrophobicity of granular carbon.
References
Huang H., Leung D.Y., 2011, Complete oxidation of formaldehyde at room temperature using TiO2 supported
metallic Pd nanoparticles, ACS Catalysis, 1, 348-354.
Huang Y., Long B., Tang M., Rui Z., Balogun M.S., Tong Y., Ji H., 2016, Bifunctional catalytic material: An
ultrastable and high-performance surface defect CeO2 nanosheets for formaldehyde thermal oxidation and
photocatalytic oxidation, Applied Catalysis B: Environmental, 181, 779-787.
Iovino P., Canzanoa S., Capassoa S., Di Nataleb M., Ertob A., Lamab A., Musmarrab D., 2013, Single and
competitive adsorption of toluene and naphthalene onto activated carbon, Chemical Engineering
Transactions, 32, 67-72.
Jha A.K., Prasad K., 2011, Biosynthesis of gold nanoparticles using bael (Aegle marmelos) leaf: mythology
meets technology, International Journal of Green Nanotechnology, 3, 92-97.
Li H.F., Zhang N., Chen P., Luo M.F., Lu J.Q., 2011, High surface area Au/CeO2 catalysts for low temperature
formaldehyde oxidation, Applied Catalysis B: Environmental, 110, 279-285.
Li Z.Q., Lu C.J., Xia Z.P., Zhou Y., Luo Z., 2007, X-ray diffraction patterns of graphite and turbostratic
carbon, Carbon, 45, 1686-1695.
Liu Z.S., Peng Y.H., Li W.K., 2014, Effects of activated carbon fibre-supported metal oxide characteristics on
toluene removal, Environmental technology, 35, 1499-1507.
Lu S., Li K., Huang F., Chen C., Sun B., 2017, Efficient MnOx-Co3O4-CeO2 catalysts for formaldehyde
elimination, Applied Surface Science, 400, 277-282.
Ma C., Pang G., He G., Li Y., He C., Hao Z., 2016, Layered sphere-shaped TiO2 capped with gold nanoparticles
on structural defects and their catalysis of formaldehyde oxidation, Journal of Environmental Sciences, 39,
77-85.
0
1,000
2,000
3,000
4,000
0
20
40
60
80
100
0 2 4 6 8 10
CO
2 c
oncentr
ation (
ppm
v)
HC
HO
rem
oval eff
icie
ncy (
%)
Time (h)
RH = 0% RH = 0% RH = 77%

Page 77
Minh N.T., Trung B.C., An N.T., Long N.Q., 2018, Dual functional adsorbent/catalyst of nano-gold/metal oxides
supported on carbon grain for low-temperature removal of toluene in the presence of water vapour, Clean
Technologies and Environmental Policy, 20, 1861-1873.
Nie L., Yu J., Jaroniec M., Tao F.F., 2016, Room-temperature catalytic oxidation of formaldehyde on
catalysts, Catalysis Science & Technology, 6, 3649-3669.
Pang G., Wang D., Zhang Y., Ma C., Hao Z., 2016, Catalytic activities and mechanism of formaldehyde oxidation
over gold supported on MnO2 microsphere catalysts at room temperature, Frontiers of Environmental
Science & Engineering, 10, 447-457.
Peng X., Luan Z., Ding J., Di Z., Li Y., Tian B., 2005, Ceria nanoparticles supported on carbon nanotubes for
the removal of arsenate from water, Materials letters, 59, 399-403.
Qi L., Cheng B., Yu J., Ho W., 2016, High-surface area mesoporous Pt/TiO2 hollow chains for efficient
formaldehyde decomposition at ambient temperature, Journal of hazardous materials, 301, 522-530.
Soares O.S.G.P., Órfão J.J.M., Figueiredo J.L., Pereira M.F.R., 2016, Oxidation of mixtures of ethyl acetate and
butyl acetate over cryptomelane and the effect of water vapour, Environmental Progress & Sustainable
Energy, 35, 1324-1329.
Tan H., Wang J., Yu S., Zhou K., 2015, Support morphology-dependent catalytic activity of Pd/CeO2 for
formaldehyde oxidation, Environmental science & technology, 49, 8675-8682.
Tu L.N.Q., Nhan N.V.H., Dung N.V., An N.T., Long N.Q., 2019, Enhanced photocatalytic performance and
moisture tolerance of nano-sized Me/TiO2–zeolite Y (Me = Au, Pd) for gaseous toluene removal: activity and
mechanistic investigation, Journal of Nanoparticle Research, 21, 194.
Wu J.C.S., Lin Z.A., Tsai F.M., Pan J.W., 2000, Low-temperature complete oxidation of BTX on Pt/activated
carbon catalysts, Catalysis Today, 63, 419-426.
Wu J., Xia Q., Wang H., Li Z., 2014, Catalytic performance of plasma catalysis system with nickel oxide catalysts
on different supports for toluene removal: effect of water vapour, Applied Catalysis B: Environmental, 156,
265-272.
Yan K.Z., Zaini M.A.A., Arsad A., Nasri N.S., 2019, Rubber Seed Shell Based Activated Carbon by Physical
Activation for Phenol Removal, Chemical Engineering Transactions, 72, 151-156.

Page 78
Proceedings of
The 5th International Conference on Low Carbon Asia & Beyond - ICLCA 2019 &
The 4th International Conference on Chemical Engineering, Food and
Biotechnology - ICCFB 2019
Vietnam, Malaysia
ISBN: 978-604-67-1372-2
ISBN 978-88-95608-67-9; ISSN 2283-9216
Investigation of activity of Edwardsiella ictaluri bacteriophages
at different conditions
Tran T.T. Xuan*, Hoang A. Hoang*
Department of Biotechnology, Faculty of Chemical Engineering,
Ho Chi Minh City University of Technology, Vietnam National University – Ho Chi Minh City (VNU-HCM), 268 Ly Thuong Kiet
St., District 10, HCMC, Vietnam
[email protected]; [email protected]
White spots in the internal organs, caused by the bacterium Edwardsiella ictaluri, is among the most common
and serious diseases in striped catfish in Mekong Delta, Vietnam. Bacteriophage or phage is virus infecting only
bacterium. Phage therapy is the use of lytic phages as a treatment for pathogenic bacterial infections. Stability
of phage to different conditions is one of the first considerations in phage therapy. Until now, there is no phage
therapy is applied to treat bacterial diseases in striped catfish. In this study, activity of G1, G7 and G9.1 phages
to factors such as organic solvents, temperature, and pH was investigated. Among these phages, G9.1 was
found to be relatively the most stable in terms of temperature, pH, and organic solvents. The activity of G9.1
was retained to approximately 90% at 37 °C for 1 h. Its activity was maintained about 90% at pH 7–11 for 24 h
and approximately 70–87% in organic solvents such as chloroform or diethyl ether, for 1 h. In conclusion, G9.1
was found to be promising in phage therapy for in vivo treatment of white spots in the internal organs in striped
catfish.
1. Introduction
The annual cycle of bacterial pathogen infections significantly affects the sustainable development of the striped
catfish industry in the region. The most common of which is white spots in the internal organs caused by
Edwardsiella ictaluri. This disease first appeared among striped catfish in Vietnam in 1998, associated with a
high mortality rate (up to 90%) (Dung et al., 2002; Dang and Nguyen, 2010). The use of antibiotics as the major
preventative and curative treatment for this disease has since become common in the region. However, such
control efforts have recently proven inadequate due to the development of antibiotic resistance by E. ictaluri
(Quach et al., 2014). This has raised concerns regarding the long-term efficacy of antibiotic treatment in the
commercial production of striped catfish. In addition, residual antibiotics at levels above approved limits in frozen
striped catfish fillets may affect consumers’ health. Due to these adverse impacts, there is an urgent need to
identify more effective solutions to replace antibiotics. Bacteriophages (or phages) are virus infecting only
bacteria. They were first discovered by Frederick W. Twort (Twort, 1915). Phage therapy involves the
therapeutic use of phages to prevent and treat pathogenic bacterial infections. Such therapy has only gained
serious attention in the aqua industry in the last 30 years due to the wide spread of antibiotic resistance in
bacteria. Phage therapy has shown its efficacy in treatment of bacterial diseases in fish and shellfish (reviewed
by Richards, 2014; Doss, 2017).
Currently, some phages G1, G7 and G9.1 infecting E. ictaluri in stripped catfish were isolated and characterized
their latent period, burst size. However, phages are constructed relatively simply with a protein capsid and
nucleic genome. Their activity is significantly affected by preservation and environmental conditions. Thus,
phage stability should be clarified prior to in vivo trials. In this study, the stability of these phages with respect to
temperature, pH, and organic solvents was investigated.

Page 79
2. Materials and methods
2.1 Phage isolation
Striped catfish kidney and liver samples were obtained from markets in Ho Chi Minh City and transferred to the
laboratory under cold conditions for phage isolation. The samples were homogenized and added to a log-phase
E. ictaluri CT1 culture. The mixture was then incubated overnight at 30 °C with rotation at 150 rpm. An aliquot
was subsequently taken and centrifuged at 9,727 ×g at 4 °C for 5 min. The resulting supernatant was passed
through a 0.22-μm filter, and the filtrate subjected to a plaque assay. A single transparent plaque was picked
from the plate, suspended in SM buffer, incubated overnight at 4 °C, and passed through a 0.22-μm filter. The
resulting filtrate was subjected to the above protocol three times in succession to purify the phage. The purified
phage stock was prepared as described elsewhere (Hoang et al., 2018).
2.2 Temperature stability test
Phage stocks of G1, G7, and G9.1 were prepared against E. ictaluri CT1. The stability of each phage at various
temperatures (4, 20, 30, 37, 50 and 65 °C) was investigated by incubating the phage (~109 PFU mL-1) at the
respective temperatures for 1 h (Verma et al., 2009; Jun et al., 2013; Yamaki et al., 2014). The phage titer was
estimated by serial dilution and the double agar-layer method (Hoang et al., 2014). The experiment was
conducted in triplicate.
2.3 pH stability test
To determine the stability of the phages at various pHs, the pH of tryptone soya broth (TSB) was adjusted using
either 1M HCl or 1M NaOH to attain solutions with pHs of 3, 4, 5, 6, 7, 8, 9, 10, 11, 12 and 13. Each phage
suspension (~109 PFU mL-1) was mixed with an equal volume of the TSB and incubated at 30 °C for 24 h (Verma
et al., 2009; Jun et al., 2013; Yamaki et al., 2014). After incubation, the phage titer was estimated by serial
dilution and the double agar-layer method, as described above. Phage suspension maintained at pH 7 was used
as control. The experiment was conducted in triplicate.
2.4 Organic solvent stability test
To assess the stability of the phages in organic solvents, a volume of each phage (~109 PFU mL-1) was mixed
with an equal volume of appropriate organic solvent (ethanol, chloroform, diethyl ether, SM buffer) and incubated
at 30 °C for 1 h (Verma et al., 2009; Jun et al., 2013). The mixture was then centrifuged at 4 °C, 10,000 xg for
10 min. Phage titer was estimated by serial dilution and the double agar-layer method, as described previously.
Phage suspension mixed with Phosphate Buffered Saline (PBS) was used as control. The experiment was
conducted in triplicate.
3. Results
3.1. Phages isolated
Some phages G1, G7, and G9.1 were isolated, purified, and chosen. The other phages were not chosen since
they resulted in small plaques (approximately 0.5 mm in diameter). Plaques of the chosen phages were shown
in Figure 1.
G1 G7 G9.1
Figure 1. Phage plaques

Page 80
3.2. Thermal stability of phages
Thermal and pH stability of phages were evaluated. G9.1 was found to be relatively thermostable at 20–37 °C
(Figure 1), with phage activity being retained to approximately 80–95% compared to control. In the case of G7,
phage activity was relatively similar to that of G9.1 at 20 °C, but, the activity was lower at 30 °C and 37 °C. On
the other hand, activity of G1 phage decreased rapidly compared to that of the other phages when temperature
increased. At high temperature of 50 °C, activity of all three phages decreased much to less than 50%. And at
65 °C, the activity completely appeared indicating that the phages were degraded totally. So, among three
phages, G9.1 phage showed the highest stability at different temperatures. The phage activity of G9.1 was much
greater than other published phages (Jun et al., 2013; Yamaki et al., 2014).
Figure 2. Effect of temperature on the viability of phages. Optimal condition at 4 °C was used as control. Error
bars indicate 95% confidence intervals for the averaged values (n = 3).
3.3. pH stability of phages
A pH stability analysis showed that three phages were stable at pH 7–11, with relatively little difference in the
phage titers with respect to control being observed (Figure 3). In contrast, significant reduction of phage activity
was noted at acidic condition (lower than pH 7). Phage G7 showed a little higher stability than other phages at
acidic condition. However, at pH 3.0, activity of all three phages losted completely. At alkaline condition, almost
no difference of activity of three phages was observed.
Figure 3. Stability of phages incubated at various pHs. Optimal condition at pH 7 was used as control. Error bars
indicate 95% confidence intervals for the averaged values (n = 3).
0
10
20
30
40
50
60
70
80
90
100
4℃ 20℃ 30℃ 37℃ 50℃ 65℃
Rem
ain
ing
acti
vity
(%
)
Temperature (oC)
G1G7G9.1
0
10
20
30
40
50
60
70
80
90
100
pH3.0 pH4.0 pH5.0 pH6.0 pH7.0 pH8.0 pH9.0 pH10 pH11 pH12 pH13
Stab
ility
(%
)
pH (-)
G1
G7
G9.1

Page 81
3.4. Organic solvent stability of phage
No effect on phage activity of G7 and G9.1 was observed after 1 h of incubation with SM (Figure 4), while that
of G1 phage decreased about 20%. In conditions, incubated either in chloroform or diethyl ether, activity of
phages G1 and G7 much decreased to more than 50%. In contrast, activity of G9.1 phage still remained about
70% and 87%, either in chloroform or diethyl ether, respectively. At the incubation in ethanol, activity of all three
phages completely losted. Many other published phages also completely lost their activity after treatment with
ethanol (Verma et al., 2009; Jun et al., 2013). Thus, among three phages, G9.1 phage showed the highest
resistance to organic solvents.
Figure 4. Viability of phages in the presence of various organic solvents. Incubation of phage in sterile PBS was
used as control. Error bars indicate 95% confidence intervals for the averaged values (n = 3).
4. Discussion
E. ictaluri is one of the main causative agents of mass mortality among striped catfish. However, no effective
method has been established to control E. ictaluri infections, except for the use of antibiotics. The high rates of
resistance to antibiotics exhibited by this pathogen have led to a significant reduction in production. Moreover,
increased levels of residual antibiotics have been detected in exported stock. Recently, many consignments
from leading Vietnamese producers have been rejected by importers in markets such as the USA, Japan, South
Korea, Canada, and Russia due to the presence of residual antibiotics in stock at levels higher than the approved
limit. Notably, since August 2nd, 2017, all consignments of imported striped catfish have been tested for
residuals of 89 types of antibiotics by the US Food and Drug Administration (2017). However, to the best of our
knowledge, relatively little information regarding phage therapy in treatment of the disease in striped catfish has
been reported. One of the first phages isolated from catfish farms in the Mekong delta against E. ictaluri was
shown (Hoang et al., 2018).
To apply phage therapy at farm scale, phage-containing liquid or solid product should be investigated. To apply
the phage-containing products at the farm scale, preservation condition of the products should be determined.
Preservation of phages has been discussed previously. Generally, most phages maintain their stability when
stored at low or freezing temperatures such as 4, -20, or -70 °C. Most research concerned phage preservation
in dry or liquid buffer state for usage in the laboratory or medicine (Choiska-Pulit et al., 2015). However, phage
preservation at ambient temperature is always challenging when the phage concentration decreases sharply in
a period of days (Joczyk et al., 2011). In the current study, G9.1 was found to be quite thermostable, with its
activity being maintained to approximately 85% at 37 °C. In addition, cryopreservatives also significantly support
survival of phages (Ackermann et al., 2004). G9.1 showed a high resistance to organic solvents such as
chloroform, and diethyl ether. These organic solvents will protect phage-containing products from contamination
of microorganisms. Therefore, G9.1 is highly promising in the creation of low-cost phage-containing products
stored at ambient temperature.
0
10
20
30
40
50
60
70
80
90
100
PBS SM Buffer Chloroform Ethanol Diethyl ether
Stab
ility
(%
)
Organic solvent
G1G7G9.1

Page 82
Striped catfish is relatively vulnerable to pond water conditions, with temperature and pH being two of the most
important parameters. Temperature and pH ranges in pond water suitable for striped catfish are 25–32 °C
(Duong, 2004) and 5.5–9.0 (Le et al., 2017), respectively. As investigated in the current study, activity of G9.1
was maintained at greater than 80% at these temperature and pH ranges. Therefore, this phage represents a
highly appropriate antimicrobial agent against E. ictaluri on striped catfish farms. In future studies, this phage
was selected to examine its stability and activity in in vivo control of E. ictaluri infection in striped catfish.
Acknowledgment
This research is funded by International Foundation for Science (IFS) under grant number I-2-A-6264-1.
References
Ackermann HW, Tremblay D & Moineau S (2004) Long-term bacteriophage preservation. WFCC Newsletter,
38, 35-40.
Choiska-Pulit A, Mitua P, liwka P, aba W & Skaradziska A (2015) Bacteriophage encapsulation: Trends and
potential applications. Trends in Food Science & Technology, 45(2), 212-221.
Dang THO, Nguyen TP. Detection of Edwardsiella ictaluri causing white spots in the internal organs of striped
catfish Pangasianodon hypophthalmus by using polymerase chain reaction technique Journal of Science –
Can Tho University 2010; 13: 151-59 (in Vietnamese)
Dung TT, Crumlish M, Turnbull JF, Ngoc NTN, Ferguson HW. Indentification of Edwardsiella ictaluri from
diseased freshwater catfish, Pangasius hypophthalmus (Sauvage), cultured in the Mekong delta, VietNam.
Journal of fish diseases 2002; 25: 733-36.
Doss, J, Culbertson, K, Hahn, D, Camacho, J, & Barekzi, N. (2017) A Review of Phage Therapy against Bacterial
Pathogens of Aquatic and Terrestrial Organisms. Viruses, 9(3), 50.
Duong NL (2004) Techniques for feeding freshwater fishes, Can Tho University Press (in Vietnamese).
FDA (USA, 2017): https://www.fsis.usda.gov/wps/portal/fsis/topics/inspection/siluriformes
Hoang, HA, Abe, M, and Nakasaki, K (2014) A novel colorimetric method for the detection of Escherichia coli
using cytochrome c peroxidase-encoding bacteriophage. FEMS. Microbiol. Lett., 352, 97-103.
Hoang, H. A., Yen, M. H., Ngoan, V. T., Nga, L. P., & Oanh, D. T. (2018). Virulent bacteriophage of Edwardsiella
ictaluri isolated from kidney and liver of striped catfish Pangasianodon hypophthalmus in Vietnam. Diseases
of aquatic organisms, 132(1), 49-56.
Joczyk E, Kak M, Midzybrodzki R & Górski A (2011). The influence of external factors on bacteriophages. Folia
microbiologica, 56(3), 191-200.
Jun, JW, Kim, JH, Shin, SP, Han, JE, Chai, JY, and Park, SC (2013) Protective effects of the Aeromonas phages
pAh1-C and pAh6-C against mass mortality of the cyprinid loach (Misgurnus anguillicaudatus) caused by
Aeromonas hydrophila. Aquaculture., 416-417, 289-295.
Le HN, Nguyen V. Be, Nguyen V.C. Ngan (2017) Survey on water quality at industrial Pangasius fish raising
areas for fishpond management purposes, Journal of Thu Dau Mot University (in Vietnamese), 4(35), 46-
54.
Quach, VCT, Tu, TD, and Dang, PHH (2014) The current status antimicrobial resistance in Edwardsiella ictaluri
and Aeromonas hydrophila cause disease on the striped catfish farmed in the Mekong Delta. J. Sci. – Can
Tho University, Special Issue: Aquaculture 2, 7-14 (2014) (in Vietnamese).
Richards, GP (2014) Bacteriophage remediation of bacterial pathogens in aquaculture: a review of the
technology, Bacteriophage. DOI:10.4161/21597081.2014.975540.
Twort, FW (1915) An investigation on the nature of ultra-microscopic viruses. The Lancet., 186, 1241-1243.
Verma, V, Harjai, K, and Chhibber, S (2009) Characterization of a T7-like lytic bacteriophage of Klebsiella
pneumoniae B5055: a potential therapeutic agent, Curr. Microbiol. 59, 274-281.
Yamaki, S, Omachi, T, Kawai, Y, & Yamazaki, K (2014) Characterization of a novel Morganella morganii
bacteriophage FSP1 isolated from river water. FEMS microbiology letters, 359(2), 166-172.

Page 83
Proceedings of
The 5th International Conference on Low Carbon Asia & Beyond - ICLCA 2019 &
The 4th International Conference on Chemical Engineering, Food and
Biotechnology - ICCFB 2019
Vietnam, Malaysia
ISBN: 978-604-67-1372-2
ISBN 978-88-95608-67-9; ISSN 2283-9216
Recovery of indium from waste streams by using supported liquid membranes with strip dispersion
Ngan Thi Tuyet Danga,b*, Da-Ming Wangb, Kien Trung Trana
a: School of Chemical Engineering, Hanoi University of Science and Technology, Hanoi, Vietnam
b: National Taiwan University, Department of Chemical Engineering, National Taiwan University, Taipei 10617, Taiwan
Two model systems of indium-containing waste stream were investigated. The first contained indium - the metal
widely used to prepare indium – tin oxide (ITO) electrode for liquid crystal displays (LCDs), plasma displays and
solar cells. The other also consisted of indium but in the presence of oxalic acid (2% v/v) which could be found
in the industrial etching solution (Ishikawa et al., 2012).
We evaluated and compared the efficiency of SLMSD in separation of indium from the solution with and without oxalic acid. As the results, Indium could be recovered from the feed solution without presence of oxalic acid with very high purities. However, the efficiency of the membrane in case with 2%v/v oxalic acid decreased significantly. Therefore, some possible solutions to improve membrane permeability in later case will be proposed.
1. Introduction
Indium is widely used to prepare indium tin oxide (ITO) electrodes for liquid crystal displays (LCDs), plasma displays and solar cells. However, the reserve of indium on the earth is limited, estimated to be about 0.05 ppm and 0.072 ppm in the continental and oceanic crusts, respectively (Taylor and McLennan, 1985). Recovery of indium from industrial waste stream can be of great help for balancing the demand and supply of indium and as well for environmental pollution control. One of the viable resource for indium recovery is the etching waste solution from indium-consuming fabrication processes (Chou et al., 2016). Liquid membrane, a process combining extraction and stripping (back-extraction), is the technique used in the present work for recovery of indium. For the process, extractant-containing oil is placed in between two aqueous solutions: the feed and strip solutions, and ions can be extracted from the feed to the oil and then be stripped from the oil to the strip solution. Because of its high selectivity for specific ions, the technique has attracted much research attention. However, practical applications of liquid-membrane processes are limited because of the difficulty in maintaining stable oil-water interfaces and in preventing extractant loss for long-term operations. To improve the stability of liquid membrane, various operation schemes have been introduced. One scheme that has been widely explored in recent years is the supported liquid membrane. Supported liquid membrane (SLM) is an operation scheme that the extractant-containing oil is impregnated in the pores of a microporous hydrophobic membrane, which is placed in between the feed and strip solutions. Because of the water repellence of the hydrophobic membrane, the aqueous feed and strip solutions cannot penetrate into the membrane pores, and stable oil-water interfaces can thus form to allow for ion extraction and stripping. Though it is a promising scheme for practical applications, SLM still has a potential long-term stability problem of losing extractant-containing oil from the pores of the hydrophobic support. Therefore, the SLM operation scheme has been modified for further improvement of long-term operation stability. A promising technique is the SLM with strip dispersion (SLMSD) (Ho and Poddar, 2001), in which the aqueous strip solution is dispersed in extractant-containing oil and then introduced to contact with the hydrophobic membrane. Though the oil can penetrate into the membrane pores, the strip solution cannot because the size of the dispersed droplet of strip solution is much larger than the membrane pores. With the technique, the oil loss from the membrane pores to the feed can be greatly reduced by applying a pressure in the feed, and the extractant contained in the membrane pores can be replenished from the strip side in case it is lost to the feed due to its solubility in water or other reasons.

Page 84
Conventional etchants are generally composed of inorganic acids (Graddon, 1956), such as HCl, HNO3, the
mixture of HCl, HNO3 or H2SO4. In this case, indium can be recovered well by SLMSD using D2EHPA as the
extractant. The extraction reaction can be described as following (Tsai and Tsai, 2012):
2𝐼𝑛(𝑎𝑞)3+ + 5(𝐻𝑅)2(𝑜𝑟𝑔) ⇌ 𝐼𝑛2𝑅10𝐻4(𝑜𝑟𝑔) + 6𝐻(𝑎𝑞)
+ (1)
with an equilibrium constant (Ke1) of 1.6x10³, where HR represents the chemical formula of D2EHPA. Over the past 20 years, organic acids have been used more often than inorganic acids, to avoid the problems
of equipment corrosion and attack of metal layers. A widely used etchant in the current LCD industry is oxalic
acid (Tsai and Wu, 2006) that forms complex with In3+ as described below:
𝐼𝑛3+ + 𝐻𝐶2𝑂4− ⇌ 𝐼𝑛(𝐻𝐶2𝑂4)2+ (2)
with an equilibrium constant (Ke2) of 1.2x10³. Because 𝐾𝑒1 ≈ 𝐾𝑒2, oxalic acid competes with D2EHPA for indium; therefore, the presence of oxalic acid slows
down indium extraction. To improve the ion extraction efficiency, one can either decrease the oxalic-acid
concentration to reduce the formation of indium-oxalate complex or increase the free D2EHPA content in the
organic solution to enhance the formation of indium-D2EHPA complex.
2. Experimentals
2.1. Materials and solution preparation:
Feed solutions: In2(SO4)3 (Sigma-Aldrich) was dissolved in water to prepare feed solution containing about 200
ppm of In3+. To simulate the waste etching solution from LCD industries, 2 wt% of oxalic acid was added to the
feed solution and H2SO4 (Sigma-Aldrich) was added to adjust the feed solution pH to 1.
Organic solutions: Di-(2-ethylhexyl) phosphoric acid (D2EHPA) (Merck) was used as extractant and Isopar-L
(Exxon Mobil Chemical) was used as diluent. 2 vol% of 1-dodecanol (Acros) was added as modifier to increase
the solubility of indium-D2EHPA complexes in Isopar-L.
Strip solutions: 5M of hydrochloric acid (HCl) (Sigma-Aldrich) aqueous solution was used as strip solution.
All the reagents were used as received without further purification, and the water used was all de-ionized.
2.2. Membrane modules:
Hydrophobic hollow-fiber modules with 6.35 cm in diameter and 20.3 cm in length were purchased from
Membrana. The membrane surface area of the module was 1.4 m2. The hollow fibers had outside diameters of
about 300 µm and inside diameters of about 220 µm, and the fiber walls contained pores with an average pore
size of 0.03 µm and a porosity of approximately 40%.
2.3. SLMSD
Figure 1 is the schematic presentation of the SLMSD set-up used in the present study. A commercial PP hollow
fiber module (Liqui-Cel, membrane surface area 1.4 m2) was used for the set-up. The feed solution was pumped
into the tube side of the membrane module and the strip solution was dispersed in the extractant-containing oil
and then pumped into the shell side.
The indium concentration in the aqueous phase was then assayed by using atomic absorption spectroscopy
(Perkin Elmer AAnalyst200). All the extraction experiments were conducted with the same stirring rate at room
temperature.
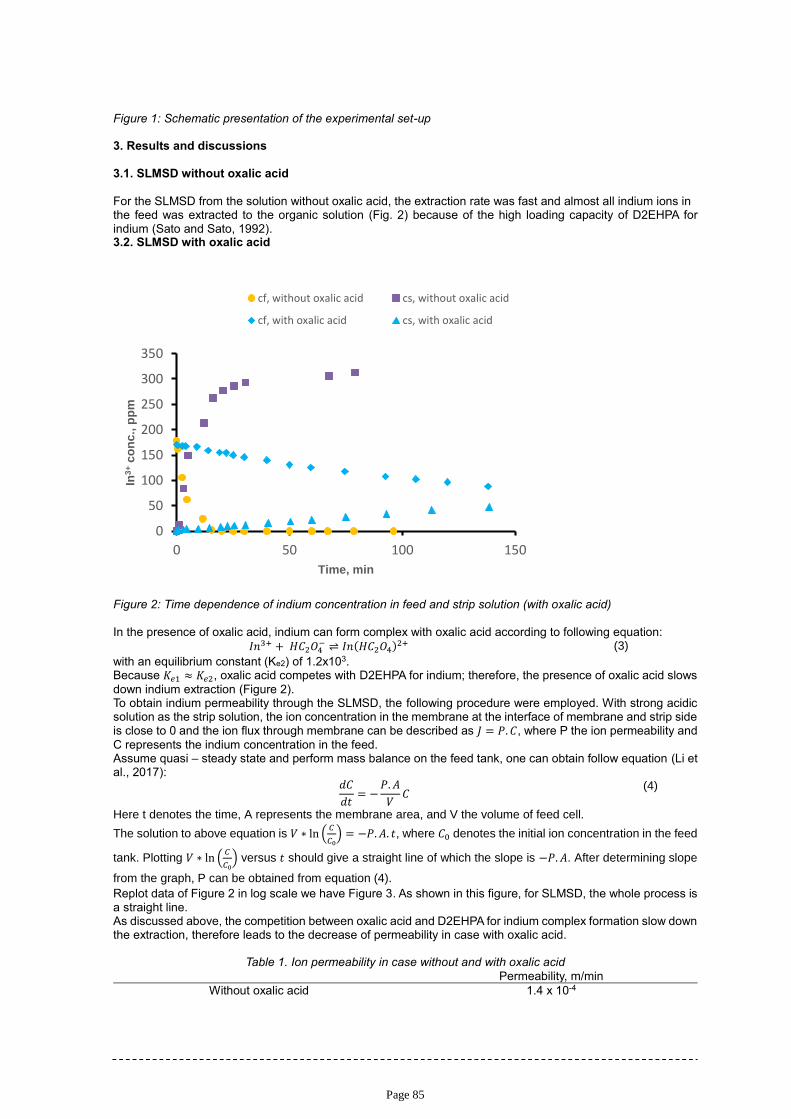
Page 85
Figure 1: Schematic presentation of the experimental set-up 3. Results and discussions
3.1. SLMSD without oxalic acid
For the SLMSD from the solution without oxalic acid, the extraction rate was fast and almost all indium ions in the feed was extracted to the organic solution (Fig. 2) because of the high loading capacity of D2EHPA for indium (Sato and Sato, 1992). 3.2. SLMSD with oxalic acid
Figure 2: Time dependence of indium concentration in feed and strip solution (with oxalic acid) In the presence of oxalic acid, indium can form complex with oxalic acid according to following equation:
𝐼𝑛3+ + 𝐻𝐶2𝑂4− ⇌ 𝐼𝑛(𝐻𝐶2𝑂4)2+ (3)
with an equilibrium constant (Ke2) of 1.2x10³. Because 𝐾𝑒1 ≈ 𝐾𝑒2, oxalic acid competes with D2EHPA for indium; therefore, the presence of oxalic acid slows
down indium extraction (Figure 2). To obtain indium permeability through the SLMSD, the following procedure were employed. With strong acidic solution as the strip solution, the ion concentration in the membrane at the interface of membrane and strip side is close to 0 and the ion flux through membrane can be described as 𝐽 = 𝑃. 𝐶, where P the ion permeability and
C represents the indium concentration in the feed. Assume quasi – steady state and perform mass balance on the feed tank, one can obtain follow equation (Li et al., 2017):
𝑑𝐶
𝑑𝑡= −
𝑃. 𝐴
𝑉𝐶
(4)
Here t denotes the time, A represents the membrane area, and V the volume of feed cell.
The solution to above equation is 𝑉 ∗ ln (𝐶
𝐶0) = −𝑃. 𝐴. 𝑡, where 𝐶0 denotes the initial ion concentration in the feed
tank. Plotting 𝑉 ∗ ln (𝐶
𝐶0) versus 𝑡 should give a straight line of which the slope is −𝑃. 𝐴. After determining slope
from the graph, P can be obtained from equation (4).
Replot data of Figure 2 in log scale we have Figure 3. As shown in this figure, for SLMSD, the whole process is a straight line. As discussed above, the competition between oxalic acid and D2EHPA for indium complex formation slow down the extraction, therefore leads to the decrease of permeability in case with oxalic acid.
Table 1. Ion permeability in case without and with oxalic acid
Permeability, m/min
Without oxalic acid 1.4 x 10⁻⁴
0
50
100
150
200
250
300
350
0 50 100 150
In3
+c
on
c.,
pp
m
Time, min
cf, without oxalic acid cs, without oxalic acid
cf, with oxalic acid cs, with oxalic acid

Page 86
With oxalic acid 3.1 x 10⁻⁶
Figure 3: Replot data of Figure 2 in log scale
To increase permeability, one can either decrease the oxalic-acid concentration to reduce the formation of indium-oxalate complex or increase the free D2EHPA content in the organic solution to enhance the formation of indium-D2EHPA complex. 3.3. Improve indium recovery 3.3.1. Increase extractant concentration
When extractant concentration increases, extraction rate increases according to equation (1). However, the viscosity of solution also increases, leads to the decrease of diffusivity. Therefore, when D2EHPA concentration is raised from 0.2M to 0.6M, permeability increases 6 times, but from 0.6M to 1M, permeability increases only about 2 times.
Figure 4: Effect of D2EHPA concentration on time dependence of indium in feed solution
-6.00
-5.00
-4.00
-3.00
-2.00
-1.00
0.000 20 40 60 80 100 120 140
V*ln
(c/c
0)
Time, min
with oxalic acidwithout oxalic acid
0
50
100
150
200
250
0 50 100 150 200
In3
+c
on
c.,
pp
m
Time, min
0.2M 0.6M 1M
-6.00
-5.00
-4.00
-3.00
-2.00
-1.00
0.000 20 40 60 80 100 120 140
V*
ln(c
/c0)
Time, min
0.08M 0.2M 0.6M 1M

Page 87
Figure 5: Replot data of Figure 4 in log scale
Table 2. Effect of D2EHPA concentration on ion permeability
D2EHPA concentration, M Permeability, m/min
0.2 1.3 x 10⁻⁵
0.6 8.0 x 10⁻⁵
1 1.5 x 10⁻⁴
3.3.2. Decrease oxalic acid concentration
The results discussed in the preceding section indicate that the presence of oxalic acid slowed down the extraction. To know how the concentration of oxalic acid affected the indium extraction performance, SLMSD experiments were performed with the feed solutions having different concentrations of oxalic acid. The results are presented in Figure 6. The higher the oxalic acid concentration was, the lower permeability of indium. The results can be explained by
that more 𝐼𝑛(𝐻𝐶2𝑂4)2+ was formed with higher oxalic acid concentration (according to reaction (2)), leading to less indium – D2EHPA complex formation.
Figure 6: Effect of oxalic acid concentration on ion permeability
However, for etching waste stream, the concentration is fixed 2 wt% and can’t be reduced because of the requirement of etching process. Therefore, decomposition of oxalic acid was performed. Learning from previous research results reported in the literature (Mailen and Tallent, 1981), we oxidized oxalic acid with 𝐻2𝑂2 according to equation (3), together with
UV irradiation. Solvent extraction experiments were performed for the feed solutions that were treated with different oxidation conditions (various 𝐻2𝑂2 concentrations and with or without UV).
Table 3. Indium extraction performance with different pretreatment conditions.
Pretreatment condition Remaining [In3+] concentration in
the feed solution, ppm
Estimated oxalic-acid
concentration, wt %
Without pretreatment 21 2.00
3 ml H2O2 18 1.69
3 ml H2O2 + UV (1 hour) 17 1.48
10 ml H2O2 11 1.13
10 ml H2O2 + UV (1 hour) 4 0.65
Without oxalic acid <1 0.00
The results indicate that the pretreatment enhanced indium recovery efficiency. After the pretreatment, the lowest remaining indium concentration we obtained was about 4 ppm, requiring a volume ratio of 20% for H2O2/feed (10ml/50ml) and 1 hour of UV irradiation. Theoretically, higher degree of oxalic-acid degradation can be obtained with a pretreatment with higher volume ratio of H2O2/feed or longer UV irradiation. But, such high
0.000015
0.000115
0.000215
0.000315
0.000415
0.000515
0 0.5 1 1.5 2
Pe
rme
ab
ilit
y,
m/m
in
Oxalic acid conc, %

Page 88
H2O2 ratio or long UV irradiation may not be economically feasible for practical application. Therefore, SLMSD was investigated with 10 ml H2O2 and 1 hour UV irradiation as pretreatment.
Figure 7: SLMSD performance with and without pretreatment ([D2EHPA] = 0.2M)
With pretreatment, the permeability of indium can obtain 7.8 x 10⁻⁵ m/min. (almost equal to the case D2EHPA concentration is 0.6M). 4. Conclusions
- Recovery of indium without oxalic acid and in the presence of oxalic acid were investigated - The presence of oxalic acid slows down the permeability of indium and the effect of oxalic acid concentration on SLMSD performance was investigated - Two possible solutions to improve ion permeability in the presence of oxalic acid were proposed, including
raising extractant concentration and reducing oxalic acid concentration
Acknowledgement
The work was partially supported by the Ministry of Science and Technology, Vietnam (34/FIRST/1.a/HUST)
and Ministry of Science and Technology, Taiwan (MOST 106-2221-E-002-179).
References
Chou, Wei-shan et al. 2016. “Recovery of Indium from the Etching Solution of Indium Tin Oxide by Solvent Extraction.” AIChE 35(3): 20–22.
Graddon, D. P. 1956. “The Absorption Spectra of Complex Oxalates.” J. Inorg. Nucl. Chem. 3(July): 308–22.
Guerriero, R., and L. Meregalli. 1988. “Indium Recovery from Sulphuric Solutions by Supported Liquid Membranes.” Hydrometallurgy 20: 109–20.
Ho, W S Winston, and Tarun K Poddar. 2001. “New Membrane Technology for Removal and Recovery of Chromium from Waste Water.” Environmental Progress 20(1): 44–52.
Ishikawa, Norio, Kanto Kagaku, and Kabushiki Kaisha. 2012. “Etching Solution Composition for Transparent Conductive Film.” US2012/0255929 1(19).
J. C. Mailen, O. K. Tallent, P. C. Arwood. 1981. “Destruction of Oxalate by Reaction with Hydrgen Peroxide.” Consolidated Fuel Reprocessing Program.
Li, Yueh Hsien et al. 2017. “Polymer Inclusion Membranes with Strip Dispersion.” Water 9: 399.
Sato, Taichi, and Keiichi Sato. 1992. “Liquid-Liquid Extraction of Indium ( III ) from Aqueous Acid Solutions by Acid Organophosphorus Compounds.” Hydrometallurgy 30: 367–83.
Taylor, S.R., and S.M. McLennan. 1985. “The Continental Crust: Its Composition and Evolution.” : 1–312. Tsai, Hung-sheng, and Teh-hua Tsai. 2012. “Extraction Equilibrium of Indium(III) from Nitric Acid Solutions by
Di(2-Ethylhexyl)Phosphoric Acid Dissolved in Kerosene.” Molecules 17: 408-419. DOI:10.3390/molecules17010408.
Tsai, Tzu-hsuan, and Yung-fu Wu. 2006. “Organic Acid Mixing to Improve ITO Film Etching in Flat Panel Display
Manufacturing.” Journal of The Electrochemical Society 153(1): C86–90.
-5.00
-4.00
-3.00
-2.00
-1.00
0.000 20 40 60 80 100 120 140
V*
ln(c
/c0)
Time, min
Without pretreatment
With pretreatment

Page 89
Proceedings of
The 5th International Conference on Low Carbon Asia & Beyond - ICLCA 2019 &
The 4th International Conference on Chemical Engineering, Food and
Biotechnology - ICCFB 2019
Vietnam, Malaysia
ISBN: 978-604-67-1372-2
ISBN 978-88-95608-67-9; ISSN 2283-9216
Pretreatment of Lignocellulosic Biomass for
Value-Added Products: A Brief Review Phung K. Le a,b*, Hieu H.T. Phama, Trinh K.T. Nguyena, Viet T. Trana,b
a Faculty of Chemical Engineering, Hochiminh City University of Technology-VNU HCM, Vietnam b Refinery and Petrochemicals Technology Research Center (RPTC), Hochiminh City University of Technology-VNU HCM,
Vietnam
Today, the development of sustainable energy based on renewable biomass materials is one of the biggest
global challenges. Moreover, biomass can be converted to various products having a wide range of applications.
However, the natural structure of lignocellulosic biomass is highly resistant to outside impacts. Thus, the
conversion of biomass into value-added products is ineffective without pretreatment processes. Pretreatment
methods were proposed to disrupt the structure of lignocellulose in several pathways depended on their
chemical nature. The advantages as well as disadvantages, the potential for industrial application of various
pretreatment technologies are discussed in this review article.
1. Introduction
The concern over the environment protection and depletion of petrochemical feedstock have spurred research
and development toward new technologies. Thus, the modern industrial production has to meet strict
requirements such as friendly to the environment, high sustainability, using renewable materials. The gradual
transition towards a bio-based economy is one of the most potential solutions for the problems mentioned earlier.
Lignocellulosic biomass is a renewable and extraordinarily abundant resource, which includes a wide range of
bioresources such as agricultural residues, forest-industrial residues, energy crops, and municipal solid waste.
Lignocellulosic biomass is composed of carbohydrates (cellulose and hemicellulose), lignin, and other
extraneous components (proteins, lipids, and inorganic substances). Recently, a concept of biorefinery is
integrated with the conversion of lignocellulose feedstocks into various products with a primary focus on biofuels
(bioethanol, biodiesel, and biogas).
Moreover, biorefinery also produces other value-added bioproducts (food, feed, platform chemicals, and
materials) and bioenergy (heat and power). However, several difficulties are associated with the conversion of
lignocellulosic biomass. The main factor is the recalcitrance due to the complex integration of main components
in biomass structure. As a result, pretreatment technologies have been developed to overcome the physical and
chemical barriers of the native recalcitrance in lignocellulose. The paper aim is to provide a comprehensive
review of most common pretreatment methods.
2. Structure of lignocellulosic materials
Lignocellulosic biomass consists of carbohydrates (cellulose and hemicellulose), lignin, and other constituents
(Wertz et al. 2017). The fractions of these main components depend on species, environment, position, growth,
and maturity (Table 1). Besides, other constituents such as protein, pectin, and ash make up a minor proportion
(Sun 2010).

Page 90
2.1 Cellulose
Cellulose is the most abundant polymer containing about 30-50% of lignocellulosic biomass (Ramesh et al.
2017). The cellulose molecule is a linear homopolymer of D-anhydroglucopyranose units linked together by β-
(1,4)-glycosidic bonds (Brodeur et al. 2011). In the cellulose structure, the partitions between crystalline and
amorphous zones are non-uniform (Wertz et al. 2017). The crystalline structure of cellulose inhibits the
enzymatic hydrolysis (Kim et al. 2016).
Table 1: Composition of some lignocellulose
Source(%) Cellulose
Hemicellulose
Lignin Extract
Xylan Mannan Galactan Arabianan
Spruce wood 41,9 6,1 14,3 - 1,2 27,1 9,6
Pine wood 37,7 4,6 14,3 - - 27,5 10,8
Birch wood 38,2 18,5 7,0 - - 22,8 4,8
Poplar wood 49,9 17,4 1,2 1,2 1,8 18,1 -
Corn waste 36,4 18,0 4,7 1,0 3,0 16,6 7,3
Wheat straw 38,2 21,2 0,3 2,5 23,4 13,0
Straw 34 - 38 32 - 40 12
2.2 Hemicellulose
Hemicellulose is a chemically heterogeneous polymer, which is predominantly composed of 5-carbon and 6-
carbon monosaccharides. Although the composition of hemicellulose varies in different species, xylose is the
principal constituent of hemicellulose fractions. The content of hemicellulose in lignocellulosic biomass is in a
range of 20-35%. Due to the branched structure and low degree of polymerization, hemicellulose is easily
degraded comparing with cellulose (Yang et al. 2013).
2.3 Lignin
Lignin is a complex amorphous polymer, which is constructed from three predominant monolignols (p-courmaryl,
coniferyl, and sinapyl alcohol) and a minor of other compounds. Precursors in the complex matrix of lignin link
to others in various linkages. The β-aryl ether bonding is the most popular linkage in the lignin structure (Yang
et al. 2013). Lignin in higher plant cell has no amorphous region. Lignin also associates with carbohydrates to
form lignin carbohydrate complex (LCC) (Van Soest 2006). Also, lignin acts as a cement for the binding between
cellulose and hemicellulose to form a three-dimensional structure of the cell wall. Hence, it provides the rigidity
and stiffness of cell walls (Calvo-Flores et al. 2015).
2.4 The role of pretreatment
In order to enhance the efficiency of conversion processes, “pretreatment” was proposed to disrupt the
recalcitrance of lignocellulosic biomass. Some typical results of pretreatment can be obtained such as the
removal of lignin, reduce the crystallinity of the biomass, and expose the larger surface area (Kim et al. 2016).
Therefore, pretreatment plays a critical role in the valorization of lignocellulosic biomass. Pretreatment is
expected to meet the following requirements: (1) reasonable capital and operating costs, (2) high lignin recovery,
(3) minimize the formation of inhibitors, (4) avoiding the loss of sugars (Kim et al. 2016).

Page 91
Figure 1. Convert biomass into fuel through pretreatment, reproduced with permission from (Mosier et al. 2005)
3. Pretreatment methods
Figure 2. Overview of pretreatment processes, reproduced with permission from (Kumar and Sharma 2017)
3.1 Physical pretreatments
In general, physical methods disrupt the structure of lignocellulosic biomass by the reduction of particle size and
crystallinity. Hence, the mass transfer characteristics, surface area, and enzyme penetration are noticeably
improved. However, physical alteration is inefficient to cleave the linkages among three main constituents, which creates a
closely enmeshed structure in biomass (Che Kamarludin et al. 2014). Moreover, the cost of physical pretreatments is usually
expensive due to energy consumption (Brodeur et al. 2011). As a result, physical methods are not preferred. In some cases,
mechanical pretreatments can be applied as a preliminary pretreatment followed by chemical pretreatments (Che Kamarludin
et al. 2014).
Physical pretreatments include conventional mechanical methods (grinding and milling) and nonconventional
methods (i.e. microwave, ultrasound, and pulsed electric field) (Kumar and Sharma 2017).
3.2 Chemical pretreatments
3.2.1 Acid
Acid pretreatments occur with the presence of mineral acids (i.e. H2SO4, HCl, and H3PO4) or organic acids.
Acids disrupt biomass structure due to the hydrolysis of carbohydrates, especially hemicellulose (Liu and
Wyman 2004). Both dilute and concentrated acids can be used to pretreat lignocellulosic biomass (Yang and
Wyman 2008). The higher concentrations require milder conditions. This method is not suitable for lignin
recovery since it only target on sugar-based components (Jung and Kim 2015). Besides, the formation of toxic
compounds and corrosion are most significant disadvantages of acid pretreatment (Pedersen et al. 2010).
3.2.2 Alkaline
Alkaline pretreatment is more effective in herbaceous and agricultural plants than woody plants due to the
difference in lignin quantity. Alkaline pretreatment is traditionally applied to treat nonwood biomass such as
straw, sugarcane bagasse, and flax. The commonly used alkalis for pretreatment are NaOH, KOH, NH3, and
Ca(OH)2. Among these alkali mediums, NaOH is the most effective chemical to delignify biomass (Sindhu et al.
2015). Depolymerization action occurs principally by the removal of and -aryl ether bonds and saponification
of intermolecular ester bonds cross-linking hemicellulose and lignin (Calvo-Flores et al. 2015). In mild conditions,
no further chemical modification occurs beyond the two mechanisms mentioned above. The considerable
amount of free phenolic groups in grass increases the solubility of lignin into alkali solution. The type of alkali,

Page 92
the concentration of alkali in pretreatment solution, biomass loading, temperature, and pretreatment time are
important factors affecting the yield of alkaline pretreatment (Sun 2010).
3.2.3 Organosolv
Organosolv can extract lignin from biomass with mixtures of organic solvents and a small amount of catalysts
(Calvo-Flores et al. 2015). Ethanol organosolv pretreatment is suite for a wide range of biomass feedstocks
such as softwoods, hardwoods, and agricultural residues (Wyman 2013). Both low-boiling-point solvents such
as ethanol, methanol, or acetone and high-boiling point solvents such as glycols can be used. The most
preferred solvents are primary alcohols and carboxylic acids (Johansson et al. 1987). Acids and bases, which
are common catalysts, added in organosolv to achieve higher yield. Under alkali-catalyst conditions, the
cleavage of -ether bonds is a priority, whereas it is required a robust acidic environment where the removal of
-ether bonds are more referred. Organic solvents can be recycled several times (Sarkanen and Hoo 1981).
Lignins generated from this method are relatively pure, undegraded, and free of sulfur. Some organic solvents
are flammable and toxic (Galbe and Zacchi 2007).
3.2.4 Ionic Liquids
Ionic liquids (ILs) are defined as organic salts with no vapor pressure or fused salts liquid containing only ions.
ILs have several unique properties, such as high recyclability, low volatility, high thermal stability, less toxic
formation, and nonflammability. A wide range of solubility and miscibility is the most useful property of ILs, which
make ILs become potential alternatives for traditional flammable and volatile solvents (Negi and Pandey 2015).
3.2.5 Deep Eutectic Solvents
Deep eutectic solvents have many characteristics similar to ionic liquids. The difference between DESs and ILs
is that DESs are not entirely composed of ionic species as ILs. A deep eutectic solvent is defined as a fluid
containing two or three components that are able to self-association through hydrogen bonds. These
components form a eutectic mixture with a melting point lower than that of each individual constituent (Kumar
and Sharma 2017).
3.2.6 Ozonolysis
Ozone treatment mainly targets lignin but negligibly affects the carbohydrates (Kumar et al. 2009). Ozonolysis
is carried out in ambient temperature and pressure. Also, this method does not produce any toxic inhibitors.
Ozonolysis is not preferred in large scale due to the high cost of ozone (Kumar and Sharma 2017).
3.3 Physicochemical pretreatments
3.3.1 Liquid hot water
Hot water pretreatment (also called hydrothermal pretreatment) is usually carried out at high temperature (160-
240C and pressure (1-3.5MPa), in a period of few minutes to hours. The pH condition should be stable in the
range of 4-7 to reduce the degradation of sugars (Jeong and Lee 2015). The hydronium ions, which are
generated from water auto-ionization, promote xylan depolymerization and remove the acetyl groups.
Subsequently, removed acetyl groups catalyze the hydrolysis of hemicellulose. At high temperature, part of
acetyl groups are converted into acetic acid support to the hydrolysis of glycosidic bonds in hemicellulose and
the -ether linkages in lignin (Yang et al. 2013) .Because hot water pretreatment does not use any chemicals
excepts water. It cannot be denied that this hydrothermal treatment is an environmentally friendly process,
compared with other pretreatments. Moreover, corrosion and chemical recycling problems are eliminated. Acid-
insoluble lignin, which make up a substantial proportion of total lignin, remain in the biomass (Jeong and Lee
2015).
3.3.2 Steam explosion
The mechanism in steam explosion is similar to the hot-water pretreatment. Saturated steam under high
pressure penetrates the cell walls by diffusion, and then the pressure is suddenly released to ambient pressure
(Agbor et al. 2011). This leads to the evaporation of condensed moisture in the cell walls and consequently alter
the macrostructure of biomass (Wang et al. 2015). Steam explosion causes degradation of hemicellulose and
partial hydrolysis of lignin (Calvo-Flores et al. 2015). This method does not use any chemicals except water,
thus offer a mild pH of reaction media, which minimal the equipment corrosion (Calvo-Flores et al. 2015). A
typical condition of steam explosion is at 200-450psig for 10 minutes. The high-pressure activates an
autohydrolysis reaction as described above. The reaction temperature and retention time are important
parameters in this pretreatment method (Yang et al. 2013). Besides a significant fraction of hemicellulose is

Page 93
removed, there are other issues such as the generation fermentation inhibitors during the process and low
delignification yield (Wang et al. 2015).
3.3.3 Ammonia-based methods
Ammonia pretreatments are similar to steam explosion excepting that water in steam explosion is replaced by
ammonia(Rabemanolontsoa and Saka 2016). The pressure is released rapidly at the end of this pretreatment
process resulting in decrystallization in cellulose, hydrolyzation and alteration of lignin structure. Ammonia
Recycle Percolation and Ammonia Fiber Explosion are commonly applied among various methods employing
ammonia (Jeong and Lee 2015).
Ammonia Recycle Percolation (ARP): The ARP has been developed to remove lignin as well as increase the
susceptibility of biomass to enzymes. The typical condition of this process is 5-15% ammonia, at a temperature
of 150-180 °C, and under a pressure of 2.3 MPa (Yang et al. 2013). Ammonia solution is passed through a
vessel packed with biomass with a flow rate of 1-5 mL/min, and the residence time of 10-90 min. ARP is capable
of removing over 80% lignin and solubilizing up to 50% of hemicellulose in woody materials (Wang et al. 2015).
Ammonia Fiber Explosion (APEX): The pretreatment conditions of this method are mild; 60-90°C in liquefied
anhydrous ammonia having the dosage of 1-2 kg of ammonia/kg of dry biomass, and the residence time is 10-
60 min (Wang et al. 2015). The primary effect of APEX is the depolymerization of hemicellulose and lignin. The
used ammonia can be recovered. The degradation of sugar-contents is minimized because all the products after
pretreatment remain in a solid phase. APEX proceeds under high pressure and involves phase changes.
Consequently, the investment for pretreatment reactors is expensive and hard to control. Thus, it is not feasible
to implement APEX at commercial scale due to the aforementioned reasons, which might cause some operating
issues and significantly increase both investment and operating costs (Yang et al. 2013). Besides, AFEX
pretreatment is not as substantial as NaOH or lime pretreatment in lignin removal (Sindhu et al. 2015).
3.3.4 Carbon dioxide explosion
The supercritical CO2 is pumped to a high pressure and temperature reactor containing biomass (Kim and Hong
2001). The high-pressure CO2 forms carbonic acids to hydrolyze the hemicellulose. Then the release of pressure
also causes physical alteration which increase accessibility to biomass structure (Zheng et al. 1995). The
moisture of biomass is the controlling factor in this pretreatment (Kim and Hong 2001). The outstanding of this
pretreatment is low cost of carbon dioxide, low operating temperature, high solid capacity, and no byproducts
formation. However, CO2 explosion is unlikely to reach the industrial scale because of the high capital and
maintenance cost of reactor (Agbor et al. 2011).
3.3.5 Wet oxidation
Wet oxidation involves the use of oxygen to oxidize compounds in biomass structure. There are two possible
reactions during wet oxidation process: low temperature hydrolysis and high temperature oxidation reaction. A
typical condition of this method is 12 bar, 195 °C for 10 to 20 minutes. Besides, the size of lignocellulosic
materials has to be reduced to about 2 mm in length (Pedersen and Meyer 2009). Wet oxidation alters the
biomass structure by solubilizing of hemicellulose and decomposition of lignin to carbon dioxide, water, and
carboxylic acids (Banerjee et al. 2009). The most setback of this pretreatment is the formation of inhibitors such
as succinic acid, glycolic acid, acetic acid, phenolic compounds. Therefore, the combination between wet
oxidation and another pretreatment is applied to enhance the pretreatment effect. For instance, the presence of
alkaline medium is proved to reduce the byproducts formation (Banerjee et al. 2011).
3.4 Biological pretreatments
Biological pretreatment is the use of microorganisms (mainly fungi) to fractionate biomass (Capolupo and
Faraco 2016). Some fungi species such as white, brown, and soft-rot selectively degrade lignin leading to the
disruption in biomass structure and minimizing the loss of carbohydrate (Brodeur et al. 2011). The main
advantages of biological pretreatments are mild conditions, high selectivity, environmental-friendly. In contrast,
the drawbacks of microorganisms such as long pretreatment time, high price, strict condition maintenance, and
low rate of hydrolysis may limit its application in large scale (Palmqvist and Hahn-Hägerdal 2000).
4. Conclusions
The increasing use of biofuels will contribute to sustainable development by reducing greenhouse gas emissions
as well as using non-renewable resources. Lignocellulosic biomass, composed of agricultural and forestry
residues, is a good source of abundant sugar to ferment into a biofuel known as bioethanol. Various pre-
treatment technologies for lignocellulose biomass have been studied and implemented to improve ethanol
production. A difficult problem in these technologies is the presence of lignin, a major inhibitor of cellulose and

Page 94
hemicellulose hydrolysis. This has led to extensive research on various pretreatment methods, which are based
on the principles of physical, chemical, physicochemical, and biological. This paper analyzes different methods
with various advantages and disadvantages. Therefore, depending on the needs, raw materials, and equipment
available to choose the method that is appropriate for the purpose of production.
Acknowledgments
This research was financially supported by Vietnam National University-HCM (Research Grant no. B2019-20-
11)
References
Agbor VB, Cicek N, Sparling R, et al (2011) Biomass pretreatment: Fundamentals toward application. Biotechnol. Adv.
Banerjee S, Sen R, Mudliar S, et al (2011) Alkaline peroxide assisted wet air oxidation pretreatment approach to enhance enzymatic convertibility of rice husk. Biotechnol Prog.
Banerjee S, Sen R, Pandey RA, et al (2009) Evaluation of wet air oxidation as a pretreatment strategy for bioethanol production from rice husk and process optimization. Biomass and Bioenergy.
Brodeur G, Yau E, Badal K, et al (2011) Chemical and physicochemical pretreatment of lignocellulosic biomass: A review. Enzyme Res 2011
Calvo-Flores FG, Dobado JA, Isac-García J, Martín-Martínez FJ (2015) Lignin and Lignans as Renewable Raw Materials: Chemistry, Technology and Applications
Capolupo L, Faraco V (2016) Green methods of lignocellulose pretreatment for biorefinery development. Appl. Microbiol. Biotechnol.
Che Kamarludin SN, Jainal MS, Azizan A, et al (2014) Mechanical pretreatment of lignocellulosic biomass for biofuel production. In: Applied Mechanics and Materials
Galbe M, Zacchi G (2007) Pretreatment of lignocellulosic materials for efficient bioethanol production. Adv Biochem Eng Biotechnol.
Jeong S-Y, Lee J-W (2015) Chapter 5 - Hydrothermal Treatment. In: Pandey A, Negi S, Binod P, Larroche CBT-P of B (eds). Elsevier, Amsterdam, pp 61–74
Johansson A, Aaltonen O, Ylinen P (1987) Organosolv pulping - methods and pulp properties. Biomass. Jung YH, Kim KH (2015) Chapter 3 - Acidic Pretreatment. In: Pandey A, Negi S, Binod P, Larroche CBT-P of B
(eds). Elsevier, Amsterdam, pp 27–50 Kim JS, Lee YY, Kim TH (2016) A review on alkaline pretreatment technology for bioconversion of lignocellulosic
biomass. Bioresour Technol 199:42–48. Kim KH, Hong J (2001) Supercritical CO2 pretreatment of lignocellulose enhances enzymatic cellulose
hydrolysis. Bioresour Technol. Kumar AK, Sharma S (2017) Recent updates on different methods of pretreatment of lignocellulosic feedstocks:
a review. Bioresour Bioprocess 4 Kumar P, Barrett DM, Delwiche MJ, Stroeve P (2009) Methods for pretreatment of lignocellulosic biomass for
efficient hydrolysis and biofuel production. Ind Eng Chem Res 48:3713–3729 Liu C, Wyman CE (2004) The effect of flow rate of very dilute sulfuric acid on xylan, lignin, and total mass
removal from corn stover. Ind Eng Chem Res 43:2781–2788 Mosier N, Wyman C, Dale B, et al (2005) Features of promising technologies for pretreatment of lignocellulosic
biomass. Bioresour Technol 96:673–686. Negi S, Pandey AK (2015) Chapter 8 - Ionic Liquid Pretreatment. In: Pandey A, Negi S, Binod P, Larroche CBT-
P of B (eds). Elsevier, Amsterdam, pp 137–155 Palmqvist E, Hahn-Hägerdal B (2000) Fermentation of lignocellulosic hydrolysates. I: Inhibition and
detoxification. Bioresour Technol Pedersen M, Meyer AS (2009) Influence of substrate particle size and wet oxidation on physical surface
structures and enzymatic hydrolysis of wheat straw. Biotechnol Prog Pedersen M, Viksø-Nielsen A, Meyer AS (2010) Monosaccharide yields and lignin removal from wheat straw in
response to catalyst type and pH during mild thermal pretreatment. Process Biochem 45:1181–1186. Rabemanolontsoa H, Saka S (2016) Various pretreatments of lignocellulosics. Bioresour. Technol. Ramesh D, Muniraj IK, Thangavelu K, Karthikeyan S (2017) Pretreatment of Lignocellulosic Biomass
Feedstocks for Biofuel Production. 33–60. Sarkanen K V., Hoo LH (1981) Kinetics of hydrolysis of erythro-guaiacylglycerol β-(2-metkoxyphenyl) ether and
its veratryl analogue using HCl and aluminum chloride as catalysts. J Wood Chem Technol. Sindhu R, Pandey A, Binod P (2015) Chapter 4 - Alkaline Treatment. In: Pandey A, Negi S, Binod P, Larroche
CBT-P of B (eds). Elsevier, Amsterdam, pp 51–60 Sun R (2010) Cereal straw as a resource for sustainable biomaterials and biofuels: chemistry, extractives,
lignins, hemicelluloses and cellulose. Concrete 291 Van Soest PJ (2006) Rice straw, the role of silica and treatments to improve quality. Anim Feed Sci Technol
130:137–171. Wang K, Chen J, Sun S-N, Sun R-C (2015) Chapter 6 - Steam Explosion. In: Pandey A, Negi S, Binod P,

Page 95
Larroche CBT-P of B (eds). Elsevier, Amsterdam, pp 75–104 Wertz JL, Deleu M, Coppée S, Richel A (2017) Hemicelluloses and lignin in biorefineries Wyman CE (2013) Aqueous Pretreatment of Plant Biomass for Biological and Chemical Conversion to Fuels
and Chemicals Yang B, Wyman CE (2008) Pretreatment: The key to unlocking low-cost cellulosic ethanol. Biofuels, Bioprod.
Biorefining Yang S-T, El-Ensashy H, Nuttha T (2013) Bioprocessing technologies in biorefinery for sustainable production
of fuels, chemicals, and polymers Zheng Y, Lin HM, Wen J, et al (1995) Supercritical carbon dioxide explosion as a pretreatment for cellulose
hydrolysis. Biotechnol Lett.

Page 96
Proceedings of
The 5th International Conference on Low Carbon Asia & Beyond - ICLCA 2019 &
The 4th International Conference on Chemical Engineering, Food and
Biotechnology - ICCFB 2019
Vietnam, Malaysia
ISBN: 978-604-67-1372-2
ISBN 978-88-95608-67-9; ISSN 2283-9216
The Induction of Beta vulgaris L. Adventitious Roots
In In Vitro Culture for Betalains Thuy Tien T. Lea, Cam Tu H.Nguyenb, Minh V. Tranc
a Hochiminh University of Technology, Vietnam b International University, Vietnam c International University, Vietnam
Betalains have gained the attention as natural food colorants because of their high anti-oxidative and free radical
scavenging activities. This study focused on the process to induce the adventitious roots from Beta vulgaris L.
seedlings. IAA 0.5 mg/L was the best treatment to induce adventitious roots from hypocotyls and cotyledons in
agar culture. In liquid culture, growth index of adventitious roots were highest at the fourth week of cultivation
but betalains contents were highest at the second week of cultivation. 5 g/L inoculum density of adventitious
roots produced the highest of growth index (2.27) and betalains concentration (0.33 mg/g FW). Sucrose
concentration at 20 g/L and 30 g/L showed little significant difference in growth index as well as betalains
contents.
Keywords: adventitious roots, Beta vulgaris L., betalains, cotyledons, hypocotyls
1. Introduction
For decades, plant cell culture has been utilized as a method to produce valuable secondary metabolites.
Betalains from Beta vulgaris L. (beetroot) are water-soluble nitrogen-containing pigments, which comprise the
red-violet betacyanins and the yellow betaxanthins (Strack et al., 2003). They have the bright red color and are
used commercially as food colorants in Europe and USA (Castellar et al., 2006). Betalains also attract the
attention of researchers because of their antioxidant and radical scavenging properties for protection against
certain oxidative stress-related disorders (Strack et al., 2003). Beside hairy root cultures, adventitious roots
which developed from different parts of plants are used to produce secondary metabolites. For instance, Fazal
et al. (2014) optimized adventitious root cultures of Prunella vulgaris for production of phenolics and flavonoids;
adventitious roots were successfully induced from Panax ginseng by Sivakumar et al. (2005) for ginsenosides;
Betsui et al. (2004) obtained anthocyanins from adventitious roots of Raphanus sativus L. in vitro.
However, there are lacks of scientific information about beetroot adventitious roots culture for betalains
production. People used to focus on micropropagation of beetroots (Sullivan et al., 1993; Bekheet et al., 2007;
Ghosh et al., 2013) or hairy root cultures (Escribano et al., 1998; Kanner et al., 2001; Pavlov et al., 2003). So,
in this research, we studied on the induction of adventitious roots at various concentration of auxins (NAA, IBA
and IAA) from different types of explants, and liquid culture for biomass and betalains.
2. Materials & methods
2.1 Materials: cotyledons, hypocotyls and roots of Beta vulgaris L. seedlings.
2.2 Methods
Seeds sterilization. The Beta vulgaris L. seeds were immersed in 2% sodium hypochlorit) with 2 -3 drops of
Tween 20 in 15 minutes before rinsing with distilled water. After that, the incubation in distilled water at 60oC
in 20 minutes was required to shorten germination time. The sterilized seeds were aseptically cultured on
growth regulator-free MS medium (Murashige and Skoog, 1962) with 2% sucrose, 6 g/L agar agar, pH 5.8 and
incubated in dark at 25oC for germination. 1- week old seedlings were used as sources of explants in further
experiments.

Page 97
Root induction. Sections of cotyledon, hypocotyl and root (1 cm in length) from in vitro seedlings were used as
explants for adventitious roots induction by transferring to MS medium supplemented with different types and
concentrations of auxins. The culture condition was maintained with 16h photoperiod, 4000 lux, at 25oC.
Liquid cultures. 14 day-old adventitious roots from root explants were transfered to liquid medium for biomass
and betalains. The factors were tested to determine optimal condition for biomass as well as betalains yield
included: inoculum density and sucrose concentrations (20 and 30 g/L). Each glass bottle contained 40 mL of
liquid MS medium with 0.2 mg adventitious root as initial inoculum weight. For inoculum density treatment, the
inoculum size varied among 0.12 g, 0.20 g and 0.28 g of roots in 40 mL of liquid medium (3, 5 and 7 g/L
respectively). The cultures were shaked at 110 rpm at 250C under light (4000 lux) in 5 weeks.
Biomass and betalains accumulation. The proliferation of adventitious roots was assessed by growth index
in fresh weight after each week. The adventitious roots were collected to dertemine betalains by mass
spectrometry of Nilsson (1970).
Data analysis. Statistical analysis was performed with SPSS Version 20.0 statistic software package. A value
of P < 0.05 was considered statistically significant.
3. Results
3.1 Effect of auxins on adventitious root induction
Adventitious roots formed from all kinds of explant even on free plant growth regulator medium. The response
of root explants with auxins was better than the others. Hypocotyl explants were more suitable than cotyledon
explants in adventitious root formation. The numbers of root per explant were different with the different kinds
and concentrations of auxins. In MS medium with NAA 0.5 mg/L, the numbers of root per explant from hypocotyls
were 16 and 15.83 from cotyledons. Whereas, IAA at various concentrations were suitable for root induction
from root explants (21.0, 26.2 and 24.8 roots per explant on medium with IAA 0.5, 1.0 and 2.0 mg/L respectively)
(Table 1). Roots on medium with NAA were red with many root hairs, roots with IAA treatments appeared with
a thicker shape and brighter red color (Figure 1). However, callus could be observed in hypocotyl and cotyledon
explants and shoots formed from any treatments in hypocotyl explants.
Table 1. Effects of auxins on adventitious root induction from explants after 3 weeks of culture
Auxin (mg/L) Root explants Hypocotyl explants Cotyledon explants
NAA IBA IAA Response
(%)
Avg. no of
roots
Response
(%)
Avg. no of
roots
Response
(%)
Avg. no of
roots
- - - 100.00 9.00d 50.00 1.20e 42.42 5.80c
0.5 - - 100.00 20.70b 83.33 16.00a 55.00 15.83a
1.0 - - 100.00 15.30c 87.50 5.80cd 68.00 16.74a
2.0 - - 100.00 25.00a 71.43 2.60e 34.62 9.50b
- 1.0 - 100.00 20.00b 71.43 2.60e 70.83 8.70bc
- 2.0 - 100.00 16.00c 71.43 9.40b 42.86 5.60d
- 3.0 - 100.00 10.20d 73.33 9.80b 57.14 9.80b
- - 0.5 100.00 21.00b 92.31 5.80cd 58.33 8.90b
- - 1.0 100.00 26.20a 77.78 9.20b 64.71 5.40d
- - 2.0 100.00 24.80a 86.67 8.60bc 68.75 5.80c
Values not sharing a common letter are significantly different at P<0.05 based on Duncan method

Page 98
Figure 1: Adventitious roots from root explants after 3 weeks of culture on MS medium with auxins
(a) NAA 0.5 mg/L; (b) NAA 1.0 mg/L (with callus); (c) NAA 2.0 mg/L; (d) IAA 0.5 mg/L; (e) IAA 1.0 mg/L; (f)
IAA 2.0 mg/L
Adventitious roots induction in vitro depends on exogenous auxins and explants. All kinds of explant from Beta
vulgaris L. seedlings responsed with the addition of auxins in adventitious roots induction, especially IAA and
NAA. The same as research of Sullivan et al. (1993) on Beta vulgaris L., cotyledon explants had less rooting
percentage than hypocotys, IAA (1.0 mg/L) and NAA (1.0 mg/L) were more effective in inducing roots. The
number of roots per explant (hypocotyls and cotyledons) in our experiments were higher, which may be due to
the different cultivars and the age of seedlings
3.2 Liquid culture
3.2.1. Effects of initial inoculum density
In liquid cultures, growth index of roots with inoculum density at 5 g/L and 7 g/L significantly increased in week
2 and week 3 and both reached maximum at week 4 (2.27 and 1.76 respectively) then started to decline from
week 5. Whereas the growth index of roots in the treatment with initial inoculum density at 3 g/L continued to
increase until week 5 (1.49) (Figure 2).
Betalains concentration increased at week 2, dropped at week 3, increased again at week 4 and then reduced
in the experiments with 3 and 7 g/L of initial roots. In the experiment with root initial inoculum density 5 g/L,
betalains concentration kept stable from week 4 to week 5. The highest concentration of betalains was at the
second week of cultures (0.32, 0.33 and 0.33 mg/g FW respectively with initial inoculum density 3, 5 and 7 g/L)
(Figure 3).
Figure 2: Growth index of Beta vulgaris L. adventitious root in liquid culture with different initial inoculum density
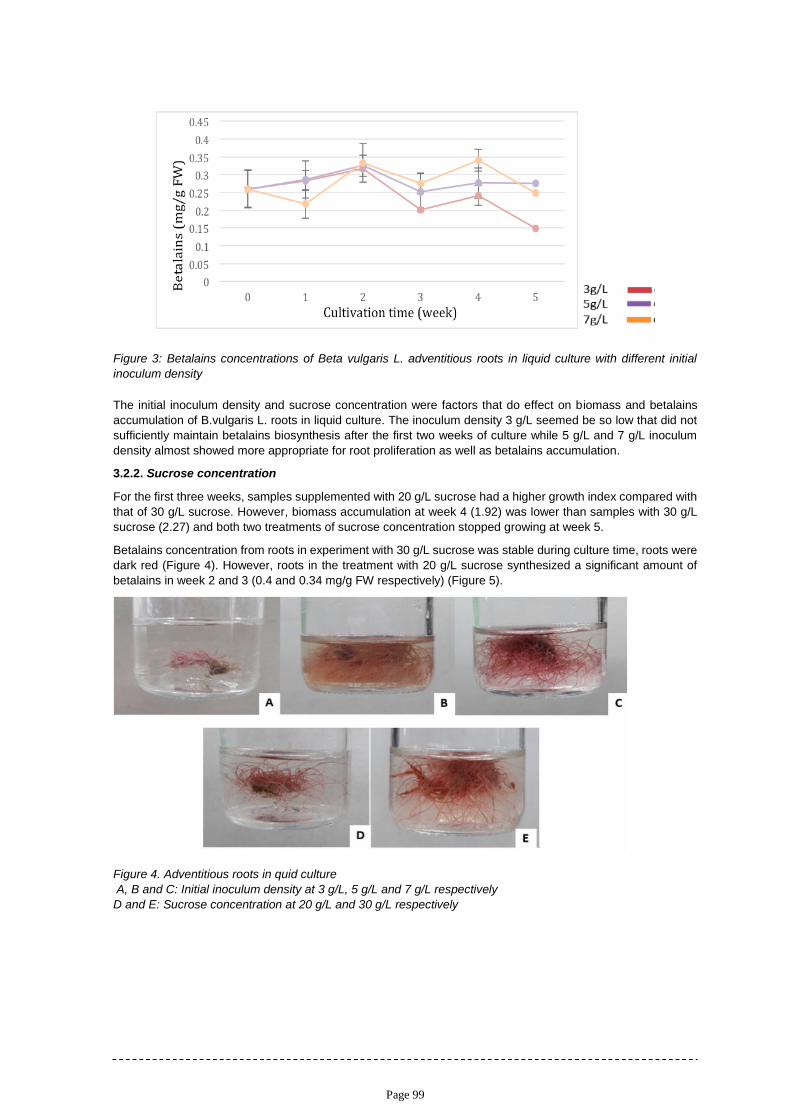
Page 99
Figure 3: Betalains concentrations of Beta vulgaris L. adventitious roots in liquid culture with different initial
inoculum density
The initial inoculum density and sucrose concentration were factors that do effect on biomass and betalains
accumulation of B.vulgaris L. roots in liquid culture. The inoculum density 3 g/L seemed be so low that did not
sufficiently maintain betalains biosynthesis after the first two weeks of culture while 5 g/L and 7 g/L inoculum
density almost showed more appropriate for root proliferation as well as betalains accumulation.
3.2.2. Sucrose concentration
For the first three weeks, samples supplemented with 20 g/L sucrose had a higher growth index compared with
that of 30 g/L sucrose. However, biomass accumulation at week 4 (1.92) was lower than samples with 30 g/L
sucrose (2.27) and both two treatments of sucrose concentration stopped growing at week 5.
Betalains concentration from roots in experiment with 30 g/L sucrose was stable during culture time, roots were
dark red (Figure 4). However, roots in the treatment with 20 g/L sucrose synthesized a significant amount of
betalains in week 2 and 3 (0.4 and 0.34 mg/g FW respectively) (Figure 5).
Figure 4. Adventitious roots in quid culture
A, B and C: Initial inoculum density at 3 g/L, 5 g/L and 7 g/L respectively
D and E: Sucrose concentration at 20 g/L and 30 g/L respectively

Page 100
Figure 5: Growth index (A) and betalains concentration (B) of Beta vulgaris L. roots in liquid culture with sucrose
Plant cells use sucrose to make energy in cellular respiration. However, sucrose is a source of carbon for
metabolite reactions in the cells. With 30 g/L of sucrose, adventitious roots of Beta vulgaris L. proliferated and
accumulated betalains better than sucrose of 20 g/L. That indicated that the concentration of 20 g/L sucrose
was not enough for roots proliferation and pigment biosynthesis.
4. Conclusions
Auxins at the appropriate concentration could enhance the rooting percentages and number of roots per explant,
more specifically, IAA 1 or 2 mg/L for root explants, NAA 0.5 mg/L for hypocotyl explants and NAA 0.5 or 1 mg/L
for cotyledon explants. In liquid culture, sucrose at the concentration of 30 g/L was better than 20 g/L and 7 g/L
of roots was the appropriate initial inoculum density for root proliferation and betalains accumulation.
References
Bekheet, S. A., Taha H. S., and Matter M. A., 2007, In vitro regeneration of sugar beet propagules and molecular
analysis of the regenerants, Arab Journal of Biotechnology 10(2), 321-332.
Betsui F., Norie T-N. and Koichiro S., 2004, Anthocyanin production in adventitious root cultures of Raphanus
sativus L. cv. Peking Koushin, Plant biotechnology 21(5), 387-391.
Castellar, M.R., Obo´n, J.M. and Ferna´ndez-Lo´pez, J.A., 2006, The isolation and properties of a concentrated
red-purple betacyanin food colourant from Opuntia stricta fruits, Journal of the Science of Food and
Agriculture, 86, 122–128.
Escribano, J., Pedreno, M.A., Garcia-Carmona, F., Munoz, R., 1998. Characterization of the antiradical activity
of betalains from Beta vulgaris L. roots, Phytochemistry Analysis 9, 124–127.
Fazal H., Bilal H. A. and Nisar A., 2014, Optimization of adventitious root culture for production of biomass and
secondary metabolites in Prunella vulgaris L., Applied Biochemistry and Biotechnology, 174(6), 2086 - 2095.
0
0.5
1
1.5
2
2.5
3
1 2 3 4 5
Gro
wth
ind
ex
Cultivation time (week)
A
00.05
0.10.15
0.20.25
0.30.35
0.40.45
0.5
0 1 2 3 4 5
Bet
alai
ns
(mg/
g FW
)
Cultivation time (week)
B

Page 101
Kanner J., Harel S., and Granit R., 2001, Betalains - a new class of dietary cationized antioxidants. Journal of
Agriculture and Food Chemistry, 49, 5178 - 5185.
Murashige T. and Skoog F., A revised medium for rapid growth and bio assays with tobacco tissue cultures,
Physiologia plantarum 15(3), 473 - 497.
Pavlov A., Georgiev V. and Kovatcheva P., 2003, Relationship between type and age of inoculum and betalains
biosynthesis by Beta vulgaris hairy root culture, Biotechnology Letter, 25, 307 – 309.
Sivakumar G., Yu K.W., Paek K.Y., 2005, Production of biomass and ginsenosides from adventitious roots of
Panax ginseng in bioreactor cultures, English Life Science, 5, 333 – 342.
Strack, D., Vogt, T. and Schliemann W., 2003, Recent advances in betalain research, Phytochemistry, 62, 247
– 269.
Sullivan, C. F., Finch P. J. D. and Burke J. I., 1993, Studies of in vitro propagation systems for sugar beet, Irish
Journal of Agricultural and Food Research, 27 - 35.