Procedure - ecroft.weebly.com · Web viewMix the agar powder with water, following the directions...
154
1 Approximate Time Required to Complete the Project Gathering enough test subjects is the only difficult part here. Each session should probably only take 10-15 minutes, but you will want a lot of people to do this, so that the data means something- plan on gathering data for up to 10 days or more. The project addresses a perennial argument between parents and children: is it OK to listen to music while you are studying? To test the effect of music on memory and whether or not listening to music affects the ability of a person to concentrate on a simple task. Computer with internet access An iPod or other personal music device Pencil and paper to take data A lot of people to act as test subjects Research Questions How does music affect concentration? How does music affect memory retention? What effect does music have on the brain? Terms, Concepts and Questions to Start Background Research Memory, neuropathy, synapse, music, demographic, genre(musical), retention, short-term memory, long term memory 1. Choose a test subject. 2. Sit him or her at a computer. 3. Go to http://www.play.vg/games/52-Concentration.html 4. Allow the test subject to play the game twice- the reason for doing this is because people naturally get better at tasks early, and less later. You want your test subjects to be decent at the task, without having enough time to get bored of it. 5. On the third time, allow the test subject to wear headphones and play music of their own selection. Have them play the game, and record their completion time in a data table. 6. Have them do the game one more time, but without music. Record their completion time. 7. Repeat the above steps for as many people as you can get to take the test- 30 people would be great! 8. Compare both ‘with music’ and ‘without music’ times for all subjects. Which was better? 9. Find a way to graph your data, so people understand the results of your experiment!
Transcript of Procedure - ecroft.weebly.com · Web viewMix the agar powder with water, following the directions...

1
Approximate Time Required to Complete the Project Gathering enough test subjects is the only difficult part here. Each session should probably only take 10-15 minutes, but you will want a lot of people to do this, so that the data means something- plan on gathering data for up to 10 days or more.
The project addresses a perennial argument between parents and children: is it OK to listen to music while you are studying?
To test the effect of music on memory and whether or not listening to music affects the ability of a person to concentrate on a simple task.
Computer with internet access An iPod or other personal music device Pencil and paper to take data A lot of people to act as test subjects
Research Questions
How does music affect concentration? How does music affect memory retention? What effect does music have on the brain?
Terms, Concepts and Questions to Start Background ResearchMemory, neuropathy, synapse, music, demographic, genre(musical), retention, short-term memory, long term memory
1. Choose a test subject. 2. Sit him or her at a computer. 3. Go to http://www.play.vg/games/52-Concentration.html4. Allow the test subject to play the game twice- the reason for doing this is because people naturally get
better at tasks early, and less later. You want your test subjects to be decent at the task, without having enough time to get bored of it.
5. On the third time, allow the test subject to wear headphones and play music of their own selection. Have them play the game, and record their completion time in a data table.
6. Have them do the game one more time, but without music. Record their completion time.7. Repeat the above steps for as many people as you can get to take the test- 30 people would be great!8. Compare both ‘with music’ and ‘without music’ times for all subjects. Which was better? 9. Find a way to graph your data, so people understand the results of your experiment!
You should take show all the data you took during the experiment in a table form. You should also include graphs. Use excel, if you know how.

2
Problem:
How do weather conditions affect how fast a puddle evaporates? Does water evaporate faster on a cooler or warmer day?
Materials:
Paper and pencil Large cup or small bucket of water Large, flat expanse of bare asphalt Stick of sidewalk chalk Timer or watch A few days with differing weather conditions Camera
Procedure
1. On a sunny day sometime around midday, go outside and write down (or have a helper write down) the date, the time, and your observations about the weather. How sunny is it? Is it warm or cool? How windy is it? Does the air feel dry or humid? If you can find out the temperature, humidity, pressure, and so on, write that down too.
2. Now pour the bucket of water out on the concrete so that it makes a puddle. Quickly draw around an outline of the puddle with the sidewalk chalk.
3. Wait five minutes, then look at the puddle. It should be smaller than it was five minutes ago. Trace its edges with the chalk again.
4. Keep doing this every five minutes until the puddle is completely gone or until an hour has gone by, whichever comes first. You should have a maximum of 13 puddle outlines, each smaller than the last.
5. Take a picture of your chalk outlines.6. On a day when the weather is noticeably different from the first day (but not wet out or too cold for
comfort), repeat steps 1-5. Try to use the same spot and take a picture from the same angle. Then do it again on yet another day when the weather is different—hotter, windier, cloudier. You’ll want at least three sets of observations, but do it as many times as you'd like!
7. Now put all of your observations and your pictures together. You should see that on some days there was more space between the puddle outlines—on those days, the water evaporated faster—and on some days, when the water evaporated more slowly, there was less space between the outlines. Try to figure out what was different on the days when the water evaporated faster. Did hotter weather make it evaporate faster or slower? What about wind? Did it evaporate faster or slower on a cloudy day? Did the time of day make a difference?
Terms/Concepts: evaporation, temperature, wind, humidity

3
What is the most effective method of preserving food? Using three types of containers we will test which one preserves fruits and vegetables the longest.
Green containers Green bags Lettuce keeper Ziploc bags Food preserving discs - Extra Life Fruit and Veggie Keeper are good brands Lettuce Strawberries, blueberries, or raspberries
1. Choose three preserving containers to test. For this example we will use Green bags, a lettuce keeper, and the preserving disc.
2. Choose the food(s) you want to preserve. Softer fruits and vegetables are a good option because their shelf life is considerably lower. For this example we will use strawberries.
3. Determine the average shelf life of the product without using a preserving method. Strawberries will last a maximum of 3 days in the refrigerator.
4. Place equal amounts of the product you choose into each container and place it in the refrigerator. Place 5 strawberries in each container.
5. Check each container daily to examine the condition of the product. 6. Record the number of days until the product spoils. Strawberries get soggy and grow and start to grow
white mold.7. Chart and graph your data:
Strawberries - Average refrigerated life span = 3 days
Number of days to spoil:Green Bags
Lettuce Keeper
Preserving Disc
Strawberries 7 8 6Product A (optional) 8 5 6Product B (optional) 6 8 8Product C (optional) 8 5 7
Terms/Concepts: How does produce spoil?; Ethylene; Methane; How long do fruits & vegetables last? Make a list of fruits and veggies along with their average shelf/refrigerator life; How do produce preservers work?

4
ProblemWhat direction should solar panels face, and why?
Materials
Magnetic compass Empty tissue box Marker Pen and paper 4 outdoor/indoor thermometers Sunny day Sand (or other form of weight) Tape Plastic wrap
Procedure
1. Fill your empty tissue box with sand.2. Tape each of the four thermometers to the tissue box, one to each side, with all the bottoms facing the
same direction.3. Tape a layer of plastic wrap over each thermometer using a square of equal size for each of them. What
do you think the Plastic Wrap is for?4. Find a spot outside that you know will get sunlight all day.5. Try to wake up before the sun rises so that you can place your tissue box in this spot. Use your compass
to find north, and rotate one side of your tissue box to face that direction. Label this side with an ‘N,’ and make sure to all the other sides with their corresponding directions on the compass. Do you think the sun rises directly to the east and sets directly in the west? Why or why not?
6. After the sun begins to rise, wait half an hour and look at the temperature for each thermometer. Record the time for each thermometer in a chart like this:
7. Do this after every hour over the course of the day, until late in the afternoon (or until sunset, if you can wait that long!).
8. Collect your tissue box and make a graph of temperatures using the data you collected. What’s the difference between the highest and lowest temperature thermometers? Is this surprising to you? Are the temperatures the same at dawn and sunset?

5
Find out what household cleaner does the best job of removing stains from fabric.
Old white socks or shirt Large, old towel Scissors Grape juice Ketchup Access to a patch of grass 3 eyedroppers 5 medium-sized plastic containers Masking tape Permanent marker Water Hand soap Bleach Dawn dishwashing soap Hydrogen peroxide Spray bottle 2 different brands of stain remover
1. To get out of a mess, you need to get into one in the first place! Cut out eighteen 2x2 inch squares from the old socks or shirt and place the cloth pieces on a table that’s easy to clean. This is the fabric that you’re going to stain.
2. Lay out an old towel and use the waterproof marker to write the word “control” on a piece of masking tape, and stick it on the top left corner of the towel.
3. Use one of the eyedroppers to add a few drops of grape juice to one square of the fabric.4. Use the other eyedropper to add a few drops of ketchup to a second piece.5. Rub the third control cloth on a patch of grass so that the fabric is streaked bright green.6. Line these controls underneath the “control” label.7. Using the same process, stain the other fifteen pieces of cloth (5 grape juice, 5 ketchup, and 5 grass).8. For the next set of three stained cloths (grape, ketchup, and grass), dip the fabric into a container of water,
and rub in a dot of hand soap to the stain. With masking tape and a permanent marker, label this set “hand soap + water.”
9. In your next set, spray the cloths with your firststore-bought stain remover and label the set with the brand name.
10. Repeat step 9for the second store-bought stain remover.11. Use an eyedropper to apply three drops of bleach to the next set of stains. (Be careful! Bleach is an
irritant, so make sure you wash with soap and water if you get any on your skin). Don’t forget to label!12. Next, let’s make a homemade stain remover and see how it compares. In the spray bottle, mix one
tablespoon of Dawn dishwashing liquid with two tablespoons of hydrogen peroxide. Swish the mixture around a little, and spray it on your last set of stains. Add your label to the towel.
13. Let the fabric dry. While it is drying, use the masking tape to label the five plastic containers with each stain remover. Fill each of these containers with about an inch of warm water.
14. Leave the control on the towel – don’t put it into the water. Each of the other pieces of fabric can go into its own container of water.
15. Let the pieces of fabric sit overnight, then pull them out and set them back on the towel in the morning. Let them dry again.
Are any of the pieces of fabric lighter than the others? Which stain remover is best at removing stains? Did some stain removers work well on one kind of stain, but not others?

6
Problem:How greasy are different brands of potato chips?
Materials:
Several bags of potato chips (different brands) Something to write with Rolling Pin Wax Paper, plastic wrap, or large sandwich bag Graph paper Tape Window Sunlight
Procedure
1. Find the serving size listed in the nutrition facts for each brand of chips.2. Write down the serving size for each brand. If we’re trying to determine if a serving of one brand of chips
is greasier than another, why do you think recording the serving size for each brand of chip is important?3. Find the total fat per serving for each brand of chips, in grams. Record this number.4. Pick a brand of chips. Count out a number of chips equal to the serving size for that brand. Make sure to
pull chips randomly from the bag. Don’t pick big or small ones, specifically. If we want to take an accurate average, why do you think this is important?
5. Place the chips on a sheet of graph paper. Record the amount of chips you pulled out for this brand of chips.
6. Lay the wax paper, plastic wrap, or large sandwich bag over the chips.7. Use this time to formulate your hypothesis. Which brand of chips do you think will be the greasiest? 8. Roll over the chips several times with the rolling pin, making sure they’re totally pulverized.9. Remove the graph paper and throw away the chips. Tape the graph paper to a window (or the surface of
your school’s overhead projector, if you have access to one).10. Count the number of squares that are translucent from the grease. (Hint: make a check mark in each
square you’re counting. You can use a pencil, pen, or grease pencil if you’re marking the graph paper itself. If you’re using an overhead projector, you can use a dry-erase marker to mark squares projected onto the whiteboard.) Only count squares that are ½ full or more. Record the number of squares you count for this brand.
11. Repeat steps 4-10 for each brand.12. The average grease per serving size is simply the amount of squares you counted for each brand. To
calculate the average grease per chip, divide squares counted by the number of chips tested. Record this number for all brands in your data chart.
13. Draw a graph like the one below comparing the listed fat value per serving for each brand of chips and the number of squares you counted when you did the experiment. Does the data surprise you, or is it what you expected? What does it suggest about the accuracy of your measurements?

7
ProblemHow does smell affect taste?
Materials
15 volunteers, none of whom are allergic to any of the foods you are giving them. You might ask about strawberries especially.
Assortment of fruit Knife Cutting board 3 large plates Q-tips Essential oil of peppermint Clipboard Pencil Plain crackers Water Cups
Procedure
1. Before you start your experiment, make sure that each of your volunteers isaware that he or sheisparticipating in an experiment related to smell and taste.Ask about any allergies to fruit or peppermint oil.
2. Create a data table you can fill in quickly as you test each volunteer.Make a copy for each volunteer (see example below).
3. Chop the fruit into bit-sized pieces. You need three pieces of each kind of fruit for each volunteer. 4. Stick a toothpick in each piece of fruit.5. Make sure all different types of fruit are cut intopieces of the same size and that there are no pieces of
fruit skin or seeds.6. Make piles of each type of fruit on each of the three plates.7. For one plate of fruit, use the cotton swab to dab a drop of peppermint oil on each piece of fruit.8. Do not let your volunteers see the plates of fruit.Also, they will need to shut their eyes or be blindfolded
throughout the experiment.9. Test each volunteer separately.10. Start with the fruit with peppermint oil on top.Hand your volunteera piece of fruit.Give her 3 seconds to
identify the fruit. If sheidentifiesthe fruit correctly, put a check mark on the data table with her name.If she can’t identify the fruit or identifiesit incorrectly, mark a 0 on her chart.
11. After testing everybody with peppermint oil covered fruit, give each volunteer some time to rest, drinka glass of water, and eata couple crackers.
12. Repeat the experiment, this time asking your volunteers to close theireyes and hold their noses as they taste each fruit.
13. Again, give your volunteers a rest before you do the final trial.14. For the next trial, your volunteers just need to shut their eyes.15. Repeat the taste test and record the results in each data table.

8
ProblemDoes age negatively affect memory?
In this study, you will test the short-term memory capacity of different age groups and examine your data to determine if younger people really have a better memory than older people.
Materials
Memory flashcards with pictures, or a computer, printer, and paper to make your own At least 5 groups of test subjects from different age groups (it would be ideal to test two people from each
of the following age groups: 10-19 years old, 20-29 years old, 30-39 years old, 40-49 years old, 50-59 years old, 60-69 years old, 70+ years old)
Timer or stopwatch
Procedure for Memory Flashcards
1. If you are going to make your own memory flashcards, make sure to print on paper thick enough that you can’t see the printed image when it is turned upside down.
2. Choose about twelve images of common things (for example, apples, butterflies, trees, airplanes, etc.). Arrange and resize the images on a Word document so that you can fit about eight images on each page. Print two copies of each of the images.
3. Cut out the images into cards of the same size.
Procedure for Study
1. Arrange your cards randomly on a table face down.2. Start your timer. Have you test subjects sit at the table and flip over two cards. If the images on the cards
match, they can put them aside. If they don’t match, the subject must turn them back over before choosing two cards again to turn over. The object of the exercise is to remember where certain cards with certain images are located in order to pair them.
3. Record the age and the time it took to complete the matching memory game for each test subject in a table. Did your study demonstrate that older people have worse short-term memories?

9
Shirt recently taken off of each subject Blindfold Chair
Just like fingerprints, each person has a unique smell. This unique smell is called an odortype. Every living thing gives off a scent. These scents are made up of molecules that evaporate and enter the air. The olfactory receptor neurons in the nose gather the scent molecules and send a message to the brain. Humans can recognize about 10,000 different smells.
In this investigation, subjects try to identify the smell of family members by smelling clothes recently worn by family members.
Terms, Concepts, and Questions to Start Background Researcholfactory receptor neurons: neurons in deep in the nasal cavity that receive and recognize smells
odortype: a mammal’s unique smell
Every person has a unique smell. Olfactory receptor neurons in the nose gather scents and send a message to the brain.Research Questions
Does each person have a unique smell? Do people recognize the unique smell of family members? Why do people have unique smells?
1. Decide on the subjects to be used in this study. The subjects should be people from your own family, but also test people from another family.
2. Gather a shirt from each of your subjects. The shirts should have been taken recently from the subjects’ bodies.
3. Assign each shirt a letter identification. For example: Mom’s shirt = A, Dad’s shirt = B, little brother Max’s shirt = C, and so on.
4. Blindfold a subject and have him or her sit in a chair. One at a time, hold each of the shirts under the subject’s nose. Do not allow the subject to touch the shirts. Ask the subject to guess who the shirt belongs to. Record the responses.
5. Repeat Step 3 with each of the subjects.

10
Problem:Do certain colors of M&Ms absorb more microwave radiation than others? Do some colors of M&M's melt faster than others?
Materials:
A package of M&Ms (If possible, get a package of coconut M&Ms. This package will have three colors: green, brown, and white. If this isn’t possible, get the good old traditional M&Ms with five colors: yellow, red, blue, green, and orange.).
Microwave Jar lid Pencil Paper plate Glue Ruler
Procedure
1. Get your flat, microwaveable plate. The plate needs to be paper, not plastic, since some plastics might heat in the microwave. Why do you think we want to avoid picking a plate that heats up in the microwave?
2. Measure the distance to the center of the circle, and make a dot in the middle. Center the jar lid over the dot and trace the lid with a pencil to create a circle.
3. Take your M&Ms out of the package, and pick only the candies that aren’t cracked or oddly shaped for your experiment. Why do you think it’s important that we pick normally shaped candies?
4. Time to get your candies in position! Make three or five clusters (depending on the type of M&Ms you are using) of three candies each, placed at equally spaced points around the circle. Refer to the illustration below:
5. Make sure that the clusters of M&Ms are equally far away from each other. Then, use a dot of glue to attach each candy to the plate.
6. While waiting for your glue to dry, create a hypothesis, your best guess about what is going to happen. When you cook these candies in the microwave, which colors do you think will get hot and crack first? Why?
7. Place the plate in the microwave. Different microwaves take different amounts of time to do this step, so if your microwave is not very strong, this can take quite a few tries. Heat the candies for 30 seconds, then remove them from the microwave and observe them. Are there any cracks? Record the number of cracks and any other observations in a table like the one below:
8. Heat your candies again for another 30 seconds, and observe them again. Continue to repeat this step until one of the candies cracks. What was the color of the first candy to crack? Make sure you record any changes after each 30 second cooking period.
9. Do this experiment several times with new sets of M&Ms placed in the same position on fresh plates. Why do you think we want to repeat the experiment more than once

11
Problem:What effect does caffeine have on human heart rate?
Materials:
10 Adults or more (We want to test as many as possible. Why do you think this is?) Mp3 player loaded with relaxing music Clock and stopwatch (a cell phone usually has both of these functions) Eye mask 5 cans of a caffeinated version of a drink 5 cans of a non-caffeinated version of the same drink Paper and tape Notebook
Procedure1. Spend some time learning how to accurately take a person’s pulse. There are plenty of good resources
online that can teach you how. Using a stopwatch, make sure to practice taking somebody else’s pulse until you’re sure you can get an accurate reading every time.
2. Mask your drinks using your paper and tape and label each can with a number.3. Make sure that you record whether each number is caffeinated or non-caffeinated in your notebook.4. Arrange a time to test each adult. It will take around 30 minutes to perform the test. Test each person
at around the same time of day, in the same circumstances (same chair, same song, etc.). Be sure to test each adult one at a time. Ask each person to refrain from eating or drinking for two hours before the test. Why do you think we want to make sure all of these things are the same from one test to the next?
5. Ask each subject what his or her caffeine consumption habits are. Record the subject’s answers on a sheet of paper dedicated to that subject, and be sure to keep your records confidential.
6. Have your subject put the mask over his or her eyes. Have the subject put the headphones on, listen to the music, and relax.
7. After five minutes have passed, take and record your subject’s starting pulse without disturbing them.8. Provide your subject with a randomly selected drink. Record the drink’s number in your notebook.
Ask your subject to drink it as quickly as possible.9. Wait five minutes, and then take and record your subject’s pulse. Continue taking the subject’s pulse
at 5-minute intervals until 15 minutes have passed.10. Graph the data you recorded.11. Do people who consume caffeine regularly react to the caffeine? To the placebo? To both? Is there a
correlation between habitual caffeine consumption and the change in pulse rate? Try to think of as many questions as you can, and keep an eye out for surprising results. After you are satisfied with your analysis, look up the effects of caffeine on the body and see if your study agrees with what other scientists have found.

12
Problem:Do certain storage conditions help avocados ripen more quickly?
Materials:
5 very firm avocados 1 banana 1 apple 3 brown paper bags Access to a refrigerator
Procedure
1. Take note of the appearance of each avocado.2. Place one avocado on the counter.3. Place one avocado on a shelf in the refrigerator.4. Place one avocado in a brown paper bag.5. Place one avocado in a brown paper bag with an apple.6. Place one avocado in a brown paper bag with a banana.7. Make sure to write down the date you begin your experiment in your data log.8. Visit your avocados on each day listed on the chart below and note any changes in the appearance, smell,
or texture of each avocado.
Digging Deeper:So how can you take this experiment to the next level? Easy. Switch up the fruits you pack away with the avocado. Switch out the avocado for a different fruit to test. Try a warmer environment instead of using a refrigerator.
There are countless things you can do to learn about fruit and how different things affect how quickly ripen, so get creative. But make sure to try only one new thing at a time! If you change more than one part of the experiment at a time, you won’t know what change caused your different results. Go to it and have fun!

13
ProblemWhich batteries last longer: brand-name or generic, alkaline or non-alkaline?
Materials
Several different brands of AA batteries. Try to purchase batteries that all have roughly the same expiration date (at least within the same year), and note the price you paid per battery. Here are some suggestions:
o Brand-name batteries: Rayovac Energizer Duracell Eveready Panasonico Generic brands: CVS Walgreens Rite Aid Kirkland (Costco) Several identical flashlights that take two AA batteries (get one flashlight for each type of battery you
plan to test) Notebook Clock or watch Masking tape to act as labels
Procedure
1. Choose a day where you’ll be able to monitor your experiment all day. Make sure to start your experiment in the morning!
2. Label each flashlight with the model of battery you will use that flashlight to test.3. Load each flashlight with two of the appropriate model of battery.4. Turn all of the flashlights on at once. Note the time, and record it in your notebook.5. Monitor each flashlight until it dies. When one goes out, note and record the time in your notebook.

14
Objective:This project examines whether people’s perceptions of taste are influenced by their sight.
Research Questions:Can the color of a food or drink affect a person’s perception of its taste? or Can our eyes fool our taste buds?
Materials:
Three containers of apple juice Red and green food coloring 60 small, clear plastic cups 20 test subjects Paper Pencil
Experimental Procedure
1. With the food coloring, dye one container of juice red and one container of juice green.2. Pour a couple of inches of juice into each cup so that you have 20 cups of red juice, 20 cups of green
juice, and 20 cups of uncolored juice.3. Place one cup of each color of juice in front of a test subject.4. Ask your subject to taste the red juice and tell you what flavor it is.5. Ask your subject to taste the green juice and tell you what flavor it is.6. Ask your subject to taste the uncolored juice and tell you what flavor it is.7. Record their answers.8. Repeat steps 3 to 7 for all of your subjects.9. Analyze your results. Did the color of the juice affect your subjects’ perceptions of their flavors? Did
people mis-identify the flavors in keeping with the colors. (For example: Did they think the red juice tasted like fruit punch or cherry?)
Terms/Concepts: Taste buds, Sense of Taste, Sense of Sight

15
ProblemObserve the effect of temperature on the strength of magnets.
Does the temperature of a magnet affect its strength? How? Why?
Materials
3 or 4 identical neodymium bar magnets
Tongs Water
Stove Pot Ice Bowl
Compass Ruler Tape
Optional:
Dry ice Safety glasses Oven mitts
ProcedureBefore testing each magnet:
1. Set one magnet out on a table so that it reaches room temperature.2. Place another magnet in a pot of boiling water for 45 seconds.3. Place a third magnet in a bowl of ice water for 30 minutes.4. Optional: Using your tongs, oven mitt, and safety glasses, place a fourth magnet in a bucket of dry ice for
30 seconds.
To test the strength of each magnet:
5. Place the compass on a flat table so that the needle facing right.
6. Turn the compass so the needle lines up with the ‘0.’ Tape the compass to the table.
7. Tape the ruler to the table so that its direction is perpendicular to that of the needle. The ‘0’ on the ruler should touch the ‘0’ on the compass.
8. Take a magnet (using tongs for the heated and cooled magnets) and slide it along the ruler towards the compass. You want the needle to move towards the magnet, so if it is moving away, flip it over.
9. Take note of the distance between the magnet and the compass when the needle of the compass begins to move. Compare the distances you recorded for all of your magnets. What do you notice? How do you think you can explain your results?

16
Test Your Dominant Side
Check out this cool experiment that will teach you more about how your body and brain work together. Test your dominant side by completing a series of challenges. Which hand do you write with? Which foot do you kick with? Do you have a dominant eye? Do you throw with one side of your body but kick with the other? Are you ambidextrous? Answer these questions and much more with this fun science experiment for kids.
What you'll need:
A pen or pencil Paper or a notepad to write your findings on An empty tube (an old paper towel tube is good) A cup of water A small ball (or something soft you can throw)
Instructions:
1. Write ‘left’ or ‘right’ next to each task depending on what side you used/favored.2. When you’ve finished all the challenges review your results and make your own conclusions about which is your
dominant eye, hand and foot.
Eye tests:
1. Which eye do you use to wink?2. Which eye do you use to look through the empty tube?3. Extend your arms in front of your body. Make a triangle shape using your fore fingers and thumbs. Bring your hands
together, making the triangle smaller (about the size of a coin is good). Find a small object in the room and focus on it through the hole in your hands (using both eyes). Try closing just your left eye and then just your right, if your view of the object changed when you closed your left eye mark down ‘left’, if it changed when you closed your right eye mark down ‘right’.
Hand/Arm tests:
1. Which hand do you use to write?2. Pick up the cup of water, which hand did you use?3. Throw the ball, which arm did you use?
Foot/Leg tests:
1. Run forward and jump off one leg, which did you jump off?2. Drop the ball on the ground and kick it, which foot did you use?

17
Objective:Test whether plants can grow without sunlight and water.
Research Questions:How do plants make their own food? Plants contain a green pigment called chlorophyll, which can make food from water and energy from sunlight. But what happens when you deprive plants of water and sunlight? Can they live? For how long?
Materials:
Potted plant Pen and paper
Experimental Procedure
1. Place your potted plant in a dark room or closet.2. Do not water your plant.3. Check on the plant every two days for two weeks, and observe what happens.4. Record your results.
Terms/Concepts: Plants; photosynthesis; primary producers

18
Objective:To discover what bubble wrap shape work best in cushioning impact.
Research Questions:Popping the bubbles in bubble wrap is always satisfying. But have you ever noticed that some of the bubbles are small and some are large, and some are square and some are round? Have you ever wondered if the shape of the bubbles makes a difference in protecting the things they wrap? Let's find out.
Materials:
Standard bubble wrap with small circles Oversized bubble wrap with large circles Square bubble wrap A dozen eggs High stool, balcony, or similar elevated platform Masking tape
Experimental Procedure
1. Wrap each kind of bubble wrap over one egg and tape it securely, so that the bubble wrap completely encases the egg.
2. Go to a high place and drop the eggs down without using any force. Just drop it.3. Observe the effect of the drop on each egg.4. Repeat the procedure three times for accurate results.5. Record your results. What type of bubble wrap did the best job of protecting the eggs?
Suggested Chart
Trial 1 Trial 2 Trial 3 Notes
Standard Bubble Wrap
Oversized Bubble Wrap
Square Bubble Wrap
Terms/Concepts: Impact; collision; mechanics; force

19
Objective:To discover if a sud-free cleaning agent works just as well as one that generates suds.
Research Questions:
What happens when bubbles start forming and foam up? Does sudsy action get things cleaner?
Many cleaners are marketed for their “rich lather,” which suggests that more bubbles and foam lead to more cleanliness. But is it true? What exactly do these bubbles do?
Materials:
Two soiled towels with obvious stains Sudsy cleaning agent (can be shampoo, dishwashing liquid, or detergent) Non-sudsy cleaning agent Two buckets to hold the soiled towels Water
Experimental Procedure
1. Take the two equally soiled towels and place each in a separate bucket. Label one bucket "sudsy" and one "non-sudsy."
2. Add the cleaning agents accordingly.3. Add equal amounts of water to both buckets.4. Wash for the same amount of time at the same pressure for both towels.5. Now observe which one is cleaner.6. Record your results.
Terms/Concepts: Bubbles; Suds

20
ProblemDiscover which public places have the most bacteria.
Materials
5 or more petri dishes Small glass dish (Pyrex) Zip-top plastic bags Agar powder Water Cotton swabs Labeling tape Marker Nitrile disposable gloves
Procedure
1. Use cotton swabs to collect your bacteria samples. All you have to do is wipe the swab on a surface. Some good locations to find a lot of bacteria are door handles, bus or train seats, desks, and faucet handles. Use only one cotton swab per location. It’s a good idea to wear gloves during this experiment so that you don’t get sick from any of the germs. Make sure to wash your hands during and after the procedure.
2. Store each cotton swab in its own labeled zip-top bag.3. Label your petri dishes with the locations where you took each sample.4. Mix the agar powder with water, following the directions from the manufacturer.5. Pour a small amount of the liquid agar in to the small glass dish.6. Take a clean, brand new cotton swab and wipe a clean petri dish.7. Dip the swab into the dish of agar. Then wipe again on the petri dish and label it “control.” Why should
you always have a control? What purpose does the control serve?8. Clean out the small dish. You do not want to contaminate the agar between samples.9. Take each of your collected samples, dip it in agar, and swab the appropriately labeled petri dish.10. Keep the dishes at room temperature and record your observations over few days. Which locations seem
to have the most bacteria?

21
To determine whether the amount of air in a soccer ball will affect how far it goes when kicked.
Materials and Equipment required
Soccer ball Ball pump Ball pressure gauge Tape measure meter or
yardstick
Inflation needle Glycerin oil Roll of gym floor tape Marker Pen
Graph paper Data chart
Research Terms
air friction
forces air pressure
energy
Research Questions
How do we measure air pressure? How much air pressure is there at sea level? How is air pressure inside the ball related to the distance the ball will travel? What happens to the air pressure inside the ball when it is kicked? Will the atmospheric pressure affect the distance the ball will travel? Does friction affect the distance the ball will travel?
Experimental Procedure
1. State the problem you are going to investigate in this science fair project.2. Create and reproduce the data sheets you will use to record your observations.3. Gather all your materials.4. Select a helper (another student or a parent) to assist you in gathering the data.5. Use the gym floor tape and mark the path along which you will kick the ball.6. Select three air pressure levels for the ball, designating them as low, medium and high. Using the pressure
gauge, double check the pressure in the soccer ball each time you change the pressure. Caution: When kicking the ball, try to kick with the same force each time. Have your partner mark the spot where the ball lands each time. Then, measure the distance and record the data in your chart. Repeat the procedure 3 times at each pressure level and then average and record the results for each level.
7. Make a line graph of the data, recording differences in pressure on the Y axis and the distance travelled on the X axis.
8. Record your conclusion and prepare your report. Include all of the following: a clear statement of the problem, your hypothesis, and a list of the materials used. Include any safety precautions taken. Describe the procedures used. Include all the data that were gathered, including all charts and graphs. For dramatic value, you may include photos of the materials used or of you in the process of conducting this investigation. Include a bibliography of sources you used. You may wish to assess what you did and describe what you would do differently if you were to do this project again. You may wish to expand this research next year. What other experiments might you use to investigate the physics of a soccer ball?

22
What is the project about? The heat experiment is an activity in which students can test how different colors absorb heat differently.
What are the goals? The goal of the heat experiment is for students to compare how much heat is absorbed by black paper versus white paper. Students should learn that dark colors absorb more light and heat than lighter colors. Students can even apply this concept to real world situations, such as what color shirt to wear on a hot summer day.
What materials are required?
Glass jar or cup (2 of the same type per student) Water Thermometer Rubber band (2 per student) Construction paper (1 sheet of white and 1 sheet of black per student) Cling wrap
What is light absorbtion? What is light reflection? What colors are known to absorb heat more than others?
For the parent/student, what terms and concepts are required to better understand the project? The concepts of absorption and reflection are essential.
1. First wrap the black construction paper around one of the glasses/jars and secure it in place with a rubber band.
2. Next wrap the white construction paper around the second glass/jar and secure it in the same fashion with a rubber band. Fill both glasses approximately 3/4 full of water (they should have the same amount of water).
3. Cover each jar with cling wrap and secure with a rubber band if necessary.4. Put both glasses in direct sunlight for 5 hours.5. Remove the glasses from sunlight and measure the temperature of the water in each glass.

23
Problem:Does temperature affect how quickly water freezes?
Materials:
Freezer 3 bowls of equal size and shape Sticky labels Marker Water Measuring cup Thermometer Notebook Pencil
Procedure
1. Clear enough room in your freezer for the three bowls. You need to be able to put them in the freezer at exactly the same time, so you don't want to be moving your frozen food and drinks around later.
2. Think about what you know about ice. What temperature is water right before it freezes? You probably usually take baths in warm water. How quickly does the water turn cold when you're in the tub?
3. After considering different temperatures of water and ice, make a guess—called a hypothesis—answering the question: Does hot water freeze faster than cold water?
4. Write your hypothesis in your notebook, including whether you think the hot, warm, or cold water would freeze first and why.
5. Using your marker, write Hot on one of your sticky labels. Repeat with labels for Warm and Cold.6. Place the sticky labels on each of the three bowls, using one per bowl. The labels will help you keep track
of which bowl holds which temperature of water.7. With your pencil, draw three columns in your notebook. Label the first column Hot, the second one
Warm and the third Cold.8. With the help of an adult, heat 1 cup of water to 100 degrees Fahrenheit. Pour it into the Hot bowl, being
careful not to burn yourself.9. Heat 1 cup of water to 70 degrees Fahrenheit, and pour it into the Warm bowl.10. Fill the Cold bowl with water that's 40 degrees Fahrenheit.11. Immediately place all three bowls in the freezer.12. Record the starting temperatures in the correct columns of your notebook.13. Open the freezer door every 10 minutes and take the temperature of the water in each bowl with a
thermometer. Record the temperature in your notebook.14. Repeat Step 13 until all three bowls have frozen over.15. Compare the information in each of the three columns in your notebook. Was your hypothesis correct?

24
Problem:Do different types of grain affect the rate of mold growth? How do food preservatives affect mold growth?
Materials:
Five plates Slice of white bread Slice of wheat bread Slice of rye bread Slice of bread made from rice flour Slice of homemade bread (like this) Teaspoon Water Journal Camera
Procedure
1. Create a chart in your journal with the breads and the ingredients in each.2. Place a slice of bread on its own plate, and sprinkle a teaspoon of water on each sample. Make sure the
slices are equally damp, but not soggy.3. Place all five plates in a warm, dark place where they won’t be bothered (like an empty cabinet) and keep
some distance between the samples. Don’t let the plates touch.4. Take a photo of each sample on its first day.5. Leave the samples overnight.6. The next day, note any changes in your science journal, and take another photo of each sample.7. Then sprinkle on some more water to keep the samples moist.8. Repeat steps 6 and 7 for one week. Remember to take careful notes about the mold, like how much mold
is growing, and what color and shape it is.9. After taking your last photos on day seven, throw away all your bread samples.

25
Problem:Which type of balloon lasts longer: Mylar® or latex?
Materials:
Three Mylar® balloons Three latex balloons Helium tank to fill up the balloons (or you can purchase them filled)
Procedure
1. Inflate one helium balloon and one Mylar balloon.2. Put both balloons in a room together. Observe how long it takes for them to lose altitude and drop to the
ground, taking measurements each day.3. Repeat steps 1-3 for three more trails to ensure accuracy.4. Record your results.5. Research the physical properties and history of Mylar and Latex. Why might one have lasted longer than
the other?

26
Discover whether reading text on a computer screen or type on paper leads to better retention of information.
How many words read on the computer screen and how many read on paper does each test subject remember?
Did the screen or the paper lead to consistently more words being remembered?
A computer A printer Printer Paper A timer or watch Paper and pencil for tracking results At least 20 test subjects
1. Develop two simple memory tests: lists of words that the test subject will study and then try to remember. The lists should be different but equally difficult.
2. In a word-processing program, type one list of words.3. Print this list out on plain white paper.4. Repeat for the second list of words.5. Show the test subject the computer screen with the words from one list on the screen. Allow him to study
it for 30 seconds.6. Take the computer away and ask the subject to name as many of the words as he can remember.7. Now repeat the memory test using the sheet of paper with the second list of words printed on it.8. Record the number of words retained from each list.9. Repeat steps 5 to 8 for all test subjects. Switch off whether you test the computer screen or the paper first
and which list of words you use on each in order to prevent test, test-practice and test-fatigue biases.10. Analyze the results. Did either the screen or the paper lead to a consistently higher number of words being
retained?11. Extension: A day or two later, ask test subjects to list all the words they can remember from the tests.
Note how many words remembered the subject saw on the computer and how many were seen on paper. This will measure retention for long-term rather than short-term memory. Is there a difference in results for long and short-term memory?
Terms/Concepts: memory, retention, long-term memory, short-term memory

27
Objective:When an acid and a base combine, the base neutralizes the acid in a chemical reaction. This is how antacids work as well. This project will test which antacids are most potent in neutralizing lemon juice.
Research Questions:
How do antacids work? Which antacid is most potent?
Have you ever had heartburn? If so, you may have used an antacid to soothe your upset stomach. An antacid is essentially a base that neutralizes your stomach acid. In this project, you can test out which antacid is most potent – at least on the acid in lemon juice!
Materials:
Grape juice (no sugar added) Eye dropper Lemon juice Several test tubes Several different types of liquid antacids
Experimental Procedure
1. Add ten drops of grape juice to each test tube. Grape juice is a natural acid-base indicator, so it turns colors depending on whether the solution it is placed in is acidic or basic.
2. Rinse the eyedropper thoroughly.3. Add ten drops of lemon juice (an acid) to each test tube.4. Label each test tube with the name of one of the liquid antacids you are testing.5. Add the first antacid, drop by drop, to the first test tube. Stop as soon as the solution changes colors. A
color change means that the antacid has neutralized the acid in the lemon juice.6. In a table such as the one below, record the number of drops needed to neutralize the acid.7. Repeat this process with the remaining types of antacids, adding drops of one antacid to each of the
remaining test tubes.8. Record your data. Which antacid neutralized the acid most quickly? What does that tell you about that
antacid?
Terms/Concepts: Acids and bases; Neutralization; What causes upset stomach?

28
ObjectiveYou know you feel hotter after running around, but are you actually hotter? How much hotter? Use a liquid crystal thermometer to find out whether exercising makes a difference in people’s temperature.
Research Questions
Does exercise change your temperature? Does everybody’s temperature change the same amount?
Materials
Liquid crystal thermometer Volunteers Watch that shows seconds, or a stopwatch Paper and pencil
Terms to KnowTemperature
Exercise
Experimental Procedure
1. Write down the names of all of your volunteers on the piece of paper (don’t forget yourself!). Under each name write “resting” and “after exercise.”
2. Have your first volunteer sit down; have them hold the thermometer against their forehead for about a minute. Look at the temperature it says and write it down next to “resting” under that person’s name.
3. Have the volunteer run or do jumping jacks for three minutes without resting.4. As soon as the three minutes is up, take their temperature again. Write down the number next to “after
exercise.”5. Give the thermometer a minute or so to cool down.6. Repeat steps 2-5 until everybody’s temperatures have been written down.7. Look at your results. Did you notice that people’s temperatures were higher after exercise than they were
before? Subtract each person’s resting temperature from their after-exercise temperature. The difference is how many degrees their temperature rose after exercise. Did everybody’s temperature rise the same amount? Can you think of any reasons why two people might not get the same result?

29
Problem:Does land or water warm faster?
Materials:
2 thermometers 2 plastic boxes (These should be exactly alike.) Sand Water
Procedure
1. Pour sand into one of your plastic boxes to a depth of two inches. Pour water into the other plastic box to a depth of two inches. The sand box will represent land while the water box represents a body of water.
2. Place the two boxes in a location that receives direct sunlight.3. For a period of 30 minutes, check the temperature of both boxes every 10 minutes. Make sure to put the
thermometer down into the sand and water to get an accurate temperature of each material. Record the temperatures in a chart (see sample below) or plot the points on a graph.

30
Research Questions:
Did the group that practiced shooting free-throws increase the number of free-throws they were able to make at the end of the experiment? If so, by how much?
Did the group that practiced mentally increase the number of free-throws they were able to make at the end of the experiment? If so, by how much?
Did the control group that didn't practice at all increase the number of free-throws they were able to make at the end of the project? If so, by how much?
Materials:
Pen and/or pencil Lab notebook Nine volunteers Basketball Basketball hoop
Experimental Procedure
1. Begin by having all of your volunteers make ten free-throw attempts each. Record how many free-throws each person was able to make in your notebook.
2. Now divide your volunteers into three groups. Ask your first group of three volunteers to practice shooting free-throws for ten minutes everyday for two weeks. Ask your second group of three volunteers to only mentally visualize themselves practicing free-throws for ten minutes everyday for two weeks. Ask your third group of three volunteers, your control group, not to do any practicing of any kind for the next two weeks.
3. At the end of the three weeks, gather your volunteers together again. Ask each volunteer to make ten free-throw attempts. Record how many free-throws each volunteer was able to make.
4. Analyze your data. Compare the number of free-throws made at the beginning to the number of free-throws made after two weeks. Did all of the groups improve? Did one or two groups improve more than the others? If so, why do you think that is? Were there any surprises?

31
Single stem cut flower examples: Roses, Lilies, Daisies, Mums, Carnations, Gladiolas, Orchids, Tulips, etc. Some of these can be found in supermarkets. Special varieties are available at a local florist. (2 of each kind you choose)
Empty water bottles, cleaned. The water bottles should be the same to eliminate variation. Camera (optional)
1. Using room temperature or cool tap water fill each water bottle with the same volume.2. Cut one of each flower stem at 10 - 12" from the base of the blossom at an angle. Depending on the height
of your water bottle the height may vary but always cut each stem at the same distance.3. Place each stem in its own water bottle and place it in the same area making sure each flower gets an
equal amount of light.4. Cut one of each flower stem at 10 - 12" from the base of the blossom straight across. Depending on the
height of your water bottle the height may vary but always cut each stem at the same distance.5. Place each stem in its own water bottle and place it in the same area making sure each flower gets an
equal amount of light.6. Record the date and appearance of the flower. If you have a camera available take a photograph. 1. Does it look like a freshly cut flower?2. Is it starting to dry out?3. What color is the blossom? Are the petals beginning to brown?4. Count the number of petals. Are any petals falling off? 1. Everyday record the date and the appearance of the flower. 2. Is it healthy like it was just picked? 3. Is it starting to wilt?4. Is it starting to turn brown?5. Are petals falling off?6. Is it wilted?7. Change the water after recording your findings each day. Keep the temperature and volume of water the
same for each flower.8. Repeat for 13 days or until all flower blossoms have wilted or died.
Terms/Concepts: Why should flower stems be cut at an angle?

32
Make sure no one has access to the cabinet where the samples will be stored during the experiment. Moldy/spoiled food can make you sick.
ObjectiveTo see what kind of food, left un-refrigerated, will mold first.
Project Goals
To leave food out to see which one will mold first. To see what foods need the least refrigeration.
Materials and Equipment
Banana Cheese Milk Bread A cabinet in which to place the samples for one week Paper and pencil Camera
Research Questions
Which type of food will mold (spoil) the quickest? Does dairy mold faster if not refrigerated?
Terms, Concepts and Questions to Start Background Research
You need to know what foods are usually refrigerated and which are not. You need to research mold to see what it looks like and how it spreads.
Experimental Procedure
1. Gather all of your sample foods and make sure they are fresh and not yet moldy.2. Take the banana, bread, and cheese and put them each on a separate plate.3. Pour milk in to a glass.4. Take pictures of the food as it appears when fresh.5. You will need to put your samples in a cabinet. They will all need to be in the same place at the same
temperature so that you get the most accurate results6. Wait 4-5 days and check on the samples. Have any of them molded?7. Document your results.8. Take pictures.

33
Objective:In this experiment we observe the expansion of liquids when frozen (changed into a solid) and determine if some liquids expand more than others when frozen.
Research Questions:Do liquids expand when frozen (when they become a solid)? Do different liquids expand different amounts?
Materials:
Six tall, narrow, clear plastic containers of the same size and shape (approximately 2 cups each) Three cups tap water Salt Sugar One cup milk One cup juice One cup vinegar Black Sharpie Red Sharpie Freezer
Experimental Procedure
1. Gradually stir as much salt into one cup of water as will dissolve.2. Gradually stir as much sugar into one cup of water as will dissolve.3. Pour one cup of each of the six liquids (water, salt water, sugar water, milk, juice, vinegar) into each
container.4. Fine tune the amount of liquid in each container so that all the containers are filled to the same level.5. With the black sharpie, mark on the container the name and level of its contents.6. Put all containers in the freezer.7. When frozen, remove the containers from the freezer and, with the red sharpie, mark the level of their
frozen contents. Did any of the liquids expand when frozen? Did some of the liquids expand more than others?
Terms/Concepts: liquid, solid, expansion

34
Objective:This science project examines the connection between temperature and chemiluminescence.
Research Questions:
Does temperature affect the strength of chemiluminescence? Can heat add energy to the chemical reaction in a light stick?
On a fall night, you’ve probably seen fireflies glowing in the bushes. Fireflies use chemiluminescence, a very efficient process that converts energy to light. Light sticks use a similar process. Do you think that temperature affects how bright light sticks or fireflies can glow? This experiment will help you find out.
Materials:
Four foam cups Permanent marker Four identical light sticks Four thermometers Stopwatch Graph paper, optional
Experimental Procedure
1. Label the cups “hot,” “warm,” “cold,” and “freezing.”2. Fill the “hot” cup with boiling water, the “warm” cup with warm tap water, the “cold” cup with cold tap
water, and the “freezing” cup with ice water.3. Drop a thermometer into each cup, and wait about a minute to make sure that the temperatures have been
measured correctly.4. Activate each light stick, and start your stopwatch at the same time.5. Simultaneously, drop each light stick into a cup of water and stir them for one minute.6. Turn off the lights. Compare the brightness of the sticks and record your observations. Try to rank them
in terms of brightness, with “4” being the brightest and “1” being the least bright.7. Turn on the lights again.8. Use the sticks to stir the cups of water for exactly five more minutes.9. Turn off the lights and compare the brightness of the sticks again. Record your observations.10. Leave the light sticks in the cups for one hour. Then compare the brightness of the sticks again.11. Analyze your data. You can either average the three rankings of each light stick and then compare the
averages, or graph the ranks on a line graph.
Terms/Concepts: Heat Energy; Endothermic and exothermic reactions; Chemiluminescence and bioluminescence; What makes fireflies glow?; What makes light sticks glow?

35
ObjectiveThis experiment explores how salt and sugar affect the melting rate of ice in water.
Research Questions:
Does adding salt to ice and water slow down, speed up, or not change the rate the ice melts in the water? Is salt the only substance to have this effect? What about sugar?
Knowing how to speed up the melting rate of ice is very important information for anyone who needs to de-ice roads or driveways after a winter storm. While it seems simple, adding salt to ice water actually activates two complex, and contradictory, chemical reactions. The salt disrupts the equilibrium of water and ice, slowing down the amount of water freezing into ice and speeding up the amount of ice melting into water. However, because of this disruption, salt lowers the temperature of the water, making the overall melting rate decrease. Which reaction will win out? We’ll also test the effect of sugar on ice.
Materials:
Three cups of equal size, one labeled “control,” one labeled “salt” and one labeled “sugar” Water Ice Salt Sugar Tablespoon Stopwatch Notebook and pen
Experimental Procedure
1. Fill each cup with water.2. Add the same amount of ice to each (about four to five cubes, depending on size of cups).3. In the cup labeled “salt,” sprinkle on a tablespoon of salt. Do not stir.4. Immediately sprinkle a tablespoon of sugar into the cup labeled “sugar.” Do not stir.5. Start the stopwatch.6. Note down the amount of time it takes for the ice to completely melt into water for each cup.7. Clean out the cups and repeat experiment three times or more, always keeping careful notes.8. Analyze this data. Figure out the average time it takes for ice to melt in plain water, water with salt added
and water with sugar added.9. For further evaluation, try using different amounts of salt. Feel free to experiment with other substances
as well, like rubbing alcohol or sand.
Terms and Concepts: molecular thermodynamics, equilibrium, freezing point, melting point, hydrogen bonds

36
Problem:How does the ply-number of toilet paper correlate to its strength?
Materials:
1, 2, & 3-ply toilet paper Water Dropper Pennies Empty soup can Rubber band
Procedure
1. Roll out three sections of each type of toilet paper.2. Observe the paper’s thickness, softness, and texture.3. Position the 1-ply piece so that the middle section is covering the top of the can. The perforated lines and
the other 2 sections should be on each side of the can.4. Place the rubber band around the can to hold the paper in place.5. Use the dropper to wet the middle of the bridged section of paper with 0.6 mL of water.6. Begin placing pennies on the dampened section one at a time.7. Continue placing the pennies until the paper breaks and the pennies fall into the can.8. Record your data.9. Repeat the experiment using the 2-ply and 3-ply paper.10. Analyze your data. Which ply of toilet paper held the most pennies before breaking? How does the
number of pennies held correlate to the strength of the paper? Is there a relationship between the ply number and the strength? Do you think the texture of the paper affects the strength?

37
This project examines which beverages produce more gas.
Which beverages release the most gas? How does the gas released by beverages affect your stomach?
Some beverages release more gas into your stomach than others. How much gas is produced by your favorite beverages?
Plastic bottles Balloons Vinegar Heating pad Variety of beverages (water, soda, juice, milk) Measuring tools
1. Pour an equal amount of each beverage into separate plastic bottles.2. Mix a couple teaspoons of vinegar into each beverage. The vinegar will represent your stomach’s
acid.3. Blow-up and release the air in a balloon for each bottle. This will stretch the balloons so they are
more easily inflated.4. Stretch the open end of a balloon over the opening of each bottle.5. Place the bottles on a warm heating pad.6. Observe the balloons at different intervals as the liquids begin to heat.7. Which liquids have inflated balloons? Which balloons are inflated more than the other balloons?
How is the inflation of each balloon related to the amount of gas produced by the liquid?
Terms/Concepts: gas; phases of matter; Which liquid beverages release the largest amount of gas?

38
Problem:What do plants need to grow? What happens to a plant that does not have sunlight or water?
Materials:
Twelve small, easy and fast to grow plants in pots (bean plants work well). Really only four plants are necessary, but it’s good to have the extras in case one or two don’t make it for reasons outside of the experiment.
Sharpie for labeling pots A sunny place A dark place (e.g. a closet) Water and watering container Paper and pencil/crayons for recording results
Procedure
1. Begin with 12 small, healthy plants. Divide them into four groups.2. Label the pots with words or simple pictures, three pots each: sun, water, sun and water, nothing (neither
sun nor water).3. Keep the “sun” plants in the sunny spot; keep the others in the dark place.4. Water the “water” plants daily or as necessary for your climate. Do not water the others.5. Check on the plants daily and record your findings in a chart labeled with the date along the left and each
of the four categories along the top. (Younger children may of course need help with this. Alternatively children may periodically make drawings of the plants that an adult can then post in a large wall chart.) Some observations you might make: What color are the plants? How tall are they? Are they getting new leaves? How do they feel (brittle, fleshy)?
6. Continue the experiment for as long as is necessary/appropriate.

39
Problem:Do some colors absorb more heat than others?
If you put a bunch of pieces of the same kind of paper out in the sun at the same time, they should all get equally warm, right? Let's find out!
Materials
Sunny day Five pieces of construction paper in different colors: white, red, green, blue, and black Tape Five thermometers Timer or clock or watch with alarm Piece of lined or graph paper and a pencil
Procedure
1. Fold each piece of construction paper in half the long way.2. Tape the long end and one short end completely shut so that the pieces of paper make skinny pockets.3. Make a graph on a sheet of lined paper. Along the left, make a column listing the construction paper by
color (white, red, green, blue, black). Along the top, make a row of numbered column headings, 0-10.4. Make sure all of the thermometers read the same temperature and write this starting temperature in the
“0” column next to each color on your table.5. Put one thermometer inside each pocket. Then take everything outside and set the pockets down next to
each other in the sun.6. Every 10 minutes, peek at each thermometer and write down the temperature on your chart. Do this 10
times.7. Now look at your observations. Did all of the thermometers heat up at the same pace, or did some heat up
faster and others slower? Did they end up being the same temperature at the end, or different temperatures?
Terms/Concepts: absorption, reflection, solar radiation

40
Problem:Does aspirin help plants grow?
Materials:
Aspirin tablets A drinking glass Hot water Room temperature water Seeds Two plant pots Soil with fertilizer Sunlight Ruler Pen and paper for notes
Procedure
1. Label one pot “Aspirin Water” and the other “Plain Water.”2. Put some soil into the pot and plant the seeds inside. Cover them up.3. Take them to a location that gets plenty of sunlight- perhaps outside if it is warm or by a window?4. Put two tablets of aspirin in a drinking glass.5. Add hot water to the tablets; they should melt and dissolve. If not, then add boiling water. Stir until
completely dissolved.6. Allow the water to cool to room-temperature.7. Once the water has cooled, water the seeds in the pot labeled “Aspirin Water.” Do not over-water the
seeds. Just add enough water until the soil is moist. Do not get the soil soaking wet.8. Water the seeds in the pot labeled “Plain Water” with plain water. Again, just get the soil moist.9. You should water the seeds everyday or when the soil feels dry with the designated types of water.10. Observe the growth of the plants daily. How long did the seeds take to germinate in each pot? If you
observe measureable growth, take your ruler and measure the height of the plant.

41
Objective:To determine whether plants experience pollution. Will plants grow more or will they be unaffected when planted in polluted soil?
Research Questions:
What is photosynthesis? Under what kinds of conditions will most seeds germinate? What are some of the substances that can pollute the soil? What do scientists know about the effect of oil in the soil and its impact on plant germination and or
growth? Is the ph of the soil a critical factor in plant growth? What is the ph of ordinary household vinegar?
Materials:
a package of seeds Planting pots top soil a measuring cup
water a watering cup a can of heavy motor oil instant dry caffeinated coffee
a bottle of white vinegar metric ruler a camera
Experimental Procedure
1. Gather all the materials that you will need for this project. These include: a package of seeds of sunflower or alfalfa or radishes, planting pots, top soil, a measuring cup, water, a watering cup, a can of heavy motor oil, instant dry caffeinated coffee, and a bottle of white vinegar, metric ruler, labels, tape, a pencil and a camera.
2. Fill your 8 planting pots with top soil. Each with the same amount. Read the directions on your seed package and plant the seeds as directed. Place the same number of seeds in each pot. Water as directed and place in a dark place for germination. Check for amount of time needed for germination. If you plan to supplement your observations with photos, start taking pictures now.
3. When the seeds have germinated, inspect to see that you have the same number of seedlings in each pot. If not, weed some out.
4. Now label the plants placing 2 plants in each category or group. Start with the controls. These plants will remain in uncontaminated top soil and therefore are labeled Control #1 and Control #2. We are being very safe in having 2 plants in each group in case one dies, we still have the other. Now, continue to label the groups of two plants as #1 and #2 +oil, #1and #2 +vinegar and #1and #2 plus coffee (caffeine). Our soil pollutants are oil, vinegar and caffeine. Will plants grow in these pollutants? Let us find out.
5. Take each group of plants and add the contaminants, placing one tablespoon of each contaminant as designated on the label, adding a tablespoon of oil, of vinegar, of dry, instant caffeinated coffee and of course, nothing to the controls. You have now contaminated 6 plants.
6. Place all 8 plant pots in full sunlight for the next 14 days watering them with equal amounts of tap water.7. Every two days, observe each group of plants and record your findings on the Observation Chart. You
may also take photos.8. Review the data in the Observation Chart and average and summarize your results in the Summary Chart.
Terms/Concepts: Soils, top soil, pollutants, soil contaminants, metals, heavy metals, photosynthesis, constant conditions.
Problem:Which type of cup is best for preventing ice from melting?
Materials:

42
Styrofoam, plastic and paper disposable cups of equal size
Objective:This experiment will evaluate if chewing gum affects students’ test performance.Research Questions:Does chewing gum improve students’ test performance?Introduction:Studies indicate that chewing gum may help improve academic performance. This experiment will test this premise by evaluating whether chewing gum helps students perform better on a series of mental challenges.Materials:
Gum Approximately 40 test subjects Several mental tasks (eg, medium-level Sudoku puzzle, multiplication test, etc) Computer Printer Notebook for analyzing results
Experimental Procedure
1. Put together several mental tests to give to your test subjects. Make sure that each task that you put together can be easily altered. You want the test to look different to your test subjects each time they take it (try not to alter the difficulty of each test when you revise them).
2. Divide your test subjects into two groups. One group should first perform the tasks while chewing gum, and the other group should first perform the tasks without gum.
3. Ask one group to chew gum while completing the tests. Record the time it takes for each test subject to perform each mental task.
4. On another day, ask them to repeat the tests without chewing gum. Remember to slightly alter your mental tasks so that they appear “new” to your test subjects. Record the time it takes for each participant to complete the tests.
5. Reverse steps 3 and 4 for your second group of participants. This group should be tested without gum on the first day, and tested with gum on the next day. Remember to slightly alter your mental tasks from one day to the next so that they appear “new” to your test subjects.
6. Analyze your results. Under which set of circumstances did test subjects perform each mental test fastest? Do you observe any patterns in your data? Does chewing gum seem to enhance or slow the speed at which the tasks are completed?
Concepts: chewing gum and academic performance

43
Objective:Discover which brands of permanent marker are least water soluble.
Research Questions:
Which “permanent” marker is really the most permanent? Do permanent markers come out in the wash?
Have you ever noticed that some permanent markers seem to last longer than others? Test out which brand of permanent marker is the most permanent, even after being washed in the laundry, by using this experiment.
Materials:
Masking tape Six different brands of permanent black markers Large piece of cloth Scissors Ruler Washing machine Detergent
Experimental Procedure
1. Wrap a piece of tape around each marker, and then label the tape with a number on each marker2. Cut out twelve pieces of identical cloth, each 6 square inches. Lay them out in two straight lines.3. Use each marker to make a dot on one piece of cloth from the first line and on one piece of cloth from the
second line. Write the number of the marker on the corner of each of the two cloths.4. Leave the clothes for a minute or two to let the ink dry.5. Set one row of cloths aside.6. Put the other row of cloths into the washing machine. Run them through the wash with some detergent
and hot water.7. Let the cloths dry completely.8. Order the washed cloths from darkest to lightest, and then compare them with the corresponding cloth in
the other row.9. Record your findings, including the ranking of each cloth (from darkest to lightest) and the color of each
mark.10. Analyze your data. Which marker was truly the most “permanent”?11. For most accurate results, you may want to repeat the entire experiment at least two more times.
Terms/Concepts: Water soluble; What is the ink in permanent markers made from?

44
Problem:Does gender affect the ability to identify different smells?
Materials:
Blindfold Knife Bowls Apple Orange Banana Lemon Cinnamon Brown sugar Garlic Onion Jalapeño peppers Any other “smells” you would like to test Notebook for recording results
Procedure
1. Cut up fruit and vegetables.2. Place each item in a separate bowl.3. Blindfold a test subject and hold a bowl up to their nose.4. Ask the participant to identify what they smell.5. Record whether the test subject was correct or incorrect.6. Repeat for each item.7. Repeat entire experiment for many different male and female test subjects. All test subjects should be
close in age to eliminate any influence age may have on sense of smell. Be sure no one has a cold!8. Evaluate your results. Are women better at identifying smells? Are women better at identifying certain
types of smells?

45
Problem:Which paper airplane design will fly the farthest?
Materials:
Paper Pen Measuring tape Notebook Scissors
Procedure
1. Take three pieces of paper and cut them so that they are all 6 by 6 inch squares.2. Fold all of them in half, and then open them flat.3. Take one piece of paper and fold two corners to the middle of the paper, forming a triangular head. 4. Take the wings of the plane and fold it so that it has 3 inch wings. This will be your Model 1.5. Take another piece of paper and let it have no head at all.6. Take the wings of the plane and fold it so that it has 3 ¾ inch wings. This will be your Model 2.7. Take the last piece of paper and fold two corners ½ inch away from the middle of the paper, forming a
smaller head with a flat tip.8. Take the wings of the plane and fold it so that it has 3 ½ inch wings. This will be your Model 3.9. Look at all of your plane models. Which do you think will fly the farthest? Write down your guess, also
called a hypothesis, in your notebook.10. Take your planes to a wide indoor area with no wind.11. Throw each plane model 5 times.12. Record each planes farthest distance.13. Look over your data. Are the results what you expected?

46
Problem:Does mint-flavored gum last longer than fruit-flavored gum?
Materials:
3 different packs of fruit-flavored gum 3 different packs of mint-flavored gum 6 volunteers Timer Notebook
Procedure
1. Separate the volunteers into two groups of 3 people.2. Instruct the first 3 people to chew mint flavored gum.3. Instruct the last 3 people to chew fruit flavored gum.4. Think about the gum you’ve chewed before. Which type of gum do you think lasts the longest? Write
down your guess, also called a hypothesis, in your notebook.5. Time how long each volunteer chews the gum until it loses its flavor.6. Record all the times until every volunteer has finished their gum.7. Look over your data. Were the results what you expected?

47
Problem:Do family members have the same fingerprints?
Materials:
Pencil Colored highlighters White paper Wide, clear tape Notebook Magnifying glass Family members
Procedure
1. Place your hand on a sheet of white paper.2. Trace the outline of your hand with a pencil.3. Take out an ink pad.4. Press your pinky into the ink pad. Make sure the front of the finger -- not the finger tip -- is blackened.
You might want to try rolling your finger from left to right over the scribble patch.5. Place a piece of wide, clear tape over your pinky finger. Press down gently.6. Slowly remove the piece of tape. There should be a dark circle where your fingerprint was.7. Put the tape on the outline of the pinky that you made earlier.8. Repeat this process with the other four fingers on your hand.9. Once your traced hand is filled with tape fingerprints, study your work with a magnifying glass. Can you
see the different types of swirls and swoops in your fingerprints? Those wavy and curly lines are classified as arches, loops and whorls. Arches look like miniature mountains; loops enter on one side of the finger before curving back and exiting on the same side; and whorls look like circles.
10. Do you think your family members will have the exact same fingerprints as you -- complete with matching arches, loops and whorls? Write down your guess, or hypothesis, in your notebook.
11. Repeat the same fingerprint process you did for yourself with your family members. Don't worry if you can't get everyone together at one time. Since the process takes a few minutes, you can take fingerprints from each family member one at a time.
12. Once you finish, it's time to study the fingerprints. Take out your magnifying glass again and start comparing your family members' fingerprints.
13. Remember arches, loops and whorls? Use your highlighters to indicate each one.14. Did any of the two people you looked at have the same fingerprints?

48
Objective:This project determines how temperature affects the stretch of a rubber band.
Research Questions:
What happens to rubber when it is heated? What happens when it is cooled?
Entropy, a measurement of the orderliness of the molecules that make up a substance, determines whether a material expands or contracts when it's heated. Let's find out what happens to a rubber band when it is both heated and cooled.
Materials:
Rubber band Scissors Weight set or washers Shoebox (about the length of a ruler) Ruler Pencil Refrigerator Hair dryer Pen Lab notebook
Experimental Procedure
1. Cut your rubber band in half with the scissors.2. Tie a weight or washer to one end.3. Sit the shoebox so that it stands tall and place the ruler inside. Poke a hole into the middle of the top of
the box. Thread the rubber band through the hole.4. Tie the rubber band to a pencil. Be sure to make sure the weight tied to the other end can swing freely.5. Allow the rubber band to stretch for three minutes at room temperature. Then measure the length of the
rubber band with the ruler. Record your data in your notebook.6. Now put the shoebox into the refrigerator for 15 minutes. After 15 minutes, remove the shoebox, and
measure the length of the rubber band again. How does the rubber band feel now? Record your data and observations.
7. Now it's time to heat things up! Use a hair dryer to heat the rubber band for 5 minutes. After 5 minutes, measure the rubber band again. How does the rubber band feel now? Record your information.
8. Analyze your data. When did your rubber band have the most stretch? When did your rubber band have the least amount of stretch? Why do you think this happened? Were you surprised? Record your conclusions.
Terms/Concepts: entropy; molecules; expansion; contraction

49
How do the melting, freezing and boiling points of liquids differ? What is it about them that does this?Problem:How do the melting, freezing and boiling points of liquids differ? Why?
Materials:
As many different liquids as you can find. Suggestions: water, juice, soda, different types of oil (canola, corn, coconut, olive), wax, vinegar, chocolate, etc.
A cooking or candy thermometer A small pot to use on the stove A freezer An adult to supervise Notebook and pencil to record observations
Experimental Procedure
1. Note observations of each item at room temperature. Is it liquid or solid?2. Determine the freezing point if it is a liquid by placing it in the freezer with a thermometer inside. Check
it every 10 minutes to see if it has solidified, and note the temperature when it has.3. Measure the melting temperature for each of the frozen items. For those that are solid at room
temperature, slowly heat in a double-boiler (a bowl inside of a pot with water at the bottom will work: be sure to have the thermometer ready to measure the temperature when it becomes a liquid). Determine the melting point of each item.
4. Heat each liquid in the pot until it just starts boiling. Measure the temperature with the thermometer.5. Record all results and make a chart comparing each liquid. Note which liquids have the highest and
lowest points overall for freezing, melting and boiling.6. Note whether the lowest and highest points are the same items for freezing, melting and boiling.

50
Objective:Students will compare the reflexes of girls and boys.
Research Questions:
Are there differences in the brains of men and women? How might these differences affect reflexes?
Materials:
A ruler (no sharp edges!) Website for reflex testing Computer(s) At least 50 test subjects of both genders, preferably in the same age range Notebook and pen to take notes
Experimental ProcedurePart 1
1. First we are going to do a simple reflex test with a ruler. Ask your test subject to kneel down on the floor with one of their arms out to be ready to grab the ruler. Tell them to grab it as soon as you drop it.
2. You should stand right in front of your partner and hold the ruler directly above his/her hand which should be in a “ready to grab” position. Make sure your ruler is turned the right way, with the lower numbers at the bottom.
3. Drop the ruler straight down into your partner's hand. Wait for them to grab it and record the number at which the top of their hand touches.
4. Repeat those steps for all your test subjects, keeping note of their genders.5. Find the average number for both genders by adding up all the numbers and dividing by the number of
test subjects in your gender group.
Part 2
1. In the second part of the experiment, we are going to use this website with reflex tests already made for you.
2. Have all your test subjects take the quick reflex tests on that webpage and record their genders as well as their test results.
3. Take these test results and also find the averages, like you did in Part I of the experiment.4. Analyze your results and create a graph to show which gender performed better on which test.
Terms/Concepts: Reflexes; Reaction Time; The functions of the brain; Stimuli; Nerves; Nervous System

51
Objective:This project explores the effectiveness of various cleaning solutions in cleaning tarnished and oxidized coins.
Research Questions:
Do the coins become clean or do they remain tarnished or oxidized? Which cleaning solution works best? How much effort does it take? Do the copper pennies get cleaner than the other coins? Do the oxidized coins get cleaner than the tarnished coins?
Materials:
Six pennies (tarnished or oxidized) Six nickels (tarnished or oxidized) Six dimes (tarnished or oxidized) Six quarters (tarnished or oxidized) One cup dish liquid One cup lemon juice One cup orange juice One cup water One cup cola One cup baking soda paste (Mix baking soda with water for a paste consistency.) 24 cups Six plastic spoons Six toothbrushes Newspaper or art cloth (to cover the table) Latex gloves (optional)
Experimental Procedure
1. Fill four cups each one quarter full with each of the six cleaning solutions suggested (4 with lemon juice, 4 with orange juice, 4 with cola, 4 with water, 4 with baking soda paste and 4 with dish liquid). Label the cups.
2. Carefully record each coin’s condition prior to placing it into its cup.3. Place one of each type of coin into each solution.4. Let all coins soak overnight.5. Using the plastic spoons and latex gloves, scoop each coin out of its cup and place it on the covered table.
Take care to label and keep track of which coin came from which solution.6. Examine the coins and record what you see before you start using the toothbrushes.7. Use the toothbrushes to clean the coins, rinse with water, re-examine the coins, and record your
observations.8. Address the research questions.
Terms/Concepts: oxidation, tarnish, chemical

52
Objective:The project is about determining whether moths are attracted to one color of light more than others.
The goal is to have the student review the literature about moths and light and then formulate and test a hypothesis about how moths respond to different colors of light.
Are moths attracted to one color of light more than to others? Why are moths attracted to artificial light sources?
Color light bulbs (alternatively a rainbow fluorescent light) Power strip Light sockets/cords Camera (optional)
Materials can be found on the Internet and are readily available.
1. Read about the attraction of moths to artificial lights, and formulate a hypothesis that predicts whether moths will be attracted to some colors of light more than others.
2. Place a white incandescent light bulb in a light fixture outdoors. Turn it on at night and watch for moths. Moths usually start to become active in late winter or spring.
3. Wait for a warm, still night free of rain then set up an array of six colored lights. Choose colors that represent a range of the visible color spectrum. Space the lights about a foot apart. Turn off the white light.
As an alternative you can purchase a rainbow fluorescent light that projects all the colors of the visible spectrum.
4. Stake a white translucent sheet about a foot above the lights. This will make it easier to see the moths from a distance.
5. Set you alarm clock so you can observe moth activity around the colored lights several times during the night. Not all types of moths show peak activity at the same time of the evening.
6. Observe and record the number of moths on the sheet each color in the light.
If you have a camera equipped for night photography, take a picture of the moths around the light to help you count them.
7. Evaluate your hypothesis in view of your findings. If necessary revise it, and propose additional experiments to test the revision.
Terms/Concepts: Moths; Artificial light; Moonlight; Feeding behavior (moths); Phototropism

53
Objective:In this experiment students will find out whether cutting up meats will make it cook faster than just cooking it whole.
Research Questions:
How do you know when your food is cooked? What is surface area and why is it relevant to cooking?
Meat is cooked when it reaches a certain temperature. At this temperature, all the harmful bacteria present in the meat is eliminated and is now safe to eat. Eating raw meat can be very risky as it contains contaminants such as salmonella, which causes severe upset stomach, diarrhea, vomiting, and fever. To prevent this, you should make sure your food is cooked thoroughly. However, most of us would like things cooked faster while being able to kill the germs!
Materials:
Meat (like steak) Knife to cut the meat 2 skillets 2 cooking thermometers cooking stove
Experimental Procedure
1. Choose two cuts of meat from the same part of the animal and that are the same dimensions and weight.2. Cut one of the meats into 1-inch square cubes. Leave the other meat uncut.3. Put the chopped cubes in one pan and the whole meat in the other. Stick a cooking thermometer through
both of them to monitor temperature. See which one reaches the “cooked” temperature faster and at what time: http://whatscookingamerica.net/Information/MeatTemperatureChart.htm
4. Evaluate your results.
Terms/Concepts: temperature; cooking; surface area

54
Objective:In this experiment, students will discover which battery composition lasts the longest.
Research Questions:
How does a battery work? What are rechargeable batteries?
Batteries make our lives portable. In other words, we can take things such as mp3 players, cell phones, digital cameras, and game consoles around to anywhere in the world. There are many kinds of batteries that are made of many chemicals. These chemicals each react differently to electricity, and some last longer than others
Materials:
Carbon Zinc Batteries (such as Eveready) Zinc Chloride Batteries (Panasonic makes some) Alkaline Batteries (Duracell) Lithium Manganese Batteries (such as Sony) Nickel Cadmium Batteries (these are labeled rechargeable, but for this experiment, they will not be
recharged) Rechargeable Nickel Metal Hydride Batteries (such as Energizer, will not be recharged for this
experiment) Lithium Ion batteries (such as Panasonic, will not be recharged) A device that drains a lot of power in a relatively short time (such as a digital camera) Timer Pen/paper for notes
Experimental Procedure
1. Take your first battery type and put it inside your chosen device. Turn the device on and leave it on consecutively until the batteries “die”. This time should vary and you should time the duration.
2. If you are not present when the batteries “die”, you should set up a camera and leave it on to monitor the exact time it does “die”.
3. Do the same for all your batteries and compare how long it lasts.
Terms/Concepts: Batteries; Electricity

55
Objective:Students will discover whether there are any differences in the way men and women remember things.
Materials:
Find a memory test online (like this one or this one) or create your own memory test based on those models.
At least 10 male and 10 female test subjects Timer/watch Pen and paper for notes
Additional Materials
CHART
Average # of Correct Answers Notes
MALE
FEMALE
Terms/Concepts: Memory; Sensory memory; Short term memory; Long term memory; Gender • Brain

56
Problem:
Does hot water boil faster than cold water?
Materials:
2 water kettles (preferably two different colors for color-coding purposes) 2candythermometers Hot and cold water from the faucet Stove Pen and paper for notes An adult (to handle the boiling water)
Procedure
1. Fill each water kettle up ¾ full of water. Make sure each kettle has the same amount of water inside. Take the temperature of the water in each kettle.
2. Ask an adult to help you boil the water on the stove.3. Watch how long each takes to “whistle” and bubble up. Record the temperature after boiling and analyze
your findings.4. Some people also say that hot water will freeze faster than cold water. Test if this is true or false by
simply filling one container with hot water and another with cold. Pop into the freezer and monitor it at regular intervals. If you have a freezer with a clear door, that will be even easier as you won't have to open the freezer to check on it.

57
Objective:In this project, students will investigate the affect of storage temperature on microwave popcorn.
Research Questions:
Does storage temperature affect the amount of microwave popcorn that actually pops? Where is the best location to store microwave popcorn for maximum popping?
Many people place items, such as noodles, popcorn and bread, in the refrigerator or freezer to maintain freshness. However, where is the best location to store your popcorn to reap the most popped kernels?
Materials:
6 identical microwave popcorn bags Microwave Freezer Refrigerator Cupboard Bowls Plastic bags
Experimental Procedure
1. Place 2 microwave popcorn bags in each of the following locations: freezer, refrigerator and cupboard.2. Leave the bags overnight.3. Remove one bag from the freezer and write freezer on the bag.4. Pop the popcorn according to the directions on the bag.5. Remove the bag and allow it to cool.6. Repeat the procedures writing refrigerator on the bag from the refrigerator and cupboard on the bag from
the cupboard.7. Ensure that you are following the same cooking directions for all of the bags.8. Mark each of 3 plastic bags as freezer, refrigerator or cupboard.9. Separate the unpopped kernels from the popcorn and place them in their corresponding plastic bag.10. Count the number of kernels that did not pop from each storage location.11. Record your data.12. Repeat the entire experiment using the other 3 bags of popcorn.13. Compare the number of kernels that did not pop. Were your numbers from the second experiment
comparable to the first? Which location had the most unpopped kernels? Which location had the least kernels that did not pop? What can you conclude about the best storage location for gaining the most popped kernels?
Terms/Concepts: temperature

58
Objective:This project determines who, on average, can jump higher, boys or girls, younger people or older, and how these two factors, gender and age, interact with one another.
Research Questions:
Does gender play an important role in how high a person can jump? Does age play an in important role in how high a person can jump? Does the gender factor change with age?
Most people would probably guess that for physical activities such as running, jumping and sports that boys are more advanced than girls. The purpose of this experiment is to determine whether gender plays a role in physical prowess and, if so, if differences are consistent across age ranges.
Materials:
Long sheets of paper Tape Measuring tape or stick Markers About 10 boys and 10 girls: try to make sure you have equivalent ages and approximate heights in both
male and female categories. (For example: try to find a boy and a girl that are both twelve years old and about the same height.)
Notebook and pencil to record observations
Experimental Procedure
1. Place the paper vertically on a stable wall and secure with tape.2. Mark measurements along the paper according to height in inches or centimeters. Make it go up to about
8 feet from the ground.3. Measure the height of each person, and measure how high they can mark on the paper while standing still.
(Make sure each person holds the marker in the same place on the marker).4. Have each person jump as high as they can, marking the paper at the highest point in their jump (still
holding the marker in the same place). Allow 3 tries each. Record the highest mark for each person.5. Measure the difference between the standing mark and the highest jumping mark. This is the height each
person jumped.6. Create a chart and determine overall whether boys or girls jump higher (use average or mean over all
numbers for each gender). Also determine what effect age has on height of jump.
Terms/Concepts: Differences in physical ability over gender and age differences, using mean and/or averages in determining a conclusion, charting data and results

59
Approximate Time Required to Complete the ProjectTwo weeks
To understand the effects of acid rain on plant growth over the short term and extrapolate the results to better understand the effects of acid rain at larger scales.
2 plant pots Enough potting soil (or garden soil) for each pot One package of plant seeds (Sunflower seeds work well) 2 spray bottles Lemon juice Direct light source Permanent marker
Acid rain occurs when low pH acids pollute our air and are deposited back on earth’s surfaces when it rains, snows, sleets or hails. These gases convert back to acids when they contact water. Acid rain can be a problem when environments lack strong bases to neutralize the acidity.
Research Questions
1. Are your results what you expected? Why do you think this occurred? 2. What implications does your experiment have for the effects of acid rain in your community?3. Given your results, what environments or areas do you think would be particularly vulnerable to the
effects of acid rain?
Terms, Concepts and Questions to Start Background ResearchAcid rain
pH
Sulfur dioxide
Nitrogen oxide
1. Fill each pot with potting soil. Place several seeds in soil – reading the instructions for planting each. (You may want to begin with three pots in case the seeds in one do not take.)
2. With a permanent marker label one pot ‘Acid rain’ and the other pot ‘Normal’.3. Water both pots and place them under a direct source of light.4. Repeat watering every day or every other day (depending on seed type) until each pot has a sprout with
leaves. 5. Measure the height of your plants and record this data as Day 1. (Tip: Take photographs throughout to use
in your presentation and analysis.)6. Fill both spray bottles with water. Select one spray bottle and add lemon juice at a quantity equal to 5
drops of lemon juice per one liter of water. 7. From this point forward, water each plant as usual and then spray each plant with the acid mix or normal
water as labeled. (Be sure to water the plant first and then spray the acid so as not to wash the acid off of the plant.)Follow this by measuring the plant every day.
8. At the end of 14 days you should have sprayed the plants and measured their height every day (or every other day).
9. Examine the growth in each of your treatments.

60
One to two hours to make the paper airplanes and collect the data; one day to prepare the science fair display.
To understand which type of paper airplane flies the farthest.
Directions for making paper airplanes Newspaper, cardstock, computer paper, construction paper, and cardboard Tape Masking tape Measuring tape Calculator
Four forces are at work to make an airplane fly: weight, lift, thrust, and drag. Weight pulls the airplane down. Lift pulls the airplane up. Thrust moves the airplane forward. Drag pulls the airplane back. The same concepts that allow a commercial airplane to fly, cause a paper airplane to fly.
In this investigation, weight, lift, thrust, and drag are considered in an effort to determine which paper airplane flies the farthest.
Termsweight:gravitational force; the force that causes an aircraft to go down
lift: the force that causes an aircraft to lift
thrust: the force that causes an aircraft to move forward
drag: the force that causes an aircraft to pull back
ConceptsWeight, lift, thrust, and drag affect the flight of airplanes as well as paper airplanes.
Research Questions
1. Locate directions for making one types of paper airplane2. Gather the necessary materials.3. Fold the paper airplanes according to the directions with all the paper types4. Determine an indoor location such as a gymnasium or auditorium to fly the planes. Flying the planes
inside will keep the wind from being a factor.5. Use masking tape to mark a starting point on the floor. 6. Throw each plane four times. Measure the distance each plane flew and record the distances. Use a
calculator to add the distances each airplane flew and divide by four to find the average distance.

61
Problem:What fruit rots that fastest?
Materials:
Two apples Two oranges Two peaches Two strawberries Knife Plastic baggies Pen and paper for notes
ProcedureNote: This experiment is best done in the winter, so that no bugs get to the fruit.
1. Cut one of each kind of fruit in half. Put it in a plastic baggie.2. Put each of the other whole fruits in a separate plastic baggie.3. Observe the decomposition progress daily and see which fruit rots first.4. Record your observations in the chart.
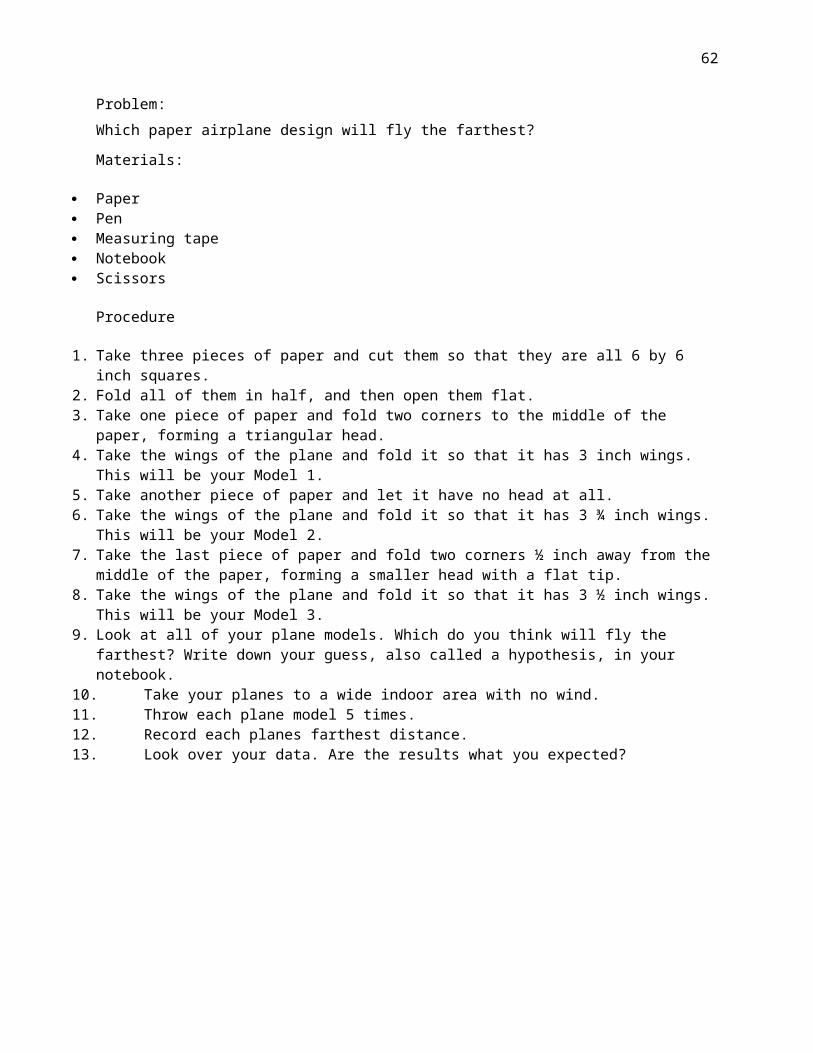
62
To determine if the color of light affects the growth of plants.
This experiment attempts to discover whether the color of the greenhouse material impacts the growth of the seedlings inside.
What colors of light do plants need in order to gather energy from sunlight? Why are greenhouses green? What is full spectrum light? Which colors of filters block ultraviolet light? How to plants convert sunlight into energy? How do plants use chlorophyll?
50 1 foot long pieces of 1x1 wood A hammer Nails Green cellophane Blue cellophane Clear cellophane Yellow cellophane Red cellophane scissors glue or tape Potting soil Planting containers (smaller than 1’ by 1’) Water Marigold seeds
Most of these materials will be easy to find at a hardware store. An adult can help saw the wood into 1 foot long pieces for you to use or the hardware store can do it for you. If your local hardware store doesn’t carry colored cellophane, you can try looking at an arts and crafts store.
1. After gathering all the necessary materials, you will need to construct your miniature greenhouses. Start by separating the foot-long pieces of 1”x1” boards into groups of 10. You will need 10 pieces to construct each greenhouse.
2. Use two nails to attach the wood together at each corner. 3. Once you have built five greenhouse frames, you are ready to add the greenhouse covers. Cut out pieces
of colored cellophane large enough to cover the sides of the greenhouse frames.4. Attach the colored cellophane to the frames using tape or glue, making sure that each greenhouse is
covered in a different color. Do not cover the bottom of the frames. 5. One greenhouse will need to be covered in clear cellophane. This will be your control.6. Fill the potting trays with soil. 7. Plant the seeds according to the package instructions.8. Water the seedlings daily and record results on a growth chart such as the ones below. Monitor the
experiment for at least two weeks.
Terms/Concepts: Chlorophyll; Full spectrum; Natural light; Light filter; Germinate; Greenhouse design

63
Objective:To determine if adding sugar to the water would increase the growth of plants?
Questions for Background Research:
What gives green plants their green color? How do green plants obtain their food? What is photosynthesis? What is chlorophyll? Are all sugars the same? How do plants store sugar? What are some of the methods being used to increase plant growth? What is a control in an experiment? Of what value is a control in this experiment?
Materials:
six geranium plants of approximately the same size sugar water a beaker a graduated cylinder a table spoon a metric ruler paper towels a camera (if you wish to take photos of the procedure and the results). These are all readily available from the local gardener, Home Depot or Wal-Mart’s.
Experimental Procedure
1. Gather all the materials you will need for this project. These include six geranium plants of approximately the same size, sugar, water, a beaker, a graduated cylinder, a tablespoon , a pen, labels, tape, paper towels and a camera (if you wish to take photos of the procedure and of the results).
2. Copy the charts provided on the next page so that you can record the data on a daily basis and summarize your findings at the close of this project.
3. Divide the geranium plants into 2 groups, one will serve as the experimental group and the other will serve as a control group. Label the plants in each group .The experimental group may be #1EXP, #2EXP and #3EXP, the control group may be #1CON, #2CON, and #3CON.
4. Find a location where all of the plants can receive an equal exposure the sunlight. Place the plants there for the duration of the project, the next 14 days. You may wish to start taking photos now.
5. Make up a sugar solution using four tablespoons of granulated sugar to every 32 ounces of water. In watering the plants you will give each plant the same amount of water. You can make the sugar solutions as you need them each day for 14 days. The control group will receive only water; however it will be the same amount of water as the experimental group.
6. Observe all the plants and in your data chart record the height of each plant, the number of leaves and any additional observations that you think are worth noting. Continue this procedure for 14 days.
7. Review all the recorded data and the photos you have taken. What are your conclusions? Write up your report. Make certain to include all of your research, your charts and your bibliography.
8. Has this project given you any new ideas about further project for the coming year? If so, start planning now. Good Luck!
Terms/Concepts: Green plants, photosynthesis, glucose, carbohydrates, starches, energy, hormones, plant respiration.

64
Objective:Determine whether plants will grow if they are watered with various liquids.
The purpose of this experiment is to find out whether plants really need water to grow or whether they just need to be kept wet.
What is the purpose of a plant’s roots? What types of nutrients do plants need in order to survive? Why do plants need water? What happens to a plant that does not get enough water? How do plants create energy?
Plants need sunlight, nutrient rich soil and water to grow. Though the quality of the water has an effect on the plant’s health, there are many plants that are able to grow even when they are given water that is polluted or that has some salt content. Most plants are unable to grow out of water that is as salty as the ocean, though there are a few varieties that can. Water is not always in abundant supply, and when it comes down to making sure that people have enough to drink, sometimes plants are asked to go without. Farmers have turned to using brackish water, or water that has a low salt content, for their crops. Understanding what types of fluids plants can use can help scientists learn more about how to meet the needs of plants as well as people in times of draught.
Seeds (green bean seeds work well because they grow quickly and are hardy.) 5 Containers A marker Potting soil Milk Juice Cola Sports Drink Water A measuring cup
1. Label the containers, “Water/Control,” “Milk,” “Juice,” “Cola,” and “Sports Drink.”2. Fill the containers with potting soil.3. Plant three seeds in each of the pots as directed on the back of the seed package.4. Measure out ½ cup of water and give it to the plants in the “Water/Control” container.5. Measure out ½ cup of milk and give it to the plants in the “Milk” container.6. Measure out ½ cup of juice and give it to the plants in the “Juice” container.7. Measure out ½ cup of cola and give it to the plants in the “Cola” container.8. Measure out ½ cup of sports drink and give it to the plants in the “Sports Drink” container.9. Place the plants in a warm, sunny place outdoors or in a window. 10. Repeat steps 4-8 every other day.11. Record the growth of the plants on a chart such as the one below.
Terms/Concepts: Germinate;Growth; Photosynthesis; Roots; Stems; Leaves; Flowers; Fruit

65
Objective:This project determines which materials will insulate best.
Research Question:
What kind of clothes will keep you warmest this winter?
Materials:
2 glass bottles (identical) Hot water 2 thermometers Plastic wrap Wool socks Cotton socks Pen or pencil Lab notebook
Experimental Procedure
1. Begin by filling both bottles to the top with hot water. The next three steps will have to be done very quickly.
2. Dry off the outside of each bottle, place a thermometer in the opening of each bottle, and seal the top of each bottle with plastic wrap.
3. Cover one bottle with a wool sock. Leave the other bottle bare.4. When the temperature in each bottle stops rising, record the temperature of each bottle in your notebook.5. Record the temperatures of both bottles again in 30 minutes.6. Repeat the steps 1-5, but this time wet the wool sock before you place it over the bottle.7. Repeat steps 1-5 using a dry cotton sock.8. Repeat steps 1-5 using a wet cotton sock.9. Analyze your data. How did the insulating properties of the wool sock compare to the insulating
properties of the cotton sock? How did the insulating properties of dry socks compare to the insulating properties of wet socks? Which sock retained the most heat? Record all of your information in your notebook.
Terms/Concepts: insulating

66
Objective:Discover if a longer paper airplane flies farther than a wide one.
Research Questions:Paper airplanes have long been a classic toy for kids. But paper airplanes can have a serious purpose as well: illustrating basic principles of aerodynamics.
Materials:
Three sheets of paper of the exact same thickness and weight Scissors Ruler Measuring Tape Pen and paper for notes
Experimental ProcedureMaking the Airplanes
1. Take a sheet of letter-size printer paper and fold it in half vertically, lengthwise.2. Run your nail along the fold to create a well-defined, reinforced crease.3. Unfold the piece of paper and fold down the two top corners until it meets the center crease that you made
in the previous steps.4. The top of the paper should now form a split triangle. Now fold the two outer edges of the triangle down
towards the center line once more.5. Your paper should be shaped somewhat like a pyramid at this stage. Valley fold the paper in half so that
the folds are inside the plane.6. Now turn the plane 90 degrees and create the wings by folding the sides down outwards starting from
about 1.5 inches from the base of the plane.7. Okay, now you should have your first paper airplane.8. To make the second airplane, we are going to cut the piece of paper shorter so that you will now have a
8.5 x 8.5in square to fold with.9. Repeat steps 1-6 on this shorter piece of paper.10. To make the third airplane, we are going to narrow the piece of letter-size paper to the dimensions of 6 x
11in. Repeat steps 1-6 after you have cut the paper to the new dimensions.
Flying & Testing the Airplanes
Note: The airplanes should be flown indoors so that wind drag won't factor in and alter the data.
1. Hold the base of the airplane in front of you and in a swift and quick motion, throw it forwards and observe where it lands. Measure the distance from where you are standing (it would be helpful to tape or mark this spot) to where the plane lands. Record the distance in your notebook.
2. Repeat several trials with the different variables of width and length of the planes. The more trials, the better.
3. Record your results. Do you notice any consistent trends?
Terms/Concepts: Basic Physics; Paper airplane design; Aerodynamics; Flight

67
Objective:We are going to find out which type of sponge holds the most water.
Research Questions:What factors determine how much water a sponge will hold?
Sponges are useful for cleaning as it holds moisture. They are porous, which means they have tiny holes in them that allow cleaning fluid or water to be held. This does the cleaning job much more quickly than you bare hands or even a wash cloth.
Materials:Choose sponges of relatively the same size
Natural Sponges
Cellulose Sea Sponge
Artificial Sponges
Polyurethane Polyether (those rainbow packs) Polyester
Water
Large Bowl(s)
Measuring Beaker
Experimental Procedure
1. Take one sponge and press it inside a bowl full of water. Let it drain a little.2. Squeeze the sponge until all of the water comes out in a measuring beaker. Record this measurement.3. Do the same for all the other sponges.4. Evaluate which one held the most water.5. Examine and compare the sponges and try to understand what properties might help one hold more water
than another.
*Note: You may want to repeat this experiment for a few trials to be accurate.*
Terms/Concepts: Sponge; Porosity; Absorbency

68
Soil types and water retention
Abstract
This science fair project was conducted to find out the amount of water retained by different types of soils. The science project was performed using sand, clay and silt soil.
Scientific Terms
Organic material, decaying, nutrients
Materials
The materials required for this science project experiment:- 3 plastic pots- 3 plastic containers- 3 sheets of fine wire mesh, slightly larger than the size of the cover of the plastic container- 600 ml of water- 1 sack of sand- 1 sack of clay- 1 sack of silt soil- 1 weighing machine- 1 measurement cylinder- 1 marker pen
Procedure
1. For this science fair project, the independent variable is the type of soil used. The dependent variable is the amount of water retained in the soil. This is determined by measuring the water drained using the measuring cylinder and also checking the weight of the pot. The constants (control variables) are the amount of water used, the amount of soil used and the time taken for the water to drain from the soil.
2. The 3 pots are labeled A, B and C. The sand is placed inside pot A up to 20mm from the top. Similarly the clay soil and silt soil are placed in pots B and C up to 20mm from the top of the pot.
3. The pots A, B and C are put outside in the hot sun to dry and for the soil to settle down in the pots for 2 days. After the second day, the weight of the pots is measured and recorded in the table below.
4. The pots A, B and C are placed on the wire mesh and plastic collection container as shown in figure 1. Using the measuring cylinder, 200ml of water is poured into each of the pots and they are allowed to drain for 4 hours.
5. After 4 hours, the amount of water in the collection containers is noted using the measuring cylinder and the weight of pots A, B and C are checked and recorded in the table.

69
Are boys better than girls at math
Abstract
This science fair project was done to find out if boys are better than girls at math. The science project experiment involved 17 year old boys and girls.
Scientific Terms
Engineering, physicist, mathematicians, global statistics
Materials
The materials required for this science fair project:- The math exam results of 100 boys and 100 girls age 17 years, from 10 schools- A computer to help analyze the data- A survey form- Permission from the school administration to obtain and use the data
Procedure
1. For this science fair project, the independent variable is the gender of the persons who sat for the math exam. The dependent variable is their performance. This is determined by totaling the results of a hundred boys and a hundred girls respectively, from each school, and dividing by these totals by 100, to obtain the average results for both boys and girls in each school. The constants (control variables) are the age of the students and the level of difficulty of the math paper.
2. Ten secondary co-ed schools are randomly selected to take part in this survey. The co-ed schools are selected because they have both boys and girls being instructed by the same teachers and sitting for the same math exam paper.
3. Letters are delivered to the 10 selected schools to obtain their permission from their principals to have access to the math exam result of their students. It is important that you obtain sample results from different schools, in order to properly test your hypothesis.
4. Once the permission is obtained, visit the schools to gather the test result data.
5. From the information gathered, the average results for each school is calculated as follows:
Average math results for boys = (Sum of results for 100 boys)/100
Average math results for girls = (Sum of results for 100 girls)/100
6. The average math results for the boys and girls are calculated for each school and recorded in the table given below.

70
The Effect of Different Brands of Cooking Spray on How Much Food Sticks to Cookware
I. STATEMENT OF PURPOSE AND HYPOTHESISI wanted to find out how much food would stick to cookware using different brands of cooking spray. My hypothesis stated that name brand cooking spray would work the best, supermarket brands would be a close comparison, and that any amount of spray would work better than none at all.
II. METHODOLOGY:The materials required for my investigation are a chocolate cookie recipe, all ingredients needed to make dough, utensils, 4 cookie sheets, 1 can of Pam, Crisco, and Stop & Shop cooking sprays.
I started collecting data by spraying 3 of the 4 cookie sheets with different sprays.
I sprayed each sheet 4 times it's width, being careful to get the whole surface covered with spray.
I marked all the sheets according to the spray it was sprayed with.
I dropped the cookie dough on the sheets, all the same width apart.
I put the cookies in the oven at the designated temperature, and took them out when indicated in the recipe.
I recorded mydata

71
Abstract
How do batteries in exploratory equipment fair in extreme temperature conditions in outer space, or at the North Pole? This science fair project was conducted to study how extreme temperatures affect the performance of batteries. The experiment was done using Duracell, Energizer and Eveready AA-size batteries.
Scientific Terms
Chemical energy, electrical energy, anode, cathode, electrolyte
Materials
The materials required for this science fair project:
- 3 Energizer AA size batteries- 3 Duracell AA size batteries- 3 Eveready AA size batteries- 6 plastic bags- 6 rubber bands- Battery holder- 2 jumper wires with crocodile clips- 1 AA battery- operated table fan- 2 beakers- 1 kg of dry ice- 1 kg of ice cubes- Safety goggles- 1 pair of thick waterproof gloves to be used to handle the dry ice- A clock to time the duration of the fan’s operation
Procedure
1. For this science fair project, the independent variables are the type of the battery and the temperature conditions. The dependent variable is the time taken for the battery to run out of power while turning the fan motor. This is determined by keeping time with the clock. The constants (control variables) are the power of the fan motor, the size of the batteries and room humidity.
2. The performance of the batteries will be tested at the following temperatures: -78°C using dry ice, 0°C using ice cubes and 24°C at room temperature.
3. For the 1st test, an Energizer battery is placed in the battery holder, and 2 jumper wires with crocodile clips are connected to the holder. The battery and the holder are placed in a plastic bag with the other end of the jumper wires sticking out of the bag. The plastic bag is tied with the rubber band.
4. The plastic bag with the battery is placed in a beaker. Wear the gloves and transfer the dry ice to the beaker. Remember not to let the dry ice come into contact with your bare skin. Wear safety goggles at all times. Allow about 15 minutes for the temperature of the battery to stabilize in the beaker. The fan is then connected to the 2 wires sticking out of the plastic bag. Once the fan turns, the clock is started. With the help of an assistant, the time taken for the battery to drain and the fan to stop is recorded in the table given below.
5. Procedures 3 and 4 are repeated using the Duracell and Eveready batteries.
6. Procedures 3, 4 and 5 are repeated by using ice cubes instead of dry ice.
7. Procedures 3, 4 and 5 are repeated at room temperature without any cooling needed.

72
AbstractHow does a parachute work? Do bigger parachutes work better than smaller parachutes? Find out in this science project if the size of the parachute matters. ObjectiveTest different sized parachutes to see how changes in the size of the parachute affect flight.Materials and Equipment
garbage bags ruler Scissors
Light weight string Washers (4) twist ties (4)
pennies (8) tape Stopwatch
Experimental Procedure1. Each parachute will be made out of the garbage bag material, so first cut open the garbage bags to
make a flat sheet of plastic.2. You will make a series of four parachutes of different sizes, from large to small. Each parachute
will be square in shape, so the four sides will each be of the same length. 3. Cut out each of the four differently sized parachutes from the garbage bag material. 4. For each parachute, tie a knot in each of its four corners.
a. The knots will be used to anchor your string.5. Cut 16 pieces of string, making each be 40 cm long.
a. Each parachute will need four pieces of string.6. For each parachute, tie one end of each piece of string around one of the four knots, positioning
the string right above the knot.7. For each parachute, hold the center of the plastic sheet in one hand and pull all strings with the
other to collect them. Tie the free end of the strings together with an overhand knot. 8. Attach 1 washer to each bundle of strings with a twist tie. Alternatively, if you are using pennies
and tape instead, tape 2 pennies to each bundle of string. a. Be sure that each parachute has the same number of washers or pennies attached, or this
will alter your results!9. In your lab notebook, make a data table that looks like Table 2 below.
a. You will be recording your results in this data table.10. Bring a stopwatch, the parachutes, and your lab notebook to a safe, high surface for your tests,
about 2 meters from the ground. a. A good place for your test might be a secure balcony, deck or playground platform.
11. Using your stopwatch, time how long it takes in seconds for each parachute to fall to the ground. Be sure to release the parachute from the same height each time. You may want to have a helper help time the parachutes when you release them.
a. If the parachute does not open during a trial, just do that trial over so that when you are finished you have three trials which all worked.
b. Test each parachute three times. Each time record your results in the data table in your lab notebook.
12. Now make a graph of your data. Make a line graph of time vs. surface area. "Time (in seconds)" should be on the y axis (the vertical axis), and "Surface area (in square cm)" should be on the x-axis (the horizontal axis).
a. You can make a graph by hand or use a website like Create a Graph to make a graph on the computer and print it.
13. After you connect the dots on your graph, your line may slope up or down. What does this tell you about the relationship between the surface area of the parachute and how long it takes the parachute to reach the ground? Which parachute was the most effective one? How do you think this is related to air resistance, or drag force?

73
4 to 6 books (enough to make 2 stacks the same height)
A package of notecards 300 to 400 pennies (loose or in
rolls) Scissors
Make 2 stacks of books with a gap of about 4 inches between them. Make sure the stacks are the same height.
Lay one file card over the gap between the books. About 1/2 inch of the card should be resting on a book at each end. How many pennies do you think you can pile on this flat bridge before it falls into the gap-5? 10? 100? Try it and see how close your guess was.
Without adding anything to the file card, try to make your bridge stronger. How could you change a file card to make it stiffer? What happens if you fold the card in half? If you make an arch? How about if you fold the card into pleats?
Make a bridge, then test it to see how many pennies it will hold. Some of your bridges may hold a few pennies before falling down. Others may be stronger, but the pennies may slide right off. And some bridges will probably hold a lot more pennies than you'd think.

74
The objective: My objective was to determine which parachute made from a common household material would have the slowest drop speed.
Materials
5 different household materials 20 Pieces of string all cut the same size 5 washers
Procedure
1. Choose five different materials to use as parachutes.2. Cut out a large square from each material.3. Each parachute should be made of identical size and shape. 4. Tie a string to each of the four corners.5. Tie the other end of all four strings around the washer.6. Find a high place to drop the parachutes.7. Repeat the drops 3 to 5 times each. 8. Time the drop from when it was released to when it hit the
ground. 9. Record each drop in your chart.10. Take the average of the drop times.
o Add the times together (remember there is only 60 seconds in a minute)
o Divide by how many trials you did.11. Record your average times in your chart.

75
ObjectiveThe goal of this experiment is to determine whether varying certain factors, such as water location and light location, will cause plants to grow in a different direction than other plants that are grown through more conventional methods.
ConceptThe idea behind this experiment is to determine whether plants are affected by both the location of their water and the location of their light source. You can choose just one of these things to test, or test both factors, so we will go ahead and describe ways of setting up both types of test.
Materials
Lots of seeds of the same (fast-growing) plant. We recommend about 40 so that you can try and grow 20 plants.
20 plant pots or holders of some sort. Make sure they are roughly the same type of container, as you do not want to introduce other variables into your experiment.
Potting soil to fill your plant containers. Water for keeping the plants alive. A ruler and a protractor, to measure the status of your plants' growths and to record the angle at which
they are growing. Lights to allow the plants to perform photosynthesis. Record turntable or some other surface that can spin on its own.
Procedure
1. Dump some soil in each of the pots and plant 2 seeds per pot (to make sure they grow)2. Put all the pots together in a room under a light and water them for 2 weeks to allow them to germinate
and start living3. Number the pots and measure the size of the plants.4. Place pots 1-5 in a row and put the lights to the side of the plants rather than above it.5. Place pots 6-10 on the turntable and start it turning (slowly). Try to make sure that the plants are all the
same distance from the center. The light should be placed above the center of the turntable.6. Place pots 11-15 in a row and put the lights above the row of plants. This group should only receive water
into the right half of the pot. The water should be poured in along the edge and you must be careful to always pour on the right side. (Note: It doesn't matter which side you pour into as long as you are consistent among this group and over the course of the experiment, making sure to always water the same side.)
7. Pots 16-20 will be kept as a control group which will receive light from above, water in the middle of the pot, and no turntable effect.
8. Continue watering your plants as explained and once a day measure the size of the plant, and also the angle from vertical at which the main stalk of the plant is growing. You may also want to count the number of leaves as that is indicative of how well the plant is growing.

76
PurposeTo investigate the link between the sensations of taste and smell.
BackgroundRead up on how we perceive taste.There is a lot of complicated information in these websites. Focus your attention on the pathways of taste and smell leading up to the sensations. While the specific details of the receptors is not relevant, pay attention to what happens from the point the chemicals (food or odor) come in contact with the receptors to sensation in the brain. Did you notice that both taste and smell are forms of chemoreception? Understand what chemoreception is.Are the nerves going to the brain for taste from the tongue the same as those used for olfaction (smell)? Keep this answer in mind for understanding the findings. Also investigate the difference between flavor and taste. Wikipedia is the place to start.
Materials 5 to 10 different kinds of food handkerchief or some kind of blindfold water cup
Procedure1. Obtain some common simple foods.
a. For example, an apple, onion, carrot, banana, etc. 2. On a paper write down the foods you have obtained and cut them into pieces for eating. 3. Get a group of testers.4. Tie a cloth around people’s eyes. 5. Feed the testers and have them guess what food it is. 6. Continue for all the types of foods.7. Make sure you mark each time they are correct or incorrect.8. Have them drink some water and rinse their mouth thoroughly each time. 9. For the second time, have the tester pinch their noses with their eyes still covered.10. Feed the testers and have them guess what food it is. 11. Continue for all the types of foods.12. Make sure you mark each time they are correct or incorrect.13. Have them drink some water and rinse their mouth thoroughly each time.

77
QuestionDoes the brand of diapers effect how much water they can hold?
Researchabsorption and disposable diapers
Materials Huggie diaper Luv diaper Cloth diaper other diaper brands (if you want) 1 measuring cup water a big bowl 1 person to help you 1 notebook 1 pen or pencil to record your results
Procedures1. get one diaper and put it in the bowl.2. fill the measuring cup with 4 cups of water.3. pour the water in the bowl on top of the diaper.4. submerge the diaper in the bowl for 30 seconds.5. take the diaper out and let it drip-dry.6. take a measurement of how much water is left in the bowl.7. record your results 8. repeat steps 1-7 with the other diapers

78
PurposeTo demonstrate the devastating effects of soil erosion and its impact to the world's agriculture.
Additional informationErosion is the wearing away of soil and rock, and the down-slope movement of soil and rock. Some factors that influence erosion include gravity, glaciers, water, wind, ice, and waves.
During the process of erosion, chemicals from farming which are contained in the soil, are washed into our waterways, causing pollution. Soil erosion is a worldwide environmental problem with up to 80% of the world's agricultural soils affected. It takes a long time for soil to form from the breaking down of rocks and organic matter. Without soil plants can't grow. Soil must be protected from erosion to preserve our futures.
Required materials
3 aluminum pans water 3 identical buckets of sand (about 2 or 3 cups) Styrofoam cup Pen or pencil Journal (to record results) Tissue
Step-By-Step Procedure
Lay your three pans about 6 inches apart. Pour one bucket of sand into the middle of each pan. Shape two piles of sand into small mountains in the center of the pans. Smooth the third pile of sand so that it covers the whole area of the pan. Cover one of the mountains with a tissue. The tissue will represent the plants and brush that would grow on your mountain. Make a small hole in the bottom of your Styrofoam cup. Place your finger over the hole and fill the cup with water. Hold the cup approximately 12 inches above the center of your smooth pan. Move your finger so that the water trickles out through the hole of the cup. When the cup has emptied, set it aside and record the results of what happened to the sand. Repeat the same procedure with the rest of the pans

79
AbstractThis science fair project was performed to compare the amount of stains left on our teeth by the beverages we drink.
BackgroundTeeth staining
The natural color of our teeth is light grey or light yellow. Teeth whitening solutions can help our teeth become whiter. However, some of the food and beverages we consume daily can stain and discolor our teeth.
There are two types of teeth stains, namely intrinsic stain or extrinsic stain. Intrinsic stains are caused by age, malnutrition, infections or genetic reasons. Extrinsic stains are more manageable. They are caused by the food and beverages that we consume. These stains are merely cosmetic and can be removed by proper dental care.
The staining of our teeth due to plaque can be easily removed by regular brushing, flossing and visiting the dentist. Food that leaves stains on our teeth includes berries, soy sauce, chili sauce and curries. Beverages that leave stains are coffee, tea or coke. These stains can also be easily removed by brushing our teeth. Scientific TermsTeeth whitening, intrinsic stains, extrinsic stains, malnutrition
Materials 5 eggs 5 cups 5 different liquids 1 toothbrush 1 tube of toothpaste 1 sheet of paper 1 black marker 1 stopwatch
Procedure1. Fill 5 cups with the five liquids. 2. Drop an egg into each cup and set aside for 20 minutes. 3. Then, remove the eggs, wipe dry, and place on a sheet of paper to dry. 4. Label each egg for the beverage it was placed in.
Compare the discoloration and staining on each egg.5. Rank the eggs according the degree of staining from worst stained to least stained.6. Record the results 7. Brush the 5 eggs with the toothbrush and toothpaste for 30 seconds.8. Rank the eggs according the degree of staining from worst stained to least stained.9. Record the results

80
PurposeTo examine what happens to various liquids when they've been left in the sun for extended periods of time.
Additional informationIf you've ever left boiling water on the stove for too long, you're sure to have noticed that you have less water in the pot then when you started. What happens to the water? Evaporation!
Evaporation is the slow process of vaporization of liquid. When the molecules in their liquid state are heated, they become gaseous. The rate of evaporation is dependant upon temperature, humidity, and wind speed. The higher the temperature is the quicker the rate of evaporation. In areas of low humidity, evaporation occurs at a more rapid pace. Finally, the higher the speed of wind the quick the evaporation process will be.
Required materials
4 bowls of equal size 4 different liquids Plastic ruler Windowsill or a spot that gets lots of sun Pen or pencil Journal to record results
Estimated Experiment Time Several days
Step-By-Step Procedure
1. Pour the same amount of each liquid into separate bowls (about one cup).
2. Place all four bowls in a sunny spot. This can be on a windowsill where a lot of natural sunshine comes in or a spot outside that receives a lot of sun. Place the ruler in the bowls and note the depth. Write the measurements in your journal.
3. After about two hours check the depth of each bowl again. Write the measurements in your journal.
4. Measure the depth of the liquids every three hours, writing the measurements down in your journal each time. You'll notice that the liquids will be evaporating with each measurement.
5. After a few days what is left in the bowls? Write the results in your journal.

81
AbstractThis experiment was performed to ascertain the factors that increase the rate of evaporation of water. The factors under examination for this experiment were the surface area of the body of water, air temperature and air pressure.
Scientific TermsEvaporation, vapor, molecules, liquid, gas
MaterialsThe materials required for this experiment:
water measuring cup 1 fan
Procedure1. Put one bowl and one plate near a sunny spot in the house.2. Put the other bowl and plate away from the sun.3. Plug in the fan next to the non-sunny plate and bowl.4. Put 1 cup of water in each of the bowls and plates.5. Turn on the fan.6. Check the plates and bowls to see how much has evaporated.7. After a few hours, pour the contents into the measuring cup.8. Record the results of how much is left.

82
AbstractThis experiment was done to find out if leaving baby food out of the refrigerator after it has been opened will result in bacterial contamination.
Scientific TermsMicrobes, bacteria, Escherichia coli, petri dish
MaterialsThe materials required for this experiment:
9 petri dishes prepared with nutrient agar 3 bottles of chicken baby food 3 bottles of pumpkin baby food 3 bottles of apple baby food A refrigerator 9 sterile cotton buds 1 permanent marker pen
Procedure1. The petri dish prepared with the agar must be stored in a refrigerator. Before the start of the
experiment, remove the petri dish from the refrigerator to allow it to normalize at room temperature.
2. The 3 bottles from each type of baby food are labeled A, B and C- Chicken A- Chicken B- Chicken C- Pumpkin A- Pumpkin B- Pumpkin C- Apple A- Apple B- Apple C
3. The 3 types of bottles marked A are opened briefly, then covered/closed. Following this, the bottles are immediately stored in the refrigerator for 24 hours.
4. The 3 bottles marked B are opened and kept out of the refrigerator for 30 minutes before replacing the cap. Following this, the bottles are immediately stored in the refrigerator for 24 hours.
5. The 3 bottles marked C are opened and kept out of the refrigerator for 30 minutes before replacing the cap and it is then left out of the refrigerator for another 24 hours.
6. After the 24 hour incubation period, mark the Petri dishes according to the list provided in step 3.
7. Remove the petri dish lids and using sterile cotton buds, take a small swab sample from each bottle (from at least 3 different spots within the bottle) and place it in the center of the relevant Petri dish (i.e. chicken sample from bottle A will be placed in petri dish marked Chicken A). A new cotton bud must be used to collect the swab from each bottle.
8. Replace the petri dish lid and store the Petri dishes in a cool, shaded place.9. The diameter of the bacteria colony is measured after 3 days and recorded in the below table.

83
Abstract
This experiment was performed to find out how different colors affect the blood pressure of a person.
Scientific Terms
Psychology, blood pressure
Materials
1 computer male and female participants of the same age clock
Procedure
1. The computer is programmed to show screens of blue, red, black, white, green and yellow.
You can set this up by using software such as Microsoft Powerpoint.2. The participants are brought into the room and allowed to relax. 3. Take their pulse for 30 seconds.4. Record their starting pulse.5. The 1st participant is seated in a comfortable chair in front of the computer
monitor. 6. The computer screen is set to blue color. 7. The participant is asked to stare at the monitor screen for 3 minutes. 8. After 3 minutes, the participant pulse is measured.9. The 1st participant is allowed to rest for 15 minutes before color 2 is done.10.Repeat for all the colors.11.Make sure all of the pulse measurements are recorded.12.Repeat for all the participants.

84
3 different lip balm brands 3 volunteers Notebook timer
1. Do an observation of how the volunteers lips look at the start.2. Give each volunteer an different lip balm brand.3. Have the volunteers put on their lip balm.4. After 2 hours, do another observation of their lips.5. Have them reapply.6. Continue observing and reapplying for five days.7. Record your observations each time you check.

85
Have you ever noticed that sometimes your heart beats faster than it does at other times? Why is that?Is an athletic person’s heartrate slower than a person who plays video games?Here is what you need:
Volunteers (equal number of athletes to video gamers) Pen and paper Stop watch, timer with seconds, or a clock with a second hand
1. Write down all your volunteers on a piece of paper.2. Label which are athletes, and which are video gamers.3. Sit your first volunteer in a chair. 4. Put your hand on their wrist to take their pulse for 30 seconds.5. Record that number.6. Have the volunteer run in place for 1 minute without stopping.7. After the minute, have them sit down8. Take their pulse again.9. Record that number10. Redo the experiment with the rest of the volunteers.

86
Three similar cups Water Freezer Pot Stove Scale
1. Fill three similar cups with the same amount of water.2. Put one cup on the scale and record the weight.3. Put one cup in the freezer until it is frozen solid.4. When frozen, put the cup on the scale and record the weight.5. Dump another cup in the pot and put it on the stove to boil6. When the water boils, carefully dump the water into the cup.7. Put the cup on the scale and record the weight.

87
pots or planting trays organic soil non-organic soil yard soil seeds light source (sunlight or artificial lighting) water ruler
1. Set the pots out in a spot where they will all get the same light.
2. Fill one pot with organic soil, one with non-organic, and the last with yard soil.
3. Label each pot.4. Make four small holes in the soil of each pot.5. Drop in three or four seeds in each hole.6. Cover the seeds completely.7. Water the seeds each day with the same amount of water.8. When the seeds start to grow, measure the seeds height
each time you observe.

88
WHAT WILL FREEZE FIRST Kool-aid Coke Salt Water Cups Freezer
1. Gather your materials. 2. Fill each cup with the same amount of Kool-aid, coke and
the other two with water.3. Label each cup.4. For the cup with the strong salt water, mix four tablespoons
of salt in the cup of water.5. For the cup with the weak salt water, mix one tablespoon of
salt in the cup of water.6. Put all the cups in the freezer in a safe spot.7. After 1 hour, open the freezer and check your cups.
a) Record what you observe in your notebook8. Keep checking on the cups until one of them freezes
completely.9. Make sure to record what you see each time you check.

89
What you need
Dishwashing detergent
Food coloring
Dish Cup Lid 5 different objects to put in the water (need two of each item)
What to do
1. Fill two cups with the same amount of water.2. Label the cups, cup A and cup B.3. Put a teaspoon of detergent in cup B.4. Record what you observe in the two cups.5. Cover the cups with a lid and shake each cup 5 times.6. Record what you observe in the two cups.7. Drop in 5 objects and record whether they sink or float.8. Record what you observe in the two cups.9. Drop 5 drops of food coloring in each cup.10.Record what you observe in the two cup.11.Stir the cups so the color mixes.12.Record what you observe in the two cups.

90
Different deodorant brands
Different fabric squares, enough for each brand of deodorant
Washing machine
Dryer
Laundry detergent
Notebook
1. First, separate each of the deodorant brands.
2. Put one piece of each fabric in front of each deodorant stick.
3. Label each deodorant stick with a number.
4. Label each of the fabric pieces with the deodorant’s number.
5. Rub enough of each deodorant on the fabric pieces with the same number.
6. Record your observations.
7. Once all the fabric has deodorant on it, put them in the washing machine.
8. Add enough Laundry detergent.
9. Turn on the washing machine and do one cycle.
10. Put the fabric in the dryer for one cycle.
11. Take out the fabric pieces and record your observations.

91
ObjectiveThe goal of this project is to determine the fastest method to cool a can of soda starting at room temperature.
Materials and Equipment To do this experiment you will need the following materials and equipment: 12 cans of soda at room temperature Instant-read digital thermometer Two styrofoam coolers Ice cubes Water Clock or timer Plastic wrap
Experimental Procedure1. Prepare an ice-only bath by adding enough ice to a styrofoam cooler to completely cover three
cans of soda.2. Prepare an ice-water bath by adding the same amount of ice to a second styrofoam cooler, then
covering the ice with water.3. Use the instant read thermometer to measure the starting temperatures of:
a. the freezer compartment,b. the refrigerator,c. the ice-only bath,d. the ice-water bath, ande. each room-temperature can of soda.
4. In each case, make sure that the temperature has stabilized before recording the result. For example, it may take a minute or two before the ice-water temperature reaches equilibrium when the water is first added to the ice.
5. Place three cans of soda in each of the cooling devices to be tested, i.e.:a. The freezer compartmentsb. The refrigeratorc. The ice-only bathd. The ice-water bath
6. Note the starting time for each cooling device.7. At regular intervals (e.g., every 5 minutes), quickly remove each set of cans from their cooling
device and measure the temperature of the soda. Note the time and temperature reading, then quickly put the cans back in the cooling device. Tips:
a. Minimize the amount of time that the refrigerator and freezer doors are open.8. It is a good idea to periodically re-check the temperatures of the cooling devices.9. The experiment is complete when the temperature reading of the soda stabilizes.10. For each cooling device, calculate the average temperature of the three soda cans for each time
point.

92
Marbles Clay Aluminum foil Plastic bottle Bucket Water
1. Get out modeling clay and use it to make a boat.2. Get out a small piece of wood.3. Get out aluminum foil and use it to make a boat.4. Fill a bucket with water and place it on the floor.5. Put your modeling clay boat in the bucket and see if it floats.6. After you see it floats, continue to put marbles in until the boat sinks.7. Count the marbles when the boat sinks.8. Record the number in your table.9. Put your clay boat out to dry.10.Repeat the experiment with your other two boats.11.After the boats are all dry, redo the experiment for a second time.12.Record your results.
93
Question: Why Do Apples Turn Brown?
Materials Honey (1 teaspoon honey mixed with 1 cup water) Lemon juice (1 teaspoon juice mixed with 1 cup water) Salt (1/2 teaspoon salt mixed with 1 cup water) Vitamin C (1 tablet crushed and dissolved in 1 cup of water) Lemon lime soda Carbonated water (bubble water) Tap water 8 Bowls Sticky Notes Spoon Apple Corer
Procedures
1. First set out 8 bowls big enough to cover the slice completely with the solution. 2. Label each bowl with the sticky notes.3. Make each of the solutions in a separate cup.4. Cut one apple into 8 slices of approximately the same size with the apple corer.5. Place an apple slice into each bowl. 6. Immediately cover with each solution, one per bowl.
a) Honey Water in one bowlb) Lemon Juice in one bowlc) Salt Water in one bowld) Vitamin C Water in one bowle) Lemon/Lime Soda in one bowlf) Carbonated Water in one bowlg) Tap Water in one bowlh) No liquid in the last bowl
7. Use your notebook to observe what you see in the bowls each day.

94
Question: What makes ice melt faster?
Materials
Ice Cubes Salt Sugar Bowls Timer
Procedure
1. Put the three bowls on the counter.2. Place one ice cube inside each bowl.3. The first bowl will have nothing else in it.4. The second bowl will have ¼ cup of salt poured on
top.5. The third bowl will have ¼ cup of sugar poured on
top.6. Start the timer.7. Observe how long each takes to melt completely.8. Repeat this experiment 3 times to see if it the same
each time.

95
QuestionWhat brand of bubble gum makes the biggest bubbles?
Materials:Various brands of bubble gumDubble BubbleBubbliciousBubble YumBazookaBig League ChewRulerPaper ClipTimerTest Subjects
Procedures:1. Start with one brand of gum.2. Each person chews that same brand of gum for 5 minutes.3. Begin blowing bubbles.4. Each person should blow 5 bubbles with one piece of gum.5. Measure each bubble using the ruler and paperclip. This will
give you the bubble diameter in centimeters.6. Write down the diameter of each bubble7. Repeat steps 1-6 for each brand of gum.8. After collecting all your data to find your average.
1. You find it by adding your data for that brand. 2. Then divide by 5.

96
Question What soda shoots the highest? Title The amazing world of Mentos and Soda.
Materials A bottle of coke A bottle of sprite A bottle of diet Mentos mints A yardstick A toothpick Cardstock Paper
Procedures1. Put one soda bottle brand in an open area outside.2. Tape the yardstick to the bottle.3. Open the bottle of soda.4. Roll the cardstock paper so it fits over the bottle top.5. Tape the cardstock so it does not unroll.6. Put the cardstock tube over the top of the open bottle.7. Push the toothpick into the cardstock tube near the bottom.
a. This will keep the Mentos from falling in too early.8. Stack the Mentos inside the tube.
a. Use the same amount for each bottle9. Pull the toothpick out and stand back.10. Use the yardstick to determine how high the fountain
went.11. Record your observations.12. Repeat with the remaining bottles.

97
The Race is On
What you need
Two identical jars
Food coloring
Hot water
Cold water
Procedure
1. Fill one jar with hot water.
2. Fill the other jar with cold water
3. Put in four drops of food coloring in both jars
4. Don’t move the jars but observe which one changes the
fastest

98
Less and Less and Less
What you need
Two identical jars
Water
One jar lid
Procedure
1. Fill the jars with the same amount of water
2. Put lid on one of the jars
3. Put the jars near the sunlight.
4. Observe over a few days.

99
Boiling Point
What you need
Two pots
thermometers
water
salt
Procedure
1. Fill the pots with the same amount of water.
2. Put two tablespoons of salt in one pot.
3. Stir to dissolve the salt.
4. Put both pots on the stove.
5. Turn the stove on high.
6. Observe
a. Which one boils first?
b. What is the temperature when they begin to boil?

100
Strongest Shapes
What you need
Books
Index Cards
Tapes
Procedure
1. Fold index cards into a triangular prism, cube, rectangular
prism, and cylinder.
2. Secure the two ends with tape to hold its shape.
3. Stand the shape up and stack books on top until the shape
crumbles.
4. Record the number of books.
5. Repeat step 3 and 4 for all shapes.

101
All Thumbs
What you need
Velcro Pair of jeans with a button Shoes Pencil Paper Coins hairbrush
Procedure
1. Find a volunteer.2. Have them do these tasks normally:
a. Button a pair of jeansb. Tie a pair of shoesc. Write their name on paperd. Pick up different coinse. Brush their hair.
3. Record how they do.4. Use the Velcro, or tape, to secure their thumb to their
hand.a. They won’t be able to use it anymore.
5. Have them do the tasks again.6. Record how they do.7. Repeat with other volunteers.

102
Nothing to Sneeze at
What you need
Pump Balloon Confetti Paper Pin Chalk Tape measure Cardboard
Procedure
1. Make three circles around a piece of paper with chalk.a. 1-foot diameterb. 3-foot diameterc. 5-foot diameter
2. Place confetti inside the balloon while not blown up.3. Blow up the balloon and tie off the end.4. Stand on the paper in the middle of the circles with the
balloon.5. Using the pin, pop the balloon.6. Record how much confetti you found in each of the circles.7. Clean the area and repeat the experiment, but this time,
hold the cardboard piece in front of the balloon when you pop it.
8. Record how much confetti you found in each of the circles.