Procedure for determination of characteristic values of...
46
Prof. Dipl.-Holzwirtin K. Frühwald Procedure for determination of characteristic values of hardwood Oslo, May 20 th 2008 Prof. Dipl.-Holzwirtin Katja Frühwald University of Applied Sciences Ostwestfalen-Lippe (formerly University of Applied Sciences Lippe & Höxter) Dept. of Production Engineering and Economics Laboratory for Timber Engineering: Products and Production
Transcript of Procedure for determination of characteristic values of...

Prof. Dipl.-Holzwirtin K. Frühwald
Procedure for determination of characteristic values
of hardwood
Oslo, May 20th 2008
Prof. Dipl.-Holzwirtin Katja Frühwald
University of Applied Sciences Ostwestfalen-Lippe(formerly University of Applied Sciences Lippe & Höxter)Dept. of Production Engineering and Economics Laboratory for Timber Engineering: Products and Production
Prof. Dipl.-Holzwirtin K. Frühwald
1
Situation in Central Europe / Germany
- Increasing amount of hardwoods (mainly beech) in the future
- Use of medium and low quality lumber (especially coloured heartwood) for construction purposes (since industrialisation only softwoods are used)
→ Finger-jointed solid structural timber, bi-lam, tri-lam and glue-laminated timber made of hardwoods are suitable
→ Strength grading system is a prerequisite
Introduction
Prof. Dipl.-Holzwirtin K. Frühwald
2
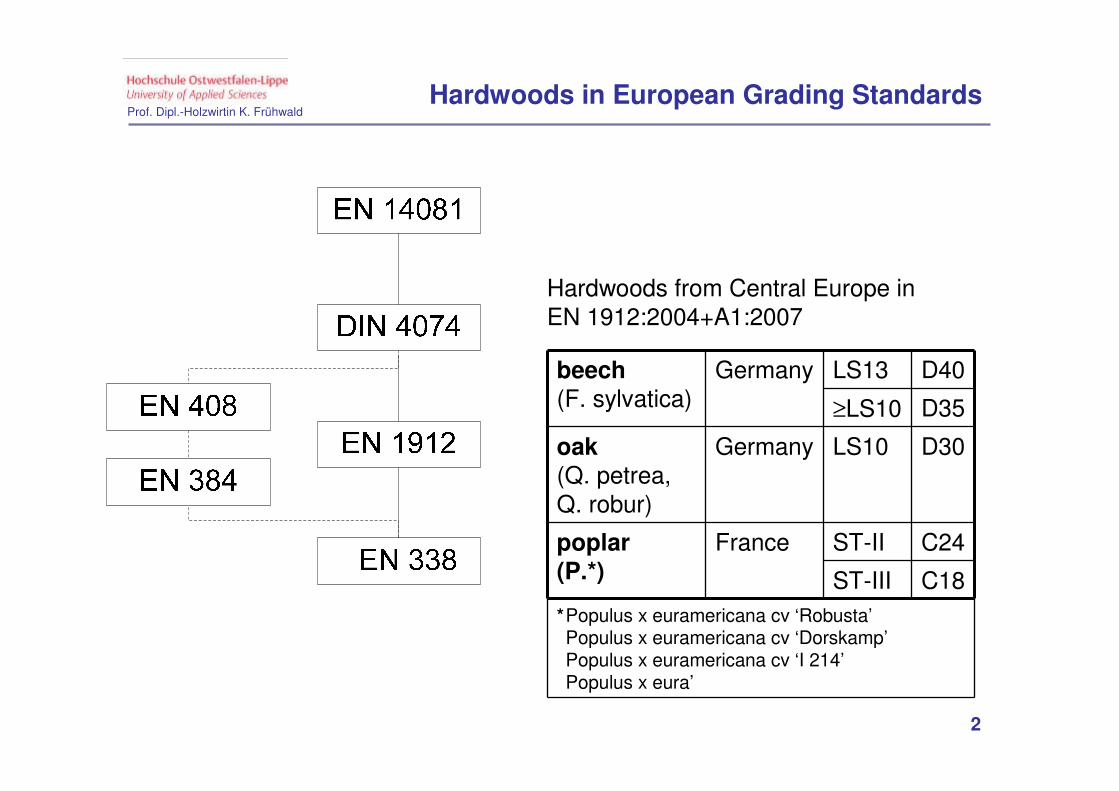
Hardwoods in European Grading Standards
Hardwoods from Central Europe in EN 1912:2004+A1:2007
beech (F. sylvatica)
Germany LS13 D40
≥LS10 D35
oak(Q. petrea, Q. robur)
Germany LS10 D30
poplar(P.*)
France ST-II C24
ST-III C18*Populus x euramericana cv ‘Robusta’Populus x euramericana cv ‘Dorskamp’Populus x euramericana cv ‘I 214’Populus x eura’
Prof. Dipl.-Holzwirtin K. Frühwald
3
Strength Grading of Hardwood
Strength Grading of Hardwood
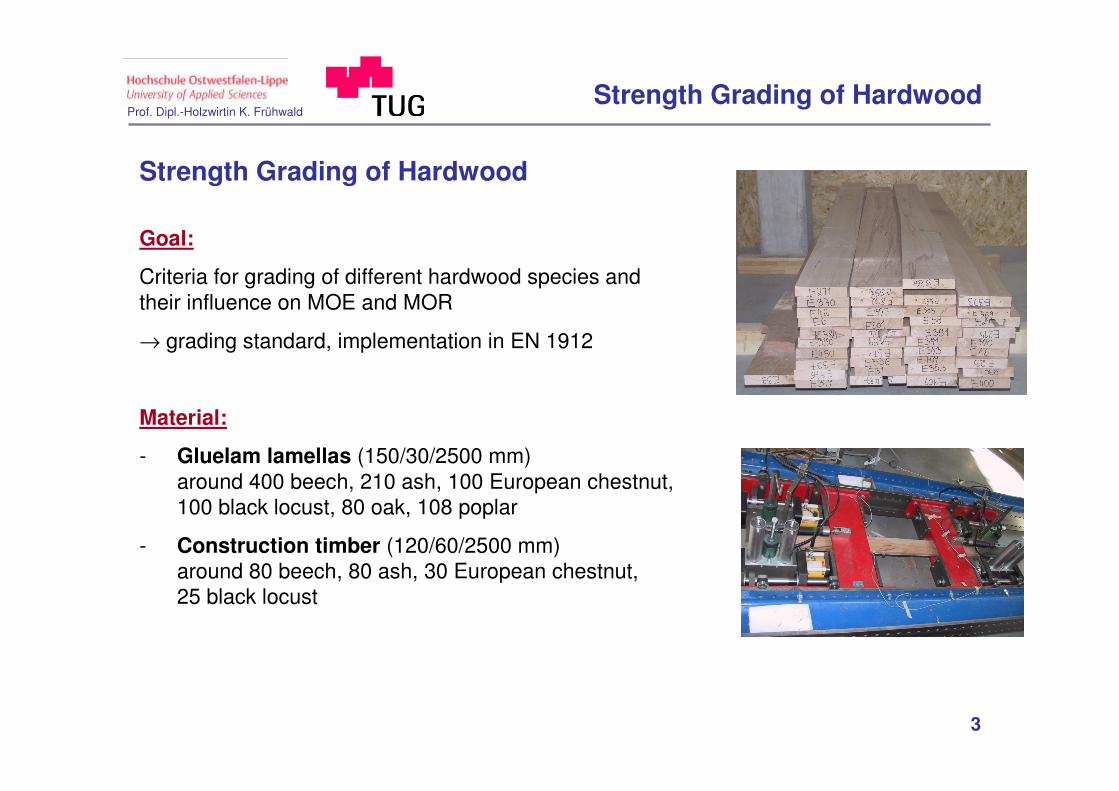
Goal:
Criteria for grading of different hardwood species and their influence on MOE and MOR
→ grading standard, implementation in EN 1912
Material:
- Gluelam lamellas (150/30/2500 mm)around 400 beech, 210 ash, 100 European chestnut, 100 black locust, 80 oak, 108 poplar
- Construction timber (120/60/2500 mm)around 80 beech, 80 ash, 30 European chestnut, 25 black locust
Prof. Dipl.-Holzwirtin K. Frühwald
4
Strength Grading of Hardwood
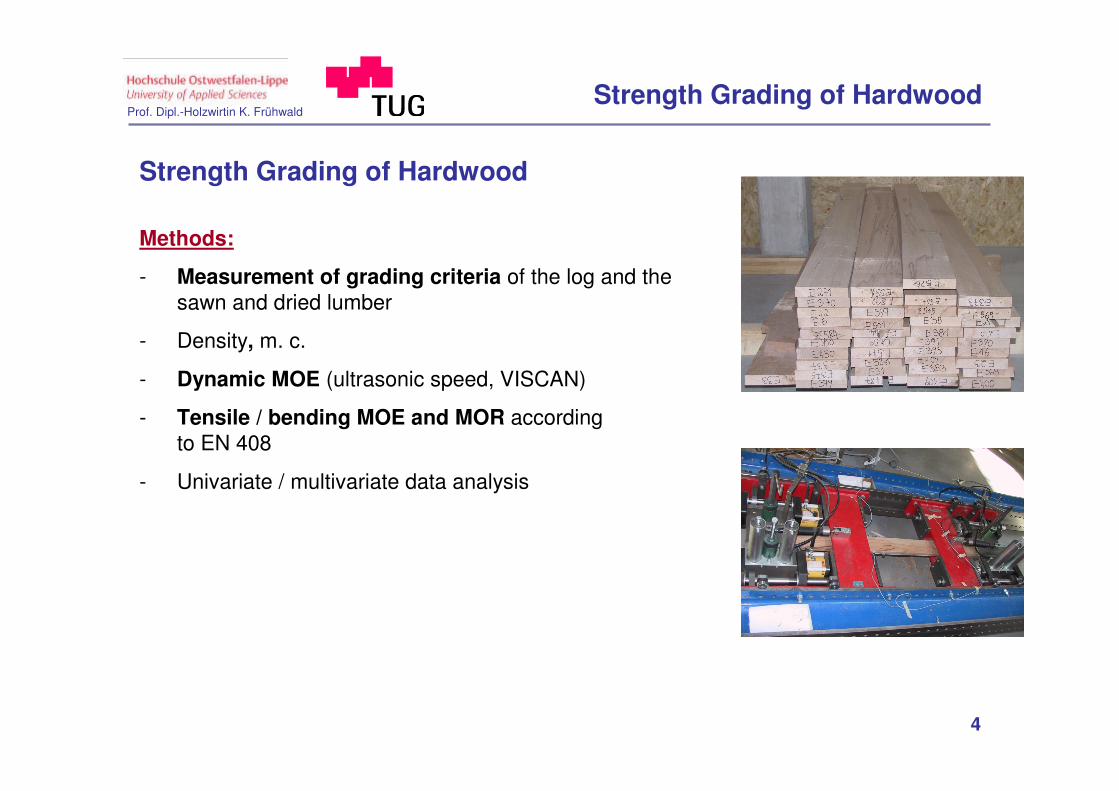
Methods:
- Measurement of grading criteria of the log and the sawn and dried lumber
- Density, m. c.
- Dynamic MOE (ultrasonic speed, VISCAN)
- Tensile / bending MOE and MOR according to EN 408
- Univariate / multivariate data analysis
Strength Grading of Hardwood
Prof. Dipl.-Holzwirtin K. Frühwald
5
Strength Grading of Hardwood
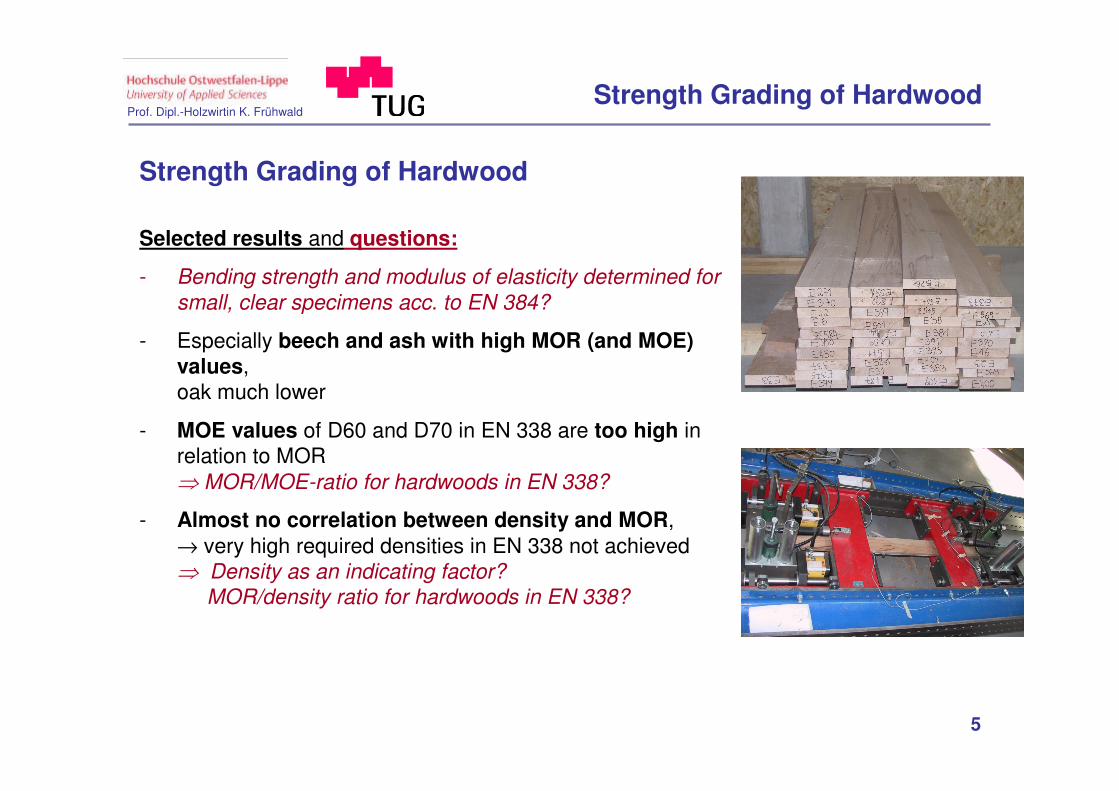
Selected results and questions:
- Bending strength and modulus of elasticity determined for
small, clear specimens acc. to EN 384?
- Especially beech and ash with high MOR (and MOE) values, oak much lower
- MOE values of D60 and D70 in EN 338 are too high in relation to MOR⇒ MOR/MOE-ratio for hardwoods in EN 338?
- Almost no correlation between density and MOR, → very high required densities in EN 338 not achieved⇒ Density as an indicating factor?
MOR/density ratio for hardwoods in EN 338?
Strength Grading of Hardwood
Prof. Dipl.-Holzwirtin K. Frühwald
6
Strength Grading of Hardwood
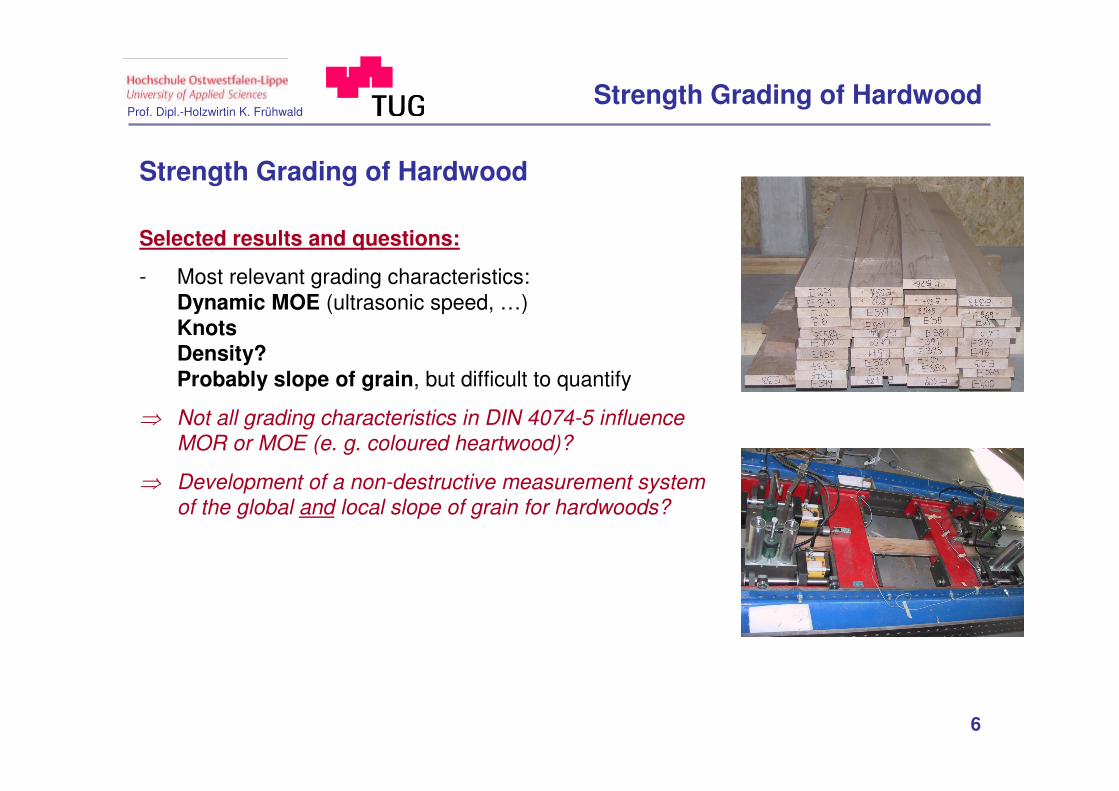
Selected results and questions:
- Most relevant grading characteristics:Dynamic MOE (ultrasonic speed, …)KnotsDensity?Probably slope of grain, but difficult to quantify
⇒ Not all grading characteristics in DIN 4074-5 influence MOR or MOE (e. g. coloured heartwood)?
⇒ Development of a non-destructive measurement system of the global and local slope of grain for hardwoods?
Strength Grading of Hardwood

Prof. Dipl.-Holzwirtin K. Frühwald
7
- Ratio small, clear vs. structural size test specimens Determination of MOR, MOE for small, clear specimensacc. to EN 384:2004, clause 7.1
- MOR/MOE-ratio
- MOR/density-ratio
- Coloured heartwood of beech and ash
- Determination of the slope of grain
Content

Prof. Dipl.-Holzwirtin K. Frühwald
8
- Ratio small, clear vs. structural size test specimens Determination of MOR, MOE for small, clear specimensacc. to EN 384:2004, clause 7.1
- MOR/MOE-ratio
- MOR/density-ratio
- Coloured heartwood of beech and ash
- Determination of the slope of grain
Content
Prof. Dipl.-Holzwirtin K. Frühwald
9
EN 384:2004 Structural Timber – Determination of characteristic values of mechanical properties and density
7 Alternative methods of determining mechanical properties
7.1 Bending strength and modulus of elasticity determined for small, clear specimens
This procedure is only permitted for hardwood species.
Factors to determine characteristic values of bending strength and modulus of elasticitymay be derived where both small clear and structural size data are available for at least three other species. (It is essential that these species are simmilar). These factors shallthen be derived from ratios of the characteristic values from the structural size data to themean values of the small clear data. These factors are then permitted to be applied to species where only small, clear data exist.
For the small clear data, the number of specimens in a sample shall be at least 40 takenfrom at least five trees, and the test method shall be the same in all cases.
Characteristic values determined in this way shall be reduced by multiplying by 0.9.
Ratio small clear vs. structural size

Prof. Dipl.-Holzwirtin K. Frühwald
10
EN 384:1995 Structural Timber – Determination of characteristic values of mechanical properties and density
6 Bending strength and modulus of elasticity determined for small, clearspecimens
This procedure is only permitted for hardwood species.
Factors to determine characteristic values of bending strength and modulus of elasticitymay be derived where both small clear and structural size data are available for at least three other species. (It is essential that these species are simmilar, e.g. not a mixture of hardwoods and softwoods). These factors shall then be derived from ratios of thecharacteristic values from the structural size data to the mean values of the small cleardata. These factors are then permitted to be applied to species where only small, cleardata exist.
For the small clear data, the number of specimens in a sample shall be at least 40 takenfrom at least five trees, and the test method shall be the same in all cases.
Characteristic values determined in this way shall be reduced by multiplying by 0.9.
Ratio small clear vs. structural size
Prof. Dipl.-Holzwirtin K. Frühwald
11
Ratio small clear vs. structural size
Questions
- What are „similar hardwood species“?
- Why are softwoods deleted in issue 2004 (compared to issue 1995)? → Reasons?→ Difference between softwoods and hardwoods?
- Does anyone knows test results?
- What about the known influence of grading characteristics on MOR, MOE, …?

Prof. Dipl.-Holzwirtin K. Frühwald
12
0%
5%
10%
15%
20%
25%
30%
35%
40%
45%
types o
f fa
ilure
[%
]
0
20
40
60
80
100
120
MO
R f
t,0 [N
/mm
2]
█ beech█ oak█ ashknots knot
clusterbark in-clusion
g. SOG woodfailure
splinterfailure
othersl. SOG
FR
ÜH
WA
LD (
2005
)
Failure types after tension test (gluelam lamellas 30x150 mm²)
Ratio small clear vs. structural size

Prof. Dipl.-Holzwirtin K. Frühwald
13
Ratio small clear vs. structural size
Purpose
� 200 gluelam-lamellas (beech and ash, 30x150 mm²)
� Tension test according to EN 408 (structural size)
� From unbroken parts: cutting as many as possible small, clear specimens(6x20 mm²)
� Tension test according to DIN 52188:1979 (summer holidays!)
� Same procedure for bending tests…

Prof. Dipl.-Holzwirtin K. Frühwald
14
- Ratio small, clear vs. structural size test specimens Determination of MOR, MOE for small, clear specimensacc. to EN 384:2004, clause 7.1
- MOR/MOE-ratio
- MOR/density-ratio
- Coloured heartwood of beech and ash
- Determination of the slope of grain
Content
Prof. Dipl.-Holzwirtin K. Frühwald
15
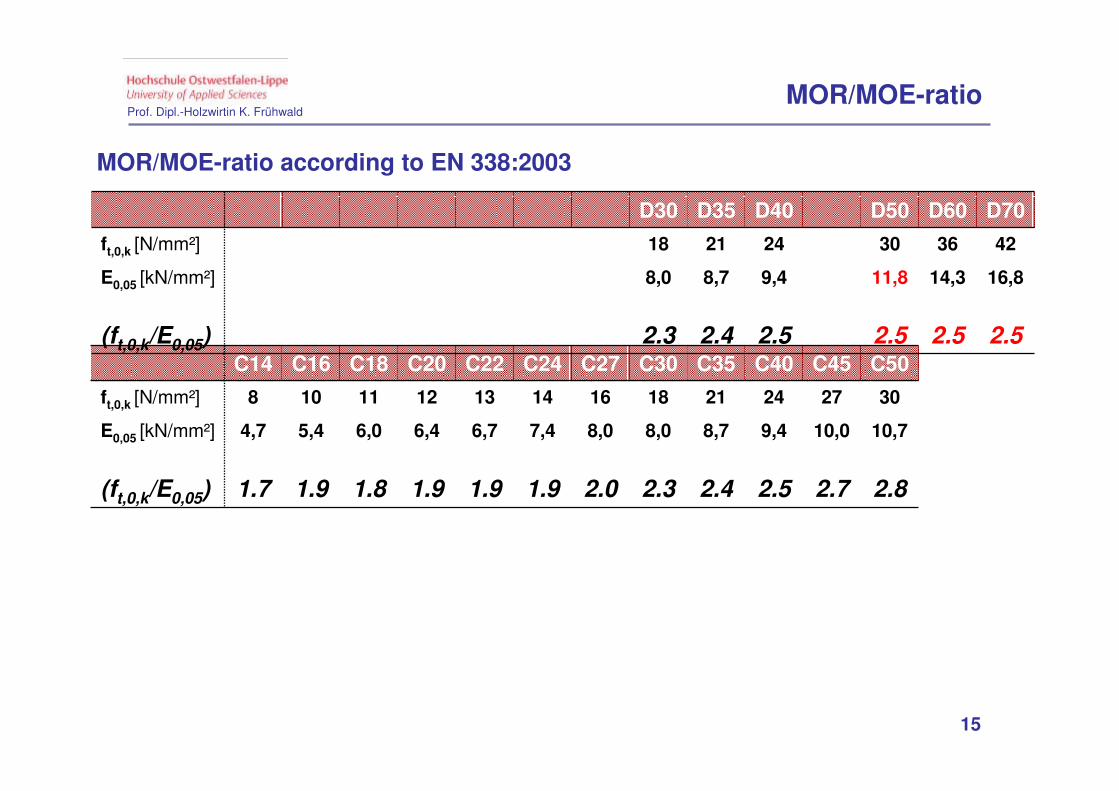
MOR/MOE-ratio according to EN 338:2003
MOR/MOE-ratio
C14 C16 C18 C20 C22 C24 C27 C30 C35 C40 C45 C50
ft,0,k [N/mm²] 8 10 11 12 13 14 16 18 21 24 27 30
E0,05 [kN/mm²] 4,7 5,4 6,0 6,4 6,7 7,4 8,0 8,0 8,7 9,4 10,0 10,7
(ft,0,k/E0,05) 1.7 1.9 1.8 1.9 1.9 1.9 2.0 2.3 2.4 2.5 2.7 2.8
D30 D35 D40 D50 D60 D70
ft,0,k [N/mm²] 18 21 24 30 36 42
E0,05 [kN/mm²] 8,0 8,7 9,4 11,8 14,3 16,8
(ft,0,k/E0,05) 2.3 2.4 2.5 2.5 2.5 2.5
Prof. Dipl.-Holzwirtin K. Frühwald
16
0 20 40 60 80 100 1200
1
2
3
4
5
6
7
8(M
OR
/MO
E)*
100
0 (
f t0/E
0)*
100
0 [-
]
MOR ft,0
[N/mm2]
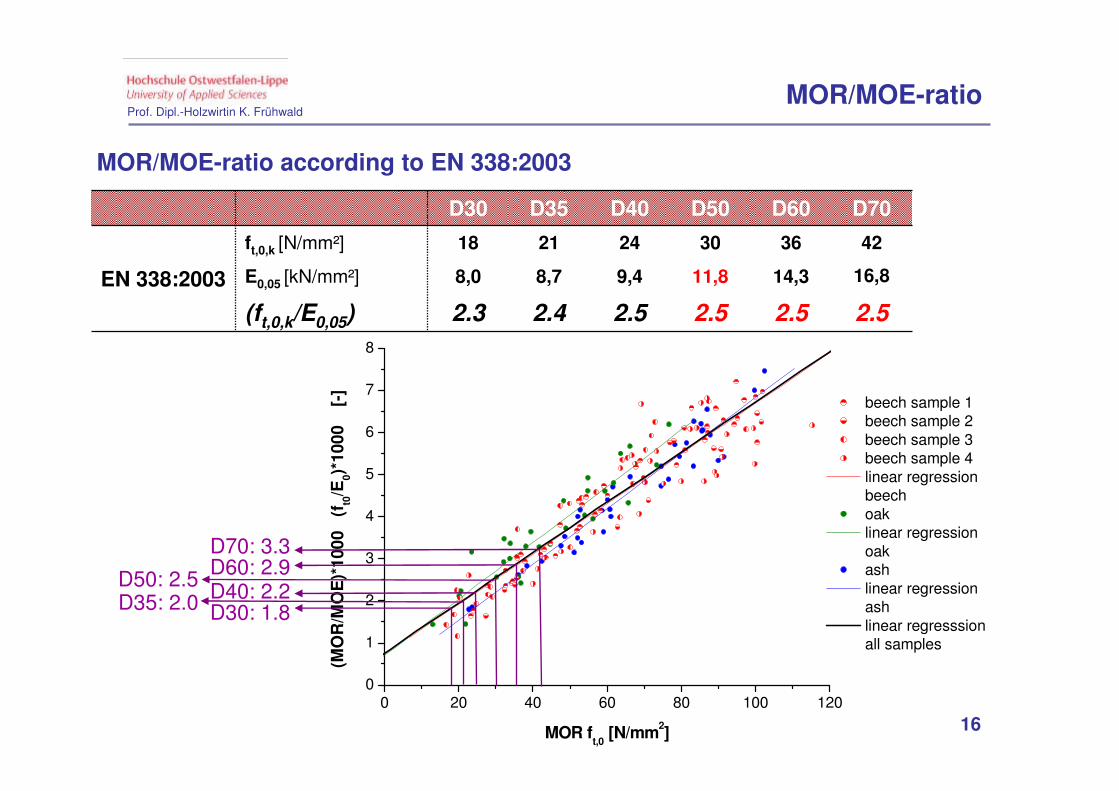
beech sample 1 beech sample 2 beech sample 3 beech sample 4 linear regression
beech oak linear regression
oak ash linear regression
ash linear regresssion
all samples
MOR/MOE-ratio according to EN 338:2003
D30: 1.8D35: 2.0 D40: 2.2D50: 2.5 D60: 2.9
D70: 3.3
MOR/MOE-ratio
D30 D35 D40 D50 D60 D70
EN 338:2003
ft,0,k [N/mm²] 18 21 24 30 36 42
E0,05 [kN/mm²] 8,0 8,7 9,4 11,8 14,3 16,8
(ft,0,k/E0,05) 2.3 2.4 2.5 2.5 2.5 2.5
Prof. Dipl.-Holzwirtin K. Frühwald
17
0 20 40 60 80 100 1200
1
2
3
4
5
6
7
8(M
OR
/MO
E)*
100
0 (
f t0/E
0)*
100
0 [-
]
MOR ft,0
[N/mm2]
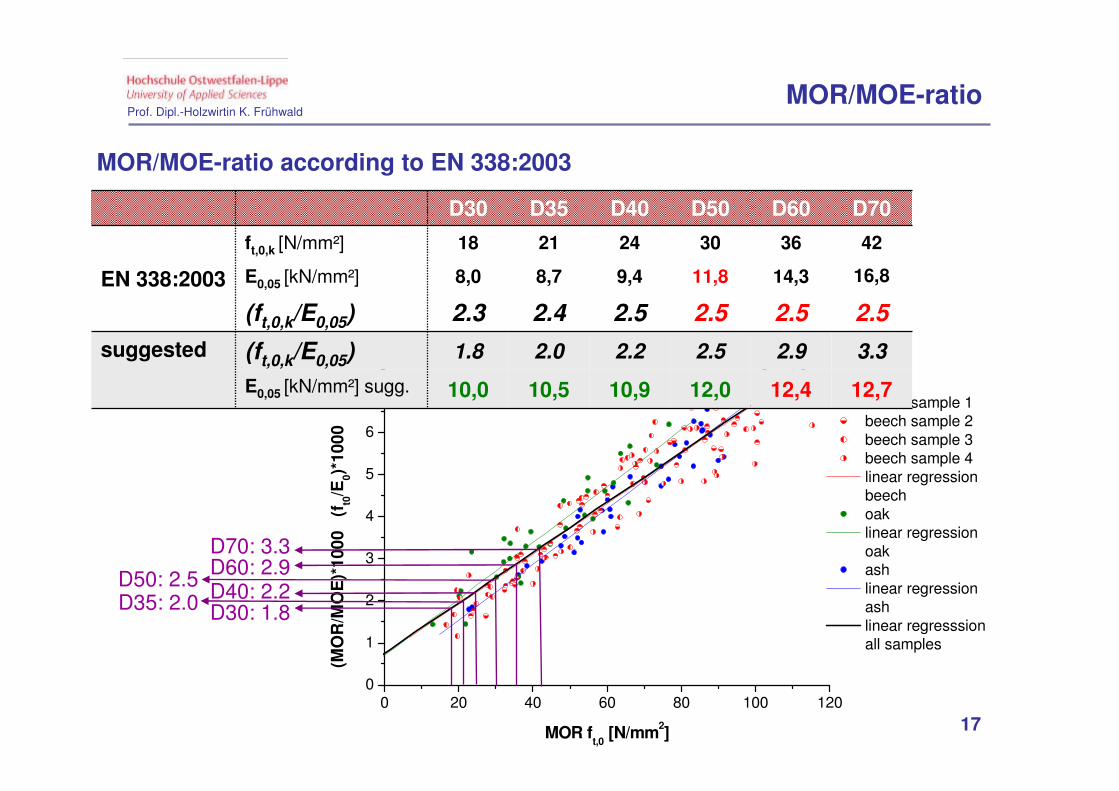
beech sample 1 beech sample 2 beech sample 3 beech sample 4 linear regression
beech oak linear regression
oak ash linear regression
ash linear regresssion
all samples
MOR/MOE-ratio according to EN 338:2003
D30: 1.8D35: 2.0 D40: 2.2D50: 2.5 D60: 2.9
D70: 3.3
MOR/MOE-ratio
D30 D35 D40 D50 D60 D70
EN 338:2003
ft,0,k [N/mm²] 18 21 24 30 36 42
E0,05 [kN/mm²] 8,0 8,7 9,4 11,8 14,3 16,8
(ft,0,k/E0,05) 2.3 2.4 2.5 2.5 2.5 2.5
suggested (ft,0,k/E0,05) 1.8 2.0 2.2 2.5 2.9 3.3
E0,05 [kN/mm²] sugg. 10,0 10,5 10,9 12,0 12,4 12,7
Prof. Dipl.-Holzwirtin K. Frühwald
18
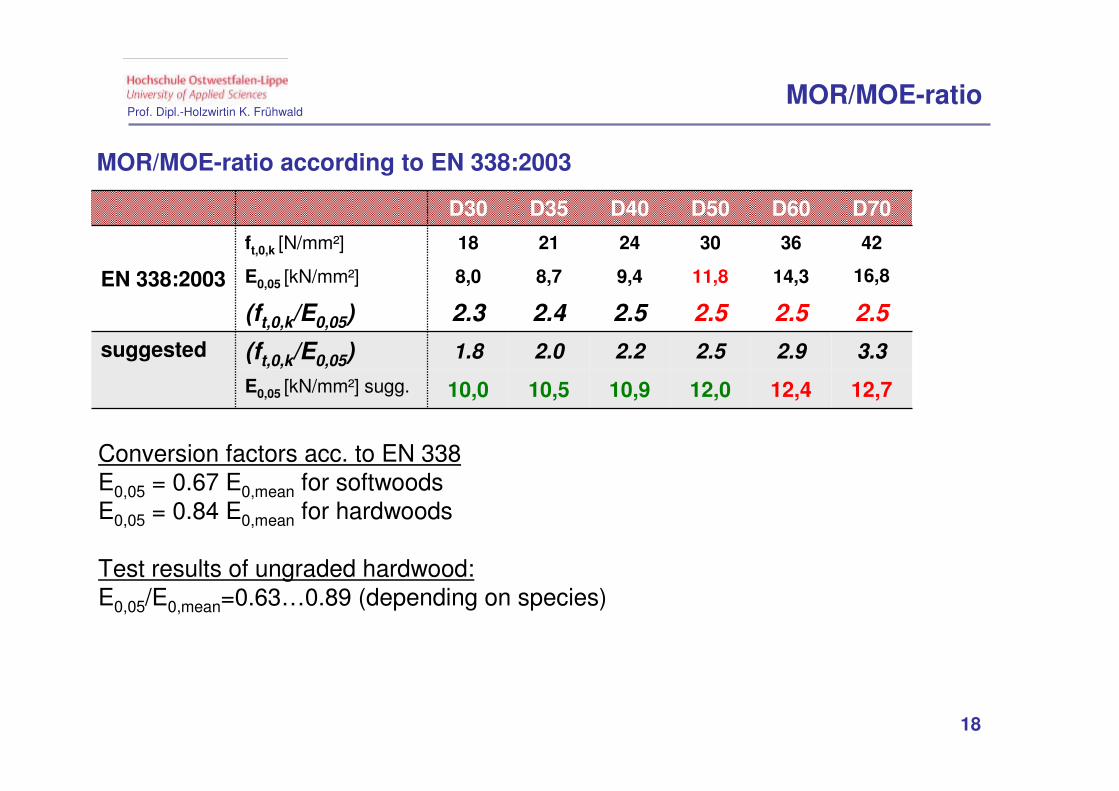
MOR/MOE-ratio according to EN 338:2003
MOR/MOE-ratio
D30 D35 D40 D50 D60 D70
EN 338:2003
ft,0,k [N/mm²] 18 21 24 30 36 42
E0,05 [kN/mm²] 8,0 8,7 9,4 11,8 14,3 16,8
(ft,0,k/E0,05) 2.3 2.4 2.5 2.5 2.5 2.5
suggested (ft,0,k/E0,05) 1.8 2.0 2.2 2.5 2.9 3.3
E0,05 [kN/mm²] sugg. 10,0 10,5 10,9 12,0 12,4 12,7
Conversion factors acc. to EN 338E0,05 = 0.67 E0,mean for softwoodsE0,05 = 0.84 E0,mean for hardwoods
Test results of ungraded hardwood: E0,05/E0,mean=0.63…0.89 (depending on species)

Prof. Dipl.-Holzwirtin K. Frühwald
19
- Ratio small, clear vs. structural size test specimens Determination of MOR, MOE for small, clear specimensacc. to EN 384:2004, clause 7.1
- MOR/MOE-ratio
- MOR/density-ratio
- Coloured heartwood of beech and ash
- Determination of the slope of grain
Content
Prof. Dipl.-Holzwirtin K. Frühwald
20
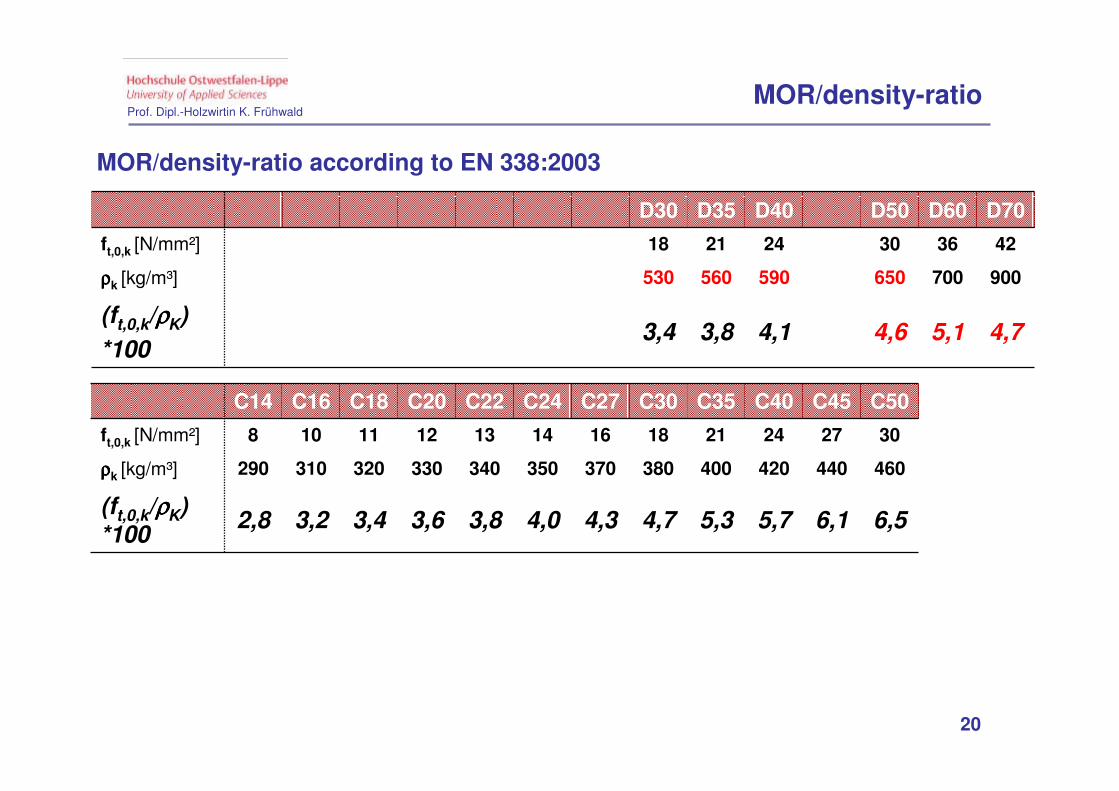
MOR/density-ratio according to EN 338:2003
MOR/density-ratio
C14 C16 C18 C20 C22 C24 C27 C30 C35 C40 C45 C50
ft,0,k [N/mm²] 8 10 11 12 13 14 16 18 21 24 27 30
ρρρρk [kg/m³] 290 310 320 330 340 350 370 380 400 420 440 460
(ft,0,k/ρρρρK)
*1002,8 3,2 3,4 3,6 3,8 4,0 4,3 4,7 5,3 5,7 6,1 6,5
D30 D35 D40 D50 D60 D70
ft,0,k [N/mm²] 18 21 24 30 36 42
ρρρρk [kg/m³] 530 560 590 650 700 900
(ft,0,k/ρρρρK)
*1003,4 3,8 4,1 4,6 5,1 4,7

Prof. Dipl.-Holzwirtin K. Frühwald
21
0 550 600 650 700 750 800 8500
20
40
60
80
100
120
density r12korr.
[kg/m3]
MO
R f
t,0 [
N/m
m2]
beech sample 1 beech sample 2 beech sample 3 beech sample 4 oak ash
MOR/density-ratio
MOR/density-ratio according to EN 338:2003 Problem:
Almost no correlation between density and tensile strength (R=+0.23…0.35)
Densities for D60 (ρk=700 kg/m3) and D70 (ρk=900 kg/m3) (→ EN 338) can not be achieved
D70
Prof. Dipl.-Holzwirtin K. Frühwald
220 20 40 60 80 100 120
0
2
4
6
8
10
12
14
16
(MO
R/d
en
sit
y)*
100
(
f t0/r
12,k
orr)*
100
[-
]
MOR ft,0
[N/mm2]
beech sample 1 beech sample 2 beech sample 3 beech sample 4 linear regression
beech oak linear regression
oak ash linear regression
ash linear regression
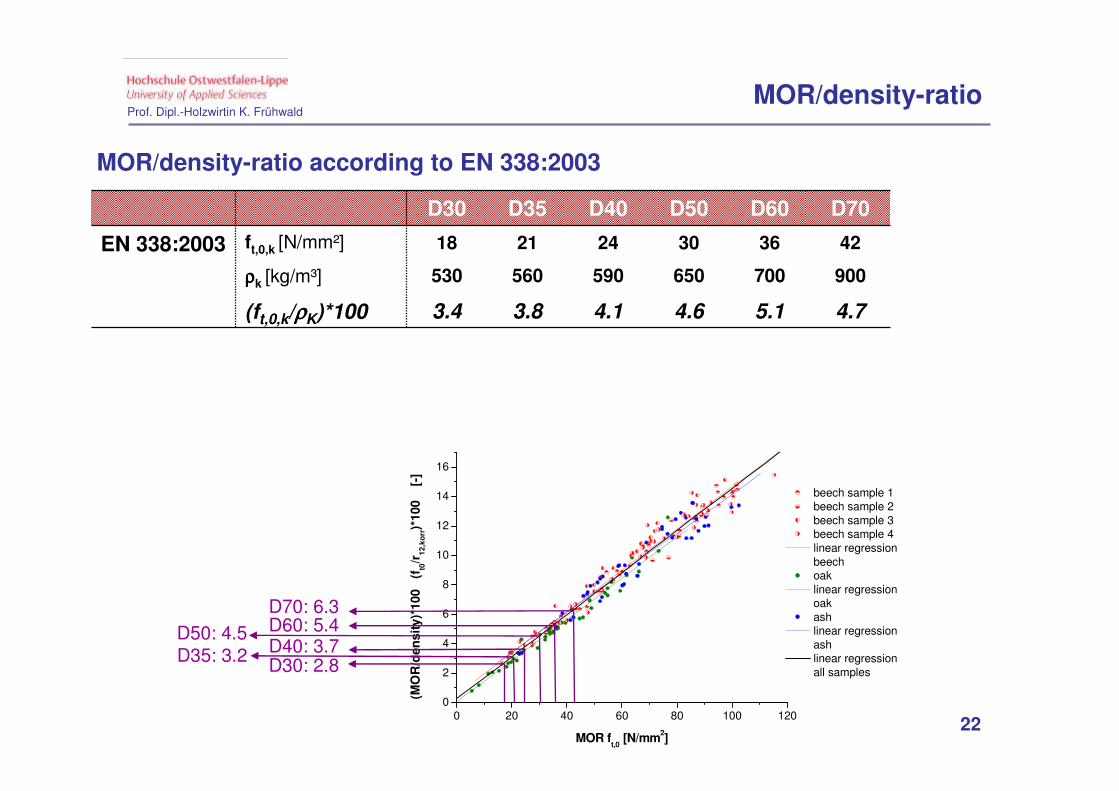
all samplesD30: 2.8D35: 3.2 D40: 3.7D50: 4.5 D60: 5.4
D70: 6.3
MOR/density-ratio
MOR/density-ratio according to EN 338:2003
D30 D35 D40 D50 D60 D70
EN 338:2003 ft,0,k [N/mm²] 18 21 24 30 36 42
ρρρρk [kg/m³] 530 560 590 650 700 900
(ft,0,k/ρρρρK)*100 3.4 3.8 4.1 4.6 5.1 4.7

Prof. Dipl.-Holzwirtin K. Frühwald
230 20 40 60 80 100 120
0
2
4
6
8
10
12
14
16
(MO
R/d
en
sit
y)*
100
(
f t0/r
12,k
orr)*
100
[-
]
MOR ft,0
[N/mm2]
beech sample 1 beech sample 2 beech sample 3 beech sample 4 linear regression
beech oak linear regression
oak ash linear regression
ash linear regression
all samplesD30: 2.8D35: 3.2 D40: 3.7D50: 4.5 D60: 5.4
D70: 6.3
MOR/density-ratio
MOR/density-ratio according to EN 338:2003
D30 D35 D40 D50 D60 D70
EN 338:2003 ft,0,k [N/mm²] 18 21 24 30 36 42
ρρρρk [kg/m³] 530 560 590 650 700 900
(ft,0,k/ρρρρK)*100 3.4 3.8 4.1 4.6 5.1 4.7
suggested (ft,0,k/ρρρρK)*100 2.8 3.2 3.7 4.5 5.4 6.3
ρρρρk [kg/m³] sugg. 640 650 650 660 670 670
ρρρρmean [kg/m³] sugg.730 740 740 750 760 760
Prof. Dipl.-Holzwirtin K. Frühwald
24
- Ratio small, clear vs. structural size test specimens Determination of MOR, MOE for small, clear specimensacc. to EN 384:2004, clause 7.1
- MOR/MOE-ratio
- MOR/density-ratio
- Coloured heartwood of beech and ash
- Determination of the slope of grain
Content
Prof. Dipl.-Holzwirtin K. Frühwald
25
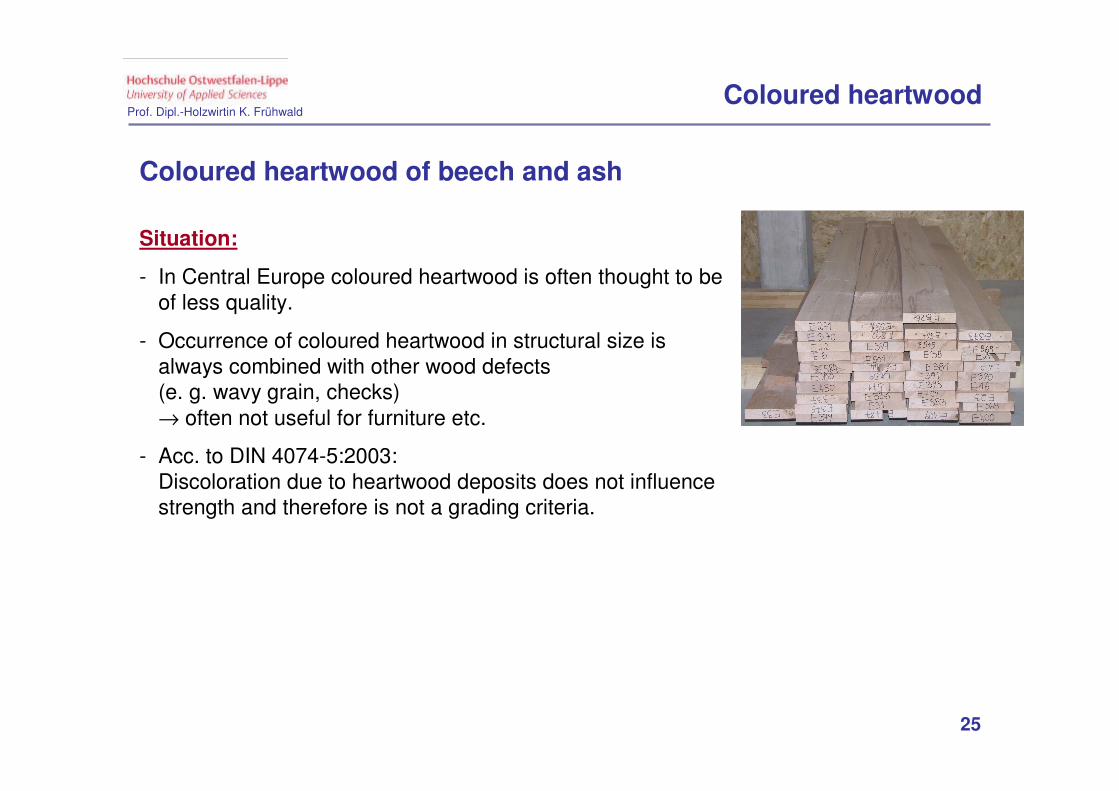
Coloured heartwood of beech and ash
Situation:
- In Central Europe coloured heartwood is often thought to be of less quality.
- Occurrence of coloured heartwood in structural size is always combined with other wood defects (e. g. wavy grain, checks) → often not useful for furniture etc.
- Acc. to DIN 4074-5:2003:Discoloration due to heartwood deposits does not influence strength and therefore is not a grading criteria.
Coloured heartwood
Prof. Dipl.-Holzwirtin K. Frühwald
26
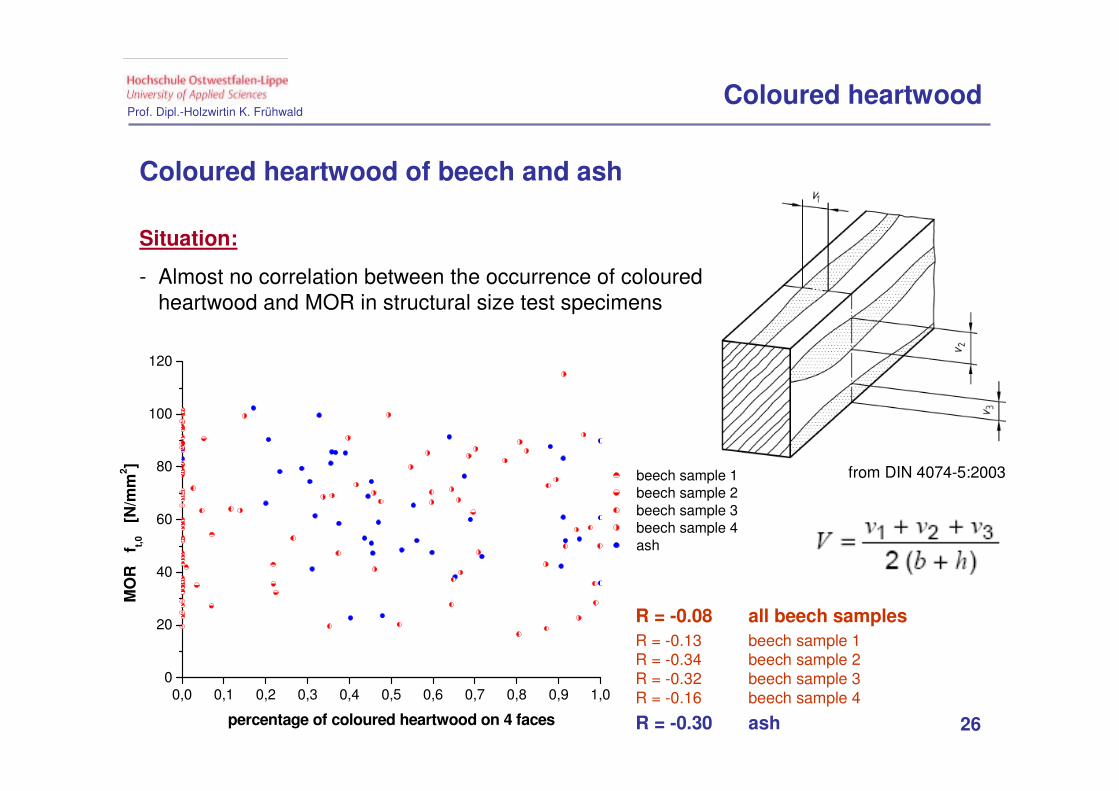
Coloured heartwood of beech and ash
Situation:
- Almost no correlation between the occurrence of colouredheartwood and MOR in structural size test specimens
Coloured heartwood
0,0 0,1 0,2 0,3 0,4 0,5 0,6 0,7 0,8 0,9 1,00
20
40
60
80
100
120
percentage of coloured heartwood on 4 faces
MO
R f
t,0 [
N/m
m2]
beech sample 1 beech sample 2 beech sample 3 beech sample 4 ash
R = -0.08 all beech samples
R = -0.13 beech sample 1R = -0.34 beech sample 2R = -0.32 beech sample 3R = -0.16 beech sample 4
R = -0.30 ash
from DIN 4074-5:2003

Prof. Dipl.-Holzwirtin K. Frühwald
27
Coloured heartwood of beech and ash
Goal:
Determination physical and mechanical propertiesof coloured heartwood and light wood of beech and ashfor small, clear specimens
Material:
- 7 beech and 9 ash stems with a high content of colouredheartwood
- As many as possible small, clear specimens of colouredheartwood and light wood
Coloured heartwood
Prof. Dipl.-Holzwirtin K. Frühwald
28
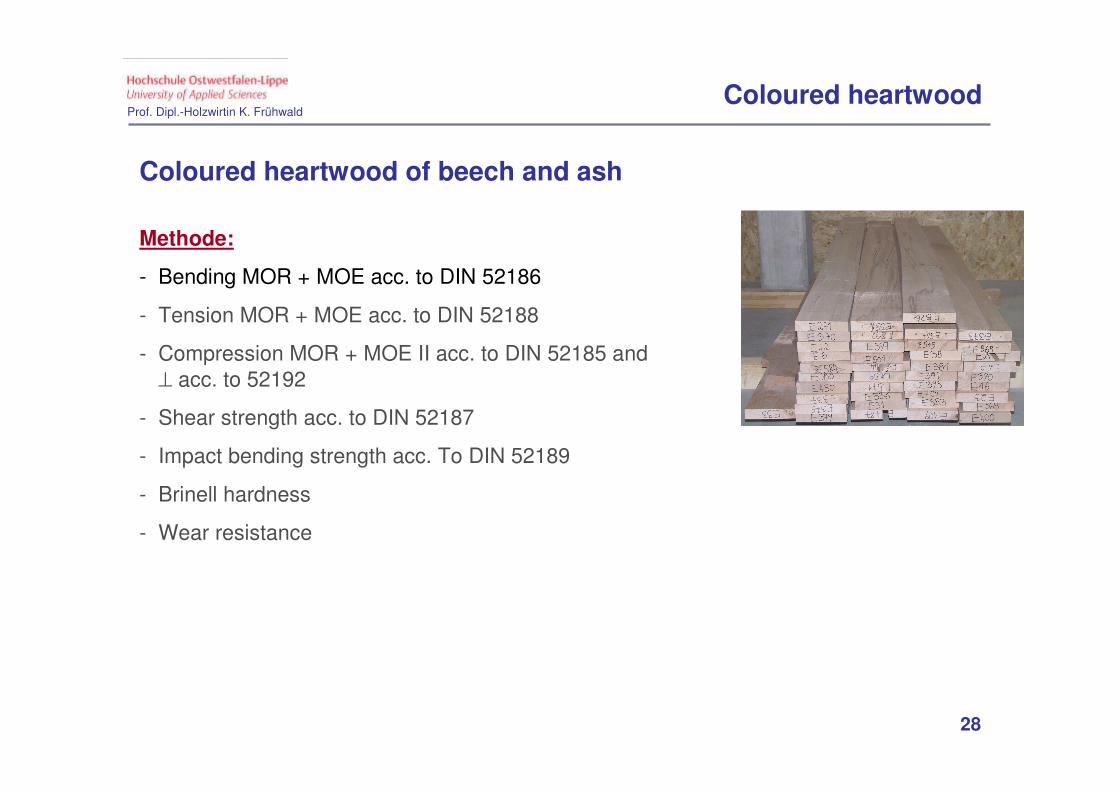
Coloured heartwood of beech and ash
Methode:
- Bending MOR + MOE acc. to DIN 52186
- Tension MOR + MOE acc. to DIN 52188
- Compression MOR + MOE II acc. to DIN 52185 and ⊥ acc. to 52192
- Shear strength acc. to DIN 52187
- Impact bending strength acc. To DIN 52189
- Brinell hardness
- Wear resistance
Coloured heartwood
Prof. Dipl.-Holzwirtin K. Frühwald
29
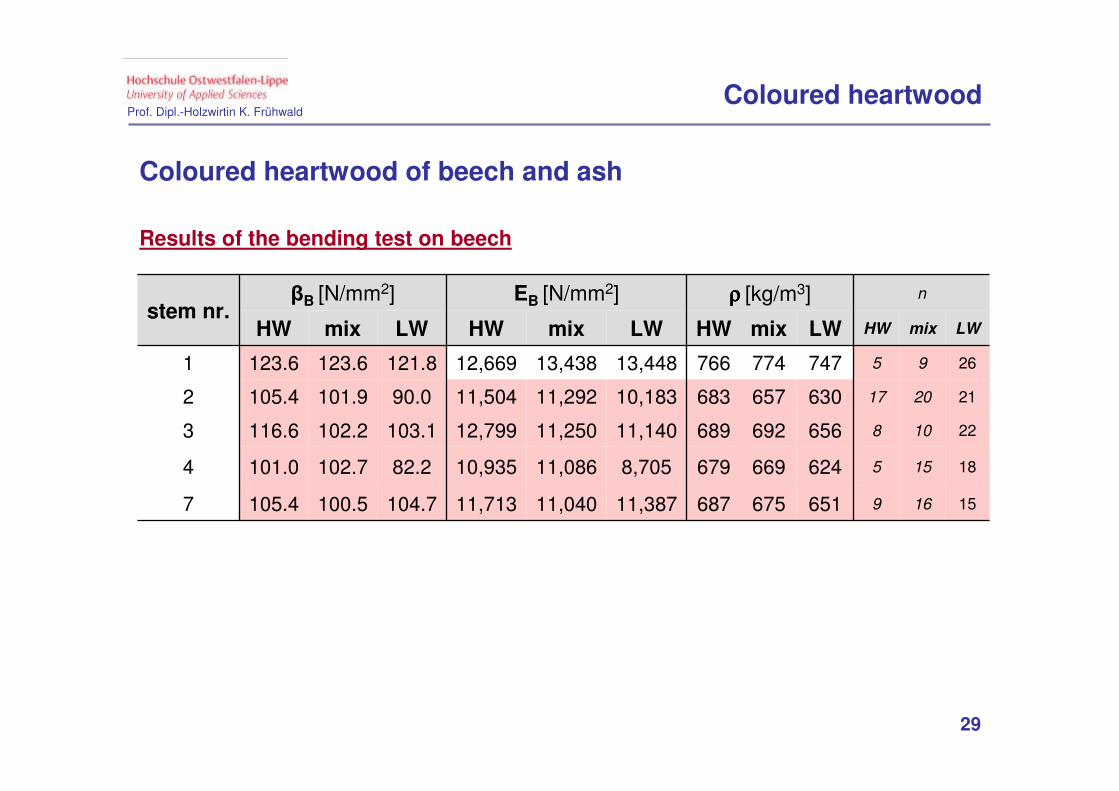
stem nr.βB [N/mm2] EB [N/mm2] ρρρρ [kg/m3] n
HW mix LW HW mix LW HW mix LW HW mix LW
1 123.6 123.6 121.8 12,669 13,438 13,448 766 774 747 5 9 26
2 105.4 101.9 90.0 11,504 11,292 10,183 683 657 630 17 20 21
3 116.6 102.2 103.1 12,799 11,250 11,140 689 692 656 8 10 22
4 101.0 102.7 82.2 10,935 11,086 8,705 679 669 624 5 15 18
7 105.4 100.5 104.7 11,713 11,040 11,387 687 675 651 9 16 15
Coloured heartwood of beech and ash
Results of the bending test on beech
Coloured heartwood
Prof. Dipl.-Holzwirtin K. Frühwald
30
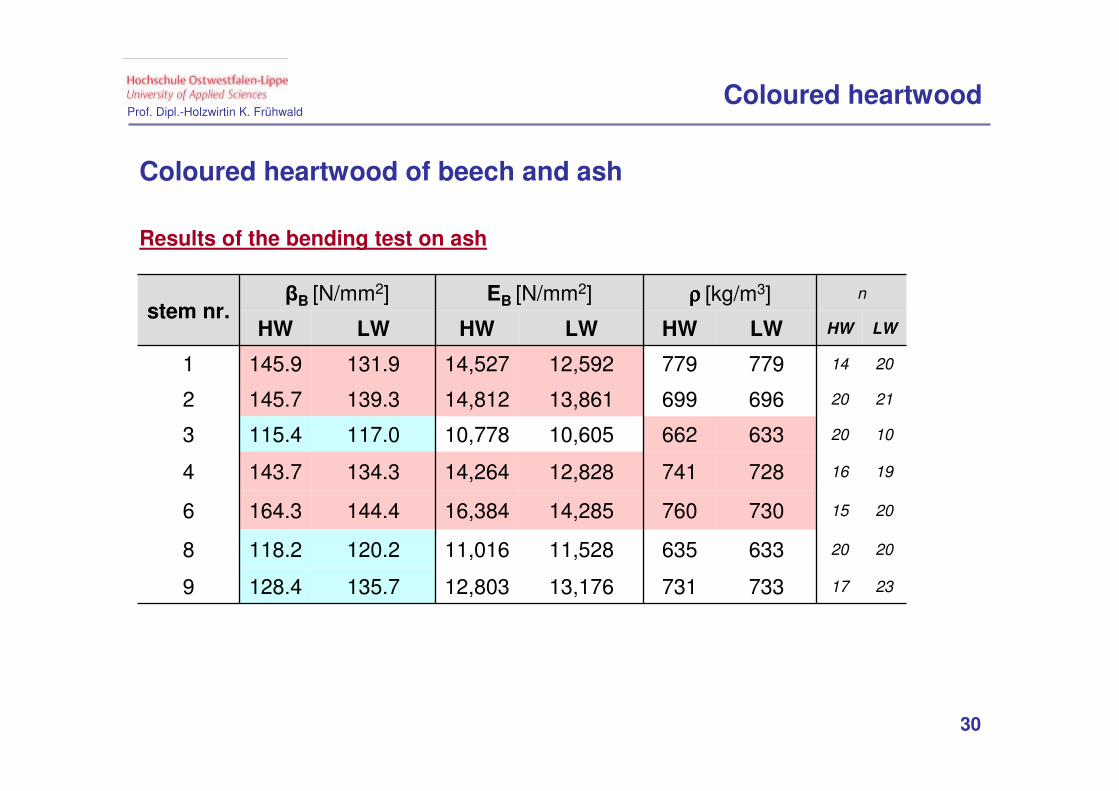
stem nr.βB [N/mm2] EB [N/mm2] ρρρρ [kg/m3] n
HW LW HW LW HW LW HW LW
1 145.9 131.9 14,527 12,592 779 779 14 20
2 145.7 139.3 14,812 13,861 699 696 20 21
3 115.4 117.0 10,778 10,605 662 633 20 10
4 143.7 134.3 14,264 12,828 741 728 16 19
6 164.3 144.4 16,384 14,285 760 730 15 20
8 118.2 120.2 11,016 11,528 635 633 20 20
9 128.4 135.7 12,803 13,176 731 733 17 23
Coloured heartwood of beech and ash
Results of the bending test on ash
Coloured heartwood

Prof. Dipl.-Holzwirtin K. Frühwald
31
stem nr.βZ [N/mm2] EZ [N/mm2] n
HW LW HW LW HW LW
2 108.3 116.8 13,410 12,484 9 31
4 104.3 138.6 11,387 13,152 13 11
6 133.8 136.0 14,304 14,023 10 13
7 112.8 146.4 12,823 14,586 14 7
Coloured heartwood of beech and ash
Results of the tension test on beech
Coloured heartwood
stem nr.βZ [N/mm2] EZ [N/mm2] n
HW LW HW LW HW LW
2 199.3 195.4 16,187 15,791 20 20
3 115.5 110.0 11,197 11,021 20 19
Results of the tension test on ash
Prof. Dipl.-Holzwirtin K. Frühwald
32
- Ratio small, clear vs. structural size test specimens Determination of MOR, MOE for small, clear specimens acc. to EN 384:2004, clause 7.1
- MOR/MOE-ratio
- MOR/density-ratio
- Coloured heartwood of beech and ash
- Determination of the slope of grain
Content

Prof. Dipl.-Holzwirtin K. Frühwald
33
Slope of grain
= deviation of the fiber direction from the longitudinal axis
MOR and MOE depend on grain angle: II>>⊥
GLOBAL (GENERAL) SLOPE OF GRAIN
= average grain angle over some length without knots etc.
- spiral grain caused by spiral instead of vertical growth of
fibers → fibers in tangential plane of growth rings
- diagonal grain caused by growth rings not parallel to
surface of sawn piece• sawing against to the pronounced taper along the pith
• crooked logs
• logs with butt swell
LOCAL SLOPE OF GRAIN
= on a smaller scale around knots etc.
Slope of Grain
Prof. Dipl.-Holzwirtin K. Frühwald
34
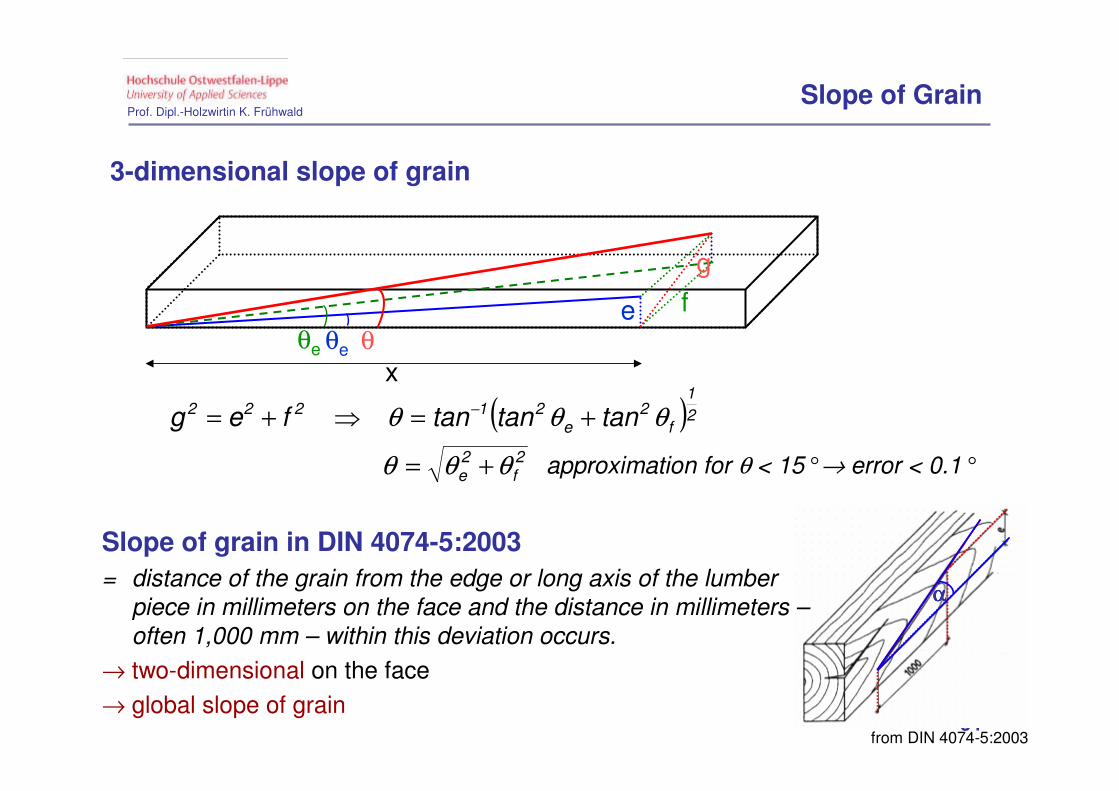
Slope of grain in DIN 4074-5:2003
= distance of the grain from the edge or long axis of the lumber
piece in millimeters on the face and the distance in millimeters –
often 1,000 mm – within this deviation occurs.
→ two-dimensional on the face
→ global slope of grain
αααα
3-dimensional slope of grain
( )2
1
f2
e21222 tantantanfeg θθθ +=⇒+= −
θe
eθe
f
x
g
θ
2f
2e θθθ += approximation for θ < 15°→ error < 0.1°
from DIN 4074-5:2003
Slope of Grain

Prof. Dipl.-Holzwirtin K. Frühwald
35
0 20 40 60 80 100 120 1400
20
40
60
80
100
120
MO
R
ft,
0
[N
/mm
2]
beech sample 1 oak
0 20 40 60 80 100 120 1400
6000
8000
10000
12000
14000
16000
18000
20000M
OE
E
0
[N
/mm
2]
gSOG from drying checks
European grading rules:
SOG from the alignment of - drying checks, - pores, - resin ducts
from DIN 4074:2003
Only on 4 % of the tested gluelam lamellas!
Slope of Grain
Prof. Dipl.-Holzwirtin K. Frühwald
36
0 20 40 60 80 100 120 140 160 180 2000
20
40
60
80
100
120
MO
R
ft,
0
[N
/mm
2]
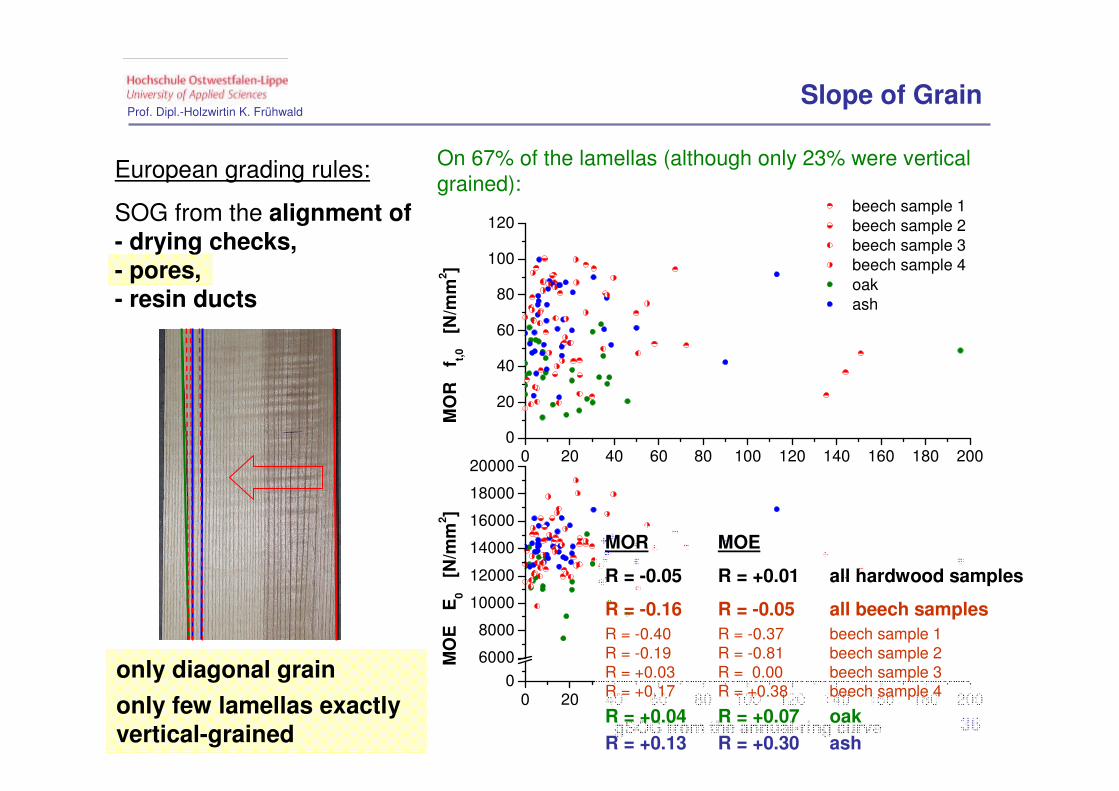
beech sample 1 beech sample 2 beech sample 3 beech sample 4 oak ash
0 20 40 60 80 100 120 140 160 180 2000
6000
8000
10000
12000
14000
16000
18000
20000M
OE
E
0
[N
/mm
2]
gSOG from the annual-ring curve
only diagonal grain
only few lamellas exactly vertical-grained
European grading rules:
SOG from the alignment of - drying checks, - pores, - resin ducts
MOR MOE
R = -0.05 R = +0.01 all hardwood samples
R = -0.16 R = -0.05 all beech samples
R = -0.40 R = -0.37 beech sample 1R = -0.19 R = -0.81 beech sample 2R = +0.03 R = 0.00 beech sample 3R = +0.17 R = +0.38 beech sample 4
R = +0.04 R = +0.07 oak
R = +0.13 R = +0.30 ash
On 67% of the lamellas (although only 23% were vertical grained):
Slope of Grain

Prof. Dipl.-Holzwirtin K. Frühwald
37
0 20 40 60 80 100 120 140 160 180 2000
20
40
60
80
100
120
MO
R
ft,
0
[N
/mm
2]
beech sample 1 beech sample 3 beech sample 4 ash
0 20 40 60 80 100 120 140 160 180 2000
6000
8000
10000
12000
14000
16000
18000
20000M
OE
E
0
[N
/mm
2]
gSOG from the annual-ring curve (vertical grained lamellas)
European grading rules:
SOG from the alignment of - drying checks, - pores, - resin ducts
MOR MOE
R = -0.22 R = -0.16 all hardwood samples
R = -0.28 R = -0.17 all beech samples
R = -0.63 R = -0.74 beech sample 1R = +0.24 R = +0.46 beech sample 3R = -0.45 R = +0.07 beech sample 4
R = +0.22 R = -0.07 ash
On the 23% vertical grained lamellas:
Only diagonal grain
Only few lamellas exactly vertical-grained
Slope of Grain

Prof. Dipl.-Holzwirtin K. Frühwald
38
0 20 40 60 80 100 1200
20
40
60
80
100
120
MO
R
ft,
0
[N
/mm
2]
beech sample 1 beech sample 2 beech sample 3 beech sample 4 oak ash
0 20 40 60 80 100 1200
6000
8000
10000
12000
14000
16000
18000
20000M
OE
E
0
[N
/mm
2]
gSOG from the scribing test on the face
On the face:
αααα
MOR MOE
R = -0.16 R = -0.07 all hardwood samples
R = -0.22 R = -0.18 all beech samples
R = -0.27 R = -0.38 beech sample 1R = -0.49 R = -0.02 beech sample 2R = -0.04 R = +0.03 beech sample 3R = -0.12 R = -0.10 beech sample 4
R = -0.14 R = +0.25 oak
R = +0.01 R = +0.06 ash
Almost no correlation between the gSOG from the scribing test on the face and MOR or MOE
Slope of Grain

Prof. Dipl.-Holzwirtin K. Frühwald
39
On the edge:
αααα
Almost no correlation between the gSOG from the scribing test on the edge and MOR or MOE
0 20 40 60 80 100 1200
20
40
60
80
100
120
MO
R
ft,
0
[N
/mm
2]
beech sample 1 beech sample 2 beech sample 3 beech sample 4 oak ash
0 20 40 60 80 100 1200
6000
8000
10000
12000
14000
16000
18000
20000M
OE
E
0
[N
/mm
2]
gSOG from the scribing test on the edge
MOR MOE
R = -0.20 R = +0.03 all hardwood samples
R = -0.22 R = -0.01 all beech samples
R = -0.36 R = -0.36 beech sample 1R = +0.34 R = +0.19 beech sample 2R = -0.14 R = +0.11 beech sample 3R = -0.24 R = +0.29 beech sample 4
R = -0.39 R = +0.16 oak
R = +0.20 R = +0.06 ash
Slope of Grain

Prof. Dipl.-Holzwirtin K. Frühwald
40
On the face and edge:according Pythagoras´ theorem
αααα
0 20 40 60 80 100 1200
20
40
60
80
100
120
MO
R
ft,
0
[N
/mm
2]
beech sample 1 beech sample 2 beech sample 3 beech sample 4 oak ash
0 20 40 60 80 100 1200
6000
8000
10000
12000
14000
16000
18000
20000M
OE
E
0
[N
/mm
2]
gSOG from the scribing test on the face and the edge
Almost no correlation between the gSOG from the scribing test on the face and edge and MOR or MOE
MOR MOE
R = -0.21 R = -0.04 all hardwood samples
R = -0.26 R = -0.15 all beech samples
R = -0.34 R = -0.43 beech sample 1R = -0.29 R = +0.06 beech sample 2R = -0.10 R = +0.07 beech sample 3R = -0.26 R = +0.11 beech sample 4
R = -0.30 R = +0.27 oak
R = +0.12 R = +0.07 ash
Slope of Grain

Prof. Dipl.-Holzwirtin K. Frühwald
41
On the face irrespective of the type of failure:
Almost no correlation between the gSOG from the fracture pattern on the face (irrespective of the type of failure) and MOR or MOE
0 50 100 150 200 250 300 3500
20
40
60
80
100
120
MO
R
ft,
0
[N
/mm
2]
beech sample 1 beech sample 2 beech sample 3 beech sample 4 oak ash
0 50 100 150 200 250 300 3500
6000
8000
10000
12000
14000
16000
18000
20000M
OE
E
0
[N
/mm
2]
gSOG from the failure pattern on the face
αααα
MOR MOE
R = -0.13 R = -0.22 all hardwood samples
R = -0.20 R = -0.31 all beech samples
R = -0.28 R = -0.45 beech sample 1R = +0.38 R = -0.33 beech sample 2R = -0.14 R = -0.55 beech sample 3R = -0.27 R = +0.04 beech sample 4
R = -0.09 R = -0.11 oak
R = -0.27 R = -0.21 ash
Slope of Grain

Prof. Dipl.-Holzwirtin K. Frühwald
42
On the face only with global and local SOG as type of failure:
Good correlation between the gSOG from the fracture pattern on the face (with global and local SOG as type of failure) and MOR or MOE
αααα
0 50 100 150 200 250 300 3500
20
40
60
80
100
120
MO
R
ft,
0
[N
/mm
2]
beech sample 1 beech sample 2 beech sample 3 beech sample 4 linear regression
beech oak ash linear regression
all samples
0 50 100 150 200 250 300 3500
6000
8000
10000
12000
14000
16000
18000
20000M
OE
E
0
[N
/mm
2]
gSOG from the failure pattern on the face
MOR MOE
R = -0.38 R = -0.47 all hardwood samples
R = -0.52 R = -0.55 all beech samples
R = -0.35 R = -0.46 beech sample 1R = -0.76 R = -0.68 beech sample 4
Slope of Grain
Prof. Dipl.-Holzwirtin K. Frühwald
43
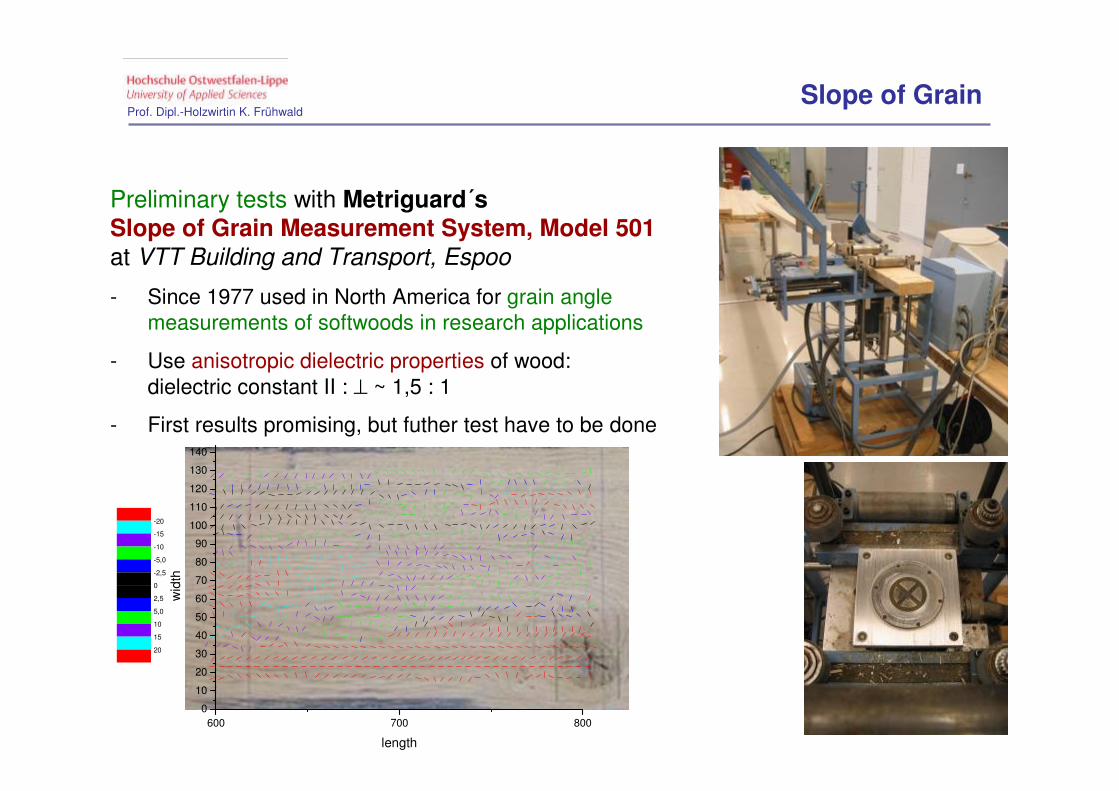
Preliminary tests with Metriguard´s Slope of Grain Measurement System, Model 501at VTT Building and Transport, Espoo
- Since 1977 used in North America for grain angle measurements of softwoods in research applications
- Use anisotropic dielectric properties of wood: dielectric constant II : ⊥ ~ 1,5 : 1
- First results promising, but futher test have to be done
600 700 8000
10
20
30
40
50
60
70
80
90
100
110
120
130
140
wid
th
length
-20
-15
-10
-5,0
-2,5
0
2,5
5,0
10
15
20
Slope of Grain
Prof. Dipl.-Holzwirtin K. Frühwald
44
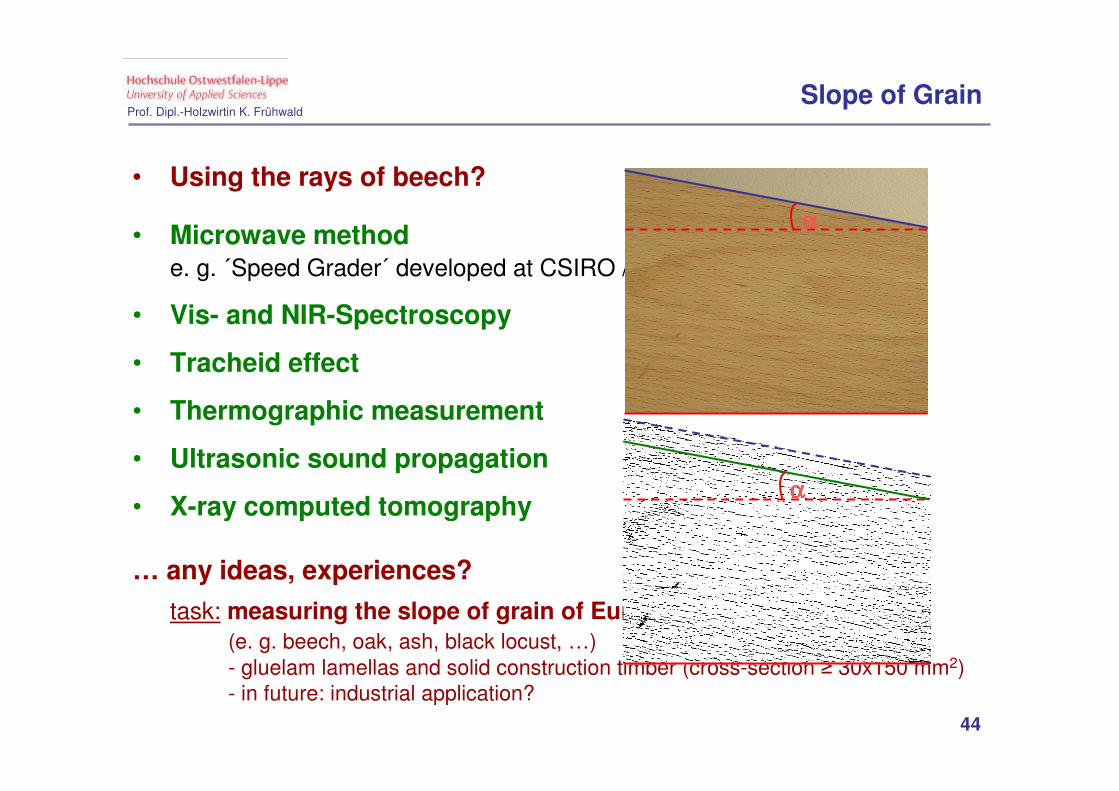
• Microwave methode. g. ´Speed Grader´ developed at CSIRO / Australia
• Vis- and NIR-Spectroscopy
• Tracheid effect
• Thermographic measurement
• Ultrasonic sound propagation
• X-ray computed tomography
… any ideas, experiences?
task: measuring the slope of grain of European hardwoods
(e. g. beech, oak, ash, black locust, …)- gluelam lamellas and solid construction timber (cross-section ≥ 30x150 mm2)- in future: industrial application?
αααα
αααα
• Using the rays of beech?
Slope of Grain
Prof. Dipl.-Holzwirtin K. Frühwald
Contact:
Prof. Dipl.-Holzwirtin Katja Frühwald
University of Applied Sciences Ostwestfalen-Lippe(formerly University of Applied Sciences Lippe & Höxter)Dept. of Production Engineering and Economics Laboratory of Timber Engineering: Products and Production
Liebigstr. 87D-32657 LemgoGermany
Tel. ++49-5261-702-569 or -145Fax ++49-5261-702-435