A Quantitative Determination of Minimum Film Thickness in ...

1Glenn Research Center at Lewis Field
Problems in Minimum Ignition Energy Determination
Dr. Martin J. Rabinowitz
Research and Technology DirectorateNASA Glenn Research Center
Brookpark, Ohio 44122
Collaborators:Robert R. Bickford, Gregory S. Calhoun, Christopher L. Hegedus,
Bryan E. Knepper, Yves C. Lamothe, James E. Sexton

2Glenn Research Center at Lewis Field
This Seems Well Understood
Well, not really.
The determination of minimum ignition energy curves for fuel/airmixtures have been problematical with widely varying results fordifferent groups using different fuels, fuel treatment regimes and ignition sources.
The focus of attention on the root cause of the variations has been in the fuel and fuel treatment. While there is considerable variation in refinery products and handling such variations are also observed for chemically pure fuels.
Perhaps there are other concerns.

3Glenn Research Center at Lewis Field
Successes and Failure for Ignition
0.1
1.0
10.0
100.0
1000.0
10000.0
5 10 15 20 25 30 35 40 45
Temperature ( 0C)
MIE
(mJ)
IgnitionNon-Ignition
Methanol MIE
0 5 10 15 20 25 30 35 40

4Glenn Research Center at Lewis Field
Type of Ignition Source
Hot Wire
Spark
Optical
Du
rati
on
Physical Chemistry Chemical Engineering Mechanical Engineering
Initiation
ns
µs
ms

5Glenn Research Center at Lewis Field
Combustion Vessel

6Glenn Research Center at Lewis Field
GRC MIE ExperimentationCombustion Vessel Apparatus

7Glenn Research Center at Lewis Field
Sparks Move Around
30 µs later

8Glenn Research Center at Lewis Field
“Dancing” Spark30 µs Between Frames

9Glenn Research Center at Lewis Field
GRC MIE ExperimentationCombustion Vessel Apparatus ~ Internal Configuration

10Glenn Research Center at Lewis Field
Ωµ
Ω
Ω
Ω
µ
Ω
Ω
Ω

11Glenn Research Center at Lewis Field
Typical Ionization Profile70µJ Spark Energy
-2
-1
0
1
2
3
4
5
6
7
8
0 500 1000 1500 2000
Time (ns)
Volta
ge (k
V)
Breakdown = 7000 VVoltage Rise = 1.3e10 V/s
Ionization Spark Duration 100 ns

12Glenn Research Center at Lewis Field
Typical Energy MeasurementEnergy = ∫ (Voltage x Current) dt
Current
Voltage
Power

13Glenn Research Center at Lewis Field
Oscillating Sparks

14Glenn Research Center at Lewis Field
Nice Looking Spark

15Glenn Research Center at Lewis Field
Nice Looking Spark -- Animation

16Glenn Research Center at Lewis Field
Reaction Wave

17Glenn Research Center at Lewis Field
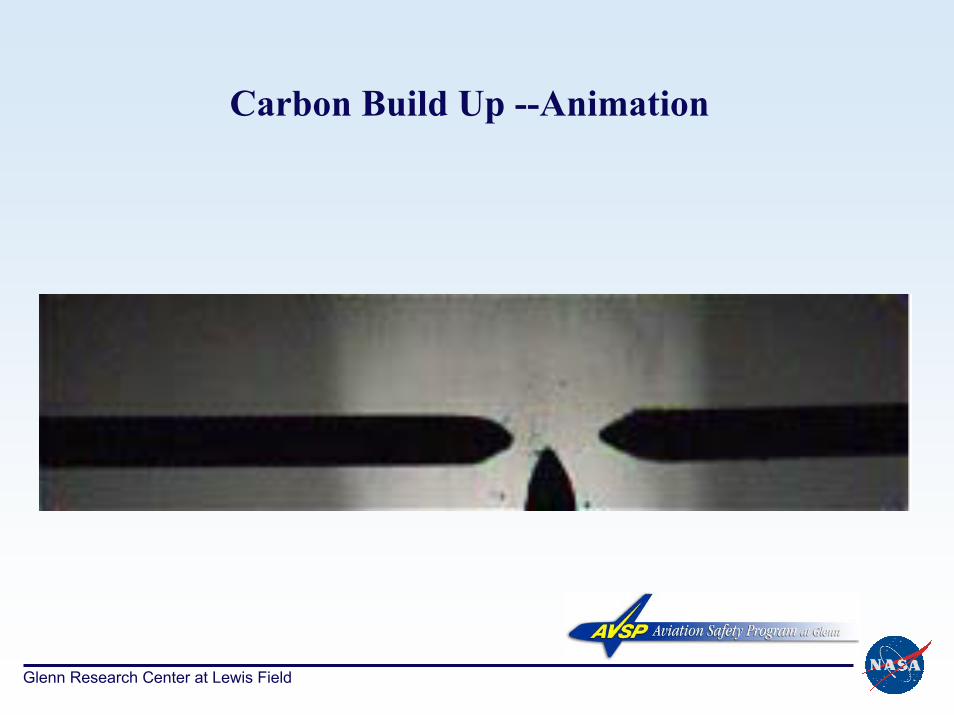
Carbon Build Up
Glenn Research Center at Lewis Field
Carbon Build Up --Animation

19Glenn Research Center at Lewis Field
Methanol
0
200
400
600
800
1000
0.0 0.5 1.0 1.5 2.0 2.5 3.0Equivalence Ratio
TIm
e to
Pea
k Pr
essu
re (m
s)
0
10
20
30
40
50
60
Pres
sure
Ris
e (p
si)

20Glenn Research Center at Lewis Field
Effect of Vapor Composition on Minimum Ignition
-1.5-1.0-0.50.00.51.01.52.02.53.03.5
0.0 1.0 2.0 3.0 4.0 5.0 6.0
(τ/ms )
E ig/mJ
OLD Methanol @ 27.5C
50/50 Isopropanol/Methanol@ 27.5C90/10 Isopropanol/Methanol@ 27.5CMinimum Spark Line ~ NoFuel
Methanol
Methanol/Isopropanol
Isopropanol
Minimum Spark in Air
21Glenn Research Center at Lewis Field
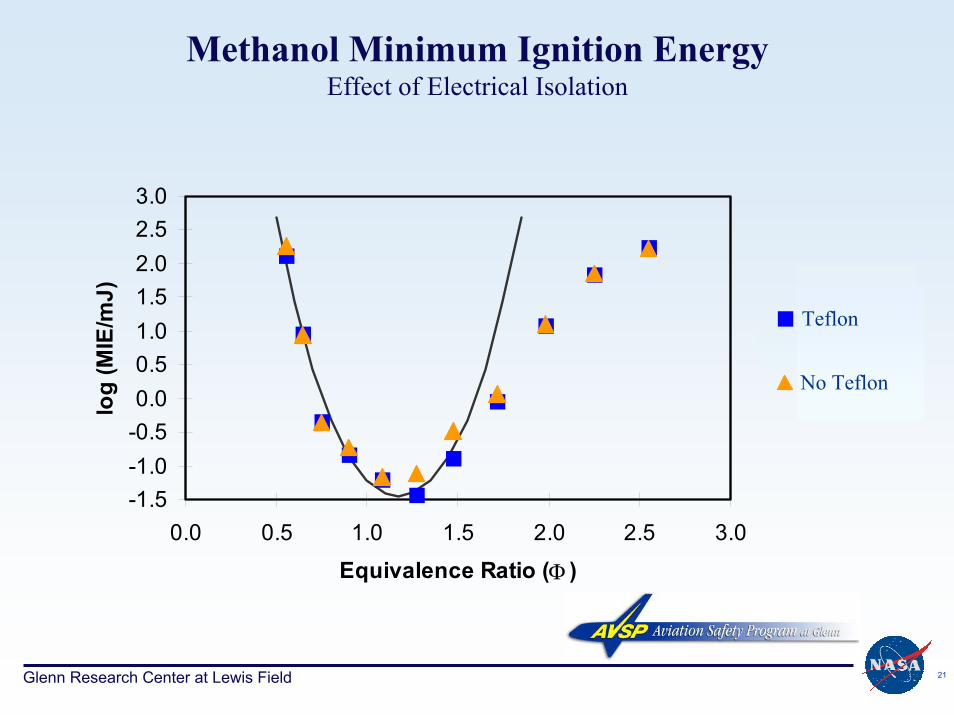
-1.5-1.0-0.50.00.51.01.52.02.53.0
0.0 0.5 1.0 1.5 2.0 2.5 3.0
Equivalence Ratio (Φ )
log
(MIE
/mJ)
Series1Series2Series3
Methanol Minimum Ignition EnergyEffect of Electrical Isolation
Teflon
No Teflon

22Glenn Research Center at Lewis Field
22.5 oC 25.0 oC 27.5 oC 32.5oC
Methanol MIE vs Spark Duration
-1.5
-0.5
0.5
1.5
2.5
3.5
0 1 2 3 4 5 6
log (τ/µs)
log
(Eig
/ m
J)
12.5 oC 14.5 oC 17.5 oC 20.0 oC

23Glenn Research Center at Lewis Field
-2.0
-1.0
0.0
1.0
2.0
3.0
4.0
5.0
0.0 1.0 2.0 3.0
Equivalence Ratio (Φ )
log
(MIE
/mJ)
Poly.
Methanol Minimum Ignition EnergyEffect of Varying Spark Duration
10 µs
100 µs
1000 µs
Actual Minima

24Glenn Research Center at Lewis Field
Iso-Octane MIE @ 210CEffect of Varying Spark Duration
10
100
1000
10000
10 100 1000 10000 100000
Spark Duration (µs)
Min
imum
Igni
tion
Ener
gy (m
J)

25Glenn Research Center at Lewis Field
More Than Enough Energy

26Glenn Research Center at Lewis Field
MIE Curves for Methanol and Iso-Octane
0.01
0.1
1
10
100
1000
0 1 2 3 4 5
Equivalence Ratio
Min
imum
Ign
ition
Ene
rgy
Iso-Octane Methanol All Spark Durations
27Glenn Research Center at Lewis Field
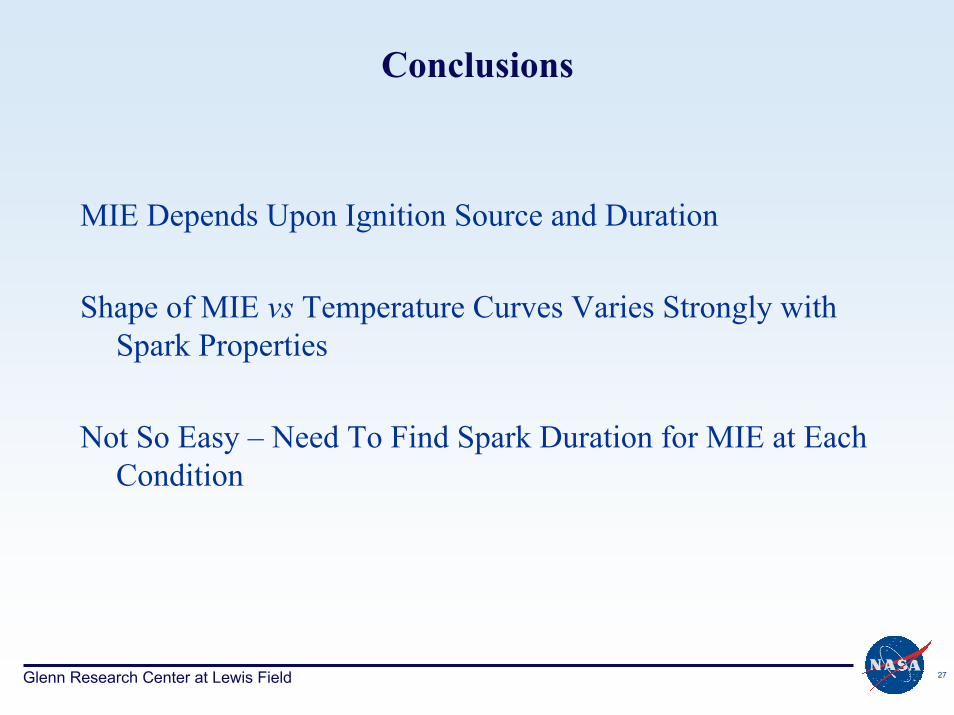
Conclusions
MIE Depends Upon Ignition Source and Duration
Shape of MIE vs Temperature Curves Varies Strongly with Spark Properties
Not So Easy – Need To Find Spark Duration for MIE at Each Condition