PROSPECTS ON BALANCED REGIONAL DEVELOPMENT IN KARNATAKA GOPAL K KADEKODI.
PROBLEMS AND PROSPECTS OF SUNFLOWER PRODUCTION IN KARNATAKA
KOMOL SINGHA PARMOD KUMAR KEDAR VISHNU
Agricultural Development and Rural Transformation Centre Institute for Social and Economic Change
Bangalore- 560 072
April 2014
Research Report: IX / ADRTC / 154
ii
CONTENTS
List of Tables iv
List of Figures vi
Acknowledgements vii
Chapter I Introduction 01-11
1.1 Role of Agriculture in State Economy 02
1.2 Importance of Oilseeds in State Agriculture 06
1.3 Problems in Oilseeds Production 09
1.4 Objectives of the Study 10
1.5 Organisation of the Report 11
Chapter II Coverage, Sampling Design and Methodology 12-17
2.1 Coverage and Sampling Design 13
Chapter III Overview of Oilseed Sector 18
3.1 Change in Cropping Pattern in the State: Area Shifts in Major
Crops
18
3.2 Factors Responsible for Changing Cropping Pattern 22
3.3 Growth Trends in Area, Production and Yield of Major Oilseeds 23
3.4 Variability in Area, Production and Productivity of Major Oil-
seeds vis-à-vis Competing Crops in Karnataka and India
46
3.5 Variability in Monthly/Annual Prices of Major Oilseeds and
Edible Oils in the State
51
Chapter IV Problem and Prospects of Oilseeds Production 53-86
4.1 Socio-economic Status of the Sample Households 53
4.2 Main Feature of Sample Households– Land Ownership,
Cropping Pattern
55
4.3 Production, Retention and Marketed Surplus of Oilseed 65
4.4 Economics of Oilseed and Competing Crops 66
4.5 Access to Improved Technology and Markets of Oilseed 79
4.6 Marketing Pattern of Oilseeds 83
4.7 Sources of Technology and Market Information 84
4.8 Suggestions for Improving Production and Productivity of
Sunflower
85
iii
Chapter V Summary, Concluding Remarks and Policy Implication 87-91
5.1 Main Findings 87
5.2 Concluding Remarks 89
5.3 Policy Suggestions 90
References 92-95
iv
LIST OF TABLES Table Tiles Page No.
Table 1.1a Contribution of Agriculture to NSDP in Karnataka 03
Table 1.1b Sectoral Contribution (%) to GSDP of Karnataka and India at
2004-05 prices
04
Table 1.1c Sectoral Growth Rate (Exponential) in Three Decades 05
Table 1.2a Sunflower Crop and its Share to Total Oilseed in Karnataka and
India(Average of 2006-07 to 2010-11)
08
Table 1.2b Sunflower Area, Production and Yield in Karnataka and All
India
08
Table 2.1a Selection of district for primary survey for Sunflower Crop 14
Table 2.1b Detail of selected District, Taluka and Village and Farmers’
Holdings
15
Table 3.1 Total Cropped Area and Percent to GCA of selected Crops in
Karnataka
19
Table 3.2 Share (%) of Each Crop in GCA in Karnataka and India (1970s
to 2000s)
21
Table 3.3a Absolute Change in GCA in Karnataka (area in Lakh hectare) 24
Table 3.3b Absolute and Relative Change in the Area of Major Selected
Crops in Karnataka and India (TE 1993-94 and TE 2009-10)
25
Table 3.3c Absolute and Relative Change in the Area of Major Food-
grains in the Major Districts of Karnataka (TE 1993-94 and TE
2009-10)
27
Table 3.3d Absolute and Relative change in the Area of major Commercial
crops in Karnataka (TE 1993-94 and TE 2009-10)
28
Table 3.3e Growth Trend of Area, Production, and Yield of Oilseeds in
Karnataka
29
Table 3.3f Change in Share (%) of Major three Districts in Oilseeds
Acreage in Karnataka (TE 1993-94 and TE 2009-10)
30
Table 3.3g Change in the Share (%) of Major three Districts Producing
Oilseeds in Karnataka (TE 1993-94 and TE 2009-10)
31
Table 3.3h Irrigated Area (in %) under Oilseeds in Kharif and Rabi
(TE1993-94 to TE2009-10)
33
Table 3.8i Changing Share of Kharif and Rabi Oilseeds Area in Major
Districts (TE 1993-94 and TE 2009-10)
34
Table 3.3j Share of Major Districts in Area under Sunflower in the State 35
Table 3.3k Share of Major Districts in Sunflower Production in Karnataka 37
Table 3.3l Share (%) of Selected Oilseed Crops’ Area and Production to
Total Oilseed in the State in TE 2009-10
38
Table 3.3m Decadal Growth rate of Area, Production and Yield of
Sunflower in Karnataka
39
Table 3.3n Average Area, Production and Yield of Sunflower in Karnataka 39
Table 3.3o Classification of Districts of Karnataka Based on Growth in
Area under Sunflower
41
v
Table Tiles Page No.
Table 3.3p Classification of Districts Based on the Growth in Sunflower
Production
42
Table 3.3q Classification of Districts Based on Yield of Sunflower in the
State
45
Table 3.4a Share of each crop in total GCA in Karnataka and India from
1980s to 2000s decades
47
Table 3.4b Contribution of various crops in total value of Agriculture
output (at 2004-05 prices)
48
Table 3.4c Growth Rate of Area under different crops in Karnataka and
India
49
Table 3.4d Growth Rate of Production for Karnataka and India 50
Table 3.4e Growth Rate of Yield for Karnataka and India 51
Table 3.5 Annual Price Variation of Sunflower Crop in Karnataka
(Rs/qtl)
52
Table 4.1a Household Classification by Social Category and Farm Size 53
Table 4.1b Operated Area by Farm Size and Social Categories (Area in
hectare)
54
Table 4.1c Socio-economic Status of Sample Households of Karnataka 55
Table 4.2a Land Ownership Pattern of the Sample Households (Area in
hectare)
56
Table 4.2b Terms of Lease-in Land in Karnataka 57
Table 4.2c Irrigated Area and Sources of Irrigation (Area in %) 58
Table 4.2d Cropping Pattern of the Sample Households (Area in hectare) 59
Table 4.2e Average Yield of Major Crops of sample Households (qtl/ha) 63
Table 4.3 Total Sunflower Oilseed Production, Retention and Sale 66
Table 4.4a Cost of Cultivation and Profitability of Sunflower for Kharif
(Rs/ha)
68
Table 4.4b Cost of Cultivation and Profitability of Sunflower for Rabi
(Rs/ha)
69
Table 4.4c Cost of Cultivation and Profitability of Sunflower for Kharif
and Rabi
73
Table 4.4d Cost and Profitability of Jowar for Kharif season (Rs/ha) 74
Table 4.4e Cost and Profitability of Jowar for Rabi season (Rs/ha) 76
Table 4.4f Cost and Profitability of Jowar for Kharif and Rabi combine
Season
78
Table 4.4g Profitability vis-à-vis Risks in Sunflower Production of
Sample Farmers
79
Table 4.5a Access to Improved Technology and Markets (in % of Sample
HH)
80
Table 4.5b Constraints Index in Cultivation of Oilseeds Crops
(Sunflower)
82
Table 4.6 Sale Pattern of Sunflower 83
Table 4.7 Sources of Technology and Market Information of Sunflower 85
Table 4.8 Suggestions for Improving Production and Productivity of
Sunflower
86
vi
LIST OF FIGURES
Figure 2.1.a State-wise Share of Sunflower in Area and Production in India 13
Figure2.1.b Household Sample Selection Procedure for Primary Field survey 15
Figure 3.1 Growth Trend of Area under Sunflower and Total Oilseed in
Karnataka
20
Figure 3.3a Share of Major Districts in Area of Sunflower in the State (TE
1993-94 and TE2009-10)
36
Figure 3.3b Share of Major Districts in Sunflower Production in Karnataka 38
vii
ACKNOWLEDGEMENTS
The present study entitled "Problems and Prospects of Sunflower Production in Karnataka" was
entrusted by the Ministry of Agriculture, Government of India, New Delhi. It is part of a larger
project coordinated by the CMA, IIM Ahmadabad to evaluate the problems and prospects of
Oilseed production in the country. For the State of Karnataka, the Sunflower was identified as the
most dominant oilseed crop and the same was selected for in-depth study.
Agricultural Development and Rural Transformation Centre (ADRTC), ISEC, Bangalore was
assigned for detail study of the crop in Karnataka. The study received immense support from the
farmers who cultivate sunflower crop in the State. Also, the officials of the Ministry of
Agriculture, Government of India and Department of Agriculture, Government of Karnataka
were very supportive while completing this project. We sincerely thank all of them for their kind
support and cooperation. We also would like to thank the Director, ISEC, Bangalore for unstinted
support and encouragement. Last but not the least, support of Ms. Rohi Choudhary, Research
Assistant, ADRTC and other office staff cannot be bypassed.
Authors
1
Problem and Prospects of Oilseed Production in
Karnataka: A Study of Sunflower Crop
Chapter I
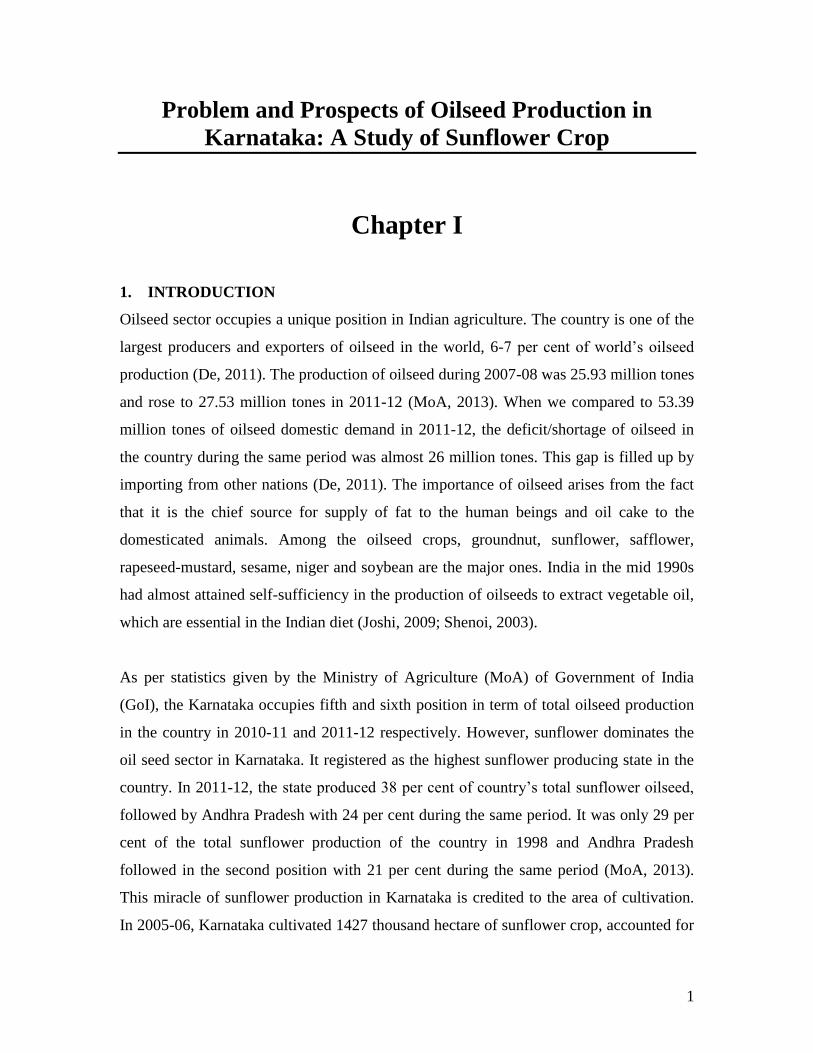
1. INTRODUCTION
Oilseed sector occupies a unique position in Indian agriculture. The country is one of the
largest producers and exporters of oilseed in the world, 6-7 per cent of world’s oilseed
production (De, 2011). The production of oilseed during 2007-08 was 25.93 million tones
and rose to 27.53 million tones in 2011-12 (MoA, 2013). When we compared to 53.39
million tones of oilseed domestic demand in 2011-12, the deficit/shortage of oilseed in
the country during the same period was almost 26 million tones. This gap is filled up by
importing from other nations (De, 2011). The importance of oilseed arises from the fact
that it is the chief source for supply of fat to the human beings and oil cake to the
domesticated animals. Among the oilseed crops, groundnut, sunflower, safflower,
rapeseed-mustard, sesame, niger and soybean are the major ones. India in the mid 1990s
had almost attained self-sufficiency in the production of oilseeds to extract vegetable oil,
which are essential in the Indian diet (Joshi, 2009; Shenoi, 2003).
As per statistics given by the Ministry of Agriculture (MoA) of Government of India
(GoI), the Karnataka occupies fifth and sixth position in term of total oilseed production
in the country in 2010-11 and 2011-12 respectively. However, sunflower dominates the
oil seed sector in Karnataka. It registered as the highest sunflower producing state in the
country. In 2011-12, the state produced 38 per cent of country’s total sunflower oilseed,
followed by Andhra Pradesh with 24 per cent during the same period. It was only 29 per
cent of the total sunflower production of the country in 1998 and Andhra Pradesh
followed in the second position with 21 per cent during the same period (MoA, 2013).
This miracle of sunflower production in Karnataka is credited to the area of cultivation.
In 2005-06, Karnataka cultivated 1427 thousand hectare of sunflower crop, accounted for
2
61 per cent of the country’s total sunflower area. It was followed by Andhra Pradesh with
19 per cent of the country’s total sunflower area. However, Karnataka’s share to the
country’s total area of sunflower reduced to 52 per cent in 2011-12 (MoA, 2013).
Sunflower crop is a drought tolerant crop and suitable for dry land farming (Norwood,
1999; Mündel, 2009). Also, Karnataka is found to be the second largest dry-land in the
country next to Rajasthan (Khan, 2013). This made Karnataka on the top in term of
sunflower cultivation in the country. Unfortunately, despite the state’s contribution of
sunflower crop in the country, the yield rate of this crop is relatively lower than the
national level. For instance, in 2010-11, the yield level of sunflower in Karnataka was
621 kg/ha compared to 1441 kg/ha in Bihar and 701 kg/ha in all India level. In the
following year (2011-12), Karnataka’s sunflower yield rate was still lower and registered
at 503 kg/ha. During the same period, in all India level, the yield rate of sunflower was
692 kg/ha and 1420 kg/ha in Bihar (MoA, 2013). This clearly indicates that the state has
got the room to improve the production and productivity of sunflower crop in the
country. This is the area where we need to emphasise and detail analysis will be made in
the following sections.
1.1. Role of Agriculture in State Economy
Karnataka is known for its rich biodiversity in India. The State has been identified as one
of the 10 agro-climatic zones, suited for the majority of agricultural and horticultural
crops (GoK, 2011). Despite a paradigm shift in economic activities from agriculture to
non-agriculture sectors in recent years in the State, the growing need for increase in
agricultural production and productivity has been greatly felt with the growth of the
population not only for food security but also for generating employment. The sector still
plays an important role in the overall development of the State and supports nearly 65 per
cent of the State’s population (GoK, 2012).
In Karnataka, though the share of agriculture to the State’s economy has been declining,
the share of it still remains very large, lingers around 14 per cent of the State’s Net State
Domestic Product (NSDP) in 2010-11. Within the primary sector, during the Tenth Plan
3
period, agriculture occupied the largest share but the growth rate of it during the period
was at the bottom at 1.4 per cent. However, the employment level was found to be
declining marginally from 65 per cent in 1993 to 61 per cent in 2005 (Singha and
Chakraborty, 2013a). This implies that the population pressure on agriculture is still very
high and the sector requires major shift in overall development for the development of
state’s economy and employment of the rural community.
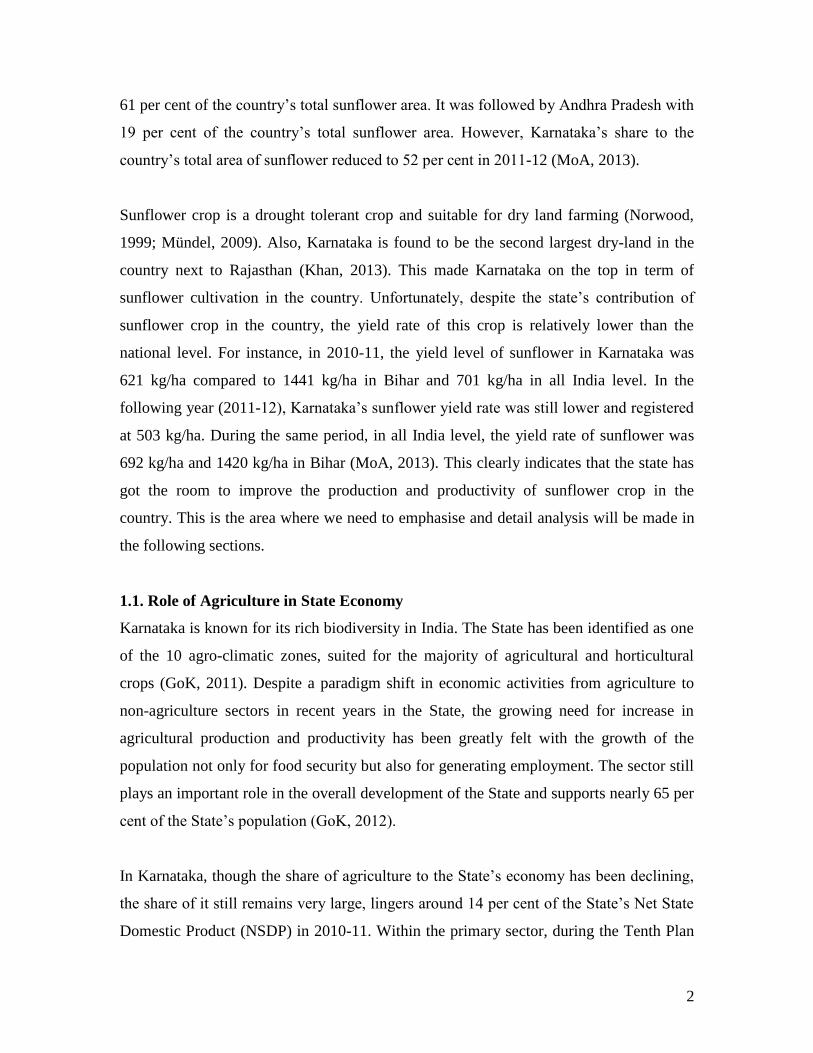
From the Table 1.1a we can summarize that the contribution (in term of per cent) of
agriculture to the State income (NSDP at 2004-05 constant prices) has declined from 25
per cent in 1999-00 to 13.6 per cent in 2010-11 compared to 14.4 per cent of all India
level (for 2010-11 at 2004-05 prices). The growth rate of agriculture during this period
(1999-00 to 2010-11) was hardly 1.9, while the growth rate of NSDP was 6.8 per cent
during the same period.
Table 1.1a: Contribution of Agriculture to NSDP in Karnataka
Year Agriculture
NSDP
(‘000 lakh)
Share of Agriculture
to NSDP
(in %)
NSDP (in Rs
‘000 lakh)
1999-00 3055.9 25.0 12231.1
2000-01 2810.1 22.8 12312.7
2001-02 2441.3 19.5 12536.0
2002-03 2225.6 16.9 13208.3
2003-04 1890.5 14.0 13465.5
2004-05 2438.3 16.4 14829.9
2005-06 2720.5 16.6 16367.0
2006-07 2614.8 14.4 18109.0
2007-08 2997.1 14.7 20345.4
2008-09 3005.3 14.0 21535.5
2009-20 3044.7 13.8 22020.6
2010-11 3237.3 13.6 23789.0
Growth Rate 1.9 -- 6.8*
Note: Figures are at the Factor Cost at 2004-05 Prices; NSDP implies Net State Domestic Product
* Significant at 5 % level
Source: RBI (2011); Planning Commission (2011)
The coefficient correlation between the growth trend of agriculture’s share and NSDP
was also found to be 0.633 and is statistically significant at p < 0.05 (Singha and
4
Chakraborty, 2013a). Fortunately, during 2010-11, the State has achieved an all time high
food-grain production of 139.86 lakh tonnes comprising of 124.21 lakh tonnes of cereals
and 15.65 lakh tonnes of pulses. In the recent past, diversification of cultivation from rice
and other conventional crops to cash crops has been noticed. Oilseeds cultivation is one
of them and constitutes one of the important groups of cash crops in the State’s
agriculture. They are the most important sources of supply of edible oils (Karnool, et al.,
2007).
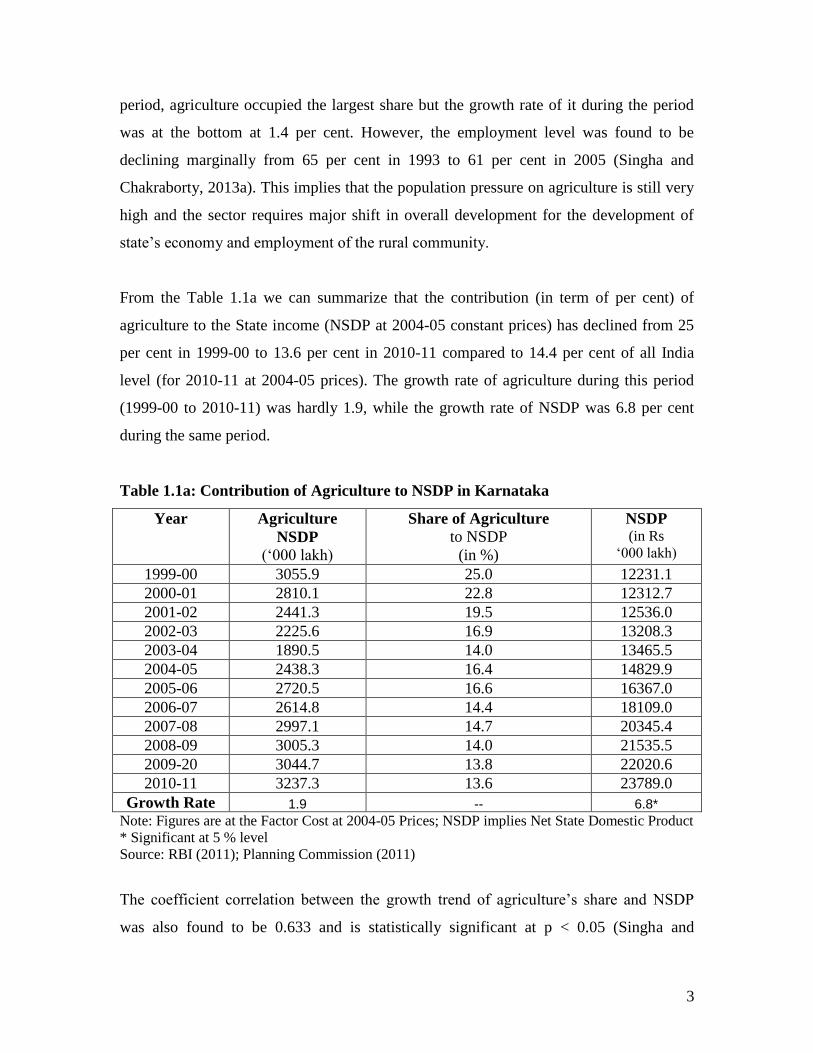
Sectoral contribution (average) of agriculture, industry and service to Gross State
Domestic Product (GSDP) is presented in Table 1.1b. We can see that the contribution of
service sector was at the highest both in the State and all India level. Though the
agriculture and allied sector (primary sector) of the State to GSDP has declined at a faster
rate than the national level from 1980s to 2000s, the contribution of the sector of the State
is at 18.18 per cent during 2001-11, which is slightly above the national level of 17.97
per cent during the same period. The average share of primary sector to total GSDP of
Karnataka was 38.97 per cent in the period of 1981 to 1991. It declined to 31.69 per cent
of GSDP in 1991to 2001 and finally reached to 18.18 in the present decade. As expected
the declined in the share of primary sector was compensated by the service sector almost
at same growth rate in both in the State and all India level.
Table 1.1b: Sectoral Contribution (%) to GSDP of Karnataka and India
(2004-05 prices)
Sectoral Contribution 1981-91 1991-01 2001-11
Karn
ata
ka
Agri, & allied Sector 38.97 31.69 18.18
Secondary Sector 17.71 20.53 20.98
Services Sector 43.32 47.78 60.83
GSDP 100 100 100
All
In
dia
Agri, & allied Sector 32.6 26.76 17.97
Secondary Sector 19.72 20.84 20.21
Services Sector 47.69 52.4 61.82
GDP 100 100 100 Source: Singha and Chakraborty (2013)
5
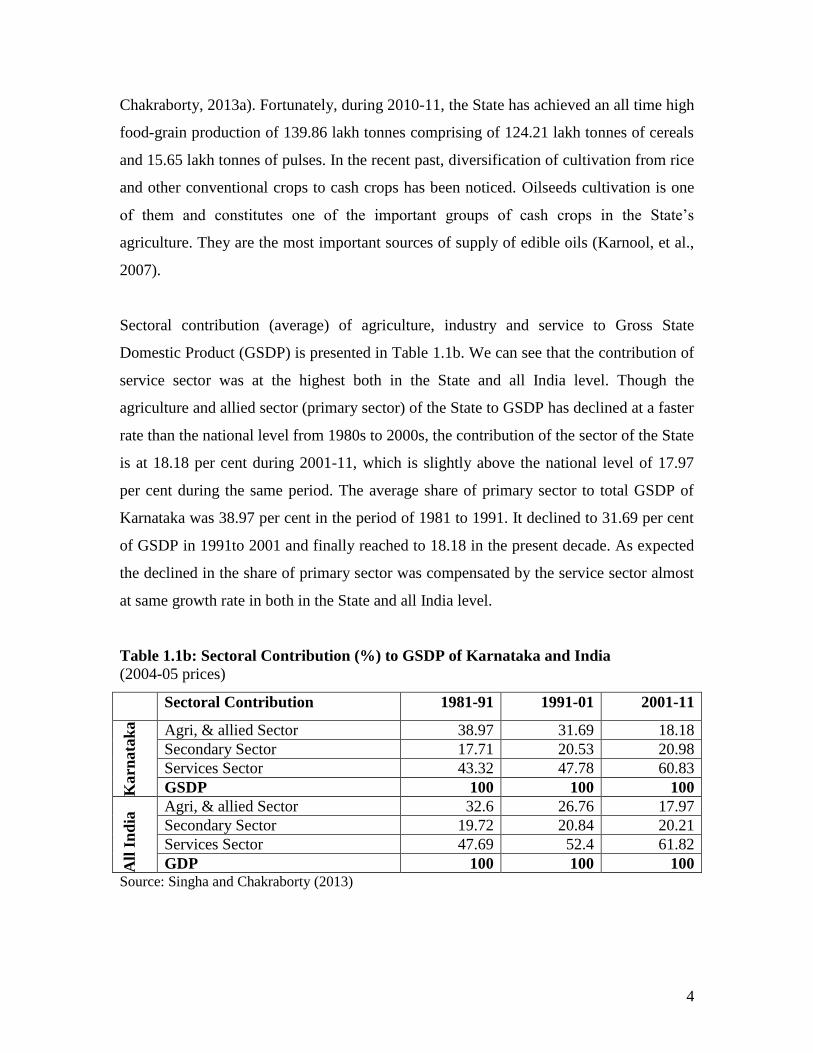
The growth rate of the three major sectors in three decades has been presented in Table
1.1c. The overall GSDP growth rate of Karnataka in last two decades was higher than the
GDP of the country during the same period. In 1981-91, the overall growth rate of
primary sector in Karnataka was 1.62 per cent; while it was 3.05 per cent for all India
level during the same period. Fortunately, the growth rate of primary sector of Karnataka
increased in the following decades at the rate of 3.65 per cent and 4.75 per cent in 1991-
01 and 2001-11 respectively. However, in all India level, it was 3.25 per cent and 3.18
per cent in 1991-01 and 2001-11 respectively, which are slightly lower than Karnataka.
Table 1.1c: Sectoral Growth Rate (Exponential) in Three Decades
Growth Rates 1981-91 1991-01 2001-11
Karn
ata
ka
Agri, & allied Sector 1.62 3.65 4.75
Secondary Sector 7.32 6.84 7.63
Services Sector 6.06 9.57 8.72
GSDP 4.57 7.22 7.77
All
In
dia
Agri, & allied Sector 3.05 3.25 3.18
Secondary Sector 6.28 6.57 7.55
Services Sector 6.40 7.48 9.20
GDP 5.28 6.20 7.18
Note: All the figures are found to be significant at 1% level
Source: Authors’ Estimation from RBI (2011); Planning Commission (2011)
The growth rate industry (secondary) sector of all India level was slowly increasing from
6.28 per cent in first decade (1981-91) to 6.57 in the second decade and finally reached to
7.55 per cent in the present decade (2001-11). However, in Karnataka, it was 7.32 per
cent in 1981-91, reduced to 6.84 per cent in 1991-01 and finally increased to 7.63 per
cent in the last decade (2001-11). As expected, in all India level, the service sector
reported around 6.40 per cent growth rate in 1981-91, rose to 7.48 per cent in 1991-01
and further increased to 9.20 per cent in the last decade. While, in Karnataka, it was
fluctuating, increased from 6.06 per cent in first decade to 9.57 per cent in 1991-01 and
finally reduced to 8.72 per cent in 2001-11. The sector surpassed the growth of industries
6
and agriculture to become fastest growing sector of the Karnataka Economy. Most of the
growth in services has been in information technology (IT), business process outsourcing
(BPO) services and knowledge based activity at National level and Karnataka.
1.2. Importance of Oilseeds in State Agriculture
For almost two decades following the onset of Green Revolution in Indian agriculture,
oilseed has demonstrated a lacklustre performance and at the same time, the demand of
edible oil has increased significantly in the country. The Government of India, in May
1986, appointed a Technological Mission on Oilseed (TMO) to enhance oilseed
production under the Oilseeds Production Programme (OPP) (Gulati, et al., 1996). The
programme was designed to supplement the efforts of the State governments to increase
the production and productivity of various oilseed crops (Deshpande, 2002). As a result
of which, the country achieved a status of ‘self sufficient and net exporter’ during early
nineties, rising from the ‘net importer’ state. This transformation has been termed as “The
Yellow Revolution” and could be primarily attributed to the institutional support,
particularly the set up of the TMO in 1986 (Rai, 1999).
Edible oils play a pivotal role in India. These are the basic food items consumed by the
masses. The industry accounts for a domestic turnover of about Rs 340 billion per annum,
and employs over one million people, directly as well as indirectly (Thilagaraj, 2010). It
also constitutes an important component of Indian households’ expenditure on food.
According to NSS 60th Round (January-June 2004), average monthly per capita
consumption expenditure (MPCE) of edible oil in food was 8.2 per cent in rural India,
and 8.2 per cent in urban India. The share of edible oil has increased in successive NSSO
surveys.1 Edible oil can be extracted from different agricultural products like ground nuts,
Soya-beans, coconuts and sunflowers. However, in India, the agriculturists cultivate
different edible oil crops but do not use them for extracting the oil. Instead, they sell the
grains as raw materials (Thilagaraj, 2010).
1 Refer to: [accessed June 2, 2013: http://mofpi.nic.in/content_printpage.aspx?categoryid=687]
7
India is the fourth largest oils seed producing country in the world, next only to USA,
China and Brazil, harvesting about 25 million tons of oilseeds against the world
production of 250 million tons per annum. Since 1995, Indian share in world production
of oilseeds has been around 10 per cent. Although, India is a major producer of oilseeds,
per capita oil consumption in India is only 10.6 kg/annum which is low compared to 12.5
kg/annum in China, 20.8 kg/annum in Japan, 21.3 kg/annum in Brazil and 48.0 kg/annum
in USA. Many varieties of oils seeds along with tree origin oilseeds are cultivated in
India. Among these, the major oilseeds are Soybean, Cottonseed, Groundnut, Sunflower,
Rapeseed, Sesame seed, Copra, Linseed, Castor seed and Palm Kernels. India occupies
the place of pride as the world's largest producer of Groundnuts, Sesame seeds, Linseeds
and Castor seeds. According to an estimate by National Council of Applied Economic
Research (NCAER), in the year 2000-2001, the demand for edible oil was projected at 10
million tons against the domestic production of 6.7 to 7.0 million tons. The short fall of
3.0- 3.3 million tons was expected to be met by importing edible oil in India. It is
predicted by NCAER that in the year 2015, the demand for edible oil in India would be
20 million tons per annum. Considering the present domestic edible oil supply of 7
million tons per annum, a shortfall of 13 million tons per annum is envisaged in the year
2015. To bridge this gap, a growth rate of 15 % per annum would be required in edible
oil production in the country. Currently, edible oil growth rate in India is only 4%. In the
event of failure to achieve the required growth rate, India would continue to spend huge
foreign exchange on import of edible oil2.
In Karnataka, the share of oilseeds to gross cropped area was about 12 per cent during the
early eighties, and went above 21 per cent during the early nineties, where it stayed
during the decade (Deshpande, 2002). In the late 1990s, State’s share of area under
oilseed to national level had gone down to 8.2 per cent and the share of production was
around 6 per cent of the all India level (Shenoi, 2003). In the State, the area under
oilseeds cultivation from 1992-93 to 2002-03 has gone down by almost 50 per cent. For
2 This paragraph is excerpted from Report on GPDP Project in Edible Oil Industry in India, Chapter I,
National Productivity Council, New Delhi [accessed on June 6, 2013 and available at: http://www.apo-
tokyo.org/gp/31pagpdp/rama/rama_tech01.pdf]
8
instance, the share of oilseed cultivation was 25.64 per cent of the net sown area and it
declined to 12.6 per cent in 2002-03. This situation was mainly attributed to shortage and
ill distribution of rainfall in the State. Out of the land under major oilseeds in Karnataka,
groundnut shared 50.42 per cent and ranked first during 2002-03. Sunflower comes in the
second rank, with a share of 34.47 per cent of the total major oilseed cultivated during
same period (Motebennur, 2012). Therefore, the role of these two crops is very
significant in the sector and the present study concentrates only in sunflower crop in
Karnataka.
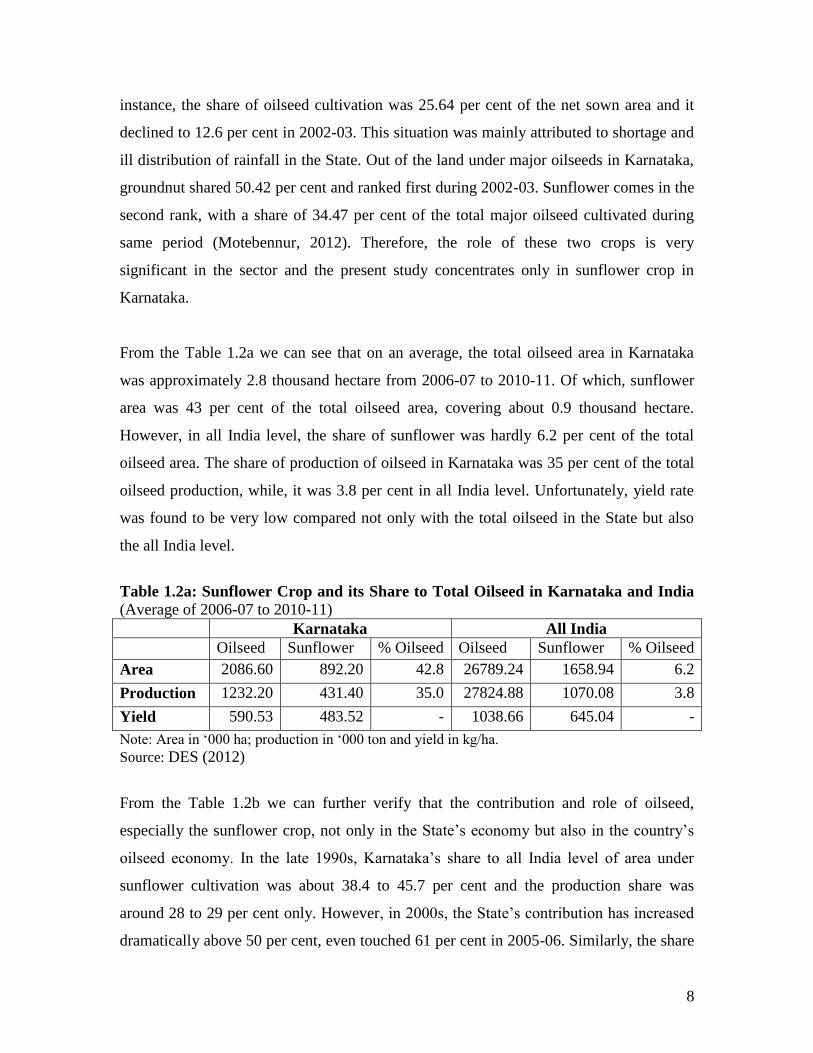
From the Table 1.2a we can see that on an average, the total oilseed area in Karnataka
was approximately 2.8 thousand hectare from 2006-07 to 2010-11. Of which, sunflower
area was 43 per cent of the total oilseed area, covering about 0.9 thousand hectare.
However, in all India level, the share of sunflower was hardly 6.2 per cent of the total
oilseed area. The share of production of oilseed in Karnataka was 35 per cent of the total
oilseed production, while, it was 3.8 per cent in all India level. Unfortunately, yield rate
was found to be very low compared not only with the total oilseed in the State but also
the all India level.
Table 1.2a: Sunflower Crop and its Share to Total Oilseed in Karnataka and India
(Average of 2006-07 to 2010-11)
Karnataka All India
Oilseed Sunflower % Oilseed Oilseed Sunflower % Oilseed
Area 2086.60 892.20 42.8 26789.24 1658.94 6.2
Production 1232.20 431.40 35.0 27824.88 1070.08 3.8
Yield 590.53 483.52 - 1038.66 645.04 -
Note: Area in ‘000 ha; production in ‘000 ton and yield in kg/ha.
Source: DES (2012)
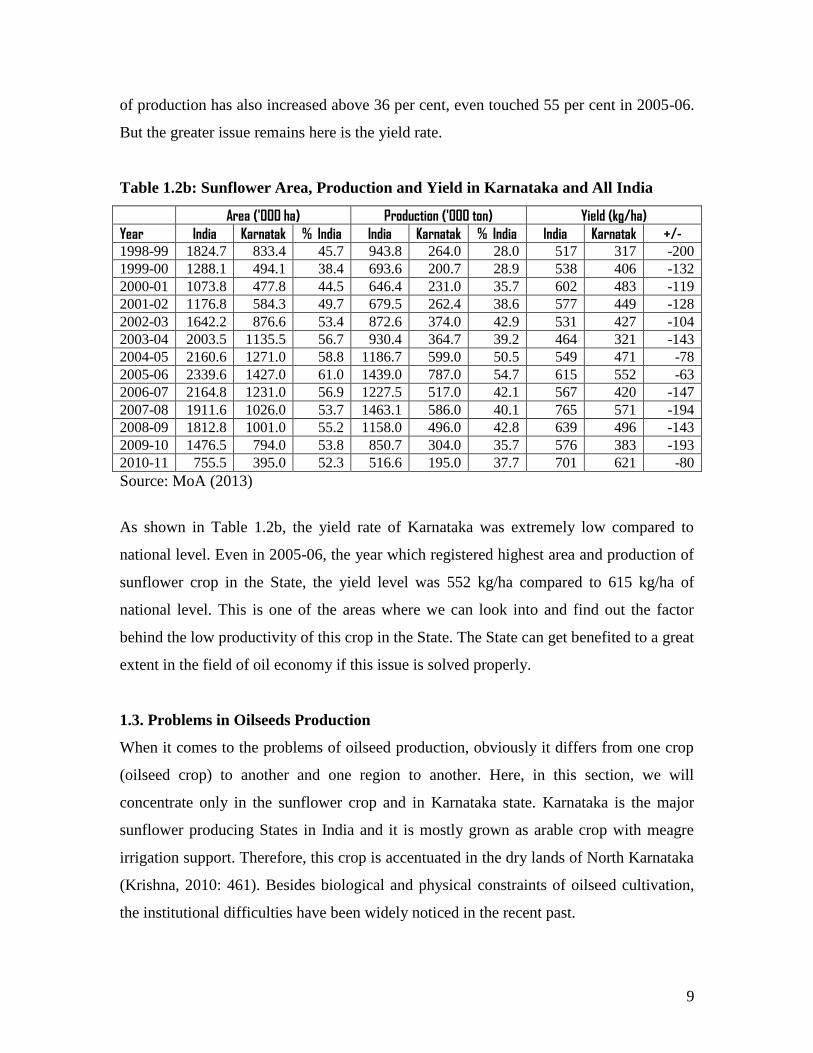
From the Table 1.2b we can further verify that the contribution and role of oilseed,
especially the sunflower crop, not only in the State’s economy but also in the country’s
oilseed economy. In the late 1990s, Karnataka’s share to all India level of area under
sunflower cultivation was about 38.4 to 45.7 per cent and the production share was
around 28 to 29 per cent only. However, in 2000s, the State’s contribution has increased
dramatically above 50 per cent, even touched 61 per cent in 2005-06. Similarly, the share
9
of production has also increased above 36 per cent, even touched 55 per cent in 2005-06.
But the greater issue remains here is the yield rate.
Table 1.2b: Sunflower Area, Production and Yield in Karnataka and All India
Area ('000 ha) Production ('000 ton) Yield (kg/ha)
Year India Karnatak % India India Karnatak % India India Karnatak +/- 1998-99 1824.7 833.4 45.7 943.8 264.0 28.0 517 317 -200
1999-00 1288.1 494.1 38.4 693.6 200.7 28.9 538 406 -132
2000-01 1073.8 477.8 44.5 646.4 231.0 35.7 602 483 -119
2001-02 1176.8 584.3 49.7 679.5 262.4 38.6 577 449 -128
2002-03 1642.2 876.6 53.4 872.6 374.0 42.9 531 427 -104
2003-04 2003.5 1135.5 56.7 930.4 364.7 39.2 464 321 -143
2004-05 2160.6 1271.0 58.8 1186.7 599.0 50.5 549 471 -78
2005-06 2339.6 1427.0 61.0 1439.0 787.0 54.7 615 552 -63
2006-07 2164.8 1231.0 56.9 1227.5 517.0 42.1 567 420 -147
2007-08 1911.6 1026.0 53.7 1463.1 586.0 40.1 765 571 -194
2008-09 1812.8 1001.0 55.2 1158.0 496.0 42.8 639 496 -143
2009-10 1476.5 794.0 53.8 850.7 304.0 35.7 576 383 -193
2010-11 755.5 395.0 52.3 516.6 195.0 37.7 701 621 -80
Source: MoA (2013)
As shown in Table 1.2b, the yield rate of Karnataka was extremely low compared to
national level. Even in 2005-06, the year which registered highest area and production of
sunflower crop in the State, the yield level was 552 kg/ha compared to 615 kg/ha of
national level. This is one of the areas where we can look into and find out the factor
behind the low productivity of this crop in the State. The State can get benefited to a great
extent in the field of oil economy if this issue is solved properly.
1.3. Problems in Oilseeds Production
When it comes to the problems of oilseed production, obviously it differs from one crop
(oilseed crop) to another and one region to another. Here, in this section, we will
concentrate only in the sunflower crop and in Karnataka state. Karnataka is the major
sunflower producing States in India and it is mostly grown as arable crop with meagre
irrigation support. Therefore, this crop is accentuated in the dry lands of North Karnataka
(Krishna, 2010: 461). Besides biological and physical constraints of oilseed cultivation,
the institutional difficulties have been widely noticed in the recent past.
10
The common sunflower, Helianthus annuus L., comprises three main races– 1) H. annuus
ssp. lenticularis, the “wild” sunflower; 2) H. annuus ssp. annuus, the “weed” sunflower;
and 3) H. annuus ssp. macrocarpus, the “giant” sunflower cultivated for its edible seeds
(Heiser, 1955). The last variety is widely used for oilseed cultivation. Basically, the
sunflower crop (H. annuus ssp. Macrocarpus) was domesticated by Native Americans
from wild, common sunflower (also H. annuus) 4000 years ago (Crites, 1993; Heiser,
1955). Basically, the crop Sunflower is relatively a recent introduction in India, which
was first reached in the southern part of the country to improve oilseed production in
1969. Initially, Russian varieties were preferred for cultivation in the region and the
hybrids were introduced in 1980 (Krishna, 2010: 459).
Coming to the problems of oilseed production in Karnataka, not much research has been
done in the area, especially the sunflower crop. One thing is clear that the growth of
oilseed in early 1990s has come from the area expansion of oilseed, especially the
irrigated area and also at the cost of food grain, more at the cost of coarse cereals, in the
country (Gulati, et al., 1996; Chhattrapati, 1980). In this context, Bansil (1997) argued
that this does not cause any decline in the production of food crops. The shift has
primarily been from the low yielding crops. As for the crop of sunflower, it is one of the
completely un-irrigated crops, which are mainly grown in the southern States of the
country including Karnataka. With the expansion of area of cultivation of this crop,
production has also increased significantly in the early nineties and experienced a sharp
declined thereafter. Because of this fluctuating nature, though it is by and large dictated
by seasonal factors, it is very difficult to say with certainly, if there is any positive trend
in this respect (Bansil, 1997). In the national level, opening of oilseed to global trade
competition seems self-sufficiency of this crop under great threat (Gulati, et al., 1996).
Informal field observation revealed that the major problems faced while cultivation of
sunflower crop in Karnataka are the problems of technology, availability of new seeds on
time and other market related issues. However, detail analysis on the problem of
sunflower drawn from primary data will be dealt in chapter IV. In the national level, what
is recognised to be lacking in oilseed production is the adequacy of the extension effort to
match the research output. Lack of proper technological and institutional arrangement left
11
the country’s oil production to vagaries of seasonal factor. Secondly multiplication and
distribution of the new improved seed varieties is the major drawback of this crop
production and productivity in India (Achaya, 1975).
1.4. Objectives of the Study
As the state of Karnataka covers second largest share of dry-land farming in India,
emphasising more on the conventional rain-fed cultivation like paddy is little preferred by
the farmers, especially in the northern Karnataka. Therefore, the crops like maize,
sunflower, tur dal etc., which can survive with little managed irrigation is preferred and
made significant improvement of these crops in the recent past in the state (Singha and
Chakraborty, 2013b). Of the oilseeds, sunflower crop has been performing well in the
state and has become the largest contributor of sunflower crop to the country. Sunflower
cultivation enhances socio-economic conditions of the farmers in Karnataka, especially in
the northern part of the state. The objective of this study centres on the cultivation of this
crop. However, specific objectives of this study are given below:
1. To understand the growth trend of oilseed production over the years, especially
the sunflower crop in Karnataka.
2. To assess the area, production and yield of sunflower crop by different districts of
Karnataka.
3. To identify the major constraints faced by sunflower cultivation/production in
Karnataka.
4. To recommend some possible suggestions to overcome the difficulties faced by
the sunflower farmers in Karnataka.
1.5. Organisation of the Report
For easy grasp and understanding of the readers, the study report is divided into five
sections. The first section covers role of agriculture in the state economy, importance of
oilseed in the state economy and highlight the problems of sunflower cultivation in
Karnataka. In second section, coverage and sampling design of the study and conceptual
framework of oilseed production in the state are given. In the third section, with the help
12
of secondary data, growth trend of oilseed production and growth of sunflower crops in
the state are discussed. The share of oilseed and sunflower in terms of area, production
and yield by Karnataka to national level and inter-district comparison are also made in
this section. Section four concentrates more on the problems of sunflower production in
the state and finally, section five wraps up the report with some suggestions and
conclusion.
13
Chapter II
2. COVERAGE, SAMPLING DESIGN AND METHODOLOGY
This study is based on both the primary and secondary data pertaining to edible oilseed
sector, particularly sunflower crop in Karnataka. In order to assess the overview of
oilseed sector of the state, a substantial amount of secondary data related to area,
production and productivity of oilseeds have been collected from different published
sources. Besides oilseed, information on other major crops in the state has also been
collected. For instances, the total food grains produced and cultivated in the state was
compiled from the Directorate of Economics and Statistics, Government of India. In
order to comprehend the growth trend, the study analyses a disaggregated time series data
from 1960s to 2000s for major oilseeds and total food grains of the state and the country.
Data on cost of cultivation for selected crops were computed from Farm Management
Division, Government of Karnataka and prepared at 1999-00 prices. Data on value of
crop output were compiled from the Central Statistical Organisation, Government of
India. Further, in the analysis, three year average (Triennium ending) of different
variables was calculated to even out the inter-year fluctuations. Growth rates have been
calculated by using the semi-log regression method with respect to time. In order to
identify major constraints in edible oilseed (sunflower) production in the state, primary
data from the households growing oilseeds in the state have been collected and analysed.
Though secondary data have been incorporated, the present study focussed more on the
primary data collected from the field. Former was used to supplement the latter. Main
argument of the study– problem of oilseed production in the state was analysed from the
primary data. Altogether 320 households, cultivating sunflower crop were surveyed from
four districts in 2012 through a well-structured questionnaire. As the state occupies
largest share of sunflower oilseed in the country, the questionnaire was framed on the
issues of sunflower cultivation, harvesting, seed, fertilizer and the problems of
production. Detail criteria for selection of district, block/taluka, village and sample
households have been given below.
14
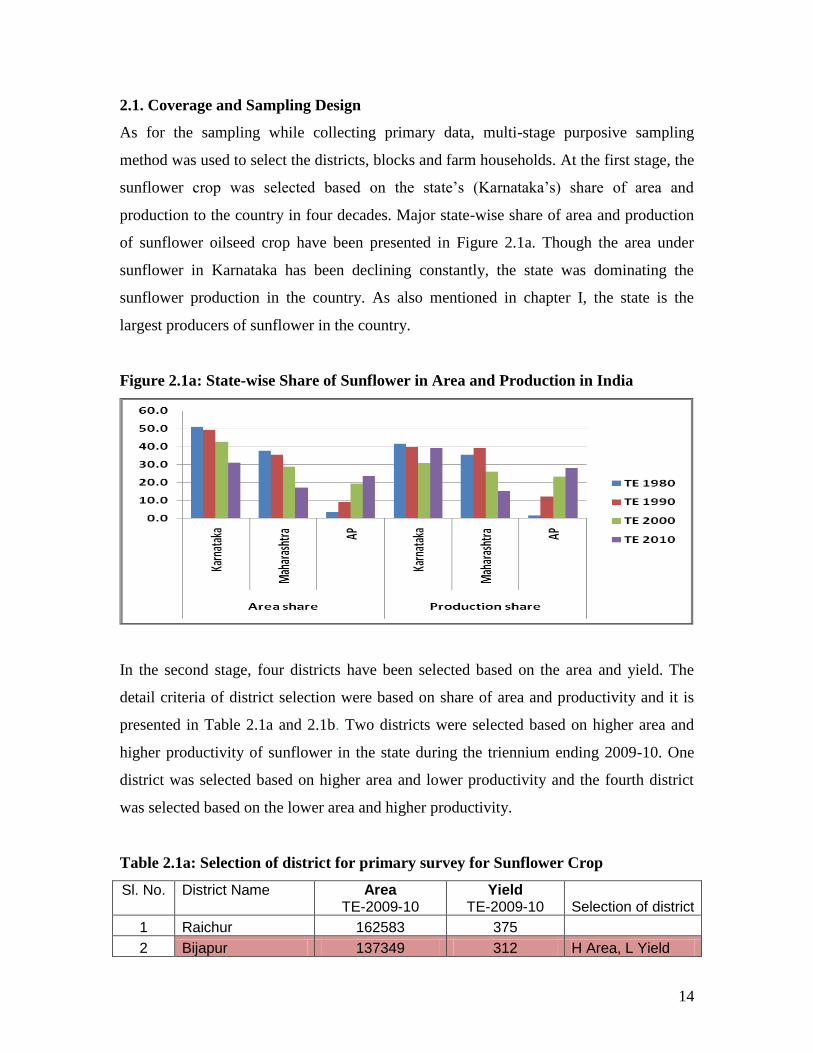
2.1. Coverage and Sampling Design
As for the sampling while collecting primary data, multi-stage purposive sampling
method was used to select the districts, blocks and farm households. At the first stage, the
sunflower crop was selected based on the state’s (Karnataka’s) share of area and
production to the country in four decades. Major state-wise share of area and production
of sunflower oilseed crop have been presented in Figure 2.1a. Though the area under
sunflower in Karnataka has been declining constantly, the state was dominating the
sunflower production in the country. As also mentioned in chapter I, the state is the
largest producers of sunflower in the country.
Figure 2.1a: State-wise Share of Sunflower in Area and Production in India
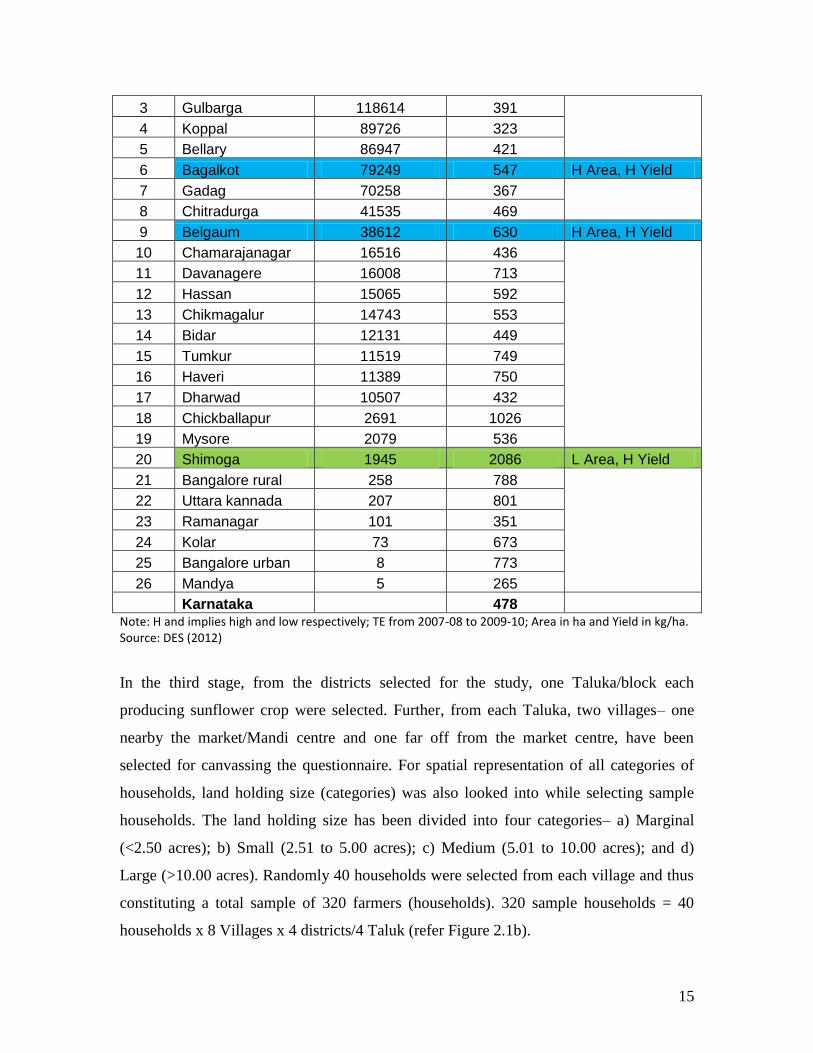
In the second stage, four districts have been selected based on the area and yield. The
detail criteria of district selection were based on share of area and productivity and it is
presented in Table 2.1a and 2.1b. Two districts were selected based on higher area and
higher productivity of sunflower in the state during the triennium ending 2009-10. One
district was selected based on higher area and lower productivity and the fourth district
was selected based on the lower area and higher productivity.
Table 2.1a: Selection of district for primary survey for Sunflower Crop
Sl. No.
District Name
Area TE-2009-10
Yield TE-2009-10 Selection of district
1 Raichur 162583 375
2 Bijapur 137349 312 H Area, L Yield
15
3 Gulbarga 118614 391
4 Koppal 89726 323
5 Bellary 86947 421
6 Bagalkot 79249 547 H Area, H Yield
7 Gadag 70258 367
8 Chitradurga 41535 469
9 Belgaum 38612 630 H Area, H Yield
10 Chamarajanagar 16516 436
11 Davanagere 16008 713
12 Hassan 15065 592
13 Chikmagalur 14743 553
14 Bidar 12131 449
15 Tumkur 11519 749
16 Haveri 11389 750
17 Dharwad 10507 432
18 Chickballapur 2691 1026
19 Mysore 2079 536
20 Shimoga 1945 2086 L Area, H Yield
21 Bangalore rural 258 788
22 Uttara kannada 207 801
23 Ramanagar 101 351
24 Kolar 73 673
25 Bangalore urban 8 773
26 Mandya 5 265
Karnataka 478 Note: H and implies high and low respectively; TE from 2007-08 to 2009-10; Area in ha and Yield in kg/ha. Source: DES (2012)
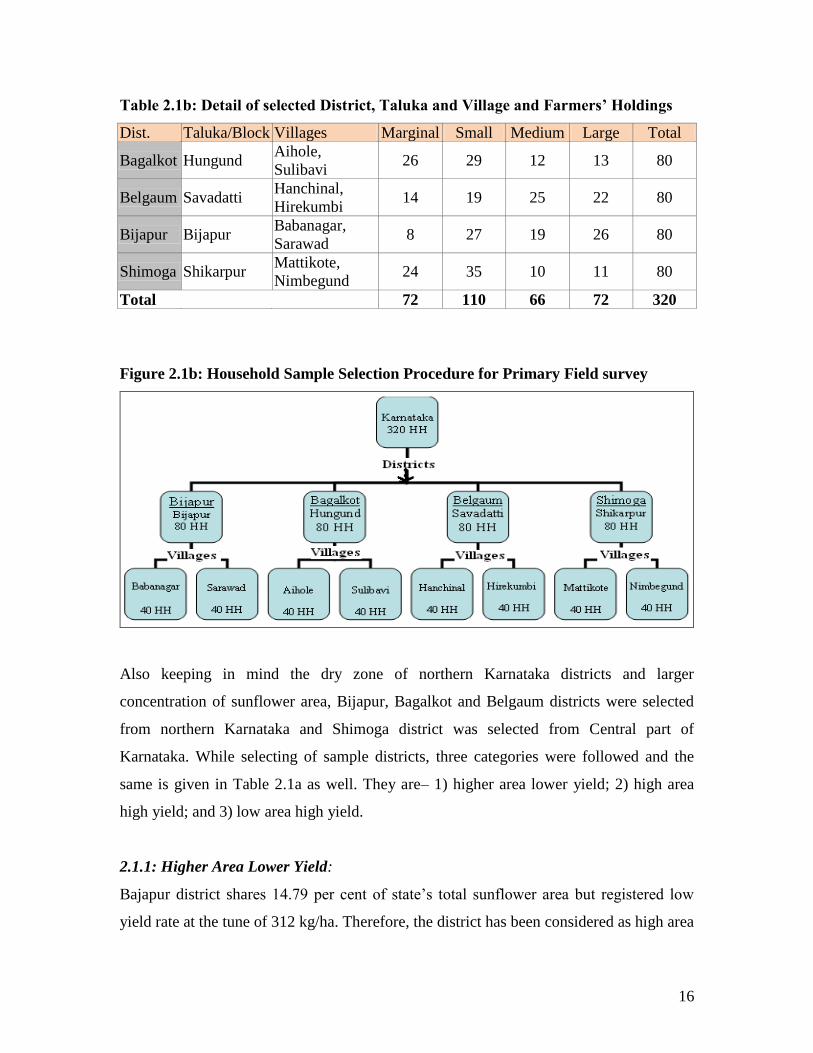
In the third stage, from the districts selected for the study, one Taluka/block each
producing sunflower crop were selected. Further, from each Taluka, two villages– one
nearby the market/Mandi centre and one far off from the market centre, have been
selected for canvassing the questionnaire. For spatial representation of all categories of
households, land holding size (categories) was also looked into while selecting sample
households. The land holding size has been divided into four categories– a) Marginal
(<2.50 acres); b) Small (2.51 to 5.00 acres); c) Medium (5.01 to 10.00 acres); and d)
Large (>10.00 acres). Randomly 40 households were selected from each village and thus
constituting a total sample of 320 farmers (households). 320 sample households = 40
households x 8 Villages x 4 districts/4 Taluk (refer Figure 2.1b).
16
Table 2.1b: Detail of selected District, Taluka and Village and Farmers’ Holdings
Dist. Taluka/Block Villages Marginal Small Medium Large Total
Bagalkot Hungund Aihole,
Sulibavi 26 29 12 13 80
Belgaum Savadatti Hanchinal,
Hirekumbi 14 19 25 22 80
Bijapur Bijapur Babanagar,
Sarawad 8 27 19 26 80
Shimoga Shikarpur Mattikote,
Nimbegund 24 35 10 11 80
Total 72 110 66 72 320
Figure 2.1b: Household Sample Selection Procedure for Primary Field survey
Also keeping in mind the dry zone of northern Karnataka districts and larger
concentration of sunflower area, Bijapur, Bagalkot and Belgaum districts were selected
from northern Karnataka and Shimoga district was selected from Central part of
Karnataka. While selecting of sample districts, three categories were followed and the
same is given in Table 2.1a as well. They are– 1) higher area lower yield; 2) high area
high yield; and 3) low area high yield.
2.1.1: Higher Area Lower Yield:
Bajapur district shares 14.79 per cent of state’s total sunflower area but registered low
yield rate at the tune of 312 kg/ha. Therefore, the district has been considered as high area
17
and lower productivity criteria. Babanagar and Sarawad villages were selected from
Bijapur taluka/block due to higher area under sunflower. The selections of the village
were based on information collected from various department including Directorate of
Economics and Statistics, Agriculture Officer and Gram Panchayat. A total of 40 farmer
households, cultivating sunflower crop have been selected from each village.
2.1.2: Higher Area and Higher Yield:
Bagalkot and Belgaum districts turned out to be the most representative districts of higher
area and higher productivity criteria. Bagalkot district registered around 8.33 per cent of
total area sunflower in the state and reported to have contributed yield of around 547
kg/ha during TE-2009-10. During the same triennium ending, Belgaum district accounted
around 4.02 per cent of total state area of sunflower and reported to have contributed
yield of around 630 kg/ha which is more than 478 kg/ha of state’s yield level. Aihole and
Sulibavi villages from Bagalkot; and Hanchinal and Hirekumbi villages were selected
from Belgaum for primary household survey.
2.1.3: Lower Area and Higher Yield:
The share of Shimoga district in term of area under sunflower crop was as lowest as 0.07
per cent of the state’s total sunflower area during triennium ending of 2009-10. However,
the district reordered highest yield rate (2086 kg/ha) amongst the districts of Karnataka
during the same period. Therefore, this district was selected on the criterion of low area
and high yield. On the basis of the criteria mentioned in section 2.1, two villages–
Mattiikote and Nimbegund villages were selected from this (Shimoga) district.
2.2. Conceptual Framework and Theoretical Model of the Study
Sunflower production is one of the economic activities that can contribute so much to
poverty reduction and hence improve community livelihoods (Zilihona, et al., 2013).
Sunflower can be grown successfully in the dry zone with little managed irrigation. It also
grows well on a wide range of well-drained soils from sandy loam to heavy clays. With
the inception of ‘Bhoo Chetana’ (soil enrichment programme) in 2009 in six districts of
18
Karnataka3 and further expanded to entire State with 50 lakh hectares of land in 2012, the
yield rate of sunflower has increased up to 345 per cent in the dry land areas (Khan,
2013). Farmers find sunflower as a highly profitable crop, especially in Northern
Karnataka. Karnataka is the second largest dry-land area in India after Rajasthan. Due to
its short duration, it is ideally sown more during the month between August and October,
and harvested between the periods of December to February. Now, the State accounts for
nearly half the area under sunflower in the country.
The conceptual framework of this study is based on the conventional theory of
production function where growth of sunflower production is enthused by the land,
labour, capital and organisation. Its growth enhances economic condition of dry-land
farmers of Karnataka where other major foods crops faced lacklustre due to shortage of
water. With the development of technology, mere expansion of area, capital and labour
seem incomplete not only in oil sector but also in other agricultural sectors. Application
of quality seed, fertilizer and other improved processes and stages of production became
necessity in the sector’s development. Based on the aforesaid factors, the households that
adopt effective strategies are likely to increase their income from the crop and thus
improve livelihood. On the other hand, households in dry-land rural areas that do not
adopt effective strategies may likely to remain their income to be low and hence live in
poverty.
3 The six districts are: Kolar, Chikkaballapur, Dharwad, Haveri, Chitradurga and Tumkur
19
Chapter III
3. OVERVIEW OF OILSEED SECTOR
In May 1986, the Government of India started the “Technology Mission on Oilseed and
Pulses” (TMOP) in order to enhance productivity in oilseeds and makes the country a self
sufficient in edible oil sector. As a consequence of which, the Government of Karnataka
approved the implementation of Nation Dairy Development Board's (NDDB) project
“Restructuring Edible Oil and Oilseeds Production and Marketing” in Karnataka keeping
in mind the objectives laid down by the TMOP. The Karnataka Co-operative Oilseeds
Growers Federation Limited (KOF) is entrusted with implementation of the Project, and
it was registered on 26th October 1984 under the Karnataka Co-operative Societies Act.
The project, which was inspired by the Anand Model of Milk Co-operatives, is designed
to create an integrated Co-partite System of production, procurement, processing of
Oilseeds and marketing of edible oil and its by-products. This project aimed at
establishing a direct link between the producer and the consumer by eliminating
middlemen. Village level primary co-operative societies were organised by making the
oilseeds growers as members in turn these primary co-operative societies became the
members of the apex body at the state level till June 1990. During the second phase of the
project, the structure has been re-organised to a three tier cooperative structure with the
village level Oilseeds Growers’ Cooperative societies affiliated to Regional Unions
organized at the district level and in turn the Regional Unions have been affiliated to the
state level Federation4.
3.1. Change in Cropping Pattern in the State: Area Shifts in Major Crops
Development consists of growth with structural changes (Singha, 2013). The rationale of
change in the cropping pattern and structural shift in agriculture in the state is an
indicator of development in the sector. The major shift in state agriculture, in terms of
area, cropping pattern from coarse cereal to commercial crop, production and
productivity, etc., has been noticed in the recent past.
4 This section is excerpted from the report of Karnataka Co-operative Oilseeds Growers Federation
Limited, available at: http://www.kof.co.in/company.html
20
Table 3.1: Total Cropped Area and Percent to GCA of selected Crops in Karnataka
Crop Area (in lakh ha)
TE 1973-74 TE 1983-84 TE 1993-94 TE 2003-04 TE 2010-11
Rice 11.17 11.66 13.20 12.16 15.14
Wheat 3.47 3.29 2.20 2.46 2.69
Total coarse cereals 45.05 43.66 36.08 36.22 36.50
Total cereals 59.69 58.61 54.51 50.84 54.32
Total pulses 13.99 16.00 16.45 19.43 24.53
Total food grain 73.68 74.61 70.97 70.27 78.85
Groundnut 9.53 8.60 12.84 8.39 8.39
Rapeseed and Mustard 0.02 0.03 0.05 0.06 0.05
Soyabean 0.00 0.00 0.36 0.67 1.62
Sunflower 0.24 2.09 12.43 8.63 7.35
Other oilseeds 2.48 4.33 3.92 2.29 1.94
Total oilseeds 12.27 15.06 29.60 20.03 19.34
Cotton 10.76 9.59 5.96 4.39 4.70
Sugarcane 1.07 1.78 2.82 3.44 3.47
Other crops 9.85 11.81 14.78 17.37 20.68
Gross Cropped Area 107.63 112.85 124.13 115.51 127.05
Crops
Percent to Total/Gross Cropped Area
TE 1973-74 TE 1983-84 TE 1993-94 TE 2003-04 TE 2010-11
Rice 10.4 10.3 10.6 10.5 11.9
Wheat 3.2 2.9 1.8 2.1 2.1
Total coarse cereals 41.9 38.7 29.1 31.4 28.7
Total cereals 55.5 51.9 43.9 44.0 42.8
Total pulses 13.0 14.2 13.3 16.8 19.3
Total food grains 68.5 66.1 57.2 60.8 62.1
Groundnut 8.9 7.6 10.3 7.3 6.6
Rapeseed and Mustard 0.0 0.0 0.0 0.0 0.0
Soya bean 0.0 0.0 0.3 0.6 1.3
Sunflower 0.2 1.9 10.0 7.5 5.8
Other oilseeds 2.3 3.8 3.2 2.0 1.5
Total oilseeds 11.4 13.3 23.8 17.3 15.2
Cotton 10.0 8.5 4.8 3.8 3.7
Sugarcane 1.0 1.6 2.3 3.0 2.7
Other crops 9.2 10.5 11.9 15.0 16.3
Gross Cropped Area 100.0 100.0 100.0 100.0 100.0
Source: MoA (2012)
21
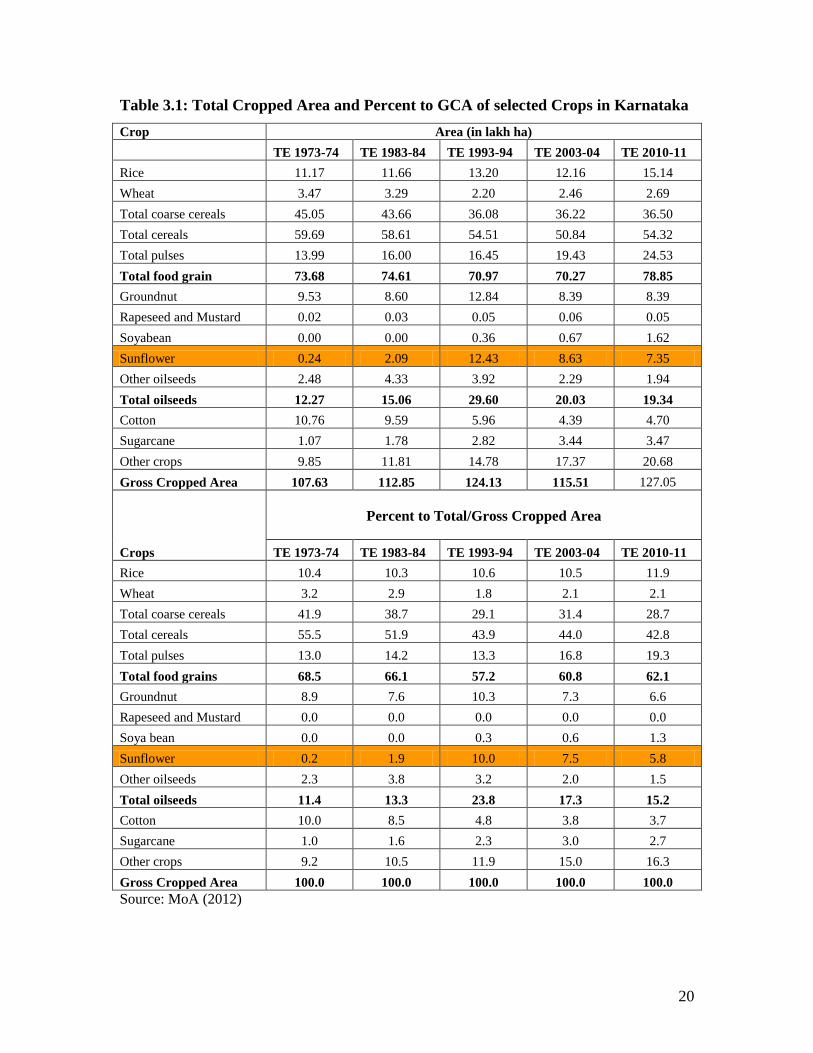
Major crop area and their percent to Gross Crop Area (GCA) in five decades in the state
are presented in Table 3.1. It shows that the total area of oilseed of the state in the early
1970s was 12.27 lakh hectares and rose to 15.06 lakh hectares in early 1980s.
Accordingly, the area of sunflower has also increased from 0.24 lakh hectares in TE-
1973-74 to 2.09 lakh hectares TE-1983-84. From the TE-1993-94, there was a miracle
change in oil seed sector in Karnataka and its contribution to national level was also very
significant. The total area of oilseed in the state in TE-1993-94 was 29.60 lakh hectares
and at the same time the area of sunflower was also rose to 12.43 lakh hectares. However,
after oil miracle in 1990s, the area of oilseed and sunflower crop of the state has been
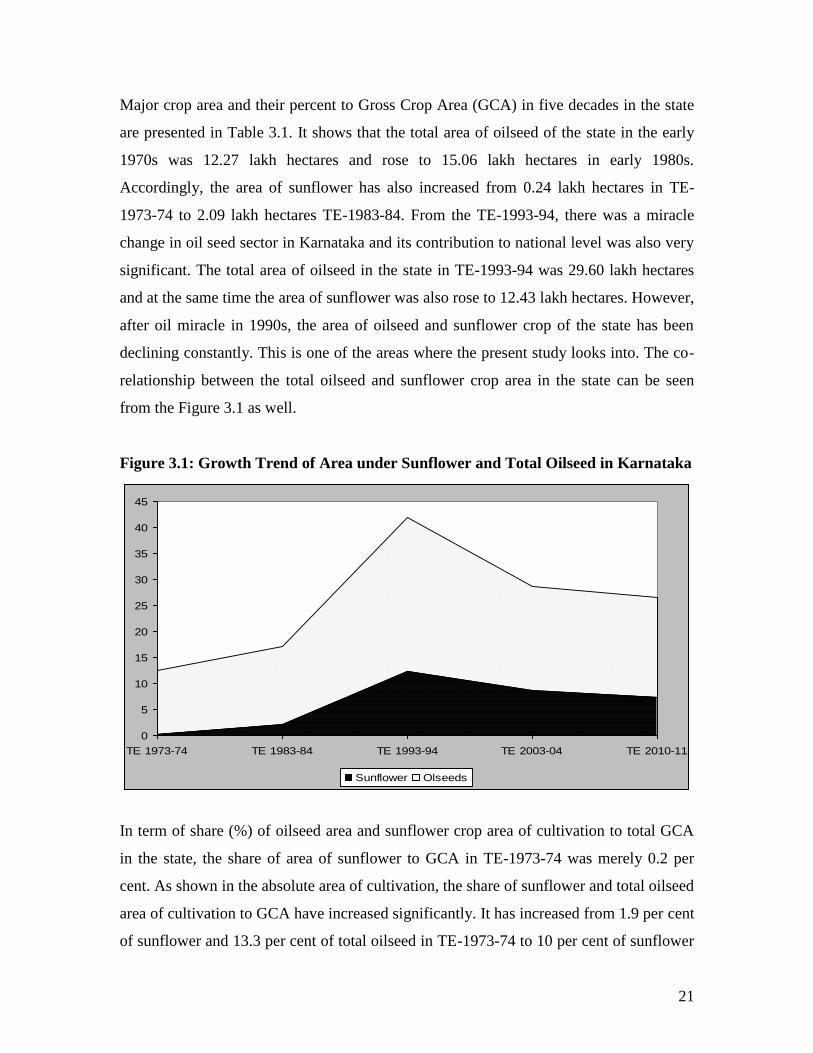
declining constantly. This is one of the areas where the present study looks into. The co-
relationship between the total oilseed and sunflower crop area in the state can be seen
from the Figure 3.1 as well.
Figure 3.1: Growth Trend of Area under Sunflower and Total Oilseed in Karnataka
0
5
10
15
20
25
30
35
40
45
TE 1973-74 TE 1983-84 TE 1993-94 TE 2003-04 TE 2010-11
Sunflower Olseeds
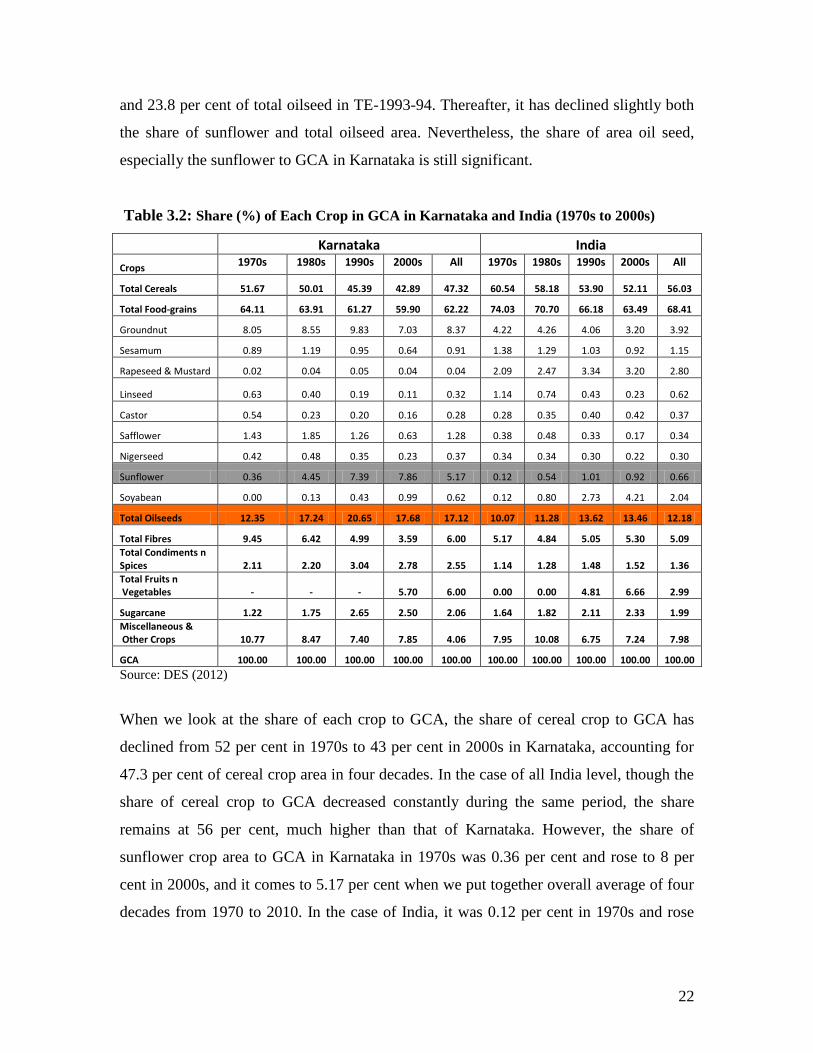
In term of share (%) of oilseed area and sunflower crop area of cultivation to total GCA
in the state, the share of area of sunflower to GCA in TE-1973-74 was merely 0.2 per
cent. As shown in the absolute area of cultivation, the share of sunflower and total oilseed
area of cultivation to GCA have increased significantly. It has increased from 1.9 per cent
of sunflower and 13.3 per cent of total oilseed in TE-1973-74 to 10 per cent of sunflower
22
and 23.8 per cent of total oilseed in TE-1993-94. Thereafter, it has declined slightly both
the share of sunflower and total oilseed area. Nevertheless, the share of area oil seed,
especially the sunflower to GCA in Karnataka is still significant.
Table 3.2: Share (%) of Each Crop in GCA in Karnataka and India (1970s to 2000s)
Karnataka India
Crops 1970s 1980s 1990s 2000s All 1970s 1980s 1990s 2000s All
Total Cereals 51.67 50.01 45.39 42.89 47.32 60.54 58.18 53.90 52.11 56.03
Total Food-grains 64.11 63.91 61.27 59.90 62.22 74.03 70.70 66.18 63.49 68.41
Groundnut 8.05 8.55 9.83 7.03 8.37 4.22 4.26 4.06 3.20 3.92
Sesamum 0.89 1.19 0.95 0.64 0.91 1.38 1.29 1.03 0.92 1.15
Rapeseed & Mustard 0.02 0.04 0.05 0.04 0.04 2.09 2.47 3.34 3.20 2.80
Linseed 0.63 0.40 0.19 0.11 0.32 1.14 0.74 0.43 0.23 0.62
Castor 0.54 0.23 0.20 0.16 0.28 0.28 0.35 0.40 0.42 0.37
Safflower 1.43 1.85 1.26 0.63 1.28 0.38 0.48 0.33 0.17 0.34
Nigerseed 0.42 0.48 0.35 0.23 0.37 0.34 0.34 0.30 0.22 0.30
Sunflower 0.36 4.45 7.39 7.86 5.17 0.12 0.54 1.01 0.92 0.66
Soyabean 0.00 0.13 0.43 0.99 0.62 0.12 0.80 2.73 4.21 2.04
Total Oilseeds 12.35 17.24 20.65 17.68 17.12 10.07 11.28 13.62 13.46 12.18
Total Fibres 9.45 6.42 4.99 3.59 6.00 5.17 4.84 5.05 5.30 5.09
Total Condiments n Spices 2.11 2.20 3.04 2.78 2.55 1.14 1.28 1.48 1.52 1.36
Total Fruits n Vegetables - - - 5.70 6.00 0.00 0.00 4.81 6.66 2.99
Sugarcane 1.22 1.75 2.65 2.50 2.06 1.64 1.82 2.11 2.33 1.99
Miscellaneous & Other Crops 10.77 8.47 7.40 7.85 4.06 7.95 10.08 6.75 7.24 7.98
GCA 100.00 100.00 100.00 100.00 100.00 100.00 100.00 100.00 100.00 100.00
Source: DES (2012)
When we look at the share of each crop to GCA, the share of cereal crop to GCA has
declined from 52 per cent in 1970s to 43 per cent in 2000s in Karnataka, accounting for
47.3 per cent of cereal crop area in four decades. In the case of all India level, though the
share of cereal crop to GCA decreased constantly during the same period, the share
remains at 56 per cent, much higher than that of Karnataka. However, the share of
sunflower crop area to GCA in Karnataka in 1970s was 0.36 per cent and rose to 8 per
cent in 2000s, and it comes to 5.17 per cent when we put together overall average of four
decades from 1970 to 2010. In the case of India, it was 0.12 per cent in 1970s and rose
23
hardly to 0.92 per cent in 2000s, and when we put together of the entire four decades, it
comes to 0.66 per cent of sunflower crop area to GCA.
3.2. Factors Responsible for Changing Cropping Pattern
During the past three to four decades the agriculture sector of Karnataka has undergone a
significant change in terms of technology, area expansion, cropping pattern, cultivation
practices, productivity, and intensity of cultivation. Within the sector, change in the
cropping pattern has been widely noticed. In this context, in earlier periods, the choice of
cropping pattern was guided by agronomic considerations and consumption needs of
farmers, but at present, it seems to be the market forces that determine the direction of
crop selection (Mahesh, 1999). In the national level, the agricultural land remains more or
less constant on one hand and increased in demand for food production due to continuous
growth of population and urbanisation on the other hand, agricultural land has come
under great pressure, resulting in crop intensification and substitution of food crops with
commercial crops (Singha, 2012; Kannan and Sundaram, 2011). In this manner,
Karnataka, the state that was traditionally known for rice cultivation has slowly switched
over to other commercial crops which are easily grown in the dry lands like maize
(Singha and Chakraborty, 2013b; Yogeshwari, 2013). Within the sector, the area of
cultivation of sunflower, maize and onion has expanded at the highest in the recent
decades in the state at the cost of food crops (Kannan and Sundaram, 2011).
According to Ghosh (2011), from early 1990s, as for change in cropping pattern, the
expansion effect could explain 63.67 per cent of the gross cropped area and the remaining
36.33 per cent of the gross cropped area was due to the substitution effect. In the
cropping pattern scenario of India, although the non-food grain crops like oilseeds,
cotton, sugarcane, etc. have been gradually replacing the food grain crops, the cropping
pattern of the country is still dominated by food grain. As of the factors influencing the
cropping pattern, in reality, no single factor can be credited for the change but a number
of factors are responsible for change in cropping pattern in India. To mention a few,
according to Persaud and Landes (2006), area planted to oilseeds has generally responded
to changes in domestic prices associated with changes in trade policy, and in price policy
24
for competing crops. It was supported by the study findings of the scholars like, Singh
(2012); Misana, et al. (2012); Mahesh (1999) that the market demand, public institutional
support through extension services, neighborhood factor and other social factors. Some
other scholars (e.g. Singha, 2013; Goyari, 2005; Mandal, 2010) have credited it to natural
factors like drought, flood, climatic condition, physical soil quality, etc. While a few of
studies (e.g. Kalaiselvi, 2012; Sood, et al., 2003) have acknowledged the factors of
technological and biological advancements that includes irrigation facilities, seed,
fertilizer and also the changing pattern of food habits that is reflected by market price or
demand in the market. However, Chandy (undated) opined that cropping pattern of any
region depends upon physical characteristics as soil, climate, rainfall, etc. Apart from
this, it depends on the nature and availability of irrigation facilities. Besides, physical and
technological factors economic motivations are also important in determining the
cropping pattern. The prices influence the acreage under the crops in two ways. One is
that the variations in the intercrop price disparities led to shifts in acreage between the
crops. Another is that the maintenance of a stable level of prices for a crop provides a
better incentive to the producer to increase the opt put than what a very high level of
price does, if there is no uncertainty of this level being maintained over a number of
years. Similarly, in Karnataka, the factors responsible for changing cropping pattern from
food crops to that of maize and sunflower, has been credited to the natural factor of dry-
land farming due to shortage of rainfall (Singha and Chakraborty, 2013b).
3.3. Growth Trends in Area, Production and Yield of Major Oilseeds
India produces a broad range of oilseeds, ranking among the world’s largest producers of
peanut, rapeseed, soybean, cottonseed, sunflower and other minor oilseeds. Its yields,
however, remain well below world averages, with limited success in sustaining
productivity growth (Persaud and Landes, 2006). The same holds true in the state of
Karnataka vis-à-vis national level, for instance, the yield rates of total oilseed as well as
sunflower were found to be much lower then the national level in the recent decades
(refer Table 1.2a). This section depicts growth trend of area, production and productivity
of major crops and oilseeds including sunflower crop in Karnataka as well as all India
level.
25
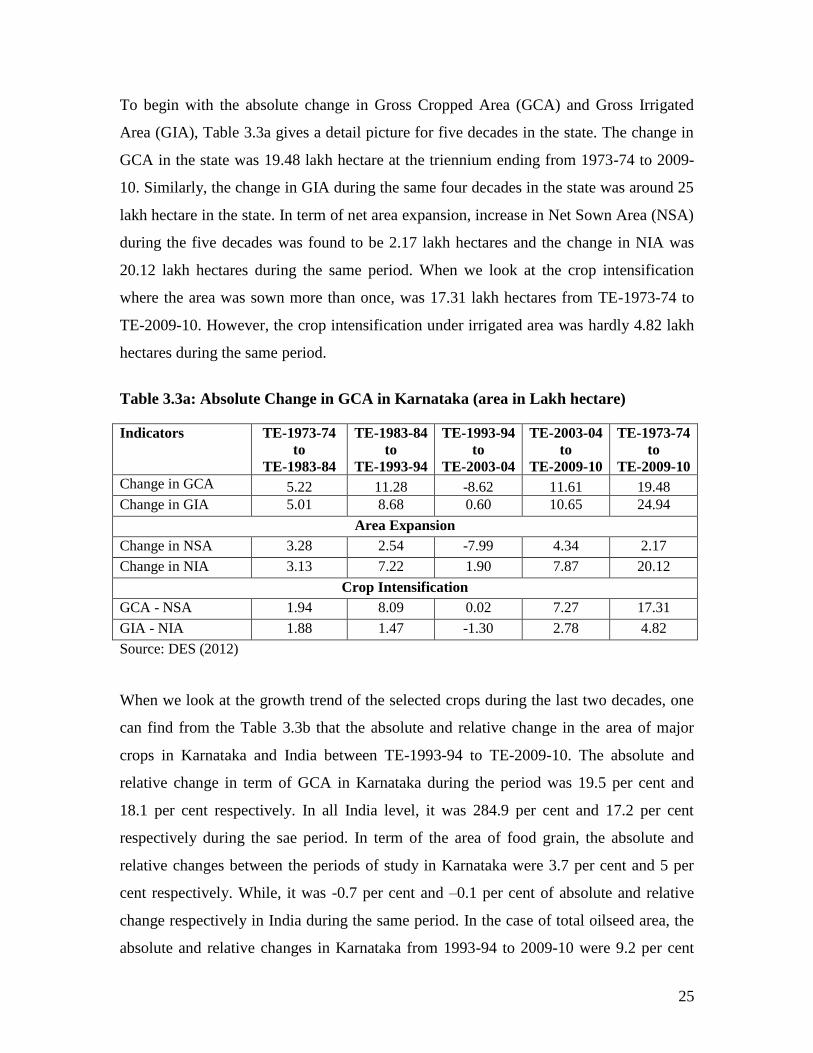
To begin with the absolute change in Gross Cropped Area (GCA) and Gross Irrigated
Area (GIA), Table 3.3a gives a detail picture for five decades in the state. The change in
GCA in the state was 19.48 lakh hectare at the triennium ending from 1973-74 to 2009-
10. Similarly, the change in GIA during the same four decades in the state was around 25
lakh hectare in the state. In term of net area expansion, increase in Net Sown Area (NSA)
during the five decades was found to be 2.17 lakh hectares and the change in NIA was
20.12 lakh hectares during the same period. When we look at the crop intensification
where the area was sown more than once, was 17.31 lakh hectares from TE-1973-74 to
TE-2009-10. However, the crop intensification under irrigated area was hardly 4.82 lakh
hectares during the same period.
Table 3.3a: Absolute Change in GCA in Karnataka (area in Lakh hectare)
Indicators TE-1973-74
to
TE-1983-84
TE-1983-84
to
TE-1993-94
TE-1993-94
to
TE-2003-04
TE-2003-04
to
TE-2009-10
TE-1973-74
to
TE-2009-10
Change in GCA 5.22 11.28 -8.62 11.61 19.48
Change in GIA 5.01 8.68 0.60 10.65 24.94
Area Expansion
Change in NSA 3.28 2.54 -7.99 4.34 2.17
Change in NIA 3.13 7.22 1.90 7.87 20.12
Crop Intensification
GCA - NSA 1.94 8.09 0.02 7.27 17.31
GIA - NIA 1.88 1.47 -1.30 2.78 4.82
Source: DES (2012)
When we look at the growth trend of the selected crops during the last two decades, one
can find from the Table 3.3b that the absolute and relative change in the area of major
crops in Karnataka and India between TE-1993-94 to TE-2009-10. The absolute and
relative change in term of GCA in Karnataka during the period was 19.5 per cent and
18.1 per cent respectively. In all India level, it was 284.9 per cent and 17.2 per cent
respectively during the sae period. In term of the area of food grain, the absolute and
relative changes between the periods of study in Karnataka were 3.7 per cent and 5 per
cent respectively. While, it was -0.7 per cent and –0.1 per cent of absolute and relative
change respectively in India during the same period. In the case of total oilseed area, the
absolute and relative changes in Karnataka from 1993-94 to 2009-10 were 9.2 per cent
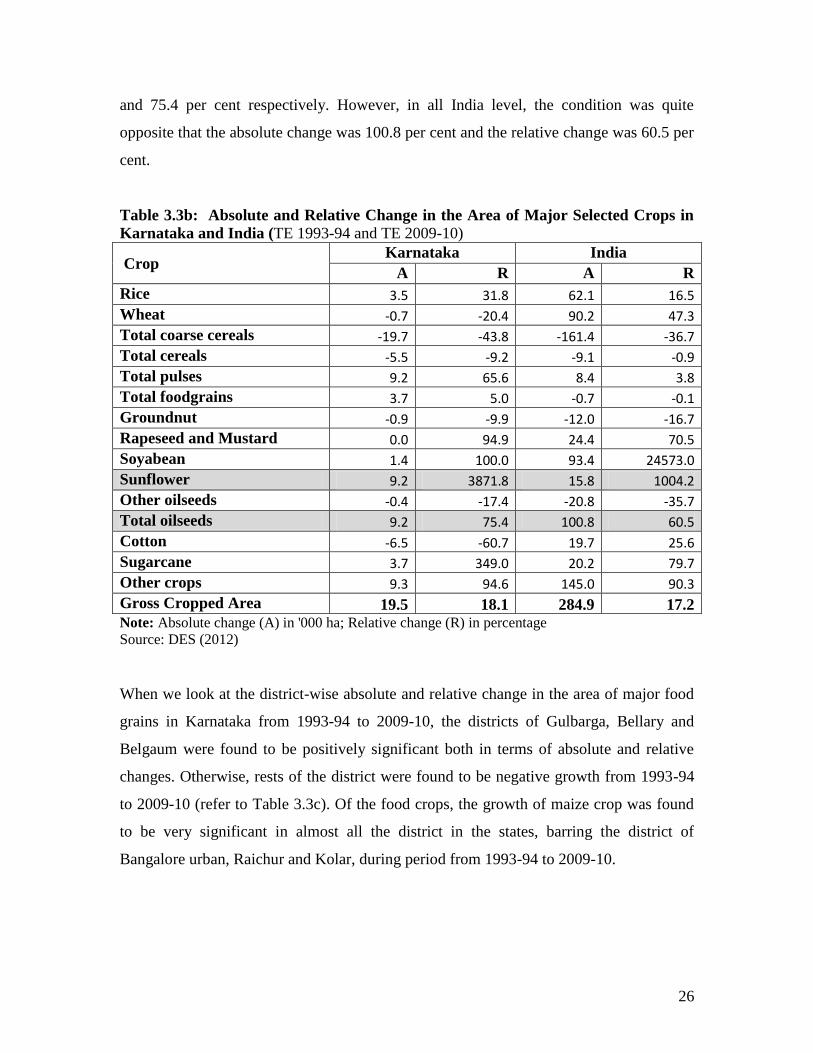
26
and 75.4 per cent respectively. However, in all India level, the condition was quite
opposite that the absolute change was 100.8 per cent and the relative change was 60.5 per
cent.
Table 3.3b: Absolute and Relative Change in the Area of Major Selected Crops in
Karnataka and India (TE 1993-94 and TE 2009-10)
Crop Karnataka India
A R A R
Rice 3.5 31.8 62.1 16.5
Wheat -0.7 -20.4 90.2 47.3
Total coarse cereals -19.7 -43.8 -161.4 -36.7
Total cereals -5.5 -9.2 -9.1 -0.9
Total pulses 9.2 65.6 8.4 3.8
Total foodgrains 3.7 5.0 -0.7 -0.1
Groundnut -0.9 -9.9 -12.0 -16.7
Rapeseed and Mustard 0.0 94.9 24.4 70.5
Soyabean 1.4 100.0 93.4 24573.0
Sunflower 9.2 3871.8 15.8 1004.2
Other oilseeds -0.4 -17.4 -20.8 -35.7
Total oilseeds 9.2 75.4 100.8 60.5
Cotton -6.5 -60.7 19.7 25.6
Sugarcane 3.7 349.0 20.2 79.7
Other crops 9.3 94.6 145.0 90.3
Gross Cropped Area 19.5 18.1 284.9 17.2 Note: Absolute change (A) in '000 ha; Relative change (R) in percentage
Source: DES (2012)
When we look at the district-wise absolute and relative change in the area of major food
grains in Karnataka from 1993-94 to 2009-10, the districts of Gulbarga, Bellary and
Belgaum were found to be positively significant both in terms of absolute and relative
changes. Otherwise, rests of the district were found to be negative growth from 1993-94
to 2009-10 (refer to Table 3.3c). Of the food crops, the growth of maize crop was found
to be very significant in almost all the district in the states, barring the district of
Bangalore urban, Raichur and Kolar, during period from 1993-94 to 2009-10.
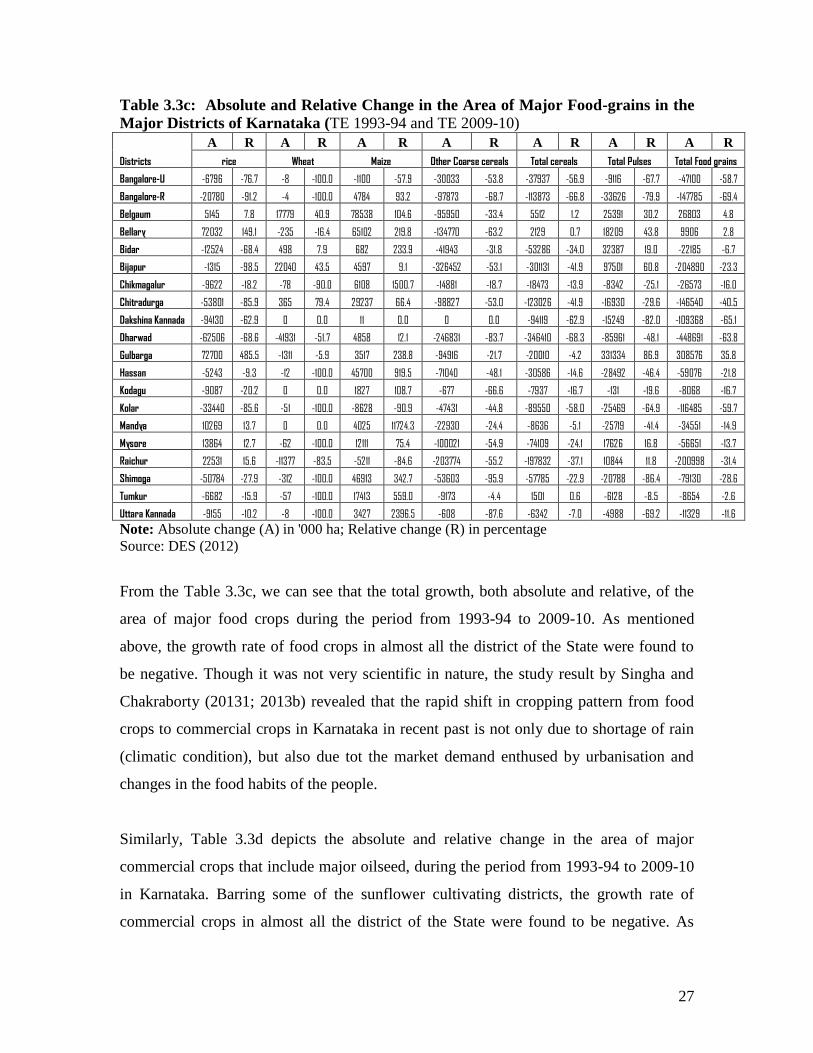
27
Table 3.3c: Absolute and Relative Change in the Area of Major Food-grains in the
Major Districts of Karnataka (TE 1993-94 and TE 2009-10)
Districts
A R A R A R A R A R A R A R
rice Wheat Maize Other Coarse cereals Total cereals Total Pulses Total Food grains
Bangalore-U -6796 -76.7 -8 -100.0 -1100 -57.9 -30033 -53.8 -37937 -56.9 -9116 -67.7 -47100 -58.7
Bangalore-R -20780 -91.2 -4 -100.0 4784 93.2 -97873 -68.7 -113873 -66.8 -33626 -79.9 -147785 -69.4
Belgaum 5145 7.8 17779 40.9 78538 104.6 -95950 -33.4 5512 1.2 25391 30.2 26803 4.8
Bellary 72032 149.1 -235 -16.4 65102 219.8 -134770 -63.2 2129 0.7 18209 43.8 9906 2.8
Bidar -12524 -68.4 498 7.9 682 233.9 -41943 -31.8 -53286 -34.0 32387 19.0 -22185 -6.7
Bijapur -1315 -98.5 22040 43.5 4597 9.1 -326452 -53.1 -301131 -41.9 97501 60.8 -204890 -23.3
Chikmagalur -9622 -18.2 -78 -90.0 6108 1500.7 -14881 -18.7 -18473 -13.9 -8342 -25.1 -26573 -16.0
Chitradurga -53801 -85.9 365 79.4 29237 66.4 -98827 -53.0 -123026 -41.9 -16930 -29.6 -146540 -40.5
Dakshina Kannada -94130 -62.9 0 0.0 11 0.0 0 0.0 -94119 -62.9 -15249 -82.0 -109368 -65.1
Dharwad -62506 -68.6 -41931 -51.7 4858 12.1 -246831 -83.7 -346410 -68.3 -85961 -48.1 -448691 -63.8
Gulbarga 72700 485.5 -1311 -5.9 3517 238.8 -94916 -21.7 -20010 -4.2 331334 86.9 308576 35.8
Hassan -5243 -9.3 -12 -100.0 45700 919.5 -71040 -48.1 -30586 -14.6 -28492 -46.4 -59076 -21.8
Kodagu -9087 -20.2 0 0.0 1827 108.7 -677 -66.6 -7937 -16.7 -131 -19.6 -8068 -16.7
Kolar -33440 -85.6 -51 -100.0 -8628 -90.9 -47431 -44.8 -89550 -58.0 -25469 -64.9 -116485 -59.7
Mandya 10269 13.7 0 0.0 4025 11724.3 -22930 -24.4 -8636 -5.1 -25719 -41.4 -34551 -14.9
Mysore 13864 12.7 -62 -100.0 12111 75.4 -100021 -54.9 -74109 -24.1 17626 16.8 -56651 -13.7
Raichur 22531 15.6 -11377 -83.5 -5211 -84.6 -203774 -55.2 -197832 -37.1 10844 11.8 -200998 -31.4
Shimoga -50784 -27.9 -312 -100.0 46913 342.7 -53603 -95.9 -57785 -22.9 -20788 -86.4 -79130 -28.6
Tumkur -6682 -15.9 -57 -100.0 17413 559.0 -9173 -4.4 1501 0.6 -6128 -8.5 -8654 -2.6
Uttara Kannada -9155 -10.2 -8 -100.0 3427 2396.5 -608 -87.6 -6342 -7.0 -4988 -69.2 -11329 -11.6
Note: Absolute change (A) in '000 ha; Relative change (R) in percentage
Source: DES (2012)
From the Table 3.3c, we can see that the total growth, both absolute and relative, of the
area of major food crops during the period from 1993-94 to 2009-10. As mentioned
above, the growth rate of food crops in almost all the district of the State were found to
be negative. Though it was not very scientific in nature, the study result by Singha and
Chakraborty (20131; 2013b) revealed that the rapid shift in cropping pattern from food
crops to commercial crops in Karnataka in recent past is not only due to shortage of rain
(climatic condition), but also due tot the market demand enthused by urbanisation and
changes in the food habits of the people.
Similarly, Table 3.3d depicts the absolute and relative change in the area of major
commercial crops that include major oilseed, during the period from 1993-94 to 2009-10
in Karnataka. Barring some of the sunflower cultivating districts, the growth rate of
commercial crops in almost all the district of the State were found to be negative. As
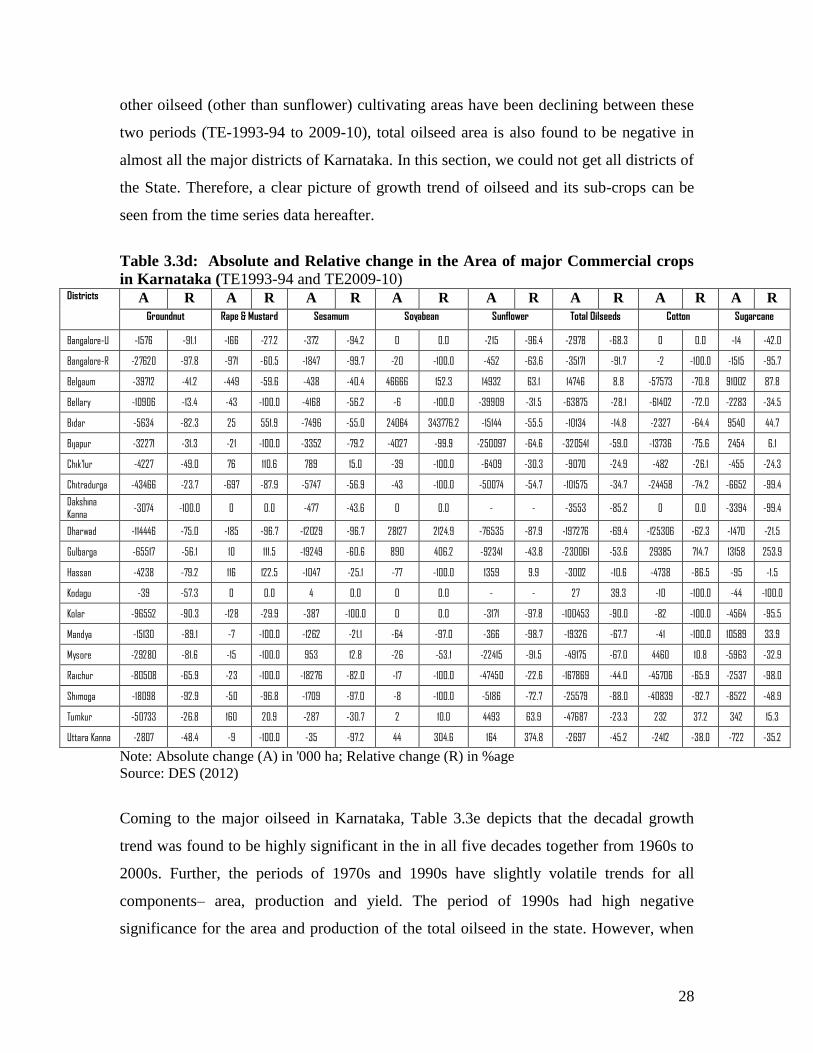
28
other oilseed (other than sunflower) cultivating areas have been declining between these
two periods (TE-1993-94 to 2009-10), total oilseed area is also found to be negative in
almost all the major districts of Karnataka. In this section, we could not get all districts of
the State. Therefore, a clear picture of growth trend of oilseed and its sub-crops can be
seen from the time series data hereafter.
Table 3.3d: Absolute and Relative change in the Area of major Commercial crops
in Karnataka (TE1993-94 and TE2009-10) Districts A R A R A R A R A R A R A R A R
Groundnut Rape & Mustard Sesamum Soyabean Sunflower Total Oilseeds Cotton Sugarcane
Bangalore-U -1576 -91.1 -166 -27.2 -372 -94.2 0 0.0 -215 -96.4 -2978 -68.3 0 0.0 -14 -42.0
Bangalore-R -27620 -97.8 -971 -60.5 -1847 -99.7 -20 -100.0 -452 -63.6 -35171 -91.7 -2 -100.0 -1515 -95.7
Belgaum -39712 -41.2 -449 -59.6 -438 -40.4 46666 152.3 14932 63.1 14746 8.8 -57573 -70.8 91002 87.8
Bellary -10906 -13.4 -43 -100.0 -4168 -56.2 -6 -100.0 -39909 -31.5 -63875 -28.1 -61402 -72.0 -2283 -34.5
Bidar -5634 -82.3 25 551.9 -7496 -55.0 24064 343776.2 -15144 -55.5 -10134 -14.8 -2327 -64.4 9540 44.7
Bijapur -32271 -31.3 -21 -100.0 -3352 -79.2 -4027 -99.9 -250097 -64.6 -320541 -59.0 -13736 -75.6 2454 6.1
Chik’lur -4227 -49.0 76 110.6 789 15.0 -39 -100.0 -6409 -30.3 -9070 -24.9 -482 -26.1 -455 -24.3
Chitradurga -43466 -23.7 -697 -87.9 -5747 -56.9 -43 -100.0 -50074 -54.7 -101575 -34.7 -24458 -74.2 -6652 -99.4
Dakshina Kanna
-3074 -100.0 0 0.0 -477 -43.6 0 0.0 - - -3553 -85.2 0 0.0 -3394 -99.4
Dharwad -114446 -75.0 -185 -96.7 -12029 -96.7 28127 2124.9 -76535 -87.9 -197276 -69.4 -125306 -62.3 -1470 -21.5
Gulbarga -65517 -56.1 10 111.5 -19249 -60.6 890 406.2 -92341 -43.8 -230061 -53.6 29385 714.7 13158 253.9
Hassan -4238 -79.2 116 122.5 -1047 -25.1 -77 -100.0 1359 9.9 -3002 -10.6 -4738 -86.5 -95 -1.5
Kodagu -39 -57.3 0 0.0 4 0.0 0 0.0 - - 27 39.3 -10 -100.0 -44 -100.0
Kolar -96552 -90.3 -128 -29.9 -387 -100.0 0 0.0 -3171 -97.8 -100453 -90.0 -82 -100.0 -4564 -95.5
Mandya -15130 -89.1 -7 -100.0 -1262 -21.1 -64 -97.0 -366 -98.7 -19326 -67.7 -41 -100.0 10589 33.9
Mysore -29280 -81.6 -15 -100.0 953 12.8 -26 -53.1 -22415 -91.5 -49175 -67.0 4460 10.8 -5963 -32.9
Raichur -80508 -65.9 -23 -100.0 -18276 -82.0 -17 -100.0 -47450 -22.6 -167869 -44.0 -45706 -65.9 -2537 -98.0
Shimoga -18098 -92.9 -50 -96.8 -1709 -97.0 -8 -100.0 -5186 -72.7 -25579 -88.0 -40839 -92.7 -8522 -48.9
Tumkur -50733 -26.8 160 20.9 -287 -30.7 2 10.0 4493 63.9 -47687 -23.3 232 37.2 342 15.3
Uttara Kanna -2807 -48.4 -9 -100.0 -35 -97.2 44 304.6 164 374.8 -2697 -45.2 -2412 -38.0 -722 -35.2
Note: Absolute change (A) in '000 ha; Relative change (R) in %age
Source: DES (2012)
Coming to the major oilseed in Karnataka, Table 3.3e depicts that the decadal growth
trend was found to be highly significant in the in all five decades together from 1960s to
2000s. Further, the periods of 1970s and 1990s have slightly volatile trends for all
components– area, production and yield. The period of 1990s had high negative
significance for the area and production of the total oilseed in the state. However, when
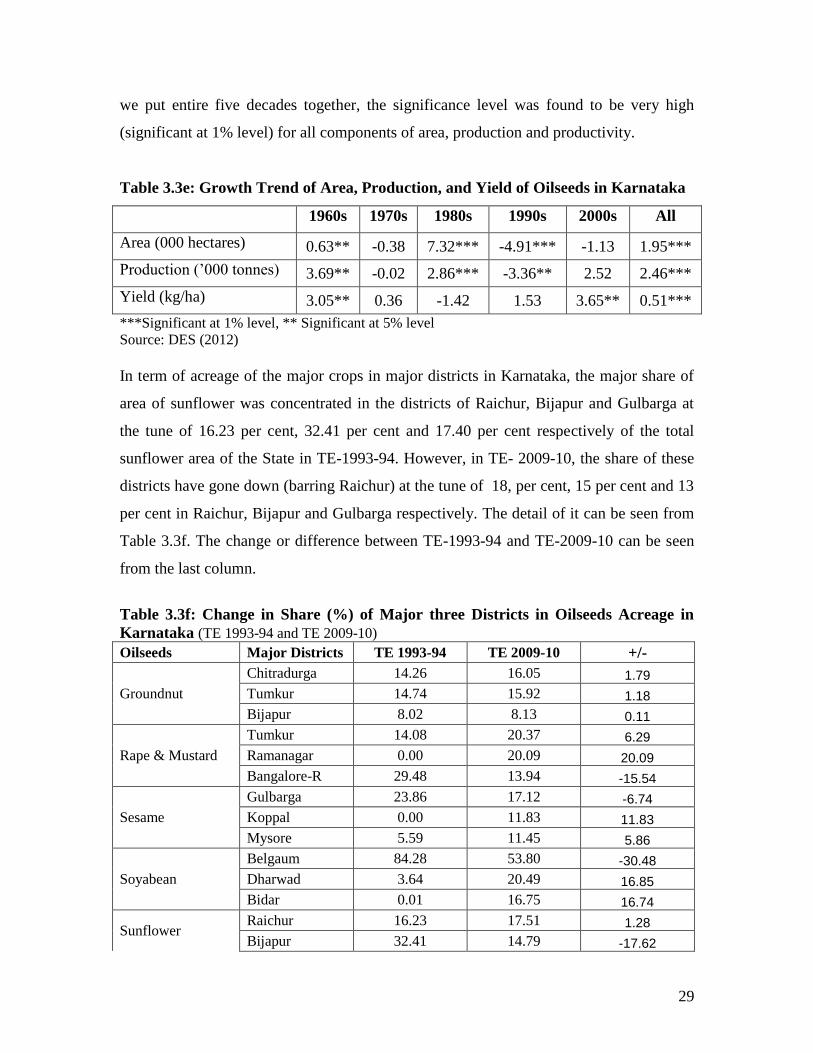
29
we put entire five decades together, the significance level was found to be very high
(significant at 1% level) for all components of area, production and productivity.
Table 3.3e: Growth Trend of Area, Production, and Yield of Oilseeds in Karnataka
1960s 1970s 1980s 1990s 2000s All
Area (000 hectares) 0.63** -0.38 7.32*** -4.91*** -1.13 1.95***
Production (’000 tonnes) 3.69** -0.02 2.86*** -3.36** 2.52 2.46***
Yield (kg/ha) 3.05** 0.36 -1.42 1.53 3.65** 0.51***
***Significant at 1% level, ** Significant at 5% level
Source: DES (2012)
In term of acreage of the major crops in major districts in Karnataka, the major share of
area of sunflower was concentrated in the districts of Raichur, Bijapur and Gulbarga at
the tune of 16.23 per cent, 32.41 per cent and 17.40 per cent respectively of the total
sunflower area of the State in TE-1993-94. However, in TE- 2009-10, the share of these
districts have gone down (barring Raichur) at the tune of 18, per cent, 15 per cent and 13
per cent in Raichur, Bijapur and Gulbarga respectively. The detail of it can be seen from
Table 3.3f. The change or difference between TE-1993-94 and TE-2009-10 can be seen
from the last column.
Table 3.3f: Change in Share (%) of Major three Districts in Oilseeds Acreage in
Karnataka (TE 1993-94 and TE 2009-10)
Oilseeds Major Districts TE 1993-94 TE 2009-10 +/-
Groundnut
Chitradurga 14.26 16.05 1.79
Tumkur 14.74 15.92 1.18
Bijapur 8.02 8.13 0.11
Rape & Mustard
Tumkur 14.08 20.37 6.29
Ramanagar 0.00 20.09 20.09
Bangalore-R 29.48 13.94 -15.54
Sesame
Gulbarga 23.86 17.12 -6.74
Koppal 0.00 11.83 11.83
Mysore 5.59 11.45 5.86
Soyabean
Belgaum 84.28 53.80 -30.48
Dharwad 3.64 20.49 16.85
Bidar 0.01 16.75 16.74
Sunflower Raichur 16.23 17.51 1.28
Bijapur 32.41 14.79 -17.62
30
Gulbarga 17.40 13.01 -4.39
Safflower
Gulbarga 36.36 19.09 -17.27
Bidar 4.84 15.23 10.39
Bijapur 17.80 11.59 -6.21
Niger seed
Mysore 5.40 14.89 9.49
Bidar 27.46 14.26 -13.20
Hassan 5.36 11.97 6.61
Castor seed
Tumkur 18.63 20.10 1.47
Mysore 13.14 15.02 1.88
Hassan 10.12 11.98 1.86
Linseed
Bijapur 54.44 38.22 -16.22
Bagalkote 0.00 22.54 22.54
Belgaum 14.46 11.89 -2.57
Total Oilseeds
Bijapur 18.54 10.36 -8.18
Raichur 12.51 9.87 -2.64
Gulbarga 14.60 9.35 -5.25
Note: +/– Difference from TE-2009-10 to TE-1993-94
Source: DES (2012)
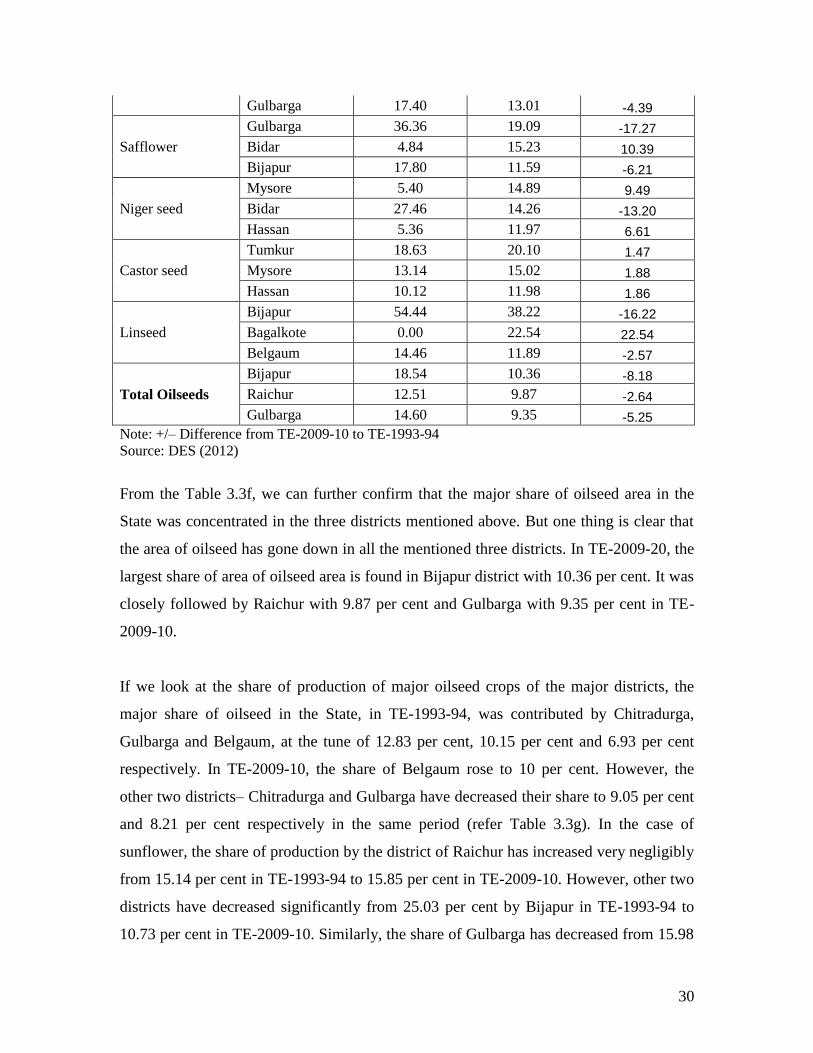
From the Table 3.3f, we can further confirm that the major share of oilseed area in the
State was concentrated in the three districts mentioned above. But one thing is clear that
the area of oilseed has gone down in all the mentioned three districts. In TE-2009-20, the
largest share of area of oilseed area is found in Bijapur district with 10.36 per cent. It was
closely followed by Raichur with 9.87 per cent and Gulbarga with 9.35 per cent in TE-
2009-10.
If we look at the share of production of major oilseed crops of the major districts, the
major share of oilseed in the State, in TE-1993-94, was contributed by Chitradurga,
Gulbarga and Belgaum, at the tune of 12.83 per cent, 10.15 per cent and 6.93 per cent
respectively. In TE-2009-10, the share of Belgaum rose to 10 per cent. However, the
other two districts– Chitradurga and Gulbarga have decreased their share to 9.05 per cent
and 8.21 per cent respectively in the same period (refer Table 3.3g). In the case of
sunflower, the share of production by the district of Raichur has increased very negligibly
from 15.14 per cent in TE-1993-94 to 15.85 per cent in TE-2009-10. However, other two
districts have decreased significantly from 25.03 per cent by Bijapur in TE-1993-94 to
10.73 per cent in TE-2009-10. Similarly, the share of Gulbarga has decreased from 15.98
31
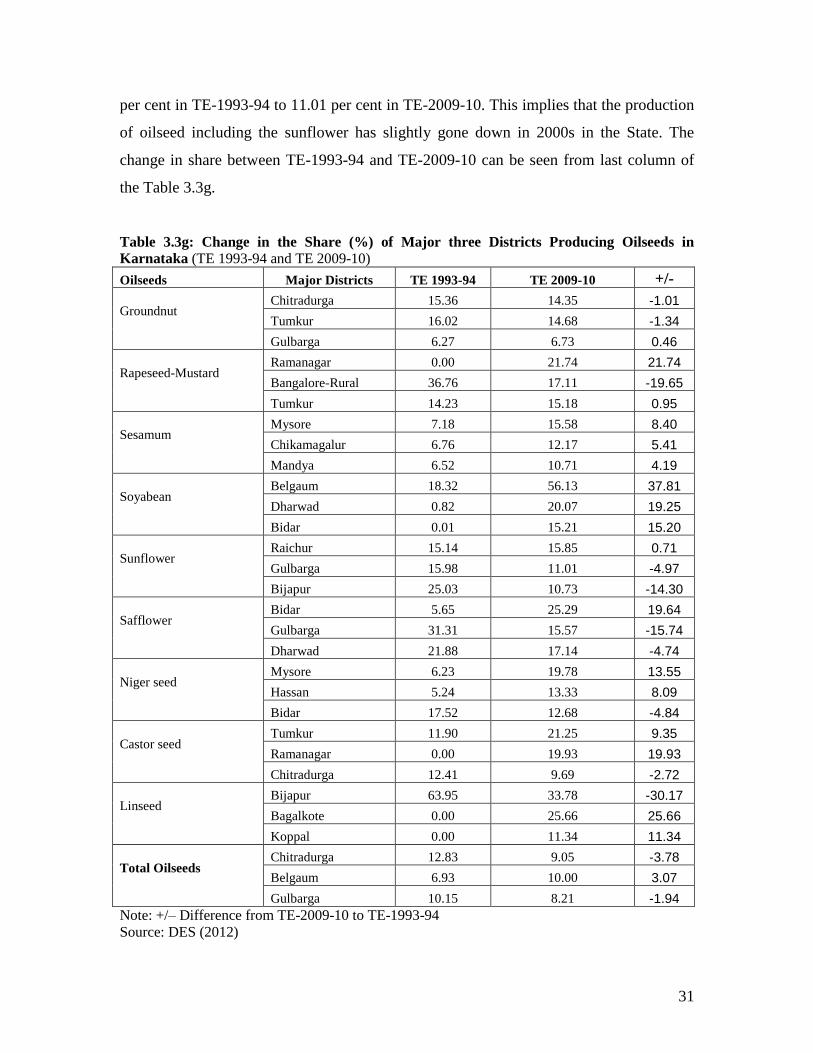
per cent in TE-1993-94 to 11.01 per cent in TE-2009-10. This implies that the production
of oilseed including the sunflower has slightly gone down in 2000s in the State. The
change in share between TE-1993-94 and TE-2009-10 can be seen from last column of
the Table 3.3g.
Table 3.3g: Change in the Share (%) of Major three Districts Producing Oilseeds in
Karnataka (TE 1993-94 and TE 2009-10)
Oilseeds Major Districts TE 1993-94 TE 2009-10 +/-
Groundnut
Chitradurga 15.36 14.35 -1.01
Tumkur 16.02 14.68 -1.34
Gulbarga 6.27 6.73 0.46
Rapeseed-Mustard
Ramanagar 0.00 21.74 21.74
Bangalore-Rural 36.76 17.11 -19.65
Tumkur 14.23 15.18 0.95
Sesamum
Mysore 7.18 15.58 8.40
Chikamagalur 6.76 12.17 5.41
Mandya 6.52 10.71 4.19
Soyabean
Belgaum 18.32 56.13 37.81
Dharwad 0.82 20.07 19.25
Bidar 0.01 15.21 15.20
Sunflower
Raichur 15.14 15.85 0.71
Gulbarga 15.98 11.01 -4.97
Bijapur 25.03 10.73 -14.30
Safflower
Bidar 5.65 25.29 19.64
Gulbarga 31.31 15.57 -15.74
Dharwad 21.88 17.14 -4.74
Niger seed
Mysore 6.23 19.78 13.55
Hassan 5.24 13.33 8.09
Bidar 17.52 12.68 -4.84
Castor seed
Tumkur 11.90 21.25 9.35
Ramanagar 0.00 19.93 19.93
Chitradurga 12.41 9.69 -2.72
Linseed
Bijapur 63.95 33.78 -30.17
Bagalkote 0.00 25.66 25.66
Koppal 0.00 11.34 11.34
Total Oilseeds
Chitradurga 12.83 9.05 -3.78
Belgaum 6.93 10.00 3.07
Gulbarga 10.15 8.21 -1.94
Note: +/– Difference from TE-2009-10 to TE-1993-94
Source: DES (2012)
32
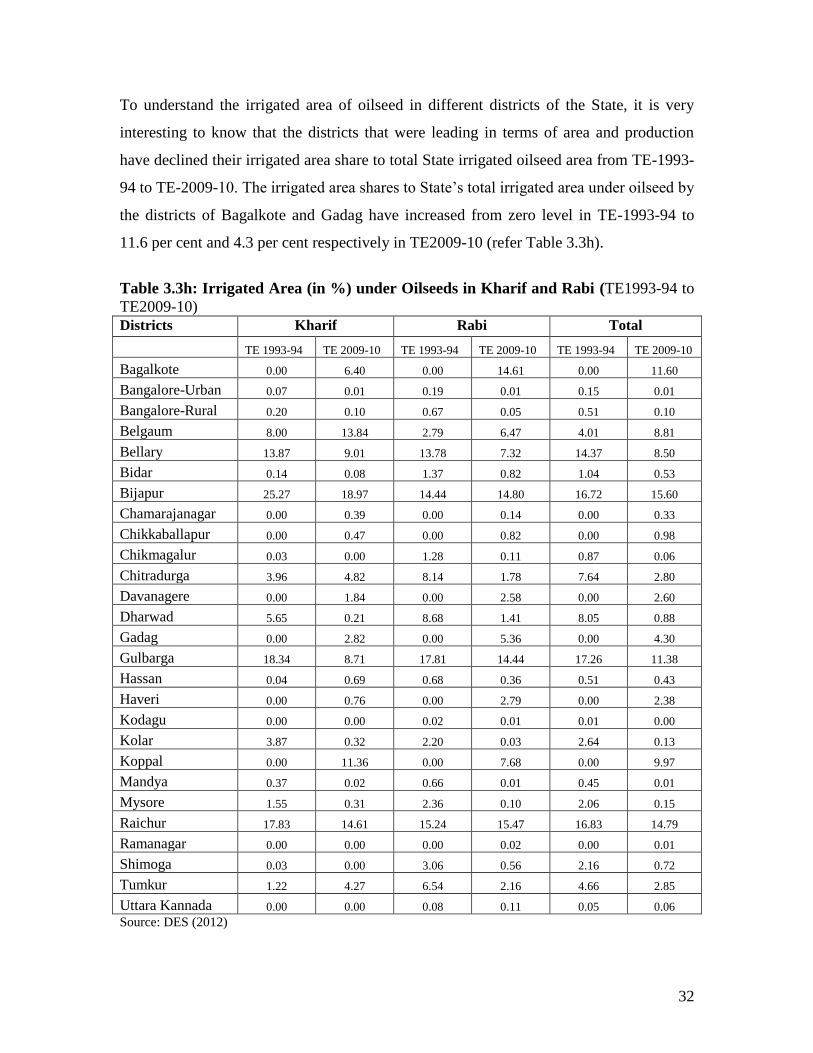
To understand the irrigated area of oilseed in different districts of the State, it is very
interesting to know that the districts that were leading in terms of area and production
have declined their irrigated area share to total State irrigated oilseed area from TE-1993-
94 to TE-2009-10. The irrigated area shares to State’s total irrigated area under oilseed by
the districts of Bagalkote and Gadag have increased from zero level in TE-1993-94 to
11.6 per cent and 4.3 per cent respectively in TE2009-10 (refer Table 3.3h).
Table 3.3h: Irrigated Area (in %) under Oilseeds in Kharif and Rabi (TE1993-94 to
TE2009-10)
Districts Kharif Rabi Total
TE 1993-94 TE 2009-10 TE 1993-94 TE 2009-10 TE 1993-94 TE 2009-10
Bagalkote 0.00 6.40 0.00 14.61 0.00 11.60
Bangalore-Urban 0.07 0.01 0.19 0.01 0.15 0.01
Bangalore-Rural 0.20 0.10 0.67 0.05 0.51 0.10
Belgaum 8.00 13.84 2.79 6.47 4.01 8.81
Bellary 13.87 9.01 13.78 7.32 14.37 8.50
Bidar 0.14 0.08 1.37 0.82 1.04 0.53
Bijapur 25.27 18.97 14.44 14.80 16.72 15.60
Chamarajanagar 0.00 0.39 0.00 0.14 0.00 0.33
Chikkaballapur 0.00 0.47 0.00 0.82 0.00 0.98
Chikmagalur 0.03 0.00 1.28 0.11 0.87 0.06
Chitradurga 3.96 4.82 8.14 1.78 7.64 2.80
Davanagere 0.00 1.84 0.00 2.58 0.00 2.60
Dharwad 5.65 0.21 8.68 1.41 8.05 0.88
Gadag 0.00 2.82 0.00 5.36 0.00 4.30
Gulbarga 18.34 8.71 17.81 14.44 17.26 11.38
Hassan 0.04 0.69 0.68 0.36 0.51 0.43
Haveri 0.00 0.76 0.00 2.79 0.00 2.38
Kodagu 0.00 0.00 0.02 0.01 0.01 0.00
Kolar 3.87 0.32 2.20 0.03 2.64 0.13
Koppal 0.00 11.36 0.00 7.68 0.00 9.97
Mandya 0.37 0.02 0.66 0.01 0.45 0.01
Mysore 1.55 0.31 2.36 0.10 2.06 0.15
Raichur 17.83 14.61 15.24 15.47 16.83 14.79
Ramanagar 0.00 0.00 0.00 0.02 0.00 0.01
Shimoga 0.03 0.00 3.06 0.56 2.16 0.72
Tumkur 1.22 4.27 6.54 2.16 4.66 2.85
Uttara Kannada 0.00 0.00 0.08 0.11 0.05 0.06
Source: DES (2012)
33
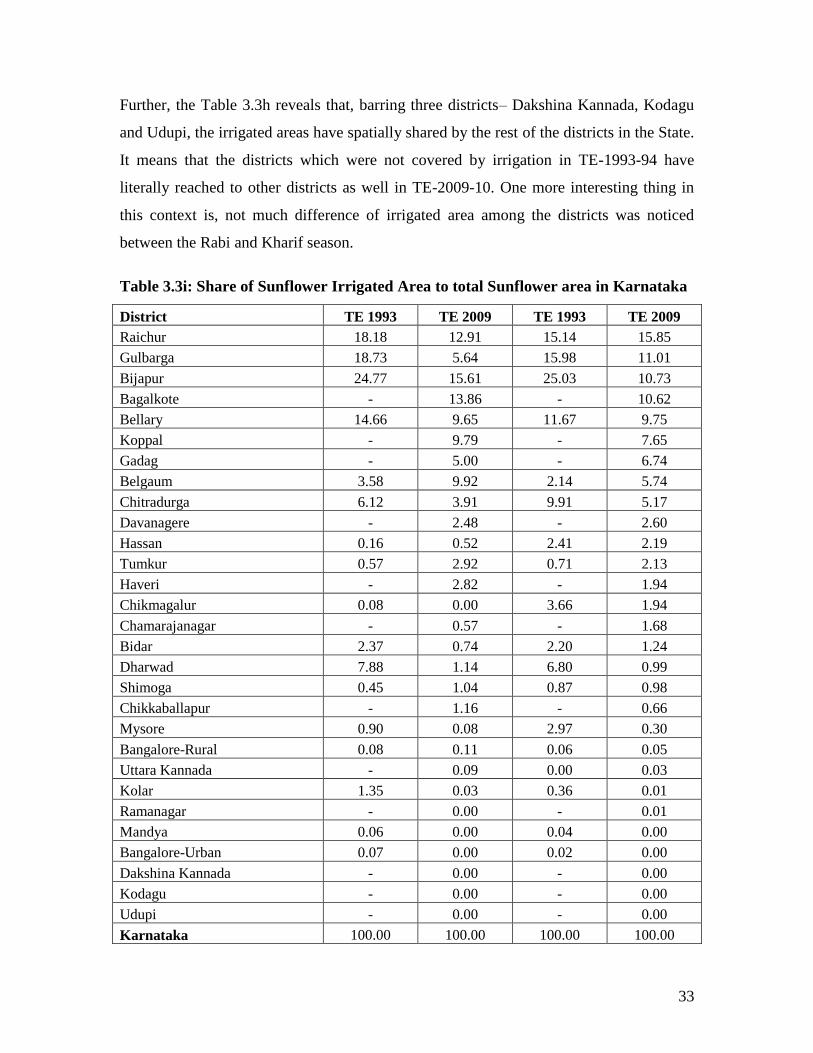
Further, the Table 3.3h reveals that, barring three districts– Dakshina Kannada, Kodagu
and Udupi, the irrigated areas have spatially shared by the rest of the districts in the State.
It means that the districts which were not covered by irrigation in TE-1993-94 have
literally reached to other districts as well in TE-2009-10. One more interesting thing in
this context is, not much difference of irrigated area among the districts was noticed
between the Rabi and Kharif season.
Table 3.3i: Share of Sunflower Irrigated Area to total Sunflower area in Karnataka
District TE 1993 TE 2009 TE 1993 TE 2009
Raichur 18.18 12.91 15.14 15.85
Gulbarga 18.73 5.64 15.98 11.01
Bijapur 24.77 15.61 25.03 10.73
Bagalkote - 13.86 - 10.62
Bellary 14.66 9.65 11.67 9.75
Koppal - 9.79 - 7.65
Gadag - 5.00 - 6.74
Belgaum 3.58 9.92 2.14 5.74
Chitradurga 6.12 3.91 9.91 5.17
Davanagere - 2.48 - 2.60
Hassan 0.16 0.52 2.41 2.19
Tumkur 0.57 2.92 0.71 2.13
Haveri - 2.82 - 1.94
Chikmagalur 0.08 0.00 3.66 1.94
Chamarajanagar - 0.57 - 1.68
Bidar 2.37 0.74 2.20 1.24
Dharwad 7.88 1.14 6.80 0.99
Shimoga 0.45 1.04 0.87 0.98
Chikkaballapur - 1.16 - 0.66
Mysore 0.90 0.08 2.97 0.30
Bangalore-Rural 0.08 0.11 0.06 0.05
Uttara Kannada - 0.09 0.00 0.03
Kolar 1.35 0.03 0.36 0.01
Ramanagar - 0.00 - 0.01
Mandya 0.06 0.00 0.04 0.00
Bangalore-Urban 0.07 0.00 0.02 0.00
Dakshina Kannada - 0.00 - 0.00
Kodagu - 0.00 - 0.00
Udupi - 0.00 - 0.00
Karnataka 100.00 100.00 100.00 100.00
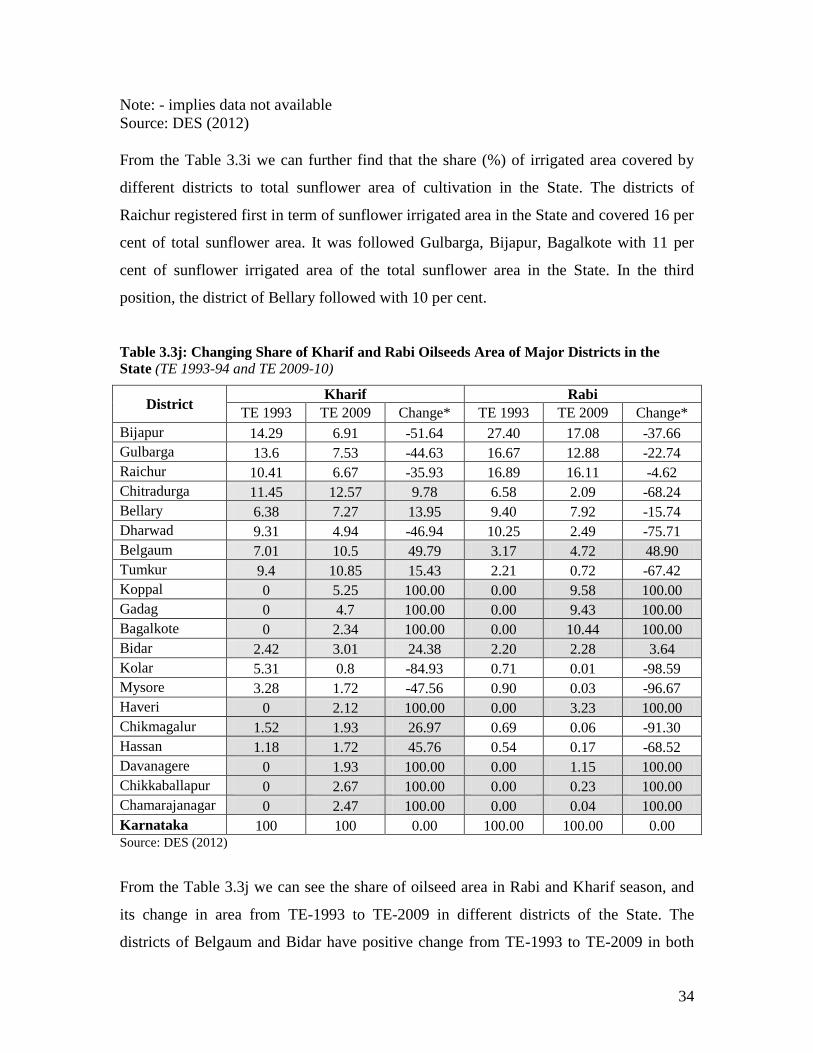
34
Note: - implies data not available
Source: DES (2012)
From the Table 3.3i we can further find that the share (%) of irrigated area covered by
different districts to total sunflower area of cultivation in the State. The districts of
Raichur registered first in term of sunflower irrigated area in the State and covered 16 per
cent of total sunflower area. It was followed Gulbarga, Bijapur, Bagalkote with 11 per
cent of sunflower irrigated area of the total sunflower area in the State. In the third
position, the district of Bellary followed with 10 per cent.
Table 3.3j: Changing Share of Kharif and Rabi Oilseeds Area of Major Districts in the
State (TE 1993-94 and TE 2009-10)
District Kharif Rabi
TE 1993 TE 2009 Change* TE 1993 TE 2009 Change*
Bijapur 14.29 6.91 -51.64 27.40 17.08 -37.66
Gulbarga 13.6 7.53 -44.63 16.67 12.88 -22.74
Raichur 10.41 6.67 -35.93 16.89 16.11 -4.62
Chitradurga 11.45 12.57 9.78 6.58 2.09 -68.24
Bellary 6.38 7.27 13.95 9.40 7.92 -15.74
Dharwad 9.31 4.94 -46.94 10.25 2.49 -75.71
Belgaum 7.01 10.5 49.79 3.17 4.72 48.90
Tumkur 9.4 10.85 15.43 2.21 0.72 -67.42
Koppal 0 5.25 100.00 0.00 9.58 100.00
Gadag 0 4.7 100.00 0.00 9.43 100.00
Bagalkote 0 2.34 100.00 0.00 10.44 100.00
Bidar 2.42 3.01 24.38 2.20 2.28 3.64
Kolar 5.31 0.8 -84.93 0.71 0.01 -98.59
Mysore 3.28 1.72 -47.56 0.90 0.03 -96.67
Haveri 0 2.12 100.00 0.00 3.23 100.00
Chikmagalur 1.52 1.93 26.97 0.69 0.06 -91.30
Hassan 1.18 1.72 45.76 0.54 0.17 -68.52
Davanagere 0 1.93 100.00 0.00 1.15 100.00
Chikkaballapur 0 2.67 100.00 0.00 0.23 100.00
Chamarajanagar 0 2.47 100.00 0.00 0.04 100.00
Karnataka 100 100 0.00 100.00 100.00 0.00 Source: DES (2012)
From the Table 3.3j we can see the share of oilseed area in Rabi and Kharif season, and
its change in area from TE-1993 to TE-2009 in different districts of the State. The
districts of Belgaum and Bidar have positive change from TE-1993 to TE-2009 in both

35
rabi and kharif seasons. Of course, seven districts have started cultivation after TE-1993
and evaluation of change rate for them do not arise. However, the districts of
Chitradurga, Bellary, Tumkur, Chigmagalur and Hassan made positive change from TE-
1993 to TE-2009 in Kharif season only, not in Rabi. During the kharif season, Belgaum
registered highest change rate with 50 per cent from TE-1993 to TE-2009, followed by
Hassan with 46 per cent.
Table 3.3k: Share of Major Districts in Area under Sunflower in the State
Districts TE 1983-84 TE 1993-94 TE 2003-04 TE 2009-10
Raichur 7.84 16.23 14.46 17.51
Bijapur 41.51 32.41 24.20 14.79
Gulbarga 13.81 17.40 13.18 13.01
Koppal 0.00 0.00 7.79 9.28
Bellary 14.50 9.59 7.87 9.10
Bagalkote 0.00 0.00 9.42 8.33
Gadag 0.00 0.00 8.21 7.63
Chitradurga 5.95 7.11 4.36 4.52
Belgaum 1.01 1.89 2.35 4.02
Chamarajanagar 0.00 0.00 0.48 1.79
Hassan 0.15 1.14 0.58 1.67
Chikmagalur 0.41 1.79 0.82 1.64
Davanagere 0.00 0.00 1.96 1.53
Bidar 5.14 2.25 1.10 1.33
Tumkur 0.35 0.52 0.96 1.20
Dharwad 5.89 6.88 0.65 1.16
Haveri 0.00 0.00 1.09 1.03
Mysore 2.54 2.01 0.17 0.23
Chikkaballapura 0.00 0.00 0.00 0.13
Shimoga 0.73 0.52 0.05 0.07
Uttara Kannada 0.00 0.00 0.00 0.02
Bangalore-Urban 0.12 0.05 0.00 0.01
Ramanagar 0.00 0.00 0.00 0.01
Kolar 0.01 0.16 0.26 0.00
Bangalore-Rural 0.00 0.01 0.03 0.00
Mandya 0.05 0.03 0.00 0.00
Source: DES (2012)
When we see the share of sunflower crop area of the districts in the State, though
Belgaum and Tumkur have slightly small share to State, it has been increasing constantly
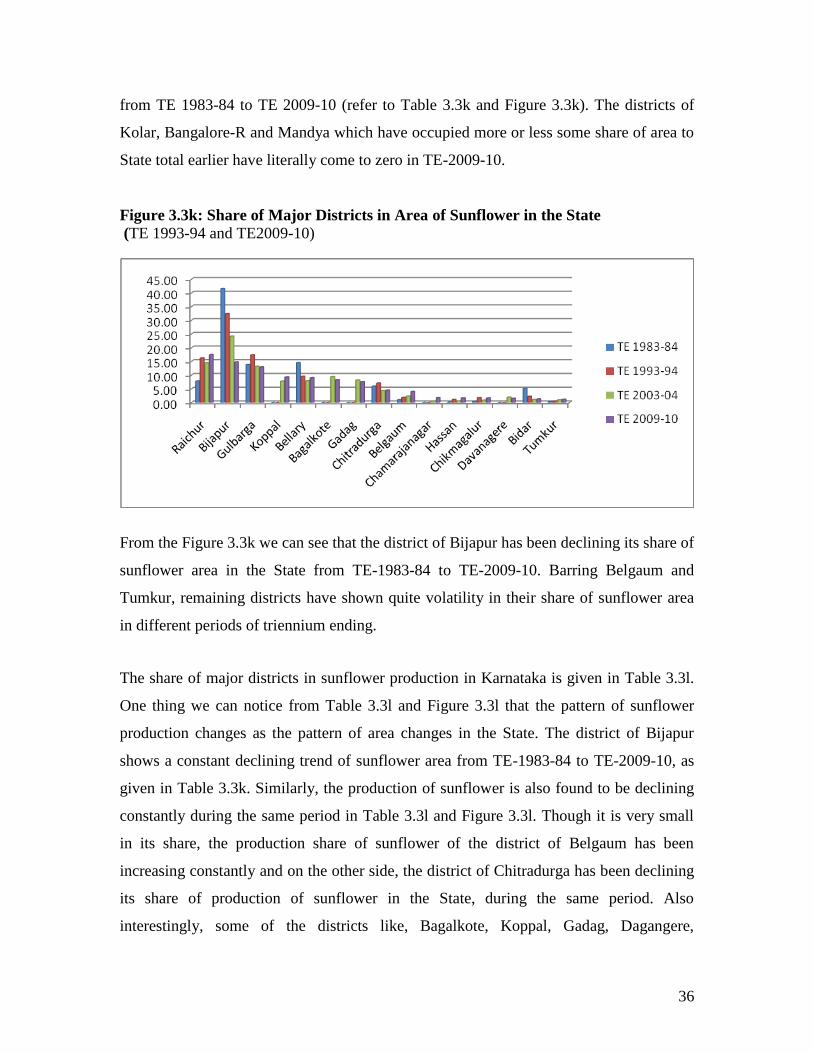
36
from TE 1983-84 to TE 2009-10 (refer to Table 3.3k and Figure 3.3k). The districts of
Kolar, Bangalore-R and Mandya which have occupied more or less some share of area to
State total earlier have literally come to zero in TE-2009-10.
Figure 3.3k: Share of Major Districts in Area of Sunflower in the State
(TE 1993-94 and TE2009-10)
From the Figure 3.3k we can see that the district of Bijapur has been declining its share of
sunflower area in the State from TE-1983-84 to TE-2009-10. Barring Belgaum and
Tumkur, remaining districts have shown quite volatility in their share of sunflower area
in different periods of triennium ending.
The share of major districts in sunflower production in Karnataka is given in Table 3.3l.
One thing we can notice from Table 3.3l and Figure 3.3l that the pattern of sunflower
production changes as the pattern of area changes in the State. The district of Bijapur
shows a constant declining trend of sunflower area from TE-1983-84 to TE-2009-10, as
given in Table 3.3k. Similarly, the production of sunflower is also found to be declining
constantly during the same period in Table 3.3l and Figure 3.3l. Though it is very small
in its share, the production share of sunflower of the district of Belgaum has been
increasing constantly and on the other side, the district of Chitradurga has been declining
its share of production of sunflower in the State, during the same period. Also
interestingly, some of the districts like, Bagalkote, Koppal, Gadag, Dagangere,
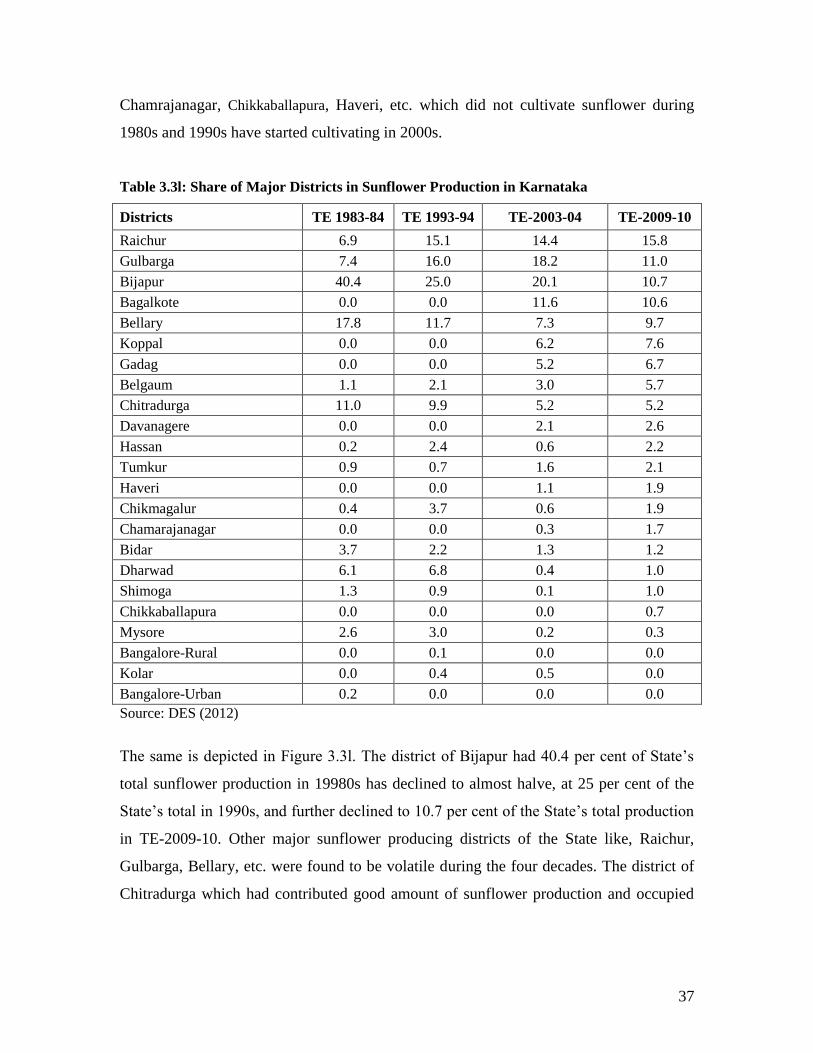
37
Chamrajanagar, Chikkaballapura, Haveri, etc. which did not cultivate sunflower during
1980s and 1990s have started cultivating in 2000s.
Table 3.3l: Share of Major Districts in Sunflower Production in Karnataka
Districts TE 1983-84 TE 1993-94 TE-2003-04 TE-2009-10
Raichur 6.9 15.1 14.4 15.8
Gulbarga 7.4 16.0 18.2 11.0
Bijapur 40.4 25.0 20.1 10.7
Bagalkote 0.0 0.0 11.6 10.6
Bellary 17.8 11.7 7.3 9.7
Koppal 0.0 0.0 6.2 7.6
Gadag 0.0 0.0 5.2 6.7
Belgaum 1.1 2.1 3.0 5.7
Chitradurga 11.0 9.9 5.2 5.2
Davanagere 0.0 0.0 2.1 2.6
Hassan 0.2 2.4 0.6 2.2
Tumkur 0.9 0.7 1.6 2.1
Haveri 0.0 0.0 1.1 1.9
Chikmagalur 0.4 3.7 0.6 1.9
Chamarajanagar 0.0 0.0 0.3 1.7
Bidar 3.7 2.2 1.3 1.2
Dharwad 6.1 6.8 0.4 1.0
Shimoga 1.3 0.9 0.1 1.0
Chikkaballapura 0.0 0.0 0.0 0.7
Mysore 2.6 3.0 0.2 0.3
Bangalore-Rural 0.0 0.1 0.0 0.0
Kolar 0.0 0.4 0.5 0.0
Bangalore-Urban 0.2 0.0 0.0 0.0
Source: DES (2012)
The same is depicted in Figure 3.3l. The district of Bijapur had 40.4 per cent of State’s
total sunflower production in 19980s has declined to almost halve, at 25 per cent of the
State’s total in 1990s, and further declined to 10.7 per cent of the State’s total production
in TE-2009-10. Other major sunflower producing districts of the State like, Raichur,
Gulbarga, Bellary, etc. were found to be volatile during the four decades. The district of
Chitradurga which had contributed good amount of sunflower production and occupied
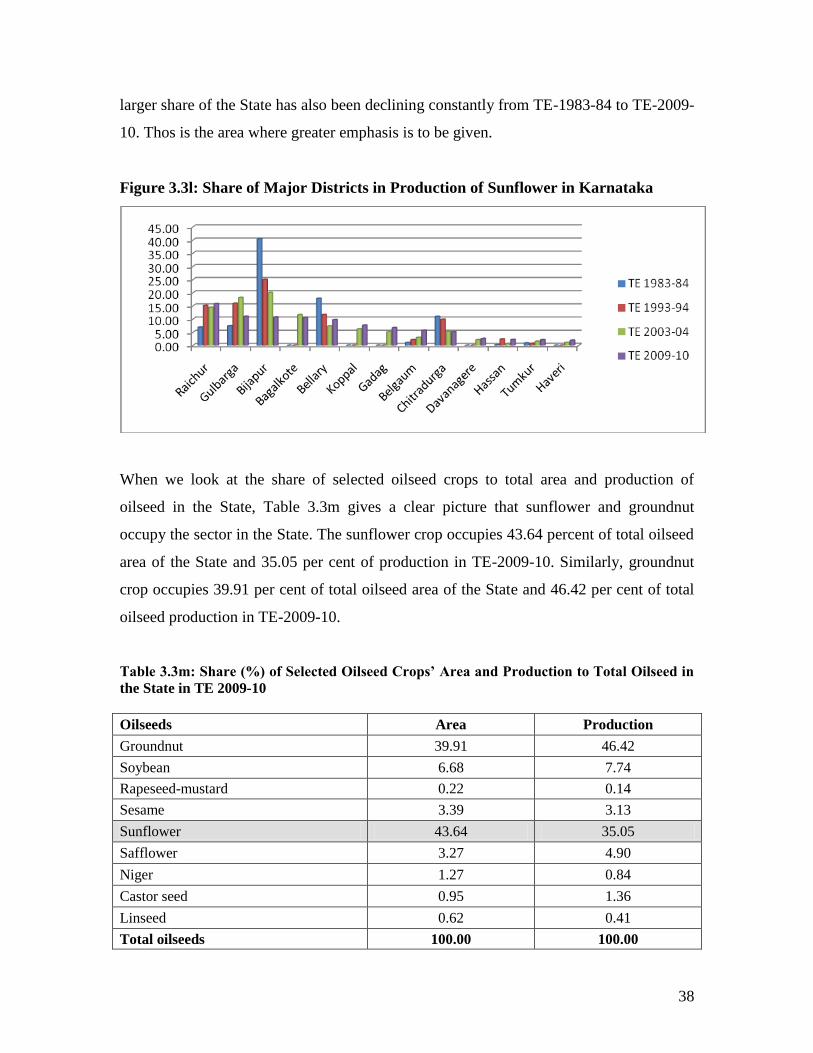
38
larger share of the State has also been declining constantly from TE-1983-84 to TE-2009-
10. Thos is the area where greater emphasis is to be given.
Figure 3.3l: Share of Major Districts in Production of Sunflower in Karnataka
When we look at the share of selected oilseed crops to total area and production of
oilseed in the State, Table 3.3m gives a clear picture that sunflower and groundnut
occupy the sector in the State. The sunflower crop occupies 43.64 percent of total oilseed
area of the State and 35.05 per cent of production in TE-2009-10. Similarly, groundnut
crop occupies 39.91 per cent of total oilseed area of the State and 46.42 per cent of total
oilseed production in TE-2009-10.
Table 3.3m: Share (%) of Selected Oilseed Crops’ Area and Production to Total Oilseed in
the State in TE 2009-10
Oilseeds Area Production
Groundnut 39.91 46.42
Soybean 6.68 7.74
Rapeseed-mustard 0.22 0.14
Sesame 3.39 3.13
Sunflower 43.64 35.05
Safflower 3.27 4.90
Niger 1.27 0.84
Castor seed 0.95 1.36
Linseed 0.62 0.41
Total oilseeds 100.00 100.00
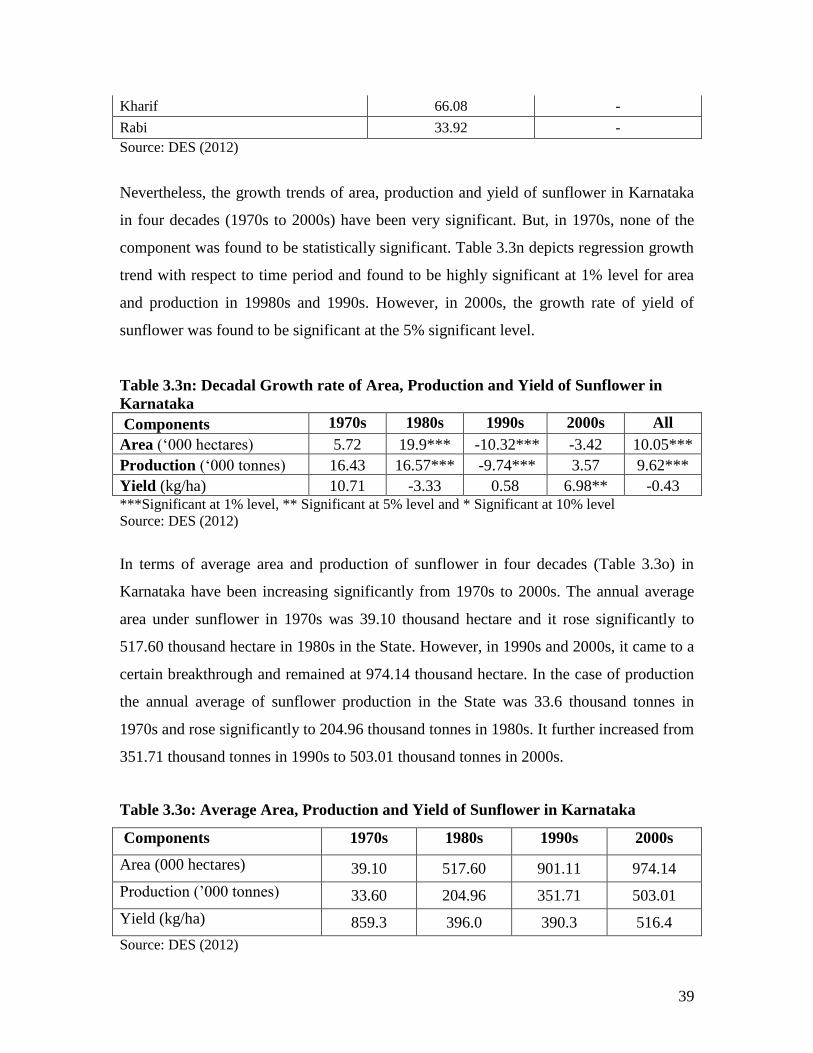
39
Kharif 66.08 -
Rabi 33.92 -
Source: DES (2012)
Nevertheless, the growth trends of area, production and yield of sunflower in Karnataka
in four decades (1970s to 2000s) have been very significant. But, in 1970s, none of the
component was found to be statistically significant. Table 3.3n depicts regression growth
trend with respect to time period and found to be highly significant at 1% level for area
and production in 19980s and 1990s. However, in 2000s, the growth rate of yield of
sunflower was found to be significant at the 5% significant level.
Table 3.3n: Decadal Growth rate of Area, Production and Yield of Sunflower in
Karnataka
Components 1970s 1980s 1990s 2000s All
Area (‘000 hectares) 5.72 19.9*** -10.32*** -3.42 10.05***
Production (‘000 tonnes) 16.43 16.57*** -9.74*** 3.57 9.62***
Yield (kg/ha) 10.71 -3.33 0.58 6.98** -0.43 ***Significant at 1% level, ** Significant at 5% level and * Significant at 10% level
Source: DES (2012)
In terms of average area and production of sunflower in four decades (Table 3.3o) in
Karnataka have been increasing significantly from 1970s to 2000s. The annual average
area under sunflower in 1970s was 39.10 thousand hectare and it rose significantly to
517.60 thousand hectare in 1980s in the State. However, in 1990s and 2000s, it came to a
certain breakthrough and remained at 974.14 thousand hectare. In the case of production
the annual average of sunflower production in the State was 33.6 thousand tonnes in
1970s and rose significantly to 204.96 thousand tonnes in 1980s. It further increased from
351.71 thousand tonnes in 1990s to 503.01 thousand tonnes in 2000s.
Table 3.3o: Average Area, Production and Yield of Sunflower in Karnataka
Components 1970s 1980s 1990s 2000s
Area (000 hectares) 39.10 517.60 901.11 974.14
Production (’000 tonnes) 33.60 204.96 351.71 503.01
Yield (kg/ha) 859.3 396.0 390.3 516.4
Source: DES (2012)
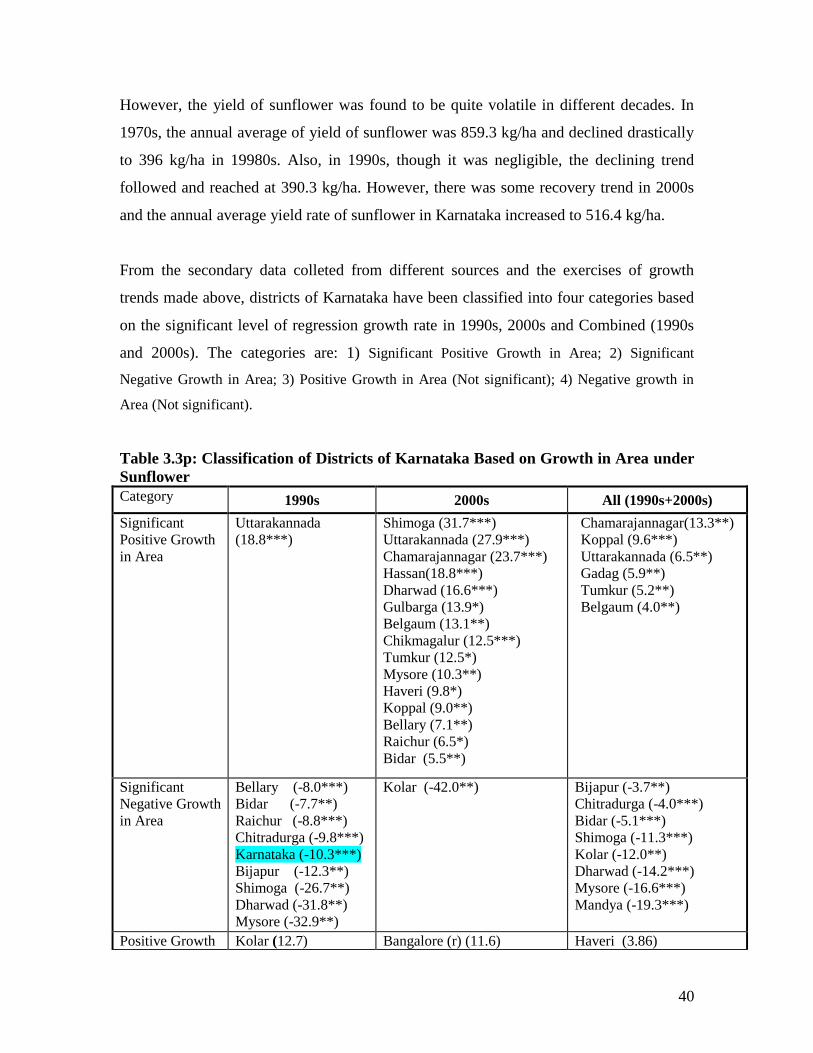
40
However, the yield of sunflower was found to be quite volatile in different decades. In
1970s, the annual average of yield of sunflower was 859.3 kg/ha and declined drastically
to 396 kg/ha in 19980s. Also, in 1990s, though it was negligible, the declining trend
followed and reached at 390.3 kg/ha. However, there was some recovery trend in 2000s
and the annual average yield rate of sunflower in Karnataka increased to 516.4 kg/ha.
From the secondary data colleted from different sources and the exercises of growth
trends made above, districts of Karnataka have been classified into four categories based
on the significant level of regression growth rate in 1990s, 2000s and Combined (1990s
and 2000s). The categories are: 1) Significant Positive Growth in Area; 2) Significant
Negative Growth in Area; 3) Positive Growth in Area (Not significant); 4) Negative growth in
Area (Not significant).
Table 3.3p: Classification of Districts of Karnataka Based on Growth in Area under
Sunflower
Category 1990s 2000s All (1990s+2000s)
Significant
Positive Growth
in Area
Uttarakannada
(18.8***)
Shimoga (31.7***)
Uttarakannada (27.9***)
Chamarajannagar (23.7***)
Hassan(18.8***)
Dharwad (16.6***)
Gulbarga (13.9*)
Belgaum (13.1**)
Chikmagalur (12.5***)
Tumkur (12.5*)
Mysore (10.3**)
Haveri (9.8*)
Koppal (9.0**)
Bellary (7.1**)
Raichur (6.5*)
Bidar (5.5**)
Chamarajannagar(13.3**)
Koppal (9.6***)
Uttarakannada (6.5**)
Gadag (5.9**)
Tumkur (5.2**)
Belgaum (4.0**)
Significant
Negative Growth
in Area
Bellary (-8.0***)
Bidar (-7.7**)
Raichur (-8.8***)
Chitradurga (-9.8***)
Karnataka (-10.3***)
Bijapur (-12.3**)
Shimoga (-26.7**)
Dharwad (-31.8**)
Mysore (-32.9**)
Kolar (-42.0**)
Bijapur (-3.7**)
Chitradurga (-4.0***)
Bidar (-5.1***)
Shimoga (-11.3***)
Kolar (-12.0**)
Dharwad (-14.2***)
Mysore (-16.6***)
Mandya (-19.3***)
Positive Growth Kolar (12.7) Bangalore (r) (11.6) Haveri (3.86)
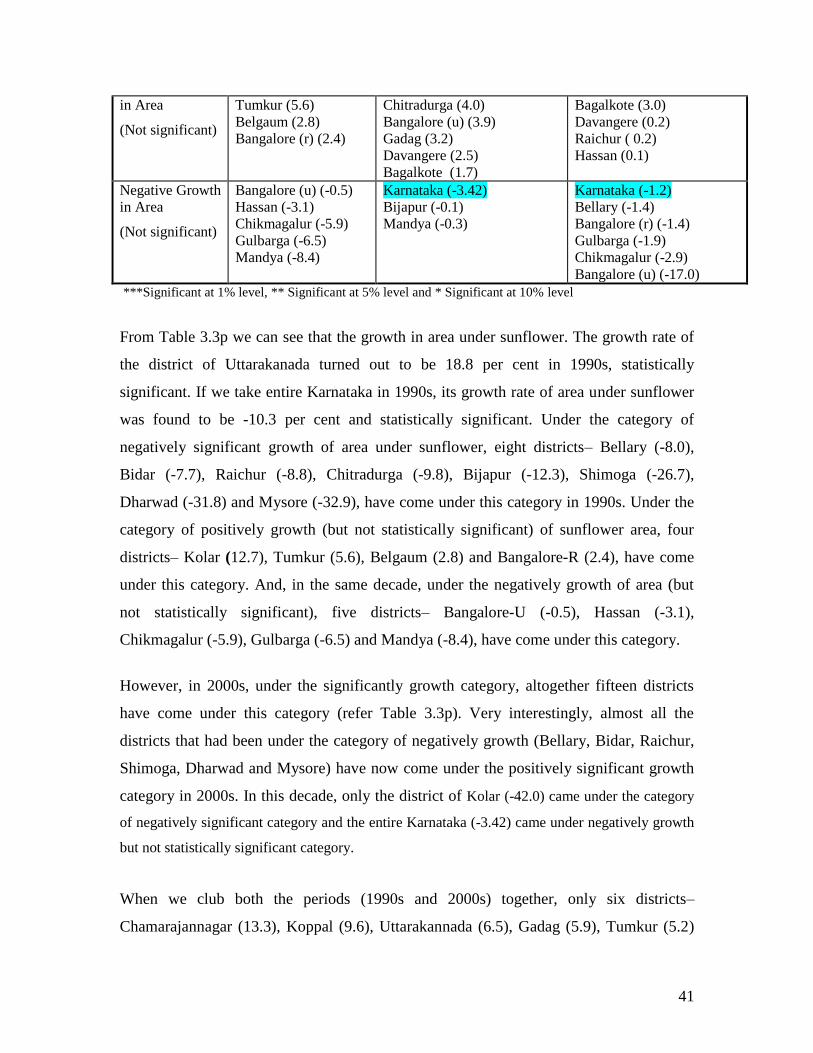
41
in Area
(Not significant)
Tumkur (5.6)
Belgaum (2.8)
Bangalore (r) (2.4)
Chitradurga (4.0)
Bangalore (u) (3.9)
Gadag (3.2)
Davangere (2.5)
Bagalkote (1.7)
Bagalkote (3.0)
Davangere (0.2)
Raichur ( 0.2)
Hassan (0.1)
Negative Growth
in Area
(Not significant)
Bangalore (u) (-0.5)
Hassan (-3.1)
Chikmagalur (-5.9)
Gulbarga (-6.5)
Mandya (-8.4)
Karnataka (-3.42)
Bijapur (-0.1)
Mandya (-0.3)
Karnataka (-1.2)
Bellary (-1.4)
Bangalore (r) (-1.4)
Gulbarga (-1.9)
Chikmagalur (-2.9)
Bangalore (u) (-17.0)
***Significant at 1% level, ** Significant at 5% level and * Significant at 10% level
From Table 3.3p we can see that the growth in area under sunflower. The growth rate of
the district of Uttarakanada turned out to be 18.8 per cent in 1990s, statistically
significant. If we take entire Karnataka in 1990s, its growth rate of area under sunflower
was found to be -10.3 per cent and statistically significant. Under the category of
negatively significant growth of area under sunflower, eight districts– Bellary (-8.0),
Bidar (-7.7), Raichur (-8.8), Chitradurga (-9.8), Bijapur (-12.3), Shimoga (-26.7),
Dharwad (-31.8) and Mysore (-32.9), have come under this category in 1990s. Under the
category of positively growth (but not statistically significant) of sunflower area, four
districts– Kolar (12.7), Tumkur (5.6), Belgaum (2.8) and Bangalore-R (2.4), have come
under this category. And, in the same decade, under the negatively growth of area (but
not statistically significant), five districts– Bangalore-U (-0.5), Hassan (-3.1),
Chikmagalur (-5.9), Gulbarga (-6.5) and Mandya (-8.4), have come under this category.
However, in 2000s, under the significantly growth category, altogether fifteen districts
have come under this category (refer Table 3.3p). Very interestingly, almost all the
districts that had been under the category of negatively growth (Bellary, Bidar, Raichur,
Shimoga, Dharwad and Mysore) have now come under the positively significant growth
category in 2000s. In this decade, only the district of Kolar (-42.0) came under the category
of negatively significant category and the entire Karnataka (-3.42) came under negatively growth
but not statistically significant category.
When we club both the periods (1990s and 2000s) together, only six districts–
Chamarajannagar (13.3), Koppal (9.6), Uttarakannada (6.5), Gadag (5.9), Tumkur (5.2)
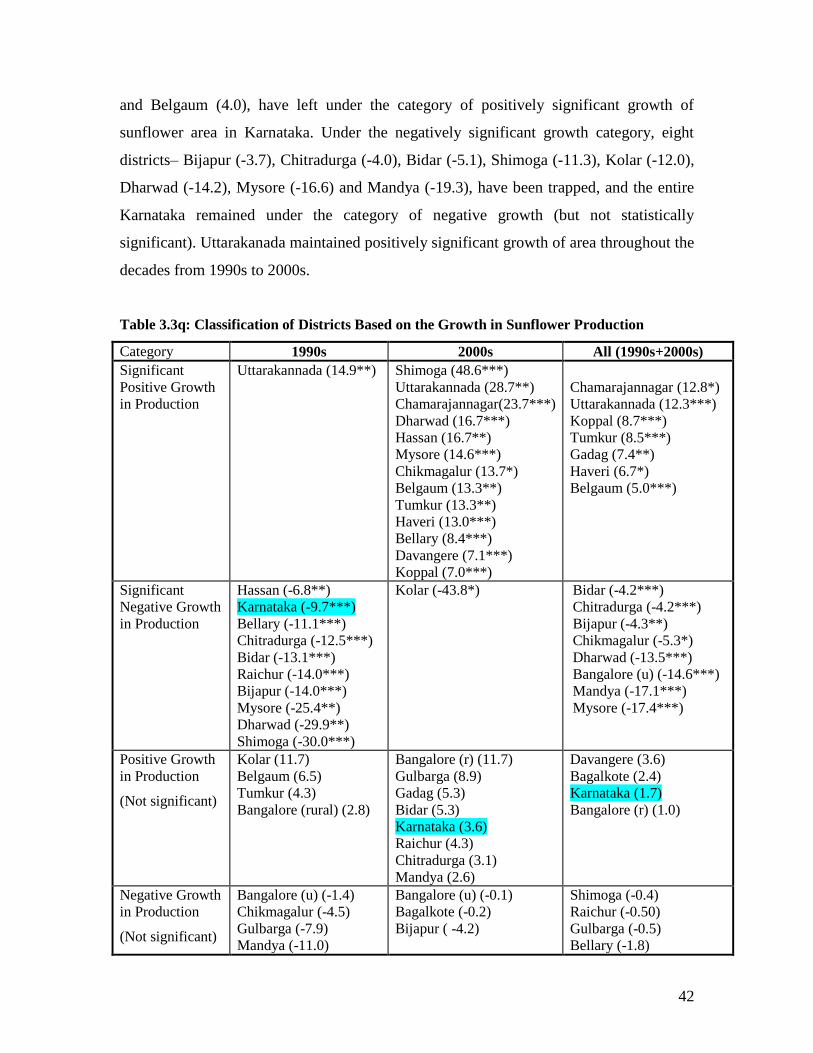
42
and Belgaum (4.0), have left under the category of positively significant growth of
sunflower area in Karnataka. Under the negatively significant growth category, eight
districts– Bijapur (-3.7), Chitradurga (-4.0), Bidar (-5.1), Shimoga (-11.3), Kolar (-12.0),
Dharwad (-14.2), Mysore (-16.6) and Mandya (-19.3), have been trapped, and the entire
Karnataka remained under the category of negative growth (but not statistically
significant). Uttarakanada maintained positively significant growth of area throughout the
decades from 1990s to 2000s.
Table 3.3q: Classification of Districts Based on the Growth in Sunflower Production
Category 1990s 2000s All (1990s+2000s)
Significant
Positive Growth
in Production
Uttarakannada (14.9**)
Shimoga (48.6***)
Uttarakannada (28.7**)
Chamarajannagar(23.7***)
Dharwad (16.7***)
Hassan (16.7**)
Mysore (14.6***)
Chikmagalur (13.7*)
Belgaum (13.3**)
Tumkur (13.3**)
Haveri (13.0***)
Bellary (8.4***)
Davangere (7.1***)
Koppal (7.0***)
Chamarajannagar (12.8*)
Uttarakannada (12.3***)
Koppal (8.7***)
Tumkur (8.5***)
Gadag (7.4**)
Haveri (6.7*)
Belgaum (5.0***)
Significant
Negative Growth
in Production
Hassan (-6.8**)
Karnataka (-9.7***)
Bellary (-11.1***)
Chitradurga (-12.5***)
Bidar (-13.1***)
Raichur (-14.0***)
Bijapur (-14.0***)
Mysore (-25.4**)
Dharwad (-29.9**)
Shimoga (-30.0***)
Kolar (-43.8*)
Bidar (-4.2***)
Chitradurga (-4.2***)
Bijapur (-4.3**)
Chikmagalur (-5.3*)
Dharwad (-13.5***)
Bangalore (u) (-14.6***)
Mandya (-17.1***)
Mysore (-17.4***)
Positive Growth
in Production
(Not significant)
Kolar (11.7)
Belgaum (6.5)
Tumkur (4.3)
Bangalore (rural) (2.8)
Bangalore (r) (11.7)
Gulbarga (8.9)
Gadag (5.3)
Bidar (5.3)
Karnataka (3.6)
Raichur (4.3)
Chitradurga (3.1)
Mandya (2.6)
Davangere (3.6)
Bagalkote (2.4)
Karnataka (1.7)
Bangalore (r) (1.0)
Negative Growth
in Production
(Not significant)
Bangalore (u) (-1.4)
Chikmagalur (-4.5)
Gulbarga (-7.9)
Mandya (-11.0)
Bangalore (u) (-0.1)
Bagalkote (-0.2)
Bijapur ( -4.2)
Shimoga (-0.4)
Raichur (-0.50)
Gulbarga (-0.5)
Bellary (-1.8)
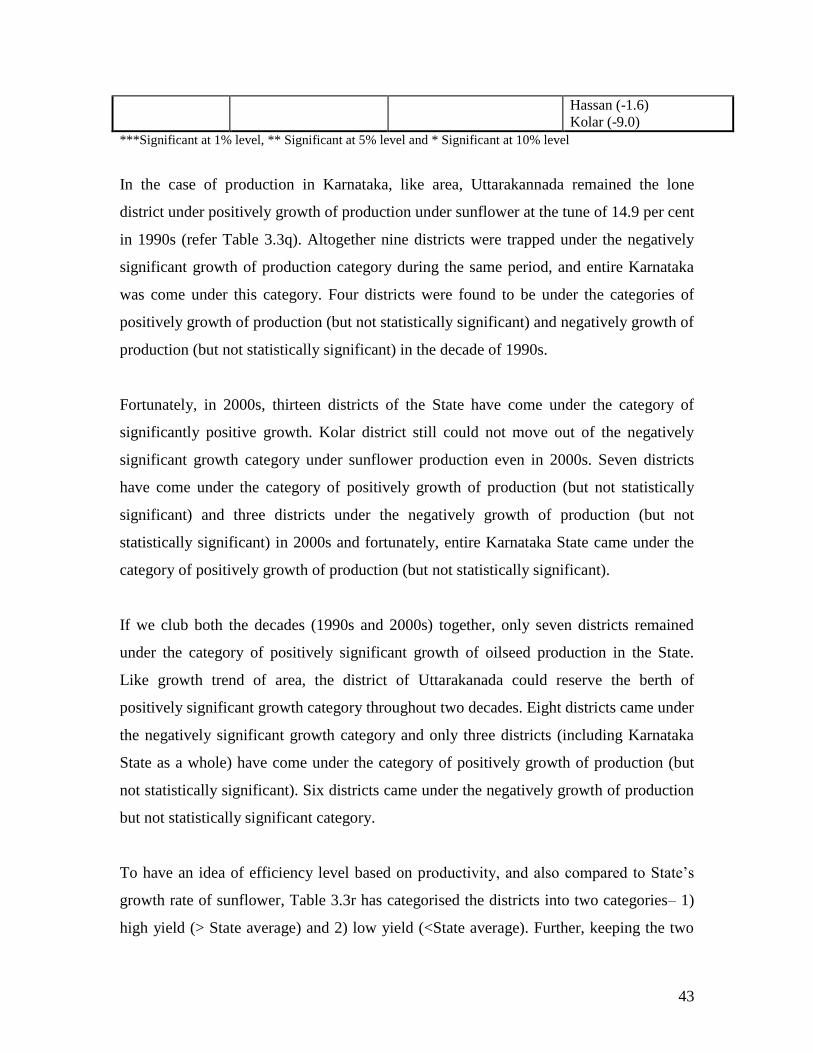
43
Hassan (-1.6)
Kolar (-9.0)
***Significant at 1% level, ** Significant at 5% level and * Significant at 10% level
In the case of production in Karnataka, like area, Uttarakannada remained the lone
district under positively growth of production under sunflower at the tune of 14.9 per cent
in 1990s (refer Table 3.3q). Altogether nine districts were trapped under the negatively
significant growth of production category during the same period, and entire Karnataka
was come under this category. Four districts were found to be under the categories of
positively growth of production (but not statistically significant) and negatively growth of
production (but not statistically significant) in the decade of 1990s.
Fortunately, in 2000s, thirteen districts of the State have come under the category of
significantly positive growth. Kolar district still could not move out of the negatively
significant growth category under sunflower production even in 2000s. Seven districts
have come under the category of positively growth of production (but not statistically
significant) and three districts under the negatively growth of production (but not
statistically significant) in 2000s and fortunately, entire Karnataka State came under the
category of positively growth of production (but not statistically significant).
If we club both the decades (1990s and 2000s) together, only seven districts remained
under the category of positively significant growth of oilseed production in the State.
Like growth trend of area, the district of Uttarakanada could reserve the berth of
positively significant growth category throughout two decades. Eight districts came under
the negatively significant growth category and only three districts (including Karnataka
State as a whole) have come under the category of positively growth of production (but
not statistically significant). Six districts came under the negatively growth of production
but not statistically significant category.
To have an idea of efficiency level based on productivity, and also compared to State’s
growth rate of sunflower, Table 3.3r has categorised the districts into two categories– 1)
high yield (> State average) and 2) low yield (<State average). Further, keeping the two
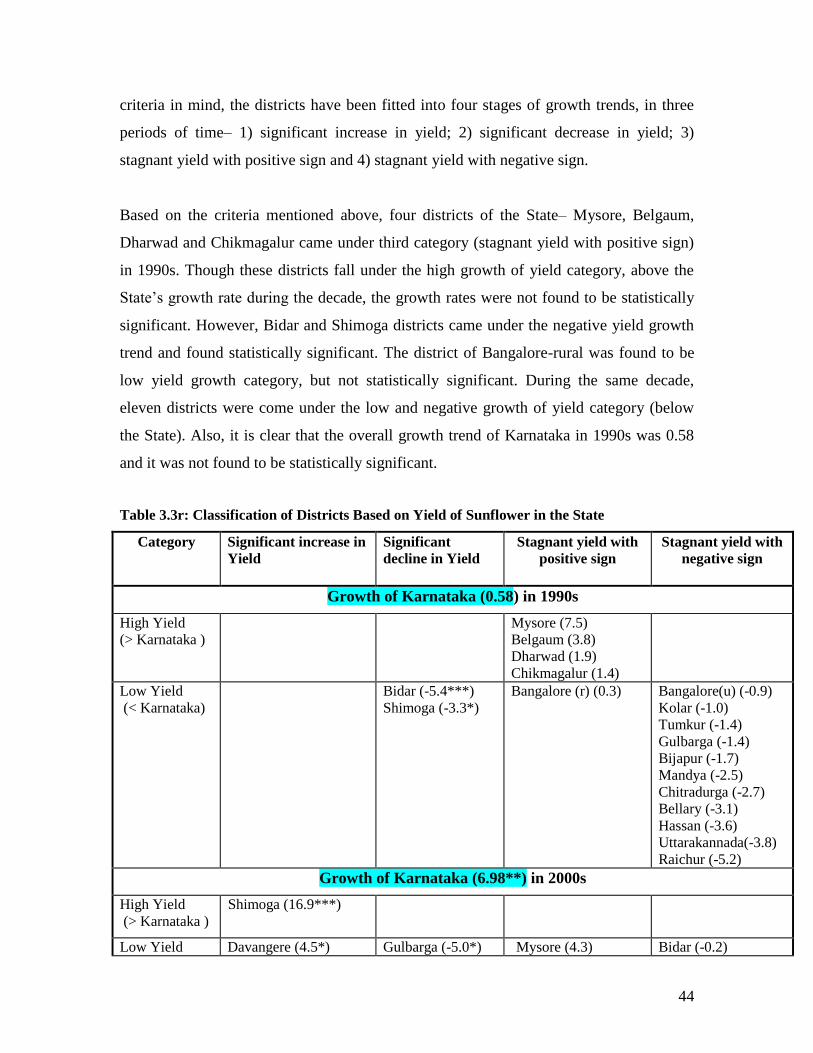
44
criteria in mind, the districts have been fitted into four stages of growth trends, in three
periods of time– 1) significant increase in yield; 2) significant decrease in yield; 3)
stagnant yield with positive sign and 4) stagnant yield with negative sign.
Based on the criteria mentioned above, four districts of the State– Mysore, Belgaum,
Dharwad and Chikmagalur came under third category (stagnant yield with positive sign)
in 1990s. Though these districts fall under the high growth of yield category, above the
State’s growth rate during the decade, the growth rates were not found to be statistically
significant. However, Bidar and Shimoga districts came under the negative yield growth
trend and found statistically significant. The district of Bangalore-rural was found to be
low yield growth category, but not statistically significant. During the same decade,
eleven districts were come under the low and negative growth of yield category (below
the State). Also, it is clear that the overall growth trend of Karnataka in 1990s was 0.58
and it was not found to be statistically significant.
Table 3.3r: Classification of Districts Based on Yield of Sunflower in the State
Category Significant increase in
Yield
Significant
decline in Yield
Stagnant yield with
positive sign
Stagnant yield with
negative sign
Growth of Karnataka (0.58) in 1990s
High Yield
(> Karnataka )
Mysore (7.5)
Belgaum (3.8)
Dharwad (1.9)
Chikmagalur (1.4)
Low Yield
(< Karnataka)
Bidar (-5.4***)
Shimoga (-3.3*)
Bangalore (r) (0.3)
Bangalore(u) (-0.9)
Kolar (-1.0)
Tumkur (-1.4)
Gulbarga (-1.4)
Bijapur (-1.7)
Mandya (-2.5)
Chitradurga (-2.7)
Bellary (-3.1)
Hassan (-3.6)
Uttarakannada(-3.8)
Raichur (-5.2)
Growth of Karnataka (6.98**) in 2000s
High Yield
(> Karnataka )
Shimoga (16.9***)
Low Yield Davangere (4.5*) Gulbarga (-5.0*) Mysore (4.3) Bidar (-0.2)
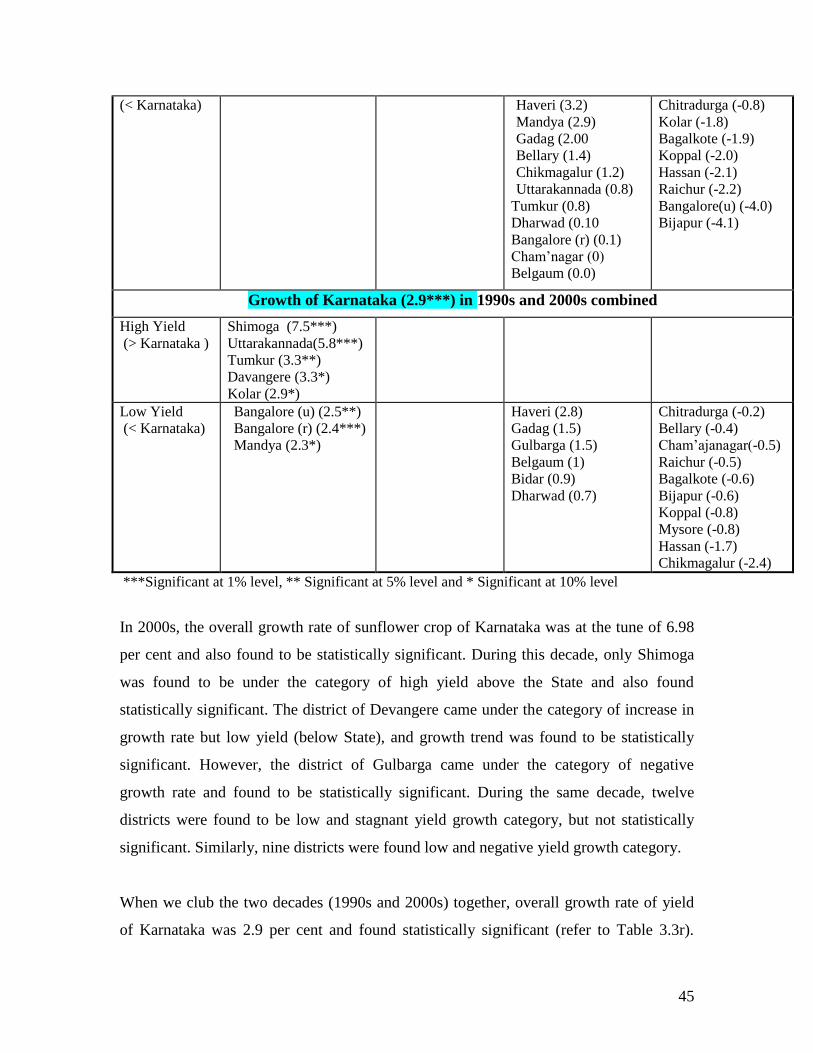
45
(< Karnataka) Haveri (3.2)
Mandya (2.9)
Gadag (2.00
Bellary (1.4)
Chikmagalur (1.2)
Uttarakannada (0.8)
Tumkur (0.8)
Dharwad (0.10
Bangalore (r) (0.1)
Cham’nagar (0)
Belgaum (0.0)
Chitradurga (-0.8)
Kolar (-1.8)
Bagalkote (-1.9)
Koppal (-2.0)
Hassan (-2.1)
Raichur (-2.2)
Bangalore(u) (-4.0)
Bijapur (-4.1)
Growth of Karnataka (2.9***) in 1990s and 2000s combined
High Yield
(> Karnataka )
Shimoga (7.5***)
Uttarakannada(5.8***)
Tumkur (3.3**)
Davangere (3.3*)
Kolar (2.9*)
Low Yield
(< Karnataka)
Bangalore (u) (2.5**)
Bangalore (r) (2.4***)
Mandya (2.3*)
Haveri (2.8)
Gadag (1.5)
Gulbarga (1.5)
Belgaum (1)
Bidar (0.9)
Dharwad (0.7)
Chitradurga (-0.2)
Bellary (-0.4)
Cham’ajanagar(-0.5)
Raichur (-0.5)
Bagalkote (-0.6)
Bijapur (-0.6)
Koppal (-0.8)
Mysore (-0.8)
Hassan (-1.7)
Chikmagalur (-2.4)
***Significant at 1% level, ** Significant at 5% level and * Significant at 10% level
In 2000s, the overall growth rate of sunflower crop of Karnataka was at the tune of 6.98
per cent and also found to be statistically significant. During this decade, only Shimoga
was found to be under the category of high yield above the State and also found
statistically significant. The district of Devangere came under the category of increase in
growth rate but low yield (below State), and growth trend was found to be statistically
significant. However, the district of Gulbarga came under the category of negative
growth rate and found to be statistically significant. During the same decade, twelve
districts were found to be low and stagnant yield growth category, but not statistically
significant. Similarly, nine districts were found low and negative yield growth category.
When we club the two decades (1990s and 2000s) together, overall growth rate of yield
of Karnataka was 2.9 per cent and found statistically significant (refer to Table 3.3r).
46
During this decade, five districts were found to be high yield category and statistically
significant. The districts and their growth rates are– Shimoga (7.5), Uttarakannada (5.8),
Tumkur (3.3), Davangere (3.3) and Kolar (2.9). However, three districts– Bangalore (u)
(2.5), Bangalore (r) (2.4) and Mandya (2.3) were found to be increasing at low yield level
(below State) and found statistically significant. Six districts were found to be low and
stagnant yield category, but also not statistically significant, and ten districts were found
to be negative growth of yield category, but not statistically significant (refer Table 3.3r).
3.4. Variability in Area, Production and Productivity of Major Oil-seeds vis-à-vis
Competing Crops in Karnataka and India
Literally, the yearly sequence and spatial arrangement of crops and fallow on a given area
is termed as cropping pattern in agriculture. The selection of crops and their varieties are
to be made depending on the soil, rainfall situation and other social and economic factors
of the area. Therefore, cropping pattern is found different in different areas depending on
the nature and condition of the soil, climatic conditions and others socio-economic
factors mentioned. In the same manner, cropping pattern of India and Karnataka is found
to be very different. Of course, the former covers entire country consists of all kinds of
soil, climatic condition, topographical condition and other socio-economic conditions.
And the latter is a subset of the former, covers small area of arable land. As Karnataka is
found to be a dry land farming State and shortage of water or rainfall, it is also found to
be one of the important factors responsible for switching over many of the farmers from
rice to other commercial dry farming in the State (Singha and Chakraborty, 2013b).
However, detail variability in area, production and productivity of major oil-seeds vis-à-
vis competing crops in Karnataka and India will be discussed through various Tables
given below.
In Table 3.4a one can find that the total cereal and food crops have been declining
constantly from 1970s till date, both in Karnataka and all India level. The share of food
and cereal crops to total GCA of Karnataka was found to be lower than that of India and
stood at 62.22 per cent and 68.41 per cent of the total GCA respectively in four decades.
However, the share of total oilseed to GCA in the State was higher than that of national
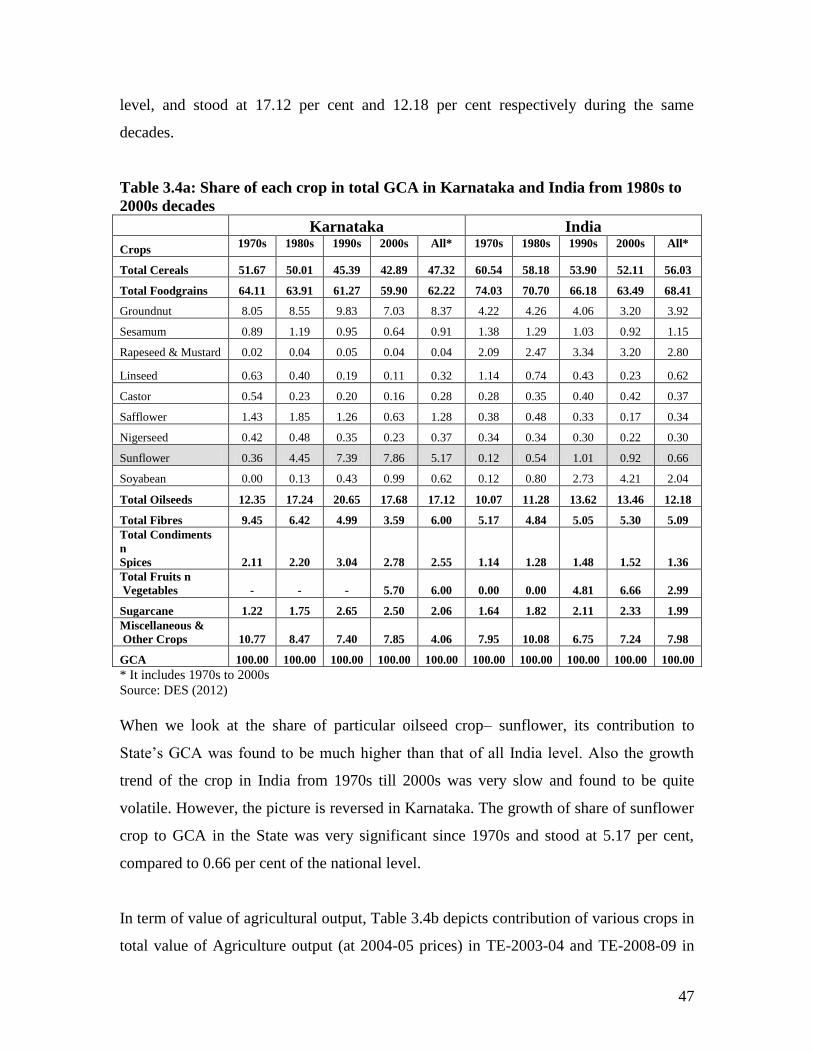
47
level, and stood at 17.12 per cent and 12.18 per cent respectively during the same
decades.
Table 3.4a: Share of each crop in total GCA in Karnataka and India from 1980s to
2000s decades
Karnataka India
Crops 1970s 1980s 1990s 2000s All* 1970s 1980s 1990s 2000s All*
Total Cereals 51.67 50.01 45.39 42.89 47.32 60.54 58.18 53.90 52.11 56.03
Total Foodgrains 64.11 63.91 61.27 59.90 62.22 74.03 70.70 66.18 63.49 68.41
Groundnut 8.05 8.55 9.83 7.03 8.37 4.22 4.26 4.06 3.20 3.92
Sesamum 0.89 1.19 0.95 0.64 0.91 1.38 1.29 1.03 0.92 1.15
Rapeseed & Mustard 0.02 0.04 0.05 0.04 0.04 2.09 2.47 3.34 3.20 2.80
Linseed 0.63 0.40 0.19 0.11 0.32 1.14 0.74 0.43 0.23 0.62
Castor 0.54 0.23 0.20 0.16 0.28 0.28 0.35 0.40 0.42 0.37
Safflower 1.43 1.85 1.26 0.63 1.28 0.38 0.48 0.33 0.17 0.34
Nigerseed 0.42 0.48 0.35 0.23 0.37 0.34 0.34 0.30 0.22 0.30
Sunflower 0.36 4.45 7.39 7.86 5.17 0.12 0.54 1.01 0.92 0.66
Soyabean 0.00 0.13 0.43 0.99 0.62 0.12 0.80 2.73 4.21 2.04
Total Oilseeds 12.35 17.24 20.65 17.68 17.12 10.07 11.28 13.62 13.46 12.18
Total Fibres 9.45 6.42 4.99 3.59 6.00 5.17 4.84 5.05 5.30 5.09
Total Condiments
n
Spices 2.11 2.20 3.04 2.78 2.55 1.14 1.28 1.48 1.52 1.36
Total Fruits n
Vegetables - - - 5.70 6.00 0.00 0.00 4.81 6.66 2.99
Sugarcane 1.22 1.75 2.65 2.50 2.06 1.64 1.82 2.11 2.33 1.99
Miscellaneous &
Other Crops 10.77 8.47 7.40 7.85 4.06 7.95 10.08 6.75 7.24 7.98
GCA 100.00 100.00 100.00 100.00 100.00 100.00 100.00 100.00 100.00 100.00
* It includes 1970s to 2000s
Source: DES (2012)
When we look at the share of particular oilseed crop– sunflower, its contribution to
State’s GCA was found to be much higher than that of all India level. Also the growth
trend of the crop in India from 1970s till 2000s was very slow and found to be quite
volatile. However, the picture is reversed in Karnataka. The growth of share of sunflower
crop to GCA in the State was very significant since 1970s and stood at 5.17 per cent,
compared to 0.66 per cent of the national level.
In term of value of agricultural output, Table 3.4b depicts contribution of various crops in
total value of Agriculture output (at 2004-05 prices) in TE-2003-04 and TE-2008-09 in
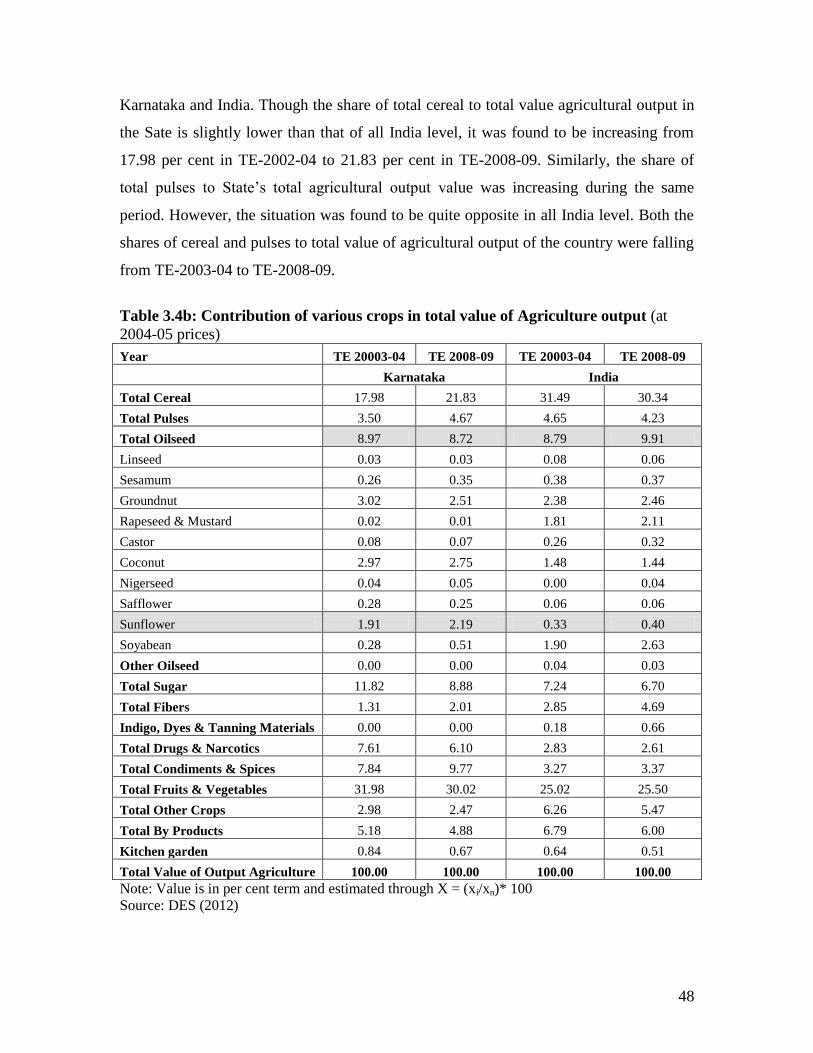
48
Karnataka and India. Though the share of total cereal to total value agricultural output in
the Sate is slightly lower than that of all India level, it was found to be increasing from
17.98 per cent in TE-2002-04 to 21.83 per cent in TE-2008-09. Similarly, the share of
total pulses to State’s total agricultural output value was increasing during the same
period. However, the situation was found to be quite opposite in all India level. Both the
shares of cereal and pulses to total value of agricultural output of the country were falling
from TE-2003-04 to TE-2008-09.
Table 3.4b: Contribution of various crops in total value of Agriculture output (at
2004-05 prices)
Year TE 20003-04 TE 2008-09 TE 20003-04 TE 2008-09
Karnataka India
Total Cereal 17.98 21.83 31.49 30.34
Total Pulses 3.50 4.67 4.65 4.23
Total Oilseed 8.97 8.72 8.79 9.91
Linseed 0.03 0.03 0.08 0.06
Sesamum 0.26 0.35 0.38 0.37
Groundnut 3.02 2.51 2.38 2.46
Rapeseed & Mustard 0.02 0.01 1.81 2.11
Castor 0.08 0.07 0.26 0.32
Coconut 2.97 2.75 1.48 1.44
Nigerseed 0.04 0.05 0.00 0.04
Safflower 0.28 0.25 0.06 0.06
Sunflower 1.91 2.19 0.33 0.40
Soyabean 0.28 0.51 1.90 2.63
Other Oilseed 0.00 0.00 0.04 0.03
Total Sugar 11.82 8.88 7.24 6.70
Total Fibers 1.31 2.01 2.85 4.69
Indigo, Dyes & Tanning Materials 0.00 0.00 0.18 0.66
Total Drugs & Narcotics 7.61 6.10 2.83 2.61
Total Condiments & Spices 7.84 9.77 3.27 3.37
Total Fruits & Vegetables 31.98 30.02 25.02 25.50
Total Other Crops 2.98 2.47 6.26 5.47
Total By Products 5.18 4.88 6.79 6.00
Kitchen garden 0.84 0.67 0.64 0.51
Total Value of Output Agriculture 100.00 100.00 100.00 100.00
Note: Value is in per cent term and estimated through X = (xi/xn)* 100
Source: DES (2012)
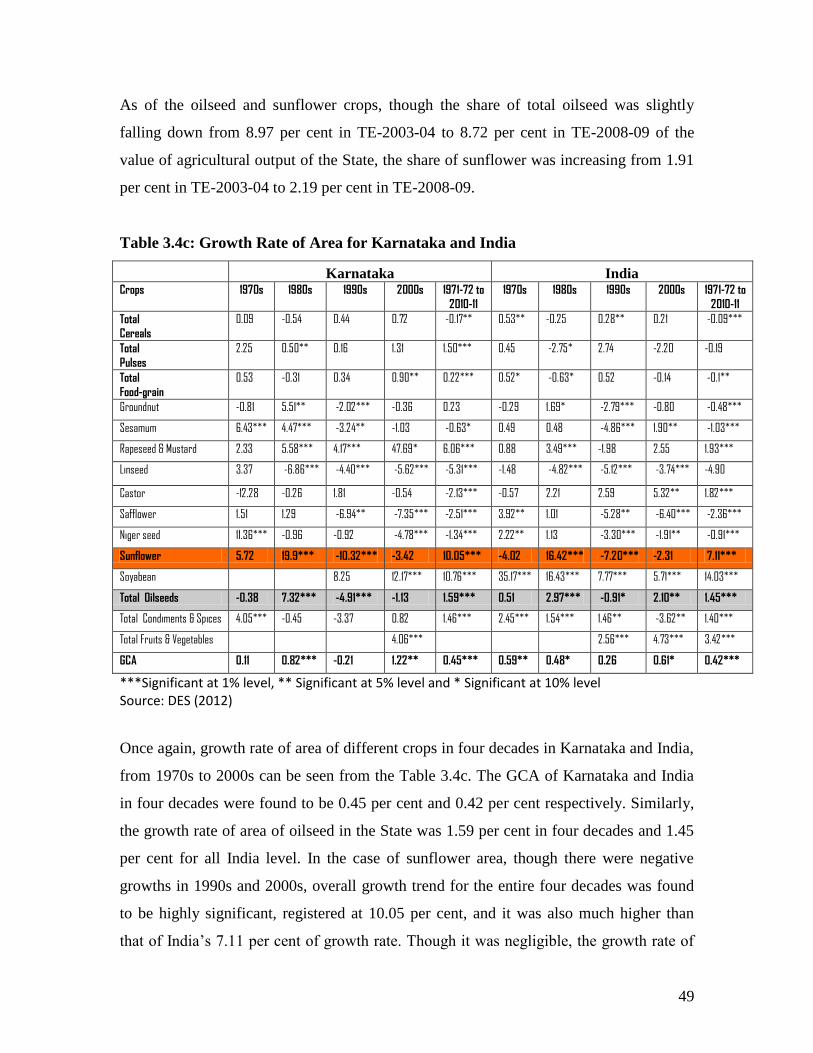
49
As of the oilseed and sunflower crops, though the share of total oilseed was slightly
falling down from 8.97 per cent in TE-2003-04 to 8.72 per cent in TE-2008-09 of the
value of agricultural output of the State, the share of sunflower was increasing from 1.91
per cent in TE-2003-04 to 2.19 per cent in TE-2008-09.
Table 3.4c: Growth Rate of Area for Karnataka and India
Karnataka India Crops 1970s 1980s 1990s 2000s 1971-72 to
2010-11
1970s 1980s 1990s 2000s 1971-72 to
2010-11
Total
Cereals
0.09 -0.54 0.44 0.72 -0.17** 0.53** -0.25 0.28** 0.21 -0.09***
Total
Pulses
2.25 0.50** 0.16 1.31 1.50*** 0.45 -2.75* 2.74 -2.20 -0.19
Total
Food-grain
0.53 -0.31 0.34 0.90** 0.22*** 0.52* -0.63* 0.52 -0.14 -0.1**
Groundnut -0.81 5.51** -2.02*** -0.36 0.23 -0.29 1.69* -2.79*** -0.80 -0.48***
Sesamum 6.43*** 4.47*** -3.24** -1.03 -0.63* 0.49 0.48 -4.86*** 1.90** -1.03***
Rapeseed & Mustard 2.33 5.58*** 4.17*** 47.69* 6.06*** 0.88 3.49*** -1.98 2.55 1.93***
Linseed 3.37 -6.86*** -4.40*** -5.62*** -5.31*** -1.48 -4.82*** -5.12*** -3.74*** -4.90
Castor -12.28 -0.26 1.81 -0.54 -2.13*** -0.57 2.21 2.59 5.32** 1.82***
Safflower 1.51 1.29 -6.94** -7.35*** -2.51*** 3.92** 1.01 -5.28** -6.40*** -2.36***
Niger seed 11.36*** -0.96 -0.92 -4.78*** -1.34*** 2.22** 1.13 -3.30*** -1.91** -0.91***
Sunflower 5.72 19.9*** -10.32*** -3.42 10.05*** -4.02 16.42*** -7.20*** -2.31 7.11***
Soyabean 8.25 12.17*** 10.76*** 35.17*** 16.43*** 7.77*** 5.71*** 14.03***
Total Oilseeds -0.38 7.32*** -4.91*** -1.13 1.59*** 0.51 2.97*** -0.91* 2.10** 1.45***
Total Condiments & Spices 4.05*** -0.45 -3.37 0.82 1.46*** 2.45*** 1.54*** 1.46** -3.62** 1.40***
Total Fruits & Vegetables 4.06*** 2.56*** 4.73*** 3.42***
GCA 0.11 0.82*** -0.21 1.22** 0.45*** 0.59** 0.48* 0.26 0.61* 0.42***
***Significant at 1% level, ** Significant at 5% level and * Significant at 10% level Source: DES (2012)
Once again, growth rate of area of different crops in four decades in Karnataka and India,
from 1970s to 2000s can be seen from the Table 3.4c. The GCA of Karnataka and India
in four decades were found to be 0.45 per cent and 0.42 per cent respectively. Similarly,
the growth rate of area of oilseed in the State was 1.59 per cent in four decades and 1.45
per cent for all India level. In the case of sunflower area, though there were negative
growths in 1990s and 2000s, overall growth trend for the entire four decades was found
to be highly significant, registered at 10.05 per cent, and it was also much higher than
that of India’s 7.11 per cent of growth rate. Though it was negligible, the growth rate of
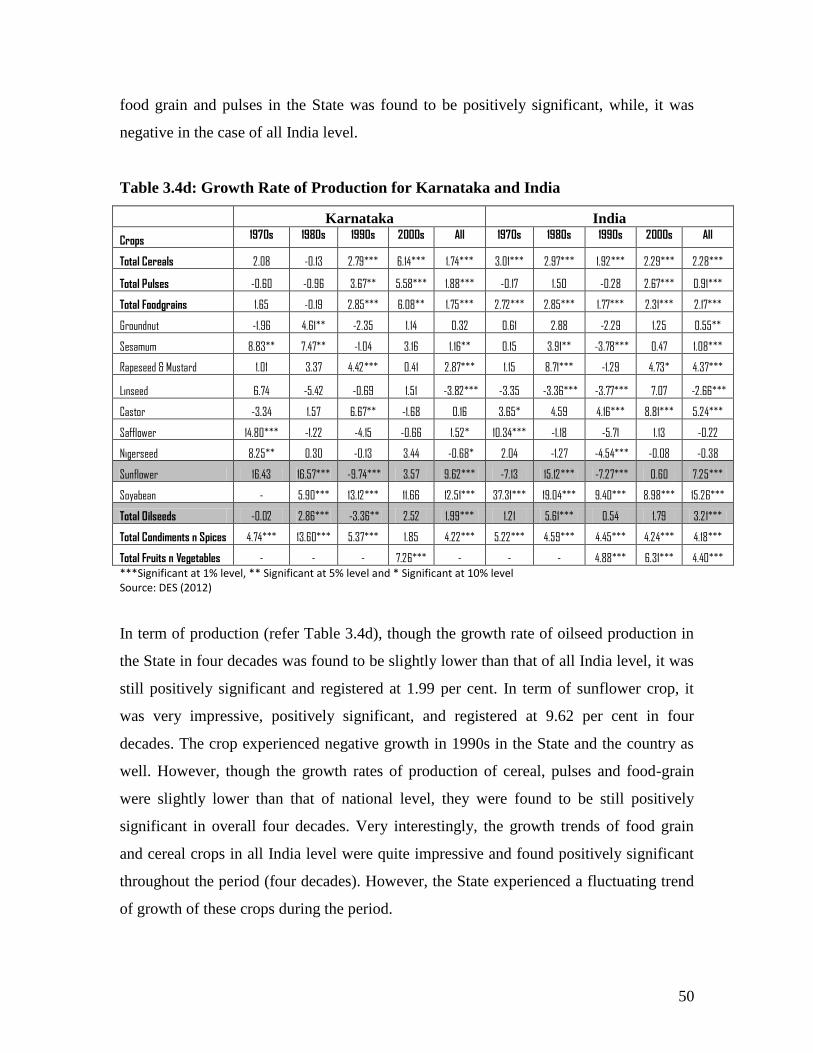
50
food grain and pulses in the State was found to be positively significant, while, it was
negative in the case of all India level.
Table 3.4d: Growth Rate of Production for Karnataka and India
Karnataka India
Crops 1970s 1980s 1990s 2000s All 1970s 1980s 1990s 2000s All
Total Cereals 2.08 -0.13 2.79*** 6.14*** 1.74*** 3.01*** 2.97*** 1.92*** 2.29*** 2.28***
Total Pulses -0.60 -0.96 3.67** 5.58*** 1.88*** -0.17 1.50 -0.28 2.67*** 0.91***
Total Foodgrains 1.65 -0.19 2.85*** 6.08** 1.75*** 2.72*** 2.85*** 1.77*** 2.31*** 2.17***
Groundnut -1.96 4.61** -2.35 1.14 0.32 0.61 2.88 -2.29 1.25 0.55**
Sesamum 8.83** 7.47** -1.04 3.16 1.16** 0.15 3.91** -3.78*** 0.47 1.08***
Rapeseed & Mustard 1.01 3.37 4.42*** 0.41 2.87*** 1.15 8.71*** -1.29 4.73* 4.37***
Linseed 6.74 -5.42 -0.69 1.51 -3.82*** -3.35 -3.36*** -3.77*** 7.07 -2.66***
Castor -3.34 1.57 6.67** -1.68 0.16 3.65* 4.59 4.16*** 8.81*** 5.24***
Safflower 14.80*** -1.22 -4.15 -0.66 1.52* 10.34*** -1.18 -5.71 1.13 -0.22
Nigerseed 8.25** 0.30 -0.13 3.44 -0.68* 2.04 -1.27 -4.54*** -0.08 -0.38
Sunflower 16.43 16.57*** -9.74*** 3.57 9.62*** -7.13 15.12*** -7.27*** 0.60 7.25***
Soyabean - 5.90*** 13.12*** 11.66 12.51*** 37.31*** 19.04*** 9.40*** 8.98*** 15.26***
Total Oilseeds -0.02 2.86*** -3.36** 2.52 1.99*** 1.21 5.61*** 0.54 1.79 3.21***
Total Condiments n Spices 4.74*** 13.60*** 5.37*** 1.85 4.22*** 5.22*** 4.59*** 4.45*** 4.24*** 4.18***
Total Fruits n Vegetables - - - 7.26*** - - - 4.88*** 6.31*** 4.40***
***Significant at 1% level, ** Significant at 5% level and * Significant at 10% level Source: DES (2012)
In term of production (refer Table 3.4d), though the growth rate of oilseed production in
the State in four decades was found to be slightly lower than that of all India level, it was
still positively significant and registered at 1.99 per cent. In term of sunflower crop, it
was very impressive, positively significant, and registered at 9.62 per cent in four
decades. The crop experienced negative growth in 1990s in the State and the country as
well. However, though the growth rates of production of cereal, pulses and food-grain
were slightly lower than that of national level, they were found to be still positively
significant in overall four decades. Very interestingly, the growth trends of food grain
and cereal crops in all India level were quite impressive and found positively significant
throughout the period (four decades). However, the State experienced a fluctuating trend
of growth of these crops during the period.
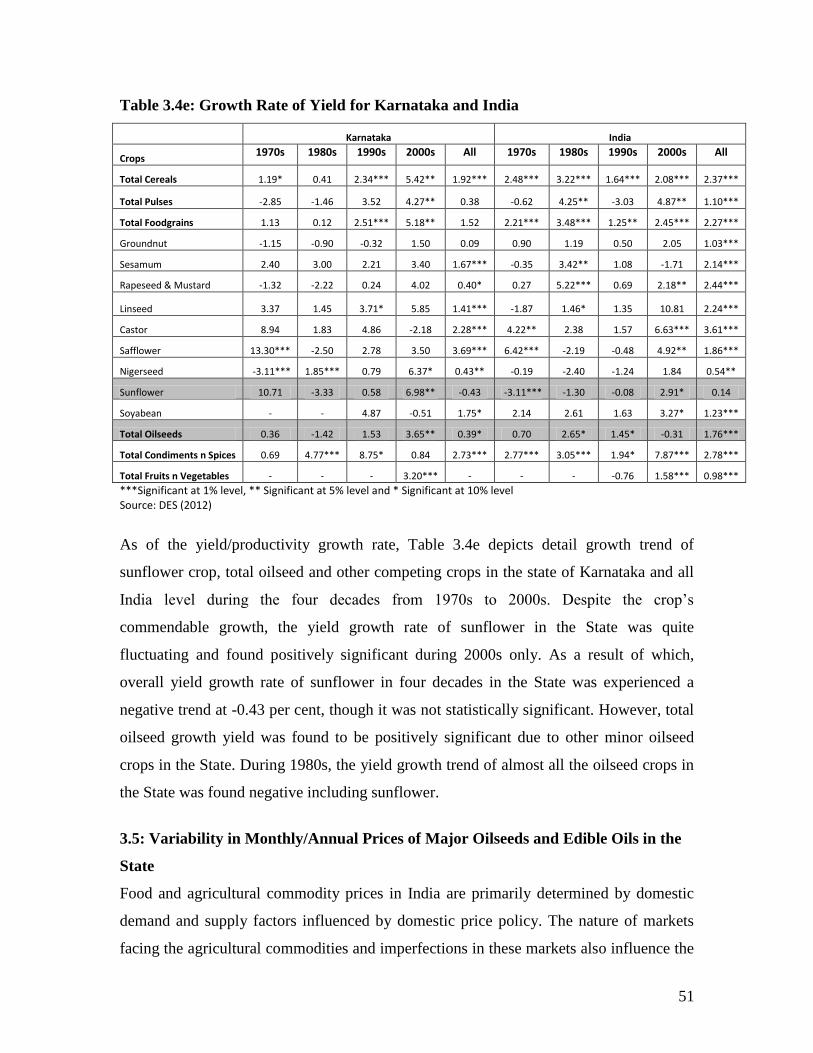
51
Table 3.4e: Growth Rate of Yield for Karnataka and India
Karnataka India
Crops 1970s 1980s 1990s 2000s All 1970s 1980s 1990s 2000s All
Total Cereals 1.19* 0.41 2.34*** 5.42** 1.92*** 2.48*** 3.22*** 1.64*** 2.08*** 2.37***
Total Pulses -2.85 -1.46 3.52 4.27** 0.38 -0.62 4.25** -3.03 4.87** 1.10***
Total Foodgrains 1.13 0.12 2.51*** 5.18** 1.52 2.21*** 3.48*** 1.25** 2.45*** 2.27***
Groundnut -1.15 -0.90 -0.32 1.50 0.09 0.90 1.19 0.50 2.05 1.03***
Sesamum 2.40 3.00 2.21 3.40 1.67*** -0.35 3.42** 1.08 -1.71 2.14***
Rapeseed & Mustard -1.32 -2.22 0.24 4.02 0.40* 0.27 5.22*** 0.69 2.18** 2.44***
Linseed 3.37 1.45 3.71* 5.85 1.41*** -1.87 1.46* 1.35 10.81 2.24***
Castor 8.94 1.83 4.86 -2.18 2.28*** 4.22** 2.38 1.57 6.63*** 3.61***
Safflower 13.30*** -2.50 2.78 3.50 3.69*** 6.42*** -2.19 -0.48 4.92** 1.86***
Nigerseed -3.11*** 1.85*** 0.79 6.37* 0.43** -0.19 -2.40 -1.24 1.84 0.54**
Sunflower 10.71 -3.33 0.58 6.98** -0.43 -3.11*** -1.30 -0.08 2.91* 0.14
Soyabean - - 4.87 -0.51 1.75* 2.14 2.61 1.63 3.27* 1.23***
Total Oilseeds 0.36 -1.42 1.53 3.65** 0.39* 0.70 2.65* 1.45* -0.31 1.76***
Total Condiments n Spices 0.69 4.77*** 8.75* 0.84 2.73*** 2.77*** 3.05*** 1.94* 7.87*** 2.78***
Total Fruits n Vegetables - - - 3.20*** - - - -0.76 1.58*** 0.98***
***Significant at 1% level, ** Significant at 5% level and * Significant at 10% level Source: DES (2012)
As of the yield/productivity growth rate, Table 3.4e depicts detail growth trend of
sunflower crop, total oilseed and other competing crops in the state of Karnataka and all
India level during the four decades from 1970s to 2000s. Despite the crop’s
commendable growth, the yield growth rate of sunflower in the State was quite
fluctuating and found positively significant during 2000s only. As a result of which,
overall yield growth rate of sunflower in four decades in the State was experienced a
negative trend at -0.43 per cent, though it was not statistically significant. However, total
oilseed growth yield was found to be positively significant due to other minor oilseed
crops in the State. During 1980s, the yield growth trend of almost all the oilseed crops in
the State was found negative including sunflower.
3.5: Variability in Monthly/Annual Prices of Major Oilseeds and Edible Oils in the
State
Food and agricultural commodity prices in India are primarily determined by domestic
demand and supply factors influenced by domestic price policy. The nature of markets
facing the agricultural commodities and imperfections in these markets also influence the
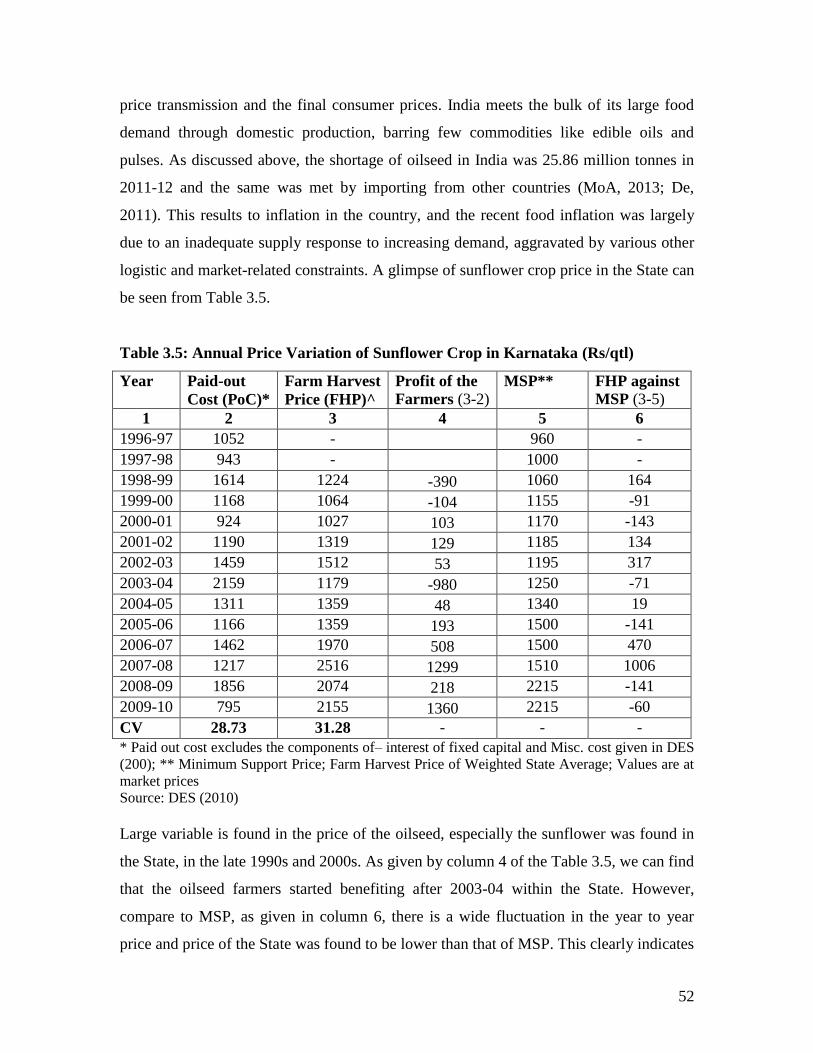
52
price transmission and the final consumer prices. India meets the bulk of its large food
demand through domestic production, barring few commodities like edible oils and
pulses. As discussed above, the shortage of oilseed in India was 25.86 million tonnes in
2011-12 and the same was met by importing from other countries (MoA, 2013; De,
2011). This results to inflation in the country, and the recent food inflation was largely
due to an inadequate supply response to increasing demand, aggravated by various other
logistic and market-related constraints. A glimpse of sunflower crop price in the State can
be seen from Table 3.5.
Table 3.5: Annual Price Variation of Sunflower Crop in Karnataka (Rs/qtl)
Year Paid-out
Cost (PoC)*
Farm Harvest
Price (FHP)^
Profit of the
Farmers (3-2) MSP** FHP against
MSP (3-5)
1 2 3 4 5 6
1996-97 1052 - 960 -
1997-98 943 - 1000 -
1998-99 1614 1224 -390 1060 164
1999-00 1168 1064 -104 1155 -91
2000-01 924 1027 103 1170 -143
2001-02 1190 1319 129 1185 134
2002-03 1459 1512 53 1195 317
2003-04 2159 1179 -980 1250 -71
2004-05 1311 1359 48 1340 19
2005-06 1166 1359 193 1500 -141
2006-07 1462 1970 508 1500 470
2007-08 1217 2516 1299 1510 1006
2008-09 1856 2074 218 2215 -141
2009-10 795 2155 1360 2215 -60
CV 28.73 31.28 - - -
* Paid out cost excludes the components of– interest of fixed capital and Misc. cost given in DES
(200); ** Minimum Support Price; Farm Harvest Price of Weighted State Average; Values are at
market prices
Source: DES (2010)
Large variable is found in the price of the oilseed, especially the sunflower was found in
the State, in the late 1990s and 2000s. As given by column 4 of the Table 3.5, we can find
that the oilseed farmers started benefiting after 2003-04 within the State. However,
compare to MSP, as given in column 6, there is a wide fluctuation in the year to year
price and price of the State was found to be lower than that of MSP. This clearly indicates
53
that there is wide variation in the sunflower price of Karnataka, not only within the State,
but also compared to national level.
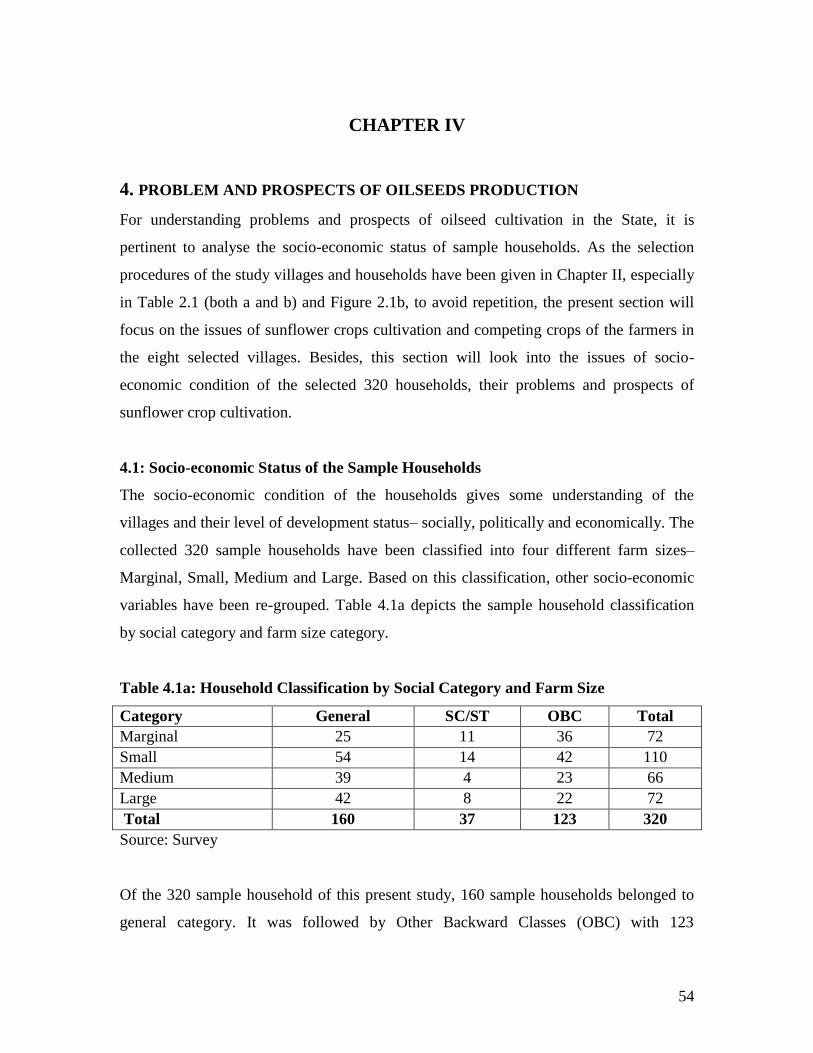
54
CHAPTER IV
4. PROBLEM AND PROSPECTS OF OILSEEDS PRODUCTION
For understanding problems and prospects of oilseed cultivation in the State, it is
pertinent to analyse the socio-economic status of sample households. As the selection
procedures of the study villages and households have been given in Chapter II, especially
in Table 2.1 (both a and b) and Figure 2.1b, to avoid repetition, the present section will
focus on the issues of sunflower crops cultivation and competing crops of the farmers in
the eight selected villages. Besides, this section will look into the issues of socio-
economic condition of the selected 320 households, their problems and prospects of
sunflower crop cultivation.
4.1: Socio-economic Status of the Sample Households
The socio-economic condition of the households gives some understanding of the
villages and their level of development status– socially, politically and economically. The
collected 320 sample households have been classified into four different farm sizes–
Marginal, Small, Medium and Large. Based on this classification, other socio-economic
variables have been re-grouped. Table 4.1a depicts the sample household classification
by social category and farm size category.
Table 4.1a: Household Classification by Social Category and Farm Size
Category General SC/ST OBC Total
Marginal 25 11 36 72
Small 54 14 42 110
Medium 39 4 23 66
Large 42 8 22 72
Total 160 37 123 320
Source: Survey
Of the 320 sample household of this present study, 160 sample households belonged to
general category. It was followed by Other Backward Classes (OBC) with 123
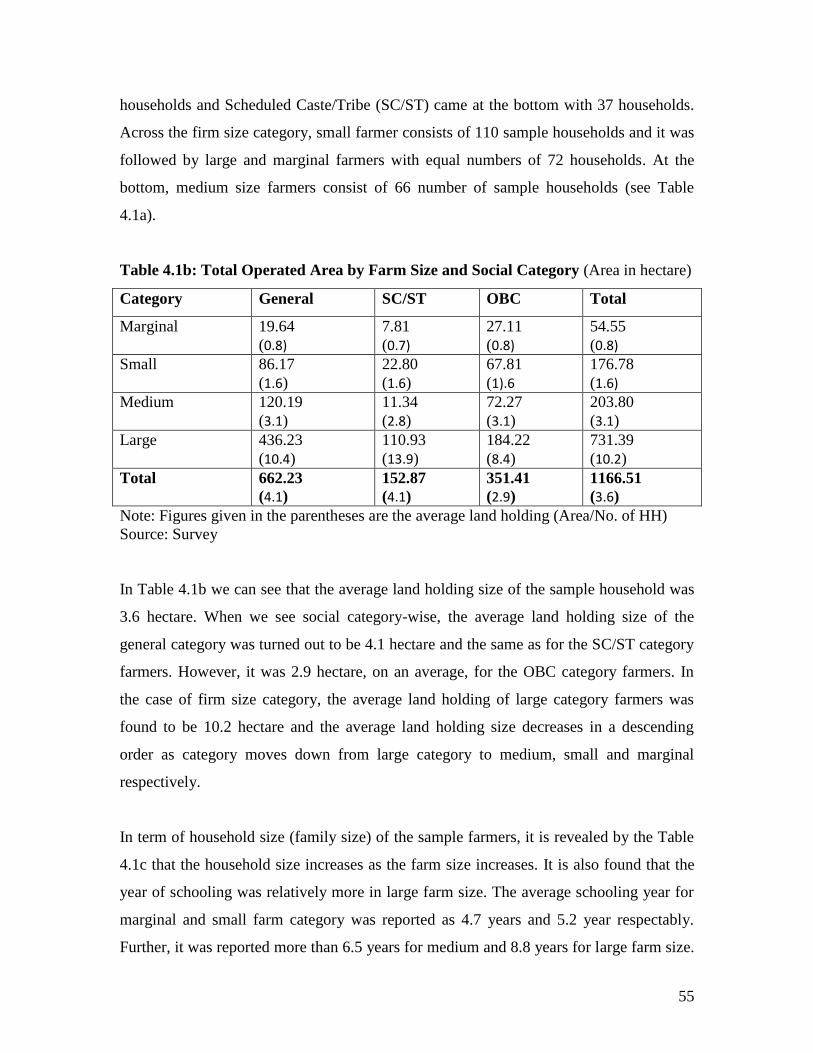
55
households and Scheduled Caste/Tribe (SC/ST) came at the bottom with 37 households.
Across the firm size category, small farmer consists of 110 sample households and it was
followed by large and marginal farmers with equal numbers of 72 households. At the
bottom, medium size farmers consist of 66 number of sample households (see Table
4.1a).
Table 4.1b: Total Operated Area by Farm Size and Social Category (Area in hectare)
Category General SC/ST OBC Total
Marginal 19.64
(0.8)
7.81
(0.7)
27.11
(0.8)
54.55
(0.8)
Small 86.17
(1.6)
22.80
(1.6)
67.81
(1).6
176.78
(1.6)
Medium 120.19
(3.1)
11.34
(2.8)
72.27
(3.1)
203.80
(3.1)
Large 436.23
(10.4)
110.93
(13.9)
184.22
(8.4)
731.39
(10.2)
Total 662.23
(4.1)
152.87
(4.1)
351.41
(2.9)
1166.51
(3.6)
Note: Figures given in the parentheses are the average land holding (Area/No. of HH)
Source: Survey
In Table 4.1b we can see that the average land holding size of the sample household was
3.6 hectare. When we see social category-wise, the average land holding size of the
general category was turned out to be 4.1 hectare and the same as for the SC/ST category
farmers. However, it was 2.9 hectare, on an average, for the OBC category farmers. In
the case of firm size category, the average land holding of large category farmers was
found to be 10.2 hectare and the average land holding size decreases in a descending
order as category moves down from large category to medium, small and marginal
respectively.
In term of household size (family size) of the sample farmers, it is revealed by the Table
4.1c that the household size increases as the farm size increases. It is also found that the
year of schooling was relatively more in large farm size. The average schooling year for
marginal and small farm category was reported as 4.7 years and 5.2 year respectably.
Further, it was reported more than 6.5 years for medium and 8.8 years for large farm size.
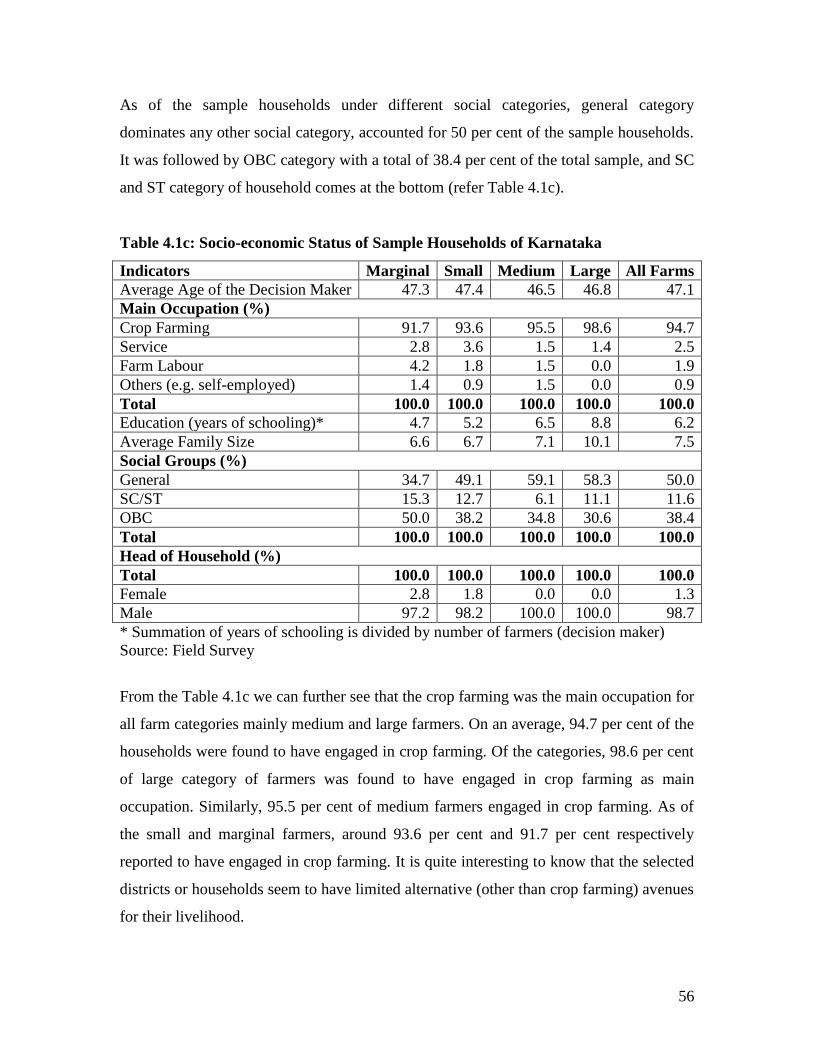
56
As of the sample households under different social categories, general category
dominates any other social category, accounted for 50 per cent of the sample households.
It was followed by OBC category with a total of 38.4 per cent of the total sample, and SC
and ST category of household comes at the bottom (refer Table 4.1c).
Table 4.1c: Socio-economic Status of Sample Households of Karnataka
Indicators Marginal Small Medium Large All Farms
Average Age of the Decision Maker 47.3 47.4 46.5 46.8 47.1
Main Occupation (%)
Crop Farming 91.7 93.6 95.5 98.6 94.7
Service 2.8 3.6 1.5 1.4 2.5
Farm Labour 4.2 1.8 1.5 0.0 1.9
Others (e.g. self-employed) 1.4 0.9 1.5 0.0 0.9
Total 100.0 100.0 100.0 100.0 100.0
Education (years of schooling)* 4.7 5.2 6.5 8.8 6.2
Average Family Size 6.6 6.7 7.1 10.1 7.5
Social Groups (%)
General 34.7 49.1 59.1 58.3 50.0
SC/ST 15.3 12.7 6.1 11.1 11.6
OBC 50.0 38.2 34.8 30.6 38.4
Total 100.0 100.0 100.0 100.0 100.0
Head of Household (%)
Total 100.0 100.0 100.0 100.0 100.0
Female 2.8 1.8 0.0 0.0 1.3
Male 97.2 98.2 100.0 100.0 98.7
* Summation of years of schooling is divided by number of farmers (decision maker)
Source: Field Survey
From the Table 4.1c we can further see that the crop farming was the main occupation for
all farm categories mainly medium and large farmers. On an average, 94.7 per cent of the
households were found to have engaged in crop farming. Of the categories, 98.6 per cent
of large category of farmers was found to have engaged in crop farming as main
occupation. Similarly, 95.5 per cent of medium farmers engaged in crop farming. As of
the small and marginal farmers, around 93.6 per cent and 91.7 per cent respectively
reported to have engaged in crop farming. It is quite interesting to know that the selected
districts or households seem to have limited alternative (other than crop farming) avenues
for their livelihood.
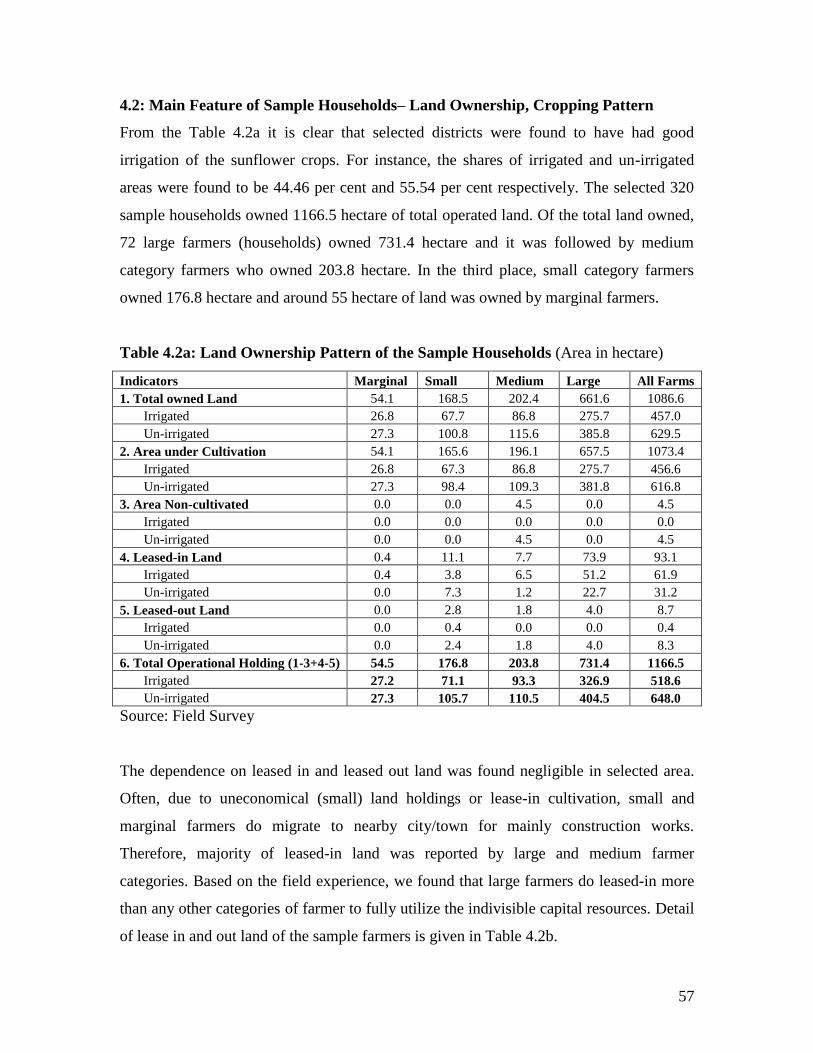
57
4.2: Main Feature of Sample Households– Land Ownership, Cropping Pattern
From the Table 4.2a it is clear that selected districts were found to have had good
irrigation of the sunflower crops. For instance, the shares of irrigated and un-irrigated
areas were found to be 44.46 per cent and 55.54 per cent respectively. The selected 320
sample households owned 1166.5 hectare of total operated land. Of the total land owned,
72 large farmers (households) owned 731.4 hectare and it was followed by medium
category farmers who owned 203.8 hectare. In the third place, small category farmers
owned 176.8 hectare and around 55 hectare of land was owned by marginal farmers.
Table 4.2a: Land Ownership Pattern of the Sample Households (Area in hectare)
Indicators Marginal Small Medium Large All Farms
1. Total owned Land 54.1 168.5 202.4 661.6 1086.6
Irrigated 26.8 67.7 86.8 275.7 457.0
Un-irrigated 27.3 100.8 115.6 385.8 629.5
2. Area under Cultivation 54.1 165.6 196.1 657.5 1073.4
Irrigated 26.8 67.3 86.8 275.7 456.6
Un-irrigated 27.3 98.4 109.3 381.8 616.8
3. Area Non-cultivated 0.0 0.0 4.5 0.0 4.5
Irrigated 0.0 0.0 0.0 0.0 0.0
Un-irrigated 0.0 0.0 4.5 0.0 4.5
4. Leased-in Land 0.4 11.1 7.7 73.9 93.1
Irrigated 0.4 3.8 6.5 51.2 61.9
Un-irrigated 0.0 7.3 1.2 22.7 31.2
5. Leased-out Land 0.0 2.8 1.8 4.0 8.7
Irrigated 0.0 0.4 0.0 0.0 0.4
Un-irrigated 0.0 2.4 1.8 4.0 8.3
6. Total Operational Holding (1-3+4-5) 54.5 176.8 203.8 731.4 1166.5
Irrigated 27.2 71.1 93.3 326.9 518.6
Un-irrigated 27.3 105.7 110.5 404.5 648.0
Source: Field Survey
The dependence on leased in and leased out land was found negligible in selected area.
Often, due to uneconomical (small) land holdings or lease-in cultivation, small and
marginal farmers do migrate to nearby city/town for mainly construction works.
Therefore, majority of leased-in land was reported by large and medium farmer
categories. Based on the field experience, we found that large farmers do leased-in more
than any other categories of farmer to fully utilize the indivisible capital resources. Detail
of lease in and out land of the sample farmers is given in Table 4.2b.
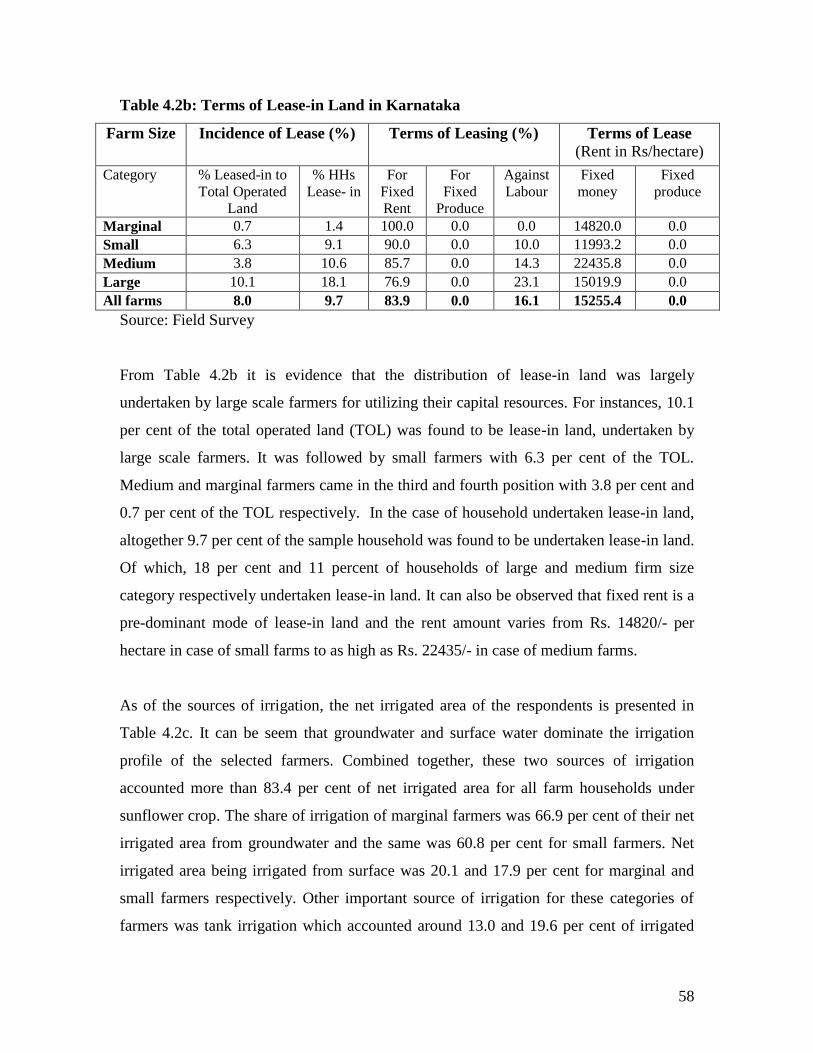
58
Table 4.2b: Terms of Lease-in Land in Karnataka
Farm Size Incidence of Lease (%) Terms of Leasing (%) Terms of Lease
(Rent in Rs/hectare)
Category % Leased-in to
Total Operated
Land
% HHs
Lease- in
For
Fixed
Rent
For
Fixed
Produce
Against
Labour
Fixed
money
Fixed
produce
Marginal 0.7 1.4 100.0 0.0 0.0 14820.0 0.0
Small 6.3 9.1 90.0 0.0 10.0 11993.2 0.0
Medium 3.8 10.6 85.7 0.0 14.3 22435.8 0.0
Large 10.1 18.1 76.9 0.0 23.1 15019.9 0.0
All farms 8.0 9.7 83.9 0.0 16.1 15255.4 0.0
Source: Field Survey
From Table 4.2b it is evidence that the distribution of lease-in land was largely
undertaken by large scale farmers for utilizing their capital resources. For instances, 10.1
per cent of the total operated land (TOL) was found to be lease-in land, undertaken by
large scale farmers. It was followed by small farmers with 6.3 per cent of the TOL.
Medium and marginal farmers came in the third and fourth position with 3.8 per cent and
0.7 per cent of the TOL respectively. In the case of household undertaken lease-in land,
altogether 9.7 per cent of the sample household was found to be undertaken lease-in land.
Of which, 18 per cent and 11 percent of households of large and medium firm size
category respectively undertaken lease-in land. It can also be observed that fixed rent is a
pre-dominant mode of lease-in land and the rent amount varies from Rs. 14820/- per
hectare in case of small farms to as high as Rs. 22435/- in case of medium farms.
As of the sources of irrigation, the net irrigated area of the respondents is presented in
Table 4.2c. It can be seem that groundwater and surface water dominate the irrigation
profile of the selected farmers. Combined together, these two sources of irrigation
accounted more than 83.4 per cent of net irrigated area for all farm households under
sunflower crop. The share of irrigation of marginal farmers was 66.9 per cent of their net
irrigated area from groundwater and the same was 60.8 per cent for small farmers. Net
irrigated area being irrigated from surface was 20.1 and 17.9 per cent for marginal and
small farmers respectively. Other important source of irrigation for these categories of
farmers was tank irrigation which accounted around 13.0 and 19.6 per cent of irrigated
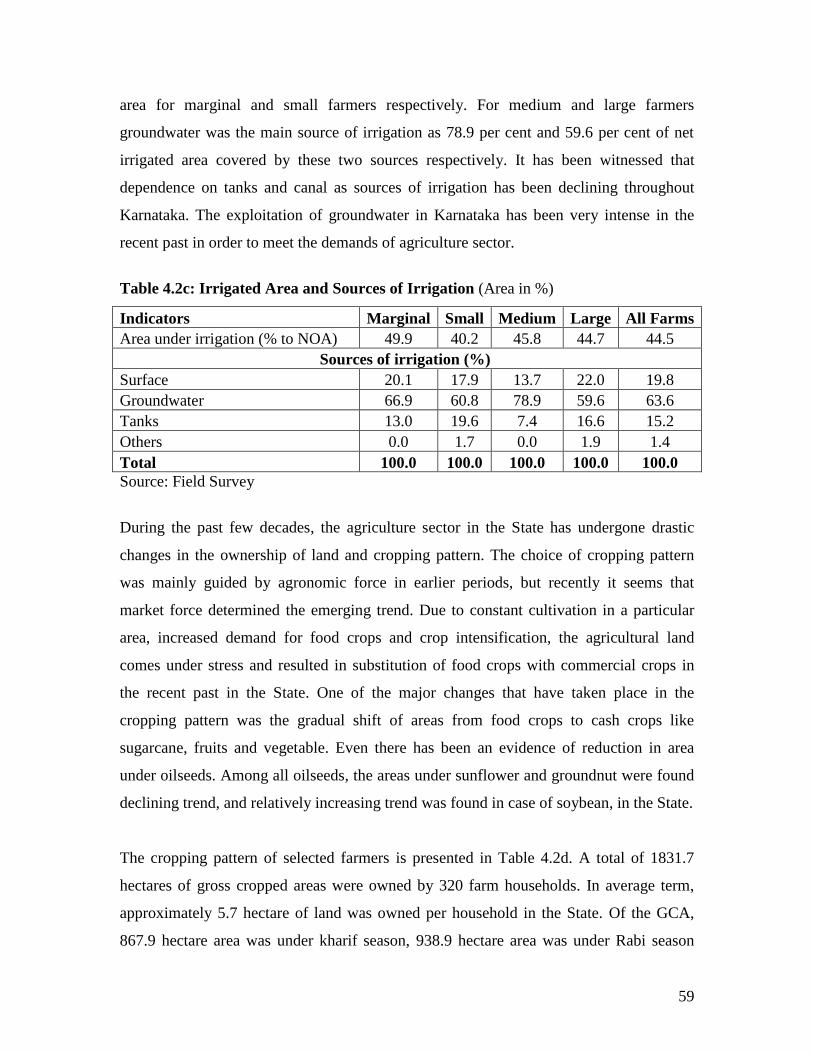
59
area for marginal and small farmers respectively. For medium and large farmers
groundwater was the main source of irrigation as 78.9 per cent and 59.6 per cent of net
irrigated area covered by these two sources respectively. It has been witnessed that
dependence on tanks and canal as sources of irrigation has been declining throughout
Karnataka. The exploitation of groundwater in Karnataka has been very intense in the
recent past in order to meet the demands of agriculture sector.
Table 4.2c: Irrigated Area and Sources of Irrigation (Area in %)
Indicators Marginal Small Medium Large All Farms
Area under irrigation (% to NOA) 49.9 40.2 45.8 44.7 44.5
Sources of irrigation (%)
Surface 20.1 17.9 13.7 22.0 19.8
Groundwater 66.9 60.8 78.9 59.6 63.6
Tanks 13.0 19.6 7.4 16.6 15.2
Others 0.0 1.7 0.0 1.9 1.4
Total 100.0 100.0 100.0 100.0 100.0
Source: Field Survey
During the past few decades, the agriculture sector in the State has undergone drastic
changes in the ownership of land and cropping pattern. The choice of cropping pattern
was mainly guided by agronomic force in earlier periods, but recently it seems that
market force determined the emerging trend. Due to constant cultivation in a particular
area, increased demand for food crops and crop intensification, the agricultural land
comes under stress and resulted in substitution of food crops with commercial crops in
the recent past in the State. One of the major changes that have taken place in the
cropping pattern was the gradual shift of areas from food crops to cash crops like
sugarcane, fruits and vegetable. Even there has been an evidence of reduction in area
under oilseeds. Among all oilseeds, the areas under sunflower and groundnut were found
declining trend, and relatively increasing trend was found in case of soybean, in the State.
The cropping pattern of selected farmers is presented in Table 4.2d. A total of 1831.7
hectares of gross cropped areas were owned by 320 farm households. In average term,
approximately 5.7 hectare of land was owned per household in the State. Of the GCA,
867.9 hectare area was under kharif season, 938.9 hectare area was under Rabi season
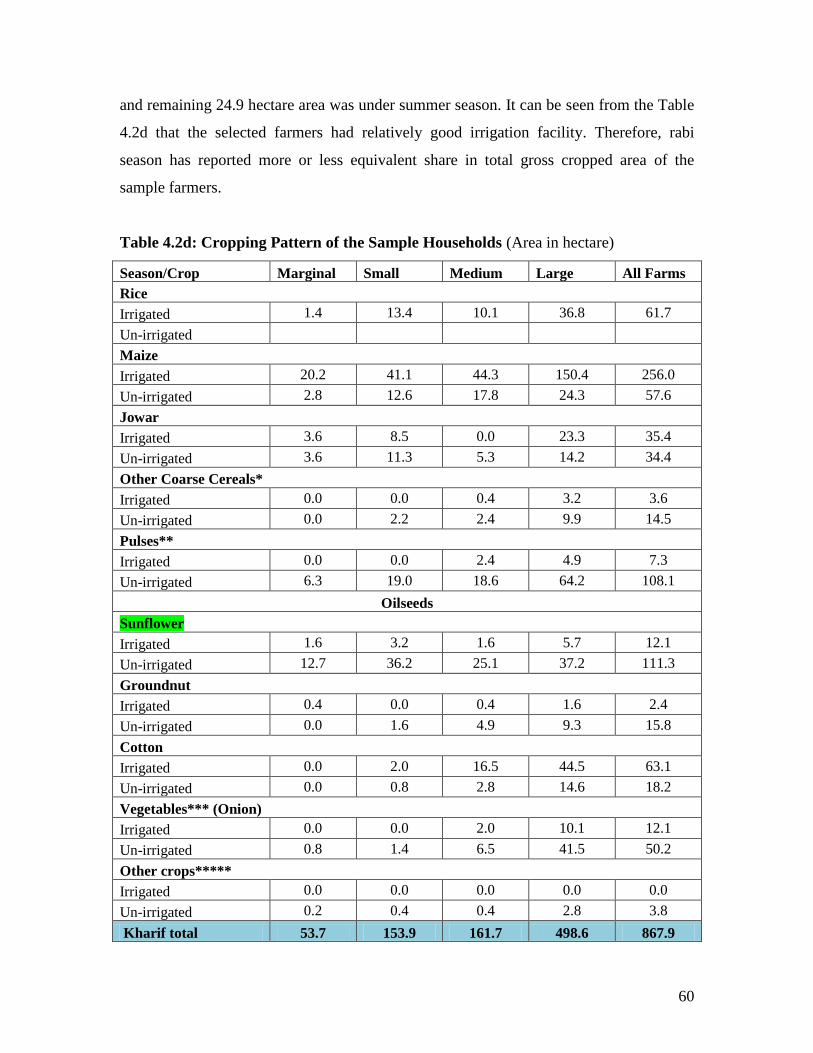
60
and remaining 24.9 hectare area was under summer season. It can be seen from the Table
4.2d that the selected farmers had relatively good irrigation facility. Therefore, rabi
season has reported more or less equivalent share in total gross cropped area of the
sample farmers.
Table 4.2d: Cropping Pattern of the Sample Households (Area in hectare)
Season/Crop Marginal Small Medium Large All Farms
Rice
Irrigated 1.4 13.4 10.1 36.8 61.7
Un-irrigated
Maize
Irrigated 20.2 41.1 44.3 150.4 256.0
Un-irrigated 2.8 12.6 17.8 24.3 57.6
Jowar
Irrigated 3.6 8.5 0.0 23.3 35.4
Un-irrigated 3.6 11.3 5.3 14.2 34.4
Other Coarse Cereals*
Irrigated 0.0 0.0 0.4 3.2 3.6
Un-irrigated 0.0 2.2 2.4 9.9 14.5
Pulses**
Irrigated 0.0 0.0 2.4 4.9 7.3
Un-irrigated 6.3 19.0 18.6 64.2 108.1
Oilseeds
Sunflower
Irrigated 1.6 3.2 1.6 5.7 12.1
Un-irrigated 12.7 36.2 25.1 37.2 111.3
Groundnut
Irrigated 0.4 0.0 0.4 1.6 2.4
Un-irrigated 0.0 1.6 4.9 9.3 15.8
Cotton
Irrigated 0.0 2.0 16.5 44.5 63.1
Un-irrigated 0.0 0.8 2.8 14.6 18.2
Vegetables*** (Onion)
Irrigated 0.0 0.0 2.0 10.1 12.1
Un-irrigated 0.8 1.4 6.5 41.5 50.2
Other crops*****
Irrigated 0.0 0.0 0.0 0.0 0.0
Un-irrigated 0.2 0.4 0.4 2.8 3.8
Kharif total 53.7 153.9 161.7 498.6 867.9
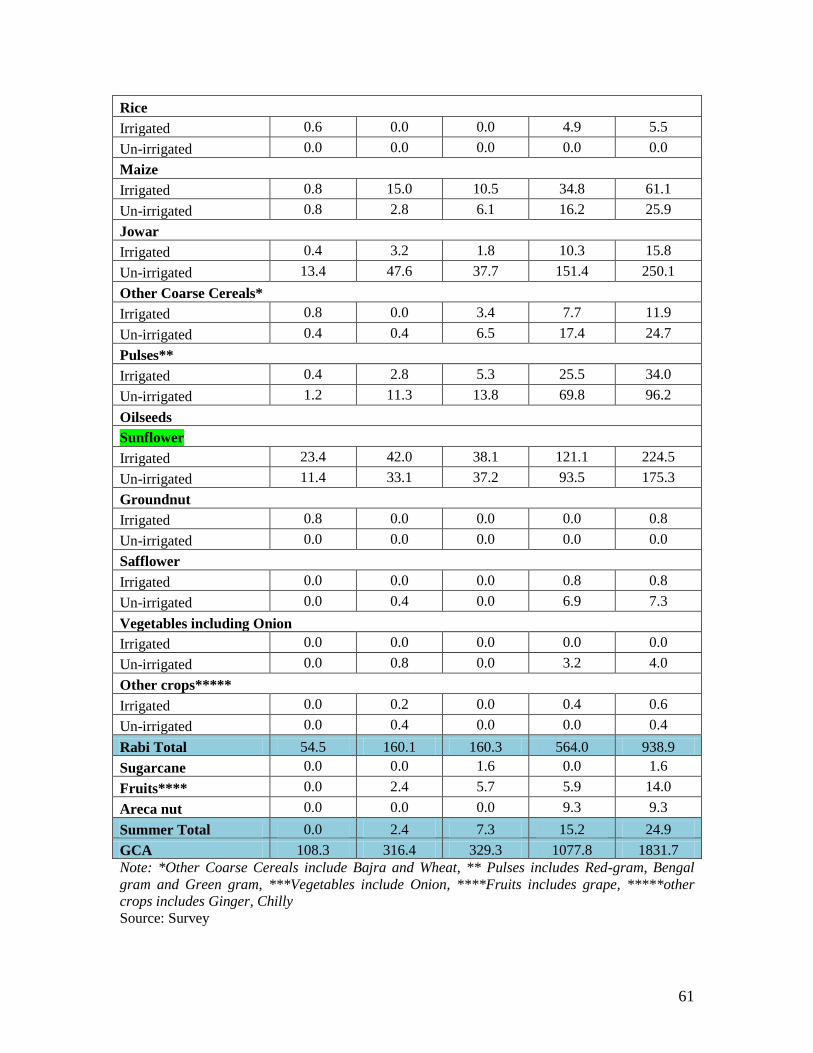
61
Rice
Irrigated 0.6 0.0 0.0 4.9 5.5
Un-irrigated 0.0 0.0 0.0 0.0 0.0
Maize
Irrigated 0.8 15.0 10.5 34.8 61.1
Un-irrigated 0.8 2.8 6.1 16.2 25.9
Jowar
Irrigated 0.4 3.2 1.8 10.3 15.8
Un-irrigated 13.4 47.6 37.7 151.4 250.1
Other Coarse Cereals*
Irrigated 0.8 0.0 3.4 7.7 11.9
Un-irrigated 0.4 0.4 6.5 17.4 24.7
Pulses**
Irrigated 0.4 2.8 5.3 25.5 34.0
Un-irrigated 1.2 11.3 13.8 69.8 96.2
Oilseeds
Sunflower
Irrigated 23.4 42.0 38.1 121.1 224.5
Un-irrigated 11.4 33.1 37.2 93.5 175.3
Groundnut
Irrigated 0.8 0.0 0.0 0.0 0.8
Un-irrigated 0.0 0.0 0.0 0.0 0.0
Safflower
Irrigated 0.0 0.0 0.0 0.8 0.8
Un-irrigated 0.0 0.4 0.0 6.9 7.3
Vegetables including Onion
Irrigated 0.0 0.0 0.0 0.0 0.0
Un-irrigated 0.0 0.8 0.0 3.2 4.0
Other crops*****
Irrigated 0.0 0.2 0.0 0.4 0.6
Un-irrigated 0.0 0.4 0.0 0.0 0.4
Rabi Total 54.5 160.1 160.3 564.0 938.9
Sugarcane 0.0 0.0 1.6 0.0 1.6
Fruits**** 0.0 2.4 5.7 5.9 14.0
Areca nut 0.0 0.0 0.0 9.3 9.3
Summer Total 0.0 2.4 7.3 15.2 24.9
GCA 108.3 316.4 329.3 1077.8 1831.7
Note: *Other Coarse Cereals include Bajra and Wheat, ** Pulses includes Red-gram, Bengal
gram and Green gram, ***Vegetables include Onion, ****Fruits includes grape, *****other
crops includes Ginger, Chilly
Source: Survey
62
As of the irrigation facilities, a total of 833.9 hectares have been reported to be irrigated
and 997.8 hectares were found to be un-irrigated. Quite opposite to the DES (2013)
statistics of 32.8 per cent of irrigated area to GCA in 2010-11 in the State, the present
study found almost 46 per cent of GCA of sample household was irrigated. Also, the
share of sunflower area under irrigation was 56.2 per cent of the total sunflower area of
the sample farmers. Despite kharif being the major crop season in Karnataka, the area
under kharif crops was found to be lower than that of rabi crop area of cultivation of the
sample farmers. For instance, previous year (2011-12), due to late and lower rainfall, the
sowing of kharif crops was started in the month of September and October in Bijapur
district. Due to this vagary of monsoon, farmer from this district do prefer to cultivate in
rabi season. During kharif season, maize crop dominates the cultivation of the selected
farmers. Maize accounted 313.6 hectare of area during kharif season for all the
households, followed by 141.6 hectare area accounted by total oilseeds seeds. Of the
oilseed, 111.3 hectare was found under sunflower and 18.2 hectare under groundnut crop
of the sample farmers. Pulses and cotton were the other major crops grown by selected
farmers in the State. It was also found that rice, maize and cotton are the main crops
grown under irrigated area whereas core cereals, pulses and oilseeds mainly grown under
un-irrigated areas.
It is found from Table 4.2d that around 938.9 hectare gross cropped areas were reported
during rabi season. Of which, 355.0 hectares were under irrigation and the remaining
583.9 hectares were found to be without irrigation. Primary field visit found that the
selected villages were facing scarcity of water, especially for cultivation. It was also
revealed by the primary survey that the selected farmers of the State give priority to grow
more food crops than that of commercial/cash crops. As a result, cash crop cultivation
reported to have higher share in rabi season than that of kharif season. Therefore, of the
total 523.2 hectares of sunflower area cultivation by the sample farmers, 399.8 hectares
were under the rabi season. The area under sunflower was 76.4 per cent of the total and
the irrigated area under the crop was 45.22 per cent. Of the 399.8 hectares of sunflower
area under rabi season, 224.5 hectares were found to be irrigated and remaining 175.3
hectares were un-irrigated. In percentage term, the irrigated area under sunflower in rabi
63
season turned out to be 56.2 percent of the total sunflower crop area of the sample
farmers.
As of the other oilseed crops, Safflower and groundnut were the other minor oilseeds
crops grown by the selected farmers. However, Jowar, Pulses and maize were the major
competing crops grown by the selected farmers. Among the farm size categories,
marginal and small farmers allocated relatively higher area for cultivation of oilseeds and
Jower crop during rabi season. Whereas, medium and large farmer categories allocated
relatively higher area for cultivation of oilseeds, pulses and cereals during rabi season.
The area under vegetable was found negligible for all far categories.
In the case of other crops, grape, areca nut and sugarcane were grown by the farmers
during summer periods, but only 24.9 hectares of area of the4 crops were reported during
summer period by all categories of sample farmer. It was also revealed by the Table 4.2d
that no marginal farmer was involved in summer crops mentioned above. However, the
large farmers mainly do cultivate the summer crops. From above discussion we can argue
that due to scarcity of water, farmers were influenced by the short gestation crops. The
study also found that the farmers were not on the favour of making investment more
money in agriculture.
The southern State of Karnataka is experiencing a continuous growth in agricultural
sector in the last few decades due to expansion of grossed cropped area. There has also
been experienced of shift in land use from agricultural sector toward non-agricultural
uses which is mainly responsible for not increased in cultivable land. As suitable area for
cultivation has been declining, in the State, greater emphasis should be given on
productivity growth of agriculture. Hence improving productivity is one of the important
goals for increasing oilseeds production. The average yield of major crops for sample
households have been depicted in table 4.2e.
Understandably, Table 4.2e revealed that average yield of crops were found to be higher
for irrigated areas than that of un-irrigated area. It shows the importance of irrigation
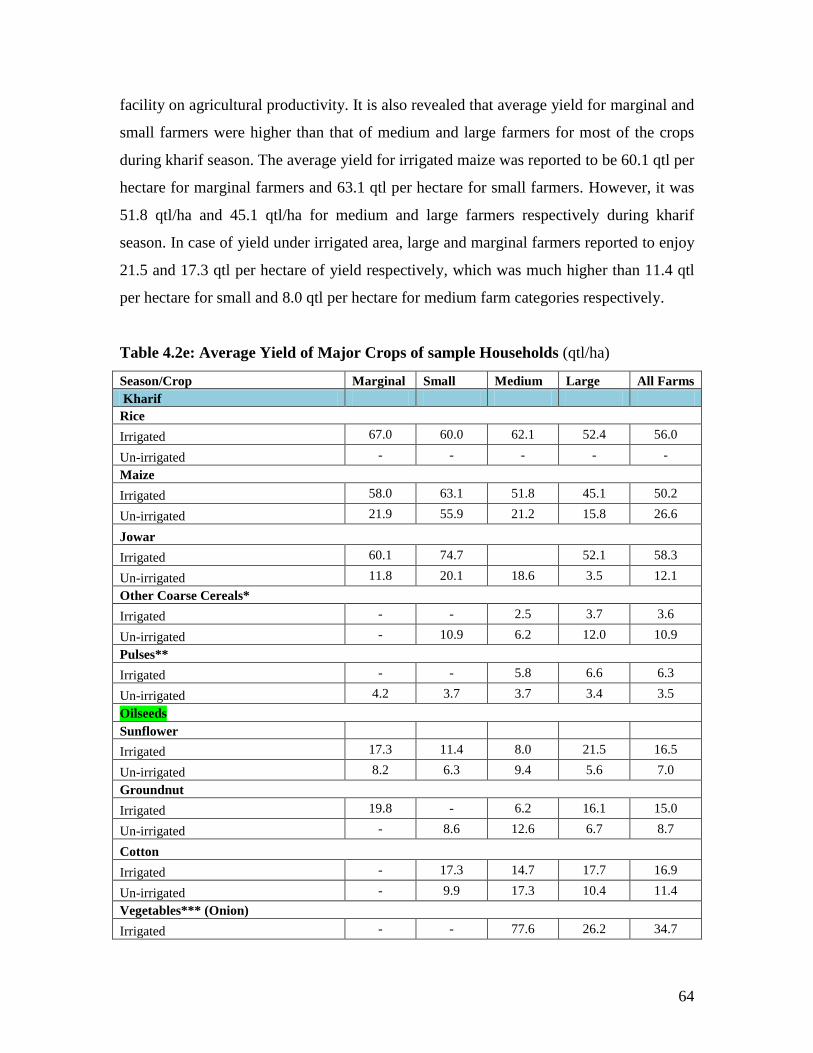
64
facility on agricultural productivity. It is also revealed that average yield for marginal and
small farmers were higher than that of medium and large farmers for most of the crops
during kharif season. The average yield for irrigated maize was reported to be 60.1 qtl per
hectare for marginal farmers and 63.1 qtl per hectare for small farmers. However, it was
51.8 qtl/ha and 45.1 qtl/ha for medium and large farmers respectively during kharif
season. In case of yield under irrigated area, large and marginal farmers reported to enjoy
21.5 and 17.3 qtl per hectare of yield respectively, which was much higher than 11.4 qtl
per hectare for small and 8.0 qtl per hectare for medium farm categories respectively.
Table 4.2e: Average Yield of Major Crops of sample Households (qtl/ha)
Season/Crop Marginal Small Medium Large All Farms
Kharif
Rice
Irrigated 67.0 60.0 62.1 52.4 56.0
Un-irrigated - - - - -
Maize
Irrigated 58.0 63.1 51.8 45.1 50.2
Un-irrigated 21.9 55.9 21.2 15.8 26.6
Jowar
Irrigated 60.1 74.7 52.1 58.3
Un-irrigated 11.8 20.1 18.6 3.5 12.1
Other Coarse Cereals*
Irrigated - - 2.5 3.7 3.6
Un-irrigated - 10.9 6.2 12.0 10.9
Pulses**
Irrigated - - 5.8 6.6 6.3
Un-irrigated 4.2 3.7 3.7 3.4 3.5
Oilseeds
Sunflower
Irrigated 17.3 11.4 8.0 21.5 16.5
Un-irrigated 8.2 6.3 9.4 5.6 7.0
Groundnut
Irrigated 19.8 - 6.2 16.1 15.0
Un-irrigated - 8.6 12.6 6.7 8.7
Cotton
Irrigated - 17.3 14.7 17.7 16.9
Un-irrigated - 9.9 17.3 10.4 11.4
Vegetables*** (Onion)
Irrigated - - 77.6 26.2 34.7
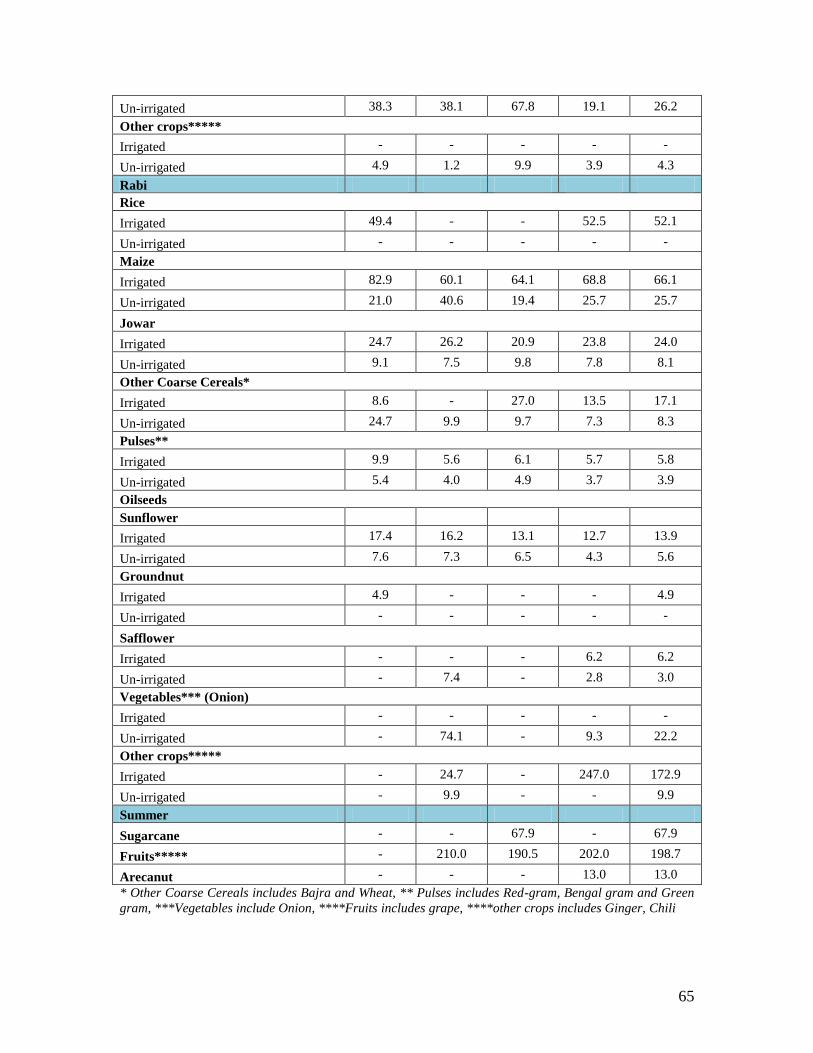
65
Un-irrigated 38.3 38.1 67.8 19.1 26.2
Other crops*****
Irrigated - - - - -
Un-irrigated 4.9 1.2 9.9 3.9 4.3
Rabi
Rice
Irrigated 49.4 - - 52.5 52.1
Un-irrigated - - - - -
Maize
Irrigated 82.9 60.1 64.1 68.8 66.1
Un-irrigated 21.0 40.6 19.4 25.7 25.7
Jowar
Irrigated 24.7 26.2 20.9 23.8 24.0
Un-irrigated 9.1 7.5 9.8 7.8 8.1
Other Coarse Cereals*
Irrigated 8.6 - 27.0 13.5 17.1
Un-irrigated 24.7 9.9 9.7 7.3 8.3
Pulses**
Irrigated 9.9 5.6 6.1 5.7 5.8
Un-irrigated 5.4 4.0 4.9 3.7 3.9
Oilseeds
Sunflower
Irrigated 17.4 16.2 13.1 12.7 13.9
Un-irrigated 7.6 7.3 6.5 4.3 5.6
Groundnut
Irrigated 4.9 - - - 4.9
Un-irrigated - - - - -
Safflower
Irrigated - - - 6.2 6.2
Un-irrigated - 7.4 - 2.8 3.0
Vegetables*** (Onion)
Irrigated - - - - -
Un-irrigated - 74.1 - 9.3 22.2
Other crops*****
Irrigated - 24.7 - 247.0 172.9
Un-irrigated - 9.9 - - 9.9
Summer
Sugarcane - - 67.9 - 67.9
Fruits***** - 210.0 190.5 202.0 198.7
Arecanut - - - 13.0 13.0
* Other Coarse Cereals includes Bajra and Wheat, ** Pulses includes Red-gram, Bengal gram and Green
gram, ***Vegetables include Onion, ****Fruits includes grape, ****other crops includes Ginger, Chili
66
Overall average yield was reported at 16.5 qtl per hectare for irrigated sunflower area
which was much higher than 7.0 qtl per hectare of yield under un-irrigated area. The
primary survey also found that rice, jowar and maize are the major competing crops that
have registered significant yield for selected farmers. In the case of rabi season, small and
marginal farmers registered higher yield than medium and large farmers. Under rabi
season, overall average yield of sunflower crop was 13.9 qtl per hectare for irrigated
areas with the highest yield recorded among the marginal farmers with 17.4 qtl per
hectare and 16.2 qtl per hectare for small farmers. Similarly, for un-irrigated areas, the
average yield was found to be highest (7.6 qtl per hectare) for marginal farmers and (7.3
qtl per hectare) for small farmers and lowest (6.5 qtl per hectare) for medium and (4.3 qtl
per hectare) for large farmers under sunflower crop. It was also found from the Table
4.2e that the yield of kharif season was reported higher than that of rabi season for both
irrigated and un-irrigated land. As of the maize crop, the yield was found to be highest
(82.9 qtl/ha) for marginal farmers and lowest (60.1 qtl/ha) for small farmers with 66.1qtl
per hectare for in an overall situation during rabi season under irrigated areas. Similarly,
yield per hectare for jowar was found to be highest for medium farmers (26.2 qtl/ha),
lowest for medium farmers (20.9 qtl/ha) and 24.0 qtl per hectare in the overall situation
for irrigated area. As for the productivity of pulses, it varied from 9.9 qtl per hectare for
large farmers to 5.6 qtl per hectare for marginal farmers. Sugarcane, fruits and areca nut
were also found place in cropping pattern for selected farmers. In totality, one can
conclude that marginal and small farmers were more productive than that of medium and
larger farmers. It was also found that the overall yield level of rabi season was lower than
that of kharif season due to scarcity of water in selected area.
4.3: Production, Retention and Marketed Surplus of Oilseed
From the Table 4.3 we can find that the production, retention and sale of sunflower crop
of the sample farmers. Farmers do cultivate sunflower for market purposes, not for self
consumption. It implies that whatever the output became marketed surplus. Another
interesting finding was that the price of sunflower rabi season was found to be higher
than that of kharif season. The study also found that the small and marginal farmers
preferred to sell their product to the middle men in the village itself due to higher
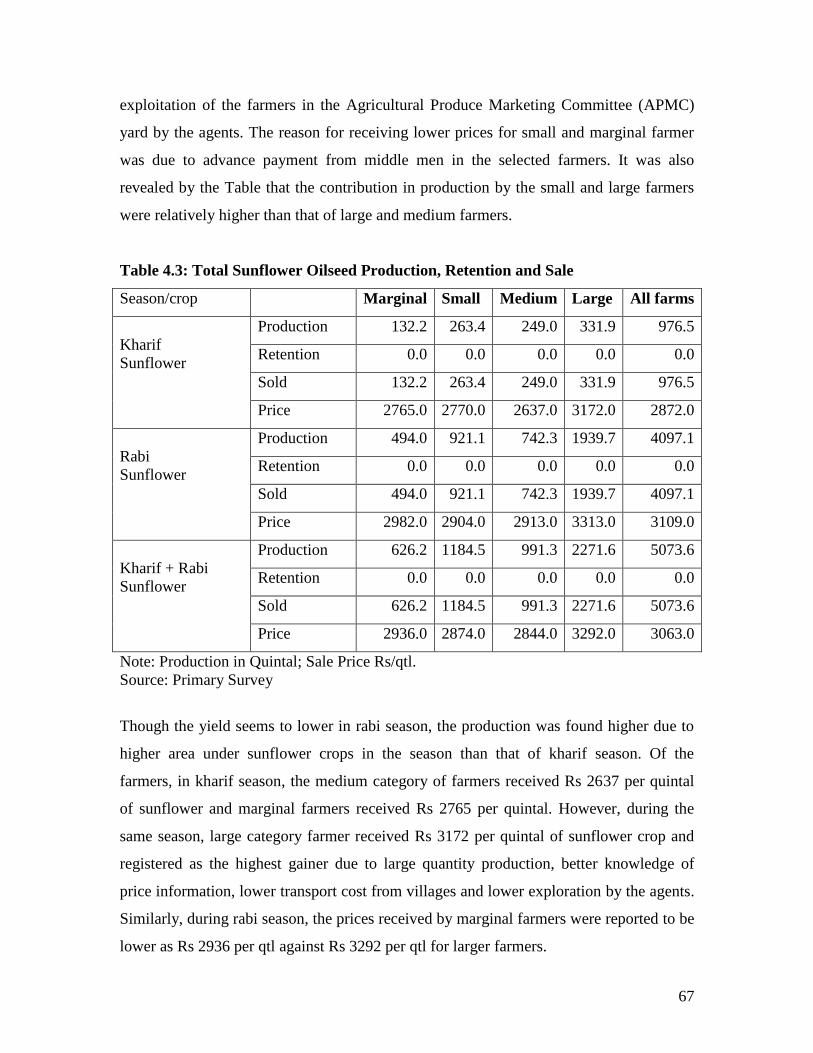
67
exploitation of the farmers in the Agricultural Produce Marketing Committee (APMC)
yard by the agents. The reason for receiving lower prices for small and marginal farmer
was due to advance payment from middle men in the selected farmers. It was also
revealed by the Table that the contribution in production by the small and large farmers
were relatively higher than that of large and medium farmers.
Table 4.3: Total Sunflower Oilseed Production, Retention and Sale
Season/crop Marginal Small Medium Large All farms
Kharif
Sunflower
Production 132.2 263.4 249.0 331.9 976.5
Retention 0.0 0.0 0.0 0.0 0.0
Sold 132.2 263.4 249.0 331.9 976.5
Price 2765.0 2770.0 2637.0 3172.0 2872.0
Rabi
Sunflower
Production 494.0 921.1 742.3 1939.7 4097.1
Retention 0.0 0.0 0.0 0.0 0.0
Sold 494.0 921.1 742.3 1939.7 4097.1
Price 2982.0 2904.0 2913.0 3313.0 3109.0
Kharif + Rabi
Sunflower
Production 626.2 1184.5 991.3 2271.6 5073.6
Retention 0.0 0.0 0.0 0.0 0.0
Sold 626.2 1184.5 991.3 2271.6 5073.6
Price 2936.0 2874.0 2844.0 3292.0 3063.0
Note: Production in Quintal; Sale Price Rs/qtl.
Source: Primary Survey
Though the yield seems to lower in rabi season, the production was found higher due to
higher area under sunflower crops in the season than that of kharif season. Of the
farmers, in kharif season, the medium category of farmers received Rs 2637 per quintal
of sunflower and marginal farmers received Rs 2765 per quintal. However, during the
same season, large category farmer received Rs 3172 per quintal of sunflower crop and
registered as the highest gainer due to large quantity production, better knowledge of
price information, lower transport cost from villages and lower exploration by the agents.
Similarly, during rabi season, the prices received by marginal farmers were reported to be
lower as Rs 2936 per qtl against Rs 3292 per qtl for larger farmers.
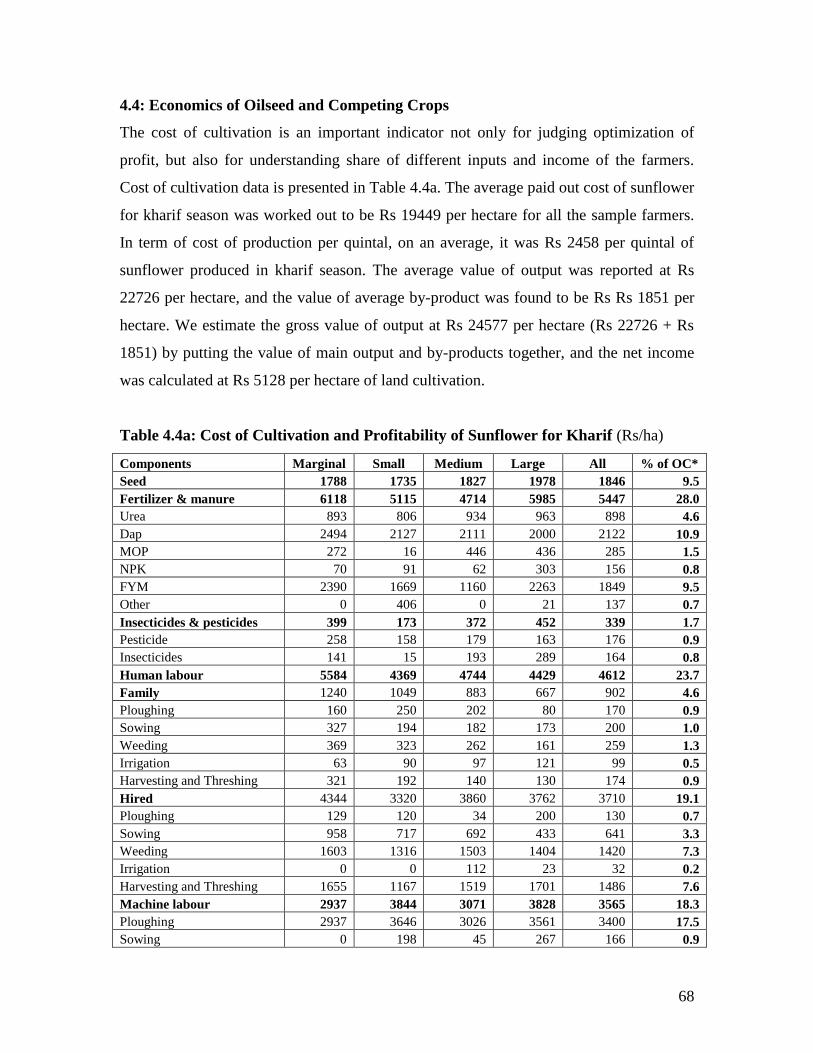
68
4.4: Economics of Oilseed and Competing Crops
The cost of cultivation is an important indicator not only for judging optimization of
profit, but also for understanding share of different inputs and income of the farmers.
Cost of cultivation data is presented in Table 4.4a. The average paid out cost of sunflower
for kharif season was worked out to be Rs 19449 per hectare for all the sample farmers.
In term of cost of production per quintal, on an average, it was Rs 2458 per quintal of
sunflower produced in kharif season. The average value of output was reported at Rs
22726 per hectare, and the value of average by-product was found to be Rs Rs 1851 per
hectare. We estimate the gross value of output at Rs 24577 per hectare (Rs 22726 + Rs
1851) by putting the value of main output and by-products together, and the net income
was calculated at Rs 5128 per hectare of land cultivation.
Table 4.4a: Cost of Cultivation and Profitability of Sunflower for Kharif (Rs/ha)
Components Marginal Small Medium Large All % of OC*
Seed 1788 1735 1827 1978 1846 9.5
Fertilizer & manure 6118 5115 4714 5985 5447 28.0
Urea 893 806 934 963 898 4.6
Dap 2494 2127 2111 2000 2122 10.9
MOP 272 16 446 436 285 1.5
NPK 70 91 62 303 156 0.8
FYM 2390 1669 1160 2263 1849 9.5
Other 0 406 0 21 137 0.7
Insecticides & pesticides 399 173 372 452 339 1.7
Pesticide 258 158 179 163 176 0.9
Insecticides 141 15 193 289 164 0.8
Human labour 5584 4369 4744 4429 4612 23.7
Family 1240 1049 883 667 902 4.6
Ploughing 160 250 202 80 170 0.9
Sowing 327 194 182 173 200 1.0
Weeding 369 323 262 161 259 1.3
Irrigation 63 90 97 121 99 0.5
Harvesting and Threshing 321 192 140 130 174 0.9
Hired 4344 3320 3860 3762 3710 19.1
Ploughing 129 120 34 200 130 0.7
Sowing 958 717 692 433 641 3.3
Weeding 1603 1316 1503 1404 1420 7.3
Irrigation 0 0 112 23 32 0.2
Harvesting and Threshing 1655 1167 1519 1701 1486 7.6
Machine labour 2937 3844 3071 3828 3565 18.3
Ploughing 2937 3646 3026 3561 3400 17.5
Sowing 0 198 45 267 166 0.9
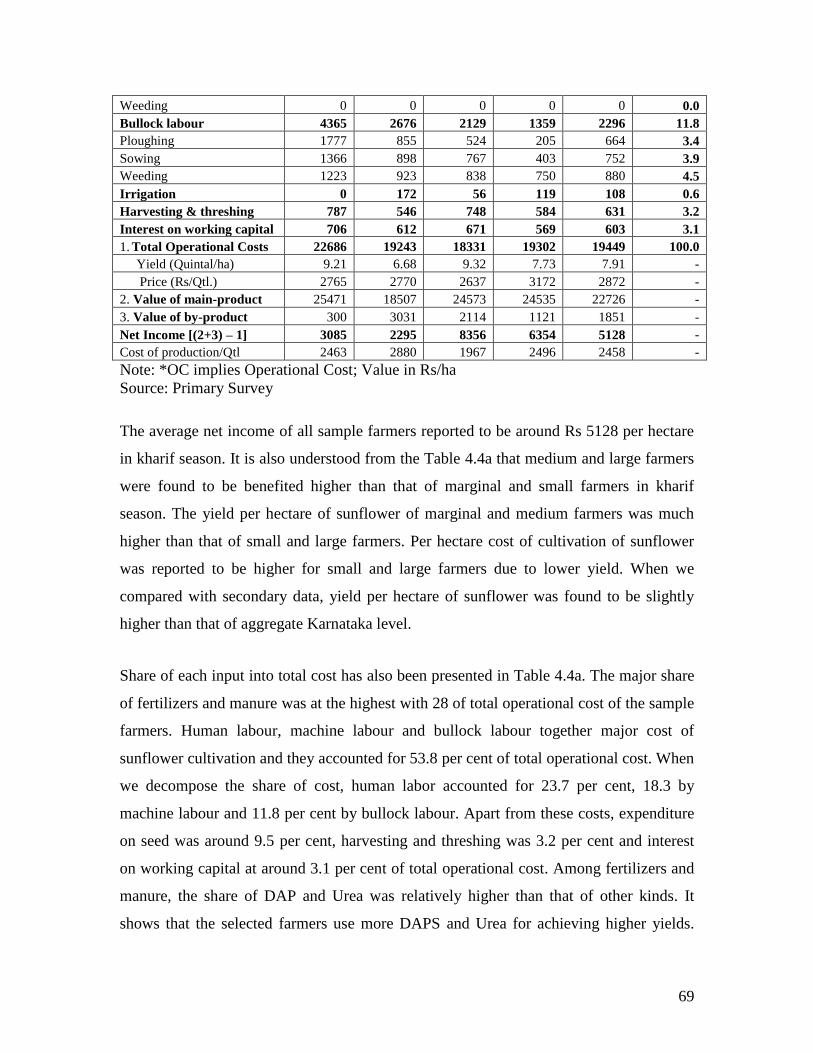
69
Weeding 0 0 0 0 0 0.0
Bullock labour 4365 2676 2129 1359 2296 11.8
Ploughing 1777 855 524 205 664 3.4
Sowing 1366 898 767 403 752 3.9
Weeding 1223 923 838 750 880 4.5
Irrigation 0 172 56 119 108 0.6
Harvesting & threshing 787 546 748 584 631 3.2
Interest on working capital 706 612 671 569 603 3.1
1. Total Operational Costs 22686 19243 18331 19302 19449 100.0
Yield (Quintal/ha) 9.21 6.68 9.32 7.73 7.91 -
Price (Rs/Qtl.) 2765 2770 2637 3172 2872 -
2. Value of main-product 25471 18507 24573 24535 22726 -
3. Value of by-product 300 3031 2114 1121 1851 -
Net Income [(2+3) – 1] 3085 2295 8356 6354 5128 -
Cost of production/Qtl 2463 2880 1967 2496 2458 -
Note: *OC implies Operational Cost; Value in Rs/ha
Source: Primary Survey
The average net income of all sample farmers reported to be around Rs 5128 per hectare
in kharif season. It is also understood from the Table 4.4a that medium and large farmers
were found to be benefited higher than that of marginal and small farmers in kharif
season. The yield per hectare of sunflower of marginal and medium farmers was much
higher than that of small and large farmers. Per hectare cost of cultivation of sunflower
was reported to be higher for small and large farmers due to lower yield. When we
compared with secondary data, yield per hectare of sunflower was found to be slightly
higher than that of aggregate Karnataka level.
Share of each input into total cost has also been presented in Table 4.4a. The major share
of fertilizers and manure was at the highest with 28 of total operational cost of the sample
farmers. Human labour, machine labour and bullock labour together major cost of
sunflower cultivation and they accounted for 53.8 per cent of total operational cost. When
we decompose the share of cost, human labor accounted for 23.7 per cent, 18.3 by
machine labour and 11.8 per cent by bullock labour. Apart from these costs, expenditure
on seed was around 9.5 per cent, harvesting and threshing was 3.2 per cent and interest
on working capital at around 3.1 per cent of total operational cost. Among fertilizers and
manure, the share of DAP and Urea was relatively higher than that of other kinds. It
shows that the selected farmers use more DAPS and Urea for achieving higher yields.
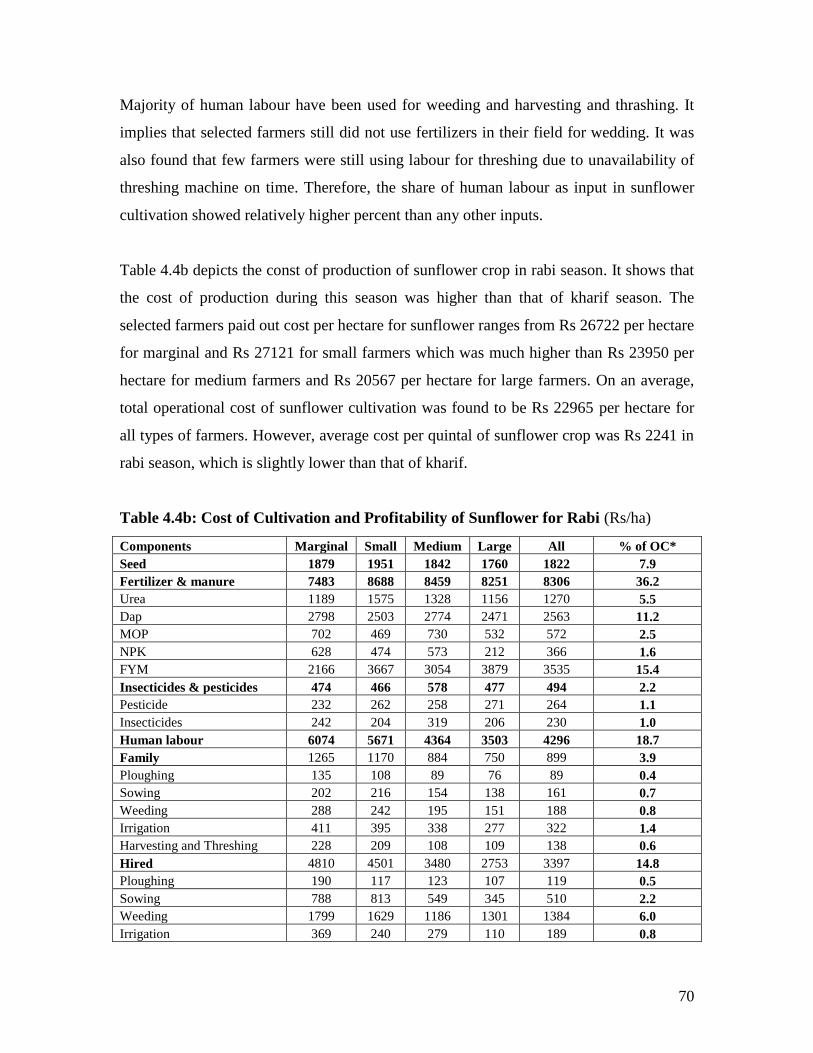
70
Majority of human labour have been used for weeding and harvesting and thrashing. It
implies that selected farmers still did not use fertilizers in their field for wedding. It was
also found that few farmers were still using labour for threshing due to unavailability of
threshing machine on time. Therefore, the share of human labour as input in sunflower
cultivation showed relatively higher percent than any other inputs.
Table 4.4b depicts the const of production of sunflower crop in rabi season. It shows that
the cost of production during this season was higher than that of kharif season. The
selected farmers paid out cost per hectare for sunflower ranges from Rs 26722 per hectare
for marginal and Rs 27121 for small farmers which was much higher than Rs 23950 per
hectare for medium farmers and Rs 20567 per hectare for large farmers. On an average,
total operational cost of sunflower cultivation was found to be Rs 22965 per hectare for
all types of farmers. However, average cost per quintal of sunflower crop was Rs 2241 in
rabi season, which is slightly lower than that of kharif.
Table 4.4b: Cost of Cultivation and Profitability of Sunflower for Rabi (Rs/ha)
Components Marginal Small Medium Large All % of OC*
Seed 1879 1951 1842 1760 1822 7.9
Fertilizer & manure 7483 8688 8459 8251 8306 36.2
Urea 1189 1575 1328 1156 1270 5.5
Dap 2798 2503 2774 2471 2563 11.2
MOP 702 469 730 532 572 2.5
NPK 628 474 573 212 366 1.6
FYM 2166 3667 3054 3879 3535 15.4
Insecticides & pesticides 474 466 578 477 494 2.2
Pesticide 232 262 258 271 264 1.1
Insecticides 242 204 319 206 230 1.0
Human labour 6074 5671 4364 3503 4296 18.7
Family 1265 1170 884 750 899 3.9
Ploughing 135 108 89 76 89 0.4
Sowing 202 216 154 138 161 0.7
Weeding 288 242 195 151 188 0.8
Irrigation 411 395 338 277 322 1.4
Harvesting and Threshing 228 209 108 109 138 0.6
Hired 4810 4501 3480 2753 3397 14.8
Ploughing 190 117 123 107 119 0.5
Sowing 788 813 549 345 510 2.2
Weeding 1799 1629 1186 1301 1384 6.0
Irrigation 369 240 279 110 189 0.8
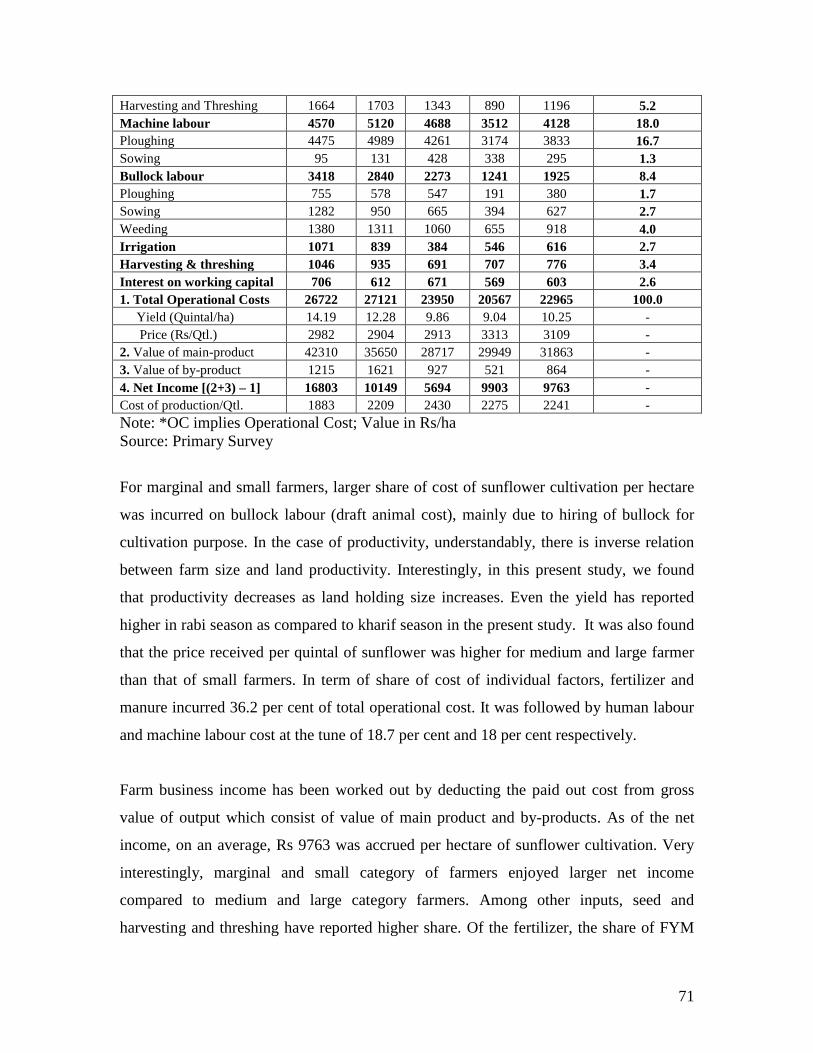
71
Harvesting and Threshing 1664 1703 1343 890 1196 5.2
Machine labour 4570 5120 4688 3512 4128 18.0
Ploughing 4475 4989 4261 3174 3833 16.7
Sowing 95 131 428 338 295 1.3
Bullock labour 3418 2840 2273 1241 1925 8.4
Ploughing 755 578 547 191 380 1.7
Sowing 1282 950 665 394 627 2.7
Weeding 1380 1311 1060 655 918 4.0
Irrigation 1071 839 384 546 616 2.7
Harvesting & threshing 1046 935 691 707 776 3.4
Interest on working capital 706 612 671 569 603 2.6
1. Total Operational Costs 26722 27121 23950 20567 22965 100.0
Yield (Quintal/ha) 14.19 12.28 9.86 9.04 10.25 -
Price (Rs/Qtl.) 2982 2904 2913 3313 3109 -
2. Value of main-product 42310 35650 28717 29949 31863 -
3. Value of by-product 1215 1621 927 521 864 -
4. Net Income [(2+3) – 1] 16803 10149 5694 9903 9763 -
Cost of production/Qtl. 1883 2209 2430 2275 2241 -
Note: *OC implies Operational Cost; Value in Rs/ha
Source: Primary Survey
For marginal and small farmers, larger share of cost of sunflower cultivation per hectare
was incurred on bullock labour (draft animal cost), mainly due to hiring of bullock for
cultivation purpose. In the case of productivity, understandably, there is inverse relation
between farm size and land productivity. Interestingly, in this present study, we found
that productivity decreases as land holding size increases. Even the yield has reported
higher in rabi season as compared to kharif season in the present study. It was also found
that the price received per quintal of sunflower was higher for medium and large farmer
than that of small farmers. In term of share of cost of individual factors, fertilizer and
manure incurred 36.2 per cent of total operational cost. It was followed by human labour
and machine labour cost at the tune of 18.7 per cent and 18 per cent respectively.
Farm business income has been worked out by deducting the paid out cost from gross
value of output which consist of value of main product and by-products. As of the net
income, on an average, Rs 9763 was accrued per hectare of sunflower cultivation. Very
interestingly, marginal and small category of farmers enjoyed larger net income
compared to medium and large category farmers. Among other inputs, seed and
harvesting and threshing have reported higher share. Of the fertilizer, the share of FYM
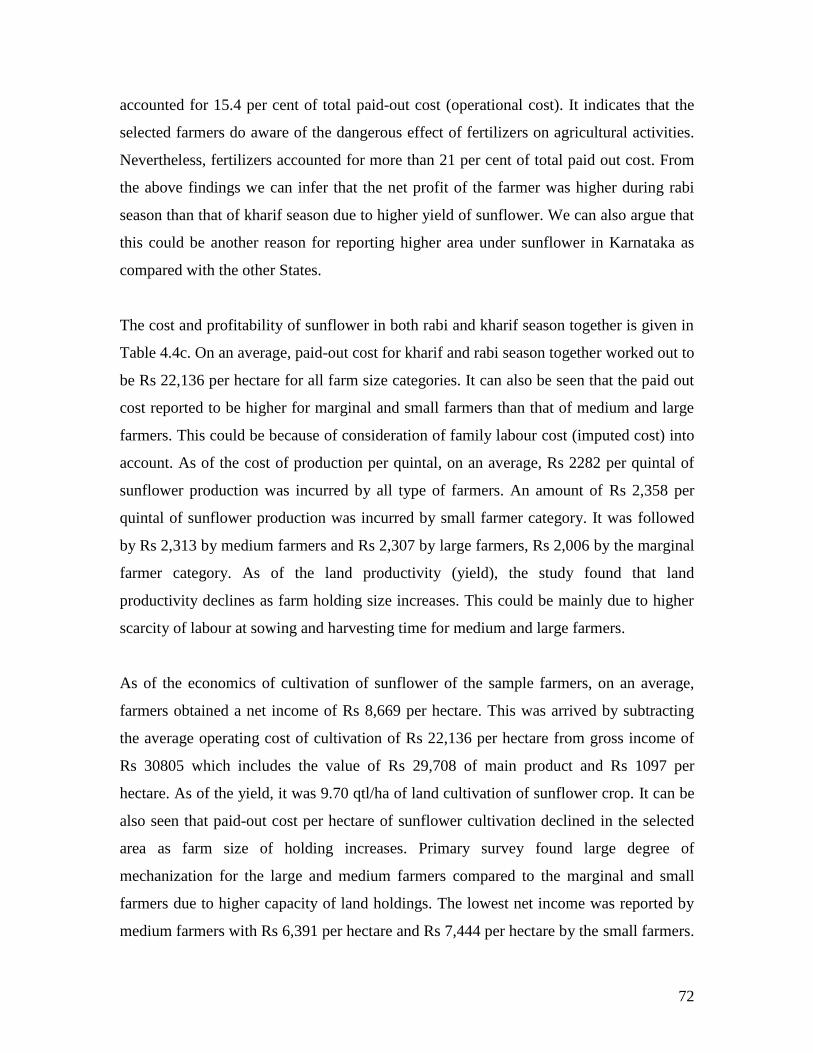
72
accounted for 15.4 per cent of total paid-out cost (operational cost). It indicates that the
selected farmers do aware of the dangerous effect of fertilizers on agricultural activities.
Nevertheless, fertilizers accounted for more than 21 per cent of total paid out cost. From
the above findings we can infer that the net profit of the farmer was higher during rabi
season than that of kharif season due to higher yield of sunflower. We can also argue that
this could be another reason for reporting higher area under sunflower in Karnataka as
compared with the other States.
The cost and profitability of sunflower in both rabi and kharif season together is given in
Table 4.4c. On an average, paid-out cost for kharif and rabi season together worked out to
be Rs 22,136 per hectare for all farm size categories. It can also be seen that the paid out
cost reported to be higher for marginal and small farmers than that of medium and large
farmers. This could be because of consideration of family labour cost (imputed cost) into
account. As of the cost of production per quintal, on an average, Rs 2282 per quintal of
sunflower production was incurred by all type of farmers. An amount of Rs 2,358 per
quintal of sunflower production was incurred by small farmer category. It was followed
by Rs 2,313 by medium farmers and Rs 2,307 by large farmers, Rs 2,006 by the marginal
farmer category. As of the land productivity (yield), the study found that land
productivity declines as farm holding size increases. This could be mainly due to higher
scarcity of labour at sowing and harvesting time for medium and large farmers.
As of the economics of cultivation of sunflower of the sample farmers, on an average,
farmers obtained a net income of Rs 8,669 per hectare. This was arrived by subtracting
the average operating cost of cultivation of Rs 22,136 per hectare from gross income of
Rs 30805 which includes the value of Rs 29,708 of main product and Rs 1097 per
hectare. As of the yield, it was 9.70 qtl/ha of land cultivation of sunflower crop. It can be
also seen that paid-out cost per hectare of sunflower cultivation declined in the selected
area as farm size of holding increases. Primary survey found large degree of
mechanization for the large and medium farmers compared to the marginal and small
farmers due to higher capacity of land holdings. The lowest net income was reported by
medium farmers with Rs 6,391 per hectare and Rs 7,444 per hectare by the small farmers.
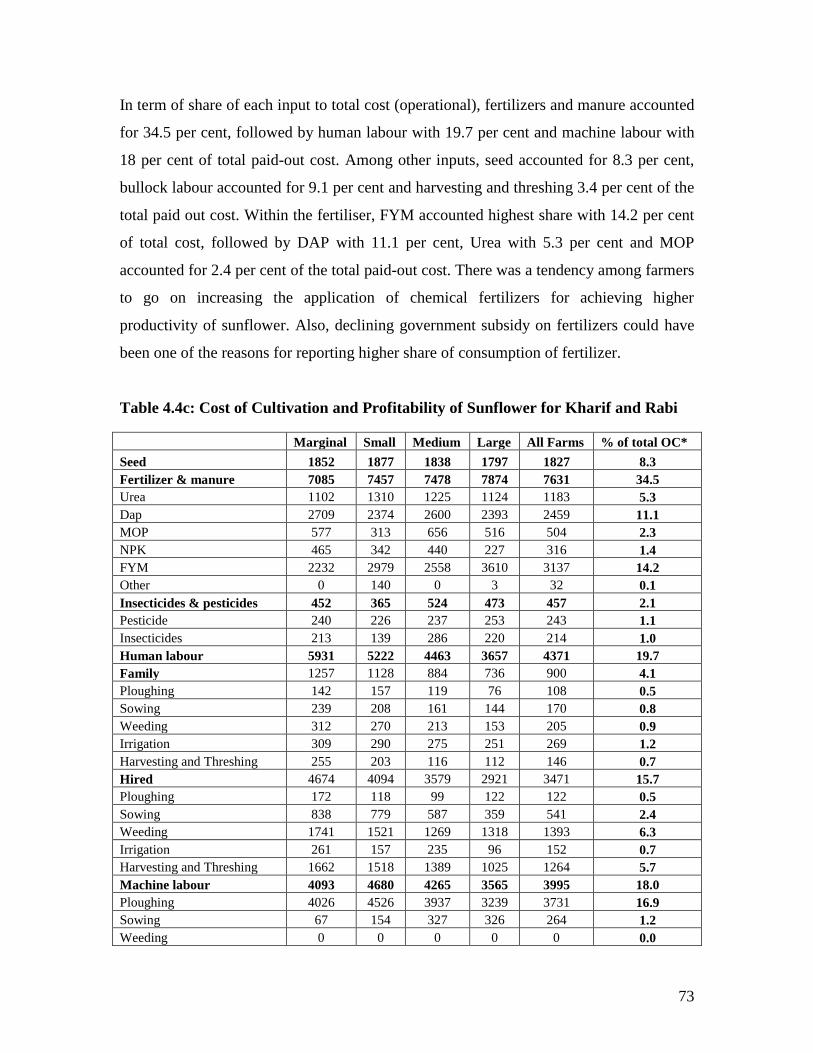
73
In term of share of each input to total cost (operational), fertilizers and manure accounted
for 34.5 per cent, followed by human labour with 19.7 per cent and machine labour with
18 per cent of total paid-out cost. Among other inputs, seed accounted for 8.3 per cent,
bullock labour accounted for 9.1 per cent and harvesting and threshing 3.4 per cent of the
total paid out cost. Within the fertiliser, FYM accounted highest share with 14.2 per cent
of total cost, followed by DAP with 11.1 per cent, Urea with 5.3 per cent and MOP
accounted for 2.4 per cent of the total paid-out cost. There was a tendency among farmers
to go on increasing the application of chemical fertilizers for achieving higher
productivity of sunflower. Also, declining government subsidy on fertilizers could have
been one of the reasons for reporting higher share of consumption of fertilizer.
Table 4.4c: Cost of Cultivation and Profitability of Sunflower for Kharif and Rabi
Marginal Small Medium Large All Farms % of total OC*
Seed 1852 1877 1838 1797 1827 8.3
Fertilizer & manure 7085 7457 7478 7874 7631 34.5
Urea 1102 1310 1225 1124 1183 5.3
Dap 2709 2374 2600 2393 2459 11.1
MOP 577 313 656 516 504 2.3
NPK 465 342 440 227 316 1.4
FYM 2232 2979 2558 3610 3137 14.2
Other 0 140 0 3 32 0.1
Insecticides & pesticides 452 365 524 473 457 2.1
Pesticide 240 226 237 253 243 1.1
Insecticides 213 139 286 220 214 1.0
Human labour 5931 5222 4463 3657 4371 19.7
Family 1257 1128 884 736 900 4.1
Ploughing 142 157 119 76 108 0.5
Sowing 239 208 161 144 170 0.8
Weeding 312 270 213 153 205 0.9
Irrigation 309 290 275 251 269 1.2
Harvesting and Threshing 255 203 116 112 146 0.7
Hired 4674 4094 3579 2921 3471 15.7
Ploughing 172 118 99 122 122 0.5
Sowing 838 779 587 359 541 2.4
Weeding 1741 1521 1269 1318 1393 6.3
Irrigation 261 157 235 96 152 0.7
Harvesting and Threshing 1662 1518 1389 1025 1264 5.7
Machine labour 4093 4680 4265 3565 3995 18.0
Ploughing 4026 4526 3937 3239 3731 16.9
Sowing 67 154 327 326 264 1.2
Weeding 0 0 0 0 0 0.0
74
Bullock labour 3694 2783 2235 1260 2012 9.1
Ploughing 1053 674 541 193 447 2.0
Sowing 1307 932 692 396 657 3.0
Weeding 1334 1177 1002 671 909 4.1
Irrigation 759 609 298 475 496 2.2
Harvesting & threshing 971 801 706 687 742 3.4
Interest on working capital 706 612 671 569 603 2.7
1. Total Operational Costs 25544 24407 22478 20356 22136 100.0
Yield (Quintals/ha) 12.74 10.35 9.72 8.82 9.70 -
Price (Rs/Qtl.) 2936 2874 2844 3292 3063 -
2. Value of main-product 37395 29745 27631 29046 29708 -
3. Value of by-product 948 2107 1238 621 1097 -
4. Net Income [(2+3) – 1] 12799 7444 6391 9311 8669 -
Cost of production/Qtl. 2006 2358 2313 2307 2282 -
Note: *OC implies Operational Cost; Value/cost in Rs/ha
Source: Primary Survey
To compare cost and profitability of sunflower crop, the study estimated the same for of
one the competing crops, Jowar of the sample farmers. For which, Table 4.4d gives a
detail information of the components of cost (paid-out cost) and profitability of Jowar
crop. The selection of this crop was based on competitive criteria. The selected farmers
would have gone for jower cultivation if they did not cultivate sunflower. The farm
business income was worked out by subtracting paid-out cost from gross value of output.
But one thing is sure that the net profit of jower was much lower than that of sunflower.
On an average, the net profit from jowar cultivation of the sample farmers was turned out
to be Rs 3802. As of the profits of different farm sizes, it may be seen that the net income
per hectare of jowar cultivation by the medium farm size category farmers was at the
highest with Rs 9,696 per hectare, followed by small farmers with Rs 2,930 and large
farmers with Rs 1736 per hectare of jowar cultivation. Marginal farmers received least
profit from the jowar cultivation at the tune of Rs 1663 per hectare. From the primary
survey, we found that the selected farmers of Bijapur received lower yield of jowar due to
less rainfall compared to other selected districts. We also found that the majority of the
farmers from this district were large farmers.
The total paid-out cost under jowar crop was highest at Rs 20174 per hectare for medium
farmers and Rs 19951 per hectare for marginal farmers. It was found to be lower for
small and large farmers at Rs 18278 and Rs 13928 per hectare. On an average, the
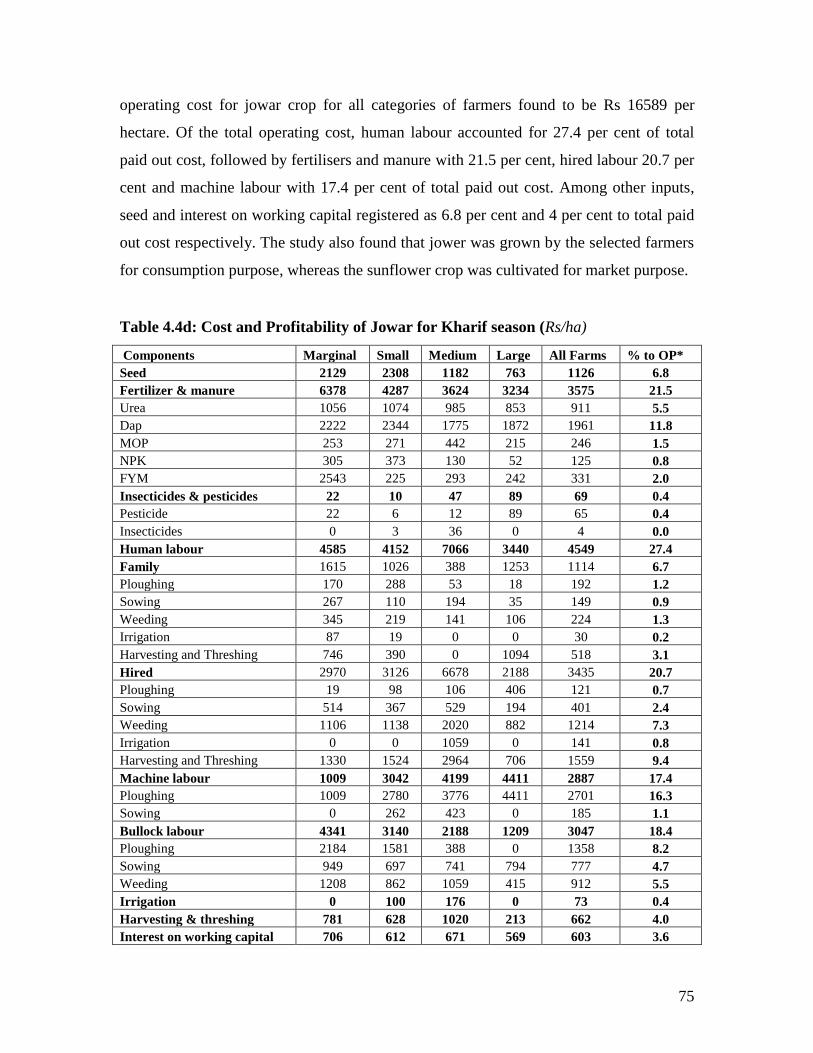
75
operating cost for jowar crop for all categories of farmers found to be Rs 16589 per
hectare. Of the total operating cost, human labour accounted for 27.4 per cent of total
paid out cost, followed by fertilisers and manure with 21.5 per cent, hired labour 20.7 per
cent and machine labour with 17.4 per cent of total paid out cost. Among other inputs,
seed and interest on working capital registered as 6.8 per cent and 4 per cent to total paid
out cost respectively. The study also found that jower was grown by the selected farmers
for consumption purpose, whereas the sunflower crop was cultivated for market purpose.
Table 4.4d: Cost and Profitability of Jowar for Kharif season (Rs/ha)
Components Marginal Small Medium Large All Farms % to OP*
Seed 2129 2308 1182 763 1126 6.8
Fertilizer & manure 6378 4287 3624 3234 3575 21.5
Urea 1056 1074 985 853 911 5.5
Dap 2222 2344 1775 1872 1961 11.8
MOP 253 271 442 215 246 1.5
NPK 305 373 130 52 125 0.8
FYM 2543 225 293 242 331 2.0
Insecticides & pesticides 22 10 47 89 69 0.4
Pesticide 22 6 12 89 65 0.4
Insecticides 0 3 36 0 4 0.0
Human labour 4585 4152 7066 3440 4549 27.4
Family 1615 1026 388 1253 1114 6.7
Ploughing 170 288 53 18 192 1.2
Sowing 267 110 194 35 149 0.9
Weeding 345 219 141 106 224 1.3
Irrigation 87 19 0 0 30 0.2
Harvesting and Threshing 746 390 0 1094 518 3.1
Hired 2970 3126 6678 2188 3435 20.7
Ploughing 19 98 106 406 121 0.7
Sowing 514 367 529 194 401 2.4
Weeding 1106 1138 2020 882 1214 7.3
Irrigation 0 0 1059 0 141 0.8
Harvesting and Threshing 1330 1524 2964 706 1559 9.4
Machine labour 1009 3042 4199 4411 2887 17.4
Ploughing 1009 2780 3776 4411 2701 16.3
Sowing 0 262 423 0 185 1.1
Bullock labour 4341 3140 2188 1209 3047 18.4
Ploughing 2184 1581 388 0 1358 8.2
Sowing 949 697 741 794 777 4.7
Weeding 1208 862 1059 415 912 5.5
Irrigation 0 100 176 0 73 0.4
Harvesting & threshing 781 628 1020 213 662 4.0
Interest on working capital 706 612 671 569 603 3.6
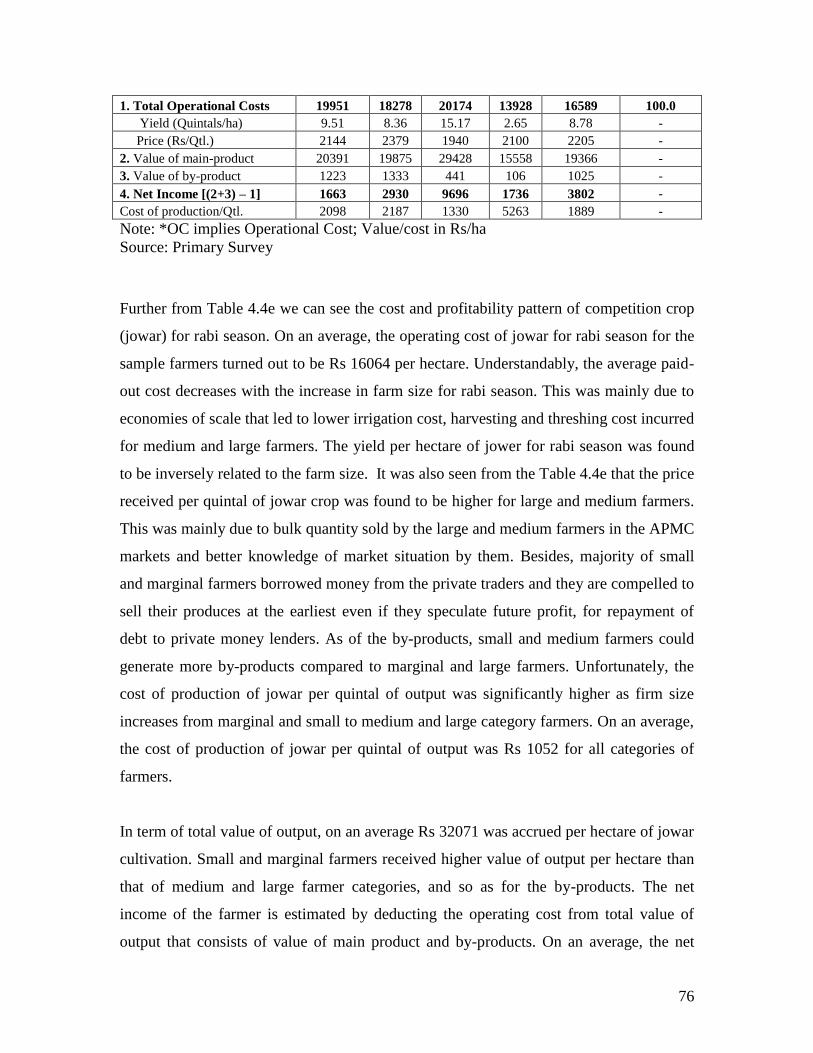
76
1. Total Operational Costs 19951 18278 20174 13928 16589 100.0
Yield (Quintals/ha) 9.51 8.36 15.17 2.65 8.78 -
Price (Rs/Qtl.) 2144 2379 1940 2100 2205 -
2. Value of main-product 20391 19875 29428 15558 19366 -
3. Value of by-product 1223 1333 441 106 1025 -
4. Net Income [(2+3) – 1] 1663 2930 9696 1736 3802 -
Cost of production/Qtl. 2098 2187 1330 5263 1889 -
Note: *OC implies Operational Cost; Value/cost in Rs/ha
Source: Primary Survey
Further from Table 4.4e we can see the cost and profitability pattern of competition crop
(jowar) for rabi season. On an average, the operating cost of jowar for rabi season for the
sample farmers turned out to be Rs 16064 per hectare. Understandably, the average paid-
out cost decreases with the increase in farm size for rabi season. This was mainly due to
economies of scale that led to lower irrigation cost, harvesting and threshing cost incurred
for medium and large farmers. The yield per hectare of jower for rabi season was found
to be inversely related to the farm size. It was also seen from the Table 4.4e that the price
received per quintal of jowar crop was found to be higher for large and medium farmers.
This was mainly due to bulk quantity sold by the large and medium farmers in the APMC
markets and better knowledge of market situation by them. Besides, majority of small
and marginal farmers borrowed money from the private traders and they are compelled to
sell their produces at the earliest even if they speculate future profit, for repayment of
debt to private money lenders. As of the by-products, small and medium farmers could
generate more by-products compared to marginal and large farmers. Unfortunately, the
cost of production of jowar per quintal of output was significantly higher as firm size
increases from marginal and small to medium and large category farmers. On an average,
the cost of production of jowar per quintal of output was Rs 1052 for all categories of
farmers.
In term of total value of output, on an average Rs 32071 was accrued per hectare of jowar
cultivation. Small and marginal farmers received higher value of output per hectare than
that of medium and large farmer categories, and so as for the by-products. The net
income of the farmer is estimated by deducting the operating cost from total value of
output that consists of value of main product and by-products. On an average, the net
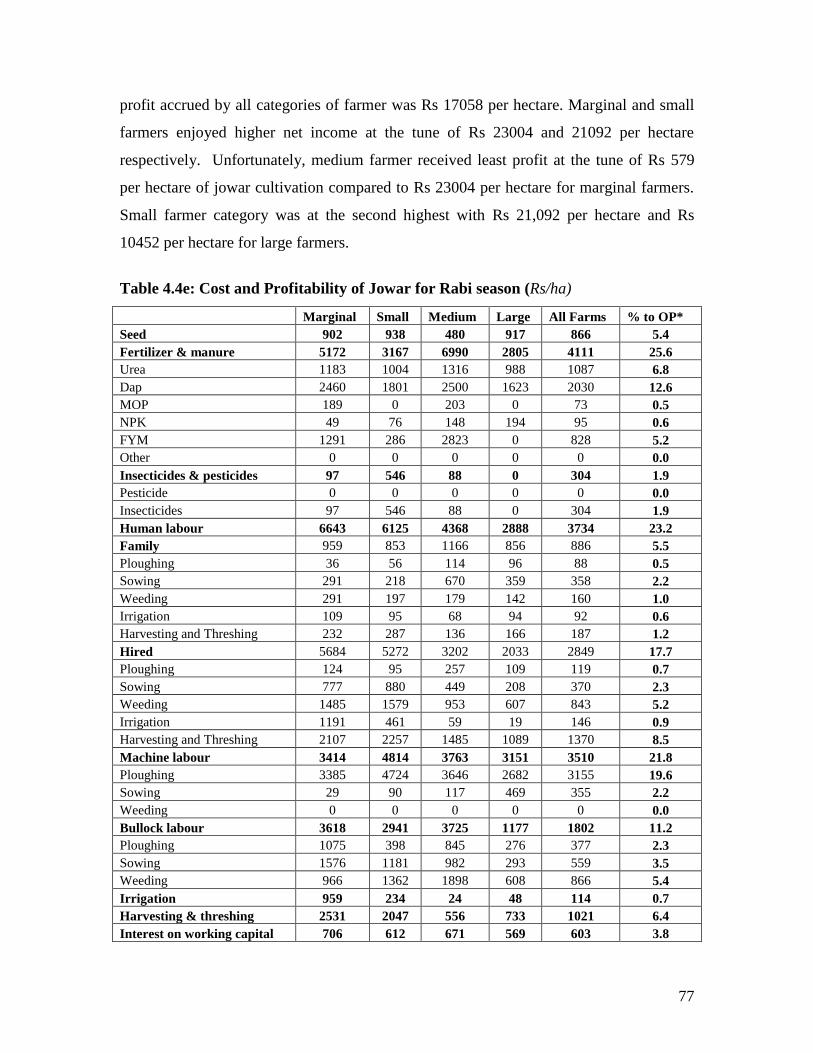
77
profit accrued by all categories of farmer was Rs 17058 per hectare. Marginal and small
farmers enjoyed higher net income at the tune of Rs 23004 and 21092 per hectare
respectively. Unfortunately, medium farmer received least profit at the tune of Rs 579
per hectare of jowar cultivation compared to Rs 23004 per hectare for marginal farmers.
Small farmer category was at the second highest with Rs 21,092 per hectare and Rs
10452 per hectare for large farmers.
Table 4.4e: Cost and Profitability of Jowar for Rabi season (Rs/ha)
Marginal Small Medium Large All Farms % to OP*
Seed 902 938 480 917 866 5.4
Fertilizer & manure 5172 3167 6990 2805 4111 25.6
Urea 1183 1004 1316 988 1087 6.8
Dap 2460 1801 2500 1623 2030 12.6
MOP 189 0 203 0 73 0.5
NPK 49 76 148 194 95 0.6
FYM 1291 286 2823 0 828 5.2
Other 0 0 0 0 0 0.0
Insecticides & pesticides 97 546 88 0 304 1.9
Pesticide 0 0 0 0 0 0.0
Insecticides 97 546 88 0 304 1.9
Human labour 6643 6125 4368 2888 3734 23.2
Family 959 853 1166 856 886 5.5
Ploughing 36 56 114 96 88 0.5
Sowing 291 218 670 359 358 2.2
Weeding 291 197 179 142 160 1.0
Irrigation 109 95 68 94 92 0.6
Harvesting and Threshing 232 287 136 166 187 1.2
Hired 5684 5272 3202 2033 2849 17.7
Ploughing 124 95 257 109 119 0.7
Sowing 777 880 449 208 370 2.3
Weeding 1485 1579 953 607 843 5.2
Irrigation 1191 461 59 19 146 0.9
Harvesting and Threshing 2107 2257 1485 1089 1370 8.5
Machine labour 3414 4814 3763 3151 3510 21.8
Ploughing 3385 4724 3646 2682 3155 19.6
Sowing 29 90 117 469 355 2.2
Weeding 0 0 0 0 0 0.0
Bullock labour 3618 2941 3725 1177 1802 11.2
Ploughing 1075 398 845 276 377 2.3
Sowing 1576 1181 982 293 559 3.5
Weeding 966 1362 1898 608 866 5.4
Irrigation 959 234 24 48 114 0.7
Harvesting & threshing 2531 2047 556 733 1021 6.4
Interest on working capital 706 612 671 569 603 3.8
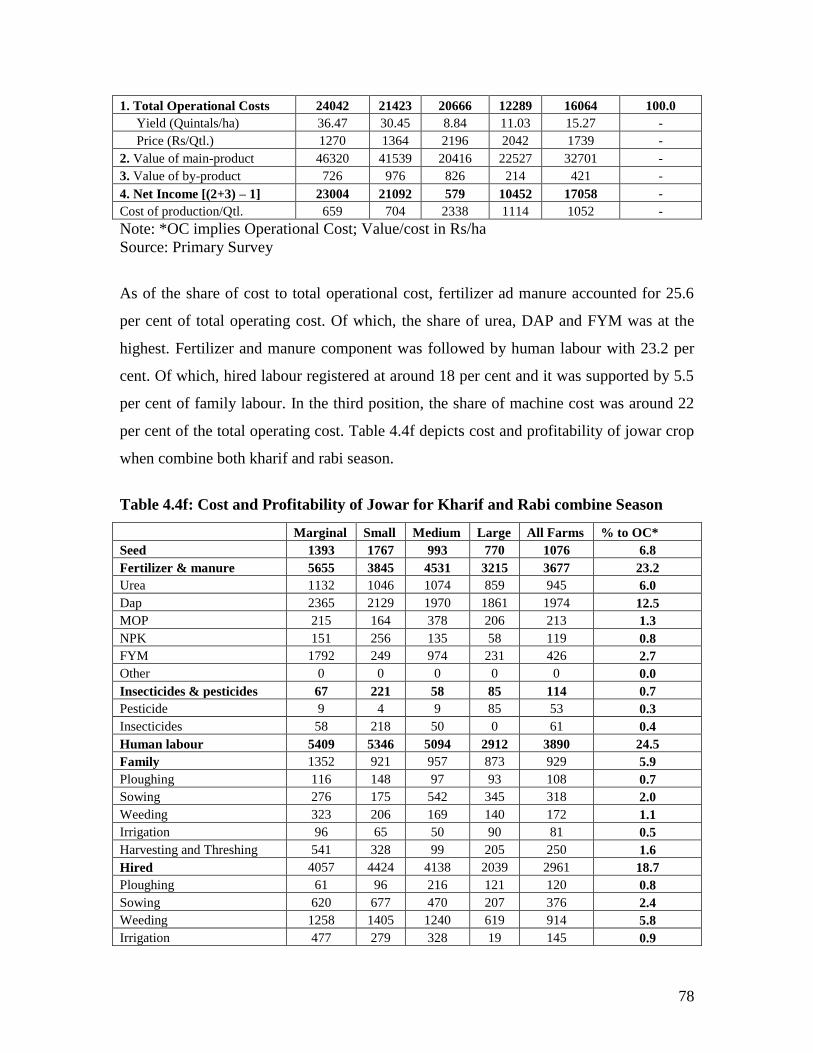
78
1. Total Operational Costs 24042 21423 20666 12289 16064 100.0
Yield (Quintals/ha) 36.47 30.45 8.84 11.03 15.27 -
Price (Rs/Qtl.) 1270 1364 2196 2042 1739 -
2. Value of main-product 46320 41539 20416 22527 32701 -
3. Value of by-product 726 976 826 214 421 -
4. Net Income [(2+3) – 1] 23004 21092 579 10452 17058 -
Cost of production/Qtl. 659 704 2338 1114 1052 -
Note: *OC implies Operational Cost; Value/cost in Rs/ha
Source: Primary Survey
As of the share of cost to total operational cost, fertilizer ad manure accounted for 25.6
per cent of total operating cost. Of which, the share of urea, DAP and FYM was at the
highest. Fertilizer and manure component was followed by human labour with 23.2 per
cent. Of which, hired labour registered at around 18 per cent and it was supported by 5.5
per cent of family labour. In the third position, the share of machine cost was around 22
per cent of the total operating cost. Table 4.4f depicts cost and profitability of jowar crop
when combine both kharif and rabi season.
Table 4.4f: Cost and Profitability of Jowar for Kharif and Rabi combine Season
Marginal Small Medium Large All Farms % to OC*
Seed 1393 1767 993 770 1076 6.8
Fertilizer & manure 5655 3845 4531 3215 3677 23.2
Urea 1132 1046 1074 859 945 6.0
Dap 2365 2129 1970 1861 1974 12.5
MOP 215 164 378 206 213 1.3
NPK 151 256 135 58 119 0.8
FYM 1792 249 974 231 426 2.7
Other 0 0 0 0 0 0.0
Insecticides & pesticides 67 221 58 85 114 0.7
Pesticide 9 4 9 85 53 0.3
Insecticides 58 218 50 0 61 0.4
Human labour 5409 5346 5094 2912 3890 24.5
Family 1352 921 957 873 929 5.9
Ploughing 116 148 97 93 108 0.7
Sowing 276 175 542 345 318 2.0
Weeding 323 206 169 140 172 1.1
Irrigation 96 65 50 90 81 0.5
Harvesting and Threshing 541 328 99 205 250 1.6
Hired 4057 4424 4138 2039 2961 18.7
Ploughing 61 96 216 121 120 0.8
Sowing 620 677 470 207 376 2.4
Weeding 1258 1405 1240 619 914 5.8
Irrigation 477 279 328 19 145 0.9
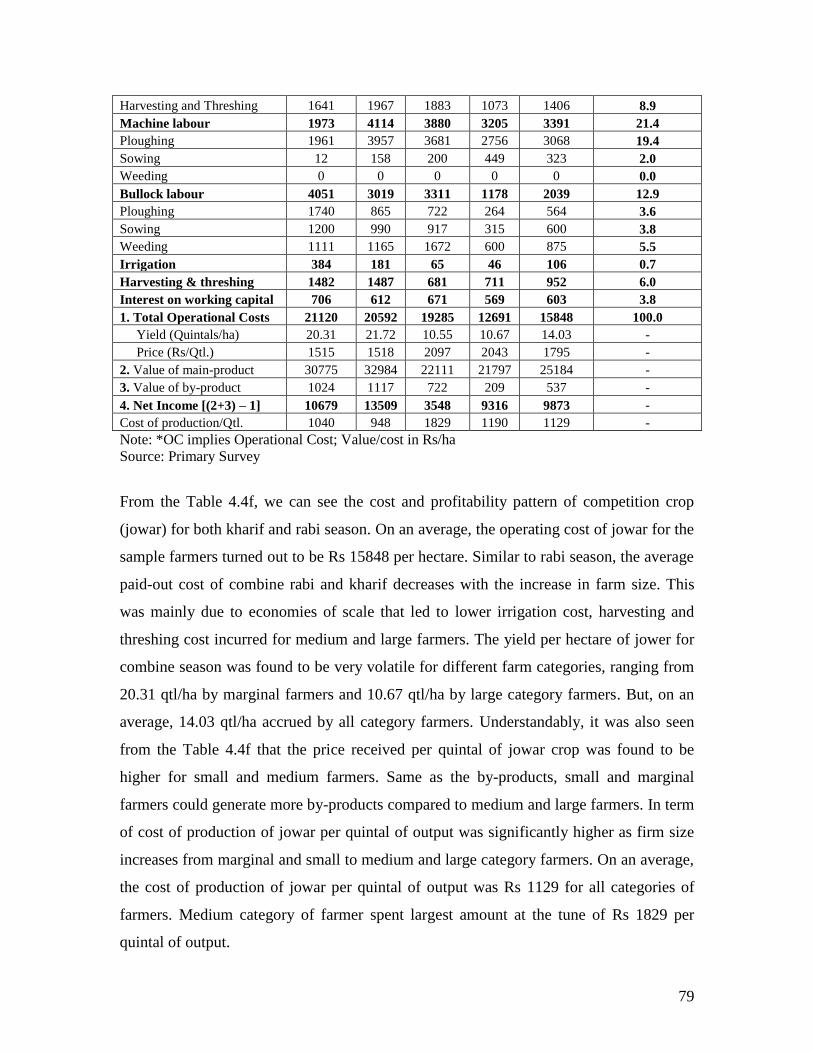
79
Harvesting and Threshing 1641 1967 1883 1073 1406 8.9
Machine labour 1973 4114 3880 3205 3391 21.4
Ploughing 1961 3957 3681 2756 3068 19.4
Sowing 12 158 200 449 323 2.0
Weeding 0 0 0 0 0 0.0
Bullock labour 4051 3019 3311 1178 2039 12.9
Ploughing 1740 865 722 264 564 3.6
Sowing 1200 990 917 315 600 3.8
Weeding 1111 1165 1672 600 875 5.5
Irrigation 384 181 65 46 106 0.7
Harvesting & threshing 1482 1487 681 711 952 6.0
Interest on working capital 706 612 671 569 603 3.8
1. Total Operational Costs 21120 20592 19285 12691 15848 100.0
Yield (Quintals/ha) 20.31 21.72 10.55 10.67 14.03 -
Price (Rs/Qtl.) 1515 1518 2097 2043 1795 -
2. Value of main-product 30775 32984 22111 21797 25184 -
3. Value of by-product 1024 1117 722 209 537 -
4. Net Income [(2+3) – 1] 10679 13509 3548 9316 9873 -
Cost of production/Qtl. 1040 948 1829 1190 1129 -
Note: *OC implies Operational Cost; Value/cost in Rs/ha
Source: Primary Survey
From the Table 4.4f, we can see the cost and profitability pattern of competition crop
(jowar) for both kharif and rabi season. On an average, the operating cost of jowar for the
sample farmers turned out to be Rs 15848 per hectare. Similar to rabi season, the average
paid-out cost of combine rabi and kharif decreases with the increase in farm size. This
was mainly due to economies of scale that led to lower irrigation cost, harvesting and
threshing cost incurred for medium and large farmers. The yield per hectare of jower for
combine season was found to be very volatile for different farm categories, ranging from
20.31 qtl/ha by marginal farmers and 10.67 qtl/ha by large category farmers. But, on an
average, 14.03 qtl/ha accrued by all category farmers. Understandably, it was also seen
from the Table 4.4f that the price received per quintal of jowar crop was found to be
higher for small and medium farmers. Same as the by-products, small and marginal
farmers could generate more by-products compared to medium and large farmers. In term
of cost of production of jowar per quintal of output was significantly higher as firm size
increases from marginal and small to medium and large category farmers. On an average,
the cost of production of jowar per quintal of output was Rs 1129 for all categories of
farmers. Medium category of farmer spent largest amount at the tune of Rs 1829 per
quintal of output.
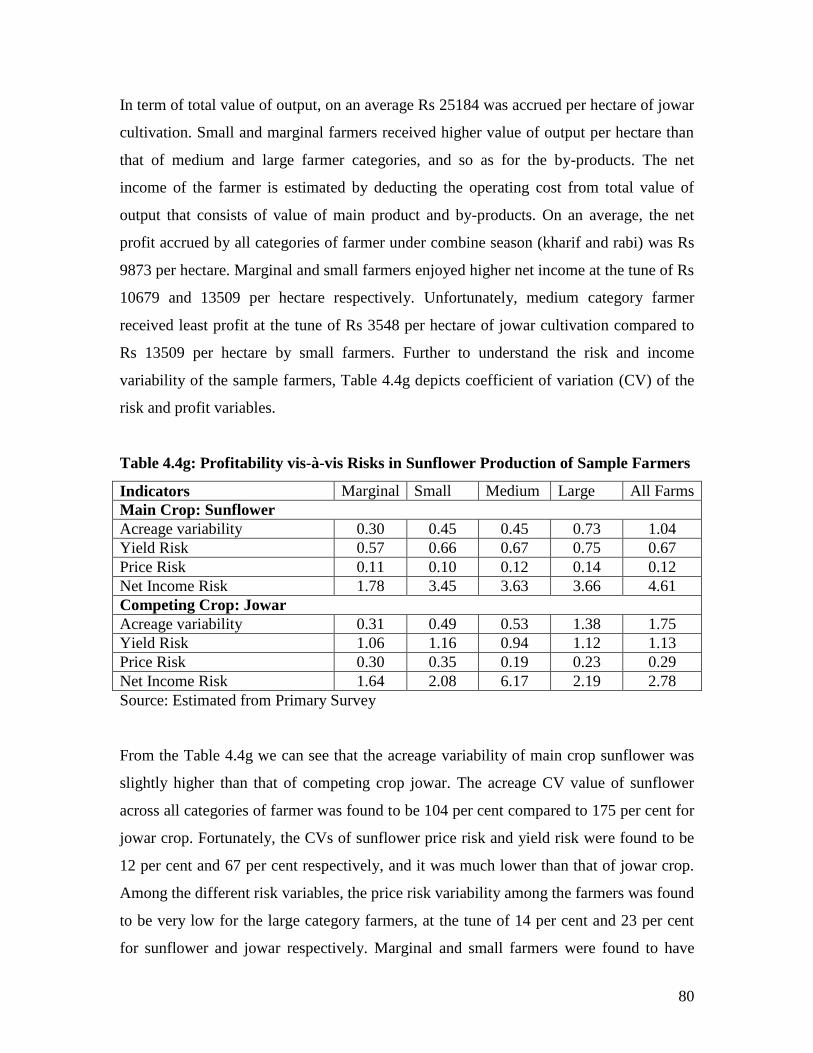
80
In term of total value of output, on an average Rs 25184 was accrued per hectare of jowar
cultivation. Small and marginal farmers received higher value of output per hectare than
that of medium and large farmer categories, and so as for the by-products. The net
income of the farmer is estimated by deducting the operating cost from total value of
output that consists of value of main product and by-products. On an average, the net
profit accrued by all categories of farmer under combine season (kharif and rabi) was Rs
9873 per hectare. Marginal and small farmers enjoyed higher net income at the tune of Rs
10679 and 13509 per hectare respectively. Unfortunately, medium category farmer
received least profit at the tune of Rs 3548 per hectare of jowar cultivation compared to
Rs 13509 per hectare by small farmers. Further to understand the risk and income
variability of the sample farmers, Table 4.4g depicts coefficient of variation (CV) of the
risk and profit variables.
Table 4.4g: Profitability vis-à-vis Risks in Sunflower Production of Sample Farmers
Indicators Marginal Small Medium Large All Farms
Main Crop: Sunflower
Acreage variability 0.30 0.45 0.45 0.73 1.04
Yield Risk 0.57 0.66 0.67 0.75 0.67
Price Risk 0.11 0.10 0.12 0.14 0.12
Net Income Risk 1.78 3.45 3.63 3.66 4.61
Competing Crop: Jowar
Acreage variability 0.31 0.49 0.53 1.38 1.75
Yield Risk 1.06 1.16 0.94 1.12 1.13
Price Risk 0.30 0.35 0.19 0.23 0.29
Net Income Risk 1.64 2.08 6.17 2.19 2.78
Source: Estimated from Primary Survey
From the Table 4.4g we can see that the acreage variability of main crop sunflower was
slightly higher than that of competing crop jowar. The acreage CV value of sunflower
across all categories of farmer was found to be 104 per cent compared to 175 per cent for
jowar crop. Fortunately, the CVs of sunflower price risk and yield risk were found to be
12 per cent and 67 per cent respectively, and it was much lower than that of jowar crop.
Among the different risk variables, the price risk variability among the farmers was found
to be very low for the large category farmers, at the tune of 14 per cent and 23 per cent
for sunflower and jowar respectively. Marginal and small farmers were found to have
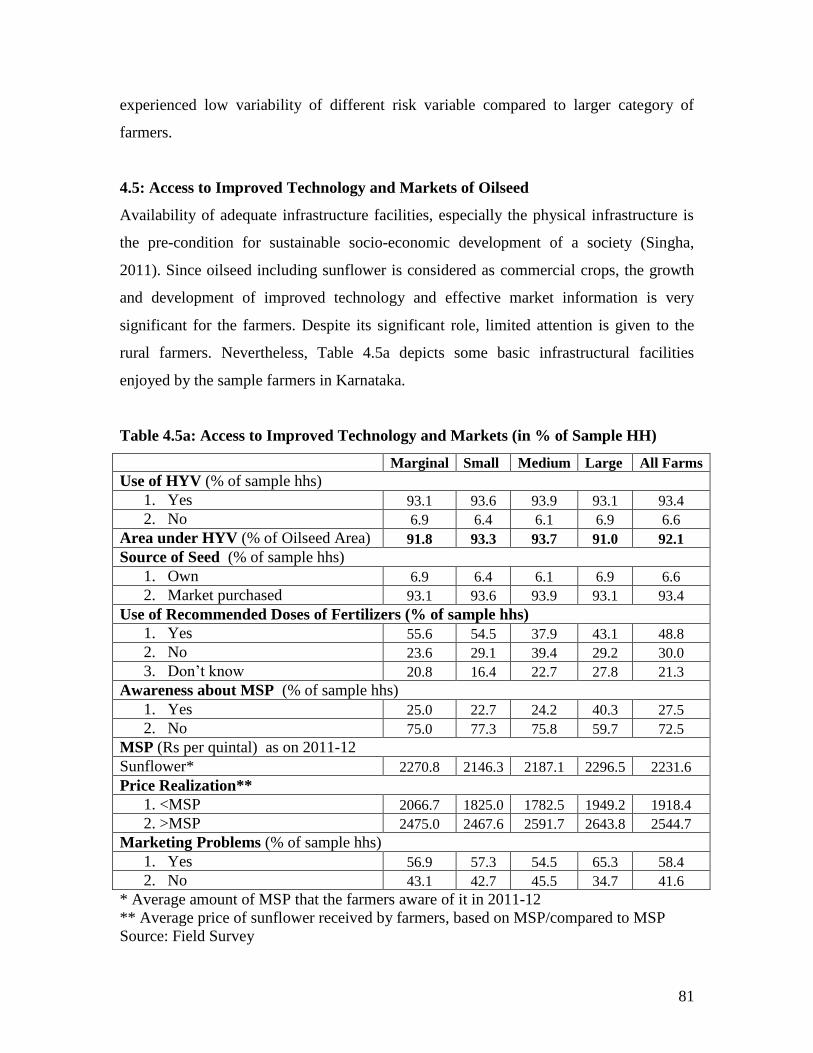
81
experienced low variability of different risk variable compared to larger category of
farmers.
4.5: Access to Improved Technology and Markets of Oilseed
Availability of adequate infrastructure facilities, especially the physical infrastructure is
the pre-condition for sustainable socio-economic development of a society (Singha,
2011). Since oilseed including sunflower is considered as commercial crops, the growth
and development of improved technology and effective market information is very
significant for the farmers. Despite its significant role, limited attention is given to the
rural farmers. Nevertheless, Table 4.5a depicts some basic infrastructural facilities
enjoyed by the sample farmers in Karnataka.
Table 4.5a: Access to Improved Technology and Markets (in % of Sample HH)
Marginal Small Medium Large All Farms
Use of HYV (% of sample hhs)
1. Yes 93.1 93.6 93.9 93.1 93.4
2. No 6.9 6.4 6.1 6.9 6.6
Area under HYV (% of Oilseed Area) 91.8 93.3 93.7 91.0 92.1
Source of Seed (% of sample hhs)
1. Own 6.9 6.4 6.1 6.9 6.6
2. Market purchased 93.1 93.6 93.9 93.1 93.4
Use of Recommended Doses of Fertilizers (% of sample hhs)
1. Yes 55.6 54.5 37.9 43.1 48.8
2. No 23.6 29.1 39.4 29.2 30.0
3. Don’t know 20.8 16.4 22.7 27.8 21.3
Awareness about MSP (% of sample hhs)
1. Yes 25.0 22.7 24.2 40.3 27.5
2. No 75.0 77.3 75.8 59.7 72.5
MSP (Rs per quintal) as on 2011-12
Sunflower* 2270.8 2146.3 2187.1 2296.5 2231.6
Price Realization**
1. <MSP 2066.7 1825.0 1782.5 1949.2 1918.4
2. >MSP 2475.0 2467.6 2591.7 2643.8 2544.7
Marketing Problems (% of sample hhs)
1. Yes 56.9 57.3 54.5 65.3 58.4
2. No 43.1 42.7 45.5 34.7 41.6
* Average amount of MSP that the farmers aware of it in 2011-12
** Average price of sunflower received by farmers, based on MSP/compared to MSP
Source: Field Survey
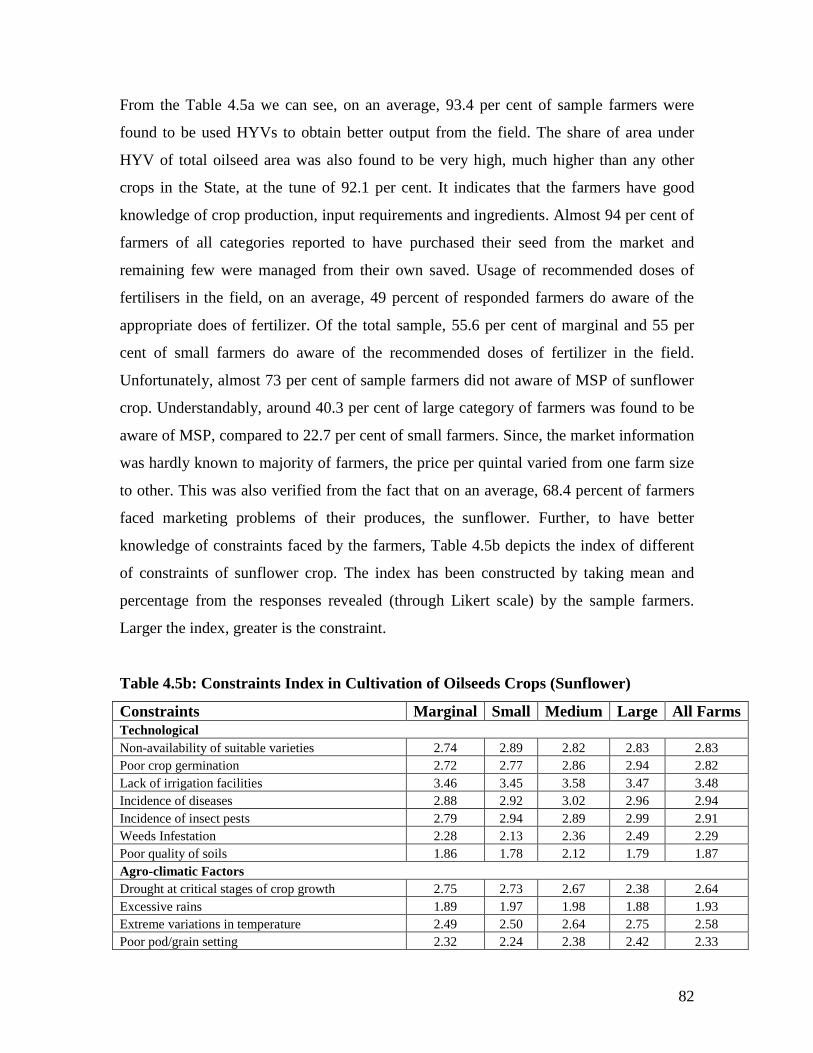
82
From the Table 4.5a we can see, on an average, 93.4 per cent of sample farmers were
found to be used HYVs to obtain better output from the field. The share of area under
HYV of total oilseed area was also found to be very high, much higher than any other
crops in the State, at the tune of 92.1 per cent. It indicates that the farmers have good
knowledge of crop production, input requirements and ingredients. Almost 94 per cent of
farmers of all categories reported to have purchased their seed from the market and
remaining few were managed from their own saved. Usage of recommended doses of
fertilisers in the field, on an average, 49 percent of responded farmers do aware of the
appropriate does of fertilizer. Of the total sample, 55.6 per cent of marginal and 55 per
cent of small farmers do aware of the recommended doses of fertilizer in the field.
Unfortunately, almost 73 per cent of sample farmers did not aware of MSP of sunflower
crop. Understandably, around 40.3 per cent of large category of farmers was found to be
aware of MSP, compared to 22.7 per cent of small farmers. Since, the market information
was hardly known to majority of farmers, the price per quintal varied from one farm size
to other. This was also verified from the fact that on an average, 68.4 percent of farmers
faced marketing problems of their produces, the sunflower. Further, to have better
knowledge of constraints faced by the farmers, Table 4.5b depicts the index of different
of constraints of sunflower crop. The index has been constructed by taking mean and
percentage from the responses revealed (through Likert scale) by the sample farmers.
Larger the index, greater is the constraint.
Table 4.5b: Constraints Index in Cultivation of Oilseeds Crops (Sunflower)
Constraints Marginal Small Medium Large All Farms
Technological
Non-availability of suitable varieties 2.74 2.89 2.82 2.83 2.83
Poor crop germination 2.72 2.77 2.86 2.94 2.82
Lack of irrigation facilities 3.46 3.45 3.58 3.47 3.48
Incidence of diseases 2.88 2.92 3.02 2.96 2.94
Incidence of insect pests 2.79 2.94 2.89 2.99 2.91
Weeds Infestation 2.28 2.13 2.36 2.49 2.29
Poor quality of soils 1.86 1.78 2.12 1.79 1.87
Agro-climatic Factors
Drought at critical stages of crop growth 2.75 2.73 2.67 2.38 2.64
Excessive rains 1.89 1.97 1.98 1.88 1.93
Extreme variations in temperature 2.49 2.50 2.64 2.75 2.58
Poor pod/grain setting 2.32 2.24 2.38 2.42 2.33
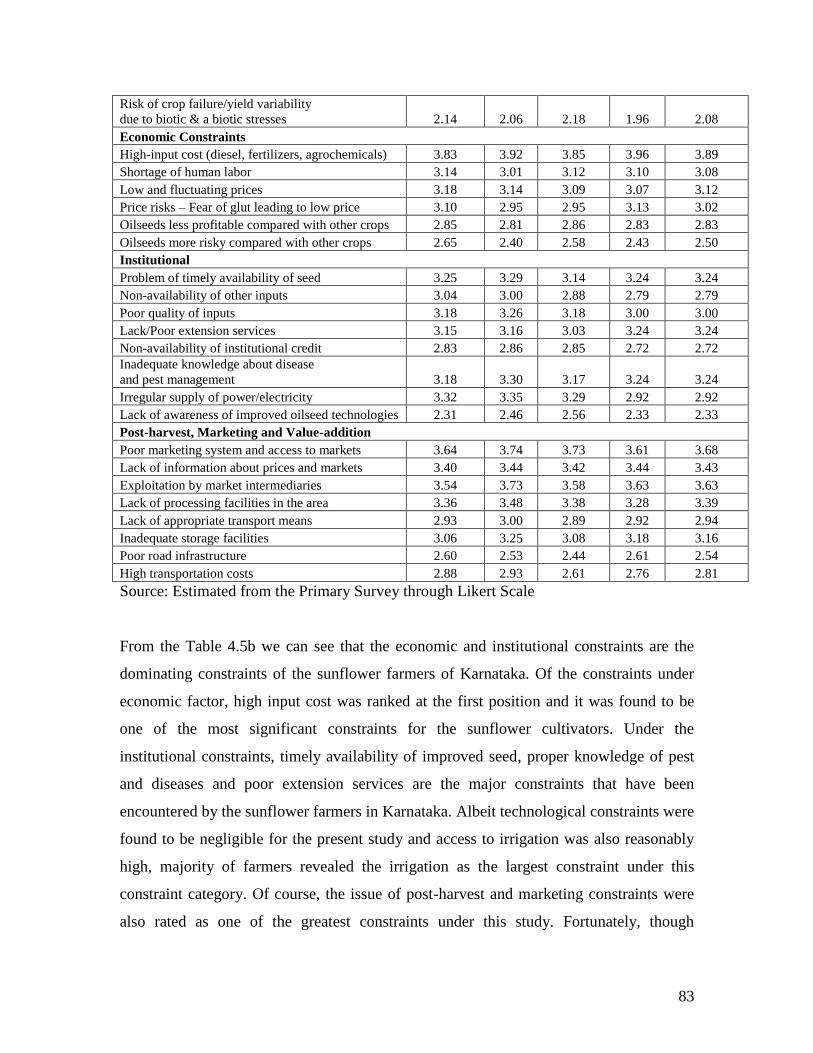
83
Risk of crop failure/yield variability
due to biotic & a biotic stresses 2.14 2.06 2.18 1.96 2.08
Economic Constraints
High-input cost (diesel, fertilizers, agrochemicals) 3.83 3.92 3.85 3.96 3.89
Shortage of human labor 3.14 3.01 3.12 3.10 3.08
Low and fluctuating prices 3.18 3.14 3.09 3.07 3.12
Price risks – Fear of glut leading to low price 3.10 2.95 2.95 3.13 3.02
Oilseeds less profitable compared with other crops 2.85 2.81 2.86 2.83 2.83
Oilseeds more risky compared with other crops 2.65 2.40 2.58 2.43 2.50
Institutional
Problem of timely availability of seed 3.25 3.29 3.14 3.24 3.24
Non-availability of other inputs 3.04 3.00 2.88 2.79 2.79
Poor quality of inputs 3.18 3.26 3.18 3.00 3.00
Lack/Poor extension services 3.15 3.16 3.03 3.24 3.24
Non-availability of institutional credit 2.83 2.86 2.85 2.72 2.72
Inadequate knowledge about disease
and pest management 3.18 3.30 3.17 3.24 3.24
Irregular supply of power/electricity 3.32 3.35 3.29 2.92 2.92
Lack of awareness of improved oilseed technologies 2.31 2.46 2.56 2.33 2.33
Post-harvest, Marketing and Value-addition
Poor marketing system and access to markets 3.64 3.74 3.73 3.61 3.68
Lack of information about prices and markets 3.40 3.44 3.42 3.44 3.43
Exploitation by market intermediaries 3.54 3.73 3.58 3.63 3.63
Lack of processing facilities in the area 3.36 3.48 3.38 3.28 3.39
Lack of appropriate transport means 2.93 3.00 2.89 2.92 2.94
Inadequate storage facilities 3.06 3.25 3.08 3.18 3.16
Poor road infrastructure 2.60 2.53 2.44 2.61 2.54
High transportation costs 2.88 2.93 2.61 2.76 2.81
Source: Estimated from the Primary Survey through Likert Scale
From the Table 4.5b we can see that the economic and institutional constraints are the
dominating constraints of the sunflower farmers of Karnataka. Of the constraints under
economic factor, high input cost was ranked at the first position and it was found to be
one of the most significant constraints for the sunflower cultivators. Under the
institutional constraints, timely availability of improved seed, proper knowledge of pest
and diseases and poor extension services are the major constraints that have been
encountered by the sunflower farmers in Karnataka. Albeit technological constraints were
found to be negligible for the present study and access to irrigation was also reasonably
high, majority of farmers revealed the irrigation as the largest constraint under this
constraint category. Of course, the issue of post-harvest and marketing constraints were
also rated as one of the greatest constraints under this study. Fortunately, though
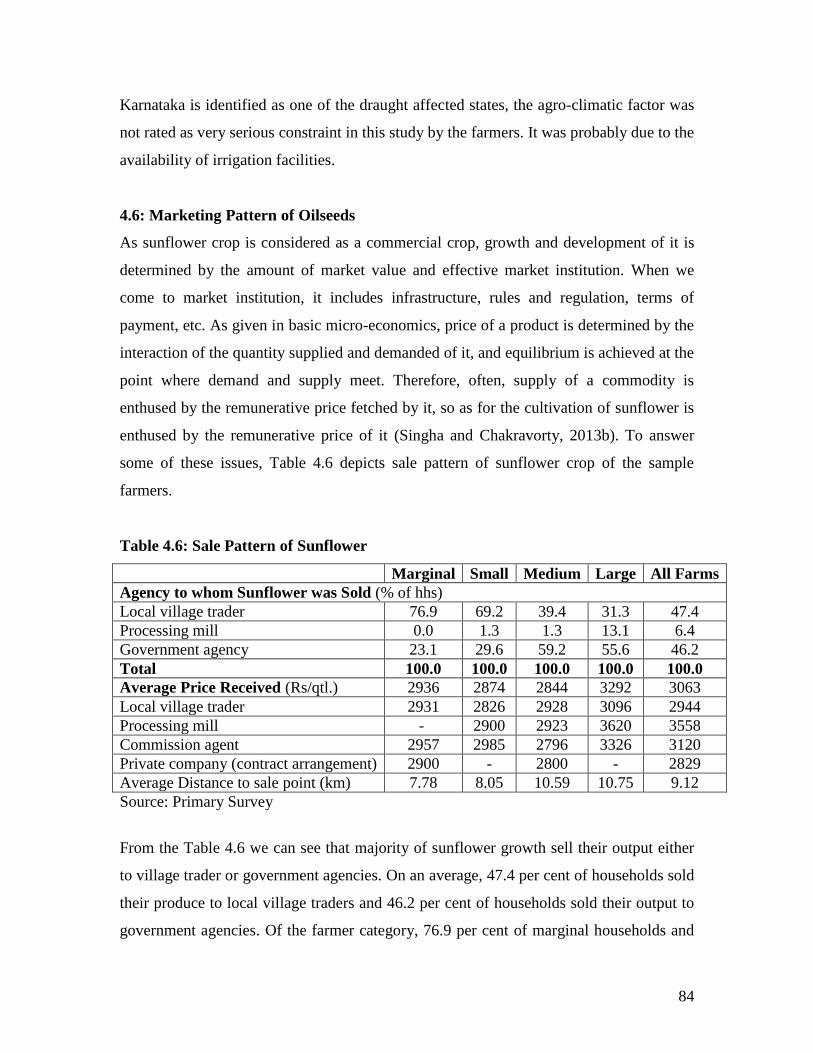
84
Karnataka is identified as one of the draught affected states, the agro-climatic factor was
not rated as very serious constraint in this study by the farmers. It was probably due to the
availability of irrigation facilities.
4.6: Marketing Pattern of Oilseeds
As sunflower crop is considered as a commercial crop, growth and development of it is
determined by the amount of market value and effective market institution. When we
come to market institution, it includes infrastructure, rules and regulation, terms of
payment, etc. As given in basic micro-economics, price of a product is determined by the
interaction of the quantity supplied and demanded of it, and equilibrium is achieved at the
point where demand and supply meet. Therefore, often, supply of a commodity is
enthused by the remunerative price fetched by it, so as for the cultivation of sunflower is
enthused by the remunerative price of it (Singha and Chakravorty, 2013b). To answer
some of these issues, Table 4.6 depicts sale pattern of sunflower crop of the sample
farmers.
Table 4.6: Sale Pattern of Sunflower
Marginal Small Medium Large All Farms
Agency to whom Sunflower was Sold (% of hhs)
Local village trader 76.9 69.2 39.4 31.3 47.4
Processing mill 0.0 1.3 1.3 13.1 6.4
Government agency 23.1 29.6 59.2 55.6 46.2
Total 100.0 100.0 100.0 100.0 100.0
Average Price Received (Rs/qtl.) 2936 2874 2844 3292 3063
Local village trader 2931 2826 2928 3096 2944
Processing mill - 2900 2923 3620 3558
Commission agent 2957 2985 2796 3326 3120
Private company (contract arrangement) 2900 - 2800 - 2829
Average Distance to sale point (km) 7.78 8.05 10.59 10.75 9.12
Source: Primary Survey
From the Table 4.6 we can see that majority of sunflower growth sell their output either
to village trader or government agencies. On an average, 47.4 per cent of households sold
their produce to local village traders and 46.2 per cent of households sold their output to
government agencies. Of the farmer category, 76.9 per cent of marginal households and
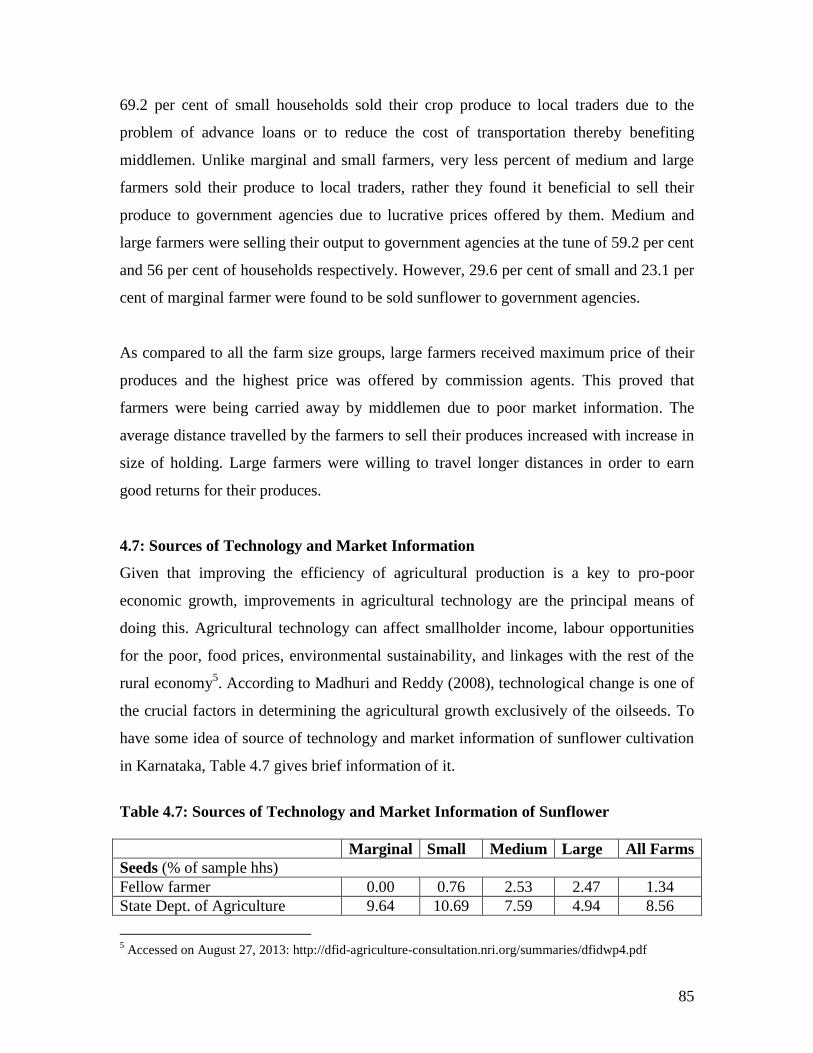
85
69.2 per cent of small households sold their crop produce to local traders due to the
problem of advance loans or to reduce the cost of transportation thereby benefiting
middlemen. Unlike marginal and small farmers, very less percent of medium and large
farmers sold their produce to local traders, rather they found it beneficial to sell their
produce to government agencies due to lucrative prices offered by them. Medium and
large farmers were selling their output to government agencies at the tune of 59.2 per cent
and 56 per cent of households respectively. However, 29.6 per cent of small and 23.1 per
cent of marginal farmer were found to be sold sunflower to government agencies.
As compared to all the farm size groups, large farmers received maximum price of their
produces and the highest price was offered by commission agents. This proved that
farmers were being carried away by middlemen due to poor market information. The
average distance travelled by the farmers to sell their produces increased with increase in
size of holding. Large farmers were willing to travel longer distances in order to earn
good returns for their produces.
4.7: Sources of Technology and Market Information
Given that improving the efficiency of agricultural production is a key to pro-poor
economic growth, improvements in agricultural technology are the principal means of
doing this. Agricultural technology can affect smallholder income, labour opportunities
for the poor, food prices, environmental sustainability, and linkages with the rest of the
rural economy5. According to Madhuri and Reddy (2008), technological change is one of
the crucial factors in determining the agricultural growth exclusively of the oilseeds. To
have some idea of source of technology and market information of sunflower cultivation
in Karnataka, Table 4.7 gives brief information of it.
Table 4.7: Sources of Technology and Market Information of Sunflower
Marginal Small Medium Large All Farms
Seeds (% of sample hhs)
Fellow farmer 0.00 0.76 2.53 2.47 1.34
State Dept. of Agriculture 9.64 10.69 7.59 4.94 8.56
5 Accessed on August 27, 2013: http://dfid-agriculture-consultation.nri.org/summaries/dfidwp4.pdf
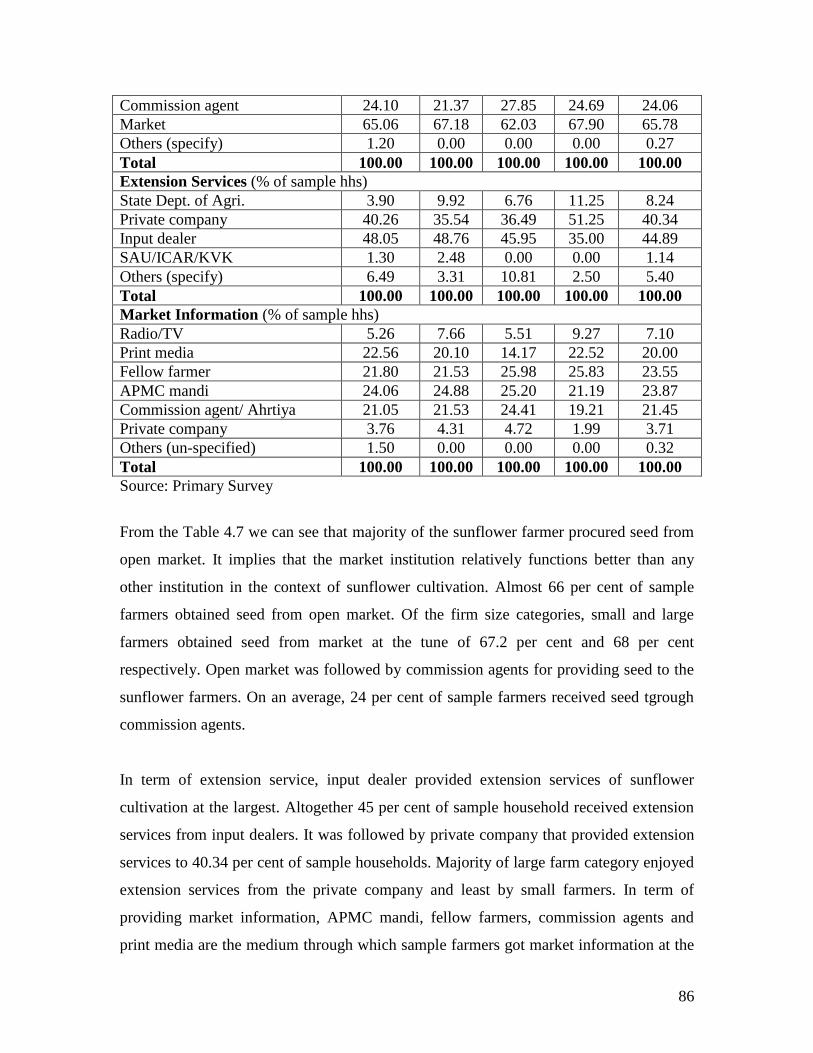
86
Commission agent 24.10 21.37 27.85 24.69 24.06
Market 65.06 67.18 62.03 67.90 65.78
Others (specify) 1.20 0.00 0.00 0.00 0.27
Total 100.00 100.00 100.00 100.00 100.00
Extension Services (% of sample hhs)
State Dept. of Agri. 3.90 9.92 6.76 11.25 8.24
Private company 40.26 35.54 36.49 51.25 40.34
Input dealer 48.05 48.76 45.95 35.00 44.89
SAU/ICAR/KVK 1.30 2.48 0.00 0.00 1.14
Others (specify) 6.49 3.31 10.81 2.50 5.40
Total 100.00 100.00 100.00 100.00 100.00
Market Information (% of sample hhs)
Radio/TV 5.26 7.66 5.51 9.27 7.10
Print media 22.56 20.10 14.17 22.52 20.00
Fellow farmer 21.80 21.53 25.98 25.83 23.55
APMC mandi 24.06 24.88 25.20 21.19 23.87
Commission agent/ Ahrtiya 21.05 21.53 24.41 19.21 21.45
Private company 3.76 4.31 4.72 1.99 3.71
Others (un-specified) 1.50 0.00 0.00 0.00 0.32
Total 100.00 100.00 100.00 100.00 100.00
Source: Primary Survey
From the Table 4.7 we can see that majority of the sunflower farmer procured seed from
open market. It implies that the market institution relatively functions better than any
other institution in the context of sunflower cultivation. Almost 66 per cent of sample
farmers obtained seed from open market. Of the firm size categories, small and large
farmers obtained seed from market at the tune of 67.2 per cent and 68 per cent
respectively. Open market was followed by commission agents for providing seed to the
sunflower farmers. On an average, 24 per cent of sample farmers received seed tgrough
commission agents.
In term of extension service, input dealer provided extension services of sunflower
cultivation at the largest. Altogether 45 per cent of sample household received extension
services from input dealers. It was followed by private company that provided extension
services to 40.34 per cent of sample households. Majority of large farm category enjoyed
extension services from the private company and least by small farmers. In term of
providing market information, APMC mandi, fellow farmers, commission agents and
print media are the medium through which sample farmers got market information at the
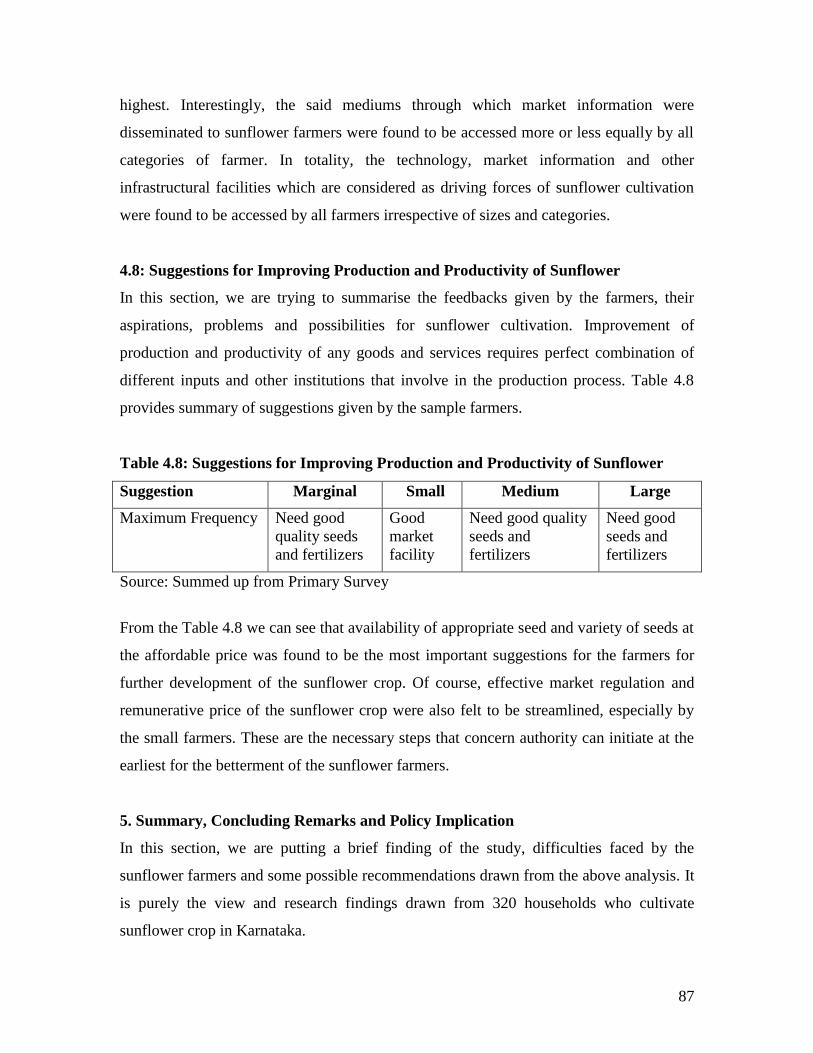
87
highest. Interestingly, the said mediums through which market information were
disseminated to sunflower farmers were found to be accessed more or less equally by all
categories of farmer. In totality, the technology, market information and other
infrastructural facilities which are considered as driving forces of sunflower cultivation
were found to be accessed by all farmers irrespective of sizes and categories.
4.8: Suggestions for Improving Production and Productivity of Sunflower
In this section, we are trying to summarise the feedbacks given by the farmers, their
aspirations, problems and possibilities for sunflower cultivation. Improvement of
production and productivity of any goods and services requires perfect combination of
different inputs and other institutions that involve in the production process. Table 4.8
provides summary of suggestions given by the sample farmers.
Table 4.8: Suggestions for Improving Production and Productivity of Sunflower
Suggestion Marginal Small Medium Large
Maximum Frequency Need good
quality seeds
and fertilizers
Good
market
facility
Need good quality
seeds and
fertilizers
Need good
seeds and
fertilizers
Source: Summed up from Primary Survey
From the Table 4.8 we can see that availability of appropriate seed and variety of seeds at
the affordable price was found to be the most important suggestions for the farmers for
further development of the sunflower crop. Of course, effective market regulation and
remunerative price of the sunflower crop were also felt to be streamlined, especially by
the small farmers. These are the necessary steps that concern authority can initiate at the
earliest for the betterment of the sunflower farmers.
5. Summary, Concluding Remarks and Policy Implication
In this section, we are putting a brief finding of the study, difficulties faced by the
sunflower farmers and some possible recommendations drawn from the above analysis. It
is purely the view and research findings drawn from 320 households who cultivate
sunflower crop in Karnataka.
88
5.1. Main Findings
Karnataka covers the second largest share of dry-land farming in India. Therefore,
emphasising more on the conventional rain-fed cultivation like paddy has little advantage
for the farmers, especially in the northern Karnataka. The crops like maize, oilseeds
including sunflower, tur dal etc., which can survive with little managed irrigation is
preferred and made significant improvement of these crops in the recent past in the state.
Of the oilseeds, sunflower crop has been performing well in the state and has become the
largest contributor of sunflower crop in the country. Sunflower cultivation enhances
socio-economic conditions of the farmers in Karnataka, when compared to other
traditional crops, especially in the northern part of the state.
In Karnataka, the area of oilseed cultivation has increased significantly in the recent past.
It was found that the total area of oilseed of the state in the early 1970s was 12.27 lakh
hectares and rose to 15.06 lakh hectares in early 1980s. Accordingly, the area under
sunflower has also increased from 0.24 lakh hectares in TE-1973-74 to 2.09 lakh hectares
TE-1983-84. Further since TE-1993-94, there was a miracle change in oil-seed sector in
Karnataka and its contribution to national level was also very significant. The total area
of oilseed in the state in TE-1993-94 was 29.60 lakh hectares and at the same time the
area under sunflower was also rose to 12.43 lakh hectares. However, after oil miracle in
1990s, the area under oilseed and also the sunflower crop of the state suffered some
declining trend. Nevertheless, the decadal growth trend of oilseed was found to be highly
significant in the in all five decades together from 1960s to 2000s. Further, the periods of
1970s and 1990s have slightly volatile trends for all components– area, production and
yield. The period of 1990s had high negative significance for the area and production of
the total oilseed in the state. But, when we put entire five decades together, the
significance level was found to be very high (significant at 1% level) for all components
of area, production and productivity.
When we look at the share of production of major oilseed crops of the major districts, the
major share of oilseed in the State, in TE-1993-94, was contributed by Chitradurga,
Gulbarga and Belgaum, at the tune of 12.83 per cent, 10.15 per cent and 6.93 per cent
89
respectively. In TE-2009-10, the share of Belgaum rose to 10 per cent. However, the
other two districts– Chitradurga and Gulbarga have decreased their share to 9.05 per cent
and 8.21 per cent respectively in the same period. In the case of sunflower, the share of
production by the district of Raichur has increased very negligibly from 15.14 per cent in
TE-1993-94 to 15.85 per cent in TE-2009-10. However, other two districts have
decreased significantly from 25.03 per cent by Bijapur in TE-1993-94 to 10.73 per cent in
TE-2009-10. Similarly, the share of Gulbarga has decreased from 15.98 per cent in TE-
1993-94 to 11.01 per cent in TE-2009-10. This implies that the production of oilseed
including the sunflower has slightly gone down in 2000s in the State.
Sunflower area under irrigation was 56.2 per cent of the total sunflower area of the
sample farmers. Despite kharif being the major crop season in Karnataka, the area under
kharif crops was found to be lower than that of rabi crop area of cultivation of the sample
farmers. Of the oilseed, 111.3 hectare was found under sunflower and 18.2 hectare under
groundnut crop of the sample farmers. The area under sunflower was 76.4 per cent of the
total sample farmers and the irrigated area under the crop was 45.22 per cent. Of the
399.8 hectares of sunflower area under rabi season, 224.5 hectares were found to be
irrigated and remaining 175.3 hectares were un-irrigated. In percentage term, the irrigated
area under sunflower in rabi season turned out to be 56.2 percent of the total sunflower
crop area of the sample farmers. Jowar was found to be competing crops grown by the
selected farmers.
As of the cost of sunflower cultivation, on an average, paid-out cost was worked out to be
Rs 22,136 per hectare. As of the cost of production per quintal, on an average, Rs 2282
per quintal of sunflower production was incurred by all type of farmers. In term of
economics of sunflower cultivation, on an average, farmers obtained a net income of Rs
8,669 per hectare. This was arrived by subtracting the average operating cost of
cultivation of Rs 22,136 per hectare from gross income of Rs 30805 which includes the
value of Rs 29,708 of main product and Rs 1097 per hectare. As of the yield, it was 9.70
qtl/ha of land cultivation of sunflower crop. It can be also seen that paid-out cost per
hectare of sunflower cultivation declined in the selected area as farm size of holding
90
increases. Primary survey found large degree of mechanisation for the large and medium
farmers compared to the marginal and small farmers due to higher capacity of land
holdings. The lowest net income was reported by medium farmers with Rs 6,391 per
hectare and Rs 7,444 per hectare by the small farmers. In term of share of each input to
total cost (operational), fertilizers and manure accounted for 34.5 per cent, followed by
human labour with 19.7 per cent and machine labour with 18 per cent of total paid-out
cost. Despite all the sunflower farmers of Karnataka irrespective of category accessed
more or less equally to technology advancement, larger farmers enjoyed better market
opportunity. Consequently, they could harness better remunerative market price of
sunflower than that of smaller farmers.
5.2. Conclusions
Karnataka is known for its rich biodiversity in India. The State has been identified as one
of the 10 agro-climatic zones, suited for the majority of agricultural and horticultural
crops. Though the share of agriculture to the State’s economy has been declining, it still
remains very large, lingers around 14 per cent of the State’s Net State Domestic Product
(NSDP) in 2010-11. The contribution of agriculture to the State income (NSDP at 2004-
05 constant prices) has declined from 25 per cent in 1999-00 to 13.6 per cent in 2010-11
compared to 14.4 per cent of all India level (for 2010-11 at 2004-05 prices).
Within the agriculture sector, the share of oilseeds to gross cropped area was about 12 per
cent during the early eighties, and went above 21 per cent during the early nineties, where
it stayed during the decade. In the late 1990s, State’s share of area under oilseed to all
India total had gone down to 8.2 per cent and production share of State was around 6 per
cent of the all India level (Shenoi, 2003). In the State, the area under oilseeds cultivation
from 1992-93 to 2002-03 has gone down by almost 50 per cent. For instance, the share of
oilseed cultivation was 25.64 per cent of the net sown area and declined to 12.6 per cent
in 2002-03. This situation was mainly attributed to shortage and ill distribution of rainfall
in the State. Out of the land under major oilseeds in Karnataka, groundnut shared 50.42
per cent and ranked first during 2002-03. Sunflower comes in the second rank, with a
share of 34.47 per cent of the total major oilseed cultivated during same period. When it
91
comes to all India level, sunflower was mainly contributed by Karnataka. Later on, the
total oilseed area in Karnataka was approximately 2.8 thousand hectare from 2006-07 to
2010-11. Of which, sunflower area was 43 per cent of the total oilseed area, covering
about 0.9 thousand hectare.
In the late 1990s, Karnataka’s share to all India level of area under sunflower cultivation
was about 38.4 to 45.7 per cent and the production share was around 28 to 29 per cent
only. However, in 2000s, the State’s contribution has increased dramatically above 50 per
cent, even touched 61 per cent in 2005-06. Similarly, the share of production has also
increased above 36 per cent, even touched 55 per cent in 2005-06. But the yield rate was
not at par with all India level. In 2005-06, the year which registered highest area and
production of sunflower crop in the State, the yield level was 552 kg/ha compared to 615
kg/ha of national level. Understandably, larger farmers of sunflower crop accessed more
effectively to market information compared to small farmers. Irrigation and other
technologies involved in sunflower cultivation were found to be accessed more or less
equally by all farmers. Albeit the large category farmers enjoyed better market
information, they were found to be more exposed to greater income risk of sunflower
cultivation. In nutshell, sunflower cultivation was found to be beneficial for the
Karnataka farmers than that of national level.
5.3. Policy Implications
As of the policy implication, availability of appropriate seed and variety of seeds at the
affordable price for the sunflower farmers would be one of the most important initiatives
for further development of the sunflower crop. It does not mean that sunflower
cultivation in the State was held up due to shortage of seed. Often, farmers were charged
exorbitant price of seed in the open market during the peak season. Same holds true for
the fertilizers. Therefore, government should make available those most essential inputs
of farmers at the affordable price with different varieties. Similarly, effective market
regulation and remunerative price of the sunflower crop were also be streamlined,
especially by the small farmers. As found the analysis above, the small and marginal
92
farmers were not equally accessible to appropriate market information and effective price
mechanism.
6. References
Achaya, K. T. (1975). Tackling the Edible Oil Famine. Economic and Political
Weekly, 10(19): 758-759+761-769.
Chhattrapati, A. C. (1980). Trends in Oilseeds Production. Economic and
Political Weekly, 15(37): 1557-1561.
Crites, G. D. (1993). Domesticated Sunflower in Fifth Millennium B. P. Temporal
Context: New Evidence From Middle Tennessee. American Antiquity, 58(1):146-
148.
Chandy, K. T. (Undated). Crop Pattern and Productivity Trends, Booklet No.510,
Agricultural Situation in India: ASIS-7, Unpublished.
Deshpande, R. S. (2002). Evaluation of Oilseed Production Programme in
Karnataka, Research Project conducted in Institute for Social and economic
Change, Bangalore (Karnataka), funded by the Government of Karnataka,
Bangalore.
De, Debdeep (2011). Edible Oil Sector in India: An Emerging Perspective and
Policy Issues. Occasional Paper 2, Jaypee Business School, Jaypee Institute of
Information Technology. Noida (Uttar Pradesh): India.
DES (2013). Land use Statistics at a Glance– State-wise. Directorate of
Economics and Statistics, Department of Agriculture and Cooperation: Ministry
of Agriculture, Government of India [accessed August 20, 2013:
http://eands.dacnet.nic.in/LUS-2010-11/S3.pdf]
DES (2012). Agricultural Statistics at a Glance. Directorate of Economics and
Statistics, Deptt. of Agriculture and Cooperation, Ministry of Agriculture.
Government of India.
DES (2010). Agricultural Prices of India, 27th
Edition. Directorate of Economics
and Statistics, Deptt. of Agriculture and Cooperation, Ministry of Agriculture.
Government of India.
GoK (2011). Integrated Agribusiness Development Policy. Bangalore:
Department of Agriculture, Government of Karnataka.
GoK (2012). Economic Survey of Karnataka 2011-12. Planning, Programme
Monitoring and Statistics Department, Government of Karnataka.
93
Gulati, Ashok; Anil Sharma; and Deepali S. Kohli (1996). Self-sufficiency and
Allocative Efficiency: Case of Edible Oils. Economic and Political Weekly,
31(13): A15-A24.
Goyari, Phanindra (2005). Flood Damages and Sustainability of Agriculture in
Assam. Economic and Political Weekly, 40(26): 2723-2729.
Ghosh, Bidyut Kumar (2011). Determinants of the Changes in Cropping Pattern
in India: 1970-71 to 2006-07. Bangladesh Development Studies, Vol. XXXIV,
No. 2, pp. 109-120.
Heiser, Charles B. Jr. (1955). The Origin and Development of the Cultivated
Sunflower. The American Biology Teacher, 17(5): 161-167.
Joshi, Deepak B. (2009). Developing Statistical Models to Study the Growth and
Instability in Oilseed Production of Karnataka. Unpublished thesis of Master of
Science (Agriculture) in Agricultural Statistics, submitted to the University of
Agricultural Sciences, Dharwad, Karnataka (India).
Kalaiselvi, V (2012). Patterns of Crop Diversification in Indian Scenario. Annals
of Biological Research, 3(4):1914-1918.
Karnool, N.N., H.S. Vijayakumar and L.B. Raghavendra (2007). Pre- and Post-
WTO Changes in Oilseed Economy of Karnataka: A Case of Groundnut,
Agricultural Economics Research Review, Vol. 20 (Conference Issue), pp. 529-
540.
Krishna, K. R. (2010). Agro-ecosystems of South India: Nutrient Dynamics,
Ecology and Productivity. Boca Raton, USA: Universal Publishers.
Khan, Imran (2013). Sunflower Miracle in Parched Fields. Tehelka Magazine,
Volume 10 Issue 23, Dated 8 June 2013 pages 1-2.
Kannan, Elumalai and Sujata Sundaram (2011). Analysis of Trends in India’s
Agricultural Growth. Working Paper 276, Institute for Social and Economic
Change, Bangalore.
Mahesh, R. (1999). Causes and Consequences of Change in Cropping Pattern: A
Location-specific Study. Discussion Paper No. 11 (December). Kerala Research
Programme on Local Level Development, Centre for Development Studies,
Thiruvananthapuram: Kerala (India).
Mandal, Raju (2010). Cropping Pattern and Risk Management in the Flood
Plains of Assam. Economic and Political Weekly, 45 (33): 78-81.
94
Motebennur, S.S. (2012). Spatial Analysis of Land-Use under Major Edible
Oilseeds in Karnataka, Contemporary Research in India, 2(3): 135-140.
MoA (2013). Area, Production and Productivity of Oilseed. Ministry of
Agriculture, Government of India [accessed on June 14, 2013 and available at:
http://www.indiastat.com/agriculture/2/commercialcrops/17188/oilseeds/17204/st
ats.aspx]
Mündel, Hans-Henning (2009). Sunflowers: An Important Part of the Tool kit for
Dry-land Farming. Australian Grain, January-February 2009, Page No. 30-33.
Misana, Salome B.; Cosmas Sokoni and Milline J. Mbonile (2012). Land-
use/cover changes and their drivers on the slopes of Mount Kilimanjaro,
Tanzania. Journal of Geography and Regional Planning, 5(6): 151-164.
Madhuri, V. Mary and K. Satyanarayana Reddy (2008). Impact of Technological
Development on the Production of Groundnut in Andhra Pradesh: An Empirical
Study. The IUP Journal of Agricultural Economics, 5(1): 24-34.
Norwood, Charles A. (1999). Water Use and Yield of Dryland Row Crops as
Affected by Tillage. Agronomy Journal, 91(1): 108-115.
Planning Commission (2011). Data for Use of Deputy Chairman, 18 May 2011.
Planning Commission, Government of India.
Persaud, Suresh and Maurice R. Landes (2006). The Role of Policy and Industry
Structure in India’s Oilseed Markets. Economic Research Report No. 17, United
States Department of Agriculture. [accessed on July 8, 2013:
http://ers.usda.gov/publications/ERR17/ERR17.pdf]
Rai, Mangala (1999). Oilseed in India: A Success Story. Bangkok: APAARI
Publications.
RBI (2011). Handbook of Statistics on the Indian Economy for the year 2010-11.
Mumbai: Govt. of India.
Shenoi, P. V. (2003). Oilseeds Production, Processing and Trade: A Policy
Framework. Occasional Paper No. 26, Department of Economic Analysis and
Research, National Bank for Agriculture and Rural Development, Mumbai.
Singha, Komol (2011). Infrastructure and Regional Disparity- A Case of North
Eastern Region of India. Journal of Social and Development Sciences, 2(4): 162-
80.
Singha, Komol (2012). Economics of Paddy Processing Industry in India: A Case
of Karnataka, Scientific Journal of Agricultural, (1): 4: 80-91.
95
Singha, Komol (2013). Growth of Paddy Production in India’s North Eastern
Region: A Case of Assam. Anvesak, Vol. 42 Number 1 & 2 (January to December
2012), Pages 193-206.
Singha, Komol and Arpita Chakravorty (2013a). Crop Diversification and
Growth of Maize in Karnataka: An Assessment. Working Paper No. 299, Institute
for Social and Economic Change, Bangalore.
Singha, Komol and Arpita Chakravorty (2013b). Crop Diversification in India: A
Study of Maize Cultivation in Karnataka. Scientific Journal of Review, 2(1): 1-10.
Singh, Gomatee (2012). Factors Influencing Cropping Pattern in Bulandshahr
District: With Special Reference to the Size of Land Holding. International Journal
of Scientific and Research Publications, 2(5): 1-10.
Sood, Anil; S. S. Ray; B. U. Choudhury; P. K. Sharma and Sushma Panigrahy
(2003). Long-term Changes in Cropping Pattern of Bathinda District, Punjab: A
Remote Sensing Approach [accessed on June 28, 2013:
http://www.isprs.org/proceedings/XXXVI/part4/Pages%20from%20RS-A9-.pdf]
Thilagaraj, A. (2010). Edible Oils: Demand-Supply Gap Continues. Market
Survey [accessed June 4, 2013:
http://www.ffymag.com/admin/issuepdf/Edible%20Oils_Feb10.pdf]
Yogeshwari, S (2013). Cropping Towards Commercialisation: Are We Neglecting
Food Security: A Case Study of Karnataka State. Asian Journal of Research in
Business Economics and Management, 3 (4): 38-52.
Zilihona, I.J.E.; H.W. Mwatawala and E.Y. Swai (2013). Sunflower Production
and its Contribution to Poverty Reduction in Singida District, Tanzania. Paper
presented at REPOA’s 18th
Annual Research Workshop held at the Kunduchi
Beach Hotel, Dar es Salaam, Tanzania on April 3-4, 2013.
_____________________________________________