PROBLEMS AND PROSPECTS OF MUTUAL FUND INVESTMENTS … · PROBLEMS AND PROSPECTS OF MUTUAL FUND...
121
PROBLEMS AND PROSPECTS OF MUTUAL FUND INVESTMENTS-A PERSPECTIVE STUDY ON KERALITES Submitted to the University Grand’s Commission,New Delhi In partial fulfillment of the requirements for the Minor Research Project. By RATHEESH.K.NAIR POST GRADUATE & RESEARCH DEPARTMENT OF COMMERCE GOVT.COLLEGE MADAPPALLY VADAKARA, KOZHIKODE January 2016
Transcript of PROBLEMS AND PROSPECTS OF MUTUAL FUND INVESTMENTS … · PROBLEMS AND PROSPECTS OF MUTUAL FUND...

PROBLEMS AND PROSPECTS OF MUTUAL FUND
INVESTMENTS-A PERSPECTIVE STUDY ON
KERALITES
Submitted to the University Grand’s Commission,New Delhi
In partial fulfillment of the requirements for the Minor Research Project.
By
RATHEESH.K.NAIR
POST GRADUATE & RESEARCH DEPARTMENT OF COMMERCE
GOVT.COLLEGE MADAPPALLY
VADAKARA,
KOZHIKODE
January 2016

Declaration
I hereby declare that the project report entitled "PROBLEMS AND
PROSPECTS OF MUTUAL FUND INVESTMENTS-A PERSPECTIVE
STUDY ON KERALITES" is a bonafide project work done by me and I further
declare that this project work has not been submitted to any University or
Institution.
Kollam Ratheesh.K.Nair
Date: 03.01.2017

Acknowledgement
It is with a sense of achievement and pride that I complete my project work.
It has been made possible by the unstinting support of many people. These few
words only convey my formal thanks but cannot convey the depth of my gratitude to
them.
I express my sincere gratitude to the Principal, Govt.College Madappally,
faculty members at Department of Commerce and staff for their valuable
suggestions and kind cooperation.
I am deeply indebted to University Grants Commission for allotting the
funds for the smooth conduct of the project.
I take this opportunity to thank my fellow Ph.D. students and friends who
were always there in times of need.
I am deeply indebted to my parents and my wife for the moral support and
encouragement in my academic pursuits.
Above all I am thankful to the God, Almighty who has given me the
strength,power and opportunity to complete this work successfully.
Ratheesh.K.Nair

Abstract
Kerala, obviously, one of the leading States in India in terms of both human
development and literacy. Unfortunately, the State could not realize such growth in
capital market investments. The conditions are not different in mutual fund
investments also. Hence, this research took efforts to investigate the underlying
reasons for such financial market lagging in Kerala through the assessment of the
problems and prospects of mutual fund investments from the perspectives of Investors
there. The study also analysed the behavior and perception of investors for looking into
the potentials of mutual fund investment in the State. Under a descriptive research
framework, through rigorous statistical procedures on the multiple responses of
investors, the study was able to make out prolific findings relevant to the development
and growth of mutual fund market in Kerala.
In Kerala, because of insufficient savings, the people prefer to invest in riskless
assets like bank deposits, post office savings etc. However, investors surveyed in this
research convinced their interests in market linked assets given the conditions of
improved earnings. Inadequate investor protection measures and imperfect market
conditions often perceived as the main risk factors that persuade the investors to keep
their place outside the fund markets. Fund management still is a problem exists at
aggravate level even among the mutual fund investors of the state. Better governance,
customised investment products with more innovative features enable the Mutual
Funds to penetrate more even into rural parts thereby can widen their client base in
Kerala. Such actions can improve the investment conditions of the State thereby
contribute more to its economic growth.

Contents
Chapter 1 Introduction ------------------------------------------------------ 1
1.1 Introduction --------------------------------------------------------- 1
1.2 Statement of the Problem------------------------------------------ 1
1.3 Significance of the study ------------------------------------------ 3
1.4 Scope of the Study ------------------------------------------------- 4
1.5 Objectives of the Study -------------------------------------------- 4
1.6 Operational Definitions -------------------------------------------- 5
1.7 Hypotheses ---------------------------------------------------------- 7
1.8 Research Design ---------------------------------------------------- 7
1.8.1 Source of Data --------------------------------------------- 7
1.8.2 Survey Instrument ----------------------------------------- 8
1.8.3 Survey Area ------------------------------------------------ 8
1.8.4 Measurement of Variables ------------------------------- 8
1.9 Sampling Design -------------------------------------------------- 10
1.10 Period of Reference ---------------------------------------------- 14
1.11 Tools of Analysis -------------------------------------------------- 14
1.12 Limitations of the Study ------------------------------------------ 15
1.13 Chapter Framework ----------------------------------------------- 15
References ----------------------------------------------------------------- 16
Chapter 2 Review of Literature ------------------------------------------- 17
Chapter 3 Mutual Funds and Regulation in Indi ------------------------ 3.1 Introduction 60
3.2 Trends in Resource Mobilisation by Private and public
Sector Mutual Funds in India. ----------------------------------- 61
3.3 Mutual Fund schemes ------------------------------------------- 64
3.4 Scheme –wise Resource Mobilisation -------------------------- 66
3.5 Asset Under Management in India:Geographical
Distribution ---------------------------------------------------- 67
3.6 State wise Penetration of Mutual Fund ---------------------------- 72
3.7 Mutual Fund investors -------------------------------------------- 78

3.7.1 Investor interest in Mutual Fund investment in
India ------------------------------------------------------- 79
3.8 Private and public Sector Mutual Funds, investor
participation and resource mobilisation -------------------------- 86
3.9 Preferences of Kerala Investors in Mutual Funds ------------ 86
3.10 Preferences of Kerala Investors in Mutual Fund schemes 87
3.11 Investor protection and regulatory mechanism of
Mutual Fund ----------------------------------------------- 83
3.11.1 Securities and Exchange Board of India --------------- 84
3.11.2 Association of Mutual Fund Industry ------------------ 84
3.11.3 Stock exchanges ------------------------------------------- 85
3.11.4 Reserve Bank of India ----------------------------------- 85
3.12 Rights with respect to Management of the fund --------------- 89
3.13 Regulatory Developments ---------------------------------------- 99
3.13.1 Investor Grievances and Redressal ------------------ 102
3.13.2 Redressal of complaints received against popular
mutual funds…………………….…………105
3.17 Conclusion -------------------------------------------------------- 114
Chapter 4 Problems and prospects of Mutual Fund Investments in
Kerala 117
4.1 Introduction ------------------------------------------------------ 117
4.2 Banking and Insurance products and Number of AMC
Branches in Kerala ------------------------------------- 127
4.3 AUM by Geography - Consolidated data for MF
Industry in Kerala ---------------------------------------- 128
4.4 Investors in Kerala ---------------------------------------------- 142
4.5 Behaviour of Individual Investors of Kerala ---------------- 176
4.6 Preference of Investment Avenues ---------------------------- 176
4.6.1 Investor Profile and Investment Preferences:
Test of Association ------------------------------------- 177

4.6.2 Relationship between Investor Category and
Preference of Investment ------------------------------------ 178
4.7 Perceived change in investment avenues given the
increased savings ------------------------------------------------ 191
4.8 Investor‟s priorities over investment features of
Mutual fund ------------------------------------------------------ 201
4.9 Investors perception towards Problems in Mutual Fund
Investment --------------------------------------------------------------- 203
4.10 Prospects of Mutual Fund Investments in Kerala ------------ 233
4.10.1 Prospective features in Mutual Fund
Investment 235
4.10.2 Factors influencing the prospects of mutual
Fund Investment ---------------------------------------- 235
4.10.2.1 Fund Promotion ------------------------------ 237
4.10.2.2 Role of Regulators --------------------------- 238
4.10.2.4 Service provided by Mutual funds -------- 239
4.10.2.4 Fund performance --------------------------- 239
4.10.2.5 Fund quality ---------------------------------- 239
4.11 Prospects of Mutual Fund investment-Discriminant
analysis ------------------------------------------------------------ 239
4.11.1 Canonical Discriminant Functions ------------------- 241
4.12 Conclusion -------------------------------------------------------- 245
Chapter 5 Summary, Findings and Suggestions ----------------------- 246
5.1 Introduction ------------------------------------------------------ 246
5.2 Regulatory mechanism of Mutual Fund ---------------------- 248
5.3 Public and Private Sector Institutional Participation ------- 249
5.4 Investor Behaviour in Kerala ---------------------------------- 251
5.5 Problems of Mutual Funds ------------------------------------ 253
5.6 Services for Mutual Fund Investment ---------------------------- 254
5.7 Suggestions and Recommendations -------------------------- 256
5.7.1 Product Design ----------------------------------------- 256
5.7.2 Use of Technology ------------------------------------ 258
5.7.3 Investor Awareness ------------------------------------ 258

8.3 Conclusion -------------------------------------------------------- 259
8.4 Contributions of the Study ------------------------------------- 260
8.5 Scope for Further Research ------------------------------------ 260
Bibliography -------------------------------------------------------------------------- 262
Appendix ------------------------------------------------------------------------------ 277
List of Presentations & Publication --------------------------------------------- 282
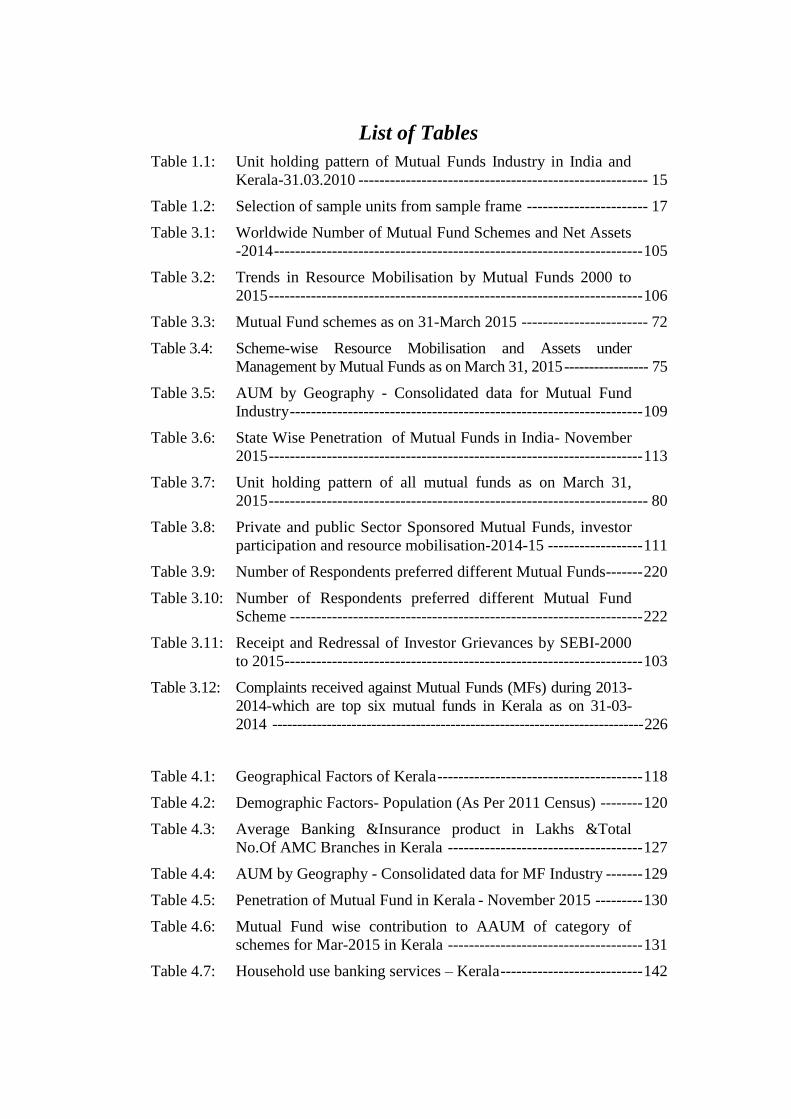
List of Tables
Table 1.1: Unit holding pattern of Mutual Funds Industry in India and
Kerala-31.03.2010 ------------------------------------------------------- 15
Table 1.2: Selection of sample units from sample frame ----------------------- 17
Table 3.1: Worldwide Number of Mutual Fund Schemes and Net Assets
-2014 ---------------------------------------------------------------------- 105
Table 3.2: Trends in Resource Mobilisation by Mutual Funds 2000 to
2015 ----------------------------------------------------------------------- 106
Table 3.3: Mutual Fund schemes as on 31-March 2015 ------------------------ 72
Table 3.4: Scheme-wise Resource Mobilisation and Assets under
Management by Mutual Funds as on March 31, 2015 ----------------- 75
Table 3.5: AUM by Geography - Consolidated data for Mutual Fund
Industry ------------------------------------------------------------------- 109
Table 3.6: State Wise Penetration of Mutual Funds in India- November
2015 ----------------------------------------------------------------------- 113
Table 3.7: Unit holding pattern of all mutual funds as on March 31,
2015 ------------------------------------------------------------------------ 80
Table 3.8: Private and public Sector Sponsored Mutual Funds, investor
participation and resource mobilisation-2014-15 ------------------ 111
Table 3.9: Number of Respondents preferred different Mutual Funds ------- 220
Table 3.10: Number of Respondents preferred different Mutual Fund
Scheme ------------------------------------------------------------------- 222
Table 3.11: Receipt and Redressal of Investor Grievances by SEBI-2000
to 2015 -------------------------------------------------------------------- 103
Table 3.12: Complaints received against Mutual Funds (MFs) during 2013-
2014-which are top six mutual funds in Kerala as on 31-03-
2014 --------------------------------------------------------------------------- 226
Table 4.1: Geographical Factors of Kerala --------------------------------------- 118
Table 4.2: Demographic Factors- Population (As Per 2011 Census) -------- 120
Table 4.3: Average Banking &Insurance product in Lakhs &Total
No.Of AMC Branches in Kerala ------------------------------------- 127
Table 4.4: AUM by Geography - Consolidated data for MF Industry ------- 129
Table 4.5: Penetration of Mutual Fund in Kerala - November 2015 --------- 130
Table 4.6: Mutual Fund wise contribution to AAUM of category of
schemes for Mar-2015 in Kerala ------------------------------------- 131
Table 4.7: Household use banking services – Kerala --------------------------- 142

Table 4.8: Preference of Investment by investors in Kerala ------------------- 176
Table 4.9: Association between Investor Category and Preference of
Investment --------------------------------------------------------------- 178
Table 4.10: Change investor preference under the condition of increased
savings -------------------------------------------------------------------- 191
Table 4.11: Change in investor preference at the increased saving level:
Paired t test results ------------------------------------------------------ 193
Table 4.12: Investor‟s expectation about investment features of Mutual
fund ----------------------------------------------------------------------- 202
Table 4.13: Investors perception towards problems in Mutual fund
investment --------------------------------------------------------------- 205
Table 4.14: KMO and Bartlett's Test of Sphericity------------------------------- 206
Table 4.15: Total Variance Explained ---------------------------------------------- 207
Table 4.16: Key factors affecting selection of mutual fund products ---------- 208
Table 4.17: Tests of Equality of Group Means- With factor scoring ---------- 240
Table 4.18: Eigen values - With factor scoring ----------------------------------- 241
Table 4.19: Functions at Group Centroids - With factor scoring --------------- 241
Table 4.20: Wilks' Lambda - With factor scoring -------------------------------- 242
Table 4.21: Standardized Canonical Discriminant Function Coefficients -
With factor scoring ----------------------------------------------------- 243
Table 4.22: Structure Matrix- With factor scoring ------------------------------- 243
Table 4.23: Classification Results a, c - With factor scoring ------------------- 244

List of Figures
Fig. 3.1: The graph indicates the growth of AUM over the years in
India -------------------------------------------------------------------------- 108
Fig. 3.2: Mutual fund schemes as on 31-March 2015 ----------------------------- 72
Fig. 3.3: AUM by Geography - Consolidated data for MF Industry-
AMFI ------------------------------------------------------------------------- 110
Fig. 3.4: Composition of AAUM in Kerala as on November 2015 ------------ 114
Fig. 3.5: Unit holding pattern of all mutual funds as on March 31, 2015 ---------- 80
Fig. 3.6: Private and public Sector Sponsored Mutual Funds, investor
participation and resource mobilisation-2014-15 ---------------------- 111
Fig. 3.7: Preference of Mutual funds ----------------------------------------------- 221
Fig.3.8: Preference of Mutual fund schemes ------------------------------------- 222
Fig. 4.1: Average Banking &Insurance product in crores & Total
No.Of AMC Branches in Kerala ----------------------------------------- 128
Fig. 4.2: AUM by Geography - Consolidated data for MF Industry ----------- 129
Fig. 4.3: Preference of Investment by investors in Kerala ---------------------- 177
Fig. 4.4: Relationship of Investor Category and Preference of
Investment ------------------------------------------------------------------- 178
Fig. 4.5: Change investor preference under the condition of increased
savings ----------------------------------------------------------------------- 192

Abbreviations
AAUM Average Asset Under Management
ACE AMFI's Code of Ethics
AGNI AMFI's Guidelines and Norms for Intermediaries
AMC Asset Management Company
AMFI Association of Mutual Funds in India
ARN AMFI Registration Number
ASBA Application Supported by Blocked Amount
AUM Asset under Management
CAGR Compounded Annual Growth Rate
CII Confederation of Indian Industry
CRM Customer Relationship Management
CSE Cochin Stock Exchange
DP Depository Participant
ECS Electronic Clearing Service
ELSS Equity Linked Savings Scheme
ETF Exchange Traded Funds
FCNR Foreign Currency Non-Resident account
FEMA Foreign Exchange Management Act, 1999
FII Foreign Institutional Investor
FIRC Foreign Inward Remittance Certificate
FMCG Fast Moving Consumer Goods
FMP Fixed Maturity Plan
FOF Fund of Funds
FPI(s) Foreign Portfolio Investor(s)
GDP Gross Domestic Product
GIC General Insurance Corporation
GSDP Gross State Domestic Product
HNI High Net worth Investors
HUF Hindu Undivided Family
IDFs Infrastructure Debt Funds
IFA Independent Financial Advisor
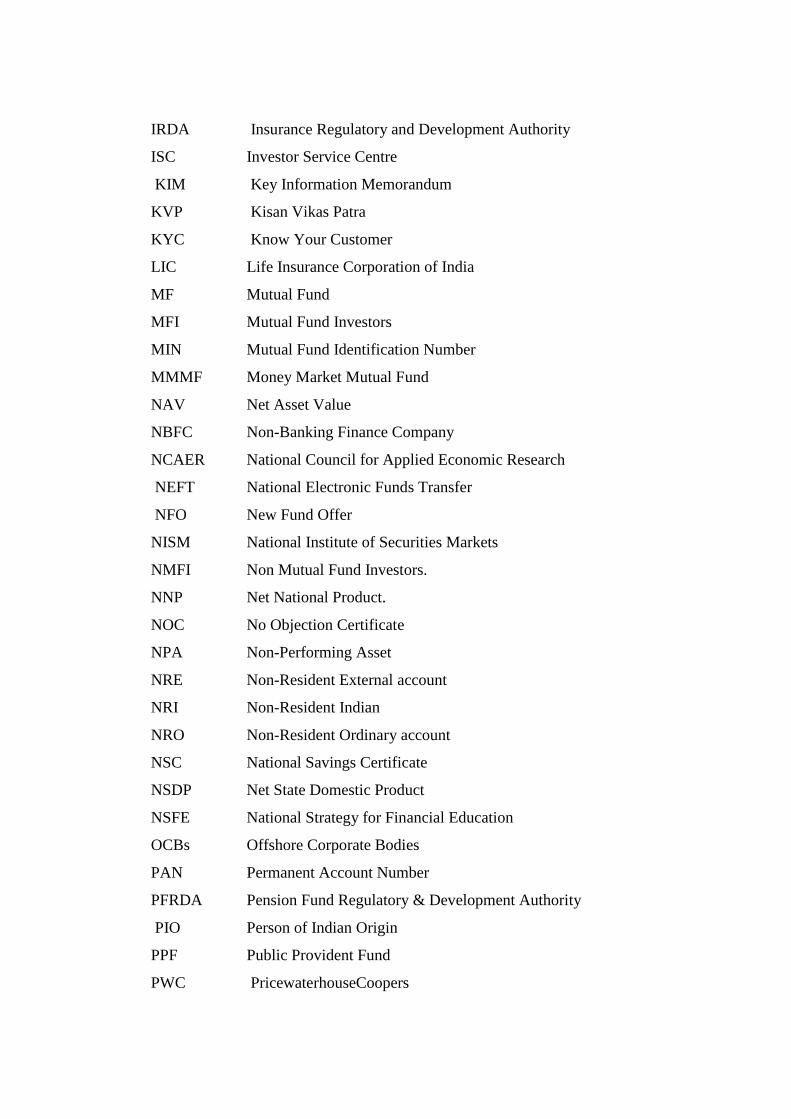
IRDA Insurance Regulatory and Development Authority
ISC Investor Service Centre
KIM Key Information Memorandum
KVP Kisan Vikas Patra
KYC Know Your Customer
LIC Life Insurance Corporation of India
MF Mutual Fund
MFI Mutual Fund Investors
MIN Mutual Fund Identification Number
MMMF Money Market Mutual Fund
NAV Net Asset Value
NBFC Non-Banking Finance Company
NCAER National Council for Applied Economic Research
NEFT National Electronic Funds Transfer
NFO New Fund Offer
NISM National Institute of Securities Markets
NMFI Non Mutual Fund Investors.
NNP Net National Product.
NOC No Objection Certificate
NPA Non-Performing Asset
NRE Non-Resident External account
NRI Non-Resident Indian
NRO Non-Resident Ordinary account
NSC National Savings Certificate
NSDP Net State Domestic Product
NSFE National Strategy for Financial Education
OCBs Offshore Corporate Bodies
PAN Permanent Account Number
PFRDA Pension Fund Regulatory & Development Authority
PIO Person of Indian Origin
PPF Public Provident Fund
PWC PricewaterhouseCoopers
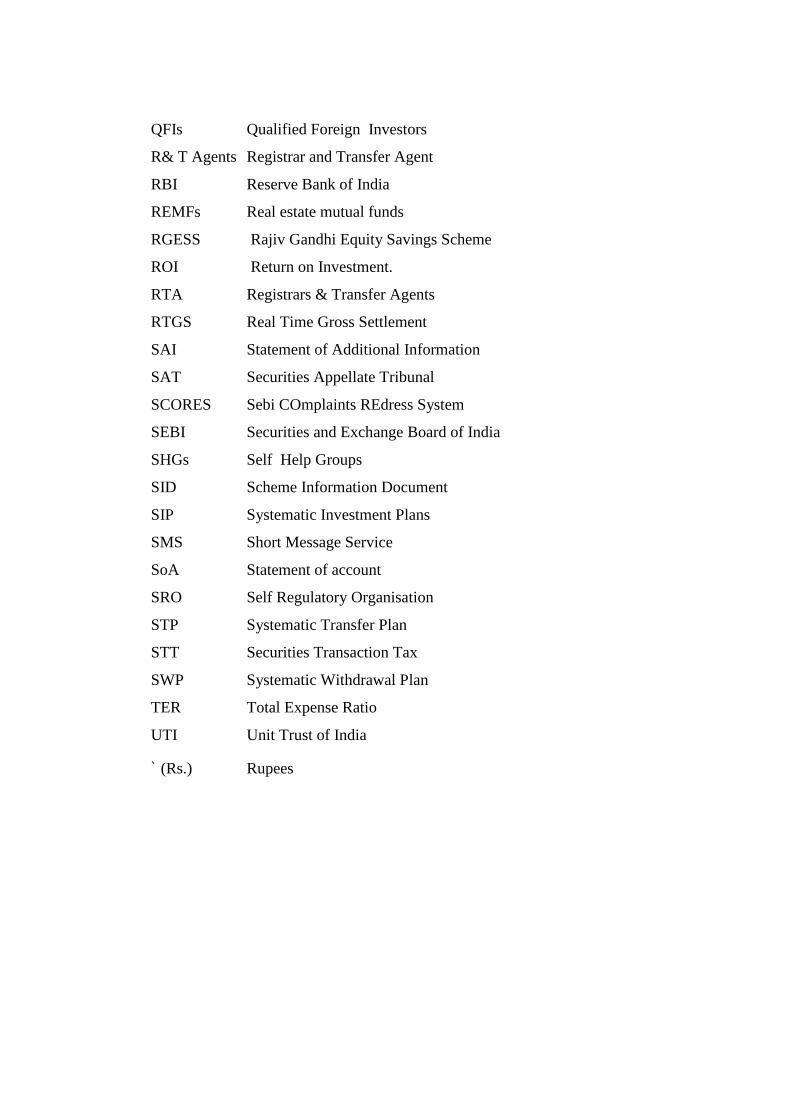
QFIs Qualified Foreign Investors
R& T Agents Registrar and Transfer Agent
RBI Reserve Bank of India
REMFs Real estate mutual funds
RGESS Rajiv Gandhi Equity Savings Scheme
ROI Return on Investment.
RTA Registrars & Transfer Agents
RTGS Real Time Gross Settlement
SAI Statement of Additional Information
SAT Securities Appellate Tribunal
SCORES Sebi COmplaints REdress System
SEBI Securities and Exchange Board of India
SHGs Self Help Groups
SID Scheme Information Document
SIP Systematic Investment Plans
SMS Short Message Service
SoA Statement of account
SRO Self Regulatory Organisation
STP Systematic Transfer Plan
STT Securities Transaction Tax
SWP Systematic Withdrawal Plan
TER Total Expense Ratio
UTI Unit Trust of India
` (Rs.) Rupees
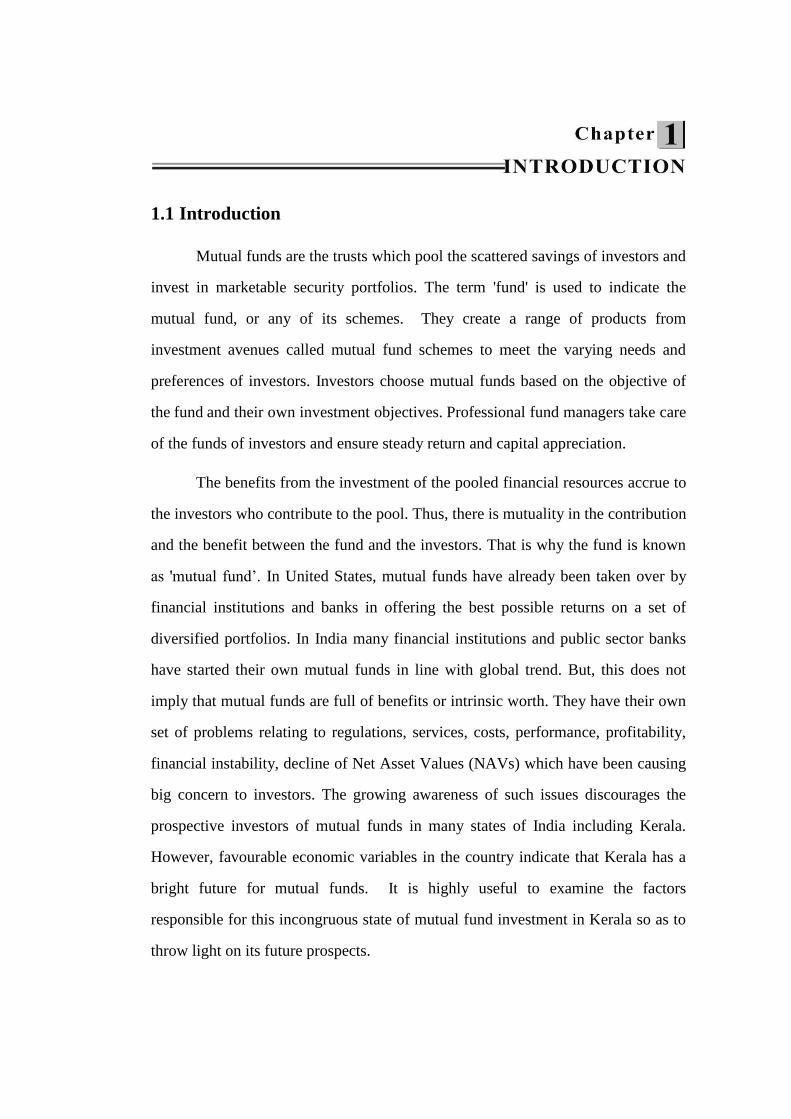
1.1 Introduction
Mutual funds are the trusts which pool the scattered savings of investors and
invest in marketable security portfolios. The term 'fund' is used to indicate the
mutual fund, or any of its schemes. They create a range of products from
investment avenues called mutual fund schemes to meet the varying needs and
preferences of investors. Investors choose mutual funds based on the objective of
the fund and their own investment objectives. Professional fund managers take care
of the funds of investors and ensure steady return and capital appreciation.
The benefits from the investment of the pooled financial resources accrue to
the investors who contribute to the pool. Thus, there is mutuality in the contribution
and the benefit between the fund and the investors. That is why the fund is known
as 'mutual fund‟. In United States, mutual funds have already been taken over by
financial institutions and banks in offering the best possible returns on a set of
diversified portfolios. In India many financial institutions and public sector banks
have started their own mutual funds in line with global trend. But, this does not
imply that mutual funds are full of benefits or intrinsic worth. They have their own
set of problems relating to regulations, services, costs, performance, profitability,
financial instability, decline of Net Asset Values (NAVs) which have been causing
big concern to investors. The growing awareness of such issues discourages the
prospective investors of mutual funds in many states of India including Kerala.
However, favourable economic variables in the country indicate that Kerala has a
bright future for mutual funds. It is highly useful to examine the factors
responsible for this incongruous state of mutual fund investment in Kerala so as to
throw light on its future prospects.

1.2 Statement of the Problem
A mutual fund, in its rudimentary conceptualisation, is a collection of stocks
and/or bonds, where an investor holds a unit, which represents a part of the fund
holding thereof. A proportionate sharing of income earned through such investors and
capital appreciations witnessed by the schemes are duly carried out. It must, however,
be mentioned that this proportional sharing by the unit holders is governed by the
number of units owned by them. Mutual fund is, therefore, the most suitable
investment option available to a common man as it provides an opportunity to invest in
a diversified, yet professionally managed portfolio. Mutual funds act as a gateway to
invest in big companies to an ordinary investor with his small investment.
Mutual funds offer benefits such as diversification, access to equity and debt
markets at low transaction costs, liquidity etc. to the investors. Given these
benefits, one would imagine that Indian households, characterized with gross
domestic savings close to 28 per cent of the total GDP, one of the highest in the
world, would congregate to invest their savings in mutual funds. Moreover mutual
fund industry needs to get healthy participation from all states of the country.
However, while considering the data published by AMFI the geographical
distribution of assets under management (AUM) across cities in India is highly
skewed in favour of the top five cities (Mumbai, Delhi, Chennai, Kolkata and
Bangalore) which contribute over 70 per cent of the entire AUM in the country.
The remaining 30 per cent is shared by the rest of the country.
The AUM/GDP ratio is the best indicator of the portion of income in a
given state or district is being invested in mutual funds (SEBI, 2014).On looking at
the investment conditions in India as a whole, the AUM/GDP ratio stand at 7 per
cent while that of Kerala it is only at 3 per cent (AMFI,2015).Being a state with
higher literacy rate of 93.91 per cent (Economic review,2012),the state expects to
create a good investment culture among the people .However, relatively large

deviation from the national average in AUM /GDP ratio signals the importance of
many questions to answer :Why the investors of Kerala are showing less interest in
mutual fund investment? What are the factors affecting the investment behaviour of
Keralites? What are the problems faced by mutual fund investors in Kerala? Do the
market regulators take appropriate measures to market the mutual fund products
among investors? Since there is no prior study investigating these issues are
available, particularly in the context of Kerala the present study makes a serious
attempt to probe into these issues in detail.
1.3 Significance of the study
The Indian mutual fund industry has developed rapidly over the past ten
years. The industry achieved a high AUM from Rs. 3.6 trillion in 2007 to Rs. 6.13
trillion in 2010, with an impressive growth rate of 16.2 per cent per year. From an
average GDP growth rate of 8 to 9 per cent during the period from 2008 to 2011, the
Indian economy is now growing at 7.4 percent in 2014-1 15(Annual report, 2015).
Economic growth of a country is closely associated with its domestic
savings (Jangili, 2011) .No country can grow without having sound capital base
supplied with its domestic savings and investment. The nature and rate of savings
in an economy implies the rate of economic growth. Mutual fund investment
schemes contribute good channel for profitable investments to households. So a
study analysing the mutual fund markets definitely help investors including
household investors to know more about the benefits of the schemes and motivate
them to park their savings with the fund investments. This can lead economic
growth through capital formation and financial market stability.
Financial markets are exposed to fast change in the modern globalised
world. More innovative products, but with complex features, are emerging into the
market and the investment of which demand sound knowledge base and good
analytical skills. Normally it is beyond the reach of investors to gain mastery over

investment science while optimising their investment function. Mutual funds are
the creations of professional investment managers who have substantive knowledge
in investment finance. Through this study ,both actual and potential investors can
make out the various attributes of mutual fund schemes in terms of its risk, return
and fund management efficiency that enable them to reap the benefits of
professional investments with minimal complexity.
Professional investment managers can understand the general investor
preferences and behaviour of Keralites. They can also identify the prime forces that
restraining the investors of the state to be part of the mutual fund market .The
information on both of these shall enable them to design fund scheme that has a
perfect match with the investor expectations.
Policy makers of the country can grab useful insights on the problems of
mutual fund investments from the perspective of investors in terms of the fund
quality, fund distribution and fund performance. This may provide valid inputs for
them to draft apposite policy framework conducive for the growth of mutual fund
market in the state.
1.4 Scope of the Study
The study emphasises the problems and prospects of Mutual fund
investment with respect to Keralites. The study covers both rural and urban
counterparts. The research primarily aims at tracking investors‟ preferences and
priorities of different investment avenues and identifying the key features of a
mutual fund. Such information helps to design a new mutual fund product or
redesign the existing schemes suitable for the financial market conditions of the
economy. Besides the factors identified, the study provides key information inputs
regarding problems of mutual fund investment and the expectations of investors in
deciding marketing mix variables that guide the fund managers in designing
profitable investment schemes in future for the Indian market.

1.5 Objectives of the Study
The clear definition of the research problem precincts its objectives as follows.
1. To identify the public and private sector institutional participation in
Mutual fund.
2. To examine the regulatory mechanism of Mutual fund.
3. To study the extent of responsibility on the part of Mutual fund financial
institutions in the reduction of investor grievances.
4. To assess the investor behaviour and mutual help of investors and experts in
Mutual Fund Investment.
5. To evaluate the service provided by Mutual fund financial institutions in
Kerala.
1.6 Operational Definitions
The variables, terms of specific measurement and testing criteria used in this
study defined as follows.
♦Asset Management Company
Asset Management Company (AMC) is the asset manager of the mutual
fund and is responsible for running the day to day operations of the mutual fund.
The AMC is appointed by the trustees in consultation with the sponsor of the fund
and with the approval of SEBI.
♦Assets Under Management (AUM)
Assets of a mutual fund refer to the market value of the securities held in the
portfolio. There may be few receivables and accrued income, which are current
assets. These are added to the portfolio value to get the total Assets Under

Management (AUM) of the fund, its average for a period is known as Average
Asset Under Management (AAUM).
♦ Centroids
It is the mean discriminant score of members in the group. It used for
designing a decision rule to classify an investor into MFI/NMFI category.
♦Discriminant coefficient
It is similar to regression coefficient, reflects the relative contribution of
each of the predictor variable on the discriminant function. A small value of the
discriminant coefficient means that the impact of a unit change in a predictor
variable is small in the discriminant function score.
♦Fund Manager
Fund Manager is the person who handles the money of the investors. He is
concerned with decision regarding the investments, protection of value of the
original investments and generation of a steady return on the original investment.
♦Intermediaries
All persons or entities concerned in selling and distribution of mutual fund
products including inter alia brokers, consultants, sub-brokers, financial advisors,
channel partners, sole proprietor firms, partnership firms, companies or called by
any other name, but shall not consist of collection centers, where there is no
element of advice, and it is only a counter for issuing forms and collecting
completed applications.
♦Investor Categories
Investor Categories or Investor type is referred to as an individual or retail
investor who has currently invested in any investment products. It includes Mutual
fund Investor and Non Mutual Fund Investor. An investor whose name appears in

the portfolio records of different mutual funds is Mutual fund Investors‟ (MFIs); all
other investors are Non Mutual fund Investors‟ (NMFIs).
♦Investment Features.
Investment features include Safety, Liquidity, Return, Tax Savings, Govt.
Regulation and Innovative Services. Among these safety, liquidity, return, tax
savings are grouped into investor objectives. Government Regulation and
contemporary services are grouped into investor requirements.
♦Investment Risk
Risk refers to the volatility of portfolio‟s value. Protection from volatility of
portfolio‟s value or risk is Safety. Risk perception of the investors towards the
mutual fund products is one of the factors to be analysed for studying the level of
risk aversion.
♦Net Asset Value
Net assets of a fund refer to the market value of the portfolio, plus accrued
incomes, less current liabilities and accrued expenses.Net Asset Value (NAV) is the
value per unit at current market prices computed as net assets divided by units
outstanding. Net Asset Value indicates the intrinsic worth of a scheme.
1.7 Hypotheses
The major hypotheses for the study include
1. Private sector Mutual Funds help to satisfy the investment needs of Mutual
fund investors than Public sector Mutual funds.
2. Stringent regulatory frame work restricts the volume of Mutual Fund
Investment.
3.The greater the reduction of investors grievance by Mutual Fund institution
the lower the mutual fund investment.
4. Investors in Kerala are showing diverging behaviour in terms of their mutual
help of investors and experts in Mutual Fund Investment.
5.There is no relationship between after investment service provided by Mutual
Fund companies and investment in Mutual funds.
1.8 Research Design
The research design for the study is basically descriptive in nature but the
objective of the study is to explore and obtain clarity about the problem situation
and factors influencing the prospects of mutual fund investment. Here, the study
makes use of discriminant model for deciphering sustainable marketing mix
variables in the design and distribution of a new mutual fund product.
1.8.1 Source of Data
The study is based on primary as well as secondary data. Data collection
process was made in two different stages. In the first stage, a review of literature
was undertaken so as to acquaint with the various aspects of the study to formulate
the conceptual framework for the research. In the second stage, primary data were
collected with the help of a pre-tested and structured questionnaire that was
finalised after a pilot study. The model of the questionnaire is given in Appendix.
Web sites of RBI, SEBI and AMFI constitute the prime secondary data
sources. Many published and unpublished reports, text books, periodicals, journals,
seminar proceedings, government publications and commission reports were also
used for hypothesis designing, sampling consideration and for validating the
information collected through primary source.
1.8.2 Survey Instrument
After discussion with officials of AMCs, stock broking firms, agents and
distributors of MF products and experts in this field, a structured and quantifiable
questionnaire was developed. The questionnaire consists of three parts. First part
comprises of questions related to demographic features and saving/investment
avenue preferences of investors. The second part of the instrument deals with
questions for assessing the problems and prospects of mutual fund investment from
the perspectives of Investors, and the last part consists of questions related to
selection of mutual funds by the Mutual fund investors.
1.8.3 Survey Area
The present study focuses on the investors residing at Kerala. Kerala is a
small state in India blessed with good climate and abundant natural resources. For
the purpose of study Kerala grouped into three regions, it includes, Northern region
(Kasargode, Kannur, Kozhikode, Wayanad, Malappuram) Central region
(Palakkad, Thrissur, Ernakulam, Idukki,) Southern region (Alappuzha, Kottayam
Pathanamthitta, Kollam, Thiruvanathapuram). Central region is the main centers
for mutual fund business in Kerala since they have highest AUM(AMFI,2015).
The study was conducted across Central region districts in Kerala.
1.8.4 Measurement of Variables
The concepts and constructs of this study converted into empirically testable
and observable variables. It includes dichotomous, categorical, continuous and
other indefinite set variables.
♦ Saving and investment avenue preferences
For measuring the Preference of Investment Avenue by investors in Kerala,
multiple responses was used, the researcher has considered ten investment
alternatives which have been measured by marking top three investment options by
investor preference on investment with current saving and that with increase in
saving. For knowing priorities‟ the investor‟s preferences ranking and rating
methodology were followed.
♦ Perception towards Investment Avenues
The analysis of perception towards investment avenues are measured in
terms of the investors‟ priority of investment features. Ranking and rating
methodology was followed to prioritize the investor‟s preferences.
♦ Risk Perception for Mutual Funds
Risk perception has been measured on a 5 point scale ranging from low risk
„1‟ to high risk „5‟.
♦ Perception towards Mutual fund investment
In order to measure the investor‟s perception towards Mutual fund
investment, six investment features, such as safety, liquidity, return, tax saving,
Govt. regulation and service are considered and these variables were measured on a
five point Likert-type scale ranging from „least requirement‟ to „most requirement‟.
♦ Problems of Investors
In order to measure the problems of investors regarding the mutual fund
investment 15 variables were considered and these variables were measured through
five point Likert-type scales ranging „least considered‟ to „most considered‟.
♦ Mutual fund selection parameters
In order to measure the investment decision parameters for selecting Mutual
fund Investment four factors were considered and these factors were measured by
marking appropriate decision option for mutual fund investment.
♦ Mutual Fund services

For measuring the Mutual Fund services, considered by the investor while
selecting mutual fund products, four variables of mutual fund service were taken
into consideration and these items were measured through five point Likert-type
scale ranging from „least considered‟ to „most considered‟.
♦ Prospective features in Mutual Fund Investment
The prospective features in mutual fund investment have measured with
fifteen variables of investors‟ expectations in mutual fund investment and these
items were measured through a five point Likert-type scale ranging from „least
considered‟ to „most considered‟.
♦ Prospects of mutual fund investment
For measuring the prospects of mutual fund investment in Kerala four
factors of investors‟ expectations in mutual fund investment (through factor
analysis) were taken into consideration. Discriminant analysis is used to estimate
the per cent of investors correctly classified as Mutual Fund Investor/Non Mutual
Fund Investor (to predict group membership), to find out the predictor variables are
relatively better in discriminating between Mutual Fund Investor/Non Mutual Fund
Investor, to classify a investor into one of the two groups by building a decision
rule and cut-off score.
1.9 Sampling Design
It includes the process of selecting sample of investors from the population
of investors.
♦ Population for the Study
Individual investors in Kerala form the universe or population for the study.
In this study particularly for analysing the prospects of mutual fund investment in
Kerala, the opinion of both mutual fund investors and non mutual fund investors
are highly essential. Accordingly the population has two parts in this research.
As per the data collection plan, primary data were collected from the
individual Mutual fund investors living in Kerala and invested in mutual fund
schemes. As on March-2010 there are nearest 19 Lakh Mutual Fund investors folio
with 27 AMC‟s in Kerala (AMFI, 2010).According to the data Compiled from the
records of SEBI and AMFI). The unit holding pattern of all mutual funds in India
stood at 4,63,27,683 folios by the end of March 2010 among these, 4.1per cent
folios from Kerala which constitute 18,99,435 folios (Table 1.1).
As per the data collection plan of the researcher, primary data were
collected from the individual Mutual fund investors living in central region of
Kerala and invested in mutual fund schemes. The investors in central region of
Kerala who have so far not invested in mutual funds provide the universe for
NMFI.
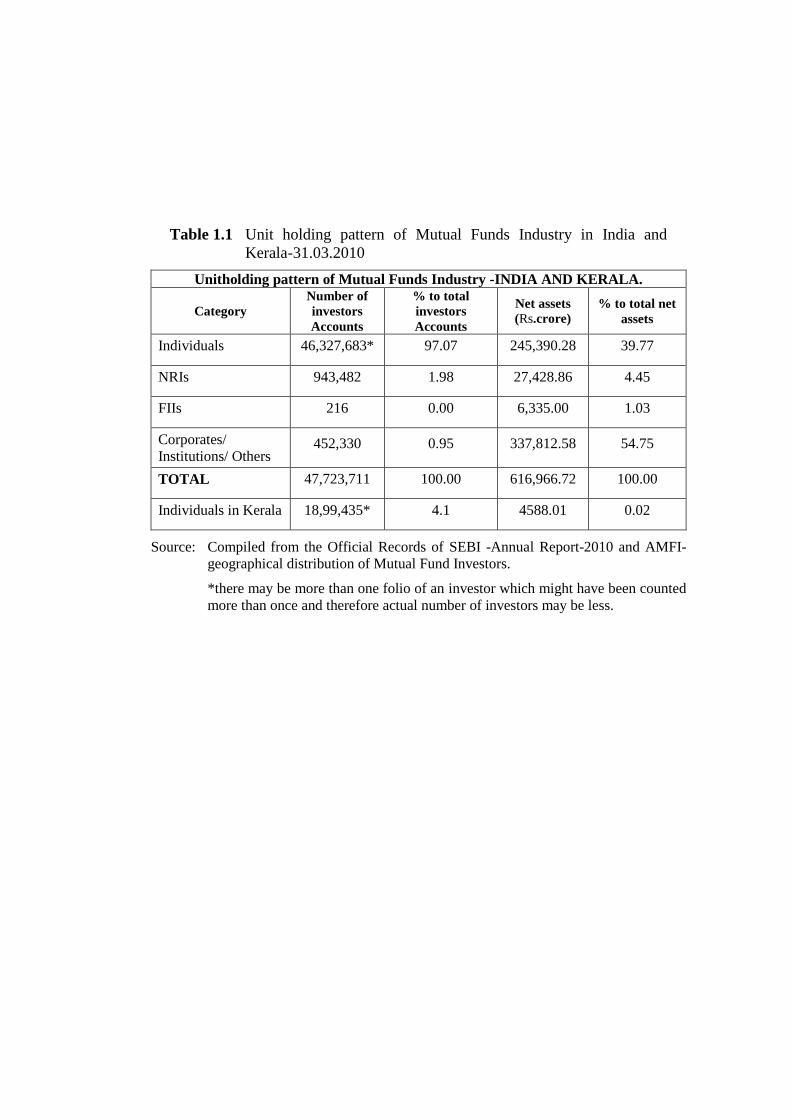
Table 1.1 Unit holding pattern of Mutual Funds Industry in India and
Kerala-31.03.2010
Unitholding pattern of Mutual Funds Industry -INDIA AND KERALA.
Category
Number of
investors
Accounts
% to total
investors
Accounts
Net assets (Rs.crore)
% to total net
assets
Individuals 46,327,683* 97.07 245,390.28 39.77
NRIs 943,482 1.98 27,428.86 4.45
FIIs 216 0.00 6,335.00 1.03
Corporates/
Institutions/ Others 452,330 0.95 337,812.58 54.75
TOTAL 47,723,711 100.00 616,966.72 100.00
Individuals in Kerala 18,99,435* 4.1 4588.01 0.02
Source: Compiled from the Official Records of SEBI -Annual Report-2010 and AMFI-
geographical distribution of Mutual Fund Investors.
*there may be more than one folio of an investor which might have been counted
more than once and therefore actual number of investors may be less.

The entire population (universe-18, 99,435 folios and approximately 19 lakh
Mutual fund investors) is divided into strata (grouped into three regions) which are
mutually exclusive and collectively exhaustive. Northern region (Kasargode,
Kannur, Kozhikode, Wayanad, Malappuram) Central region (Palakkad, Thrissur,
Ernakulam, Idukki and Southern region (Alappuzha, Kollam, Kottayam,
Pathanamthitta, Thiruvanathapuram).
The investors in Kerala who have so far not invested in mutual funds
provide the universe for NMFI. Financial advisors from the central region (from
four districts) include 230 ARN holder‟s (Table 1.2). They provide a list of NMFI
which might be the prospective investors in Mutual Fund investment from their
district.
♦Sample size
Since the investor populations in Kerala are quite large, the study
determined the sample size of Investors using the approach of Cochran (1963). The
equation used for this purpose is:
Where, n is the sample size, Z2
is the abscissa of the normal curve that cuts
off an area α at the tails (1 - α equals the desired confidence level), e is the desired
level of precision, p is the estimated proportion of an attribute that is present in the
population, and q is 1-p. The value for Z is found in statistical tables which contain
the area under the normal curve.
In this study, assuming p=0.5 (maximum variability under normal
distribution with 95 per cent confidence level and ±5 per cent precision. The
resulting sample size is 385, i.e.

= 385
The study rounded off this figure to 400. Accordingly 200 MFIs and 200
NMFIs were selected.
♦ Sample Frame and Selection of Sample units
The population of 19 lakh Mutual fund investors have their accounts (folio)
in 27 AMC‟s in Kerala, these AMC have 58 branches all over Kerala (AMFI,
2010).The size of sample in each region is proportional to the number of AMC
branches in each region. In central region 24 AMC branches and 230 ARN holders.

Source:Compiled from the official records of AMFI*No of AMC Branches
Financial advisors with ARN Holders in Kerala as on 31March 2015.
Sample Frame
S.No. Region District
MFI NMFI
Total sample size of
Investors
AMC Branches
% Sample size-MFI
Total no of Financial advisors with ARN Holders
% Sample size NMFI
1
CENTRAL
Palakkad 2 8.33 17 29 12.61 25 42
2 Thrissur 7 29.17 58 65 28.26 57 115
3 Ernakulum 15 62.50 125 112 48.70 97 222
4 Idukki 0 0.00 0 3 1.30 3 3
Total 24 100 200 230 100.00 200 400

The final sampling units of 200 MFIs were selected from the list provided
by AMCs‟ and was based on judgment sampling method. The active involvement
of fund investors measured in terms of frequency of investment, amount of
investment and number of schemes they held provide the basis for judgment in
sample selection.
For a comprehensive analysis of the problems and prospects related to
mutual fund in Kerala a sample of 200 Non Mutual Fund Investors (NMFI) were
also selected. Financial advisors from the three regions include 520 ARN Holder's.
The size of sample in central region is proportional to the number of financial
advisors in the region. At first advisors are selected on simple random basis from
the list of ARN holders (central region) in the AMFI website. The selected ARN
holders has provided a list of 2002 investors who have not so far preferred mutual
funds as the destination point of their investment .To ensure parity in comparison
200 NMFI were selected on systematic random basis .For this purpose the study fix
10 (2002/200) as the sampling interval. From the numbers included in the interval,
six has randomly chosen, thereafter every 6th
investor in the list provided has been
selected as the final sample unit of NMFI for the study and the procedure has
completed the selection of 200 NMFIs. Thus the total sample size for the study
became 400 investors: 200 MFIs and 200 NMFIs.
1.10 Period of Reference
Data required from the investors is very sensitive and indicative in nature as it
comprises of the information regarding their savings and investments. Most of the
investors are hesitant and unsecure in providing this kind of data on mails and phone
calls. Hence, only possible way was self administered questionnaire. The survey was
conducted during the period of 2013 January to 2014 March. Secondary data collected
for the study were relating Mutual funds from 1964 to 2013-14.However, a longer
duration and latest improvements has also been considered wherever necessary.

1.11 Tools of Analysis
The researcher has administrated rigorous statistical procedure for drawing useful
inference from the collected data. The selection of the statistical design was based on
both the objective pursued and the nature of the data used. The analytical methodology
covered wide range of statistical tools of parametric or non parametric nature.
Chi square analysis as a test of association of attributes has been extensively
used in this study. Association of attributes like demographic features, investor
preferences and that of investor category with perception towards investment
features, the level of risk perception and decision parameters for mutual fund
investment were examined using Chi square analysis.
Independent sample t test verified the statistical significance of differences
in mean perception score of MFIs and NMFIs towards various aspects of their
investment programmes. Paired occurred t test examined whether there was any
significant changes in investor preference at the increased savings levels.
Exploratory factor analysis was employed to reduce the number of
variables/statements representing various problems of mutual fund investments into
specific number of factors explaining the related problems. Such procedure can
simplify the inference process; similarly the same methodology was adopted to
identify the prospective features of mutual fund investment. Again using the same
factor loading canonical discriminant analysis predict the investment features in the
order of their priority which possibly included in the mutual fund innovation in
future for canvassing more number of investors from NMFI group to MFI group.
1.12 Limitations of the Study
The present study is subject to the following limitations.
1. Some of the respondents are not ready to disclose their full investment
details.
2. The study is based on primary data; hence personal bias of the respondents
might have affected the results of the study.
3. The finding and implementation of the study are limited to 800 selected
investors in Kerala.
1.13 Chapter Framework
In order to present the research report in a perfect and easily understandable
manner, it is classified into seven chapters.
The Chapter -1: INTRODUCTION -This chapter focuses on the introduction,
statement of the problem, significance of the study, scope of the study, objectives
of the study, operational definition, hypotheses, research design, sampling design,
reference period, primary data collection, tools of analysis, limitations and chapter
frame work.
Chapter 2: REVIEW OF LITERATURE- In this chapter, an effort is made to
review the available literature. It specifically reviewed the saving and investment,
laws, regulations, literacy and marketing, analysis of financial intermediation, fund
performance and investor behaviour. It helps to identify the research gap in the
field of mutual fund.
Chapter 3: MUTUAL FUNDS AND REGULATION IN INDIA: The third
chapter gives an overview of Trends in Resource Mobilisation by Private
and public Sector Mutual Funds in India. State Wise Penetration of Mutual
Fund , Mutual Fund investors , Preferences of Kerala Investors in
Mutual Funds and schemes, Investor protection and regulatory
mechanism of Mutual fund, regulatory developments, Investor Grievances
and Redressal.
Chapter 4: Problems And Prospects Of Mutual Fund Investments In Kerala.
: This chapter deals with geographic, demographic and economic factors in
Kerala,Investors in Kerala, , behaviour of individual investors includes preference
and perception towards investment avenues of Keralites. It also analyses the
problems of quality and performance of Mutual fund investment, decision
parameters for selecting mutual fund investment in Kerala. This chapter finally
reports the statistical procedures adopted for analysing the prospects of MF
investment, investors‟ expectations, prospective features in mutual fund investment
and factors influencing the prospects of mutual fund investment. It is also devoted
to discriminant model for deciphering sustainable marketing mix variables in the
design of a new mutual fund product.
Chapter 5: SUMMARY, FINDINGS AND SUGGESTIONS- The last chapter
presents the major findings of the study, summary of findings and implications,
suggestions and recommendations, conclusion and scope for future research in the
field.
References
1. AMFI (2010) Geographical distribution of Mutual Fund Investors.
Geographical distribution of Mutual Fund Investors and Compiled from the
records of AMCs.
2. AMFI (2015) Industry Trends, https://www.amfiindia.com/Themes/
Theme1/ downloads/home/ industry-trends-may-2015.pdf, http://www. amfiindia.
com/research-information/aum-data/classified-average-aum-31/3/2015
3. Annual Report (2014-15) Ministry of finance (budget division- Advance
Estimates) Govt.of India: Page V.
4. Cochran, W. G. (1963). Sampling Techniques, 2nd Ed., New York: John
Wiley and Sons, Inc.

5. Economic Review (2012) State Planning Board,Thiruvanathapuram, Kerala,
India.
6. Jangili Ramesh (2011) Causal Relationship between Saving, Investment
and Economic Growth for India – What does the Relation Imply? - Reserve
Bank of India Occasional Papers, Vol. 32(1), pp25-39.
7. SEBI (2014) Development Research Group Studies 2013 - 14, Securities
and Exchange Board of India: p66.
………….………….

2.1 Introduction
The Indian mutual fund industry has developed rapidly over the past 10
years. Although a large number of studies have been carried out on the growth and
financial performance of mutual funds in India, not much light has been shed on
the causes for the low penetration of mutual funds in Kerala. The earlier studies
paid more focus to performance measures, structure of fund, fund characteristics,
managerial skills and behavioural patterns over time. The existing studies are very
few and very little information is available about investor perceptions towards the
problems and prospects of a mutual fund in Kerala. The following studies justify
the relevance and importance this study and helps to identify the variables for the
problems and prospects of a mutual fund investment in Kerala.
Nalini (1996) pointed that, mutual funds create awareness among urban and
rural middle class people about the benefits of investment in capital market,
through profitable and safe avenues. Mutual fund could be able to make up a large
amount of the surplus funds by making people invest these funds.
Ramamurthy and Reddy (2005) conducted a study to evaluate recent trends
in the mutual fund industry and draw a conclusion that the main beneficiaries will
be the small investors “due to efficient management, diversification of investment,
easy administration, nice return potential, liquidity, transparency, flexibility,
affordability, wide range of choices and a proper regulation governed by SEBI”.
Mohanty (2006) analyzed the weakness of mutual funds. They are non
availability of tailor-made schemes; no guarantee of returns, no control over costs,
problem of managing large corpus, volatility of return depends on market
conditions, which is subject to frequent market volatility. Market mutual funds

scheme is for short period where return is not profitable and the instruments are
lesser in number.
Surjit (2006) analysed the relationship between investors and mutual funds.
Investors have started believing in mutual funds to manage their hard- earned money.
Mutual funds are those institutions that can give maximum satisfaction to their
investors by diversifying the portfolio. The mutual funds are becoming popular among
the people who are more risk-averse than pure equity investors. Carefully managed
mutual funds can ensure optimum returns even during turbulent times in the market
and that makes the mutual fund a good choice among the retail investors. Due to the
reduction in the bank interest rates and high degree of volatility in the Indian stock
market, investors are looking for an alternative for their small time investment which
can provide them a higher return and also safety to their investments.
Ahmed and Ahuja (2006) evaluated the cause and effect relationship
between mutual fund investment decision and fund family, fund size, type of fund,
type of portfolio and schemes, risk involved of the fund manager, past performance
of the fund, liquidity factors and current market conditions.
Sasaki and Rathiha (2008) pointed out that the different variables which
influence to invest on mutual funds are safety, liquidity, stability, speculative
values, diversification and low cost. Through the study the researcher found that,
the most important factors leading to mutual fund investments are risk freeness ,
income, savings and cost.
Thompson and Choi (2001) examined the role of laws governing investor
protection, transparency of reporting, Insider trading, Taxation, the quality of
enforcement of the laws, potential conflicts of interest between the fund and the
fund investors and the ownership concentration across several countries and their
financial development.

Bhalla (2004) concluded that investors do not need to be familiar with the
characteristics of the different types of mutual funds. Many investors do not
understand what they are buying. With so many choices, investors risk making the
wrong ones. Besides investing in appropriate and high-cost mutual funds, investors
also buy laggards. There is no shortage of mediocre performers.
Singh and Chander (2004) analysed that, the perceptions about mutual
funds in the view of general investor feels that different regulatory bodies like
SEBI and others have not been able to regulate and control the working of mutual
funds so as to safeguard the small investors‟ interest.
Khorana et al. (2005) found that consistent with related findings from the
law and economics literature, the mutual fund industry is larger in countries with
strong rules, laws, and regulations, specifically where mutual fund investors‟ rights
are better protected. The industry is smaller in countries where barriers to entry are
higher, measured by the effort required to set up a new fund. The fund industry is
larger in countries with a wealthier and more educated population, and where the
industry itself is older. Finally, the fund industry is larger in countries in which
defined contribution pension plans are more prevalent. These results indicate that
laws and regulation, supply-side, and demand-side factors simultaneously affect the
size of the mutual fund industry.
Chander and Singh (2006) studied the preference of investors, the study
revealed that, investor‟s decision to invest in a particular mutual fund is affected by
different sources from where information about working of that fund becomes
available to investor; they also opined that the occupation groups differ
significantly in their perception about the returns received from the mutual fund.
Muller and Weber (2010) investigated the consequences of financial literacy
in the context of mutual fund investments. They found that the level of financial
literacy is not related to the performance of the actively managed funds. In contrast,

overconfidence might prevent subjects from investing passively. A positive relation
was found between the belief of being better than average in identifying superior
investments and the likelihood of buying an active fund, thus confirming this
notion. Also, better-than-average thinking is positively correlated with financial
expertise.
Barber et al. (2005) argued that the purchase decisions of mutual fund
investors are influenced by salient, attention-grabbing information. Investors are
more sensitive to salient in-your-face fees, like front-end loads and commissions,
than operating expenses; they are likely to buy funds that attract their attention
through exceptional performance, marketing, or advertising. They found
consistently negative relations between fund flows and front-end load fees. A
negative relation between fund flows and commissions charged by brokerage firms
was also documented. In contrast, no relation (or a perverse positive relation) was
found between operating expenses and fund flows. Additional analyses indicate
that mutual fund marketing and advertising, the costs of which are often embedded
in a fund‟s operating expenses, account for this surprising result.
Gurunathan (2007) examined, the investors need protection from the various
malpractices and unfair practices made by the corporate and intermediaries. As the
individual investors‟ community and the investment avenues are on the rise, it is
interesting to know how the investors shall be protected through various
legislations. The present positive attitude of investors is heartening though investor
sentiments have been shaken by the various scandals.
Confederation of Indian Industry (2010) observed that Indian Mutual fund
Industry is incapacitated by loads, investor awareness, governance and risk
management, technology and low retail participations.

Grubber (1996) attempted to study the problem relating to the fast growth of
mutual funds in spite of lower performance of actively managed portfolios. The
study revealed that, mutual funds had negative performance compared to the
market and provided evidence of persistency of underperformance. Sophisticated
clients withdrew money from mutual funds during the period of low performance
whereas mutual funds found money from disadvantaged clientele leading to the
faster growth of funds.
Sondhi and Jain (2005) examined the performance of equity mutual funds
classified on the basis of public sector and private sector. The paper evaluated the
performance by comparing the returns to bench mark indices of Nifty and Sensex
and found that the returns generated by private sector and public sector mutual
funds are very inferior to market returns.
Bello (2005) matched a sample of socially responsible stock mutual funds
matched to randomly select conventional funds of similar net assets to investigate
differences in characteristics of assets held, degree of portfolio diversification and
variable effects of diversification on investment performance. The study found that
socially responsible funds do not differ significantly from conventional funds in
terms of any of these attributes. Moreover, the effect of diversification on
investment performance is not different between the two groups.
Selvaraj and Devi (2007) examined the performance of mutual funds, they
opined that “the performance of an actively managed fund largely depends on the
investment decisions of its manager. Statistically, for every investor who
outperforms the market, there is one who underperforms. Among those who
outperform their index before expenses, though, many end up underperforming
after expenses. Before expenses, a well-run index fund should have average
performance. By minimizing the impact of expenses, index funds should be able to
perform better than average”

Agarwal et al. (2009) examined the performance of hedge funds relative to
traditional mutual funds and found that trading strategies will improve the
performance of hedge funds. Gil-Bazo et al. (2009) have examined the market for
equity mutual funds and found that Funds with worse before-fee performance
charge higher fees and that better fund governance may bring fees more in line with
performance.
Gangadhar (1992) identified mutual funds as the prime vehicle for
mobilization of household sector‟s savings as it ensures the triple benefits of steady
return, capital appreciation and low risk. He identified that open-end funds were
very popular in India due to its size, economies of operations and for its liquidity.
Investors opted for mutual funds with the expectation of higher return for a given
risk, greater convenience and liquidity.
Rajan,R.V., (1997) highlighted the segmentation of investors on the basis
of their characteristics, investment size, and the relationship between stage in life
cycle of the investors and their investment.
Massa et al. (1999) identified a set of systematic factors that explain a
significant amount of the variation in flows. They examined common component to
mutual fund investor behaviour and tried to find out which asset classes may be
regarded as economic substitutes by the participants in the market for mutual fund
shares. They found that flows into equity funds, both domestic and international,
are negatively correlated to flows to money market funds and precious metals
funds. This suggests that investor rebalancing between cash and equity explains a
significant amount of trade in mutual fund shares. The negative correlation of
equities to metals suggests that this timing is not simply due to liquidity concerns,
but rather to sentiment about the equity premium. This paper also finds that the
factors derived from flows alone explain as much as 45 per cent of the cross-
sectional variation in mutual fund returns.
Walia and Kiran (2009) analysed mutual fund as an investment avenue is
preferred by those investors who don‟t want to take complete risk of capital market
volatility or those investors who want to rely on professional knowledge of mutual
funds AMCs. Survey results reveal the fact that very few investors rank mutual
funds as most preferred investment avenue and rank it at first position.
Basil (2013) the service quality is the dominant factor influencing fund
selection behaviour. The fund preference of mutual fund investors depends on their
time horizon and risk perception. Mutual fund investors in Kerala give more
preferences towards open-ended and growth oriented (equity funds) schemes.
Although research on mutual fund is quite extensive in India and
international context, the studies investigating the behavioural aspects of fund
investment are relatively scanty. Moreover, most of the research has selected
sample from the mutual fund investor group only for surveying their perception or
experience on different aspects of fund investment. No academic research in India,
particularly in Kerala has included the non mutual fund investor group in the
survey. While probing in to the reasons for their apprehensions or difference
towards the fund investment. Thus the present study proposes to carry out survey
among both MFI‟s and NMFI‟s for identifying the problems and prospects of
mutual fund investment in Kerala. With high literacy rate, larger per capita and
lower contribution to the mutual fund segment, Kerala definitely provide a good
representation of sample for studying the problems and prospects of mutual fund
investment.
………….………….

Chapter 3
MUTUAL FUNDS AND REGULATION IN INDIA
3.1 Introduction
Worldwide Net Assets shows United States have 15,852.34 USD Billions Total
Net Assets in 2014(Table-3.1). The mutual fund industry in India started in 1963 with
the formation of Unit Trust of India, at the initiative of the Government of India
and Reserve Bank of India. The Indian mutual fund industry is one of the fastest
growing sectors in the Indian capital and financial markets. The latest available
mutual fund data shows that the AUM has risen significantly, to Rs.19,94,985 crore
(USD 192 billion) by May 2015(AMFI,2015). With the bifurcation of the erstwhile
UTI which had in March 2000 more than Rs. 76,000 crores of assets under
management and with the setting up of a UTI Mutual Fund, conforming to the
SEBI Mutual Fund Regulations, and with recent mergers taking place among
different private sector funds, the mutual fund industry has entered its current phase
of consolidation and growth.
Table-3.1 Worldwide Number of Mutual Fund Schemes and Net Assets -2014
Top ten Countries and India’s Total Net Assets (In USD Billions) and Number of Mutual
Fund Schemes #
Sl.No. COUNTRY Total Net Assets (In USD
Billions)
Number of Mutual Fund
Schemes
2010 $ 2014 $ 2010 2014 1 United States 11,832.99 15,852.34 7,554 7,923
2 Luxembourg 2,512.87 3,208.26 9,353 9,839
3 Australia 1,455.85 1,601.13 N/A N/A
4 Ireland 1,014.10 1,547.34 2,899 3,462
5 France 1,617.18 1,391.27 7,791 7,082
6 United Kingdom 854.41 1,182.18 2,204 1,920
7 Brazil 980.45 989.54 5,618 8,560
8 Canada 636.95 981.80 2,117 3,164
9 Japan 785.50 780.64 3,905 5,404
10 China 364.99 708.88 660 1,763
11 INDIA 111.421
*(613979-Crore)
134.63
*(825240-Crore)
658
* (882)
723
*( 1638)
Notes: (1) N/A = not available

2-#Country in which more than 700 Billion USD in total Net Asset in 2014.
Source: International Investment Funds Association (2015 Investment Company Fact Book)
*Handbook of Statistics on Indian Securities Market 2014.
3.2 Trends in Resource Mobilisation by Private and public Sector
Mutual Funds in India.
Mutual fund industry continued to exhibit positive growth in assets under
management in 2013-14. The gross mobilisation of resources by all mutual funds
during 2013-14 was at Rs.97, 68,100 crore compared to Rs.72, 67,885 crore during the
previous year indicating an increase of 34.4 percent over the previous year (Table-3.2).
Correspondingly, redemption also increased by 35.1 percent to Rs.97, 14,318 crore in
2013- 14 from Rs.71, 91,346 crore in 2012-13. The net resources mobilised by all the
mutual funds aggregated to Rs.53,782 crore in 2013-14 compared to net inflow of
Rs.76,539 crore in2012-13. As of at the end of March 2014, the cumulative net assets
managed by all the mutual funds totaled to Rs.8, 25,240 crore as against Rs.7,01,443
crore at the end of March 2013, representing a rise 17.6 per cent.
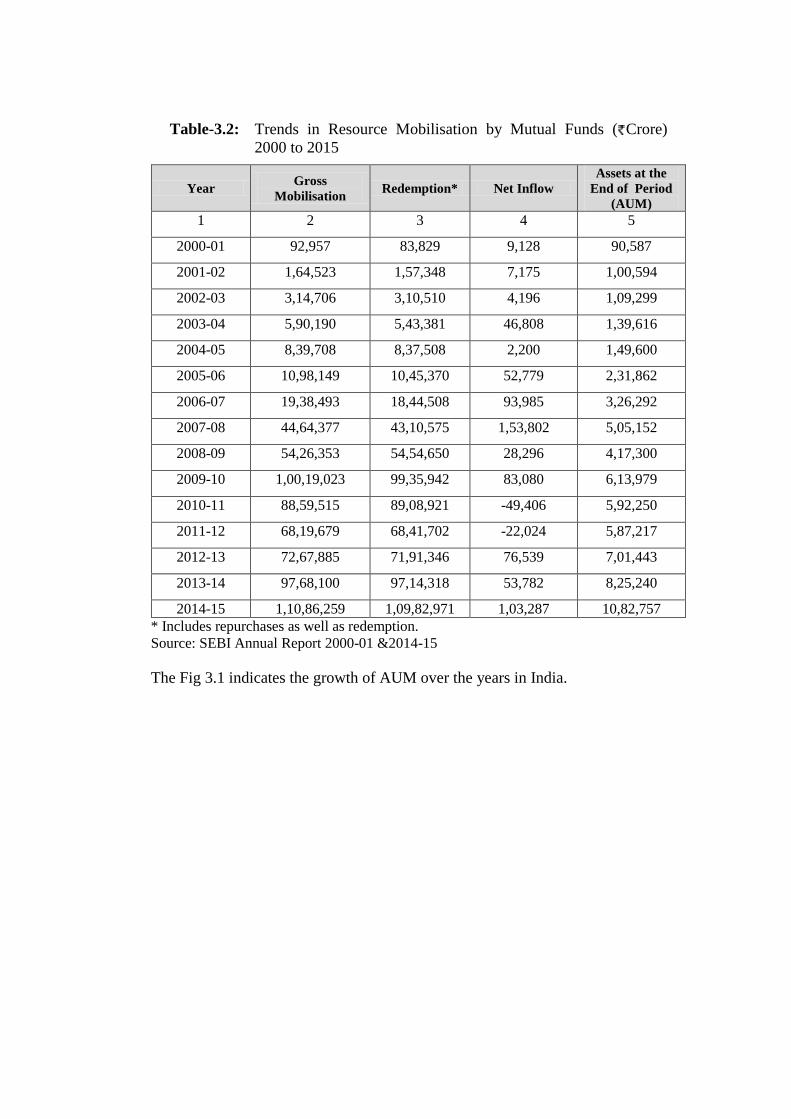
Table-3.2: Trends in Resource Mobilisation by Mutual Funds ( Crore)
2000 to 2015
Year Gross
Mobilisation Redemption* Net Inflow
Assets at the
End of Period
(AUM)
1 2 3 4 5
2000-01 92,957 83,829 9,128 90,587
2001-02 1,64,523 1,57,348 7,175 1,00,594
2002-03 3,14,706 3,10,510 4,196 1,09,299
2003-04 5,90,190 5,43,381 46,808 1,39,616
2004-05 8,39,708 8,37,508 2,200 1,49,600
2005-06 10,98,149 10,45,370 52,779 2,31,862
2006-07 19,38,493 18,44,508 93,985 3,26,292
2007-08 44,64,377 43,10,575 1,53,802 5,05,152
2008-09 54,26,353 54,54,650 28,296 4,17,300
2009-10 1,00,19,023 99,35,942 83,080 6,13,979
2010-11 88,59,515 89,08,921 -49,406 5,92,250
2011-12 68,19,679 68,41,702 -22,024 5,87,217
2012-13 72,67,885 71,91,346 76,539 7,01,443
2013-14 97,68,100 97,14,318 53,782 8,25,240
2014-15 1,10,86,259 1,09,82,971 1,03,287 10,82,757
* Includes repurchases as well as redemption.
Source: SEBI Annual Report 2000-01 &2014-15
The Fig 3.1 indicates the growth of AUM over the years in India.

Figure 3.1 The graph indicates the growth of AUM over the years in India.
3.3 Mutual Fund Schemes
Mutual funds can be of three basic types, depending on how they are offered
for purchase and redemption: open-ended, close-ended and interval funds (Table 3.3
and Fig.3.2)
Table 3.3: Mutual Fund schemes as on 31-March 2015
Schemes Open-ended Close-ended Interval Total
A. Income/ Debt Oriented Schemes 364(356) 910(757) 72(65) 1,346(1,178)
B. Growth/ Equity Oriented Schemes 342(325) 92(38) 0(0) 434(363)
C. Balanced Schemes 25(29) 0(1) 0(0) 25(30)
D. Exchange Traded Fund 48(40) 0(0) 0 (0) 48(40)
E. Fund of Funds Investing Overseas 31(27) 0 (0) 0 (0) 31(27)
TOTAL (A+B+C+D+E) 810(777) 1,002(796) 72(65) 1,884(1,638)
1. Figures in parentheses indicate corresponding figures for 2013-14.
Source: SEBI Annual Report-2014-15
0
1000
2000
3000
4000
5000
6000
7000
8000
9000
2001 2002 2003 2004 2005 2006 2007 2008 2009 2010 2011 2012 2013 2014
AUM IN INDIA
AUM Linear (AUM)

Fig-3.2 Mutual fund schemes as on 31-March 2015
Maturity-wise there were 777 open-ended schemes, 796 close-ended
schemes and 65 Interval Schemes as on March 31, 2014. For the income/debt
oriented schemes category, the number of close-ended schemes exceeded open-
ended schemes. In 2015; there were 810 open-ended schemes, 1002 close-ended
schemes and 72 Interval Schemes (Table 3.3).
The simplest way to categories‟ mutual fund products is to look at the
investment objective and the portfolio of the fund. A fund may se3k to invest the
money it mobilises from investors in debt instruments, equity instruments, in
commodities such as gold, in international funds and securities, in other funds, in
derivatives or some combination of these investment options. So the four broad
categories (Mutual fund Schemes) are:
Equity funds investing in equity securities.
Debt funds investing in short and long-term debt instruments.
Hybrid funds investing in a combination of equity and debt.
Other funds including international, commodity, and fund of funds.
The return that a fund may offer and the risk it carries depend on the
investment portfolio.
3.4 Scheme-wise Resource Mobilisation
0
200
400
600
800
1000
1200
Open-ended Close-ended Interval
Fund of Funds InvestingOverseas
Exchange Traded Fund
Balanced Schemes
Growth/ Equity OrientedSchemes
Income/ Debt OrientedSchemes
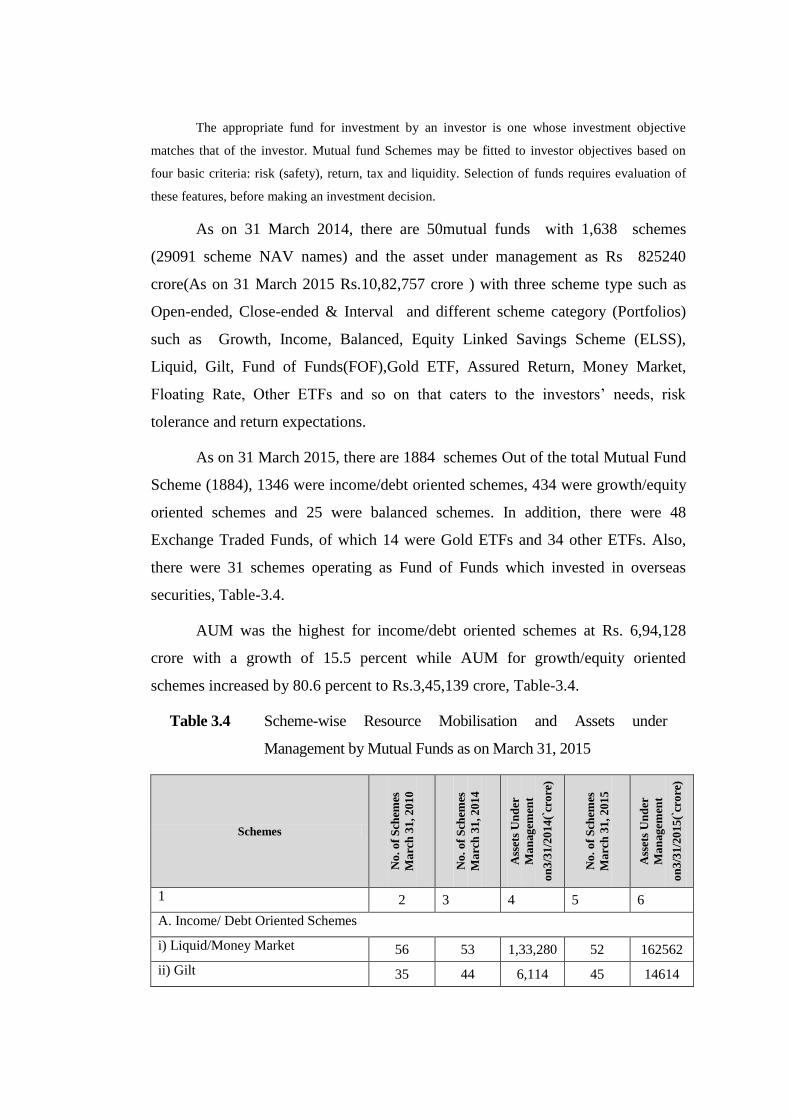
The appropriate fund for investment by an investor is one whose investment objective
matches that of the investor. Mutual fund Schemes may be fitted to investor objectives based on
four basic criteria: risk (safety), return, tax and liquidity. Selection of funds requires evaluation of
these features, before making an investment decision.
As on 31 March 2014, there are 50mutual funds with 1,638 schemes
(29091 scheme NAV names) and the asset under management as Rs 825240
crore(As on 31 March 2015 Rs.10,82,757 crore ) with three scheme type such as
Open-ended, Close-ended & Interval and different scheme category (Portfolios)
such as Growth, Income, Balanced, Equity Linked Savings Scheme (ELSS),
Liquid, Gilt, Fund of Funds(FOF),Gold ETF, Assured Return, Money Market,
Floating Rate, Other ETFs and so on that caters to the investors‟ needs, risk
tolerance and return expectations.
As on 31 March 2015, there are 1884 schemes Out of the total Mutual Fund
Scheme (1884), 1346 were income/debt oriented schemes, 434 were growth/equity
oriented schemes and 25 were balanced schemes. In addition, there were 48
Exchange Traded Funds, of which 14 were Gold ETFs and 34 other ETFs. Also,
there were 31 schemes operating as Fund of Funds which invested in overseas
securities, Table-3.4.
AUM was the highest for income/debt oriented schemes at Rs. 6,94,128
crore with a growth of 15.5 percent while AUM for growth/equity oriented
schemes increased by 80.6 percent to Rs.3,45,139 crore, Table-3.4.
Table 3.4 Scheme-wise Resource Mobilisation and Assets under
Management by Mutual Funds as on March 31, 2015
Schemes
No
. o
f S
chem
es
Ma
rch
31
, 2
01
0
No
. o
f S
chem
es
Ma
rch
31
, 2
01
4
Ass
ets
Un
der
Ma
nag
emen
t
on
3/3
1/2
014
(`cr
ore
)
No
. o
f S
chem
es
Ma
rch
31
, 2
01
5
Ass
ets
Un
der
Ma
nag
emen
t
on
3/3
1/2
015
(`cr
ore
)
1 2 3 4 5 6
A. Income/ Debt Oriented Schemes
i) Liquid/Money Market 56 53 1,33,280 52 162562
ii) Gilt 35 44 6,114 45 14614

iii) Debt (other than assured returns) 367 1,077 4,60,672 1245 515772
iv) Infrastructure development 0 4 879 4 1179
Subtotal (i to iv) 458 1,178 6,00,945 1346 694128
B. Growth/ Equity Oriented Schemes
i) ELSS 48 52 25,547 55 39470
ii) Others 307 311 1,65,560 379 305669
Subtotal (i+ii) 355 363 1,91,107 434 345139
C. Balanced Schemes
Balanced schemes 33 30 16,793 25 26368
D. Exchange Traded Funds
i) Gold ETF 7 14 8,676 14 6655
ii) Other ETFs 14 26 4,528 34 8060
Subtotal (i+ii) 21 40 13,204 48 14715
E. Fund of Funds Investing Overseas
Fund of Funds investing overseas 15 27 3,191 31 2408
TOTAL (A+B+C+D+E) 882 1,638 8,25,240 1884 1082757
Source: SEBI Annual Report-2009-10, 2013-14, 2014-15
AUM of gilt schemes in 2014-15 increased by 139 percent, followed by a
rise of 84.6 percent in „others‟ schemes of growth/equity oriented schemes and a
78.0 percent increase in „other‟ ETF schemes. Except the fund of funds investing
overseas schemes and gold ETFs, all the schemes registered an increase in AUM
over the previous year. The highest decline in AUM was registered for fund of
funds investing overseas schemes at 24.5 percent.
3.5 Assets Under Management in India: Geographical Distribution
For savings to be streamlined into the capital market, investors need to first
and foremost be made aware of avenues and opportunities. The mutual fund
industry is yet to spread its reach beyond big cities. The top five cities contribute
72.13per cent of the AUM, the remaining 27.87per cent distributed among other
cities. Statistics show that in December 2014, penetration in the top five cities
increased to 72.13per cent as compared to 71.12per cent in March 2012, whereas

for cities beyond the top five, penetration has decreased. One of the prime areas the
industry is focusing on is developing the penetration ratio and increasing its
presence in other cities. Table 3.5 and Fig.3.3.
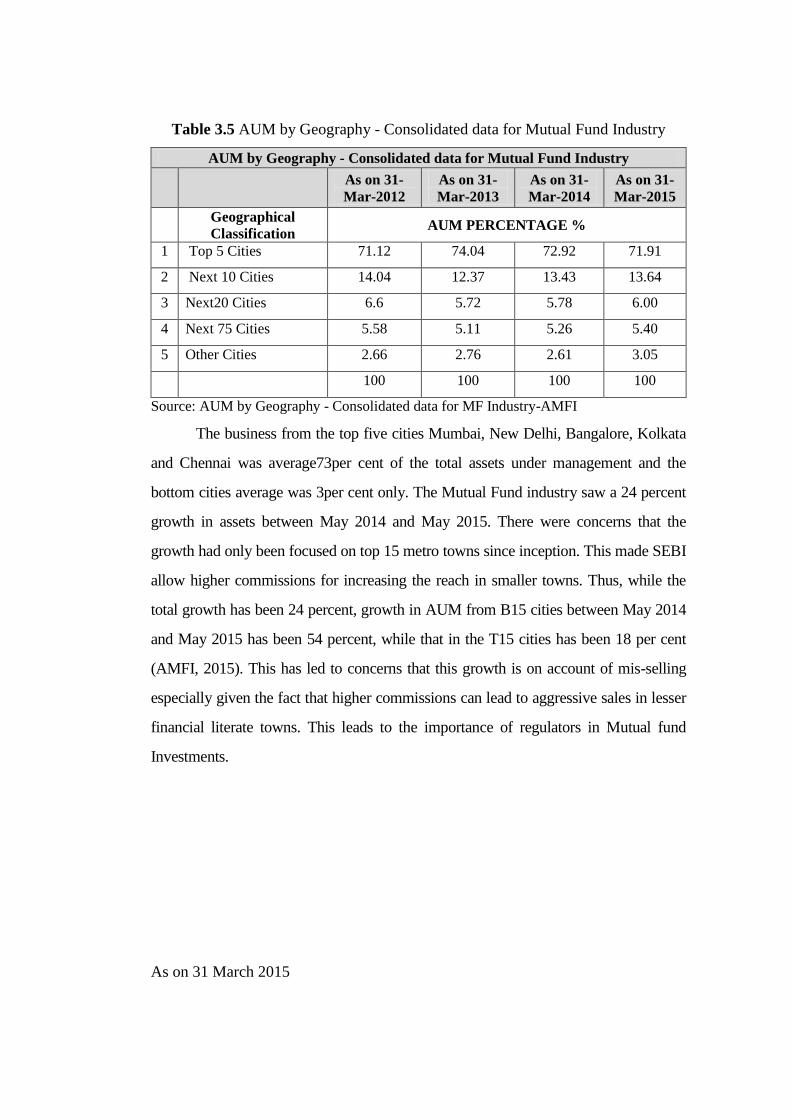
Table 3.5 AUM by Geography - Consolidated data for Mutual Fund Industry
AUM by Geography - Consolidated data for Mutual Fund Industry
As on 31-
Mar-2012
As on 31-
Mar-2013
As on 31-
Mar-2014
As on 31-
Mar-2015
Geographical
Classification AUM PERCENTAGE %
1 Top 5 Cities 71.12 74.04 72.92 71.91
2 Next 10 Cities 14.04 12.37 13.43 13.64
3 Next20 Cities 6.6 5.72 5.78 6.00
4 Next 75 Cities 5.58 5.11 5.26 5.40
5 Other Cities 2.66 2.76 2.61 3.05
100 100 100 100
Source: AUM by Geography - Consolidated data for MF Industry-AMFI
The business from the top five cities Mumbai, New Delhi, Bangalore, Kolkata
and Chennai was average73per cent of the total assets under management and the
bottom cities average was 3per cent only. The Mutual Fund industry saw a 24 percent
growth in assets between May 2014 and May 2015. There were concerns that the
growth had only been focused on top 15 metro towns since inception. This made SEBI
allow higher commissions for increasing the reach in smaller towns. Thus, while the
total growth has been 24 percent, growth in AUM from B15 cities between May 2014
and May 2015 has been 54 percent, while that in the T15 cities has been 18 per cent
(AMFI, 2015). This has led to concerns that this growth is on account of mis-selling
especially given the fact that higher commissions can lead to aggressive sales in lesser
financial literate towns. This leads to the importance of regulators in Mutual fund
Investments.
As on 31 March 2015

Fig. 3.3 AUM by Geography - Consolidated data for MF Industry-AMFI
Source: Assets under management in India: Geographical distribution- AMFI
3.6 State Wise Penetration of Mutual Fund
Industry highlights of CRISIL (2014) states that the domestic mutual fund
industry maintained the positive momentum in the last quarter of 2014. Average
assets under management (AUM) rose to a record high and exceeded the Rs. 11
trillion mark. Average AUM rose 4.39per cent or by Rs 465.41 billion to Rs. 11.06
trillion (excluding fund of funds) in the quarter ended December 2014 as per the
data released by the Association of Mutual Funds in India (AMFI). The industry's
average assets increased 26.21per cent or by Rs. 2.30 trillion in 2014 ,the fastest
calendar year growth since the industry started declaring quarterly average assets in
September 2010. Growth in the latest quarter was mainly driven by rise in equity
funds' assets; the industry's total gain would have been higher but for the decline in
AUM of liquid funds, FMPs and gold exchange traded funds (ETFs). Equity funds,
which were the toast of the industry the entire year, were the primary driver of
72%
14%
6% 5% 3%
Assets under management in India: Geographical distribution- AMFI
Top 5 cities Next 10 Cities Next 20 Cities
Next 75 Cities Other Cities

industry assets in the latest quarter. The category's average AUM gained 15.74per
cent or Rs 457.25 billion to a record high of Rs 3.36 trillion. For the year, the
category gained 71.99per cent or Rs 1.41 trillion, the largest calendar year gain
since the industry started declaring average assets (since September 2010). Growth
was led by robust inflows and mark to market (MTM) gains. The category
registered inflows of Rs. 589.39 billion in 2014 compared with outflows of Rs.
117.92 billion in 2013. The domestic equity market as represented by the CNX
Nifty gained 31.39per cent in 2014 compared with 6.76per cent returns in 2013.
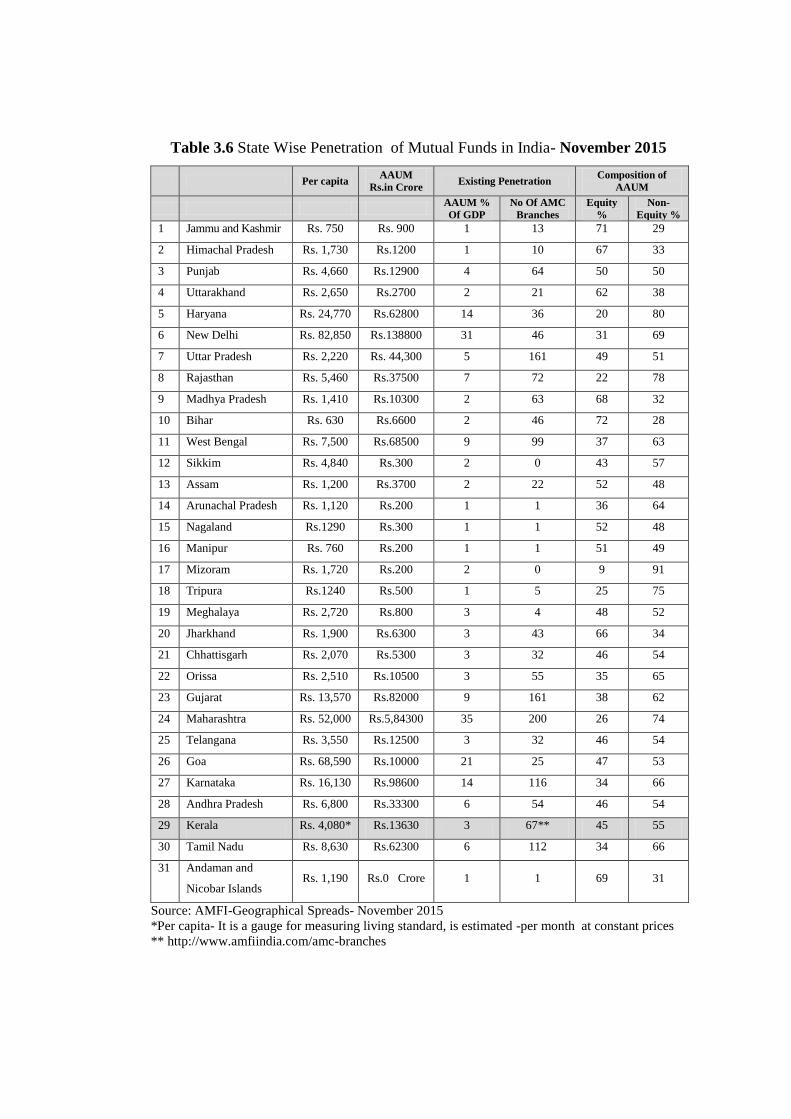
Table 3.6 State Wise Penetration of Mutual Funds in India- November 2015
Per capita AAUM
Rs.in Crore Existing Penetration
Composition of
AAUM
AAUM %
Of GDP
No Of AMC
Branches
Equity
%
Non-
Equity %
1 Jammu and Kashmir Rs. 750 Rs. 900 1 13 71 29
2 Himachal Pradesh Rs. 1,730 Rs.1200 1 10 67 33
3 Punjab Rs. 4,660 Rs.12900 4 64 50 50
4 Uttarakhand Rs. 2,650 Rs.2700 2 21 62 38
5 Haryana Rs. 24,770 Rs.62800 14 36 20 80
6 New Delhi Rs. 82,850 Rs.138800 31 46 31 69
7 Uttar Pradesh Rs. 2,220 Rs. 44,300 5 161 49 51
8 Rajasthan Rs. 5,460 Rs.37500 7 72 22 78
9 Madhya Pradesh Rs. 1,410 Rs.10300 2 63 68 32
10 Bihar Rs. 630 Rs.6600 2 46 72 28
11 West Bengal Rs. 7,500 Rs.68500 9 99 37 63
12 Sikkim Rs. 4,840 Rs.300 2 0 43 57
13 Assam Rs. 1,200 Rs.3700 2 22 52 48
14 Arunachal Pradesh Rs. 1,120 Rs.200 1 1 36 64
15 Nagaland Rs.1290 Rs.300 1 1 52 48
16 Manipur Rs. 760 Rs.200 1 1 51 49
17 Mizoram Rs. 1,720 Rs.200 2 0 9 91
18 Tripura Rs.1240 Rs.500 1 5 25 75
19 Meghalaya Rs. 2,720 Rs.800 3 4 48 52
20 Jharkhand Rs. 1,900 Rs.6300 3 43 66 34
21 Chhattisgarh Rs. 2,070 Rs.5300 3 32 46 54
22 Orissa Rs. 2,510 Rs.10500 3 55 35 65
23 Gujarat Rs. 13,570 Rs.82000 9 161 38 62
24 Maharashtra Rs. 52,000 Rs.5,84300 35 200 26 74
25 Telangana Rs. 3,550 Rs.12500 3 32 46 54
26 Goa Rs. 68,590 Rs.10000 21 25 47 53
27 Karnataka Rs. 16,130 Rs.98600 14 116 34 66
28 Andhra Pradesh Rs. 6,800 Rs.33300 6 54 46 54
29 Kerala Rs. 4,080* Rs.13630 3 67** 45 55
30 Tamil Nadu Rs. 8,630 Rs.62300 6 112 34 66
31 Andaman and
Nicobar Islands Rs. 1,190 Rs.0 Crore 1 1 69 31
Source: AMFI-Geographical Spreads- November 2015
*Per capita- It is a gauge for measuring living standard, is estimated -per month at constant prices
** http://www.amfiindia.com/amc-branches

India's per capita income, a gauge for measuring living standard, is
estimated to have gone up 11.7 per cent to Rs 5,729 per month in 2012-13 at
current prices, compared with Rs 5,130 in the previous fiscal. The estimated rate of
growth in per capita income for the current fiscal, however, is lower than the
previous fiscal when it grew by 13.7 per cent.
Fig. 3.4 Composition of AAUM in Kerala as on November 2015
As per Table 3.6 State Wise Penetration of Mutual Funds in India on
November 2015, per capita income in Kerala was Rs.4080, AAUM was Rs.13630
Crore , penetration of mutual fund investment in Kerala was just 3per cent Of
GDP (of 67 AMC Branches in Kerala). As per Fig 3.4, 55 per cent Mutual fund
investors in Kerala prefer non equity mutual fund schemes and 45 per cent prefer
equity schemes in Mutual funds. Compared to other states in India, the reason for
the present condition and its prospective requirements are analysed.
3.7 Mutual Fund investors
Investors in mutual funds may be resident individual, institutional investors,
NRIs, Flls and PIOs. They are allotted a folio number when they make a first purchase with a
fund house, whether in an NFO or in an existing scheme. The R&T agent of the scheme creates a
folio for the investor under which all transactions are recorded. Investor folio number is like a bank
45
55
Composition of AAUM in Kerala as on November 2015
Equity %
Non- Equity %

account number. Investors can hold units of multiple schemes of a fund house, under one folio
(Table 3.3).
As on March 31, 2015, while individuals subscribed 97.28 percent of the
total folios, their share in the total net assets was 46.92 percent. On the other hand,
corporate/institutions had a miniscule share of 0.92 percent in the total number of
folios, their share in the total net assets was significant at 47.64 percent. In
comparison to 2012-13, the percentage share of individuals in the total folios (96.9
to 97.28) and share in net assets (45.73 to 46.92) had increased. NRIs/OCBs with
1.75 percent share in folios had 3.82 percent share in total net assets (2014-15).
As per the Table 3.7, Fig.3.5,as on 31 March 2015 Rs 10,82,757.4 crore
AUM and 4,17,40,206 investors folios, compared to Rs.6,13,979 crore AUM and
4,77,23,711 investors folios on 31 March 2010.
Table 3.7 Unit holding pattern of all mutual funds as on March 31, 2015
Unit holding pattern of all mutual funds as on March 31, 2015
Investor
Category
2012-13 2013-2014 2014-15
%
No. of
Folios
%
No. of
Folios
%
AUM
% of
AUM
1 2 3 4 5 6 7 8
Individuals 96.9 39042636 97.19 40606623 97.28 508032 46.92
(45.73)
NRIs/OCBs 1.8 783048 1.95 731081 1.75 41363 3.82
(4.70)
FIIs 0.0 432 0.00 19798 0.05 17546 1.62
(0.96)
Corporates/
Institutions/
Others
1.2 345525 0.86 382704 0.92 515816 47.64
(48.61)
TOTAL 100 40171641 100 41740206 100 1082757 100
Notes: Figures in parentheses indicate corresponding figures for 2012-13
Source: SEBI Annual Report 2012-13 to 2014-15
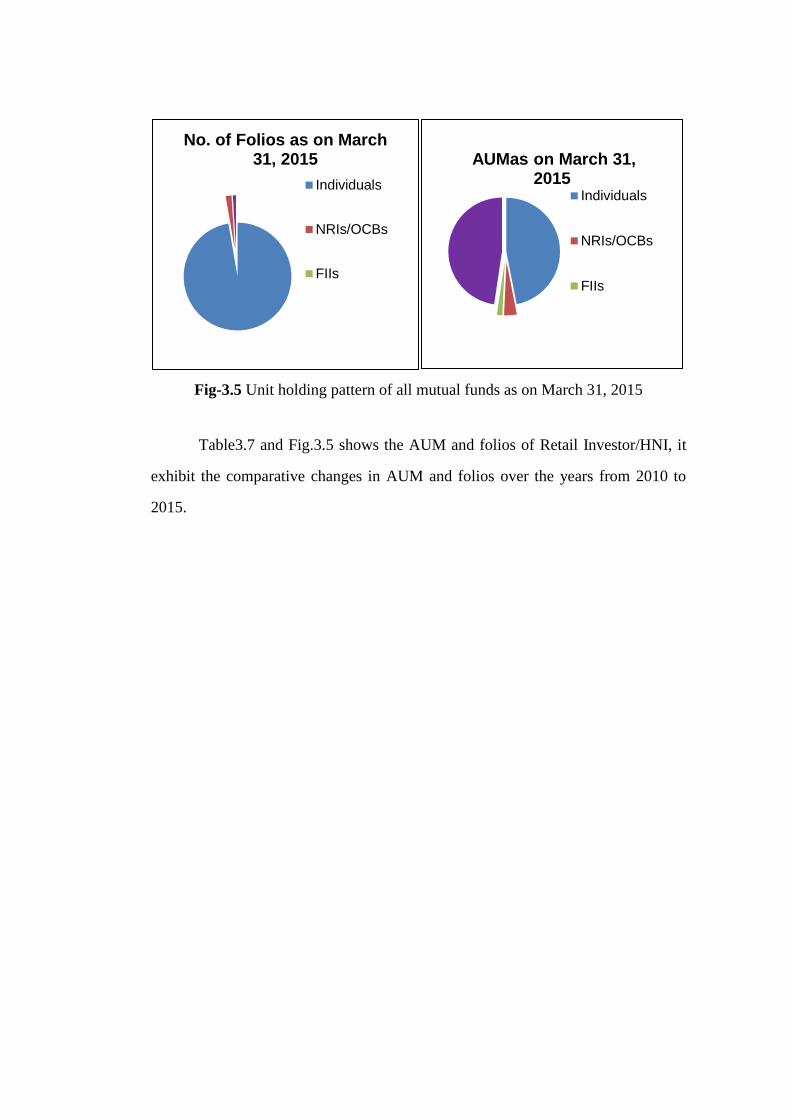
Fig-3.5 Unit holding pattern of all mutual funds as on March 31, 2015
Table3.7 and Fig.3.5 shows the AUM and folios of Retail Investor/HNI, it
exhibit the comparative changes in AUM and folios over the years from 2010 to
2015.
No. of Folios as on March 31, 2015
Individuals
NRIs/OCBs
FIIs
AUMas on March 31,
2015 Individuals
NRIs/OCBs
FIIs

Fig-3.5 Asset under Management and Folios - Retail Investor/HNI*
Classification as on March 31, 2015
3.8 Private and public Sector Mutual Funds, investor participation
and resource mobilisation
At the end of March 2015 the private sector mutual funds retained the
dominant place in the mutual fund industry with Rs. 917762 Crore Asset under
Management, and in Public sector mutual fund holds Rs. 164995 Crore Assets
Under Management, it is presented in Table 3.8 and in Fig.3.6.
Retail&HNI Investors AUM (Rs. Cr) as on
March 31, 2015
Liquid
Gilt
Debt
Equity
Retail&HNI Investors No of Folios as on March
31, 2015
Liquid
Gilt
Debt
Equity

Table 3.8: Private and public Sector Sponsored Mutual Funds, investor
participation and resource mobilisation-2014-15
Investor
Category N
o. o
f F
oli
os
Perce
nta
ge
to T
ota
l
Fo
lio
s u
nd
er P
riv
ate
Sec
tor
NA
V (
Rs.
In
crore)
(AU
M)
Perce
nta
ge
to T
ota
l N
et
Ass
ets
un
der
Priv
ate
Sec
tor
No
. o
f F
oli
os
Perce
nta
ge
to T
ota
l F
oli
os
un
der P
ub
lic
Secto
r
NA
V (
Rs.
in cro
re)
AU
M)
Perce
nta
ge
to T
ota
l N
et
Ass
ets
un
der
Pu
bli
c S
ecto
r S
ecto
r
1 2 3 4 5 6 7 8 9
Private Sector Sponsored Mutual Funds Public Sector Sponsored Mutual Funds
2014-15
Individuals 2,62,85,069 96.6 425238 46.3 14321554 98.6 82794 50.2
NRIs/OCBs 6,01,263 2.2 37200 4.1 129818 0.9 4163 2.5
FPIs 19,788 0.1 17502 1.9 10 0.0 44 0.0
Corporates/
Institutions/
Others
3,15,761 1.2 437822 47.7 66943 0.5 77994 47.3
Total 27221881 100 917762 100 14518325 100 164995 100
2013-14
Individuals 24885093 96.3 304711 44.1 14157543 98.8 66194 47.6
NRIs/OCBs 662677 2.6 30181 4.4 120371 0.8 3415 2.4
FPIs 207 0.0 7776 1.1 225 0.0 5898 4.2
Corporates/
Institutions/
Others
294932 1.1 348018 50.4 50593 0.4 63662 45.7
Total 25842909 100 690688 100 14328732 100 139170 100
Note: UTI figures are reported with public sector mutual funds.
Source: SEBI Annual Report-2014-15

Fig. 3.6 Private and public Sector Sponsored Mutual Funds, investor
participation and resource mobilisation-2014-15
Individual investors (50.2%) prefer to invest in public sector sponsored
mutual funds.
3.9 Preferences of Kerala Investors in Mutual Funds
The name of the mutual fund which, the investor prefers to invest shall
definitely be a factor deciding the success of investment. The survey reveals that
following Mutual funds and asset management companies are preferred by Mutual
Fund Investors in Kerala.
Table 3.9 Number of Respondents preferred different Mutual Funds
Sl.
No. Mutual Funds *
No of
Respondents
Percentage of
Respondents
1 Axis Mutual Fund -Axis Asset Management Co. Ltd. 24 11.45
46.3
4.1 1.9
47.7
Percentage to Total Net Assets under Private Sector-2014-15
Individuals
NRIs/OCBs
FPIs
Corporates/Institutions/Others
50.2
2.5 0
47.3
Percentage to Total Net Assets underPublic Sector-2014-15
Individuals
NRIs/OCBs
FPIs
Corporates/Institutions/Others

2 HDFC Mutual Fund-HDFC Asset Management Company Limited 48 39
3 Reliance Mutual Fund-Reliance Capital Asset Mgmt. Ltd. 60 29.45
4
Kotak Mahindra Mutual Fund-Kotak Mahindra Asset Management
Company Limited. 11 5.25
5 Tata Mutual Fund-Tata Asset Management Limited 20 9.45
6 SBI Mutual Fund-SBI Funds Management Private Limited 145 42.25
4 Sundaram Mutual Fund -Sundaram Asset Management Company Ltd 14 4
8
ICICI Prudential Mutual Fund-ICICI Prudential Asset Management
Company Ltd 96 48
9
DSP Black Rock Mutual Fund-DSP Black Rock Investment Managers
Private Limited 11 5.5
10
Birla Sun Life Mutual Fund-Birla Sun Life Asset Management Company
Limited 46 23
11
Franklin Templeton Mutual Fund-Franklin Templeton Asset
Management (India) Private Limited. 24 12
12 UTI Mutual Fund-UTI Asset Mgmt. Co. Ltd. 104 51.45
*Multiple responses
Source: Survey data
It is understood from the analysis of Table 3.9 and exhibit in Fig.3.7 that
SBI mutual fund occupying the prime position in winning the attraction of fund
investors in Kerala. Out of 400 mutual fund investors surveyed with multiple
response option, 42.25 per cent prefer to invest in SBI mutual funds. Another
public sector fund, UTI mutual fund is preferred by 51.45 per cent investors. ICICI
prudential and HDFC mutual fund are also considered for investment by a
significant number of investors. Mutual funds promoted by Kotak Mahindra and
Sundaram are able to induce only a very small fraction of investors.

Fig 3.7 - Preference of Mutual funds
SBI Mutual Fund manage their operations in Kerala through their seven
branches, bank backed captive distribution and other intermediaries including
IFA‟s (Independent financial advisors). UTI Mutual Fund manages their operations
in Kerala through their five branches and other intermediaries including IFA‟s.
ICICI Prudential Mutual Fund manage their operations in Kerala through their six
branches, bank backed captive distribution and other intermediaries including
IFA‟s. HDFC Mutual Fund manage their operations in Kerala through their three
branches, bank backed captive distribution and other intermediaries including
IFA‟s. Reliance Mutual Fund manages their operations in Kerala through their ten
branches and other intermediaries including IFA‟s. Other Mutual Funds having
three or more branches in Kerala are Birla Sun Life Mutual Fund, Tata Mutual
Fund, Kotak Mahindra Mutual Fund, Sundaram Mutual Fund and Peerless Mutual
Fund. All these Mutual Funds have no bank backed captive distribution network. It
shows that the role of distribution network is important for the growth of Mutual
fund investment in Kerala.
3.10 Preferences of Kerala Investors in Mutual Fund schemes
To satisfy the needs of Mutual fund investors, Mutual fund Schemes are
designing more lucrative and innovative tools considering the appetite for risk
taking of individual investors. While designing these innovative fund scheme
AMCs mainly consider for risk return trade off and after completely evaluating the
020406080
100120140160
Axis Mutual Fund -Axis Asset…
HDFC MutualFund-HDFC…
Reliance MutualFund-Reliance…
Kotak MahindraMutual Fund-…
Tata Mutual Fund-Tata Asset…
SBI Mutual Fund-SBI Funds…
Sundaram MutualFund -Sundaram…
ICICI PrudentialMutual Fund-…
DSP Black RockMutual Fund-…
Birla Sun LifeMutual Fund-…
Franklin TempletonMutual Fund-…
UTI Mutual Fund-UTI Asset Mgmt.…
Preference of Mutual Funds
No of Respondents

various securities on various risk parameters new fund scheme is launched that can
satisfy the quest of every investor to maximize the returns. Present study classified
the Mutual Fund Scheme based on the investment objectives. Mutual Fund Scheme
preferred by Keralites shown in Table 3.10 and Fig.3.8.
Table 3.10: Number of Respondents preferred different Mutual Fund Scheme.
Sl. No. Mutual fund Schemes * No of respondents Percentage of Respondents
1 Debt Schemes 294 44.25
2 Equity Schemes 398 99.50
3 Balanced schemes 32 8.00
4 Liquid Schemes 122 30.50
5 ELSS 64 16.45
6 Other Schemes 24 6.00
*Multiple responses
Source: Survey data
Fig 3.8- Preference of Mutual fund schemes
As per Table 3.10 reveals that almost all mutual fund investors surveyed
prefer to invest in equity schemes .Equity funds include Growth schemes and
ELSS. Equity funds are investing in equity securities and may provide regular
return or capital appreciation. Growth schemes seek only capital appreciation and
therefore invest in equities. Selection of equity funds may be based on various parameters
,such as their consistent performance, a stable long-term performance, concentration of a
portfolio i.e. the number of sectors to which the fund has exposure, level of diversification in the
portfolio and portfolio turnover ratio, i.e. the total sales or purchases of a fund (whichever is lower)
divided by the average net assets of the fund. Higher the portfolio turnover ratio, greater
0
50
100
150
200
250
300
350
400
450
500
EquitySchemes
DebtSchemes
Hybridschemes
Other Schemes
Balanced schemes
Liquid Schemes
Debt Schemes
ELSS
Equity Schemes

the frequency of trading, and lower the average holding period for the stocks held
in the portfolio. The market capitalisation of the stocks (large cap, small cap and mid cap) in the
portfolio should be in line with the objectives of the portfolio, A high level of cash in an equity fund
may imply that the fund manager is trying to time the market, liquidity, The size of the fund,
measured as its net assets, may also influence the performance of a fund. The risk in the portfolio of
a fund may differ based on the style used to construct the portfolio.
About 45 per cent of the mutual fund investors have expressed their interest in non equities
also. While comparing the numbers related to equity and non equity funds, the investors do not have
any special inclination to any of the two funds. However, only eight per cent investors prefer to
invest in balanced funds which imply that the mutual fund investors prefer to enjoy the full
potentials of capital market fluctuations than to stabilise their income conditions. Balanced funds
are in mid-way path but failed to make investor appeal in Kerala. A significant number of investors
prefer to provide liquidity of their investments.
3.11 Investor protection and regulatory mechanism of Mutual
fund.
The legal and regulatory framework governing the mutual fund industry includes the
agencies that are involved in regulating various elements of the mutual fund industry and the
specific provisions that seek the protection of investor interests. To improve the awareness
investors can use the source of data published by regulators in MF. The websites of
AMFI and SEBI are sources of information that investors can use in India.
3.11.1 Securities and Exchange Board of India
The Securities and Exchange Board of India (SEBI) is entrusted with role of regulating and
supervising mutual funds in India. The central piece of regulation for the mutual fund industry is the
SEBI (Mutual Funds) Regulations, 1996. This regulation has been amended from time to time.
SEBI has been set up by an Act of Parliament namely the SEBI Act, 1992 and is therefore
supervised by the Ministry of Finance. Appeals against any ruling of SEBI can be made to the
Securities Appellate Tribunal (SAT).
Mutual funds can appoint only SEBI-registered constituents to carry out various functions for
them. Constituents such as the Asset Management Company (AMC) and Trustee Company are registered
with SEBI. They are therefore also subject to regulation by the Acts relevant to their constitution, such as
the Companies Act and the Indian Trusts Act. Mutual funds are not directly regulated by anyone other
than SEBI. But constituents can be dually regulated depending on their nature.
The website of SEBI (www.sebi.gov.in) contains the updated version of the SEBI (Mutual Fund)
Regulations, 1996. It also holds all the circulars that have been issued to mutual funds, the reports of

committees on mutual funds, and board papers relating to all regulated intermediaries including
mutual funds. The SIDs of the funds yet to be launched by mutual funds is also available for investor
feedback.
3.11.2 Association of Mutual Fund Industry
AMFI is an industry body that has been created by the AMCs are its members; they
associate for the promotion of the interests of the mutual fund industry. AMFI is not an SRO but an
association of the mutual fund industry. An SRO is a regulatory authority of an industry, appointed by
the regulator to perform specific functions. But AMFI recommend desirable practices to SEBI,
AMFI may be involved in the implementation of the code as specified by SEBI.
The website of AMFI (www.amfiindia.com) contains the latest NAV of all mutual funds,
uploaded daily at the end of each business day by funds. The latest dividend announcements and
fund AUM are also available. The contact information including address, phone numbers, key
officials and website URLs can be found for all mutual funds. AMFI also brings out a monthly
publication showing the AUM of the mutual fund industry, categorised by type of fund and category
of the fund house. The AMFI website features a facility to find distributors with valid
ARN in a geographical location.
3.11.3 Stock exchanges
Stock exchanges perform some of the regulatory functions as an SRO (self-
regulatory organization) on behalf of SEBI. Asset Management Companies list the
close ended exchange traded funds in Stock Exchange and they follow the
regulatory and disclosure requirements of the stock exchange. The stock
exchanges, as a primary regulator, are entrusted to act as the first level source of
detecting market frauds, suspicious activities and any aberrations in the market
movement; these are then reported to SEBI for further examination.
3.11.4 Reserve Bank of India
RBI is the regulatory authority of banks in India. Banks can function as sponsors,
custodians and distributors of mutual funds, in discharging these functions; they are subject to
regulation stipulated by RBI from time to time. RBI is the regulator of money markets and the
government securities markets in India. Since mutual funds may invest in these securities (MMMF),
they are required to abide by the RBI regulations as may be applicable.

Mutual funds publish the rankings and ratings they receive from various agencies, along
with a brief description of the methodology used. Some of these agencies (Information service
providers) also award best funds in each category with awards.
The National Centre for Financial Education is setup as part of National
Institute of Securities Markets (NISM), with support from all financial sector
regulators i.e. Reserve Bank of India (RBI), Securities and Exchange Board of
India (SEBI), Insurance Regulatory and Development Authority (IRDA), Pension
Fund Regulatory and Development Authority (PFRDA) and Forward Market
Commission (FMC) for implementation of the National Strategy for Financial
Education (NSFE).
3.12 Rights with respect to Management of the Fund
If a mutual fund desires to make a change in any fundamental attribute of a scheme, say
converting a closed-end fund to an open-ended fund, or converting a sector fund into a diversified
fund, such a change impacts investors in the scheme. So, a mutual fund cannot change any of its
fundamental attributes without notifying the existing unit holders and giving them 30-days' notice to
redeem without exit load. If two schemes of a mutual fund are merged or consolidated, it is
considered a change in fundamental attribute of both the merging Scheme and the surviving scheme.
However, if the following conditions are met, such merger or consolidation may not be considered
as the change in fundamental attribute of the surviving scheme:
a. There are no other changes to the attributes of the surviving scheme.
b. The mutual fund is able to demonstrate that the merger or consolidation does not affect the
interests of the unit holders of the surviving scheme.
Unit holders can terminate the AMC of a mutual fund by passing resolution signed by unit
holders holding at least 75per cent of the total unit holding of the scheme. They can also seek to
wind up the scheme.
If the trustees seek to wind up a scheme, or redeem a scheme pre maturely, they need to
seek the consent of the unit holders. SEBI can also order a mutual fund to seek investor consent on
any matter it decides to be of utmost importance to unit holders.
If there is a change in the sponsor or the AMC of the scheme, unit holders have the right to
be notified and the right to redeem the; units without load, within a stipulated period of at least 30
days.
Mutual funds are formed as trusts and the money and security that belong to the unit holders is
held by the custodian. The AMC or the sponsor does not directly hold the funds or securities belonging to
the investors. The custodian is independent of the sponsor. Trustees supervise the working of the mutual
fund, in the interest of the investors. This structure provides a good level of protection to the investors.
Unit holders receive unit certificate and Statement of account (SoA). The unit certificate is
only an acknowledgement of the number of units held by the investor. Unlike a unit certificate, the
SoA is a record of all the transactions done during a given period and the current value of the
holdings. Both SoA and unit certificate are not negotiable or tradable. R&T agents, on behalf of
mutual funds, despatch So As to investors whenever there is a transaction on a folio. Investors are
entitled to get an updated SoA, once a year, for all folios they hold with a mutual
fund even if there are no transactions done on the folio.
3.13 Regulatory Developments
In relation with Overseas Regulatory Developments in Mutual funds the
Securities and Exchange Board of India („SEBI‟) announced a series of measures to
stimulate the mutual fund industry from 2012-13 onwards, especially distribution of
mutual funds. It reenergising mutual fund industry and continued focus on investor
protection, list of the regulatory amendments were announced. It includes mutual
funds / asset management companies („AMC‟) to provide a separate plan for direct
investments with a lower expense ratio and no commission or brokerage can be paid
from such plans. SEBI permitted cash transactions in mutual fund schemes, subject
to compliance with anti-money laundering rules and regulations. The SEBI directed
mutual funds / AMCs to, annually, set apart at least two basis points on daily net
assets within the maximum limit of total expense ratio (TER) for investor education
and awareness initiatives. SEBI directed additional disclosure requirements
pertaining to portfolio disclosures, financial result disclosures, etc. on mutual
funds/AMCs. The SEBI allowed AMCs to charge service tax payable on investment
and advisory fees to the mutual fund scheme, in addition to the maximum amount of
TER. In light of the important role played by the Housing Finance Companies
(„HFC‟) in the housing sector, the SEBI has permitted an additional exposure not

exceeding 10per cent of net assets of the debt oriented scheme for investments in
HFCs. To address the issue of mis-selling, the SEBI, with effect from July 1, 2013,
directed all existing schemes and all schemes to be launched on or thereafter, to be
labeled considering the level of risk associated with them. The SEBI, permitted
mutual funds to buy credit protection to hedge the credit risk on their investments in
corporate bonds, subject to compliance with the Reserve Bank of India (RBI)
guidelines on CDS-(Credit Default Swaps) and in repo for corporate bonds. The
SEBI has clarified that, pending investment of funds by portfolio managers, they can
deploy funds, on short term basis, in liquid mutual fund schemes. The limits
applicable for investments made by QFIs (Qualified Foreign Investors) in mutual
funds have been revised upwards. Pension funds and provident funds to be permitted
to invest in exchange traded funds, debt mutual funds (Union Budget 2013) and asset
backed securities. The universe of strategic investors in the IDF MF has been
expanded to include, systemically important NBFCs registered with RBI and certain
categories of Foreign Institutional Investors which are long term investors as per the
norms specified by SEBI. While making a fund recommendation, the distributor
must keep in mind the guidelines (advertisement code ) laid down by SEBI. The
representation of schemes, past performance, ranking and awards, are all subject to
these guidelines. The objective is to ensure that the advertisements are not
misleading and do not create unrealistic expectations. In order to address the issue of
mis-selling, Product Labeling would provide investors an easy understanding of the
kind of product/scheme they are investing in and its suitability to them. It helps to
reduce the problem of mis-selling, so SEBI decide to introduce „Label‟ mutual funds,
with effect from July 1, 2013, on the parameters as mentioned under:
1. Nature of scheme such as to create wealth or provide regular income in an
indicative time horizon (short/ medium/ long term).
2. A brief about the investment objective (in a single line sentence) followed
by kind of product in which investor is investing (Equity/Debt).
3. Level of risk, depicted by colour code boxes as under:

Blue – Investors understand that their principal will be at low risk.
Yellow – Investors understand that their principal will be at medium risk.
Brown – Investors understand that their principal will be at high risk.
The colour codes shall also be described in text beside the colour code box.
4. Scheme advertisements – placed in manner so as to be prominently visible
to investors.
The selling practices adopted by the distributor should be in the interest of the investors.
AMFI and fund houses have put in place a set of guidelines to be followed by the distributors.
Distributors have to follow AMFI's code of ethics (ACE) AMFI's Guidelines and Norms for
Intermediaries (AGNI) as well as those prescribed by the concerned AMC and SEBI.
3.13.1 Investor Grievances and Redressal
SEBI has been taking various regulatory measures to expedite the redressal of
investor grievances. The grievances lodged by investors (if it is not solved by the
respective company) are taken up with the respective listed company or intermediary
and continuously monitored. SCORES (Sebi COmplaints REdress System) enables the
investor to directly lodge the complaints online and such complaints are considered as
„e-complaints‟. Grievances pertaining to stock brokers and depository participants are
taken up with concerned stock exchange and depository for redressal and monitored by
the concerned department through periodic reports obtained from them. Grievances
pertaining to other intermediaries are taken up with them directly for redressal and
continuously monitored by concerned department of SEBI. The company/intermediary
is required to respond in prescribed format in the form of Action Taken Report (ATR).
Upon the receipt of ATR, the status of grievances would be updated. If the response of
the company/intermediary is insufficient / inadequate, follow up action is initiated.
SEBI takes appropriate enforcement actions (Adjudication, 11B directions of SEBI
Act 1992, Prosecution etc.) as provided under the law where progress in redressal of
investor grievances is not satisfactory.
SEBI received 38,442 complaints during 2014- 15 and resolved 35,090
grievances cumulatively as Compared to 33,550 grievances received and 35,299
grievances resolved in 2013-14 (Table -3.11).
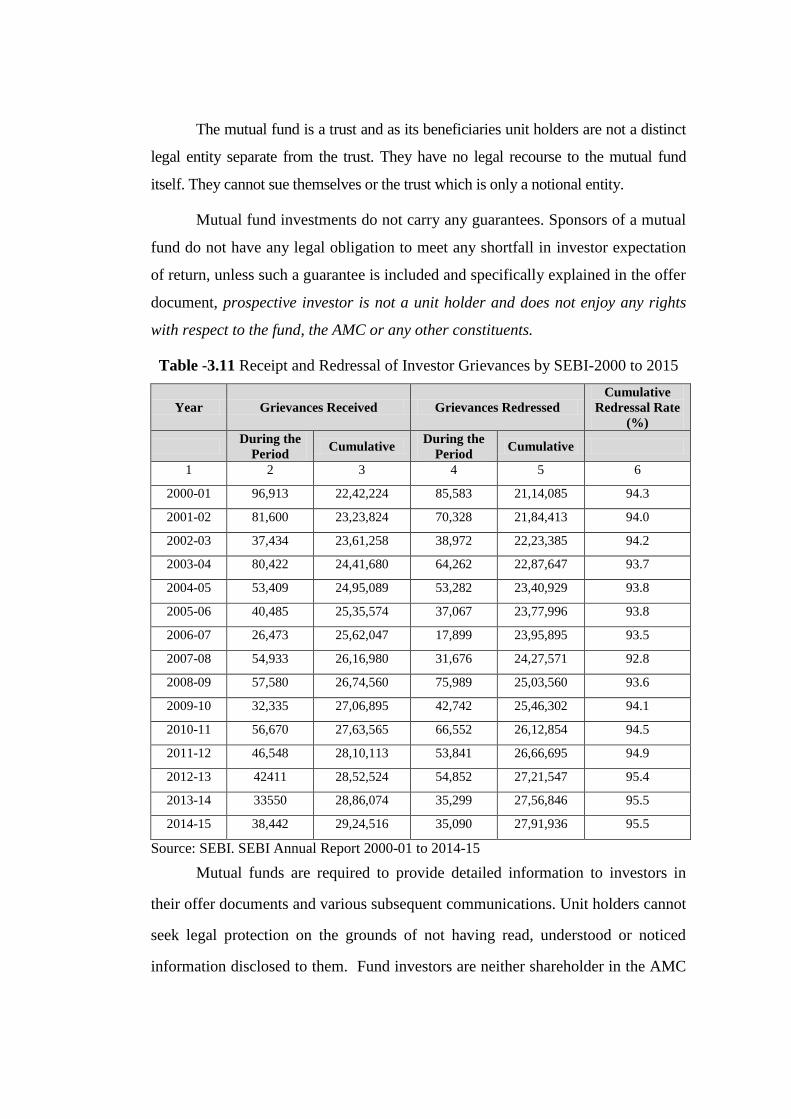
The mutual fund is a trust and as its beneficiaries unit holders are not a distinct
legal entity separate from the trust. They have no legal recourse to the mutual fund
itself. They cannot sue themselves or the trust which is only a notional entity.
Mutual fund investments do not carry any guarantees. Sponsors of a mutual
fund do not have any legal obligation to meet any shortfall in investor expectation
of return, unless such a guarantee is included and specifically explained in the offer
document, prospective investor is not a unit holder and does not enjoy any rights
with respect to the fund, the AMC or any other constituents.
Table -3.11 Receipt and Redressal of Investor Grievances by SEBI-2000 to 2015
Year Grievances Received Grievances Redressed
Cumulative
Redressal Rate
(%)
During the
Period Cumulative
During the
Period Cumulative
1 2 3 4 5 6
2000-01 96,913 22,42,224 85,583 21,14,085 94.3
2001-02 81,600 23,23,824 70,328 21,84,413 94.0
2002-03 37,434 23,61,258 38,972 22,23,385 94.2
2003-04 80,422 24,41,680 64,262 22,87,647 93.7
2004-05 53,409 24,95,089 53,282 23,40,929 93.8
2005-06 40,485 25,35,574 37,067 23,77,996 93.8
2006-07 26,473 25,62,047 17,899 23,95,895 93.5
2007-08 54,933 26,16,980 31,676 24,27,571 92.8
2008-09 57,580 26,74,560 75,989 25,03,560 93.6
2009-10 32,335 27,06,895 42,742 25,46,302 94.1
2010-11 56,670 27,63,565 66,552 26,12,854 94.5
2011-12 46,548 28,10,113 53,841 26,66,695 94.9
2012-13 42411 28,52,524 54,852 27,21,547 95.4
2013-14 33550 28,86,074 35,299 27,56,846 95.5
2014-15 38,442 29,24,516 35,090 27,91,936 95.5
Source: SEBI. SEBI Annual Report 2000-01 to 2014-15
Mutual funds are required to provide detailed information to investors in
their offer documents and various subsequent communications. Unit holders cannot
seek legal protection on the grounds of not having read, understood or noticed
information disclosed to them. Fund investors are neither shareholder in the AMC

nor are they depositors with the fund. Their investments cannot be protected by any
of the regulators under the Companies Act. Investors can first approach the AMC
and the trustees to seek redressal of any complaints relating to their investments. If
their complaint is not resolved they can write to SEBI for redressal. The redressal
by these entities is on best effort basis, and is not obligatory. The offer document
has to disclose the details of pending investor complaints. This may form a ground
for SEBI to refuse permission to a mutual fund to launch new schemes.
3.13.2 Redressal of complaints received against popular mutual
funds
Table 3.12 gives a summary of complaints received against leading mutual
funds in India as on 31.03.2014.These six funds were emerged out as the most
preferred mutual funds for investors in Kerala, according to the survey conducted
in the study.
Table 3.12 Complaints received against Mutual Funds (MFs) during 2013-
2014-which are top six mutual funds in Kerala as on 31-03-2014
Redressal of Complaints received against Mutual Funds (MFs) during 2013-2014-which are top six mutual funds in
Kerala as on 31-03-2014
Co
mp
Lain
t C
od
e
SB
I M
utu
al
Fu
nd
UT
I M
utu
al
Fu
nd
ICIC
I P
ru
den
tia
l M
utu
al
Fu
nd
HD
FC
Mu
tua
l F
un
d
Reli
an
ce M
utu
al
Fu
nd
Bir
la S
un
Lif
e M
utu
al
Fu
nd
TOTAL
Type of Complaint# (b) (b) (b) (b) (b) (b) (b)
I A
Non receipt of Dividend on
Units 81 209 224 140 10 26 423
I B
Interest on delayed payment
of Dividend 9 6 3 4 6 5 33
I C
Non receipt of Redemption
Proceeds 114 280 344 248 245 81 1342

I D Interest on delayed payment of Redemption 6 11 14 20 25 92 168
II
A
Non receipt of Statement of
Account/Unit Certificate 32 221 3 139 52 5 452
II
B
Discrepancy in Statement of
Account 0 45 1051 984 1948 1 4032
II
C
Data corrections in Investor
details 430 2,618 1322 3841 0 4151 12662
II
D
Non receipt of Annual
Report/Abridged Summary 1 2 0 1 0 0 4
III A
Wrong switch between Schemes 0 11 85 24 46 11 180
III B
Unauthorized switch between Schemes 0 11 0 6 0 0 14
III
C
Deviation from Scheme
attributes 0 0 0 2 0 0 2
III
D
Wrong or excess
charges/load 0 12 0 10 0 0 22
III E
"Non updation of changes
viz. address, PAN, bank details, nomination, etc" 55 348 1211 213 389 1328 3544
IV Others * 158 541 63 325 241 356 1414
V SIP Related 232 0 0 0 491 0 423
Grand Total 1418 4,345 4353 6023 3453 6056 25648
Total Complaints Received 1418 4345 4353 6023 3453 6056 25648
Total Number of Folios 4114882 9554400 2644954 4508444 5463364 2019404 28345084
Percentage Complaints Against
Folios 0.03% 0.05% 0.16% 0.13% 0.06% 0.30% 0.09%
# - including against its authorized persons / distributors / employees etc
*Non actionable - means the complaint that are incomplete / outside the scope of the Mutual Fund
(b)** Number of Complaints received during the year,more than90% of complints areredressed during the year itself ,so only 10% may carry forward to next year.
Secondary Data Source: AMFI-Redressal of Complaints received against Mutual Funds (MFs) during 2013-2014
On analysing the table it came to know that most of the complaints are
registered about data correction in investor details. Discrepancy in statement of
account and non updation of changes were complaints next to the correction of
investor details. Non receipts of redemption proceeds reported from some side
along with the complaints of other nature.
While comparing the columns in the table, which reports complaints raised
against various mutual fund, it is worth to mention that more number of complaints
are made against the private sector mutual funds than the public sector funds.
During this period maximum number of complaints registered against Birla sun life
mutual fund followed by ICICI prudential and HDFC .Even though UTI mutual
fund lead the sector in terms of owning customer portfolio, the rate of complaints
registered against this fund in relative terms is much lower than its private sector

peers. However, SBI mutual fund is found better performer in terms of successful
delivery of investor service through the reduction of investor complaints. This is
true both in absolute and relative terms. On clubbing these findings one can
conclude that the public sector mutual funds show more efficiency in creating
satisfied customer base.
3.14 Conclusion
Financial savings of Indian household sector was increased by 18.0 percent
from Rs. 6,94,234 crore in 2012-13 to Rs. 8,19,450 crore in 2013-14. . It serves the
purpose of financing the economic activity in India, where savings are deployed for building
businesses that generate wealth, create jobs and pay taxes. So the financial assets foster
economic growth and encouraged by the government over physical assets. In order to
enhance the appeal of financial assets over physical assets, the government provides for regulation,
disclosure of information and investor protection. Mutual funds are financial assets, the mutual
fund industry in India started in 1963 with the formation of Unit Trust of India, at
the initiative of the Government of India and Reserve Bank of India. The Indian
mutual fund industry is one of the fastest growing sectors in the Indian capital and
financial markets. The mutual fund industry in India has seen dramatic
improvements in quantity as well as quality of product and service offerings in
recent years. The Indian Mutual Fund industry continues to evolve with various
policy measures to preserve and maintain a safe and fair market to protect the
interest of investors. Mutual Funds in India are governed by the SEBI (Mutual
Fund) Regulations 1996 as amended from time to time SEBI has taken several
steps to reenergize mutual fund industry to increase product penetration especially
in smaller cities/towns, regulation of distributors and issues concerning investor
protection, develop a long-term policy for the sustainable growth of the industry
and increase household savings through mutual funds. As of at the end of March
2014, the cumulative net assets managed by all the mutual funds totalled to
Rs.8,25,240 crore as against Rs.7,01,443 crore at the end of March 2013,
representing a rise 17.6 percent. The business from the top five cities Mumbai,
New Delhi, Bangalore, Kolkata, Chennai was average73per cent of the total assets
under management and the bottom cities average was 3per cent only. So to improve
the geographical reach of mutual funds, AMCs are now allowed to charge
additional TER (up to 30 bps) with respect to inflows beyond top 15 cities, subject
to the satisfaction of certain conditions. To increase the base of mutual fund
distributors, the SEBI has permitted a new cadre of distributors which includes
postal agents, retired government and semi-government officials, retired teachers,
retired bank officers and other persons (such as bank correspondents) to sell units
of mutual fund schemes. These channels, models and facilities available to tackle
the challenges in mutual fund distribution and lead a focused approach to increase
presence in Kerala.
………….………….
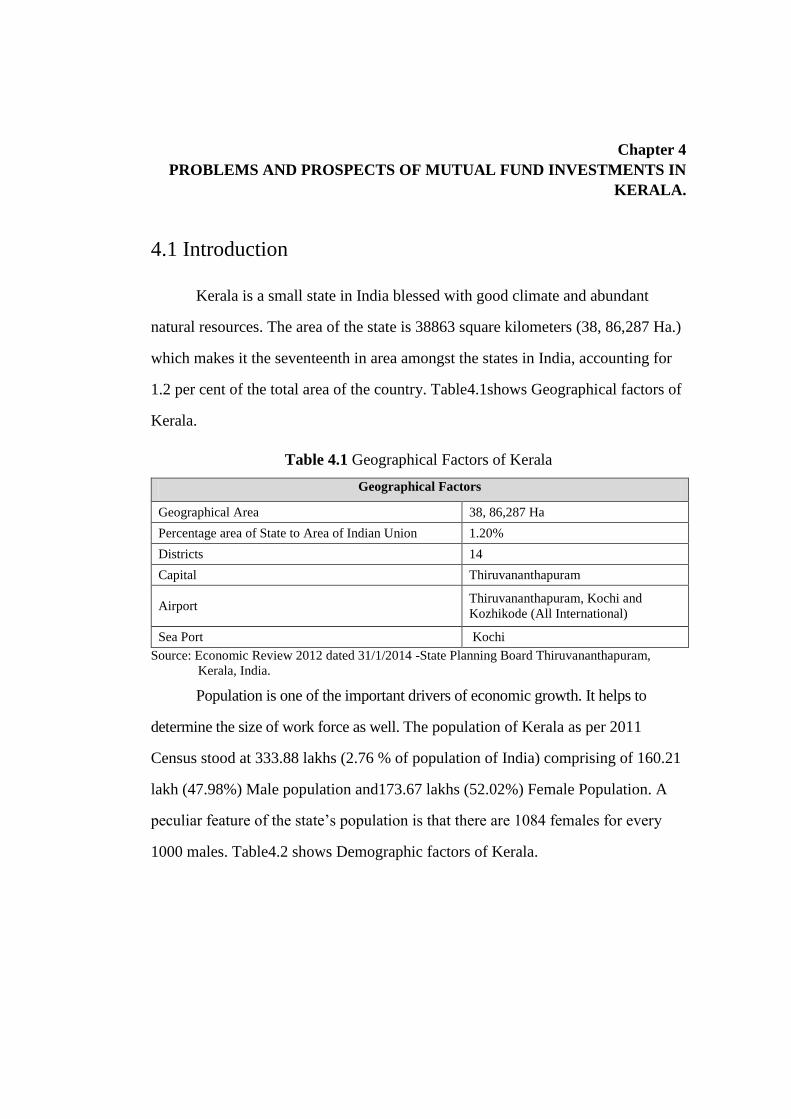
Chapter 4
PROBLEMS AND PROSPECTS OF MUTUAL FUND INVESTMENTS IN
KERALA.
4.1 Introduction
Kerala is a small state in India blessed with good climate and abundant
natural resources. The area of the state is 38863 square kilometers (38, 86,287 Ha.)
which makes it the seventeenth in area amongst the states in India, accounting for
1.2 per cent of the total area of the country. Table4.1shows Geographical factors of
Kerala.
Table 4.1 Geographical Factors of Kerala
Geographical Factors
Geographical Area 38, 86,287 Ha
Percentage area of State to Area of Indian Union 1.20%
Districts 14
Capital Thiruvananthapuram
Airport Thiruvananthapuram, Kochi and
Kozhikode (All International)
Sea Port Kochi
Source: Economic Review 2012 dated 31/1/2014 -State Planning Board Thiruvananthapuram,
Kerala, India.
Population is one of the important drivers of economic growth. It helps to
determine the size of work force as well. The population of Kerala as per 2011
Census stood at 333.88 lakhs (2.76 % of population of India) comprising of 160.21
lakh (47.98%) Male population and173.67 lakhs (52.02%) Female Population. A
peculiar feature of the state‟s population is that there are 1084 females for every
1000 males. Table4.2 shows Demographic factors of Kerala.
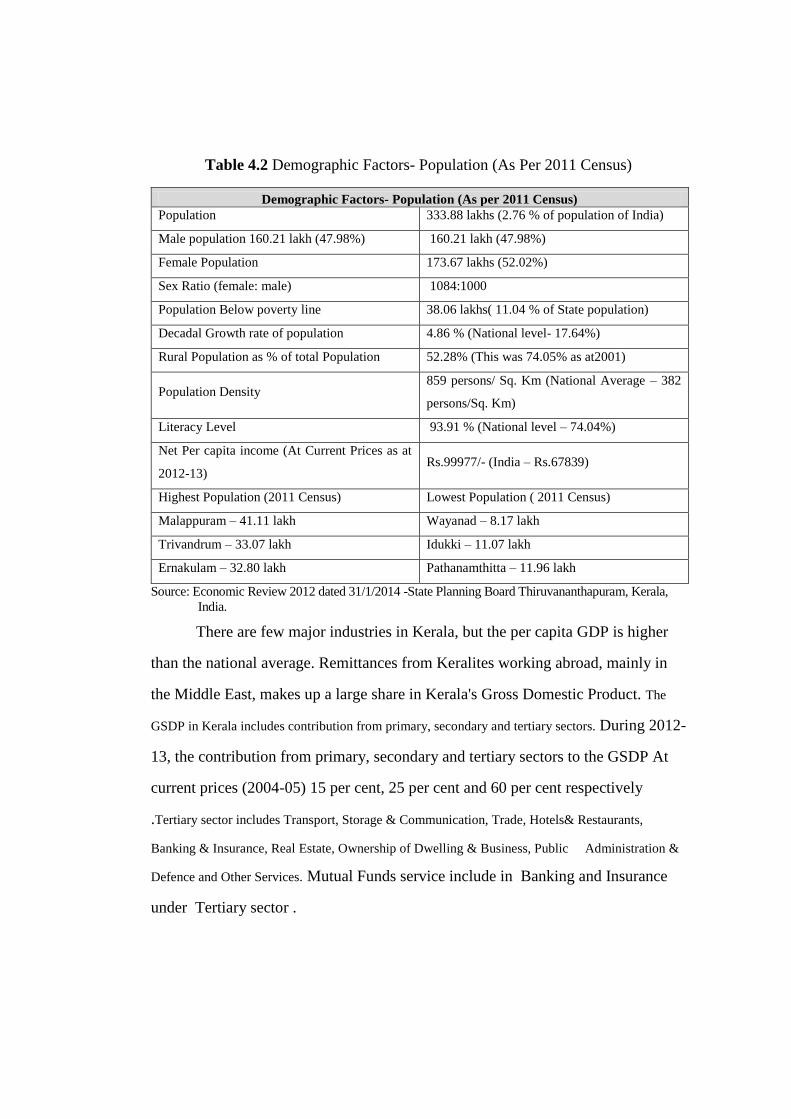
Table 4.2 Demographic Factors- Population (As Per 2011 Census)
Demographic Factors- Population (As per 2011 Census)
Population 333.88 lakhs (2.76 % of population of India)
Male population 160.21 lakh (47.98%) 160.21 lakh (47.98%)
Female Population 173.67 lakhs (52.02%)
Sex Ratio (female: male) 1084:1000
Population Below poverty line 38.06 lakhs( 11.04 % of State population)
Decadal Growth rate of population 4.86 % (National level- 17.64%)
Rural Population as % of total Population 52.28% (This was 74.05% as at2001)
Population Density 859 persons/ Sq. Km (National Average – 382
persons/Sq. Km)
Literacy Level 93.91 % (National level – 74.04%)
Net Per capita income (At Current Prices as at
2012-13) Rs.99977/- (India – Rs.67839)
Highest Population (2011 Census) Lowest Population ( 2011 Census)
Malappuram – 41.11 lakh Wayanad – 8.17 lakh
Trivandrum – 33.07 lakh Idukki – 11.07 lakh
Ernakulam – 32.80 lakh Pathanamthitta – 11.96 lakh
Source: Economic Review 2012 dated 31/1/2014 -State Planning Board Thiruvananthapuram, Kerala,
India.
There are few major industries in Kerala, but the per capita GDP is higher
than the national average. Remittances from Keralites working abroad, mainly in
the Middle East, makes up a large share in Kerala's Gross Domestic Product. The
GSDP in Kerala includes contribution from primary, secondary and tertiary sectors. During 2012-
13, the contribution from primary, secondary and tertiary sectors to the GSDP At
current prices (2004-05) 15 per cent, 25 per cent and 60 per cent respectively
.Tertiary sector includes Transport, Storage & Communication, Trade, Hotels& Restaurants,
Banking & Insurance, Real Estate, Ownership of Dwelling & Business, Public Administration &
Defence and Other Services. Mutual Funds service include in Banking and Insurance
under Tertiary sector .
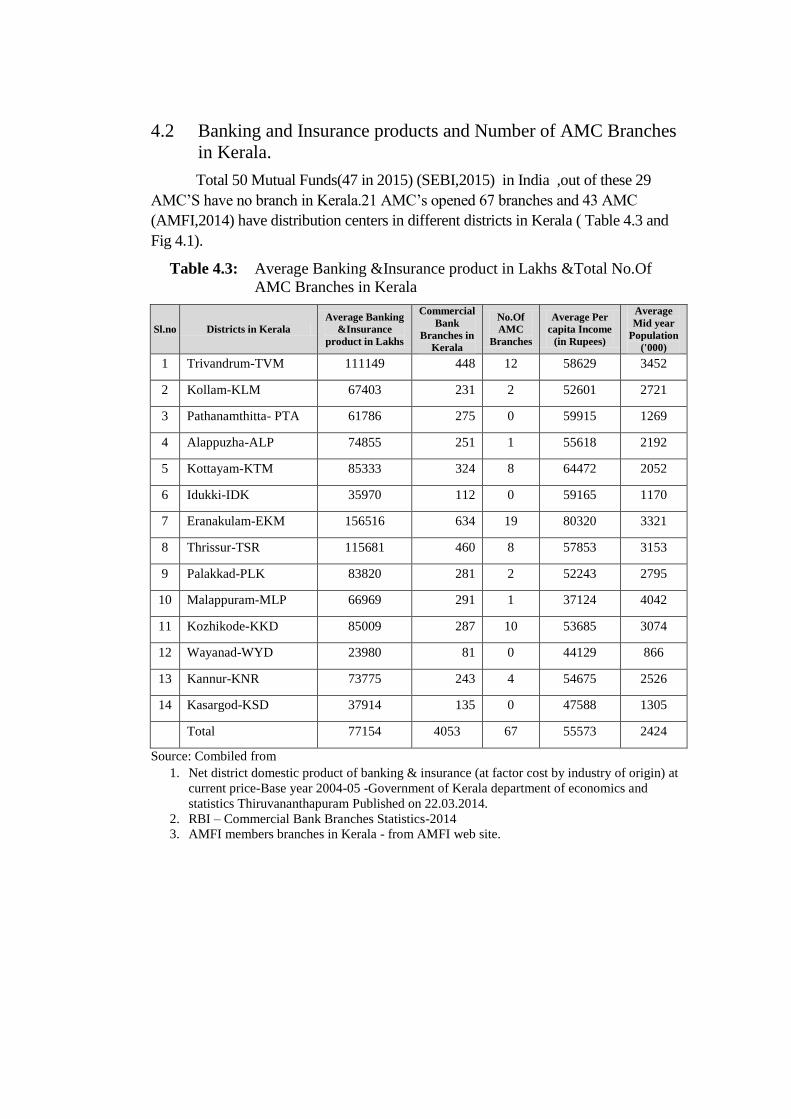
4.2 Banking and Insurance products and Number of AMC Branches
in Kerala.
Total 50 Mutual Funds(47 in 2015) (SEBI,2015) in India ,out of these 29
AMC‟S have no branch in Kerala.21 AMC‟s opened 67 branches and 43 AMC
(AMFI,2014) have distribution centers in different districts in Kerala ( Table 4.3 and
Fig 4.1).
Table 4.3: Average Banking &Insurance product in Lakhs &Total No.Of
AMC Branches in Kerala
Sl.no Districts in Kerala
Average Banking
&Insurance
product in Lakhs
Commercial
Bank
Branches in
Kerala
No.Of
AMC
Branches
Average Per
capita Income
(in Rupees)
Average
Mid year
Population
('000)
1 Trivandrum-TVM 111149 448 12 58629 3452
2 Kollam-KLM 67403 231 2 52601 2721
3 Pathanamthitta- PTA 61786 275 0 59915 1269
4 Alappuzha-ALP 74855 251 1 55618 2192
5 Kottayam-KTM 85333 324 8 64472 2052
6 Idukki-IDK 35970 112 0 59165 1170
7 Eranakulam-EKM 156516 634 19 80320 3321
8 Thrissur-TSR 115681 460 8 57853 3153
9 Palakkad-PLK 83820 281 2 52243 2795
10 Malappuram-MLP 66969 291 1 37124 4042
11 Kozhikode-KKD 85009 287 10 53685 3074
12 Wayanad-WYD 23980 81 0 44129 866
13 Kannur-KNR 73775 243 4 54675 2526
14 Kasargod-KSD 37914 135 0 47588 1305
Total 77154 4053 67 55573 2424
Source: Combiled from
1. Net district domestic product of banking & insurance (at factor cost by industry of origin) at
current price-Base year 2004-05 -Government of Kerala department of economics and
statistics Thiruvananthapuram Published on 22.03.2014.
2. RBI – Commercial Bank Branches Statistics-2014
3. AMFI members branches in Kerala - from AMFI web site.
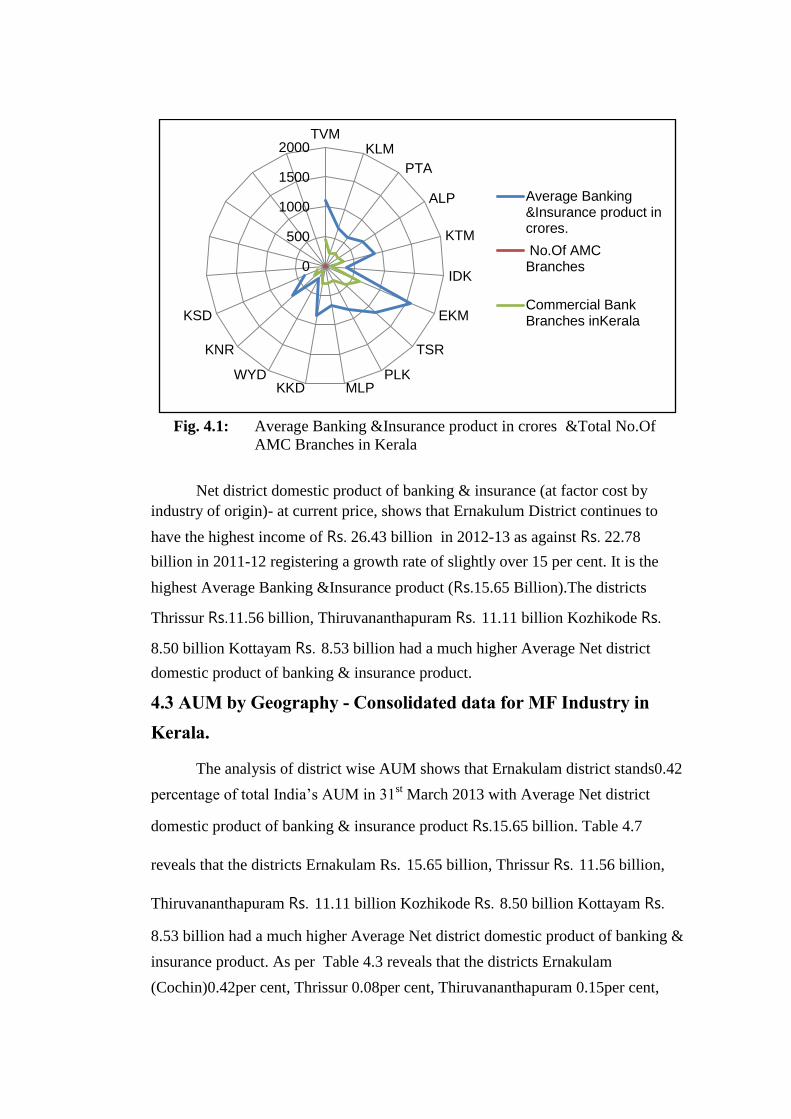
Fig. 4.1: Average Banking &Insurance product in crores &Total No.Of
AMC Branches in Kerala
Net district domestic product of banking & insurance (at factor cost by
industry of origin)- at current price, shows that Ernakulum District continues to
have the highest income of Rs. 26.43 billion in 2012-13 as against Rs. 22.78
billion in 2011-12 registering a growth rate of slightly over 15 per cent. It is the
highest Average Banking &Insurance product (Rs.15.65 Billion).The districts
Thrissur Rs.11.56 billion, Thiruvananthapuram Rs. 11.11 billion Kozhikode Rs.
8.50 billion Kottayam Rs. 8.53 billion had a much higher Average Net district
domestic product of banking & insurance product.
4.3 AUM by Geography - Consolidated data for MF Industry in
Kerala.
The analysis of district wise AUM shows that Ernakulam district stands0.42
percentage of total India‟s AUM in 31st March 2013 with Average Net district
domestic product of banking & insurance product Rs.15.65 billion. Table 4.7
reveals that the districts Ernakulam Rs. 15.65 billion, Thrissur Rs. 11.56 billion,
Thiruvananthapuram Rs. 11.11 billion Kozhikode Rs. 8.50 billion Kottayam Rs.
8.53 billion had a much higher Average Net district domestic product of banking &
insurance product. As per Table 4.3 reveals that the districts Ernakulam
(Cochin)0.42per cent, Thrissur 0.08per cent, Thiruvananthapuram 0.15per cent,
0
500
1000
1500
2000TVM
KLM
PTA
ALP
KTM
IDK
EKM
TSR
PLKMLPKKD
WYD
KNR
KSD
Average Banking&Insurance product incrores.
No.Of AMCBranches
Commercial BankBranches inKerala
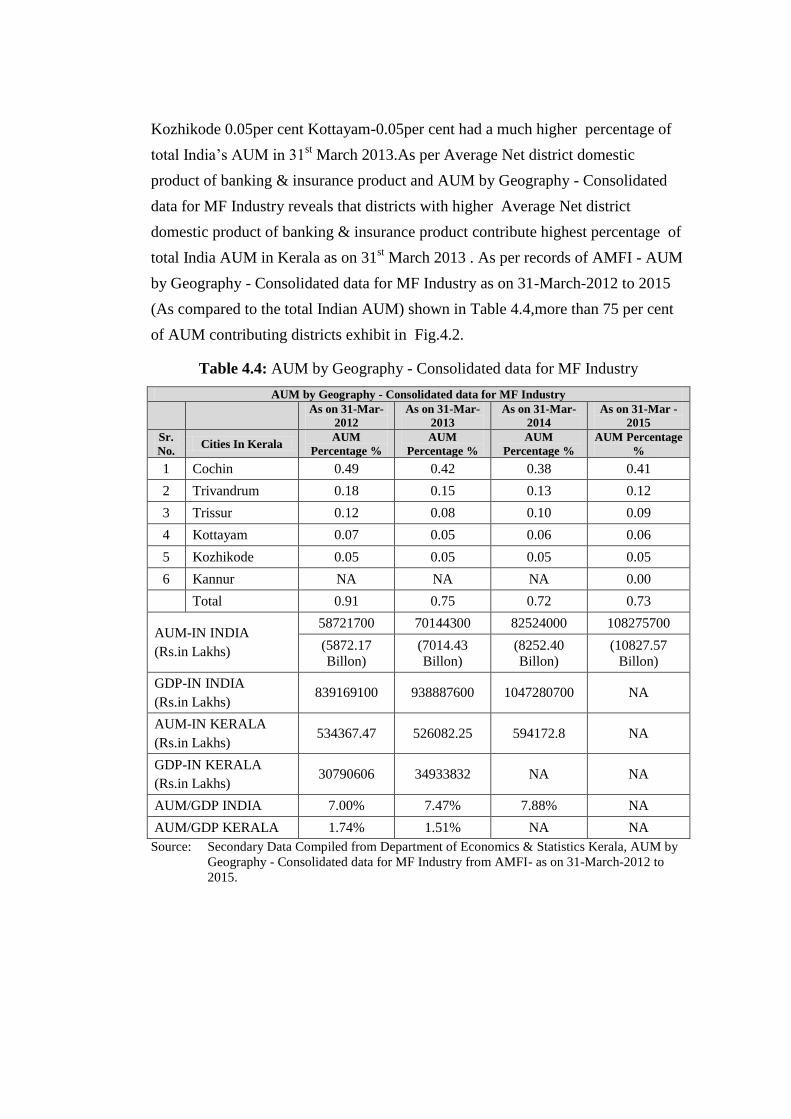
Kozhikode 0.05per cent Kottayam-0.05per cent had a much higher percentage of
total India‟s AUM in 31st March 2013.As per Average Net district domestic
product of banking & insurance product and AUM by Geography - Consolidated
data for MF Industry reveals that districts with higher Average Net district
domestic product of banking & insurance product contribute highest percentage of
total India AUM in Kerala as on 31st March 2013 . As per records of AMFI - AUM
by Geography - Consolidated data for MF Industry as on 31-March-2012 to 2015
(As compared to the total Indian AUM) shown in Table 4.4,more than 75 per cent
of AUM contributing districts exhibit in Fig.4.2.
Table 4.4: AUM by Geography - Consolidated data for MF Industry
AUM by Geography - Consolidated data for MF Industry
As on 31-Mar-
2012
As on 31-Mar-
2013
As on 31-Mar-
2014
As on 31-Mar -
2015
Sr.
No. Cities In Kerala
AUM
Percentage %
AUM
Percentage %
AUM
Percentage %
AUM Percentage
%
1 Cochin 0.49 0.42 0.38 0.41
2 Trivandrum 0.18 0.15 0.13 0.12
3 Trissur 0.12 0.08 0.10 0.09
4 Kottayam 0.07 0.05 0.06 0.06
5 Kozhikode 0.05 0.05 0.05 0.05
6 Kannur NA NA NA 0.00
Total 0.91 0.75 0.72 0.73
AUM-IN INDIA
(Rs.in Lakhs)
58721700 70144300 82524000 108275700
(5872.17
Billon)
(7014.43
Billon)
(8252.40
Billon)
(10827.57
Billon)
GDP-IN INDIA
(Rs.in Lakhs) 839169100 938887600 1047280700 NA
AUM-IN KERALA
(Rs.in Lakhs) 534367.47 526082.25 594172.8 NA
GDP-IN KERALA
(Rs.in Lakhs) 30790606 34933832 NA NA
AUM/GDP INDIA 7.00% 7.47% 7.88% NA
AUM/GDP KERALA 1.74% 1.51% NA NA
Source: Secondary Data Compiled from Department of Economics & Statistics Kerala, AUM by
Geography - Consolidated data for MF Industry from AMFI- as on 31-March-2012 to
2015.
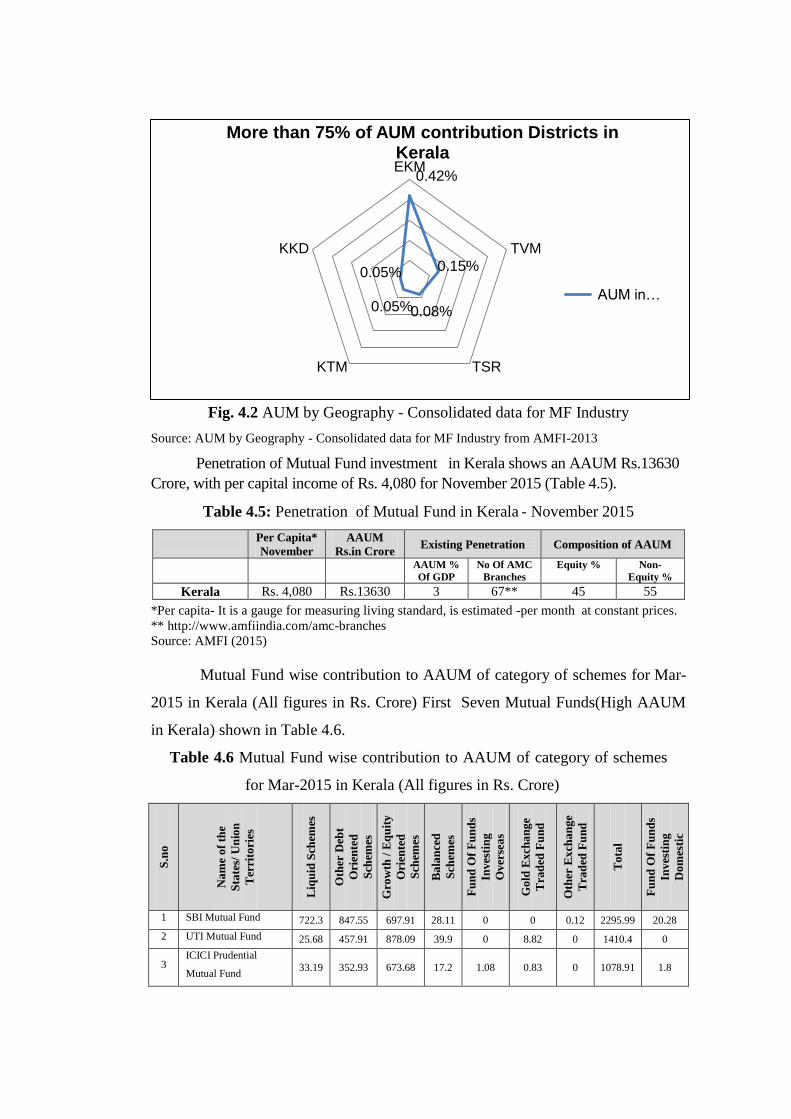
Fig. 4.2 AUM by Geography - Consolidated data for MF Industry
Source: AUM by Geography - Consolidated data for MF Industry from AMFI-2013
Penetration of Mutual Fund investment in Kerala shows an AAUM Rs.13630
Crore, with per capital income of Rs. 4,080 for November 2015 (Table 4.5).
Table 4.5: Penetration of Mutual Fund in Kerala - November 2015
Per Capita*
November
AAUM
Rs.in Crore Existing Penetration Composition of AAUM
AAUM %
Of GDP
No Of AMC
Branches
Equity %
Non-
Equity %
Kerala Rs. 4,080 Rs.13630 3 67** 45 55
*Per capita- It is a gauge for measuring living standard, is estimated -per month at constant prices.
** http://www.amfiindia.com/amc-branches
Source: AMFI (2015)
Mutual Fund wise contribution to AAUM of category of schemes for Mar-
2015 in Kerala (All figures in Rs. Crore) First Seven Mutual Funds(High AAUM
in Kerala) shown in Table 4.6.
Table 4.6 Mutual Fund wise contribution to AAUM of category of schemes
for Mar-2015 in Kerala (All figures in Rs. Crore)
S.n
o
Na
me
of
the
Sta
tes/
Un
ion
Ter
rito
ries
Liq
uid
Sch
emes
Oth
er D
ebt
Ori
ente
d
Sch
emes
Gro
wth
/ E
qu
ity
Ori
ente
d
Sch
emes
Ba
lan
ced
Sch
emes
Fu
nd
Of
Fu
nd
s
Inv
esti
ng
Ov
erse
as
Go
ld E
xch
an
ge
Tra
ded
Fu
nd
Oth
er E
xch
an
ge
Tra
ded
Fu
nd
To
tal
Fu
nd
Of
Fu
nd
s
Inv
esti
ng
Do
mes
tic
1 SBI Mutual Fund 722.3 847.55 697.91 28.11 0 0 0.12 2295.99 20.28
2 UTI Mutual Fund 25.68 457.91 878.09 39.9 0 8.82 0 1410.4 0
3 ICICI Prudential
Mutual Fund 33.19 352.93 673.68 17.2 1.08 0.83 0 1078.91 1.8
0.42%
0.15%
0.08% 0.05%
0.05%
EKM
TVM
TSRKTM
KKD
More than 75% of AUM contribution Districts in Kerala
AUM in…

4 Reliance Mutual Fund 106.48 221.07 632.96 9.85 0 5.73 0.47 976.56 26.06
5 HDFC Mutual Fund 43.3 207.86 546.98 102.7 0 7.78 0 908.63 4.13
6 Franklin Templeton
Mutual Fund 8.22 159.54 371.96 4.04 8.61 0 0 552.37 8.11
7 Birla Sun Life Mutual
Fund 31.22 201.5 298.15 7.15 0.71 0 0 538.73 3.99
Source: http://www.amfiindia.com/research-information/aum-data/classified-average-aum
Even though Penetration of Mutual Fund investment in Kerala shows an
AAUM Rs.13630 Crore, which is below 2 percent of AAUM in India, for
November 2015. It may be not only due to the economic condition in Kerala but
also the investment behaviour of Keralites. It is observed that many researchers
have studied different dimensions of investment behaviour of investors. They are
found out some important factors influences their risk perception, investment
decisions and savings patron of investment. Economic condition in Kerala also
directs various factors influencing investment decision. Those factors affecting
mutual fund investment in Kerala with respect to its problems and prospects
includes investment features and demographic features. Analysing these factors
guide to identify the investment behaviour of Keralites.
4.4 Investors in Kerala
As financial markets are becoming increasingly complex with serious
problems of information asymmetry, the need for financial literacy and education
has become even more acute. But Kerala have highest literacy rate (93.91%), high
enrolment rate in schools and lowest dropout rate from schools. In addition to that
Kerala have one bank branch for every 5900 persons as against all India average of
11000. 74 percentage households in Kerala use banking services (Table 4.7).
Table 4.7 Household use banking services - Kerala
Absolute number Percentage
Total Rural Urban Total Rural Urban
Total number of
households 77,16,370 40,95,674 36,20,696 100 100 100
Households use banking
services 57,28,876 30,24,934 27,03,942 74.2 73.9 74.7
Source: Census of India 2011

Financial Inclusion or inclusive banking is a precursor for inclusive and
sustainable economic growth. Financial literacy is a prerequisite for effective
financial inclusion, which will ensure that financial services reach the under banked
sections of the society, leading to consumer protection through self-regulation.
Banks are now using new technologies like mobile phones to reach low
income consumers. Banks should therefore be proactive about transferring this
technology into an opportunity . Further, physical access to growth centers through
development of a rural road network unleashes the productive capacity of the
people living in rural areas and generates positive externalities. Rural roads, by
themselves, can be considered a powerful instrument of financial inclusion
(Lalitha, 2008) Moreover, analysis of State level data has confirmed that increased
banking network and per capita income enhanced savings as well as credit
inclusion. But the extent of perception and attitude of investors in the market is a
sore point with the banking and financial services industry, with a large amount of
savings being channelise into gold and real estate rather than the Mutual Funds.
A typical investor is unlikely to have the knowledge, skills, preference and time
to keep track of events, understand their implications and act speedily. It cannot be
expected for a general theory aimed at explaining how the financial markets function,
to neglect how the investors, as one of the fundamental actors of the markets, make
their decisions as to purchase or sell a financial asset. It can be said that the question
about how people in general and investors in particular make their psychological
decision processes is a subject matter of behavioral psychology (Peter, 1996).
4.5 Behaviour of Individual Investors of Kerala
Investment decision is the function of a host of independent factors ranging
from socio economic conditions to investor utilities. These factors determine the
direction and structure where the investor should opt for an investment avenue.
Investors demographic and investment profile have close relation to their preference
of saving and investment in Kerala. It determines the investment objectives and the
investors‟ choices. There is an association between investor category and perception
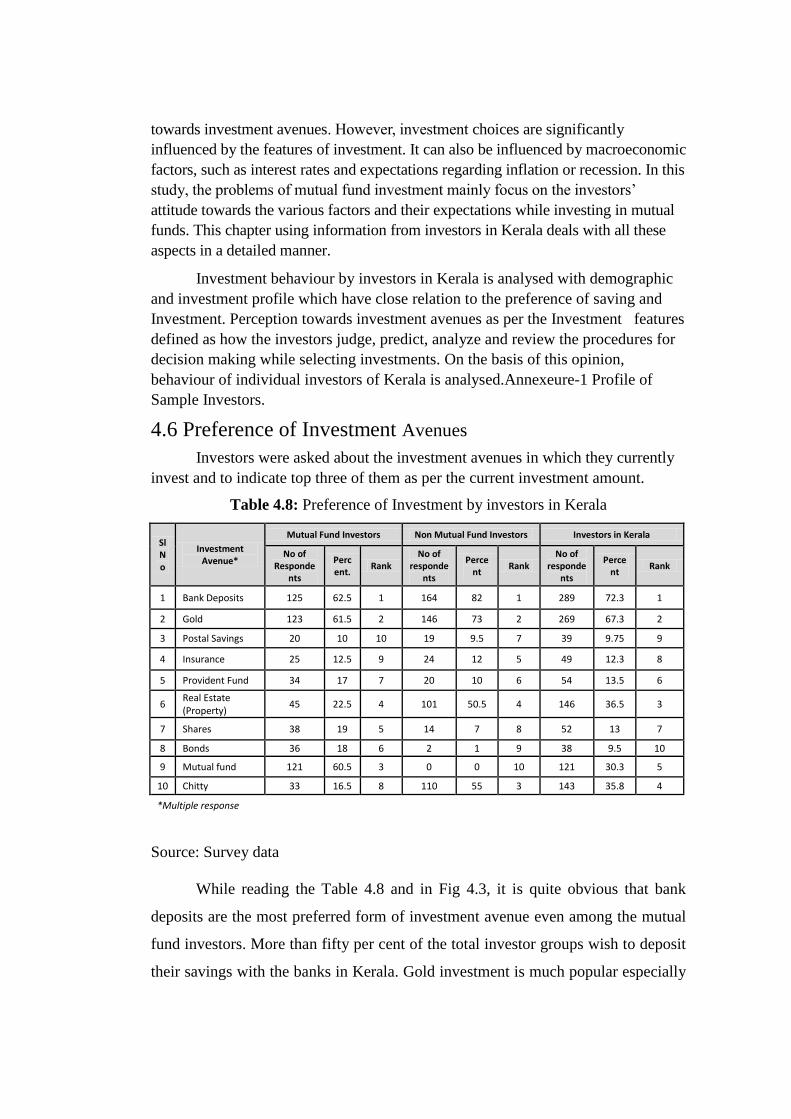
towards investment avenues. However, investment choices are significantly
influenced by the features of investment. It can also be influenced by macroeconomic
factors, such as interest rates and expectations regarding inflation or recession. In this
study, the problems of mutual fund investment mainly focus on the investors‟
attitude towards the various factors and their expectations while investing in mutual
funds. This chapter using information from investors in Kerala deals with all these
aspects in a detailed manner.
Investment behaviour by investors in Kerala is analysed with demographic
and investment profile which have close relation to the preference of saving and
Investment. Perception towards investment avenues as per the Investment features
defined as how the investors judge, predict, analyze and review the procedures for
decision making while selecting investments. On the basis of this opinion,
behaviour of individual investors of Kerala is analysed.Annexeure-1 Profile of
Sample Investors.
4.6 Preference of Investment Avenues
Investors were asked about the investment avenues in which they currently
invest and to indicate top three of them as per the current investment amount.
Table 4.8: Preference of Investment by investors in Kerala
Sl No
Investment Avenue*
Mutual Fund Investors Non Mutual Fund Investors Investors in Kerala
No of Responde
nts
Percent.
Rank No of
respondents
Percent
Rank No of
respondents
Percent
Rank
1 Bank Deposits 125 62.5 1 164 82 1 289 72.3 1
2 Gold 123 61.5 2 146 73 2 269 67.3 2
3 Postal Savings 20 10 10 19 9.5 7 39 9.75 9
4 Insurance 25 12.5 9 24 12 5 49 12.3 8
5 Provident Fund 34 17 7 20 10 6 54 13.5 6
6 Real Estate (Property)
45 22.5 4 101 50.5 4 146 36.5 3
7 Shares 38 19 5 14 7 8 52 13 7
8 Bonds 36 18 6 2 1 9 38 9.5 10
9 Mutual fund 121 60.5 3 0 0 10 121 30.3 5
10 Chitty 33 16.5 8 110 55 3 143 35.8 4
*Multiple response
Source: Survey data
While reading the Table 4.8 and in Fig 4.3, it is quite obvious that bank
deposits are the most preferred form of investment avenue even among the mutual
fund investors. More than fifty per cent of the total investor groups wish to deposit
their savings with the banks in Kerala. Gold investment is much popular especially

among the non mutual fund investors (73 per cent).An important point to be noted
here is that lesser inclination to corporate securities by non mutual fund investors
may force them to abstain from mutual fund investments which are subject to
market fluctuations. But this is not true to mutual fund investors. Although, only a
quarter of them preferred to invest in equity shares or bonds, almost double of that
(30.3 per cent ) have found mutual funds as their favorite investment mode.
Fig-4.3 Preference of Investment by investors in Kerala
So the mutual funds and intermediaries should take initiation to create
investor awareness about the potentials of mutual fund investment and the
strategies that the fund managers pursued to manage the investment risk.
4.6.1 Investor Profile and Investment Preferences: Test of Association
The study previously mentioned that the investment preferences of investors
are significantly related to their demographic features which include investor
category, their residence region, income, age, gender and occupation. The
following section at first cross tabulates the data and thereafter conducts the test of
attributes using Chi square analysis.
4.6.2 Relationship between Investor Category and Preference of
Investment
For testing the association between investor category and their investment
preferences the following hypothesis were made.
289
269
39
49
54
146
52
38
121
143
0 100 200 300 400
Bank Deposits
Gold
Postal Savings
Insurance
Provident Fund
Real Estate
Shares
Bonds
Mutual fund
Chitty
Investors in Kerala
Investors inKerala

H0: There is no association between type of Investor and preference of Investment.
H1: There is association between type of Investor and preference of Investment.
Table 4.8: Association between Investor Category and Preference of Investment
Investor Category
Investment Avenues#
Sig.
Ban
k D
ep
osi
ts
Go
ld /
E -
Go
ld
PO
Sav
ings
/NSC
Insu
ran
ce
PP
F
Re
al E
stat
e
Shar
es
Bo
nd
s
Mu
tual
Fu
nd
s
Ch
itty
Non-MF investor
164
(82.0)
146
(73.0)
19
(9.5)
24
(12.0)
20
(10.0)
101
(50.5)
14
(7.0)
2
(1.00) 0(0)
110
(55.0) 347.099 .000*
MF Investor
125
(62.5)
123
(61.5)
20
(10.0)
25
(12.5)
34
(17.00)
45
(22.5)
38
(19.00)
36
(18.0)
121
(60.5)
33
(16.5)
#Multiple response
Note: Figures in parenthesis indicate per cent.
Source: Survey data *The Chi-square statistic is significant at the one per cent level.
Fig. 4. 4 Relationship of Investor Category and Preference of Investment
On looking across the columns of Table 4.8 and Fig.4.4, we came to know
that there is uniformity in pattern of investments by both groups. However a close
observation finds divergence in the magnitude of investments over various assets.
On account of this Chi square value found significant at one per cent level.
Accordingly we reject the null hypothesis and can infer that the investment
0
50
100
150
200Bank Deposits
Gold
Postal Savings
Insurance
ProvidentFund
Real Estate
Shares
Bonds
Mutual fund
Chitty
Non-MF investor
MF Investor
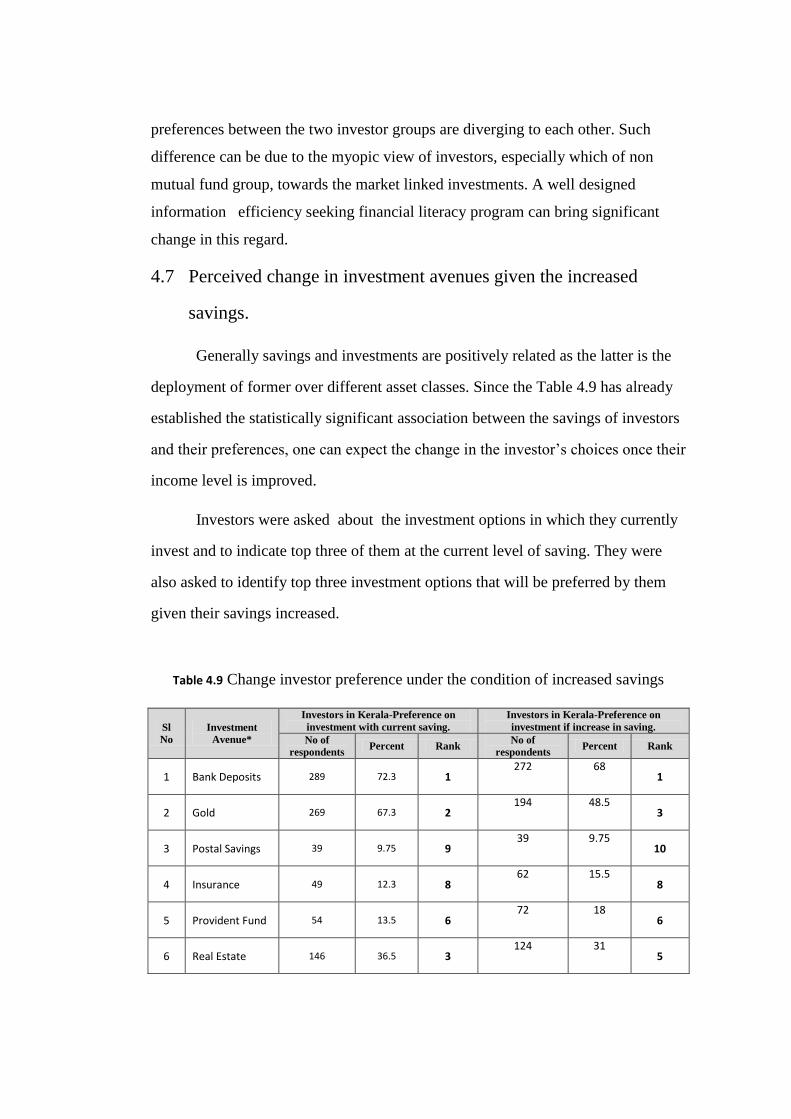
preferences between the two investor groups are diverging to each other. Such
difference can be due to the myopic view of investors, especially which of non
mutual fund group, towards the market linked investments. A well designed
information efficiency seeking financial literacy program can bring significant
change in this regard.
4.7 Perceived change in investment avenues given the increased
savings.
Generally savings and investments are positively related as the latter is the
deployment of former over different asset classes. Since the Table 4.9 has already
established the statistically significant association between the savings of investors
and their preferences, one can expect the change in the investor‟s choices once their
income level is improved.
Investors were asked about the investment options in which they currently
invest and to indicate top three of them at the current level of saving. They were
also asked to identify top three investment options that will be preferred by them
given their savings increased.
Table 4.9 Change investor preference under the condition of increased savings
Sl
No
Investment
Avenue*
Investors in Kerala-Preference on
investment with current saving.
Investors in Kerala-Preference on
investment if increase in saving.
No of
respondents Percent Rank
No of
respondents Percent Rank
1 Bank Deposits 289 72.3 1 272 68
1
2 Gold 269 67.3 2 194 48.5
3
3 Postal Savings 39 9.75 9 39 9.75
10
4 Insurance 49 12.3 8 62 15.5
8
5 Provident Fund 54 13.5 6 72 18
6
6 Real Estate 146 36.5 3 124 31
5

7 Shares 52 13 7 128 32
4
8 Bonds 38 9.5 10 65 16.25
7
9 Mutual fund 121 30.3 5 201 50.25
2
10 Chitty 143 35.8 4 43 10.75
9
**Multiple response
Source: Survey data
Fig. 5.9 Change investor preference under the condition of increased savings
Table 4.9 and Fig.5.9, compares the investment preferences at the current
savings with that at the increased savings. On observing the investor responses we
can find changes in the investment choices of investors at the increased savings
level. More number of investors who have given much importance to relatively risk
free assets like bank deposits, gold investments and post office savings earlier, are
now come forward to invest in market linked assets like shares, bonds and mutual
funds. An outstanding observation that the study made here is that the people who
are willing to invest in mutual funds are almost doubled from the previous level. A
close observation reveals that most of the potential investors to the fund investment
0
50
100
150
200
250
300
BankDeposit
s
Gold
PostalSavings
Insurance
Provident Fund
RealEstate
Shares
Bonds
Mutualfund
Chitty
Investors in Kerala-Preference oninvestment withcurrent saving.
Investors in Kerala-Preference oninvestment if increasein saving.

are from Chit schemes. This finding indeed helpful to make a deduction that the
investors in Kerala not preferring fund investments not simply because of their risk
perception, but may be due to non availability of schemes that has a perfect match
with their savings conditions. This information is highly imperative for fund
managers to design their schemes in more customised form for penetrating deep in
to the untapped potentials of mutual fund markets in Kerala.
Paired sample test or dependent sample t test has been administered for
testing the significance of change in investor preference towards each of the asset
class considered. Here we take the null hypothesis of:
Ho: µd =0 against that alternative hypothesis of µd > 0 .Here, d denotes the
difference in scores by two investment preference.
The test Statistics are reported in Table 4.10
Table 4.10 Change in investor preference at the increased saving level:
Paired t test results.
Investments
Investors in Kerala- Mean Preference on
investment with current saving.
Investors in Kerala- Mean Preference on
investment if increase in saving.
Mean Difference
t Sig.
Pair 1-Bank Deposits 0.49 0.68 -.188 -6.701 0.000*
Pair 2-Gold 0.55 0.49 0.060 2.240 0.026*
Pair 3-Postal Savings 0.22 0.10 0.125 5.738 0.000*
Pair 4-Insurance 0.22 0.16 0.063 2.801 0.005*
Pair 5-Provident Fund 0.27 0.18 0.085 3.597 0.000*
Pair 6-Real Estate 0.35 0.31 0.042 1.385 0.167
Pair 7-Shares 0.18 0.32 -.140 -5.378 0.000*
Pair 8-Bonds 0.16 0.16 -.005 -.283 0.778
Pair 9-Mutual fund 0.21 0.50 -.293 -12.003 0.000*
Pair 10-Chitty 0.36 0.11 0.250 10.357 0.000*
Source: Survey data
*Significant at five per cent level
Thus on interpreting the results of t test, it is very clear that the change in
investor preference at the increased savings conditions are statistically significant at
the level prescribed. This is true in all case of investments and confirms the
conclusions that we made the analysis as per Table 4.10.
Paired Samples t-test has compared the Investor preference at two savings level
i.e. preference on investment with current saving and preference on investment at the
increased savings level. Here the negative t value means that the mean preference on
investment with current savings is higher than the mean preference on investment if
there is increase in savings. The positive t value shows that the mean preference on
investment at the increased savings level is higher than that at the current savings level.
The preference of Mutual Fund shows positive t value i.e. Preference on Mutual Fund
will increase when saving increases. Investment in chitty shows negative t value, so
preference on chitty will reduce even though saving increases. Paired Samples t-test
results reported in the Table 5.10 also agree with the significance of difference among
the change in investor preference at the increased saving level.
4.8 Investor‟s priorities over investment features of Mutual
fund.
Investment portfolio building pre demands the assessment of return, risk and
liquidity associated with each of the investment options by investors. Once the
investors successfully complete, the process then only can easily develop the
portfolios of different types which can fulfill their requirements. Portfolio
development mainly involves finding how much proportion of the disposable
income should be invested into different investment options so that it can give
required return at required time with the lowest possible risk. An investor's
interaction with a mutual fund begins with the initial purchase or investment and
end with redeem the investment. Mutual funds enable such interaction by providing
various services to investors. Minimizing risk (ensuring safety) and maximizing
return are the two basic criteria that are given highest weightage while designing
services specifications as a rational investor. Investor‟s knowledge about capital
market volatility and AMCs ability to control risk involved in mutual funds plays a
dominating role in determining their satisfaction level.
The variation in response of investors with respect to investment features in
ten investment option (Table 5.14 of previous chapter) shows the variation of

investor‟s perception towards various investment avenues. One of the big
challenges in the Kerala context has been the weaning of the household from real
assets such as gold and real estate, both of which are used as insurance and
investment vehicles, towards formal sector finance. The dissimilarity in responses
of investors towards various investment avenues leads to analyse whether such
perceptual difference prevailing in Mutual fund investment also.
In order to measure the investor‟s priorities over investment features of Mutual
fund, six investment features, such as safety, liquidity, return, tax saving, Govt.
regulation and service are considered and these variables were measured on a five
point Likert-type scale ranging from „least requirement‟ to „most requirement‟. The
investors are asked to respond in terms of their expectation from fund investment.
Here t test is used to compare the means of Mutual Fund Investors and Non
Mutual Fund Investors perception towards the priorities of investment features
H0:µ1=µ2
H1: Two means are not equal i.e. µ1≠µ2
Table 4.12 Investor‟s expectation about investment features of Mutual fund.
Sl.No. Investment features Mean Score
t Sig. (2-tailed) MFI NMFI
1 SAFETY 2.78 3.45 -5.096 .000*
2 LIQUIDITY 2.84 2.80 .245 .807
3 RETURN 3.51 2.86 4.806 .000*
4 TAX SAVING 2.78 2.86 .610 .542
5 GOVT.REGULATION 2.80 3.16 -2.734 .007*
6 SERVICE 3.45 2.72 5.622 .000*
*Significant at one per cent level. Source: Survey data
The result in Table 4.12 shows the average perception on various features
needed in mutual fund investment or requirements i.e. Safety, Liquidity, Return,
Tax saving, Govt. regulation and Service.
Tables 4.12 compare the mean expectation score of MFIs and NMFIs about
the various investment features of mutual funds. When MFIs expect more returns
and better investor service from the prospective fund schemes, NMFIs demand
more safety and government regulations. Since most of the fund schemes are liquid
in nature, both of the investor groups do not expect further improvement in this
regard. Independent sample t test is used to find the statistical significance of
difference between the mean perception score of the two investor groups.
Since the p value in all these cases are less than one per cent, the assumed
level of significance, the hypothesis for equality in the mean rating on safety,
return, Govt. regulation and service are rejected in favour of the alternative
hypothesis that the requirement of these factors in Mutual fund investment by both
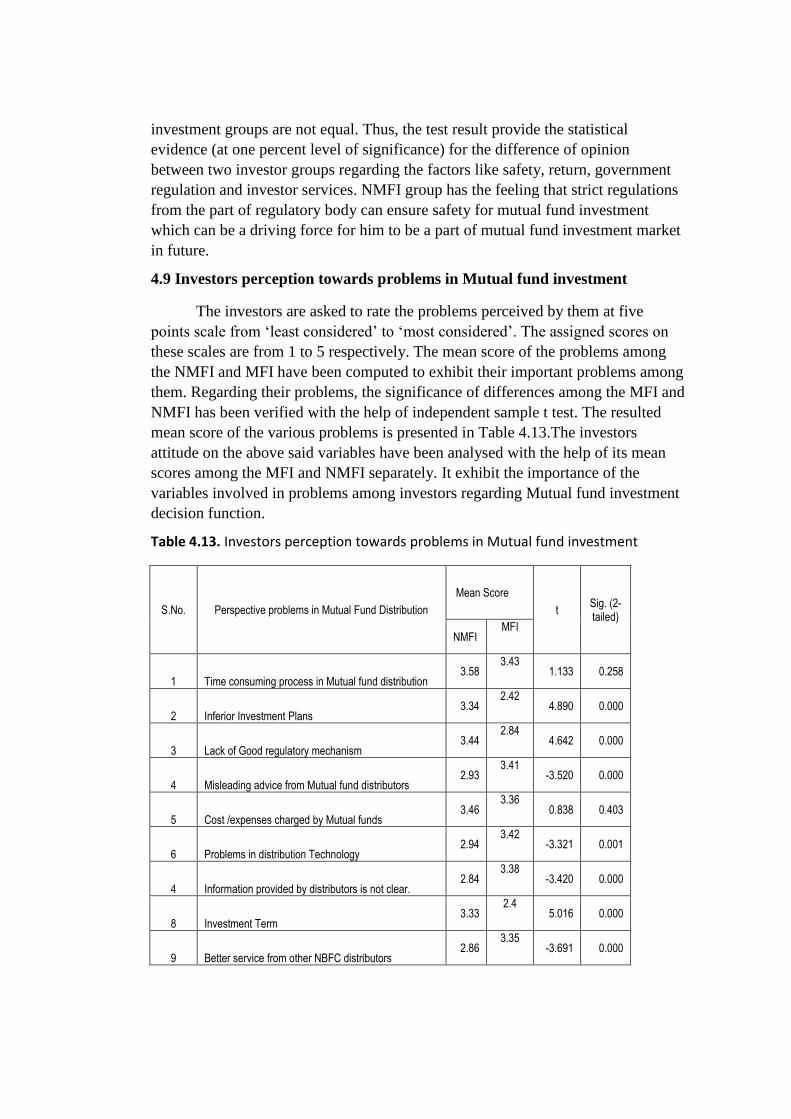
investment groups are not equal. Thus, the test result provide the statistical
evidence (at one percent level of significance) for the difference of opinion
between two investor groups regarding the factors like safety, return, government
regulation and investor services. NMFI group has the feeling that strict regulations
from the part of regulatory body can ensure safety for mutual fund investment
which can be a driving force for him to be a part of mutual fund investment market
in future.
4.9 Investors perception towards problems in Mutual fund investment
The investors are asked to rate the problems perceived by them at five
points scale from „least considered‟ to „most considered‟. The assigned scores on
these scales are from 1 to 5 respectively. The mean score of the problems among
the NMFI and MFI have been computed to exhibit their important problems among
them. Regarding their problems, the significance of differences among the MFI and
NMFI has been verified with the help of independent sample t test. The resulted
mean score of the various problems is presented in Table 4.13.The investors
attitude on the above said variables have been analysed with the help of its mean
scores among the MFI and NMFI separately. It exhibit the importance of the
variables involved in problems among investors regarding Mutual fund investment
decision function.
Table 4.13. Investors perception towards problems in Mutual fund investment
S.No. Perspective problems in Mutual Fund Distribution
Mean Score
t Sig. (2-tailed)
NMFI MFI
1 Time consuming process in Mutual fund distribution 3.58
3.43 1.133 0.258
2 Inferior Investment Plans 3.34
2.42 4.890 0.000
3 Lack of Good regulatory mechanism 3.44
2.84 4.642 0.000
4 Misleading advice from Mutual fund distributors 2.93
3.41 -3.520 0.000
5 Cost /expenses charged by Mutual funds 3.46
3.36 0.838 0.403
6 Problems in distribution Technology 2.94
3.42 -3.321 0.001
4 Information provided by distributors is not clear. 2.84
3.38 -3.420 0.000
8 Investment Term 3.33
2.4 5.016 0.000
9 Better service from other NBFC distributors 2.86
3.35 -3.691 0.000

10 Less Liquidity 3.45
2.94 3.444 0.000
11 New and private sector mutual funds are not safe 2.90
2.85 0.382 0.403
12 High risk 3.45
2.86 4.490 0.000
13 Mutual funds are not able to satisfy the investors’ confidence in distributors
3.29 3.43
-1.144 0.253
14 Lack of assistance in mutual fund transaction 2.81
3.34 -3.841 0.000
15 Inefficient fund Managers 3.56
3.44 0.418 0.443
Source: Survey data
While comparing the mean score indicating the problems perceived by
MFIs and NMFIs with regard to mutual fund investments more divergence than
convergence among investors are quite evident .MFIs faced some problems at
aggravate level which include time taken in fund distribution, misleading advice
from mutual fund distributors, incidental cost and expenses charged, abstract
information from the distributors and poor services from distributors compared to
other NBFCs. NMFI have apprehension about the time consuming process in fund
distribution , the cost and expenses charged, fail to win investor confidence and
inefficient fund management. They have showed their reluctance to invest because
of inferior investment plans, absence of good regulatory mechanism, inappropriate
investment term, less chance for recovery of investment amount without loss and
high risk associated with the fund investments. Based on the facts, it appears that
investors have distinct problems with mutual fund investments. When MFIs
expected problems mainly associated with fund distribution, NMFIs, who can be
potential investors perceive the inefficient investment plan, lack of protection and
high risk element as the problems connected with mutual fund investment.
4.10 Prospects of Mutual Fund Investments in Kerala
Mutual funds offer varied benefits to investors through professional and
sound fund management. Thus mutual funds reduce the risk and yield
comparatively high rate of return. Investments in mutual fund are also being
depended on many environmental factors. There should be an environment

conducive for the growth of capital market investors in a country. More over many
of the potential investors expect better service from the funds once they go for
investment. They will have certain expectation on different dimensions of fund
performance which might be satisfied at the real market place. Once mutual fund
companies have identified the investor expectations and decided to perform
according to the level of expectation, then they should analyse the prospects for the
growth of the fund. The prospects will be indirectly analysed by examining the
proportion of non mutual fund investors, i.e. potential investors who are ready to
become mutual fund investors once their requirements are promised to be satisfied
by the fund managers.
4.10.1 Prospective features in Mutual Fund Investment
Prospective features in Mutual Fund investment are the expectations that
motivate the investor to prefer the mutual fund investments. It is analysed with the
help of exploratory factor analysis. The score of all the 15 features given by the
investors have been included for the factor analysis. The ultimate aim of the factor
analysis is to identify the key factors influencing the prospects of mutual Fund
investment or fund selection behaviour.
4.10.2 Factors influencing the prospects of mutual Fund Investment
The factors considered for selecting mutual funds are narrated with the help
of factor analysis. The Mutual Fund attributes were measured through a five point
Likert-type scale ranging from „low expectation‟ to „high expectation‟. The
identified 15 prospective features in Mutual Fund affecting selection of mutual
fund schemes are analysed using Principal Component Analysis, with the objective
to identify the factors influencing the prospects of mutual fund investment. Before
conducting the factor analysis, Kaiser-Meyer-Olkin test and Bartlett's Test of
Sphericity measure of sampling adequacy were used to examine the
appropriateness of factor analysis.
The approximate chi-square statistic for the Bartlett's Test of Sphericity is
6454.588 with 105 degrees of freedom, which is significant at five per cent level
(Table-4.14). The KMO statistic (0.495) is also significantly large (>0.5). Hence,
factor analysis is considered as an appropriate technique for further analysis of
data.
Table 4.14: KMO and Bartlett's Test of Sphericity
Kaiser-Meyer-Olkin
Measure of Sampling
Adequacy.
Bartlett's Test of
Sphericity p value
(Approx. Chi-Square
value)
0.483 4244.319 0.000*

*Significant at one per cent level
Source: Survey data
Table 4.15 gives the total variance contributed by each component with
Eigen values. The factor frame work retain only factors with Eigen values greater
than one and other factors are not included in this model. It is possible to select
weights or factor coefficients so that first factor explains the largest portion of total
variance i.e.46.026.Accordingly five factors were emerged out on the base of
variance. The first factor accounts for 34.24 per cent of the total variance followed
by 14.49 per cent by second factor. The remaining three factors were contributed to
the total variance almost at same scale or at 4 to 8 per cent.
An important out put from the factor analysis is the factor matrix also called
the factor pattern matrix. The factor matrix contains the coefficients used to express
the standardised variables in terms of factors. The factor matrix formed for the
analysis is Table 4.16 which explains the main factors, explaining the selection of
mutual fund products in future according to perspective of investors in Kerala.
From the table it is very clear that Factor 1 has high coefficients for variables one
to three. This factor may be labeled as “fund promotion”. Factor 2 is highly related
with variables four to seven and the same may be labeled as “role of regulators.”
Factor 3 is positively closed with four variables which we called as “service of
mutual funds”. The last two factors, Factor 4 and Factor 5 constituted by two
variables each and they can be named as “fund performance” and “fund quality”
respectively. The detailed explanation of all the five factors are given in the
succeeding paragraphs.
Table 4.15: Total Variance Explained
Total Variance Explained
Component
Initial Eigenvalues Extraction Sums of Squared
Loadings
Rotation Sums of Squared
Loadings
Total
% of
Varian
ce
Cumulat
ive % Total
% of
Varian
ce
Cumula
tive % Total
% of
Variance
Cumulativ
e %
1- Fund Promotion 5.412 38.080 38.080 5.412 38.080 38.080 3.441 23.139 23.139
2- Role of Regulators 2.608 14.384 55.464 2.608 14.384 55.464 2.444 16.311 39.450
3-Service of mutual funds
1.319 8.496 64.263 1.319 8.496 64.263 2.352 15.681 55.131
4-Fund performance 1.245 8.300 42.563 1.245 8.300 42.563 2.302 15.349 40.480
5- Fund quality 1.012 6.444 49.304 1.012 6.444 49.304 1.324 8.824 49.304
6 .444 5.144 84.484
4 .502 3.345 84.829
8 .432 2.882 90.411
9 .325 2.165 92.846
10 .244 1.830 94.405
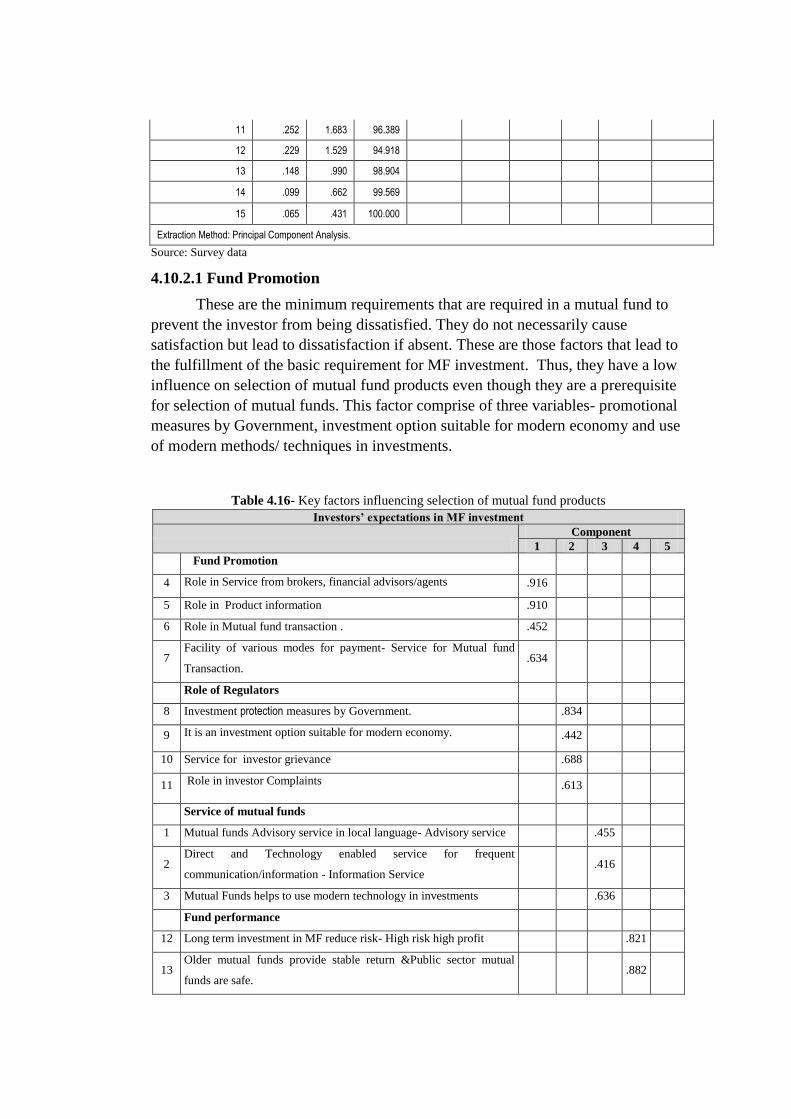
11 .252 1.683 96.389
12 .229 1.529 94.918
13 .148 .990 98.904
14 .099 .662 99.569
15 .065 .431 100.000
Extraction Method: Principal Component Analysis.
Source: Survey data
4.10.2.1 Fund Promotion
These are the minimum requirements that are required in a mutual fund to
prevent the investor from being dissatisfied. They do not necessarily cause
satisfaction but lead to dissatisfaction if absent. These are those factors that lead to
the fulfillment of the basic requirement for MF investment. Thus, they have a low
influence on selection of mutual fund products even though they are a prerequisite
for selection of mutual funds. This factor comprise of three variables- promotional
measures by Government, investment option suitable for modern economy and use
of modern methods/ techniques in investments.
Table 4.16- Key factors influencing selection of mutual fund products Investors’ expectations in MF investment
Component
1 2 3 4 5
Fund Promotion
4 Role in Service from brokers, financial advisors/agents .916
5 Role in Product information .910
6 Role in Mutual fund transaction . .452
7 Facility of various modes for payment- Service for Mutual fund
Transaction. .634
Role of Regulators
8 Investment protection measures by Government.
.834
9 It is an investment option suitable for modern economy.
.442
10 Service for investor grievance
.688
11 Role in investor Complaints
.613
Service of mutual funds
1 Mutual funds Advisory service in local language- Advisory service .455
2 Direct and Technology enabled service for frequent
communication/information - Information Service .416
3 Mutual Funds helps to use modern technology in investments .636
Fund performance
12 Long term investment in MF reduce risk- High risk high profit
.821
13 Older mutual funds provide stable return &Public sector mutual
funds are safe. .882

Fund quality
14 Investment distribution channels (e.g. Banks)
.951
15 Professional fund management
.629
Extraction Method: Principal Component Analysis.
Rotation Method: Varimax with Kaiser Normalization.
a. Rotation converged in 8 iterations.
Source: Survey data
4.10.2.2 Role of Regulators
These are the factors that lead to satisfaction if fulfilled and can lead to
dissatisfaction if not fulfilled. These include regulations in expert advice and
service from brokers‟ financial advisors/agents, product information, facilities for
various investment plans such as SIP, STP, SWP and Switches and in investor
Complaints.
4.10.2.3 Service provided by Mutual funds
These are the factors that lead to satisfaction if fulfilled and can lead to
dissatisfaction if not fulfilled. These include Mutual funds advisory service in local
language, direct and technology enabled service, frequent communication/
information, service for investor grievance, Facility of various modes for payment.
4.10.2.4 Fund performance
These are factors that increase the selection of mutual fund products if
fulfilled but does not cause dissatisfaction if not fulfilled. This include, long term
investment in Mutual fund, older mutual funds provide stable return & public
sector mutual funds are safe.
4.10.2.5 Fund quality
These are the factors that lead to satisfaction if fulfilled and can lead to
dissatisfaction if not fulfilled. These include investor protection through good
regulatory mechanism, Experience and professionalism of MF managers.
4.11 Prospects of Mutual Fund investment-Discriminant analysis.
The prospects of Mutual Fund investment in Kerala analysed through
Investors expectations in MF investment using factor loadings computed under
exploratory factor frame work. Once we identified the factors determining the
prospects of mutual fund investment, we should begin to find out the predictor
variables that are relatively better in discriminating the two investor groups, MFIs
and NMFIs, to classify an investor in to one of the two groups by a decision rule.
Accordingly using the same factor loadings extracted under exploratory factor
frame work as data inputs, a discriminant analysis model was framed out to find
out how do investors who have preference to mutual fund investment differ from

those who have not. In fact the analysis plan to estimate the percentage of
investors correctly classified as MFIs and NMFIs.
The discriminant analysis model involves linear combinations of the
following form.
D =b0+b1X1+b2X2+b3X3+……….bk nk
Where
D= Discriminant score
bs= Discriminant Coefficients
Xs=predictor or independent variable.
Discriminant analysis is used to predict group membership. The basic
principle underlying a discriminant model is to choose linear combinations of the
predictor variables that will maximise between group variance to within group
variance. It is a technique for analysing data when the criterion or dependent
variable is categorical and the predictor is or independent variables are metric.
Infact the linear contribution of predictor variables discriminate between the
categories of the dependent variables. As the two investor groups, the dependent
variables are in categorical form they are to be compared on the basis of the
loadings of five factors that are predictor variables in metric form. Fund promotion,
role of regulators, service of mutual funds, fund performance and fund quality are
the predictor variables in the model. However to know in which of the factors the
two investor group differentiate significantly, univariate F ratios has been
computed. The values of F statistics are presented in Table 4.17.
Table 4.17: Tests of Equality of Group Means- With factor scoring
S.L.No. Tests of Equality of Group Means
Prospective factors Wilks'
Lambda F df1 df2 Sig.
1 Fund Promotion 1.000 0.001 1 398 0.942
2 Role of Regulators 0.991 3.668 1 398 0.056
3 Service provided by Mutual Funds 0.968 13.364 1 398 0.000*
4 Fund Performance 0.936 24.269 1 398 0.000*
5 Fund Quality 0.960 16.545 1 398 0.000*
*At one per cent level Source: Survey data
It is observed from the table that the significant difference exists in the
variables of Role of Regulators, Service provided by Mutual Funds, Fund
Performance and Fund Quality at one per cent level.
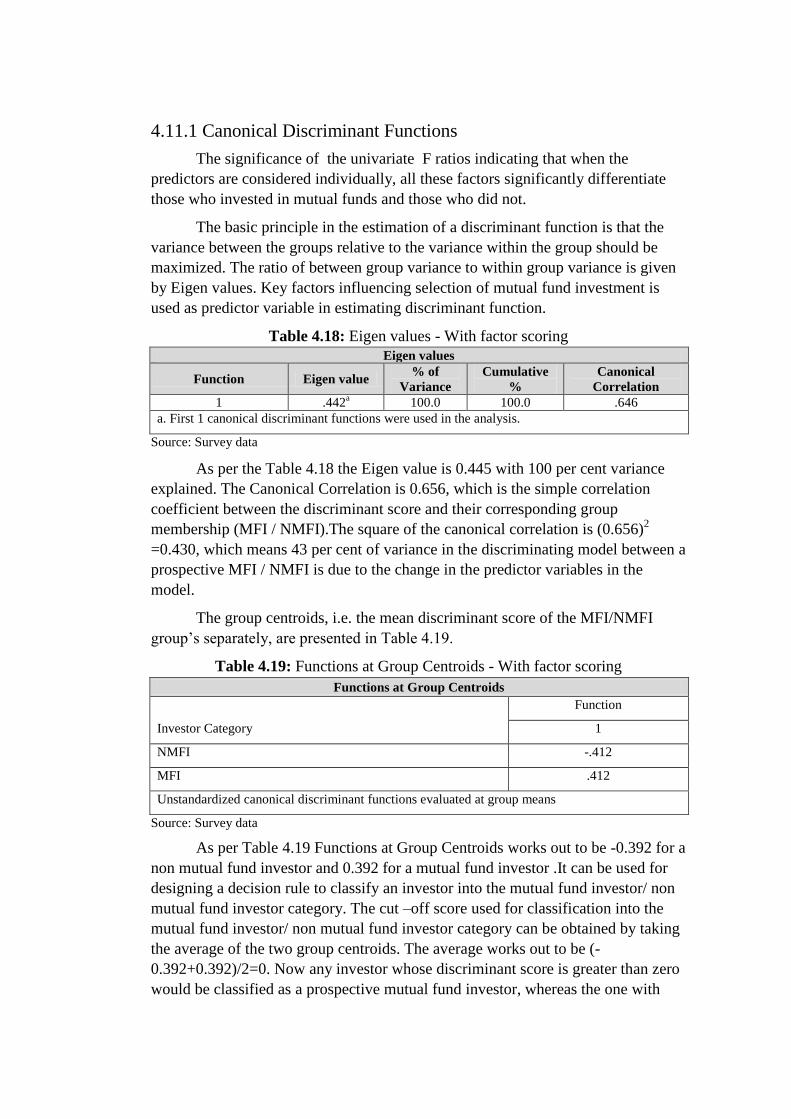
4.11.1 Canonical Discriminant Functions
The significance of the univariate F ratios indicating that when the
predictors are considered individually, all these factors significantly differentiate
those who invested in mutual funds and those who did not.
The basic principle in the estimation of a discriminant function is that the
variance between the groups relative to the variance within the group should be
maximized. The ratio of between group variance to within group variance is given
by Eigen values. Key factors influencing selection of mutual fund investment is
used as predictor variable in estimating discriminant function.
Table 4.18: Eigen values - With factor scoring
Eigen values
Function Eigen value % of
Variance Cumulative
% Canonical
Correlation 1 .442
a 100.0 100.0 .646 a. First 1 canonical discriminant functions were used in the analysis.
Source: Survey data
As per the Table 4.18 the Eigen value is 0.445 with 100 per cent variance
explained. The Canonical Correlation is 0.656, which is the simple correlation
coefficient between the discriminant score and their corresponding group
membership (MFI / NMFI).The square of the canonical correlation is (0.656)2
=0.430, which means 43 per cent of variance in the discriminating model between a
prospective MFI / NMFI is due to the change in the predictor variables in the
model.
The group centroids, i.e. the mean discriminant score of the MFI/NMFI
group‟s separately, are presented in Table 4.19.
Table 4.19: Functions at Group Centroids - With factor scoring
Functions at Group Centroids
Investor Category
Function
1
NMFI -.412
MFI .412
Unstandardized canonical discriminant functions evaluated at group means
Source: Survey data
As per Table 4.19 Functions at Group Centroids works out to be -0.392 for a
non mutual fund investor and 0.392 for a mutual fund investor .It can be used for
designing a decision rule to classify an investor into the mutual fund investor/ non
mutual fund investor category. The cut –off score used for classification into the
mutual fund investor/ non mutual fund investor category can be obtained by taking
the average of the two group centroids. The average works out to be (-
0.392+0.392)/2=0. Now any investor whose discriminant score is greater than zero
would be classified as a prospective mutual fund investor, whereas the one with

score less than zero would be classified as a non mutual fund investor. Therefore, it
may be inferred that a high score on Role of Regulators, Service provided by
Mutual Funds, Fund Performance and Fund Quality is likely to classify a
respondent into the mutual fund investor group.
Table 4.20: Wilks' Lambda - With factor scoring
Wilks' Lambda
Test of Function(s) Wilks' Lambda Chi-square Sig. 1 .346 62.291 .000*
*Significant at one per cent level
Source: Survey data
Wilks‟ lambda is the product of the univariate lambda for each function,
computed by finding the ratio of within –group sum of squares to total sum of
squarer‟s in a one way ANOVA where the dependent variable is the discriminant
score for each respondent and the predictor variable is the category (one or zero) to
which the respondent belongs. The value of Wilks‟ lambda is 0.356.The Wilks‟
lambda takes a value between 0 and 1 and lower the value of Wilks‟ lambda, the
higher is the significance of the discriminant function. The statistical test of
significance for Wilks‟ lambda is carried out with the chi-squared transformed
statistic, which is 115.236 (Table 4.20) at a p value of 0.000.Since the p value is
significant at one per cent level, it is inferred that the discriminant function is
significant.

Table 4.21: Standardized Canonical Discriminant Function Coefficients -
With factor scoring
S.L.No. Standardised Canonical Discriminant Function Coefficients
Prospective factors Function
1 Fund Promotion 0.005
2 Role of Regulators 0.240
3 Service provided by Mutual Funds 0.502
4 Fund Performance -0.694
5 Fund Quality 0.555
Source: Survey data.
Standardized Canonical Discriminant Function Coefficients helps to
interpret the discriminant coefficient exactly in the same way as a regression
coefficient. A small value of the discriminant coefficient means that the impact of a
unit change in a predictor variable is small in the discriminant function score. The
coefficients of standardized discriminant function are independent of the units of
measurements. The absolute values of the coefficients in standardized discriminant
function indicate the relative contribution of the variables in discriminating
between the two groups. Table 4.21 gives the standardized canonical discriminant
function coefficients. It indicates that Fund Quality is the most important factor,
which discriminates between the MF investor and Non Mutual Fund Investor
group, followed by Service Provided by Mutual Funds, Role of Regulators, Fund
Promotion and Fund performance.
Another way of finding the relative contributions of the predictor variables in
discriminating between the MF investor and Non Mutual Fund Investor group is
through comparing the structural coefficients of the predictor variables (Table 4.22).
Table 4.22: Structure Matrix- With factor scoring
S.L.No. Structure Matrix
Prospective factors Function
1 Fund Performance -.634
2 Fund Quality .494
3 Service provided by Mutual Funds .444
4 Role of Regulators .232
5 Fund Promotion .004
Pooled within-groups correlations between discriminating variables and standardized canonical
discriminant functions
Variables ordered by absolute size of correlation within function
Source: Survey data
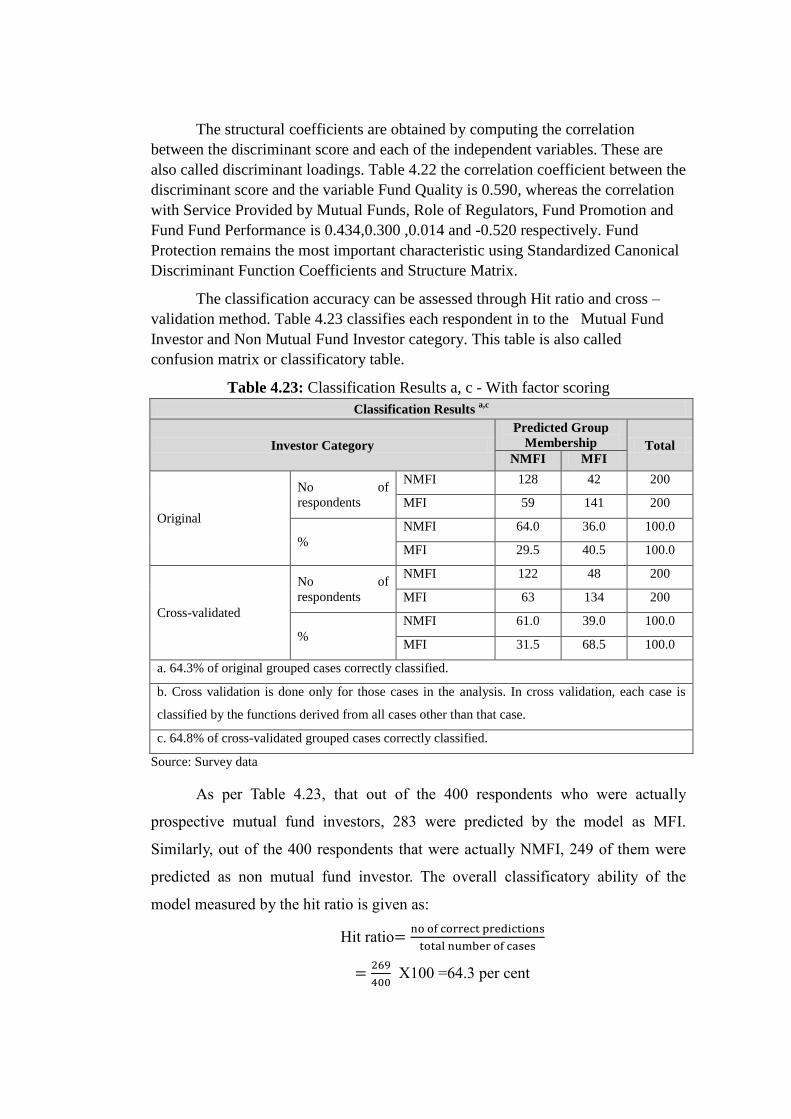
The structural coefficients are obtained by computing the correlation
between the discriminant score and each of the independent variables. These are
also called discriminant loadings. Table 4.22 the correlation coefficient between the
discriminant score and the variable Fund Quality is 0.590, whereas the correlation
with Service Provided by Mutual Funds, Role of Regulators, Fund Promotion and
Fund Fund Performance is 0.434,0.300 ,0.014 and -0.520 respectively. Fund
Protection remains the most important characteristic using Standardized Canonical
Discriminant Function Coefficients and Structure Matrix.
The classification accuracy can be assessed through Hit ratio and cross –
validation method. Table 4.23 classifies each respondent in to the Mutual Fund
Investor and Non Mutual Fund Investor category. This table is also called
confusion matrix or classificatory table.
Table 4.23: Classification Results a, c - With factor scoring
Classification Results a,c
Investor Category
Predicted Group
Membership Total NMFI MFI
Original
No of
respondents
NMFI 128 42 200
MFI 59 141 200
% NMFI 64.0 36.0 100.0
MFI 29.5 40.5 100.0
Cross-validated
No of
respondents
NMFI 122 48 200
MFI 63 134 200
% NMFI 61.0 39.0 100.0
MFI 31.5 68.5 100.0
a. 64.3% of original grouped cases correctly classified.
b. Cross validation is done only for those cases in the analysis. In cross validation, each case is
classified by the functions derived from all cases other than that case.
c. 64.8% of cross-validated grouped cases correctly classified.
Source: Survey data
As per Table 4.23, that out of the 400 respondents who were actually
prospective mutual fund investors, 283 were predicted by the model as MFI.
Similarly, out of the 400 respondents that were actually NMFI, 249 of them were
predicted as non mutual fund investor. The overall classificatory ability of the
model measured by the hit ratio is given as:
Hit ratio no of correct predictions
total number of cases
4 X100 =64.3 per cent
Thus, 66.5 per cent of original grouped cases correctly classified. As per
cross validation, each case is classified by the functions derived from all cases
other than that case. Cross validation is done only for those cases in the analysis
(leave one out classification).As per Table 4.23, 64.8 per cent of cross-validated
grouped cases correctly classified. So there are increased chances for more number
of NMFIs to be part of Mutual Fund market in Kerala provided the overall
performance of the Funds at par with the level expected by the investors.
4.12 Conclusion
This chapter discussed about the problems of mutual fund investments from
the perspectives of investors in Kerala. Using five point Likert Scale the study
collected responses regarding three dimensions of financial service industry-
Investor perception towards mutual fund investments, the role of intermediaries in
delivering services to investors and services rendered by mutual funds. The study
found that the existing mutual fund investors in Kerala demand increased return
and better investor services for their utility maximization in investment function.
Non mutual fund investors still found the mutual fund investments as highly risky
investments and its investor protection measures are not adequate. Fund
distribution is remained as a problem even to mutual fund investors of the state. A
good investment plan with customised and innovative features is highly essential
for the fund investments to penetrate deep in to the market. Priorities should be
given to the improvement in information services and grievance redressal services
rendered by mutual funds. The distribution network of the fund at present is urban
centered in Kerala, which should be expanded to rural Kerala also.
The prospects of Mutual fund investments in Kerala were analysed from the
investors point of view .The exploratory factor analysis administrated was able to
identify five important areas: Fund promotion, Role of regulators, Service of
mutual funds, Fund performance and Fund quality, where the mutual fund market
should make better their performance for expanding its investor base .However
difference exist in level of expectation of the present and potential investors.
Canonical discrimination function was successfully discriminated the two investor
groups at a greater scale with its lower Wilks lambda value. Fund quality is the
most important factor where the rate of discrimination was high followed by
mutual fund services and regulators roles. Innovative products with fewer risk,
speed and efficient grievance redressal together with imparting professionalism in
investor services definitely can find good market for mutual fund instruments in
Kerala given the buoyant capital market conditions of India.
………….………….

Chapter 5
Summary, Findings and Suggestions
5.1 Introduction
The heterogeneity amongst investors in terms of their perception
preferences and investment behaviour can be significant in identifying the
problems and prospects of mutual fund investment. Hence, the present study
attempts to analyse the investor behaviour and perception for assessing the
potentials of mutual fund investment in Kerala context.
This study is descriptive as well as exploratory in nature. The study
primarily based on the survey data collected from 400 sample individual investors
in Kerala through a self –administered questionnaire. Most of the qualitative
variables used in the study were measured on Likert type scaling techniques.
Individual investors in Kerala constitute the universe or population in this study. To
study the problems and prospects of Mutual fund investment Kerala, the opinions
of both Mutual Fund Investors (MFI) and Non Mutual Fund Investors (NMFI), are
considered. MFIs are investors who are living in Kerala and invested in mutual
fund schemes. NMFIs are investors who have not so far invested in mutual funds
but likely to invest in mutual funds in future.
The final sampling units of 200 MFIs were selected from the list provided
by AMCs‟ and was based on judgment sampling method. The sample of 200 NMFI
was selected using systematic random technique. The analytical methodology
covered wide range of statistical tools of parametric or non parametric nature. Chi
square analysis as a test of association of attributes has been extensively used in
this study. Independent sample t test verified the statistical significance of
differences in mean perception score of MFIs and NMFIs towards various aspects
of their investment programmes. Paired t test examined whether there was any
significant changes in investor preference at the increased savings levels.
Exploratory factor analysis was employed to reduce the number of
variables/statements representing various problems/prospective features of mutual
fund investments. Again using the same factor loading canonical discriminant
analysis predict the investment features in the order of their priority which possibly
included in the mutual fund innovation in future for canvassing more number of
investors from NMFI group to MFI group.
The prime objectives of the study include:
1. To identify the regulatory mechanism of Mutual fund.
2. To examine the public and private sector institutional participation.
3. To assess the investor behaviour and mutual help of investors and experts in
Mutual Fund Investment.
4. To study the extent of responsibility on the part of Mutual fund financial
institutions in the reduction of investor grievances.
5. To evaluate the service provided by Mutual fund financial institutions in
Kerala.
5.2 Regulatory mechanism of Mutual Fund
The legal and regulatory framework governing the mutual fund industry
includes the agencies that are involved in regulating various elements of the mutual
fund industry and the specific provisions that seek the protection of investor
interests. To improve the awareness investors can use the source of data published
by regulators in MF. The websites of AMFI and SEBI are sources of information
that investors can use in India.
The mean expectation score of MFIs and NMFIs about the various
investment features of mutual funds have compared. When MFIs expect more
returns and better investor service from the prospective fund schemes, NMFIs
demand more safety and government regulations. Independent sample t test results
provide the statistical evidence (at one percent level of significance) for the
difference of opinion between two investor groups regarding the factors like safety,
return, government regulation and investor services. NMFI group has the feeling

that strict regulations from the part of regulatory body can ensure safety for mutual
fund investment.
5.3 Public and Private Sector Institutional Participation
At the end of March 2015 the private sector mutual funds retained the
dominant place in the mutual fund industry with Rs. 917762 Crore Asset under
Management, and in Public sector mutual fund holds Rs. 164995 Crore Assets
Under Management.But Individual investors (50.2%) prefer to invest in public
sector sponsored mutual funds.
5.4 Investor Behaviour in Kerala
Bank deposits are the most preferred form of Investment Avenue even
among the mutual fund investors. More than fifty per cent of the total investor
groups wish to deposit their savings with the banks in Kerala. Gold investment is
much popular especially among the non mutual fund investors (73 per cent). Lesser
inclination to corporate securities by non mutual fund investors may force them to
abstain from mutual fund investments which are subject to market fluctuations. A
well designed information efficiency seeking financial literacy program can bring
significant change in this regard. These observations are statistically proved by the
result of Chi square analysis.
On comparing the investment preferences at the current savings with that at
the increased savings, we can find changes in the investment choices of investors at
the increased savings level. More number of investors who have given much
importance to relatively risk free assets like bank deposits, gold investments and
post office savings earlier, are now come forward to invest in market linked assets
like shares, bonds and mutual funds. Most of the potential investors to the fund
investment are from Chit schemes. This finding indeed helpful to make a deduction
that the investors in Kerala not preferring fund investments not simply because of
their risk perception, but may be due to non availability of schemes that has a
perfect match with their savings conditions. Paired Samples t-test results reported

also agree with the significance difference among the change in investor preference
at the increased saving level.
The mean expectation score of MFIs and NMFIs about the various
investment features of mutual funds have compared. When MFIs expect more
returns and better investor service from the prospective fund schemes, NMFIs
demand more safety and government regulations. NMFI group has the feeling that
strict regulations from the part of regulatory body can ensure safety for mutual fund
investment.
5.5 Problems of Mutual Funds
The problems faced by MFIs include Selection of mutual funds,Seletion of
mutual fund schemes, misleading advice from mutual fund distributors, incidental
cost and expenses charged and poor services from distributors compared to other
NBFCs.To solve or reduce these problems are the responsibility of Mutual Funds.
NMFI have apprehension about the time consuming process in fund distribution
and the cost and expenses charged. Moreover they perceive the inefficient
investment plan, lack of protection and high risk element as the problems
connected with mutual fund investment.
The problems related to mutual fund products are misleading advice from
Mutual fund distributors, Better service from chit fund /other NBFC distributors in
Kerala, financial sophistication about Mutual fund, Problems in Technology based
service from Mutual Funds. Mutual Funds are not able to satisfy the investors‟
expectations by maintaining credibility and confidence, avoiding delay in Mutual
fund distribution and adequate assistance in mutual fund transaction. The
significant difference among the MFI and NMFI have been identified in the case of
variables namely advice, service, information, technology and transaction. For the
two variables, time consuming process in fund distribution and failure of
distributors to win confidence of investors, there were no statistically significant
difference in mean perception score between two investor groups.
Cost /expenses charged by Mutual funds , High risk(Lack of safety), Less
Liquidity, Lack of Good regulatory mechanism, Inefficient fund Managers are
considered to be important by investors for making Mutual fund investment in
Kerala. Both MFIs and NMFIs have the same opinion that cost /expense charged
by the funds are high and the fund management in most firms is not much efficient.
Investment Term, Investment Plan, and new and private sector mutual funds
are not safe. The significant difference among the MFI and NMFI have been
identified in the case of variables namely Investment Term and Investment Plan,
where non mutual fund investors perceived the problem at higher level than mutual
fund investors. Sound investment plan together with an investment term tailored to
investor needs can overcome this issue.
5.6 Services for Mutual fund investment
Existing mutual fund investors give more weightage to information service
and investor grievance services. In fact advisory service and service for mutual
fund transaction are perceived at the same scale by both group of investors and the
same is measured at average rate. From the independent sample test results also, it
is much clear that investor differences exist in priorities for information and
grievance service by mutual funds in Kerala.
The services of intermediary at different roles are perceived relatively at
high level by mutual fund investors and their perceptions are almost evenly
distributed. Non mutual fund investors contradict with the response of mutual fund
investors in two areas advisory service and mutual fund transaction and the same is
statistically significant.
The study also examined the expectation of investors regarding the various
dimensions of mutual fund investments. The prospective features in Mutual Fund
affecting selection of mutual fund schemes are analysed using Principal
Component Analysis, with the objective to identify the factors influencing the
prospects of mutual fund investment. The KMO statistic (0.483) found is also
significantly large (>0.5). Hence, factor analysis as an appropriate technique for
further analysis of data.
Exploratory factor frame work has identified the five factors as the prime
area in which the mutual fund should exhibit superior performance. They include

fund promotion, role of regulators, service of mutual funds, fund performance and
fund quality.
Fund promotion is the minimum requirements that are required in a mutual
fund to prevent the investor from being dissatisfied. They have a low influence on
selection of mutual fund products even though they are a prerequisite for selection
of mutual funds.
Role of regulators are the factors that lead to satisfaction if fulfilled and can
lead to dissatisfaction if not fulfilled. These include, Investment protection
measures by Government, investment option suitable for modern economy ,
Service for investor grievance , Role in investor Complaints .
Service provided by Mutual funds include Mutual funds advisory service in
local language, direct and technology enabled service, frequent
communication/information, Mutual Funds helps to use modern technology in
investments
Fund performance include, long term investment in Mutual fund, older
mutual funds provide stable return & public sector mutual funds are safe.
Fund quality includes good distribution channels (e.g. Banks), Experience
and professionalism of mutual fund managers.
The study has identified the factors determining the prospects of mutual
fund investment and find out the predictor variables that are relatively better in
discriminating the two investor groups, using the same factor loadings extracted
under exploratory factor frame work as data inputs, a discriminant analysis model
was framed out to find out how do investors who have preference to mutual fund
investment differ from those who have not. As the two investor groups, the
dependent variables are in categorical form they are to be compared on the basis of
the loadings of five factors that are predictor variables in metric form. Fund
promotion, role of regulators, service of mutual funds, fund performance and fund
quality are the predictor variables in the model. Univariate F ratio found the
significant difference exists in the variables of Role of regulators, Service provided
by Mutual Funds, Fund Performance and Fund Quality at one per cent level.
The Canonical Correlation is 0.646, which is the simple correlation
coefficient between the discriminant score and their corresponding group
membership which indicates that significant amount of variance in the
discriminating model between a prospective MF investor/Non Mutual Fund
Investor is due to the change in the predictor variables in the model. Functions at
Group Centroids work out to be -0.412 for a Non Mutual Fund Investor and 0.412
for a mutual fund investor. It is inferred that a high score on Role of regulators,
Service provided by Mutual Funds, Fund Performance and Fund Quality is likely to
classify a respondent into the mutual fund investor group. Lower value of Wilks‟
lambda (0.346) indicates the significance of the discriminant function at higher
level. The statistical test of significance for Wilks‟ lambda found the discriminant
function is significant at one per cent level.
The standardized canonical discriminant function coefficients indicates that
Fund Quality is the most important factor, which discriminates between the MF
investor and Non Mutual Fund Investor group, followed by Service Provided by
Mutual Funds, Role of regulators, Fund Promotion and Fund performance. Fund
Protection or quality remains the most important characteristic using Structure
Matrix also. The overall classificatory ability of the model measured by the hit ratio
is 67.3 per cent and 64.8 per cent of cross-validated grouped cases correctly
classified. These findings imply that there are increased chances for more number
of NMFIs to be part of Mutual Fund market in Kerala provided the overall
performance of the Funds at par with the level expected by the prospective
investors.
5.7 Suggestions and Recommendations
Servicing the customers and guiding them to achieve their financial goals
shall determine the sustainability of mutual fund market in future. Investors should
be aware of the sectors in which they are investing and should have a clear outlook
on the performance of their investments, with all the risks explained. The financial
services landscape in India is transforming, with a plethora of changes taking place
at the regulatory front. Against this backdrop, mutual funds must re-structure their
existing businesses strategies to meet the changing needs of their clients and
provide them with complete investment solutions. Although emerging markets
such as India offer a wide range of investment choices, it is important to design
innovative products to fuel the growth of the mutual fund industry, particularly in
Kerala. Based on the findings and observations made through this study the
following suggestions are given.
5.7.1 Product Design
The study reveals that the investors are considering factors like service
quality and fund quality as the core of the product at the time of mutual fund
investments. Strong customer focus is essential in a market like Kerala where the
competition among financial market players is common. A prudent product design
with customised features spelt out in this research will make the new mutual fund
products attractive for the Keralites.
Mutual fund products need to be simplified if they have be sold to the
masses through a public sector bank channel. This is possible since most of the
people would like to make regular transactions with banks. The product needs to
copy a fixed deposit or chitty and provide a predictable income. Multiplicity of
products creates confusion in the mind of customers. Right products should be
offered to the right customers for which the funds need to reduce the number of
schemes through clubbing different ones with similar objectives. Multiple share
class structure, like that of chitty in Kerala, should be promoted for which the fund
managers need to enhance the potential of their systematic investment plans.
5.7.2 Use of Technology
Technological innovations like „Shared Services‟ can bring many
conveniences to the investors and allow Mutual Funds to significantly enhance
their reach and presence in the country. This shall help Funds to reach further to the
goals of retail penetration. Such initiative will also help to remove duplicities in the
system and reduce the inherent risks in the industry. It can enhance operational
efficiency and developing customer centric products with a focus on profitability
and better customer service.

Mobile phones and the internet in urban and rural areas can be used as a
platform to educate consumers regarding products and its benefits. Mobiles
powered with the internet can be used as an important information source for unit
holders and prospective investors. The usage of mobiles or tablets by sales
channels has far reaching effects and can be a facilitator to educating customers
about products, capturing information of investors in Kerala.
5.7.3 Investor Awareness
Lack of awareness and financial illiteracy is one of the major problems
identified in this study regarding mutual fund investments. Mutual funds should
realize that they need to invest in financial education and awareness in order to reap
long-term benefits. Campaigns to educate the investors should be conducted. Fund
houses may try to bring novelty to the way they connect with their target
customers. Regulators and agencies in Mutual fund industry also engaged in the
investor awareness Programme. Digital strategy can also use for creating financial
literacy among investors.
5.3 Conclusion
The study analysed the behaviour and perception of investors for looking
into the potentials of mutual fund investment in the state. Under a descriptive
research framework, through rigorous statistical procedures on the multiple
responses of 200 Mutual Fund Investors and 200 Non mutual Fund Investors, the
study was able to make out prolific findings relevant for the development and
growth of mutual fund market in Kerala.
Non mutual fund investors have lower inclination to corporate securities and
they have the feeling that mutual fund investments are risky. Inadequate investor
protection measures and imperfect market conditions are raised as the main factors
contributing risks to fund investments. Here the role of regulators is crucial. Fund
quality is remained as a problem even to mutual fund investors of the state. A good
investment plan with customised and innovative features is highly essential for the
fund investments to penetrate deep in to the market. Priorities should be given to
the improvement in services rendered by mutual funds. Such actions definitely
improve the investment conditions of mutual fund market in Kerala thereby the
growth of the sector.
Innovative products with fewer risk, speed and efficient grievance redressal
together with imparting professionalism in investor services definitely can find
good market for mutual fund instruments in Kerala given the buoyant capital
market conditions of India. Fund managers should understand the general investor
behaviour of Keralites and must trace out the forces restraining them to be the part
of the system. This shall help them to design fund schemes that has a perfect
match with the investor expectations. Policy makers of the country should draft
apposite policy framework conducive for the growth of mutual fund market in the
states like Kerala. Such initiatives at national level, at least partially, could address
the developmental issues of whole nation.
d. Contributions of the Study
The study makes the following contribution to Mutual funds, the mutual fund
regulators across India want to encourage the participation of individual investors
with mutual fund product. The small investors purchase behaviour does not have a
high level of coherence due to the influence of different purchase factors. The
factors identified in the study provide key information inputs regarding investor‟s
preferences and priorities that will guide future mutual fund product managers in
designing attractive mutual fund products for Keralites.
5.5 Scope for Further Research
1. To test the efficacy of behavioural finance theory postulates of Mutual Fund
investors on an Indian plat form.
2. Further research should be carried out in order to enhance the understanding
of the concepts of service quality and Investor satisfaction, how they are
measured because they are very important for mutual fund organizations in
terms of prospects of mutual fund investment.
………….………….

Annexure -1
PROFILE OF SAMPLE INVESTORS.
Table 5.1: Family Profile of investors
Factors MF Investors
Non-MF investors
Total
N % N % N %
Place
Rural 94 47.00 98 48.75 192 47.88
Urban 106 53.00 102 51.25 208 52.13
No of members in the family
<=3 30 15.25 35 17.50 65 16.38
4 102 51.00 91 45.25 193 48.13
4+ 67 33.75 75 37.25 142 35.50
Annual income
Low-Up to 4 lakh 48 24 34 17.25 82 20.63
Medium-Above 4 lakh
below 7 lakh 92 45.75 113 56.75 205 51.25
High- 7lakhs and above 61 30.25 52 26 113 28.13
Source: Survey data
Books and Journals
Bhalla V.K. (2007), Investment Management, New Delhi: S. Chand & Company
Ltd.
Agarwal, Vikas; Boyson, Nicole M.; Naik, Narayan Y, (2009) Hedge Funds for
Retail Investors? An Examination of Hedged Mutual Funds, Journal of
Financial & Quantitative Analysis, Vol. 44(2), pp. 273-305.
Ahmed Faisal and Ahuja Maneesh Kumar , (2006), Decision Function and the
Decisional Matrix for Mutual Fund Investment, Review of Professional
Management, Vol.4(2), pp.27-30.
Barber, B., Zheng, L., & Odean, T. (2005). Out of Sight, Out of Mind: The Effects
of Expenses on Mutual Fund Flows. Journal of Business, 2095‐2120.
Bello Zakri Y., (2005), Socially Responsible Investing and Portfolio Diversification,
The Journal of Financial Research, Vol. XXVIII (1), pp.41-57.
Chander Subhash and Singh Jaspal ,(2006) Investors‟ Preference for Investment in
Mutual Funds: An Empirical Evidence , The ICFAI Journal of Behavioural
Finance, Investment strategies for Individual Investors, pp.223-235.
Gangadhar V,(1992) The Changing Pattern of Mutual Funds in India, The
Management Accountant, Vol. 27 (12), pp. 924-28.
Gruber, Another Puzzle(1996) The Growth in Actively Managed Mutual Funds,
Journal of Finance Vol. LI (3), pp. 783-809.w
Gurunathan.K. Balanaga,(2007), An Investors‟ Requirements in Indian Securities
Market,Delhi Business Review, Vol. 8(10), p.39.
Khorana, A., Servaes, H., &Tufano, P. (2005). Explaining the Size of the Mutual
Fund Industry around the World. Journal of Financial Economics, Vol.50.
Mohanty Ajaykumar (2006), ABC of Mutual funds: The Indian Way, Portfolio
Organiser, Vol.7 (7), pp.45-51.
Muller, S., & Weber, M. (2010). Financial Literacy and Mutual Fund Investments:
Who Buys Actively Managed Funds? Schmalenbach Business Review, 126‐
153.
Nalini Prava Tripathy, (1996), Mutual Fund In India: A Financial Service In
Capital Market , Finance India, Vol. X(1), March, pp. 85–91.
Rajan,R.V., (1997), Investment Size Based Segmentation of Individual Investors,
Management Researcher, pp.21-28
Ramamurthy, B. M. and Reddy, S. (2005), Recent Trends in Mutual Fund Industry,
SCMS Journal of Indian Management, Vol. 39(2), pp. 45-53.
Selvaraj V., and Marammal Devi V, (2007), Performance of Mutual Funds, Facts
For You, Vol.27 (8), pp.31-34.
Singh, J. and Chander, S. (2004), An Empirical Analysis of Perceptions of
Investors towards Mutual Funds, Finance India, Vol:XVIII(4), pp.1673-
1692.
Sondhi, H. J. and Jain, P. K, (2005), Financial Management of Private and Public
Equity Mutual Funds in India: An Analysis of Profitability, The ICFAI
Journal of Applied Finance, Vol. 11(6), pp 14-27.
SurjitMohana,(2006), Mutual funds and Indian Capital Market, Portfolio
Organiser, Vol.7(8), pp.50-53.
Walia Nidhi and Kiran Ravi, (2009), An Analysis of Investor‟s Risk Perception
towards Mutual Funds Services, International Journal of Business and
Management,Vol.4(5), p.115.
Theses / Dissertation and Reports
Basil John Thomas (2013) Mutual Fund investors’ Behaviour in Kerala, School of
Management and Business Studies, Mahatma Gandhi University, Kottayam,
Kerala.
Confederation of Indian Industry ,CII 6th Mutual Fund Summit (2010),Price water
house Coopers (PwC-Price Waterhouse and Coopers & Lybrand to create
PwC) CII 6th
International conference 23 June 2010, Mumbai.

CRISIL Mutual Fund Ranking, December 2014,CRISIL Research.
Department of Posts (2014), Department of Posts ,Ministry of Communications
and Information Technology, Government of India-Annual Report.
Economic Review (2012), State Planning Board,Thiruvanathapuram, Kerala, India.
Economic Review (2014), State Planning Board, Thiruvanathapuram, Kerala,
India.
India Human Development Index Report (2004),Life Expectancy at Birth by
Gender, 1992 – 2004 Table 5A.10, page 287
India Post/Financial Services/Mutual Funds/List of Post Offices- http:
//www.indiapost.gov.in/MutualFunds_POs.aspx.-2015.
India Union Budget (2013),Key policy announcements in , India Union Budget
2013
Jangili Ramesh (2011) Causal Relationship between Saving, Investment and
Economic Growth for India – What does the Relation Imply? - Reserve Bank
of India Occasional Papers, Vol. 32(1).
Kapila Raj and Kapila Uma (Ed) 1998, „Indian Securities Market‟, Mutual Funds -
2000, SEBI Discussion paper.
Kerala Department of Economics and Statistics,(2014), Gross Domestic Product of
Kerala and India From 2004-05 TO 2012-13 (Base Year 2004-05)
Thiruvananthapuram 22.03.2014-Department of Economics & Statistics.
KSFE,2015, Annual Report on 2011-2012 published on 16.02.2015
Massa, M., Goetzmann, W. N., and Rouwenhorst, G. K. (1999). Behavioral Factors
in Mutual Fund Flows. Yale ICF Working Paper No. 00‐14.
National Council of Applied Economic Research-how households save and invest:
evidence from NCAER household survey- main report, sponsored by
Securities and Exchange Board of India (SEBI), July 2011.
Outlook India (2007). 16 July 2007
Price Waterhouse and Coopers and Lybrand, PWC, CII. (2013). Indian Mutual
Fund Industry: Unearthing the growth potential in untapped markets.
Mumbai: CII.r
Sasaki R., and Rathiha, R., (2008), „Mutual Funds and Investors interest‟, Paper
Presented at the First International Conference of KAAS, December 5-6,
Nagercoil
Saving and Investment survey (1983), Kerala State Planning Board.
SEBI (2014) Development Research Group Studies 2013 - 14, Securities and
Exchange Board of India: 66.
SEBI-2015, Annual Report 2014-15
Thompson, J., & Choi, S.‐M. (2001), Governance systems for collective investment
schemes in OECD countries. Paris: OECD.
United Nations Development Programme, (2011), Inequality-Adjusted Human
Development Index for India's States. Retrieved February 13, 2013.
World Fact book (2008). Central Intelligence Agency. March 2008.
Web Sources
AMFI (www.amfiindia.com)
BSE (www.bseindia.com)
Credence Analytics (www.credenceanalytics.com)
CRISIL (www.crisil.com)(www.crisil fundservices.com)
ICRA online at www.mutualfundsindia.com etc.
Lipper (www.lipperweb.com)
Morning Star (www.morningstar.com)
NSE (www.nseindia.com)
RBI (www.rbi.org.in)
SEBI (www.sebi.gov.in) - Mutual Funds Section
SEBI Annual Report 2013-14 and 2014-15
Value Research (www.valueresearchonline.com)

PROBLEMS &PROSPECTS OF MUTUAL FUND INVESTMENTS
A PERCEPTIVE STUDY ON KERALITES
Questionnaire for Investors
Name Place Schedule number
1 Rural
2 Urban
Part-I PERSONAL PROFILE
1. Age
2. Gender 1. Male 2. Female
3. Marital Status: 1. Married 2. Unmarried 3. Widowed
4. No of members in the family
5. Education 6.Occupation
7. Gross Annual income 8.Average Annual savings
SAVING AND INVESTMENT
9. How much do you invest annually?
10. Mark (Please (√) your preference for investment avenues.
No. Investments Mark your investment
(Top 3 option)
If your savings increases,
your preferred marking
(Top 3option)
1 Bank Deposits
2 Gold / E - Gold
3 PO Savings/NSC
4 Insurance
5 PF
6 Real Estate
7 Shares
8 Bonds
9 Mutual Funds

10 Chitty
Part –II
11. Please rate the requirement of following features in mutual funds while
selecting it. Please (√) tick the appropriate option.
No. Investment objectives and features
Requirement.
1 = Least; 2 = Low; 3 =
Moderate; 4 = High; 5 =
Most
1 Safety 1 2 3 4 5
2 Liquidity 1 2 3 4 5
3 Return 1 2 3 4 5
4 Tax Saving 1 2 3 4 5
5 Govt. Regulation 1 2 3 4 5
6 Service 1 2 3 4 5
12. Please rate the problems considered in mutual funds while selecting it. Please
(√) tick the appropriate option
No Perspective problems in Mutual Fund Investment
Considered
1 = Least; 2 = Low; 3
= Moderate; 4 =
High; 5 = Most 1 2 3 4 5
1 Time consuming process in Mutual fund distribution 1 2 3 4 5
2 Inferior Investment Plans 1 2 3 4 5
3 Lack of Good regulatory mechanism 1 2 3 4 5
4 Misleading advice from Mutual fund distributors 1 2 3 4 5
5 Cost /expenses charged by Mutual funds 1 2 3 4 5
6 Problems in distribution Technology 1 2 3 4 5
7 Information provided by distributors is not clear. 1 2 3 4 5
8 Investment Term 1 2 3 4 5
9 Better service from other NBFC distributors 1 2 3 4 5
10 Less Liquidity 1 2 3 4 5
11 New and private sector mutual funds are not safe 1 2 3 4 5
12 High risk 1 2 3 4 5
13 Mutual funds are not able to satisfy the investors‟
confidence in distributors. 1 2 3 4 5
14 Lack of assistance in mutual fund transaction 1 2 3 4 5
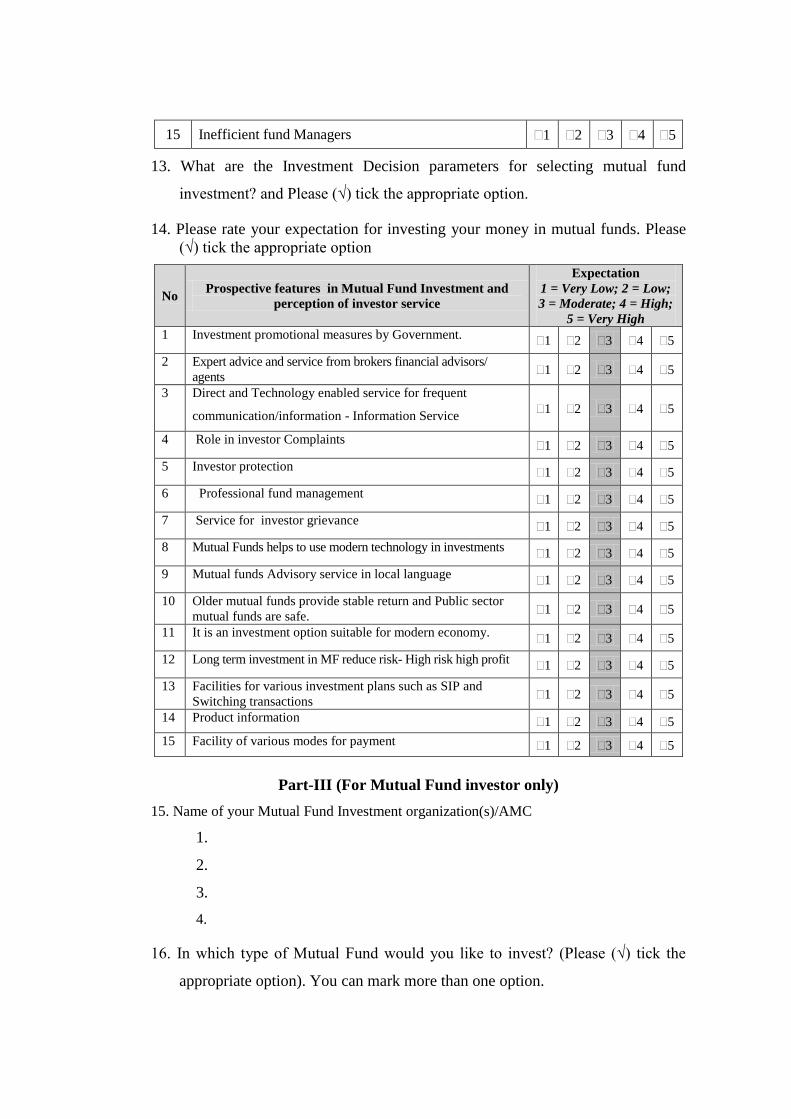
15 Inefficient fund Managers 1 2 3 4 5
13. What are the Investment Decision parameters for selecting mutual fund
investment? and Please (√) tick the appropriate option.
14. Please rate your expectation for investing your money in mutual funds. Please
(√) tick the appropriate option
No Prospective features in Mutual Fund Investment and
perception of investor service
Expectation
1 = Very Low; 2 = Low;
3 = Moderate; 4 = High;
5 = Very High
1 Investment promotional measures by Government. 1 2 3 4 5
2 Expert advice and service from brokers financial advisors/
agents 1 2 3 4 5
3 Direct and Technology enabled service for frequent
communication/information - Information Service 1 2 3 4 5
4 Role in investor Complaints 1 2 3 4 5
5 Investor protection 1 2 3 4 5
6 Professional fund management 1 2 3 4 5
7 Service for investor grievance 1 2 3 4 5
8 Mutual Funds helps to use modern technology in investments 1 2 3 4 5
9 Mutual funds Advisory service in local language 1 2 3 4 5
10 Older mutual funds provide stable return and Public sector
mutual funds are safe. 1 2 3 4 5
11 It is an investment option suitable for modern economy. 1 2 3 4 5
12 Long term investment in MF reduce risk- High risk high profit 1 2 3 4 5
13 Facilities for various investment plans such as SIP and
Switching transactions 1 2 3 4 5
14 Product information 1 2 3 4 5
15 Facility of various modes for payment 1 2 3 4 5
Part-III (For Mutual Fund investor only)
15. Name of your Mutual Fund Investment organization(s)/AMC
1.
2.
3.
4.
16. In which type of Mutual Fund would you like to invest? (Please (√) tick the
appropriate option). You can mark more than one option.

1. Debt funds 2. Equity funds 3. Hybrid funds (Balanced)
4. Liquid funds 5. ELSS Funds
6. Others (ETF, Fund of Funds investing overseas)
17. Suggestions, if any, for the betterment of mutual fund investments in your State:
___________________________________________________________________
___________________________________________________________________
___________________________________________________________________
___________________________________________________________________
………….………….