Problem: What is the phylogenetic history of the three species and seven populations of Gallotia...
10
The Biogeography of Gallotia lizards in the Canary Islands
-
Upload
ross-manning -
Category
Documents
-
view
228 -
download
5
Transcript of Problem: What is the phylogenetic history of the three species and seven populations of Gallotia...
The Biogeography of Gallotia lizards in the Canary Islands

Problem: What is the phylogenetic history of
the three species and seven populations of Gallotia lizards on the Canary islands?
Does the presence of four morphologically different populations of G. galloti on the four westernmost islands imply continuing evolution?
Task:Use data from geography, geological history, morphology (body size), and molecular genetics to develop answers to the study questions.
Part 1: Phylogeny based on geographic distance
Using Map 1, measure the distance in kilometers of each island to the mainland (Africa). List these distances on a separate page. Include the following islands: Lanzarote, Fuerteventura, Gran Canaria, Tenerife, Gomera, Palma, and Hierro.
Part 1
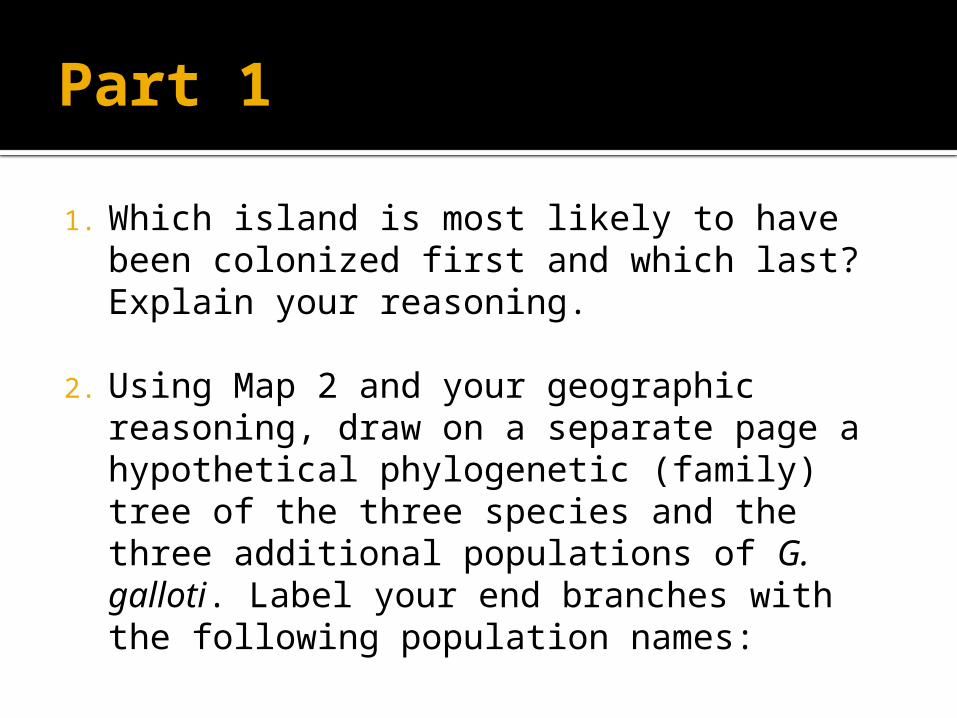
1. Which island is most likely to have been colonized first and which last? Explain your reasoning.
2. Using Map 2 and your geographic reasoning, draw on a separate page a hypothetical phylogenetic (family) tree of the three species and the three additional populations of G. galloti. Label your end branches with the following population names:

G. galloti populations G. atlantica G. stehlini G. galloti Tenerife G. galloti Palma G. galloti Gomera G. galloti Hierro
Part 2: Phylogeny Based On Geological History
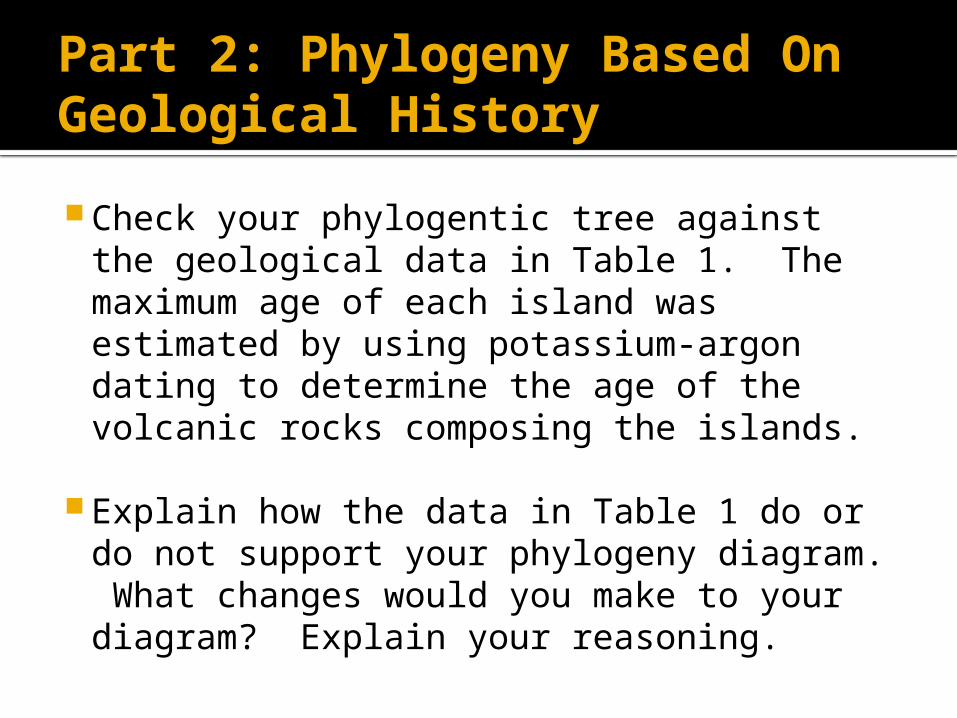
Check your phylogentic tree against the geological data in Table 1. The maximum age of each island was estimated by using potassium-argon dating to determine the age of the volcanic rocks composing the islands.
Explain how the data in Table 1 do or do not support your phylogeny diagram. What changes would you make to your diagram? Explain your reasoning.
Part 3: Phyologeny Based on Morphology
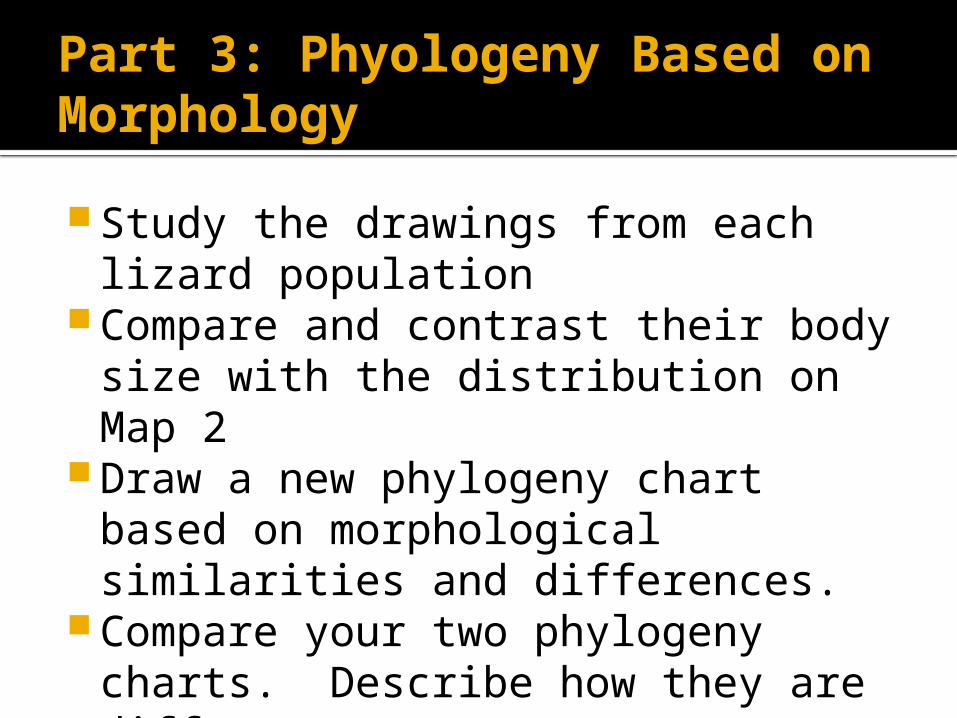
Study the drawings from each lizard population
Compare and contrast their body size with the distribution on Map 2
Draw a new phylogeny chart based on morphological similarities and differences.
Compare your two phylogeny charts. Describe how they are different.
Part 5: Phylogeny Based on Molecular Genetics
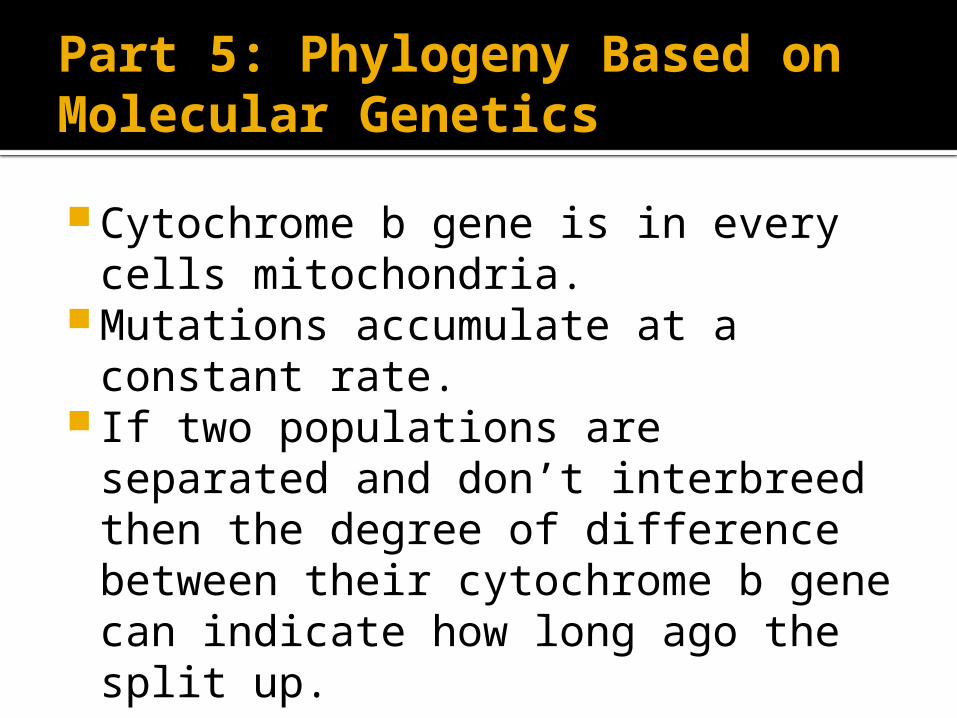
Cytochrome b gene is in every cells mitochondria.
Mutations accumulate at a constant rate.
If two populations are separated and don’t interbreed then the degree of difference between their cytochrome b gene can indicate how long ago the split up.
Part 5: Molecular genetics
Task:Count the differences between all
pairings of the seven populations and use that data to construct a final phylogenetic tree based on similarities and differences.