PROBLEM STATEMENTS IN PROBLEM-SOLVING, RtI PROCESSES FSSM Summer Institute, June 26, 2007 Charlotte...
33
PROBLEM STATEMENTS IN PROBLEM-SOLVING, RtI PROCESSES FSSM Summer Institute, June 26, 2007 Charlotte Smith, NCSP,[email protected]
-
Upload
jarod-race -
Category
Documents
-
view
213 -
download
0
Transcript of PROBLEM STATEMENTS IN PROBLEM-SOLVING, RtI PROCESSES FSSM Summer Institute, June 26, 2007 Charlotte...
PROBLEM STATEMENTS
IN PROBLEM-SOLVING,
RtI PROCESSES
FSSM Summer Institute, June 26, 2007Charlotte Smith, NCSP,[email protected]

2
INTRODUCTIONSWho I am.....Who are You?
Housekeeping…bathrooms, “Parking Lot”
What my colleagues and I have been doing on the other side of the state.
3
NEWS FROM OUT WEST Mid 1990’s North Kansas City School District:
Increasing commitment to early intervention and School-Based Problem Solving Teams
Mid 1990’s: General Educator hired as full-time district level problem solving team facilitator for training and support of gen ed staff
Steadily increasing # school psychologists to meet the NASP recommended 1:1000 ratio and serve on each PST; expanding role of school psychologists
Using 15% of IDEA money for prevention, early intervention. Ex: Subs for gen ed teachers to attend trainings, administer benchmark probes
4
…MORE NEWS
2005/2006: RtI replaces IQ/Achievement discrepancy in local compliance plan for SLD eligibility determination
CBM added to District Assessment Plan
CBM benchmarking for students and frequent Progress Monitoring used by teachers to monitor progress of children at risk, including progress toward iep goals for students with disabilities.
5
0
100
200
300
400
500
600
Referrals
SLD
ND
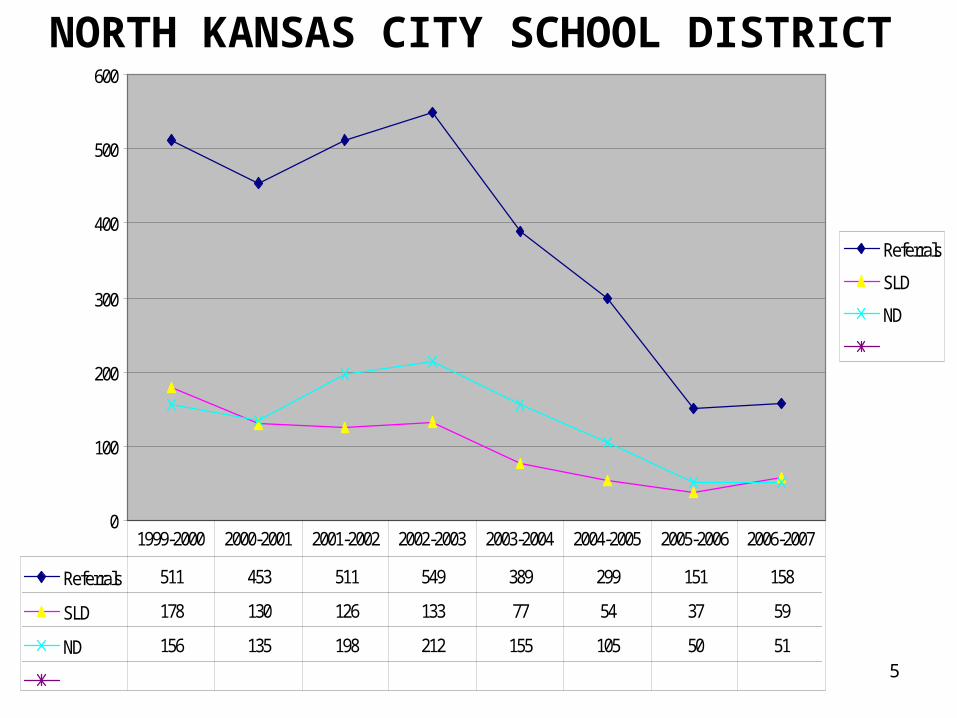
Referrals 511 453 511 549 389 299 151 158
SLD 178 130 126 133 77 54 37 59
ND 156 135 198 212 155 105 50 51
1999-2000 2000-2001 2001-2002 2002-2003 2003-2004 2004-2005 2005-2006 2006-2007
NORTH KANSAS CITY SCHOOL DISTRICT
6
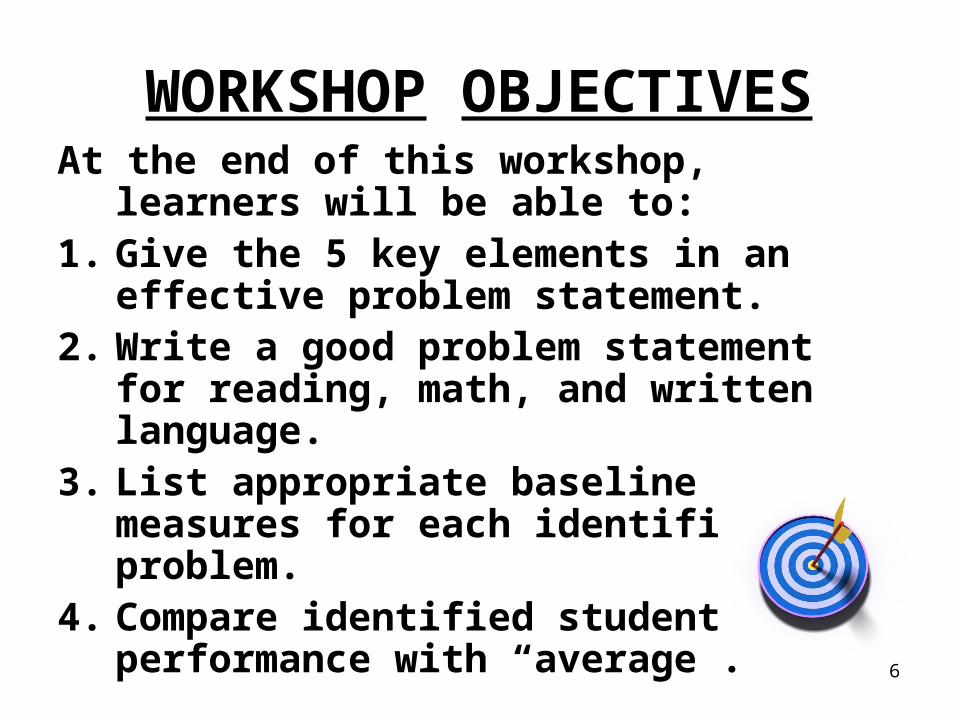
WORKSHOP OBJECTIVESAt the end of this workshop, learners will
be able to:1. Give the 5 key elements in an effective
problem statement.2. Write a good problem statement for
reading, math, and written language.3. List appropriate baseline measures
for each identified problem.4. Compare identified student’s
performance with “average”.
7
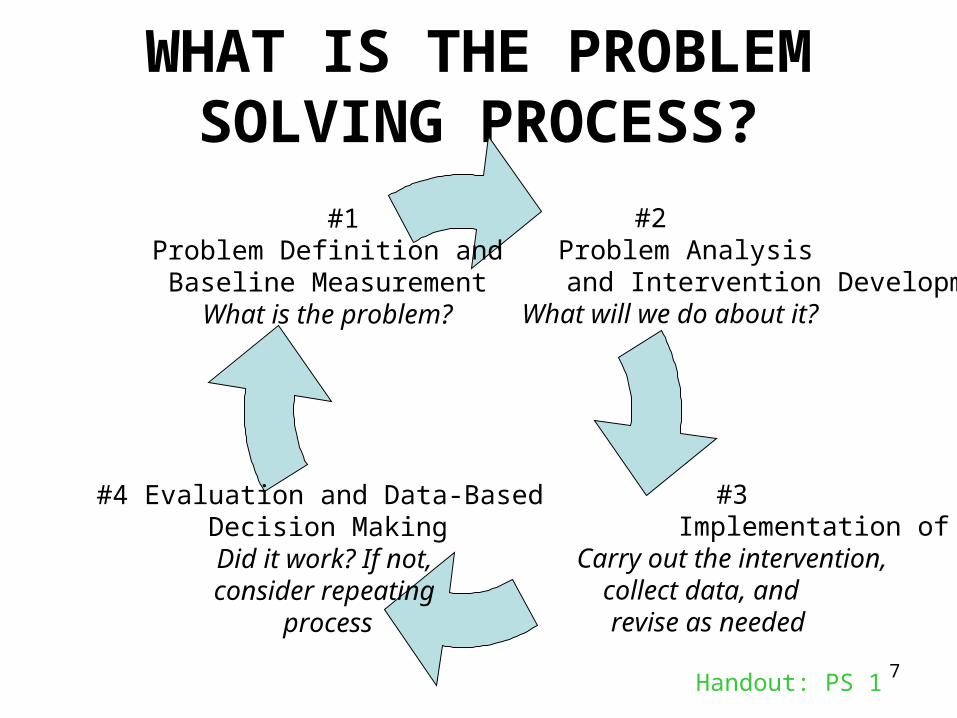
WHAT IS THE PROBLEM SOLVING PROCESS?
#2 Problem Analysis
and Intervention Development What will we do about it?
#3 Implementation of Interventions
Carry out the intervention, collect data, and
revise as needed
#4 Evaluation and Data-Based Decision Making
Did it work? If not, consider repeating
process
#1Problem Definition andBaseline MeasurementWhat is the problem?
Handout: PS 1

8
Team Activity: Problems Statements Then, Now & Future
9
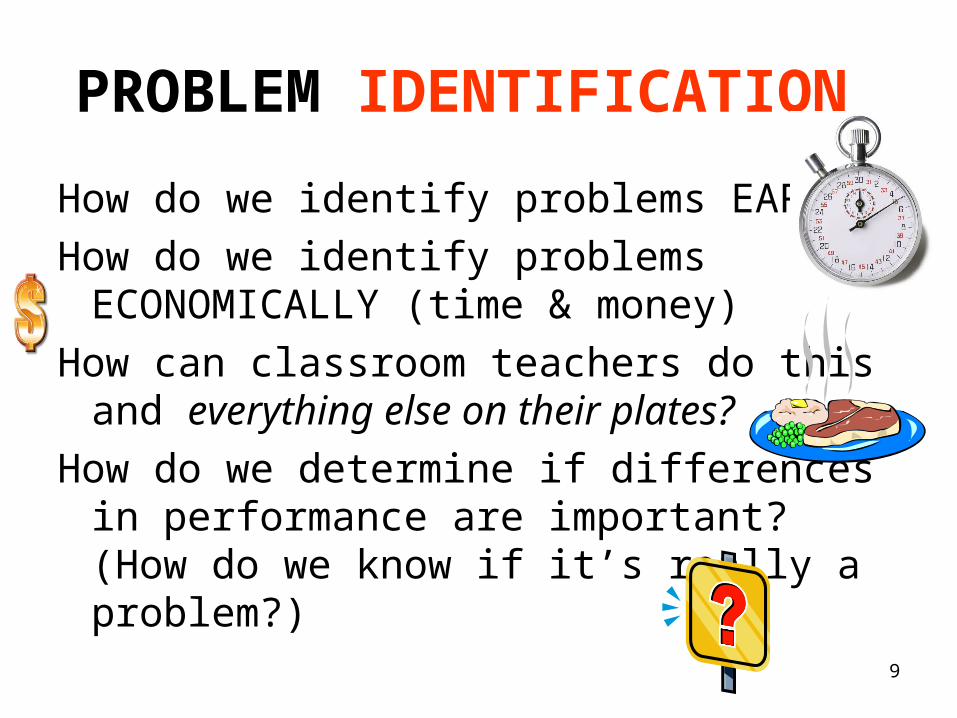
PROBLEM IDENTIFICATION
How do we identify problems EARLY?
How do we identify problems ECONOMICALLY (time & money)
How can classroom teachers do this and everything else on their plates?
How do we determine if differences in performance are important? (How do we know if it’s really a problem?)
10
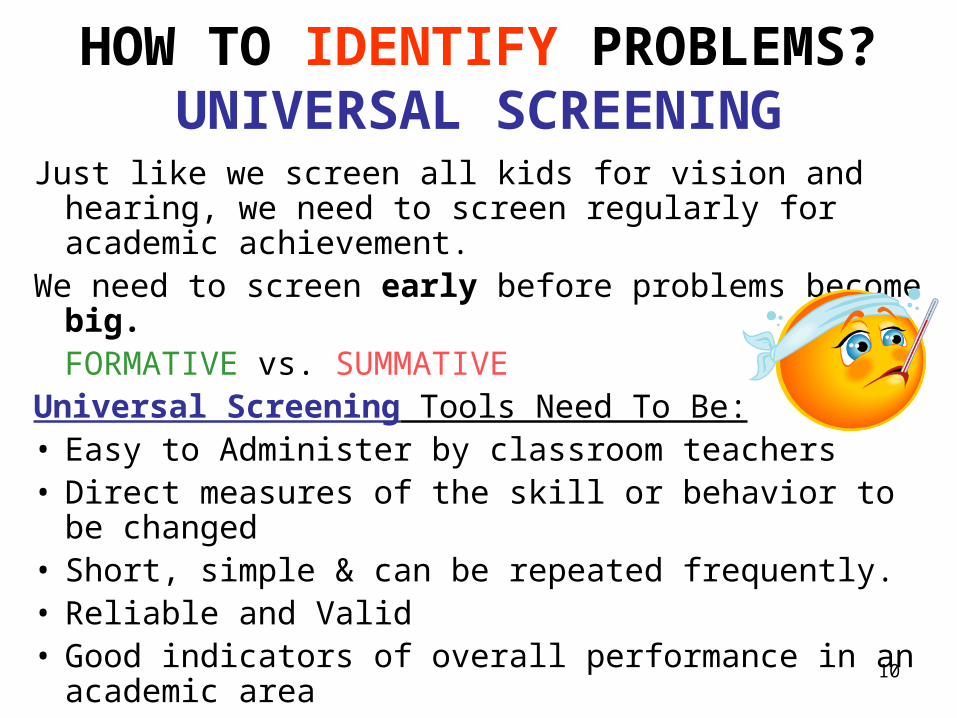
HOW TO IDENTIFY PROBLEMS? UNIVERSAL SCREENING
Just like we screen all kids for vision and hearing, we need to screen regularly for academic achievement.
We need to screen early before problems become big.FORMATIVE vs. SUMMATIVE
Universal Screening Tools Need To Be: • Easy to Administer by classroom teachers• Direct measures of the skill or behavior to be
changed• Short, simple & can be repeated frequently. • Reliable and Valid• Good indicators of overall performance in an
academic area
11
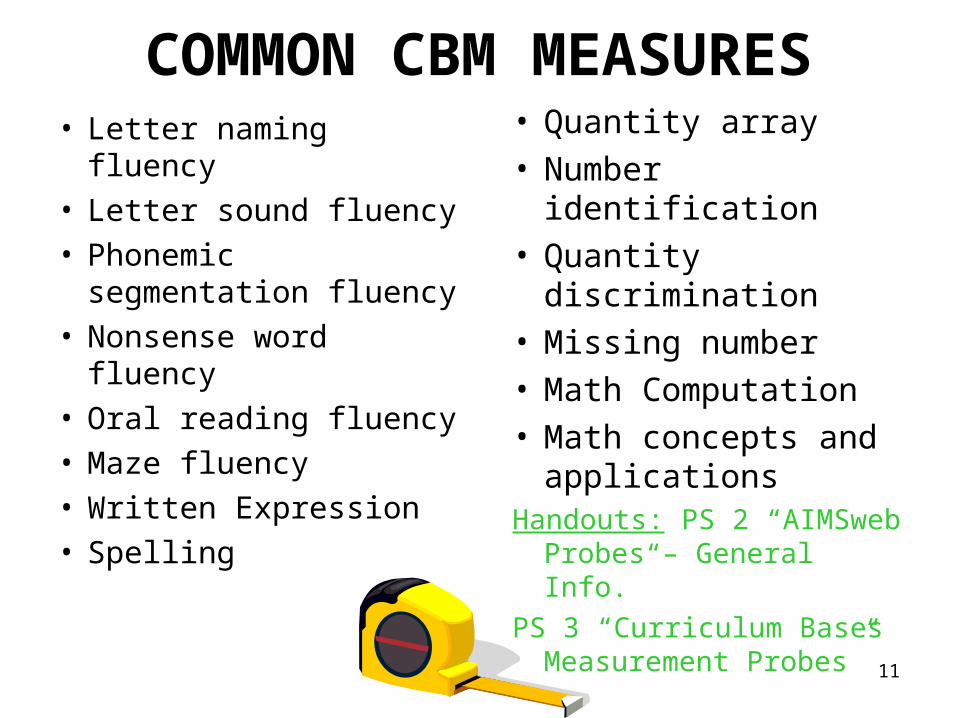
COMMON CBM MEASURES• Letter naming fluency• Letter sound fluency• Phonemic
segmentation fluency• Nonsense word
fluency• Oral reading fluency• Maze fluency• Written Expression• Spelling
• Quantity array• Number identification• Quantity
discrimination• Missing number• Math Computation• Math concepts and
applicationsHandouts: PS 2 “AIMSweb
Probes – General Info.”
PS 3 “Curriculum Bases Measurement Probes”
12
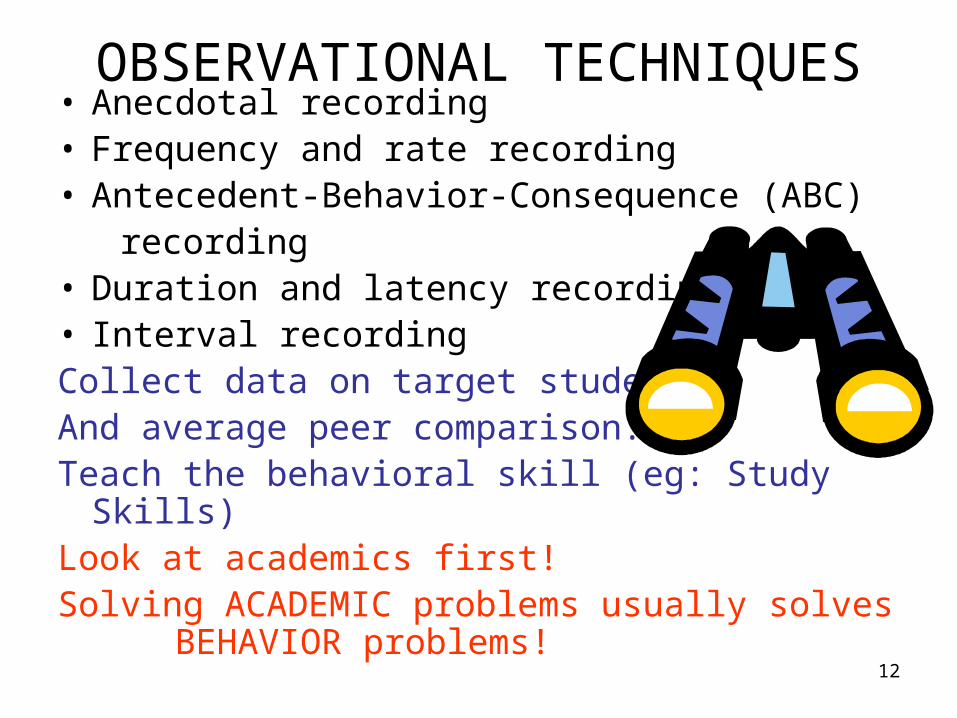
OBSERVATIONAL TECHNIQUES• Anecdotal recording• Frequency and rate recording• Antecedent-Behavior-Consequence (ABC) recording• Duration and latency recording• Interval recordingCollect data on target student And average peer comparison.Teach the behavioral skill (eg: Study Skills)Look at academics first!Solving ACADEMIC problems usually solves
BEHAVIOR problems!
13
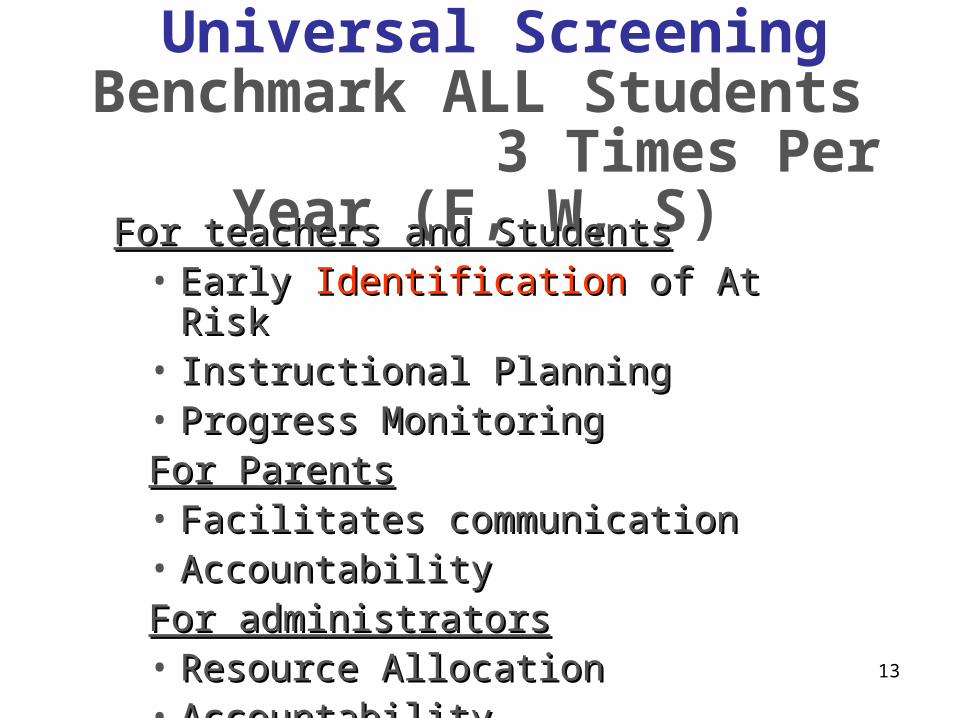
Universal Screening Benchmark ALL Students 3 Times Per Year (F, W,
S) For teachers and StudentsFor teachers and Students• Early Early IdentificationIdentification of At Risk of At Risk • Instructional PlanningInstructional Planning• Progress Monitoring Progress Monitoring For ParentsFor Parents• Facilitates communicationFacilitates communication• Accountability Accountability For administratorsFor administrators • Resource AllocationResource Allocation• AccountabilityAccountability
14
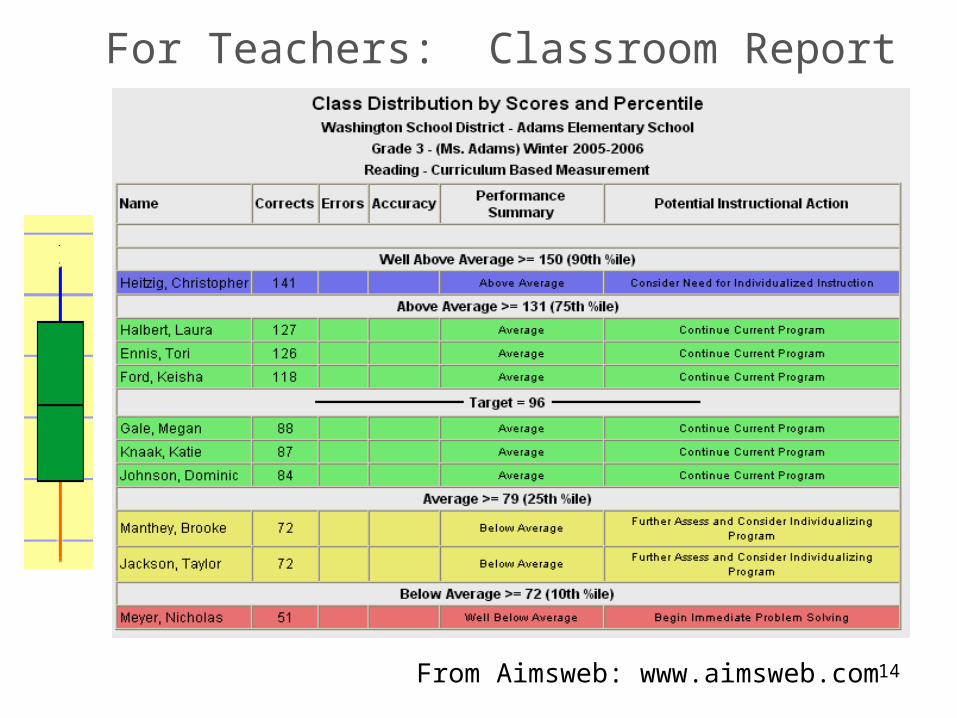
For Teachers: Classroom Report
From Aimsweb: www.aimsweb.com
15
PROBLEM DEFINITION
What is a good problem statement?
What tools and/or resources are needed to get information for a good problem statement?
Who should write the problem statement,
and how is the problem statement presented?
16
Problem Statements
• Setting (when presented with what task?)
• An observable behavior (what skill?)
• Measure ( calculate level and rate)
• Baseline (defining the level of performance)
• Average peer comparison (typical peer)
with rhythm…
Beth Wood
HOW DO WE DEFINE A PROBLEM?

17
Sample Problem Statement• S: When presented with a 3rd gr.
oral reading fluency probe,• A: Wilbur is able to read aloud
correctly• M: (words) in one minute• B: thirty-five words• A: while an average peer* reads 78
words aloud correctly in one minute.
*handout packet: PS 4 “AIMSweb Growth Table”
18
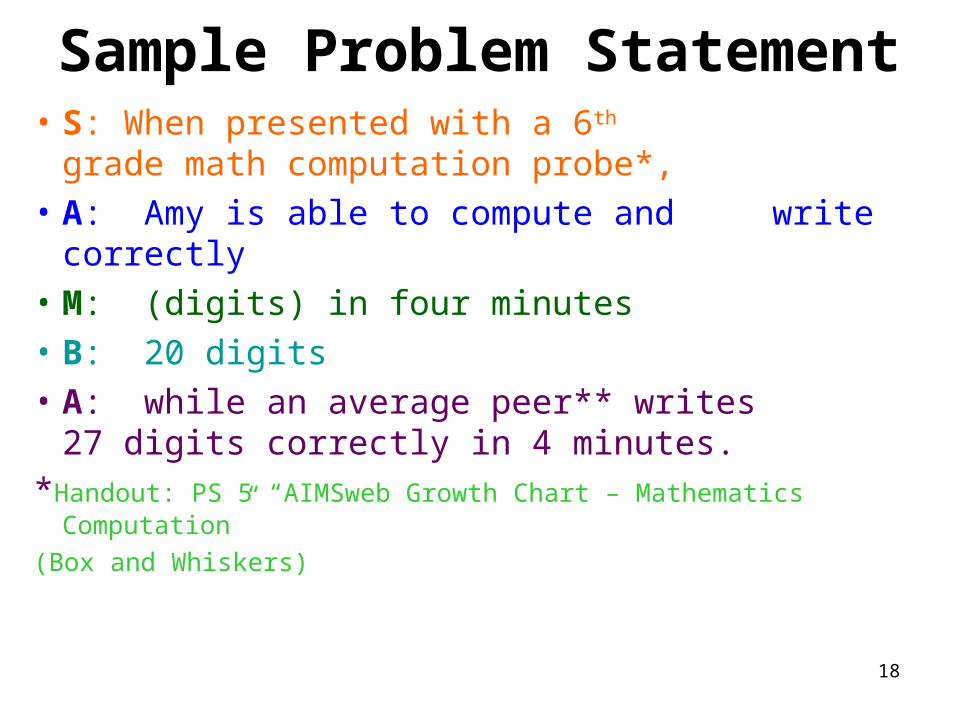
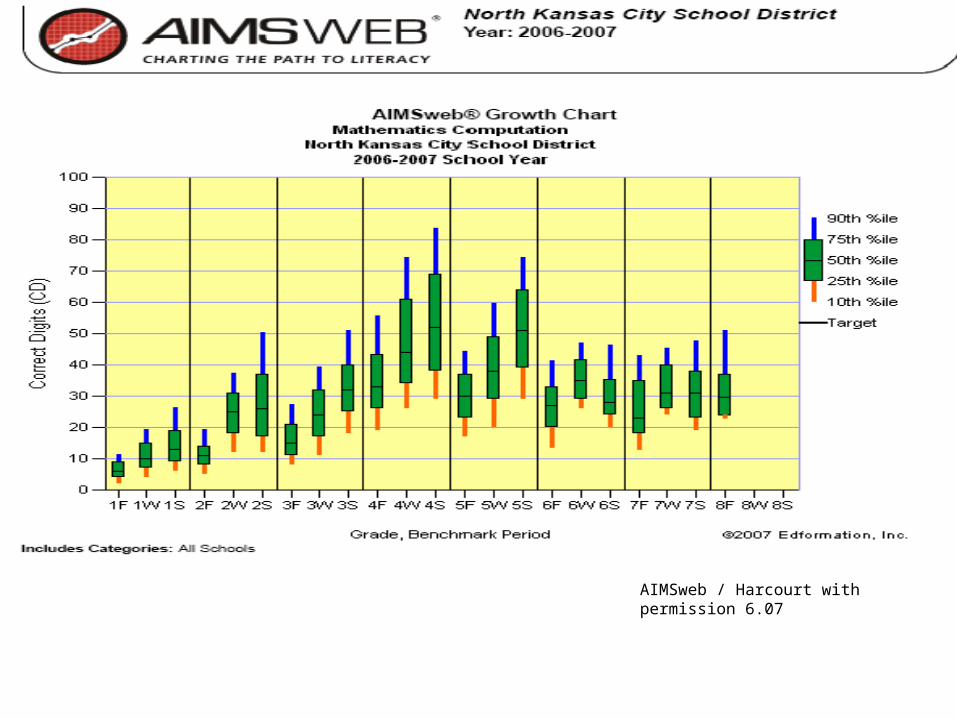
Sample Problem Statement• S: When presented with a 6th grade
math computation probe*,• A: Amy is able to compute and write
correctly • M: (digits) in four minutes• B: 20 digits• A: while an average peer** writes 27
digits correctly in 4 minutes.*Handout: PS 5 “AIMSweb Growth Chart – Mathematics
Computation” (Box and Whiskers)
19
AIMSweb / Harcourt with permission 6.07
20
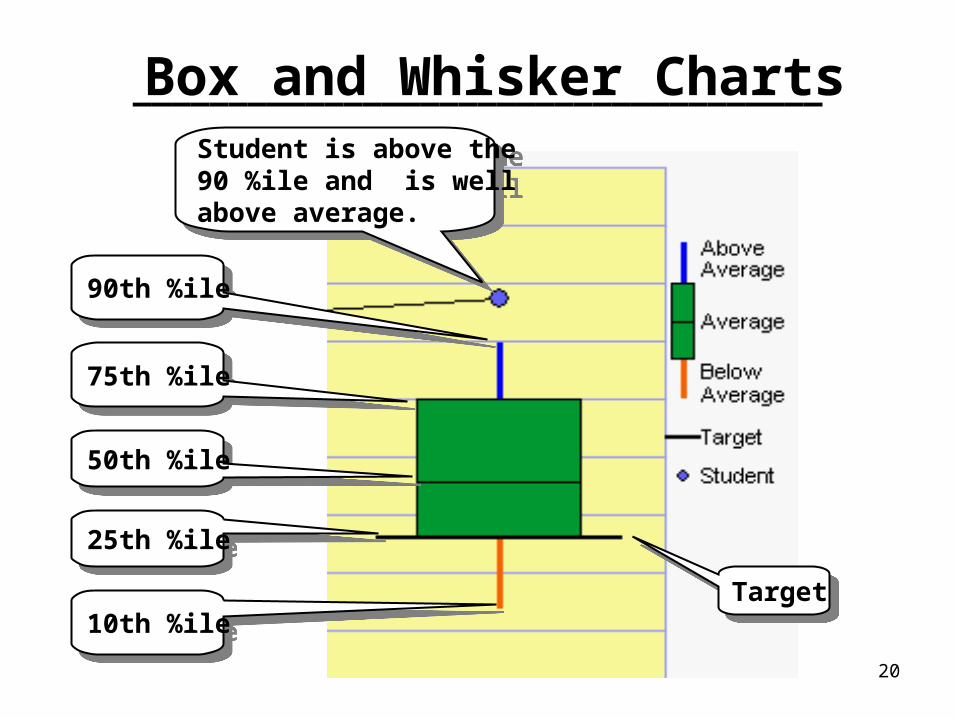
10th %ile10th %ile
90th %ile90th %ile
75th %ile75th %ile
50th %ile50th %ile
25th %ile25th %ile
Student is above the90 %ile and is well above average.
Student is above the90 %ile and is well above average.
TargetTarget
____________________________________Box and Whisker Charts
21
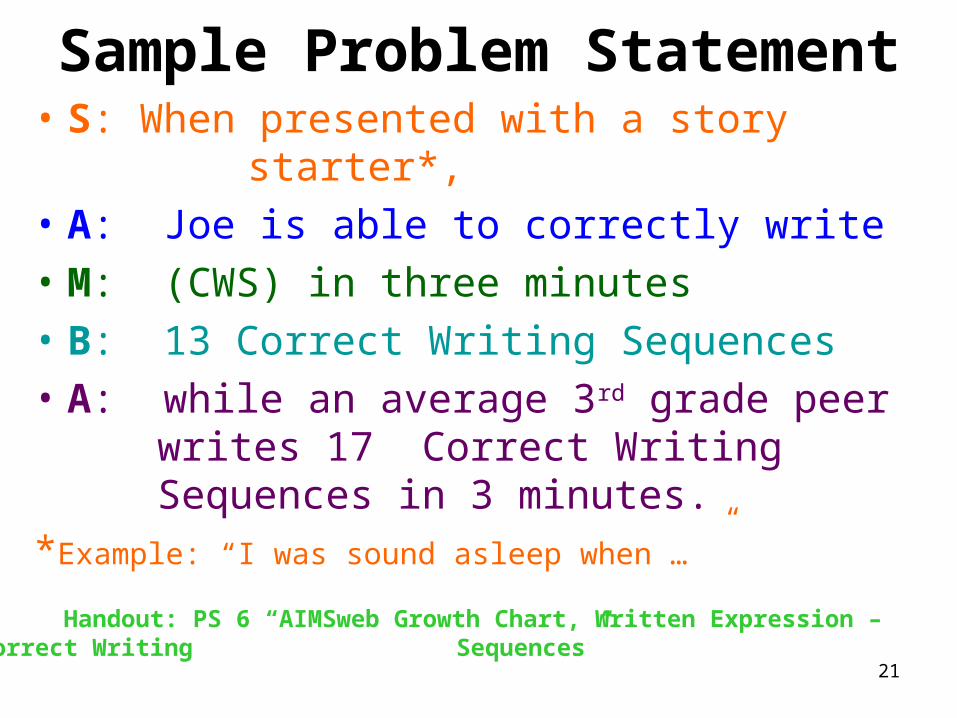
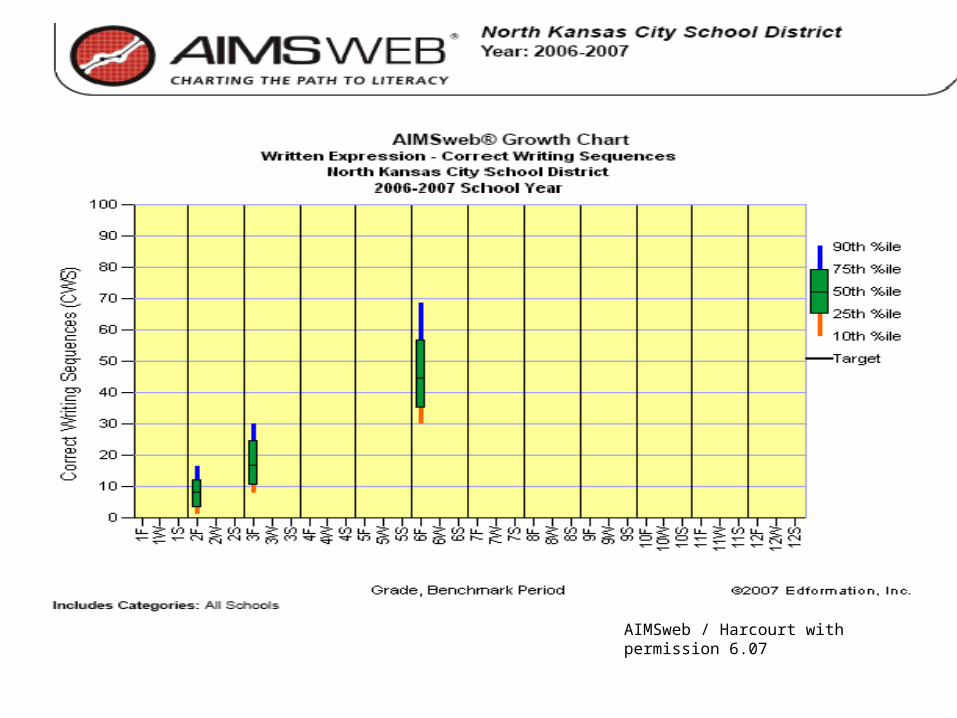
Sample Problem Statement• S: When presented with a story
starter*,• A: Joe is able to correctly write • M: (CWS) in three minutes• B: 13 Correct Writing Sequences• A: while an average 3rd grade peer
writes 17 Correct Writing Sequences in 3 minutes.
*Example: “I was sound asleep when … ” Handout: PS 6 “AIMSweb Growth Chart, Written Expression – Correct Writing Sequences”
22
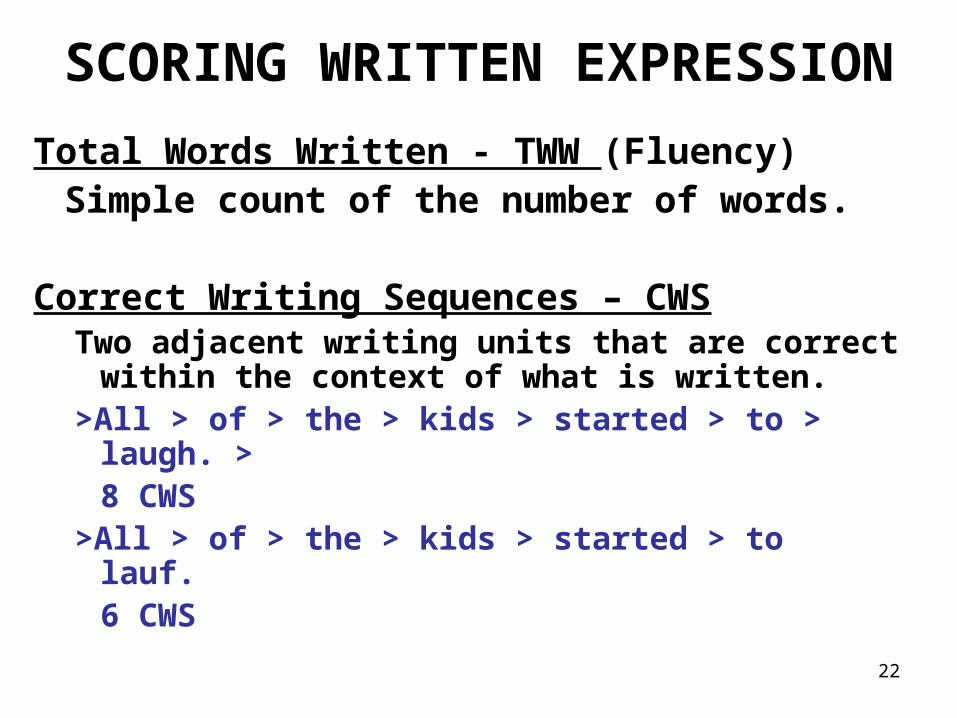
SCORING WRITTEN EXPRESSION
Total Words Written - TWW (Fluency)Simple count of the number of words.
Correct Writing Sequences – CWSTwo adjacent writing units that are correct
within the context of what is written.>All > of > the > kids > started > to > laugh. >
8 CWS>All > of > the > kids > started > to lauf.
6 CWS
23
AIMSweb / Harcourt with permission 6.07
24
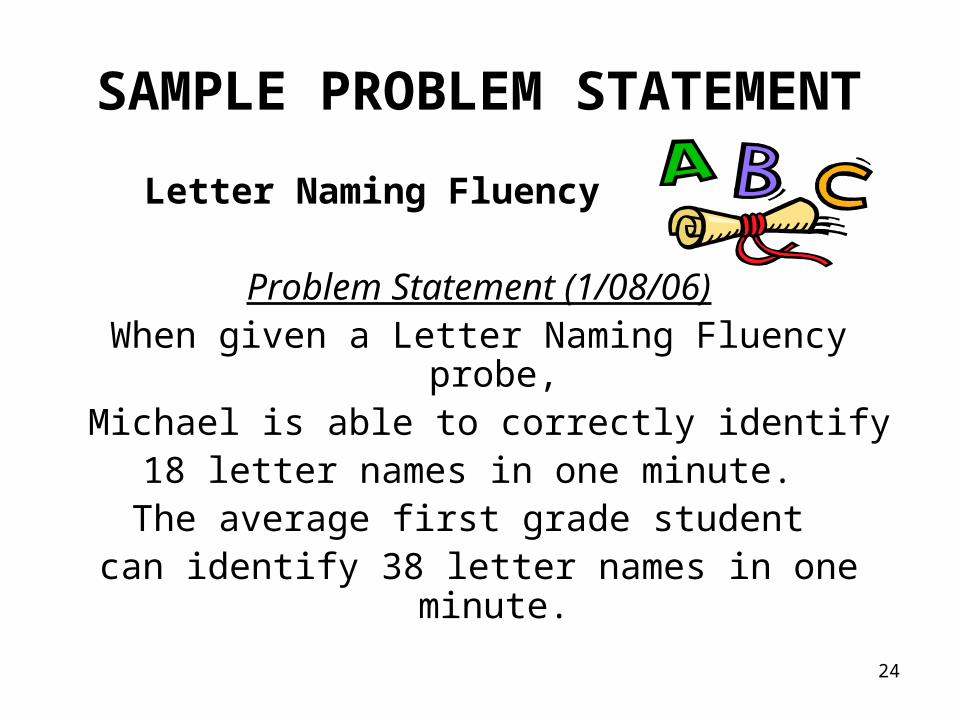
SAMPLE PROBLEM STATEMENT
Letter Naming Fluency
Problem Statement (1/08/06)When given a Letter Naming Fluency probe,
Michael is able to correctly identify 18 letter names in one minute. The average first grade student
can identify 38 letter names in one minute.
25
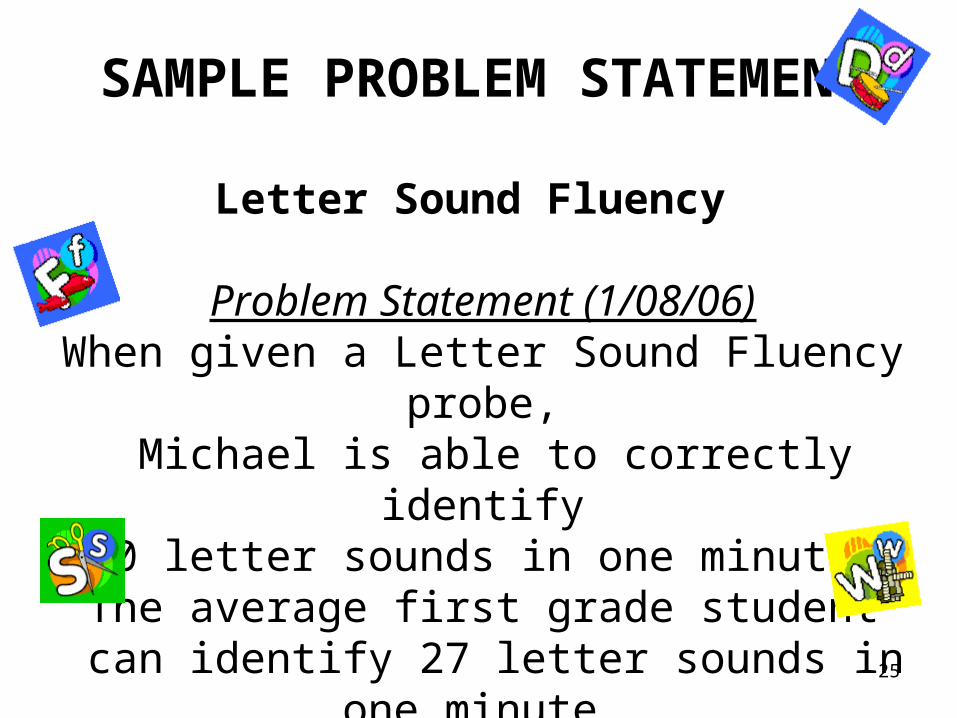
SAMPLE PROBLEM STATEMENT
Letter Sound Fluency
Problem Statement (1/08/06)When given a Letter Sound Fluency probe,
Michael is able to correctly identify 10 letter sounds in one minute. The average first grade student
can identify 27 letter sounds in one minute..
26
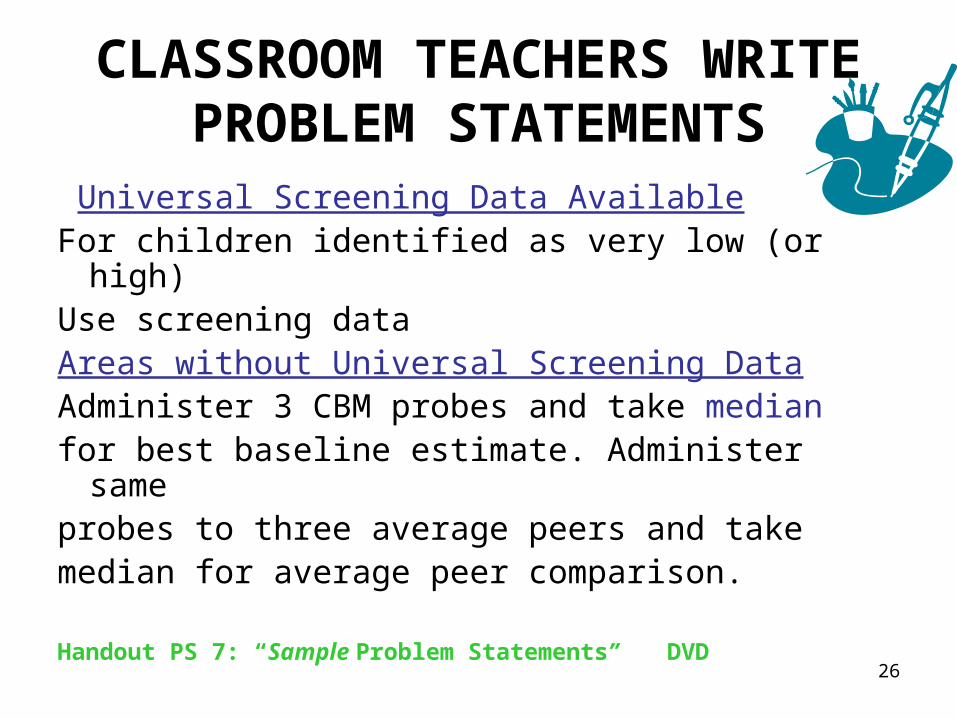
CLASSROOM TEACHERS WRITE PROBLEM STATEMENTS
Universal Screening Data AvailableFor children identified as very low (or high)Use screening dataAreas without Universal Screening DataAdminister 3 CBM probes and take medianfor best baseline estimate. Administer same probes to three average peers and take median for average peer comparison.
Handout PS 7: “Sample Problem Statements” DVD
27
Handout Packet: PS 8
Find “Writing Problem Statements”.
Work with your team to practice writing problem statements in each of the areas.
Choose one problem statement you’d like to share with the group, and write it on the overhead transparency.
28
WHERE DO WE GO FROM HERE?
If you are a new principal in a building, and you discovered through fall benchmarking that an unacceptable percentage of your students are at or below the 10 percentile in measures of reading. What would you do?
Handout PS 9 “Problem SolvingTeam Request for Assistance”
29
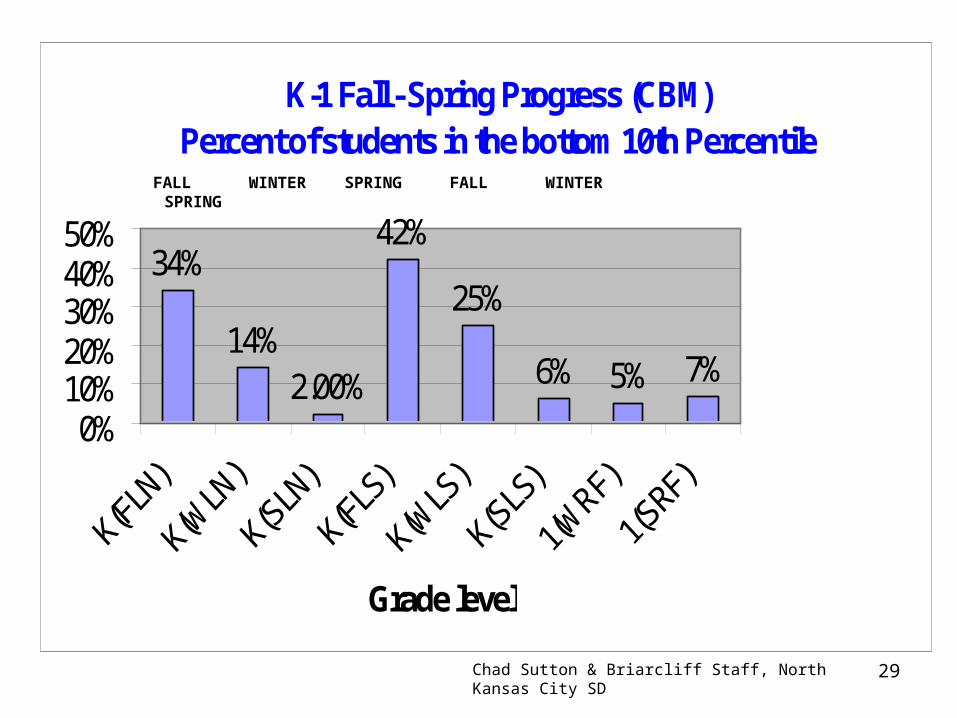
K-1 Fall - Spring Progress (CBM)Percent of students in the bottom 10th Percentile
34%
2.00%
42%
25%
7%5%6%14%
0%10%20%30%40%50%
Grade level
Chad Sutton & Briarcliff Staff, North Kansas City SD
FALL WINTER SPRING FALL WINTER SPRING

30
Team Activity: Problems Statements Then, Now & Future
31
ACKNOWLEDGEMENTS
Beth Wood, Problem Team Facilitator, North Kansas City School District
Steven Beldin, Director of Pupil Services, North Kansas City School District
Dr. Dave Tilly, Heartland AEA, IowaDr. Erica Lembke, University of MissouriNational Center on Student Progress
Monitoring www.studentprogress.orgHarcourt www.aimsweb.com
32
CBM PROBES
www.aimsweb.com (fee based)
www.interventioncentral.org
http://dibels.uoregon.edu
www.studentprogress.org
33
CONTACT INFORMATION
Charlotte SmithNorth Kansas City School District2000 NE 46th St.KC MO 64116816.413.5113