Problem ID: apl - icpc.baylor.edu · Problem ID: barcodes Code-11 is a barcode system for encoding...
22
Problem A APL Lives! Problem ID: apl APL is an array programming language that uses a notation invented by Ken Iverson in 1957. In this problem we consider only a small subset of the language which we call apl (that is, small APL). Each apl expression appears on a line by itself and each expression has a value, which is displayed immediately after the expression is entered. Operators in apl do not have precedence like those in C, C++, or Java, but instead are applied right to left. However, parentheses may be used to control evaluation order. Similarly, operands for binary operators are evaluated in right to left order. Here are some examples of apl expressions. var = 1 2 3 Store the vector 1 2 3 in var, replacing its previous value. The value of the expression is 1 2 3. The left operand of the = operator must be a variable. var + 4 Display the value of var with 4 added to each of its elements (result: 5 6 7); the stored version of var is not modified. - / var Display the value of var as if a - operator had been inserted between each of its elements on each row (result: 2). If var has two dimensions, the result is a vector. If var has three dimensions, the result is a two-dimensional array. * / and + / have analogous behaviors. iota 5 Generate a vector with the values 1 2 3 4 5. 2 2 rho 1 2 3 4 Reshape the vector 1 2 3 4 into a 2 by 2 array; 1 and 2 are in the first row, and 3 and 4 are in the second row. 2 2 rho 1 2 3 4 5 6 Same result as above. 2 3 rho 1 2 3 4 Another reshaping, yielding a first row with 1 2 3 and a second row with 4 1 2; if the right argument does not have a sufficient number of elements, then the elements of the right operand are reused starting from the beginning, in row-major order. 2 drop iota 5 Result: 3 4 5. Drops the two leading elements from iota 5. 1 2 * 3 4 Result: 3 8. Illustrates element-wise multiplication. Operands must be conformable – either they have the same shape, or at least one must be a one-element vector (see second example). ( ( a = 1 ) drop 1 2 3 ) – 5 Result: -3 -2. Illustrates use of parentheses. a + ( a = 5 ) + a + ( a = 6 ) Result: 22. Illustrates evaluation order In this problem you are to write an interpreter for apl. Integers in the input are non-negative and less than 10 4 . All computed integer values (including intermediate values) have absolute values less than 10 4 . The number of entries in any matrix is always less than or equal to 10 4 . Variable names consist of one to three alphabetic lower- case characters, and the names iota, rho, and drop are always interpreted as operators. Exactly one space separates elements of statements (constants, variables, operators, and parentheses). Constants in the input are vectors. All intermediate values are one, two, or three-dimensional arrays with positive dimensions. This restricts some operand ranges: “2 0 rho 1 2 3”, “2 3 2 1 rho 5”, and “3 drop iota 3” are illegal. The only arithmetic operators provided are + (addition), – (subtraction), and * (multiplication). Their operands are conformable as illustrated in the examples. Observe that “1 1 rho 1” and “1 rho 1” have different shapes. The operand for iota evaluates to a one-element positive vector. The left operand of drop evaluates to a one-element non-negative vector and its right operand evaluates to a vector. Both operands of rho evaluate to vectors.
Transcript of Problem ID: apl - icpc.baylor.edu · Problem ID: barcodes Code-11 is a barcode system for encoding...
Problem A APL Lives!
Problem ID: apl APL is an array programming language that uses a notation invented by Ken Iverson in 1957. In this problem we consider only a small subset of the language which we call apl (that is, small APL). Each apl expression appears on a line by itself and each expression has a value, which is displayed immediately after the expression is entered. Operators in apl do not have precedence like those in C, C++, or Java, but instead are applied right to left. However, parentheses may be used to control evaluation order. Similarly, operands for binary operators are evaluated in right to left order. Here are some examples of apl expressions. var = 1 2 3 Store the vector 1 2 3 in var, replacing its previous value. The
value of the expression is 1 2 3. The left operand of the = operator must be a variable.
var + 4 Display the value of var with 4 added to each of its elements (result: 5 6 7); the stored version of var is not modified.
- / var Display the value of var as if a - operator had been inserted between each of its elements on each row (result: 2). If var has two dimensions, the result is a vector. If var has three dimensions, the result is a two-dimensional array. * / and + / have analogous behaviors.
iota 5 Generate a vector with the values 1 2 3 4 5. 2 2 rho 1 2 3 4 Reshape the vector 1 2 3 4 into a 2 by 2 array; 1 and 2 are in
the first row, and 3 and 4 are in the second row. 2 2 rho 1 2 3 4 5 6 Same result as above. 2 3 rho 1 2 3 4 Another reshaping, yielding a first row with 1 2 3 and a second
row with 4 1 2; if the right argument does not have a sufficient number of elements, then the elements of the right operand are reused starting from the beginning, in row-major order.
2 drop iota 5 Result: 3 4 5. Drops the two leading elements from iota 5. 1 2 * 3 4 Result: 3 8. Illustrates element-wise multiplication. Operands
must be conformable – either they have the same shape, or at least one must be a one-element vector (see second example).
( ( a = 1 ) drop 1 2 3 ) – 5 Result: -3 -2. Illustrates use of parentheses. a + ( a = 5 ) + a + ( a = 6 ) Result: 22. Illustrates evaluation order In this problem you are to write an interpreter for apl. Integers in the input are non-negative and less than 104. All computed integer values (including intermediate values) have absolute values less than 104. The number of entries in any matrix is always less than or equal to 104. Variable names consist of one to three alphabetic lower-case characters, and the names iota, rho, and drop are always interpreted as operators. Exactly one space separates elements of statements (constants, variables, operators, and parentheses). Constants in the input are vectors. All intermediate values are one, two, or three-dimensional arrays with positive dimensions. This restricts some operand ranges: “2 0 rho 1 2 3”, “2 3 2 1 rho 5”, and “3 drop iota 3” are illegal. The only arithmetic operators provided are + (addition), – (subtraction), and * (multiplication). Their operands are conformable as illustrated in the examples. Observe that “1 1 rho 1” and “1 rho 1” have different shapes. The operand for iota evaluates to a one-element positive vector. The left operand of drop evaluates to a one-element non-negative vector and its right operand evaluates to a vector. Both operands of rho evaluate to vectors.
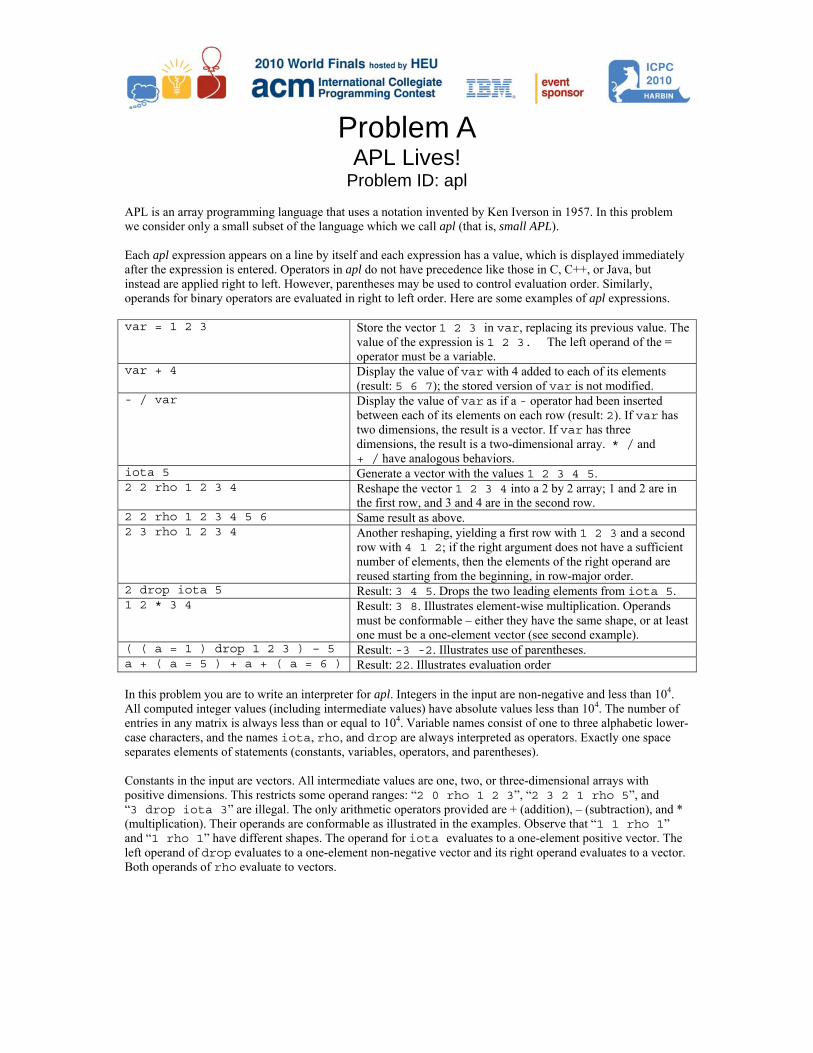
Input The input contains several test cases, each on a line by itself. The values of variables assigned in one test case are available for use in following test cases. No expression exceeds 80 characters in length, including space characters. No test case produces an invalid result (for example, an empty vector). The last test case is followed by a line containing the single character ‘#’. Output For each test case, display a line containing the case number and the input line. Then, starting on the next line, display the result of evaluating the expression. Vectors display as a single line of integers; m× n arrays display as m lines of n values, and m× n× p arrays display as m arrays of size n × p, with a blank line separating the n × p arrays. Values on the same line should be separated by white space but need not be aligned in columns. Sample Input Output for the Sample Inputvar = 1 2 3 var + 4 - / var iota 5 2 2 rho 1 2 3 4 2 3 rho 1 2 3 4 2 drop iota 4 1 2 * 3 4 ( ( a = 1 ) drop 1 2 3 ) – 5 a + ( a = 5 ) + a + ( a = 6 ) ( 2 2 rho 2 drop iota 6 ) + 100 1 2 3 + 4 5 6 2 3 rho 1 2 3 4 5 + 1 2 3 4 5 + / 2 3 4 rho iota 2 * 3 * 4 ( 2 4 5 rho iota 2 * 4 * 5 ) - 99 #
Case 1: var = 1 2 3 1 2 3 Case 2: var + 4 5 6 7 Case 3: - / var 2 Case 4: iota 5 1 2 3 4 5 Case 5: 2 2 rho 1 2 3 4 1 2 3 4 Case 6: 2 3 rho 1 2 3 4 1 2 3 4 1 2 Case 7: 2 drop iota 4 3 4 Case 8: 1 2 * 3 4 3 8 Case 9: ( ( a = 1 ) drop 1 2 3 ) - 5 -3 -2 Case 10: a + ( a = 5 ) + a + ( a = 6 ) 22 Case 11: ( 2 2 rho 2 drop iota 6 ) + 100 103 104 105 106 Case 12: 1 2 3 + 4 5 6 5 7 9 Case 13: 2 3 rho 1 2 3 4 5 + 1 2 3 4 5 2 4 6 8 10 2 Case 14: + / 2 3 4 rho iota 2 * 3 * 4 10 26 42 58 74 90 Case 15: ( 2 4 5 rho iota 2 * 4 * 5 ) - 99 -98 -97 -96 -95 -94 -93 -92 -91 -90 -89 -88 -87 -86 -85 -84 -83 -82 -81 -80 -79 -78 -77 -76 -75 -74 -73 -72 -71 -70 -69 -68 -67 -66 -65 -64 -63 -62 -61 -60 -59
Problem B Barcodes
Problem ID: barcodes
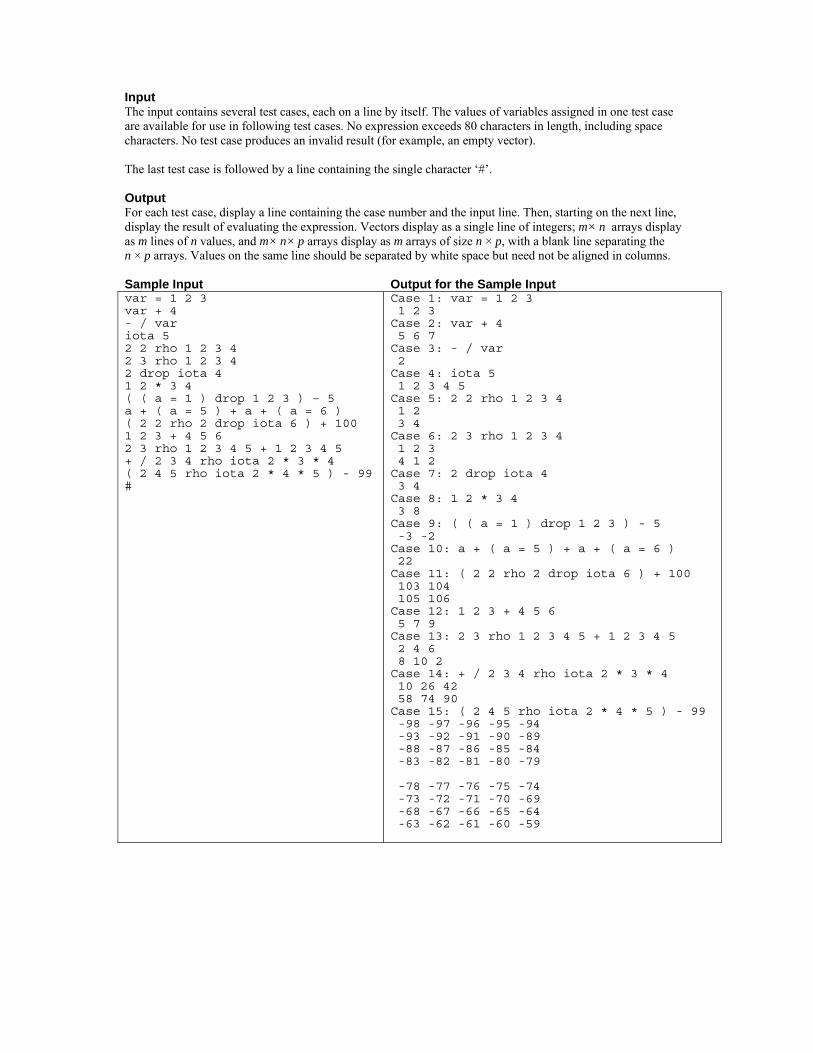
Code-11 is a barcode system for encoding characters used primarily in labeling telecommunications equipment. The characters encoded are limited to digits 0 through 9, the dash (“–”), and a special start/stop character which appears at the beginning and end of each Code-11 barcode. Code-11 is a discrete system, and each character is encoded independently. A character’s encoding is represented by five adjacent regions, or bars, that alternate between a dark color and a light color, starting with a dark bar. The width of each bar is either narrow or wide, according to the encoding scheme shown below, where 0 represents a narrow bar and 1 represents a wide bar.
Character Encoding
0 00001
1 10001
2 01001
3 11000
4 00101
5 10100
6 01100
7 00011
8 10010
9 10000
– 00100
Start/Stop 00110 Thus the character 1 is encoded as a wide dark bar, a narrow light bar, a narrow dark bar, a narrow light bar, and finally a wide dark bar. The barcodes for the individual characters must be separated by a narrow light bar whose only function is to separate the characters. A two-width encoding like that used for Code-11 has the benefit of simplicity. Since it is necessary only to distinguish a narrow bar from a wide bar, Code-11 allows for a large level of print tolerance in lower-quality printing conditions. To enable detection of errors, the Code-11 barcodes we use will have two check characters, C and K, added at the end of the message (before the stop character). If the n characters to be encoded (left to right) are c1 through cn, then the weight of the C check character is
10 1 11
where w(ci) is the weight associated with character ci. The weights for the digits 0 through 9 are 0 through 9; the weight for the hyphen is 10. (Note that mod has higher precedence than +.)
The weight of the K check character is
1 9 1 11
where cn+1 is the C check character. For example, suppose the message to be encoded is 123–45. Then the C check character is 5 and the K check character is 2. The barcodes for the eight characters 123–4552, preceded and followed by the barcode for the start/stop character, comprise the complete Code-11 barcode encoding of the message. Simple barcode readers measure the intensity of light reflected from a barcode to a linear array containing hundreds of tiny CCD sensors, each reporting light or dark. Light and dark regions are identified ,and the width of each region is used by the decoding software to validate the barcode and to obtain the encoded information. Since the orientation of the barcode is not fixed, the software must be able to decode the barcode whether it is scanned from left to right or from right to left. Your problem is to decode the information obtained by scanning a Code-11 barcode, given the widths of the light and dark regions detected by the reader. Assume a wide bar is intended to be twice as wide as a narrow bar. Due to inconsistencies among printers, the width of a bar can be up to 5 percent larger or smaller than intended. There are no zero-length messages (with barcodes containing only start/stop, check characters, and inter-character spacing). Input The input contains several test cases, each representing a single scanning attempt. The data for each case begins with an integer m ≤ 150 that specifies the number of regions detected by a barcode reader. This is followed by m integers d1…dm (1 ≤ di ≤ 200) giving the number of sensors in each region (within a region, all sensors report the same light intensity). The data for each test case begins and ends with a dark bar (there is no leading or trailing white space). The last test case is followed by a single integer zero. Output For each input case, display a line containing the case number and the results of the decoding effort. If the barcode can be successfully decoded, then display the sequence of message characters (without its check characters). If the decoding is successful but the C check character is incorrect, then display “bad C”. If the decoding is successful and the C check character is correct but the K check character is incorrect, then display “bad K”. Display “bad code” if the barcode cannot be successfully decoded due to bar widths outside the allowable range, missing or invalid start/stop codes, or some other invalid condition. Follow the format of the sample output.
Sample Input Output for the Sample Input 59 10 20 20 10 10 10 20 10 10 20 10 10 10 10 20 10 20 10 10 10 20 10 20 10 20 10 20 10 10 10 10 10 20 10 10 10 10 10 10 20 20 10 20 10 10 20 10 10 20 10 10 10 20 10 10 20 20 10 10 35 10 10 10 10 10 10 10 10 10 10 10 10 10 10 10 10 10 10 10 10 10 10 10 10 10 10 10 10 10 10 10 10 10 10 10 35 10 10 20 20 10 10 20 10 10 10 20 10 10 20 10 10 20 10 10 10 20 10 20 10 20 10 10 10 10 10 10 10 20 20 10 0
Case 1: 123-45Case 2: bad code Case 3: bad K

Problem C Tracking Bio-bots
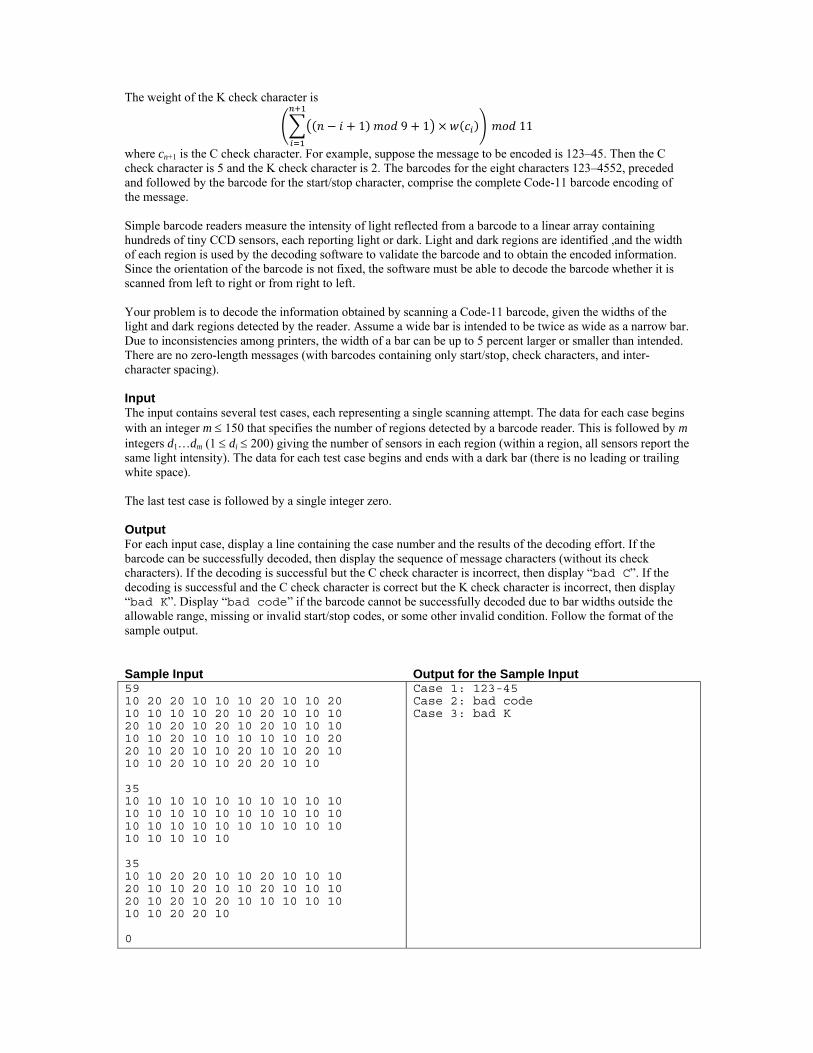
Problem ID: biobots The researchers at International Bio-bot Makers (IBM) have invented a new kind of Bio-bot, a robot with behavior mimicking biological organisms. The development of the new robot is at a primitive stage; they now resemble simple four-wheeled rovers. And like most modern robots, Bio-bots are not very mobile. Their weak motors and limited turning capability put considerable limitations on their movement, even in simple, relatively obstacle-free environments. Currently the Bio-bots operate in a room which can be described as an m×n grid. A Bio-bot occupies a full square on this grid. The exit is in the northeast corner, and the room slopes down towards it, which means the Bio-bots are only capable of moving north or east at any time. Some squares in the room are also occupied by walls, which completely block the robot. Figure 1, which corresponds to the sample input, shows an example of such a room.
Figure 1 Clearly, a Bio-bot located on square A is capable of leaving the room, while one at square B is trapped inside it, no matter what it does. Locations like B are called “stuck squares.” (Walls do not count as stuck squares.) Given the description of a room, your job is to count the total number of stuck squares in the room. Input Input consists of multiple test cases, each describing one room. Each test case begins with a line containing three integers m, n, and w (1 ≤ m, n ≤ 106, 0 ≤ w ≤ 1000). These indicate that the room contains m rows, n columns, and w horizontal walls. Each of the next w lines contains four integers x1, y1, x2, y2, the coordinates of the squares delimiting one wall. All walls are aligned from west to east, so 0 ≤ x1 ≤ x2 < n and 0 ≤ y1 = y2 < m. Walls do not overlap each other. The southwest corner of the room has coordinates (0,0) and the northeast corner has coordinates (n -1, m -1).
The last test case is followed by a line containing three zeros. Output For each test case, display one line of output containing the test case number followed by the number of stuck squares in the given room. Follow the format shown in the sample output. Sample Input Output for the Sample Input8 8 3 1 6 3 6 2 4 2 4 4 2 7 2 0 0 0
Case 1: 8
Problem D Castles
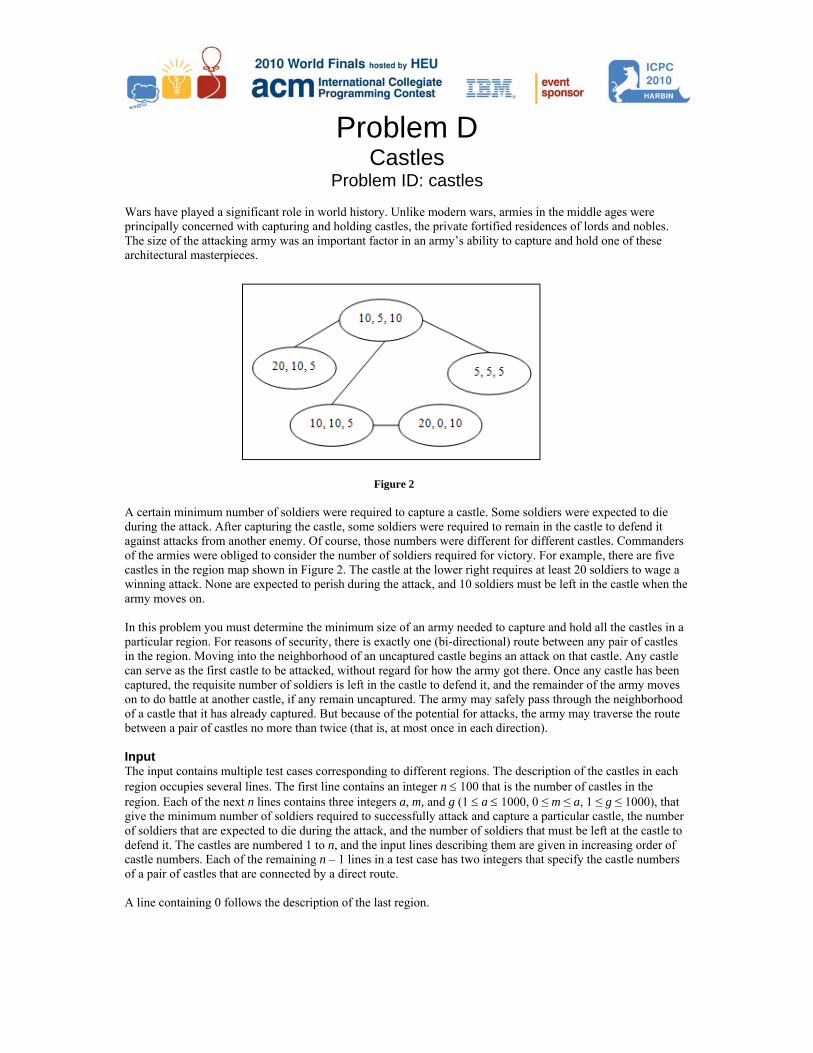
Problem ID: castles Wars have played a significant role in world history. Unlike modern wars, armies in the middle ages were principally concerned with capturing and holding castles, the private fortified residences of lords and nobles. The size of the attacking army was an important factor in an army’s ability to capture and hold one of these architectural masterpieces.
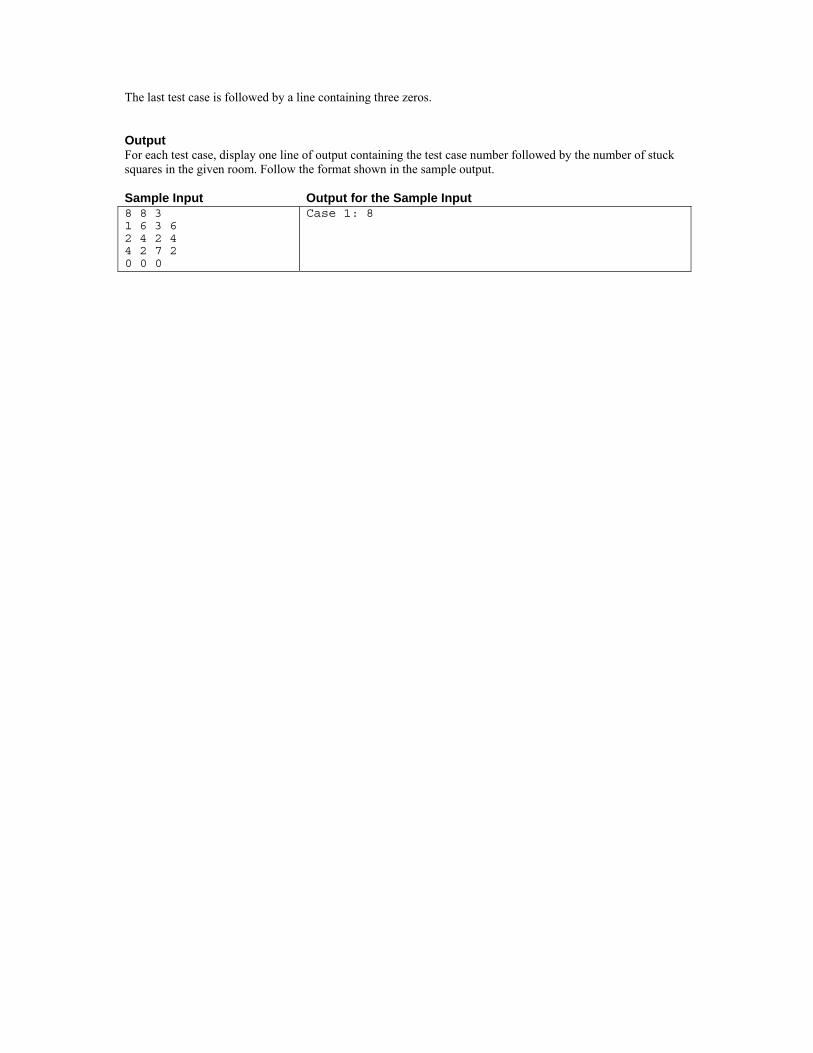
A certain minimum number of soldiers were required to capture a castle. Some soldiers were expected to die during the attack. After capturing the castle, some soldiers were required to remain in the castle to defend it against attacks from another enemy. Of course, those numbers were different for different castles. Commanders of the armies were obliged to consider the number of soldiers required for victory. For example, there are five castles in the region map shown in Figure 2. The castle at the lower right requires at least 20 soldiers to wage a winning attack. None are expected to perish during the attack, and 10 soldiers must be left in the castle when the army moves on. In this problem you must determine the minimum size of an army needed to capture and hold all the castles in a particular region. For reasons of security, there is exactly one (bi-directional) route between any pair of castles in the region. Moving into the neighborhood of an uncaptured castle begins an attack on that castle. Any castle can serve as the first castle to be attacked, without regard for how the army got there. Once any castle has been captured, the requisite number of soldiers is left in the castle to defend it, and the remainder of the army moves on to do battle at another castle, if any remain uncaptured. The army may safely pass through the neighborhood of a castle that it has already captured. But because of the potential for attacks, the army may traverse the route between a pair of castles no more than twice (that is, at most once in each direction). Input The input contains multiple test cases corresponding to different regions. The description of the castles in each region occupies several lines. The first line contains an integer n ≤ 100 that is the number of castles in the region. Each of the next n lines contains three integers a, m, and g (1 ≤ a ≤ 1000, 0 ≤ m ≤ a, 1 ≤ g ≤ 1000), that give the minimum number of soldiers required to successfully attack and capture a particular castle, the number of soldiers that are expected to die during the attack, and the number of soldiers that must be left at the castle to defend it. The castles are numbered 1 to n, and the input lines describing them are given in increasing order of castle numbers. Each of the remaining n – 1 lines in a test case has two integers that specify the castle numbers of a pair of castles that are connected by a direct route. A line containing 0 follows the description of the last region.
Figure 2

Output For each test case, display the case number and the minimum number of soldiers in the army needed to conquer all the castles in the region. Follow the format shown in the sample output. Sample Input Output for the Sample Input 3 5 5 5 10 5 5 5 1 1 1 3 2 3 5 10 5 10 20 10 5 10 10 5 5 5 5 20 0 10 1 2 1 3 1 4 3 5 0
Case 1: 22Case 2: 65
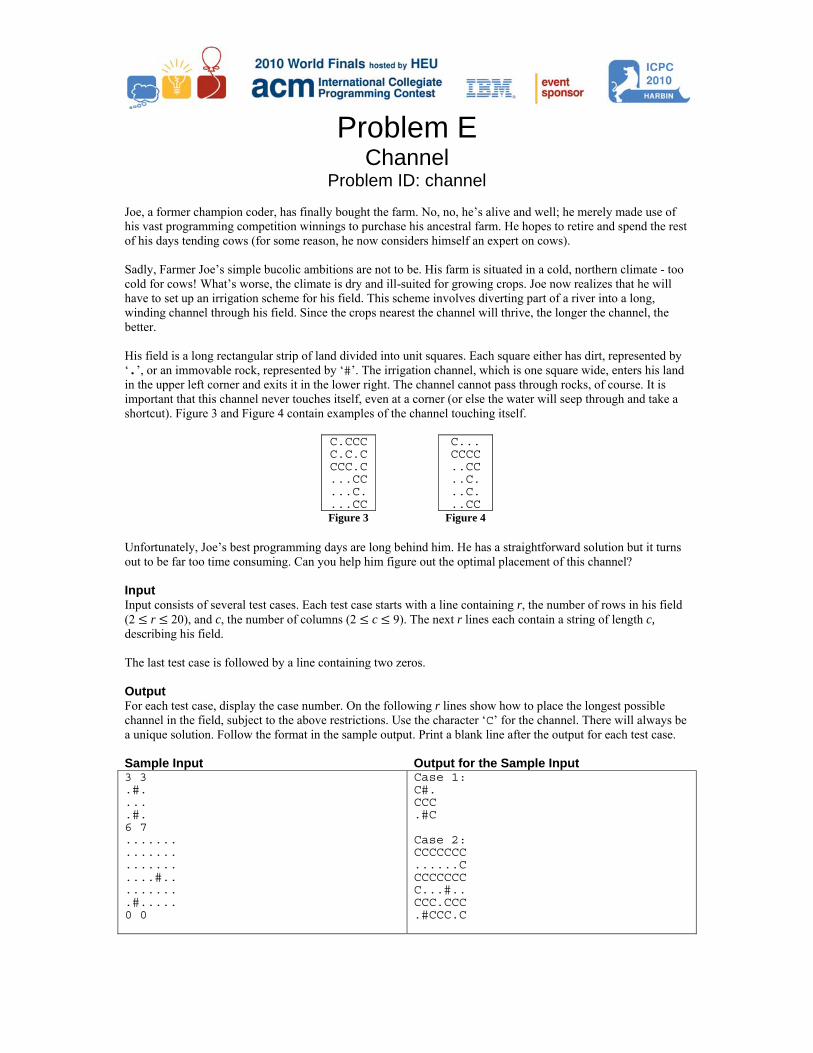
Problem E Channel
Problem ID: channel Joe, a former champion coder, has finally bought the farm. No, no, he’s alive and well; he merely made use of his vast programming competition winnings to purchase his ancestral farm. He hopes to retire and spend the rest of his days tending cows (for some reason, he now considers himself an expert on cows). Sadly, Farmer Joe’s simple bucolic ambitions are not to be. His farm is situated in a cold, northern climate - too cold for cows! What’s worse, the climate is dry and ill-suited for growing crops. Joe now realizes that he will have to set up an irrigation scheme for his field. This scheme involves diverting part of a river into a long, winding channel through his field. Since the crops nearest the channel will thrive, the longer the channel, the better. His field is a long rectangular strip of land divided into unit squares. Each square either has dirt, represented by ‘.’, or an immovable rock, represented by ‘#’. The irrigation channel, which is one square wide, enters his land in the upper left corner and exits it in the lower right. The channel cannot pass through rocks, of course. It is important that this channel never touches itself, even at a corner (or else the water will seep through and take a shortcut). Figure 3 and Figure 4 contain examples of the channel touching itself.
C.CCCC.C.C CCC.C ...CC ...C. ...CC
C...CCCC ..CC ..C. ..C. ..CC
Figure 3 Figure 4 Unfortunately, Joe’s best programming days are long behind him. He has a straightforward solution but it turns out to be far too time consuming. Can you help him figure out the optimal placement of this channel? Input Input consists of several test cases. Each test case starts with a line containing r, the number of rows in his field (2 r 20), and c, the number of columns (2 c 9). The next r lines each contain a string of length c, describing his field. The last test case is followed by a line containing two zeros. Output For each test case, display the case number. On the following r lines show how to place the longest possible channel in the field, subject to the above restrictions. Use the character ‘C’ for the channel. There will always be a unique solution. Follow the format in the sample output. Print a blank line after the output for each test case. Sample Input Output for the Sample Input 3 3 .#. ... .#. 6 7 ....... ....... ....... ....#.. ....... .#..... 0 0
Case 1:C#. CCC .#C Case 2: CCCCCCC ......C CCCCCCC C...#.. CCC.CCC .#CCC.C

This page intentionally left blank.
Problem F Contour Mapping Problem ID: contour
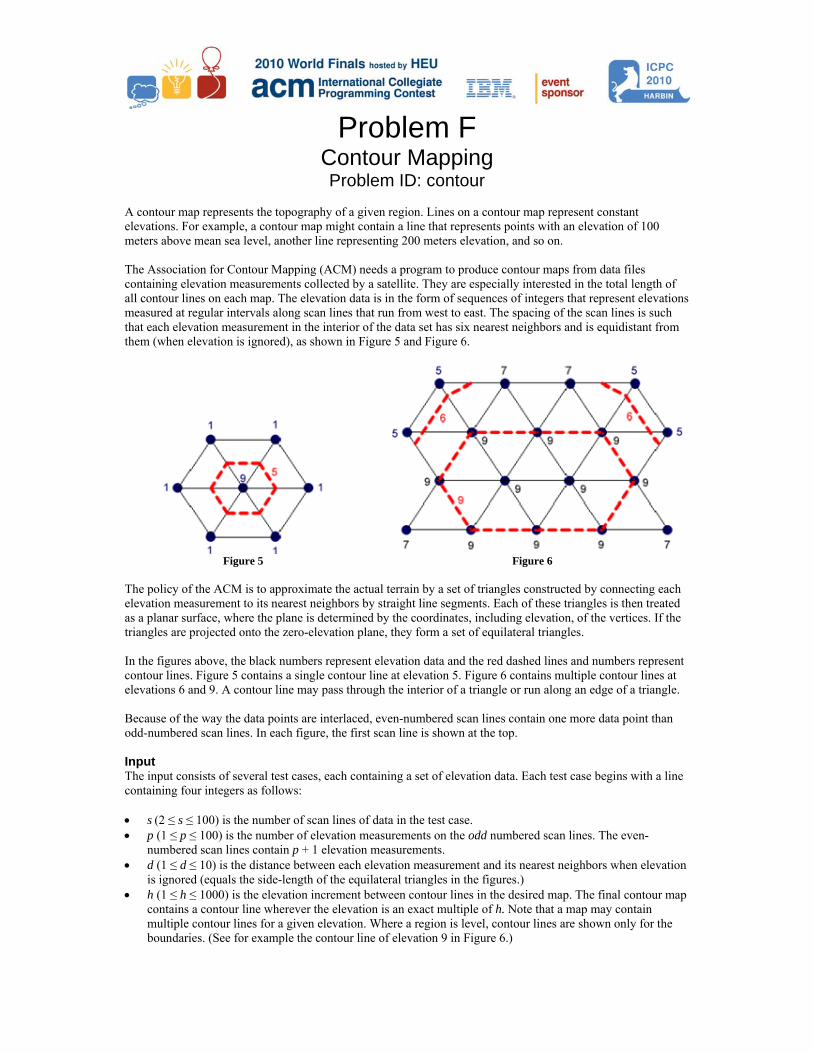
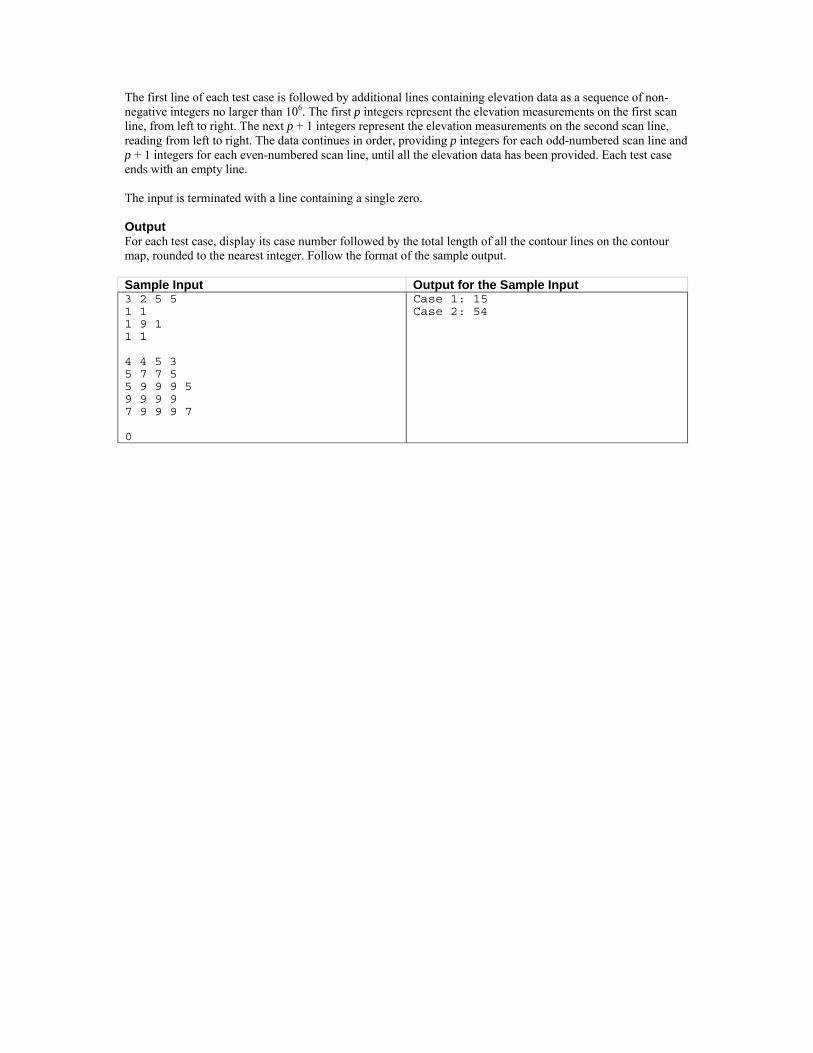
A contour map represents the topography of a given region. Lines on a contour map represent constant elevations. For example, a contour map might contain a line that represents points with an elevation of 100 meters above mean sea level, another line representing 200 meters elevation, and so on. The Association for Contour Mapping (ACM) needs a program to produce contour maps from data files containing elevation measurements collected by a satellite. They are especially interested in the total length of all contour lines on each map. The elevation data is in the form of sequences of integers that represent elevations measured at regular intervals along scan lines that run from west to east. The spacing of the scan lines is such that each elevation measurement in the interior of the data set has six nearest neighbors and is equidistant from them (when elevation is ignored), as shown in Figure 5 and Figure 6.
Figure 5
Figure 6
The policy of the ACM is to approximate the actual terrain by a set of triangles constructed by connecting each elevation measurement to its nearest neighbors by straight line segments. Each of these triangles is then treated as a planar surface, where the plane is determined by the coordinates, including elevation, of the vertices. If the triangles are projected onto the zero-elevation plane, they form a set of equilateral triangles. In the figures above, the black numbers represent elevation data and the red dashed lines and numbers represent contour lines. Figure 5 contains a single contour line at elevation 5. Figure 6 contains multiple contour lines at elevations 6 and 9. A contour line may pass through the interior of a triangle or run along an edge of a triangle. Because of the way the data points are interlaced, even-numbered scan lines contain one more data point than odd-numbered scan lines. In each figure, the first scan line is shown at the top. Input The input consists of several test cases, each containing a set of elevation data. Each test case begins with a line containing four integers as follows: • s (2 ≤ s ≤ 100) is the number of scan lines of data in the test case. • p (1 ≤ p ≤ 100) is the number of elevation measurements on the odd numbered scan lines. The even-
numbered scan lines contain p + 1 elevation measurements. • d (1 ≤ d ≤ 10) is the distance between each elevation measurement and its nearest neighbors when elevation
is ignored (equals the side-length of the equilateral triangles in the figures.) • h (1 ≤ h ≤ 1000) is the elevation increment between contour lines in the desired map. The final contour map
contains a contour line wherever the elevation is an exact multiple of h. Note that a map may contain multiple contour lines for a given elevation. Where a region is level, contour lines are shown only for the boundaries. (See for example the contour line of elevation 9 in Figure 6.)
The first line of each test case is followed by additional lines containing elevation data as a sequence of non-negative integers no larger than 106. The first p integers represent the elevation measurements on the first scan line, from left to right. The next p + 1 integers represent the elevation measurements on the second scan line, reading from left to right. The data continues in order, providing p integers for each odd-numbered scan line and p + 1 integers for each even-numbered scan line, until all the elevation data has been provided. Each test case ends with an empty line. The input is terminated with a line containing a single zero. Output For each test case, display its case number followed by the total length of all the contour lines on the contour map, rounded to the nearest integer. Follow the format of the sample output. Sample Input Output for the Sample Input 3 2 5 5 1 1 1 9 1 1 1 4 4 5 3 5 7 7 5 5 9 9 9 5 9 9 9 9 7 9 9 9 7 0
Case 1: 15Case 2: 54
Problem G The Islands
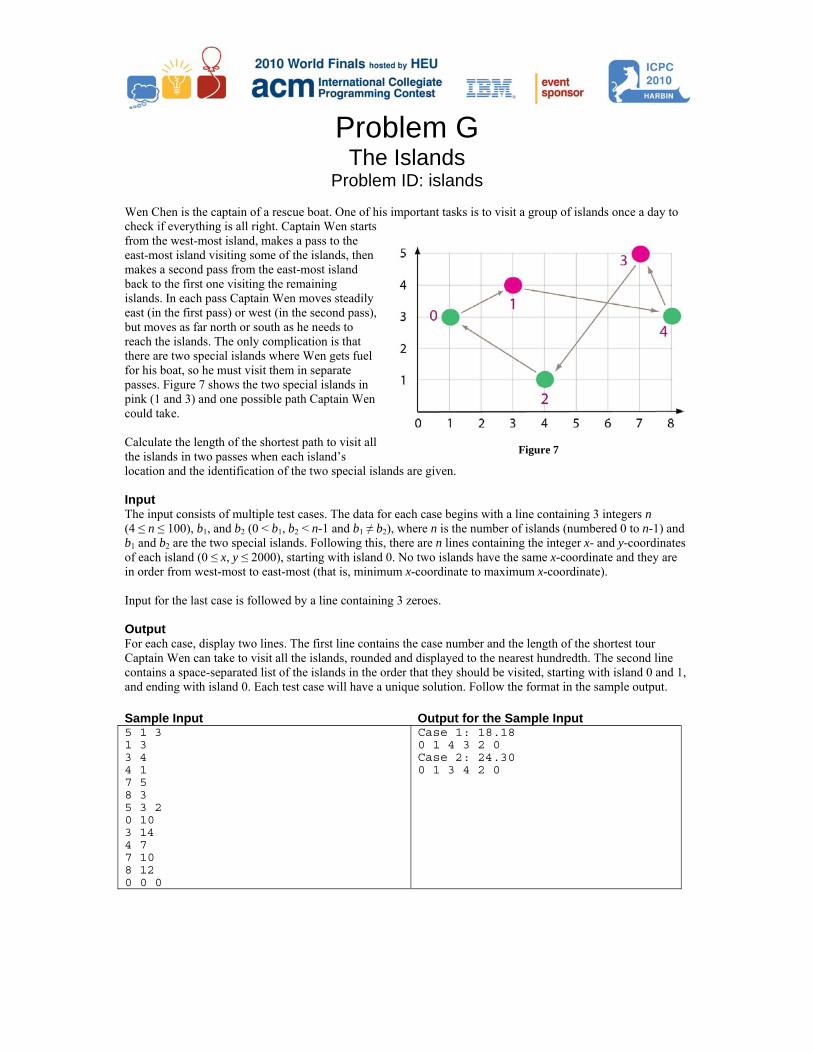
Problem ID: islands Wen Chen is the captain of a rescue boat. One of his important tasks is to visit a group of islands once a day to check if everything is all right. Captain Wen starts from the west-most island, makes a pass to the east-most island visiting some of the islands, then makes a second pass from the east-most island back to the first one visiting the remaining islands. In each pass Captain Wen moves steadily east (in the first pass) or west (in the second pass), but moves as far north or south as he needs to reach the islands. The only complication is that there are two special islands where Wen gets fuel for his boat, so he must visit them in separate passes. Figure 7 shows the two special islands in pink (1 and 3) and one possible path Captain Wen could take. Calculate the length of the shortest path to visit all the islands in two passes when each island’s location and the identification of the two special islands are given. Input The input consists of multiple test cases. The data for each case begins with a line containing 3 integers n (4 ≤ n ≤ 100), b1, and b2 (0 < b1, b2 < n-1 and b1 ≠ b2), where n is the number of islands (numbered 0 to n-1) and b1 and b2 are the two special islands. Following this, there are n lines containing the integer x- and y-coordinates of each island (0 ≤ x, y ≤ 2000), starting with island 0. No two islands have the same x-coordinate and they are in order from west-most to east-most (that is, minimum x-coordinate to maximum x-coordinate). Input for the last case is followed by a line containing 3 zeroes. Output For each case, display two lines. The first line contains the case number and the length of the shortest tour Captain Wen can take to visit all the islands, rounded and displayed to the nearest hundredth. The second line contains a space-separated list of the islands in the order that they should be visited, starting with island 0 and 1, and ending with island 0. Each test case will have a unique solution. Follow the format in the sample output. Sample Input Output for the Sample Input 5 1 3 1 3 3 4 4 1 7 5 8 3 5 3 2 0 10 3 14 4 7 7 10 8 12 0 0 0
Case 1: 18.180 1 4 3 2 0 Case 2: 24.30 0 1 3 4 2 0
Figure 7

This page intentionally left blank.
Problem H Rain
Problem ID: rain In recent years, hurricanes and tsunamis have shown the destructive power of water. That destructive power is not restricted to the sea, however. Heavy rain may cause floods, destroying people’s houses and fields. Using intricate models, scientists try to predict where the water will accumulate as a result of significant rain. One of the ways to model a hilly landscape is triangulation, which approximates a surface using triangles. Triangle sides are entirely shared between two adjacent triangles, with the exception of triangles at the region boundary, which may have some sides not shared. Imagine you have a triangulation model of a landscape. Now the rain starts pouring down – some water flows to the sea, and the rest gets trapped by the landscape to form lakes. Your task is to write a program that determines how many lakes are formed and the water level in each of them. Assume that the rain is heavy enough to fill all lakes up to their maximal levels. For any lake, it is possible to sail between any two points on its surface (except the boundaries) with a boat whose size is arbitrarily small, but not zero. Therefore, if two lakes share only points (or one point) having a zero depth, they are considered different lakes. Input The input contains several test cases. Each test case starts with a line containing two integers, p ≥ 3, which is the number of points, and s ≥ 3, which is the number of sides of the triangulation. Each of the next p lines describes a triangulation point. The description of each point starts with a two-letter code that is unique for the test case. The code is followed by three integers that describe the point in the format x y h. Here x and y (-10000 ≤ x,y ≤ 10000) are two-dimensional coordinates and h (0 ≤ h ≤ 8848) is the height of the point above sea level. Each of the next s lines contains the description of one side of a triangle. The description of a side consists of two different two-letter codes that specify the endpoints of the side. The projection of the lines to the xy-plane satisfies the following conditions:
• No side intersects any other side except at its endpoints. • The points and sides together form a triangulation of a single connected region. • There are no “holes” inside the region (that is, the boundary forms a single closed polygonal curve).
You may consider all points outside the triangulated region to have lower heights than the closest point of the region boundary. In other words, if the water gets to a boundary of the region, it flows out freely. The last line of the input contains two zeroes. Output For each test case, display the case number and the levels of all different lakes located inside the given region, each on a separate line. The levels are heights above sea level and should be printed in non-decreasing order. If no lakes are formed display a single 0. Follow the format of the sample output.
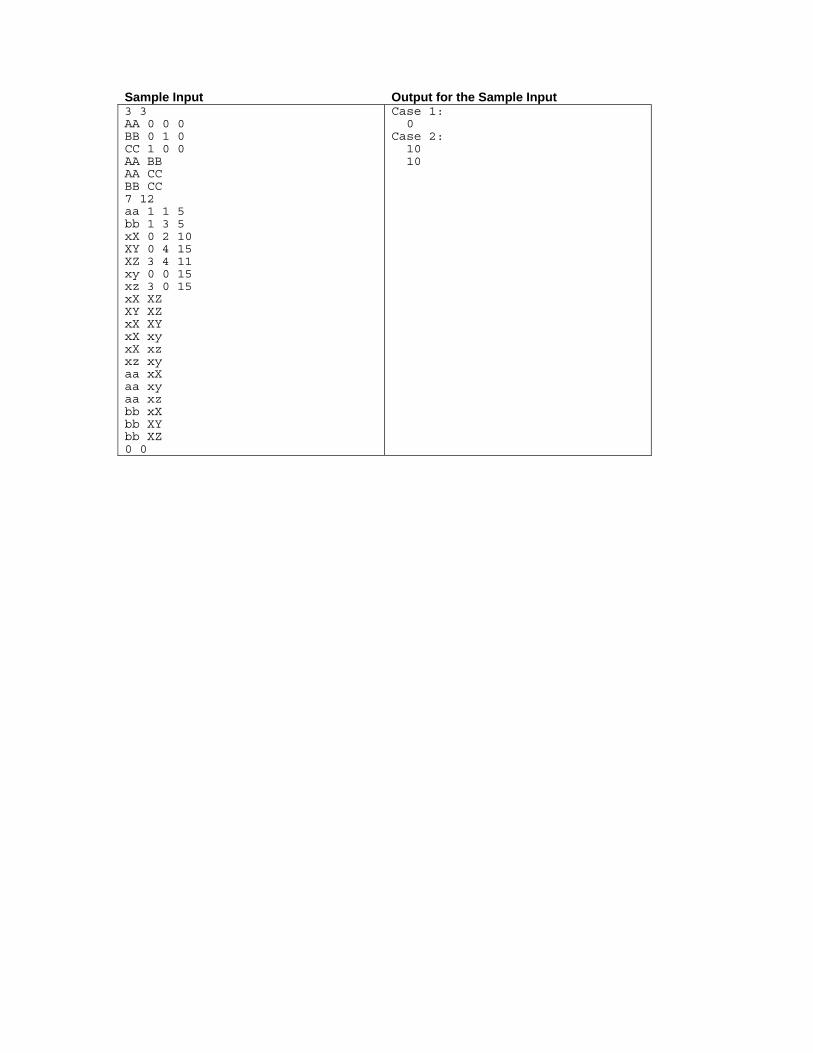
Sample Input Output for the Sample Input3 3 AA 0 0 0 BB 0 1 0 CC 1 0 0 AA BB AA CC BB CC 7 12 aa 1 1 5 bb 1 3 5 xX 0 2 10 XY 0 4 15 XZ 3 4 11 xy 0 0 15 xz 3 0 15 xX XZ XY XZ xX XY xX xy xX xz xz xy aa xX aa xy aa xz bb xX bb XY bb XZ 0 0
Case 1: 0 Case 2: 10 10
Problem I Robots on Ice Problem ID: robots
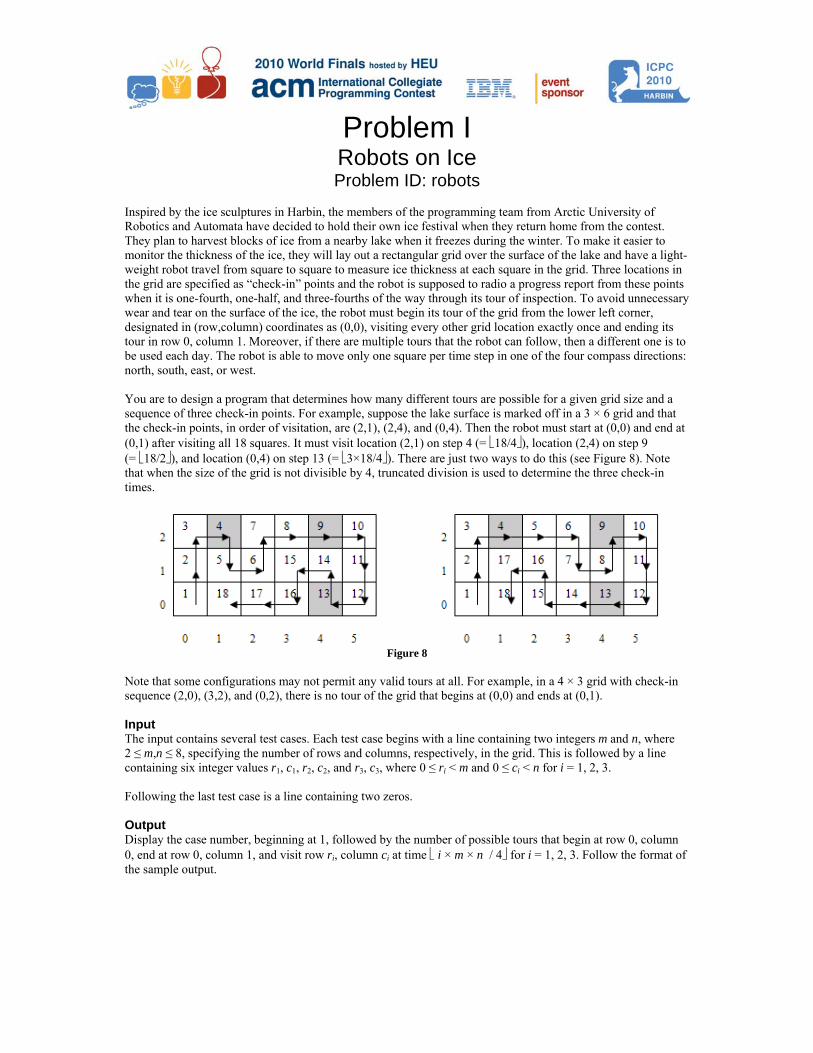
Inspired by the ice sculptures in Harbin, the members of the programming team from Arctic University of Robotics and Automata have decided to hold their own ice festival when they return home from the contest. They plan to harvest blocks of ice from a nearby lake when it freezes during the winter. To make it easier to monitor the thickness of the ice, they will lay out a rectangular grid over the surface of the lake and have a light-weight robot travel from square to square to measure ice thickness at each square in the grid. Three locations in the grid are specified as “check-in” points and the robot is supposed to radio a progress report from these points when it is one-fourth, one-half, and three-fourths of the way through its tour of inspection. To avoid unnecessary wear and tear on the surface of the ice, the robot must begin its tour of the grid from the lower left corner, designated in (row,column) coordinates as (0,0), visiting every other grid location exactly once and ending its tour in row 0, column 1. Moreover, if there are multiple tours that the robot can follow, then a different one is to be used each day. The robot is able to move only one square per time step in one of the four compass directions: north, south, east, or west. You are to design a program that determines how many different tours are possible for a given grid size and a sequence of three check-in points. For example, suppose the lake surface is marked off in a 3 × 6 grid and that the check-in points, in order of visitation, are (2,1), (2,4), and (0,4). Then the robot must start at (0,0) and end at (0,1) after visiting all 18 squares. It must visit location (2,1) on step 4 (= ⎣18/4⎦), location (2,4) on step 9 (= ⎣18/2⎦), and location (0,4) on step 13 (= ⎣3×18/4⎦). There are just two ways to do this (see Figure 8). Note that when the size of the grid is not divisible by 4, truncated division is used to determine the three check-in times.
Figure 8
Note that some configurations may not permit any valid tours at all. For example, in a 4 × 3 grid with check-in sequence (2,0), (3,2), and (0,2), there is no tour of the grid that begins at (0,0) and ends at (0,1). Input The input contains several test cases. Each test case begins with a line containing two integers m and n, where 2 ≤ m,n ≤ 8, specifying the number of rows and columns, respectively, in the grid. This is followed by a line containing six integer values r1, c1, r2, c2, and r3, c3, where 0 ≤ ri < m and 0 ≤ ci < n for i = 1, 2, 3. Following the last test case is a line containing two zeros. Output Display the case number, beginning at 1, followed by the number of possible tours that begin at row 0, column 0, end at row 0, column 1, and visit row ri, column ci at time ⎣ i × m × n / 4⎦ for i = 1, 2, 3. Follow the format of the sample output.

Sample Input Output for the Sample Input 3 6 2 1 2 4 0 4 4 3 2 0 3 2 0 2 0 0
Case 1: 2Case 2: 0
Chocolate candy, ava You find thare very pithem. You a program Your chocochocolate, may then rsingle rectawell: you w For exampthat containinput.)
Input The input cline containThis is follThe next liparts. The input i Output For each tedesired wa Sample In4 3 4 6 3 2 1 2 2 3 1 5 0
in its many forailable in virtua
hat the only thiicky and have dhave found it that solves the
olate comes asyou may break
repeatedly breaangular portionwill break up y
ple, Figure 9 shn 6, 3, 2, and 1
consists of mulning a single inlowed by a lineine contains n p
is terminated b
est case, first day: display “Ye
nput
S
rms is enjoyed ally every coun
ing better than different appetincreasingly di
e problem once
s a rectangular k one bar into tak the resultingn of the chocolyour bar only if
hows one way t1 pieces respec
ltiple test casesnteger n (1 ≤ ne containing twpositive intege
by a line contai
isplay its case es” if it is poss
ProbSharing Problem
by millions ofntry around the
eating chocolaites: some wouifficult to deter
e and for all!
bar. The bar cotwo pieces alon
g pieces in the slate that has a sf all of it can be
that a chocolatetively, by brea
F
s, each describ ≤ 15), the num
wo integers x aners, giving the n
ning the intege
number. Then sible, and “No”
blem JChoco
ID: choco
f people arounde world.
ate is to share iuld like more armine whether
onsists of sameng a division bsame manner. specified numbe distributed to
e bar consistinaking it 3 times
Figure 9
ing a chocolatember of parts innd y (1 ≤ x, y ≤number of piec
er zero.
display wheth” otherwise. Fo
Output forCase 1: Case 2:
J late
olate
d the world eve
it with friends.and others less r their demands
e-sized rectangbetween rows oEach of your f
ber of pieces. Yo your friends,
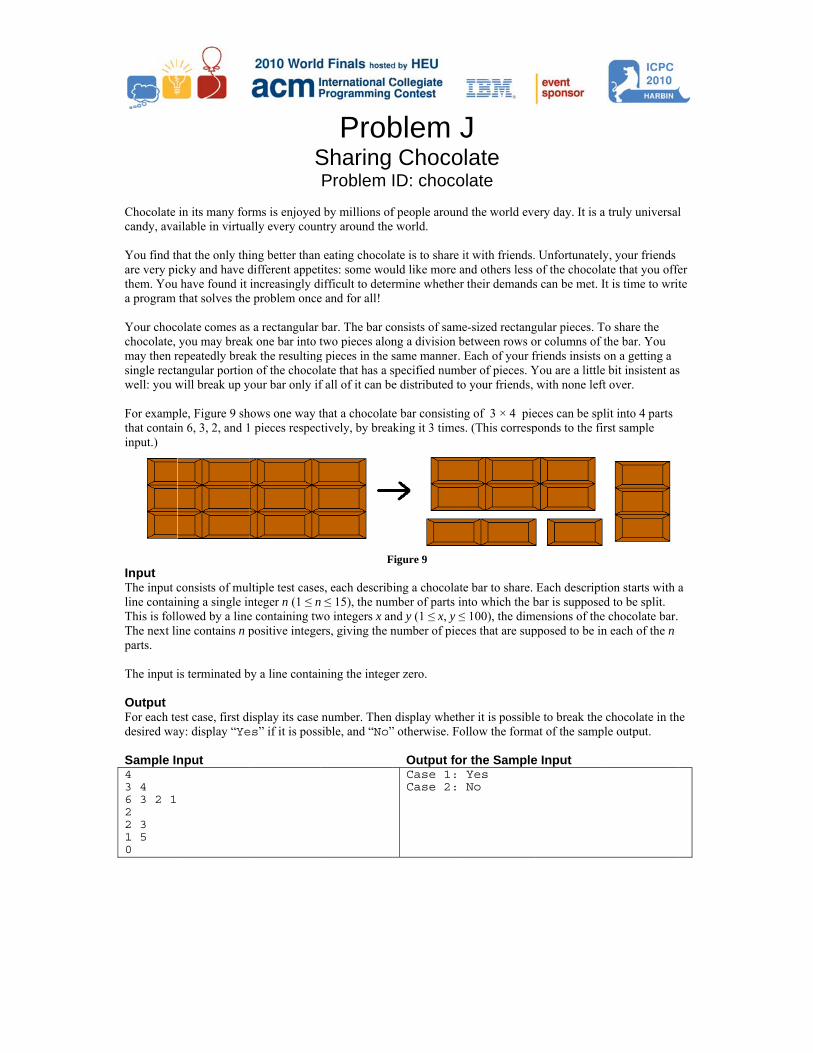
g of 3 × 4 pies. (This corresp
e bar to share. nto which the b≤ 100), the dimces that are sup
her it is possibleollow the forma
r the SampleYesNo
ery day. It is a
Unfortunatelyof the chocola
s can be met. It
gular pieces. Toor columns of tfriends insists oYou are a little with none left
eces can be spliponds to the fir
Each descriptibar is supposed
mensions of the pposed to be in
e to break the cat of the sampl
e Input
truly universal
y, your friends te that you offet is time to writ
o share the the bar. You on a getting a bit insistent asover.
it into 4 parts rst sample
ion starts with ad to be split. chocolate bar.
n each of the n
chocolate in thle output.
l
fer te
s
a
he

This page intentionally left blank.
Problem K Paperweight
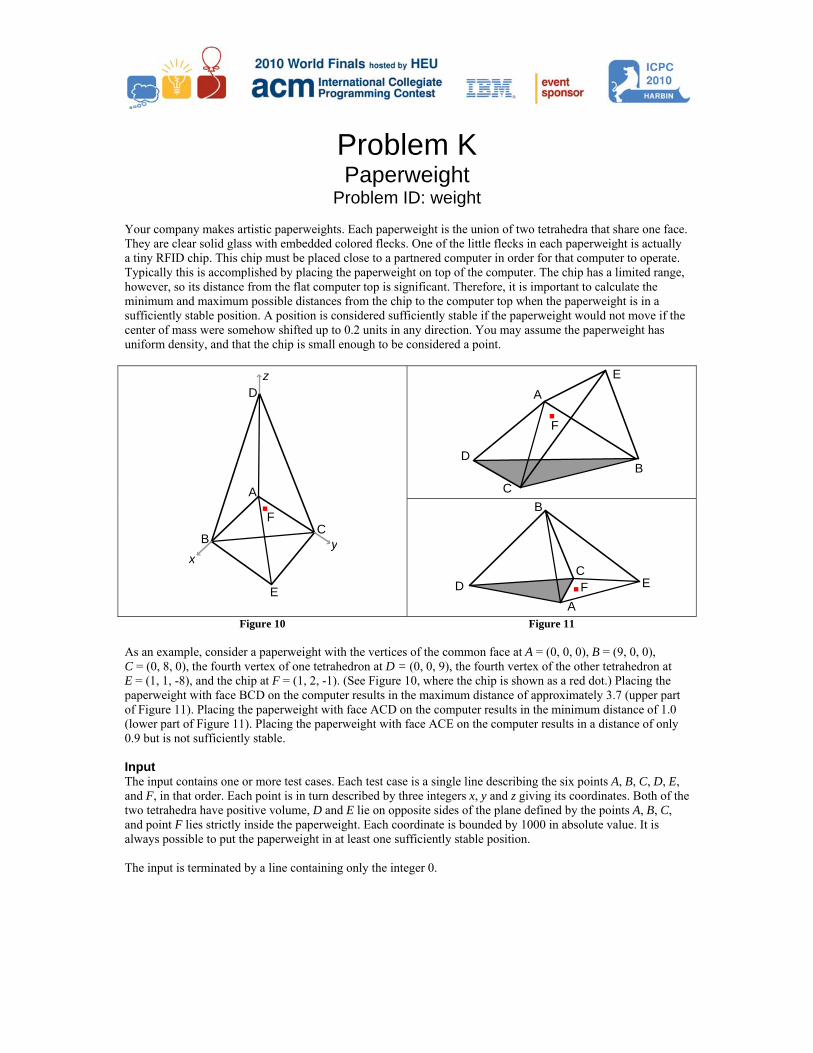
Problem ID: weight Your company makes artistic paperweights. Each paperweight is the union of two tetrahedra that share one face. They are clear solid glass with embedded colored flecks. One of the little flecks in each paperweight is actually a tiny RFID chip. This chip must be placed close to a partnered computer in order for that computer to operate. Typically this is accomplished by placing the paperweight on top of the computer. The chip has a limited range, however, so its distance from the flat computer top is significant. Therefore, it is important to calculate the minimum and maximum possible distances from the chip to the computer top when the paperweight is in a sufficiently stable position. A position is considered sufficiently stable if the paperweight would not move if the center of mass were somehow shifted up to 0.2 units in any direction. You may assume the paperweight has uniform density, and that the chip is small enough to be considered a point.
Figure 10 Figure 11
As an example, consider a paperweight with the vertices of the common face at A = (0, 0, 0), B = (9, 0, 0), C = (0, 8, 0), the fourth vertex of one tetrahedron at D = (0, 0, 9), the fourth vertex of the other tetrahedron at E = (1, 1, -8), and the chip at F = (1, 2, -1). (See Figure 10, where the chip is shown as a red dot.) Placing the paperweight with face BCD on the computer results in the maximum distance of approximately 3.7 (upper part of Figure 11). Placing the paperweight with face ACD on the computer results in the minimum distance of 1.0 (lower part of Figure 11). Placing the paperweight with face ACE on the computer results in a distance of only 0.9 but is not sufficiently stable. Input The input contains one or more test cases. Each test case is a single line describing the six points A, B, C, D, E, and F, in that order. Each point is in turn described by three integers x, y and z giving its coordinates. Both of the two tetrahedra have positive volume, D and E lie on opposite sides of the plane defined by the points A, B, C, and point F lies strictly inside the paperweight. Each coordinate is bounded by 1000 in absolute value. It is always possible to put the paperweight in at least one sufficiently stable position. The input is terminated by a line containing only the integer 0.
A
E
BC
D
xy
z
F
DB
E
C
A
F
D
B
EC
AF

Output For each test case, display the case number followed by the minimum and maximum distances from the chip to the base plane when the paperweight is sufficiently stable. These numbers should be rounded and displayed to five digits after the decimal point. Follow the format in the sample output. Sample Input Output for the Sample Input 0 0 0 9 0 0 0 8 0 0 0 9 1 1 -8 1 2 -10 0 0 7 0 0 0 7 0 0 0 7 -1 -2 -3 2 2 2 1 2 3 6 2 3 -2 6 3 -1 0 7 4 1 -2 -1 5 3 0
Case 1: 1.00000 3.73526 Case 2: 0.57735 2.66967 Case 3: 0.28214 5.00871