
Problem debt and low-income households - IFS
61
Problem debt and low-income households Andrew Hood Robert Joyce David Sturrock
Transcript of Problem debt and low-income households - IFS

Problem debt and low-income households
Andrew HoodRobert JoyceDavid Sturrock

Problem debt and low-income households
Andrew Hood Robert Joyce David Sturrock Copy-edited by Judith Payne
The Institute for Fiscal Studies

Published by
The Institute for Fiscal Studies
7 Ridgmount Street London WC1E 7AE
Tel: +44 (0) 20-7291 4800 Fax: +44 (0) 20-7323 4780 Email: [email protected] Website: http://www.ifs.org.uk
© The Institute for Fiscal Studies, January 2018
ISBN 978-1-911102-77-9

Preface The Joseph Rowntree Foundation has supported this project as part of its programme of research and innovative development projects, which it hopes will be of value to policymakers, practitioners and service users. The facts presented and views expressed in this report are, however, those of the authors and not necessarily those of the Foundation. Neither are the views expressed necessarily those of the other individuals or institutions mentioned here, including the Institute for Fiscal Studies, which has no corporate view. The authors also gratefully acknowledge funding from the IFS Retirement Savings Consortium, which comprises Age UK, Association of British Insurers, Chartered Insurance Institute, Department for Work and Pensions, HM Revenue and Customs, HM Treasury, Investment Association, Legal and General Investment Management, Money Advice Service, and Tax Incentivised Savings Association. Support from the ESRC-funded Centre for the Microeconomic Analysis of Public Policy (CPP) at IFS, grant reference ES/M010147/1, is also gratefully acknowledged.
The Wealth and Assets Survey data are collected by the Office for National Statistics and made available by the UK Data Archive (crown copyright). The British Household Panel Survey data were supplied through the UK Data Archive and are copyright Institute for Social and Economic Research.
The authors would like to thank Helen Barnard, Carl Emmerson, members of the advisory group and members of the IFS Retirement Savings Consortium for helpful comments. Any errors and all views expressed are those of the authors.

Contents Executive summary 5 1. Introduction 9 2. Unsecured household debt in Great Britain 11
2.1 The size and distribution of unsecured household debt in Great Britain 12 2.2 Who is in debt? 16 2.3 Assets and net indebtedness 18 2.4 Persistence of debt holdings over time 20
3. The immediate term: ‘debt servicing pressure’ 22 3.1 How does debt become a problem for households? 23 3.2 A definition of ‘immediate servicing pressure’ 25 3.3 Characteristics of individuals in households under servicing pressure 26 3.4 The role of assets 30 3.5 Summary 31
4. The dynamics of ‘servicing pressure’ 33 4.1 Entry into immediate servicing pressure 34 4.2 Exit from immediate servicing pressure 39 4.3 Summary 42
5. The medium term: ‘repayment pressure’ 44 5.1 A benchmark measure of repayment pressure 45 5.2 Accounting for income growth and the timing of repayments 48 5.3 Accounting for different possible income paths 51 5.4 Summary 54
6. Conclusion 55 Appendix A 56 Appendix B 58 References 60

Executive summary
© Institute for Fiscal Studies 5
Executive summary
Unsecured household debt in Great Britain
Around half of households in Great Britain in 2012–14 had some unsecured consumer debt, with 10% of households holding over £10,000 of such debt.
Almost half of this kind of debt is from formal loans (43%), with credit and store card debt (25%) and hire purchase debt (21%) the next most significant categories.
Those with lower incomes are less likely to hold any unsecured debt, but are more likely to be in ‘net debt’, with unsecured debts of greater value than their financial assets.
35% of those in the lowest income decile have debts of greater value than their financial assets. This compares with 10% in the highest income decile.
Those who held debt in 2012–14 were likely to have held debt for a number of years.
More than half of those who had debts when interviewed in 2012–14 had debts on all four occasions they were interviewed (spanning a period of six years).
While debts can be a sign that a household is struggling to manage its finances, they can also be an appropriate and manageable response to negative shocks or an anticipated income rise.
It is important for policymakers looking to address ‘problem debt’ to distinguish between these different possibilities, based in part on the wider economic circumstances of households.
The immediate term: ‘debt servicing pressure’
The proportion of individuals spending more than a quarter of their income on servicing unsecured debts is relatively similar for different income groups.
From the second-lowest to the top income decile, the proportion remains between 5% and 7%. The rate is higher in the lowest income decile, at 12%.

Problem debt and low-income households
6 © Institute for Fiscal Studies
Being in arrears on debts or other payment obligations (e.g. utility bills) is highly concentrated amongst the lowest-income households – 16% of those in the lowest income decile are in arrears compared with just 1% of those in the highest decile.
As a result, according to a measure of ‘immediate servicing pressure’ defined as spending more than a quarter of current income servicing debts or being in arrears, the proportion of individuals in a household that is under pressure is 25% in the lowest income decile and just 6% in the highest decile.
Low-educated young adults are more likely to face servicing pressure than high-educated young adults due both to higher rates of arrears and to higher costs of servicing their debts.
This is despite the fact that the two groups hold similar amounts of unsecured debt relative to income (student loans are not included). Low-educated individuals hold more of their debt as types such as mail order and hire purchase debt, which have faster repayment rates.
Differences in asset holdings provide one important reason to be more concerned about low-income households that face servicing pressure than high-income ones.
Of those individuals under immediate servicing pressure, 64% in the lowest income decile had financial assets worth less than half their debts, compared with 29% in the highest income decile.
The dynamics of ‘servicing pressure’
Low-income households are significantly more likely to enter servicing pressure than those with higher incomes.
Entry rates fall from 11% in the lowest income quintile to 4% in the highest. This difference is entirely driven by lower-income households being much more likely to fall into arrears.
Those with lower incomes are more likely to get stuck in servicing pressure than those with higher incomes.
44% of those in the bottom income quintile under servicing pressure were still under servicing pressure two years later, compared with 34% of those in the top income quintile. This is driven by the fact that low-income individuals who are in arrears are more likely to be in arrears two years later than those on high incomes.

Executive summary
© Institute for Fiscal Studies 7
Entry into servicing pressure is much more likely to be explained by a rise in debt servicing costs than by a fall in income.
58% of those who entered servicing pressure due to their repayment-to-income ratio rising saw their servicing costs rise by at least a quarter of their income. By contrast, only 15% had income falls that were alone sufficient for entry into servicing pressure.
Those remaining under servicing pressure due to persistently high repayments have higher debt-to-income ratios and are more likely to take out additional debt when already under pressure.
27% of those who remained under servicing pressure saw their credit card debt rise by at least a tenth of their income, compared with just 12% of those who left servicing pressure.
The medium term: ‘repayment pressure’
When considering whether unsecured debts might pose problems for a household, it is important to consider not just servicing pressure (which may arise temporarily) but also whether unsecured debts will be a struggle to repay over the medium term.
Defining a measure of ‘repayment pressure’, we identify households whose total debt burden, less any financial assets, is greater than 20% of household income. Using this measure, 9% of individuals were in a household under repayment pressure in 2012–14.
As with immediate servicing pressure, it is low-income and younger households that look most likely to struggle to repay their debts over the longer term.
The percentage of individuals under repayment pressure (on the measure above) falls from 14% of those aged 20–24 to 1% of those aged 80–84 and from 13% in the lowest income decile to 3% in the highest income decile.
Taking account of the facts that debt will be repaid out of future income, and that incomes tend to grow over time, does tend to make repayments look more manageable for some groups.
The debt repayments of younger adults look slightly more manageable once one accounts for the fact that their incomes are expected to increase, but there is almost no impact on repayment pressure among older working-age adults.

Problem debt and low-income households
8 © Institute for Fiscal Studies
Accounting for the fact that some people are only temporarily on low incomes reduces the percentage of low-income households expected to be under repayment pressure.
The percentage of individuals in the lowest income decile in a household under repayment pressure falls from 15% to 9% when taking this uncertainty into account. However, doing this makes little difference to the rate of repayment pressure for low-income households with children.

Introduction
© Institute for Fiscal Studies 9
1. Introduction In recent years, the debt holdings of households in Great Britain have been a subject of attention and concern amongst policymakers and the general public. In particular, there has been heightened awareness of unsecured household debt or ‘consumer credit’ such as credit card debt, hire purchase agreements and unsecured loans. A source of particular concern has been the increase in the total volume of outstanding consumer credit shown in Figure 1.1: according to the Bank of England’s measure (discussed in more detail in Section 2.1), total consumer credit in real terms has risen from less than £170 billion in 2013 to more than £200 billion.
One aspect of the concern around unsecured debt is that keeping up with repayments on these debts may place significant financial and psychological burdens on households. Requirements to make large repayments could have effects on households’ ability to purchase other essential items, with immediate impacts on the well-being of members of the household. Extended periods when income is being used to make debt payments may mean that households cannot make important investments, with knock-on consequences for future life prospects.
Yet households can hold debt for good reasons. Credit cards and loans can be used to meet unexpected costs or to smooth over periods when income is temporarily low. Hire purchase and leasing agreements may enable a household to access a durable good, such as a car, sooner than would otherwise be the case. Such decisions may be perfectly reasonable, and indeed actually beneficial to a household whose income in future will allow it to meet debt repayments without getting into problems.
It is therefore crucial to distinguish between the occasions when debt is a problem and those when it is not. To do this, we need to go beyond aggregate figures about debt
Figure 1.1. Outstanding amounts of consumer credit lending to individuals in the UK
Note: Figures adjusted for inflation using the CPI.
Source: Bank of England series LPMBI2O.
0
50
100
150
200
250
300
01-A
pr-9
3 01
-Apr
-94
01-A
pr-9
5 01
-Apr
-96
01-A
pr-9
7 01
-Apr
-98
01-A
pr-9
9 01
-Apr
-00
01-A
pr-0
1 01
-Apr
-02
01-A
pr-0
3 01
-Apr
-04
01-A
pr-0
5 01
-Apr
-06
01-A
pr-0
7 01
-Apr
-08
01-A
pr-0
9 01
-Apr
-10
01-A
pr-1
1 01
-Apr
-12
01-A
pr-1
3 01
-Apr
-14
01-A
pr-1
5 01
-Apr
-16
01-A
pr-1
7
Cons
umer
cre
dit (
£ bi
llion
)

Problem debt and low-income households
10 © Institute for Fiscal Studies
holdings and look at individual households’ situations and the circumstances in which debt is taken on and paid off. In this report, we set up and examine metrics that bring together different aspects of households’ situations to capture better when debt may be problematic. Understanding the nature and evolution of cases where debt can lead to problems will increase our understanding of why this can happen and so inform responses which seek to alleviate or prevent ’problem debt’.
In this report, we aim to build on a range of previous research into ‘problem debt’.1 We do this using the Office for National Statistics (ONS)’s Wealth and Assets Survey (WAS), which interviews a representative sample of Great British households on a rolling two-year basis, such that each household is re-interviewed biennially where possible. We focus on the objective characteristics of households and their financial situations. This should be seen as complementary to analyses that draw on households’ subjective experiences of holding debt as well or instead, such as Department for Work and Pensions (2017).
The report begins in Chapter 2 with some context on the debt holdings of households in Great Britain and how those holdings are related to other characteristics. In Chapter 3, we set up and analyse a definition of ‘immediate servicing pressure’, which tries to identify those households for which meeting debt obligations is a significant current financial pressure. One way of exploring why ‘servicing pressure’ arises and considering when it may be most problematic is to examine its dynamics: when does it arise and how do households escape from it? We turn to these questions in Chapter 4. Finally, in Chapter 5, we take a medium-term view of households’ debt positions. It is important to consider not just whether households face servicing pressure at a given point in time. Such pressures may arise temporarily and with good reason without posing problems for a household. By asking whether, over a longer time period, households will struggle to repay their debts, we may get further insight into the sorts of individuals most likely to be at risk of being adversely affected by their debt holding.
1 For a recent example, see Department for Work and Pensions (2017).

Unsecured household debt in Great Britain
© Institute for Fiscal Studies 11
2. Unsecured household debt in Great Britain
Key findings
Around half of households in Great Britain in 2012–14 had some unsecured consumer debt, with 10% of households holding over £10,000 of such debt.
Almost half of this kind of debt is from formal loans (43%), with credit and store card debt (25%) and hire purchase debt (21%) the next most significant categories.
Those with lower incomes are less likely to hold any unsecured debt, but are more likely to be in ‘net debt’, with unsecured debts of greater value than their financial assets.
35% of those in the lowest income decile have debts of greater value than their financial assets. This compares with 10% in the highest income decile.
Those who held debt in 2012–14 were likely to have held debt for a number of years.
More than half of those who had debts when interviewed in 2012–14 had debts on all four occasions they were interviewed (spanning a period of six years).
While debts can be a sign that a household is struggling to manage its finances, they can also be an appropriate and manageable response to negative shocks or an anticipated income rise.
It is important for policymakers looking to address ‘problem debt’ to distinguish between these different possibilities, based in part on the wider economic circumstances of households.
This chapter sets out the context for the rest of the report, with a brief overview of the debt holdings of households in Great Britain. Going beyond the headline statistics about the total amount of debt that households have, we look at the different types and sizes of debts held by different kinds of households, and how the debt holdings of particular households tend to change over time.

Problem debt and low-income households
12 © Institute for Fiscal Studies
To do this, we use data on household debt holdings from the Wealth and Assets Survey, which interviews a representative sample of British households every two years. At the time of writing, four ‘waves’ of the survey are available, covering the period from 2006–08 to 2012–14. Households are followed across multiple waves of the survey, allowing us to observe the evolution of debt holdings over time for a large and broadly representative sample of households.2
In our analysis, we focus on unsecured household debt with repayments that are not income-contingent. This means that we exclude two important types of household debt. We exclude mortgage debt on the basis that these debts are secured against housing; and we exclude student loans from the Student Loans Company (SLC) on the basis that the level of repayments for these loans is income-contingent, meaning that the lowest-income households do not repay them.3
The forms of debt that are included in our measure of household debt can be grouped into those with fixed monthly repayments (whether as the result of a formal contract or an informal agreement) and those without. Debts with fixed repayment terms include all unsecured loans (both formal loans from institutions and other loans from individuals) and other credit agreements such as hire purchase agreements, payments for purchases from mail order catalogues, and other payments for goods and services that are being made in instalments.4,5 Debts without fixed repayments include credit and store cards, overdrafts, and arrears on household bills and credit agreements. In the case of a credit or store card, we measure the level of debt held by a household as the amount left outstanding on its most recent bill for that card. Importantly, this means that a household in which individuals use credit cards but repay their balance fully at the end of each statement period does not have credit card debt according to our measure. Finally, we consider a household to be in arrears on its bills or credit agreements only if it has missed two or more consecutive payments.
2.1 The size and distribution of unsecured household debt in Great Britain
In 2012–14, households in Great Britain held a total of £83 billion of unsecured debt on our measure. Box 2.1 explains how this estimate of household debt compares with estimates of other measures of debt holdings. The levels of household debt in the WAS are lower
2 Wave 4 of WAS interviewed 20,247 households, covering 46,455 individuals. Over the four waves, 93,362
household interviews were carried out. 3 All individuals in our data who are making SLC repayments began university before 2012 and therefore the
overwhelming majority do not make any repayments if their earnings are below a certain threshold (between £15,795 in 2012–13 and £17,775 in 2017–18) and they make repayments worth 9% of earnings above this threshold. Excluding these debts therefore makes sense given the focus of this report on ‘problem debt’.
4 We use the term ‘hire purchase’ to refer to all forms of credit agreement where the individual agrees to pay the creditor a series of payments in return for either the immediate or eventual ownership of a good or service.
5 Hire purchase agreements may be perceived as a form of secured debt as individuals can commonly be required to return the good to which the agreement pertains if they fail to keep up their repayments. However, an individual does not actually own the good until all instalments are paid and hire purchase agreements generally prohibit the sale of the good until that point. Moreover, the Consumer Credit Act (1974) allows the creditor to enforce payment of half the value of the good, even if it is returned by the individual and the agreement is terminated. Hire purchase has many of the characteristics of an unsecured debt, from the perspective of the debtor.

Unsecured household debt in Great Britain
© Institute for Fiscal Studies 13
than other comparable estimates. This could reflect under-reporting of debt holdings such that our findings may represent a conservative assessment of the extent of debt holdings. Our estimate gives an average of £3,200 of debt for each household in Great Britain, but
Box 2.1. Alternative estimates of household debt
WAS is one of multiple sources of data about household debt. Here, we compare the estimates of debt holdings in WAS with the Bank of England’s consumer credit statistics and with the Financial Conduct Authority (FCA)’s Financial Lives Survey.
The latest wave of WAS, incorporating data on 20,247 households, gives an estimate of total debt of the types we examine of £83 billion. Of this, £20 billion was credit card debt. Wave 4 of WAS took place between July 2012 and June 2014, so we can see this figure as average outstanding debt holdings over this period.
The Bank of England releases monthly consumer credit statistics, which combine reports of unsecured loans and advances (excluding student loans), credit card debt, and overdrafts issued by all UK-based monetary financial institutions together with data from the ONS’s monthly survey of credit grantors, which covers non-bank lending. The Bank releases statistics for total outstanding consumer credit of these types and for outstanding credit card debt. Over the period covered by the latest wave of WAS (July 2012 to June 2014), total credit averaged £158 billion and credit card debt averaged £56 billion.a This measure of credit card debt includes all outstanding credit card balances, not just amounts ‘rolled over’ at the end of a statement period.
Table 2.1. Comparison of aggregate unsecured debt statistics (£ billion)
Note: ‘Other’ includes motor finance and other hire purchase, mail order/catalogue debt and arrears debt. WAS and FCA figures show only credit card debt that is ‘rolled over’ from one month to the next. To make FCA per-adult figures comparable to figures from WAS and the Bank, we scale them up by the number of adults in Great Britain in 2017 and deflate by total consumer credit growth from June 2012 to March 2017 (as given by Bank statistics). All figures exclude student loans from the Student Loans Company.
Debt type ONS Wealth and Assets Survey
(July 2012 – June 2014)
Bank of England consumer credit
statistics (July 2012 – June 2014)
FCA Financial Lives Survey
(Jan–April 2017, scaled to match July 2012 – June
2014)
Loans (excl. SLC) 37.0 - 65.2 Overdrafts 4.3 - 4.4 Other 21.8 - 37.2 Total non-credit card 63.0 101.7 106.8 Credit cards 19.9 56.2 27.6 Total 82.9 158.0 134.4

Problem debt and low-income households
14 © Institute for Fiscal Studies
In October 2017, the FCA released a report based on its Financial Lives Survey carried out between January and April 2017 (Financial Conduct Authority, 2017). This survey of 12,865 UK adults asked about holdings of debts of the following types: loans, credit card debt, motor finance debt, overdrafts and other forms of debt (including other hire purchase and catalogue debt). On a comparable basis, the FCA figures are equivalent to total debt of £134 billion and credit card debt of £28 billion. Table 2.1 makes a comparison of debts of each category, from the three data sources.
We should not expect the figures from these different sources to be the same. For example, the WAS and FCA figures include only credit card debt rolled over at the end of a month, whereas the Bank data are intended to capture all outstanding credit card debt. Adjustments to account for the different areas and time periods covered will be imperfect. Nevertheless, we acknowledge there are significant differences between the data sources, and the table suggests that the analysis in this report, since it is based on the WAS data, may understate the overall level of debt.
a Total consumer credit outstanding in September 2017 was £204 billion, a figure that has been widely quoted in the media.
Figure 2.1. Unequal distributions of household debt and income (Lorenz curves)
Note: ‘Debt’ includes total household unsecured debts of the types being examined in this report. ‘Income’ is net household income.
Source: Authors’ calculations using data from wave 4 of WAS.
0%
10%
20%
30%
40%
50%
60%
70%
80%
90%
100%
0% 10% 20% 30% 40% 50% 60% 70% 80% 90% 100%
Cum
ulat
ive
perc
enta
ge o
f deb
t hol
ding
s or
inco
me
Cumulative percentage of households
Debt
Income

Unsecured household debt in Great Britain
© Institute for Fiscal Studies 15
this should not be interpreted as the debt of a ‘typical’ household because debt holdings are very unequally distributed. The detailed household survey data allow us to examine that distribution. While just over half (53%) of households hold no debt at all on our measure, almost a third (32%) hold over £1,000 and a tenth (10%) of households have over £10,000 of debt. Figure 2.1 demonstrates quite how concentrated household debt is by plotting a Lorenz curve. This curve tells us the proportion of household debt that is held by a certain proportion of households. For example, we can see that the most-indebted fifth of households hold fully 90% of total household debt and that the most-indebted tenth hold around 70% of total household debt. For comparison, the figure also shows the Lorenz curve for net income (measured after taxes have been paid and benefits received). In our data, the highest-income fifth of households have 43% of total income and the highest-income tenth 27% of income – a much more equal distribution than that of debt.
As with income, some of the overall inequality in the distribution of debts is due to the fact that individuals hold different amounts of debt at different stages of life. In other words, one would expect to observe inequality in overall debt holdings even if there were no inequality within birth cohorts, simply because different individuals are at different stages of their life cycle. The rest of this chapter shows that these trends in debt holdings by age are significant.
Figure 2.2 illustrates how the total £83 billion of unsecured household debt breaks down into different types of debt. It shows that formal loans make up 43% of debt holdings, with credit and store cards the next largest component at 25% and hire purchase making up 21% of debt holdings (most of which is for the purchase of cars).6
Figure 2.2. Distribution of household debt holdings, by type
Source: Authors’ calculations using data from wave 4 of WAS.
6 ‘Payday loans’ and other forms of short-term high-cost credit are included in formal loans, but their impact is
extremely small since only 30 individuals in the data report having such a loan.
Formal loans 43%
Informal loans 3%
Store cards 1%
Credit cards 24%
Hire purchase 21%
Mail order 1%
Overdraft 5%
Arrears 2%

Problem debt and low-income households
16 © Institute for Fiscal Studies
2.2 Who is in debt?
In this section, we turn to consider how the size and composition of debt holdings vary between different groups of the household population.
We look first at how debt holdings vary with age. Figure 2.3 shows that younger individuals are much more likely to live in a household in debt than are older individuals. Among individuals in their 20s or 30s, around 60–70% are in a household with some form of debt, compared with 39% for those aged 60–64 and only 11% for those aged 80–84. The figure also shows that younger individuals are more likely to be in a household with sizeable debt: 15–20% of those in their 20s, 30s and 40s live in a household with more than £10,000 of debt, compared with 7% of those aged 60–64 and 1% of those aged 80–84.
There are several potential explanations for the observed pattern by age. For example, individuals may take out unsecured debt as a way of ‘smoothing’ their consumption patterns in the face of fluctuations in their income: they may experience a fall in their income that is likely to be temporary and wish to maintain their levels of spending. We would expect that such volatility in income might be more common during working life than at older ages. Individuals might also take on these debts when they need to make unusually large expenditures and do not have savings that they can use to meet them. Older people may be more likely to have built up some savings over working life and so be less likely to use debt for this purpose.
In Figure 2.4, we explore how debt holdings vary with net income (measured after taxes and benefits). In light of the strong relationship between age and debt holdings shown above, and the fact that income and age are also related, we divide individuals into age-specific household equivalised income deciles – more precisely, we divide individuals into
Figure 2.3. Percentage of individuals in households that hold some debt, by age group
Source: Authors’ calculations using data from waves 3 and 4 of WAS.
0%
10%
20%
30%
40%
50%
60%
70%
80%
20–2
4 25
–29
30–3
4 35
–39
40–4
4 45
–49
50–5
4 55
–59
60–6
4 65
–69
70–7
4 75
–79
80–8
4 All
Perc
enta
ge o
f ind
ivid
uals
Age group
Debt
Debt of over £1,000
Debt of over £10,000

Unsecured household debt in Great Britain
© Institute for Fiscal Studies 17
Figure 2.4. Percentage of individuals in households that hold some debt, by age-adjusted income decile
Note: Income deciles are calculated at the individual level, where each individual is assigned the level of net equivalised income of the household to which they belong. Decile rankings are made within four age groups: 29 and below, 30–44, 45–59, and 60 and over.
Source: Authors’ calculations using data from waves 3 and 4 of WAS.
four age groups and calculate household equivalised income deciles within those groups.7 We then show the percentage of individuals in each decile who are in a household holding any debt, the percentage in households with more than £1,000 of debt, and the percentage in households with more than £10,000 of debt. While just under 50% of individuals in both the lowest and highest income deciles have some debt, this figure is closer to 60% in the middle of the distribution. The prevalence of large debt holdings is more clearly increasing with income: while 7% of individuals in the lowest income decile are in a household with debts of more than £10,000, this figure rises to 18% for the highest income decile. As a result, more than 60% of unsecured debt is held by households with above-average incomes.
Figure 2.5 examines whether the types of debts held vary across the income distribution. The proportions of individuals in a household with credit and store card debt and with hire purchase debt are much higher towards the top of the income distribution. 18% of individuals that are part of a household in the bottom decile have some credit or store card debt, but this figure is about 36% in the eighth and ninth deciles (before dropping back to 27% in the top decile). The proportion of individuals in a household with some hire purchase debt has an even stronger association with income, with individuals in the ninth decile being more than twice as likely to be in a household with some hire purchase debt
7 These age groups are 29 and under, 30–44, 45–59, and 60 and over. We use the OECD modified equivalence
scale. In the rest of this report, we will use income deciles calculated on this equivalised within-age-group basis.
0%
10%
20%
30%
40%
50%
60%
70%
Low
est 2 3 4 5 6 7 8 9
Hig
hest
All
Perc
enta
ge o
f ind
ivid
uals
Age-adjusted equivalised income decile
Debt
Debt of over £1,000
Debt of over £10,000

Problem debt and low-income households
18 © Institute for Fiscal Studies
Figure 2.5. Percentage of individuals in households that hold some debt, by age-adjusted income decile
Note: Income deciles are calculated at the individual level, where each individual is assigned the level of net equivalised income of the household to which they belong. Decile rankings are made within four age groups: 29 and below, 30–44, 45–59, and 60 and over.
Source: Authors’ calculations using data from waves 3 and 4 of WAS.
as someone in the bottom decile. In contrast, the proportion of individuals that are in a household in arrears declines steadily with income, from 16% in the bottom income decile to just 1% in the top income decile.
2.3 Assets and net indebtedness
When thinking about the debt holdings of households, it is natural to also think about what assets they have, and in particular whether households are in ‘net debt’ – that is, have debts that are larger than their assets. We consider debts net of two classes of assets. The first is financial assets, which include positive balances in current accounts,8 savings accounts, cash and investment ISAs, National Savings products, shares, bonds, unit and investment trusts, loans made to others, and other informal financial assets.9 The second is net property wealth, which is the total value of all property owned by members of the household less any mortgage debt.
8 The inclusion of current account balances in our measure of financial assets may lead us to overstate asset
holdings to the extent that the balance reflects within-month fluctuations in income and spending commitments.
9 Approximately half of the total value of household financial assets is made up of current and savings accounts and ISAs. For most households, these asset types make up substantially more than half of financial assets. As a result, the patterns in net debt explored in this chapter change very little if financial assets are restricted to include only these most liquid assets.
0%
10%
20%
30%
40%
50%
60%
70%
Low
est 2 3 4 5 6 7 8 9
Hig
hest
All
Perc
enta
ge o
f ind
ivid
uals
Age-adjusted equivalised income decile
Any debt
Formal loans
Informal loans
Credit and store cards
Hire purchase
Arrears

Unsecured household debt in Great Britain
© Institute for Fiscal Studies 19
Figure 2.6 shows the percentages of individuals, overall and in each income decile, living in a household with any unsecured debt, a household in net financial debt, and a household that is in net debt even when net housing wealth is included. Looking first at the overall picture, the figure shows that of the roughly 50% of individuals living in households that have some debt, less than half are in a household that is in net debt when financial assets are taken into account – amounting to around a quarter of individuals in Great Britain. Once net housing wealth is taken into account, that figure falls to 14%.
Figure 2.6 also shows that taking account of assets changes the relationship between income and debt documented in Figure 2.4. While lower-income households are less likely to hold some unsecured debt than higher-income households, they are more likely to be in net debt once financial assets have been accounted for: 35% of individuals in the lowest income decile are in households that are in net debt, compared with 10% in the top income decile. Once housing wealth is included as well, the negative relationship between income and net debt becomes even stronger: 26% of individuals in the lowest income decile live in a household that is in net debt even after accounting for household wealth, compared with just 2% of individuals in the top household income decile. The sharp contrast in the level and patterns of net indebtedness compared with gross indebtedness show the important role of assets in understanding how debt is likely to affect household living standards – something we explore in more detail in subsequent chapters.10
Figure 2.6. Percentage of individuals in households in debt and net debt, by age-adjusted income decile
Note: Income deciles are calculated at the individual level, where each individual is assigned the level of net equivalised income of the household to which they belong. Decile rankings are made within four age groups: 29 and below, 30–44, 45–59, and 60 and over.
Source: Authors’ calculations using data from waves 3 and 4 of WAS.
10 One further component of wealth that may be relevant when considering a household’s financial situation is
its pension wealth – which, if households were allowed to draw on it, could provide a further source of resources. However, only 7% of individuals in net debt when including financial assets are in a household with some defined contribution pension wealth.
0%
10%
20%
30%
40%
50%
60%
70%
Low
est 2 3 4 5 6 7 8 9
Hig
hest
All
Perc
enta
ge o
f ind
ivid
uals
Age-adjusted equivalised income decile
Percentage holding some debt
Percentage in net debt including financial assets
Percentage in net debt including financial assets and net property wealth

Problem debt and low-income households
20 © Institute for Fiscal Studies
It is perhaps surprising that there are a large number of households that continue to hold debts despite the fact that they have sufficient financial assets to clear those debts. One reason that households might be in this situation is that debts and assets may be held by different members of the household who may manage their finances separately. However, we find that of the 31% of individuals who are in a household that has unsecured debts but also enough financial assets to clear those debts, only around a fifth (6% of all individuals) are not also in the same position when only their personal assets and debts are considered. We also find that of the 22% of individuals who are in a household in net financial debt, a large majority of these individuals (74%, or 16% of all individuals) are also in net financial debt when considered on an individual basis.
2.4 Persistence of debt holdings over time
So far, we have looked at households’ debt holdings at one point in time. But a situation in which debt is taken on and quickly paid off may have very different implications for the household concerned from one in which debt persists (and potentially spirals) over longer periods. Using the fact that the WAS follows the same households over time and interviews them every two years, we are able to look directly at this question. Figure 2.7 splits those individuals in households observed with debt in the fourth (and most recent) wave of WAS into groups according to the number of previous waves in which they were in a household in debt, and then looks at how this split varies with age. Looking first at the population as a whole, among those individuals who were interviewed in all four waves of WAS, 53% were in a household with some debt in the most recent wave of data and 31% were in a household with some debt in all four waves. In other words, more than half of
Figure 2.7. Distribution of individuals in households with debt in wave 4 by number of waves in which they were in a household with some debt, by age group
Note: Sample contains only those individuals interviewed in all four waves of WAS.
Source: Authors’ calculations using data from waves 1 to 4 of WAS.
0%
10%
20%
30%
40%
50%
60%
70%
80%
20–2
4
25–2
9
30–3
4
35–3
9
40–4
4
45–4
9
50–5
4
55–5
9
60–6
4
65–6
9
70–7
4
75–7
9
80–8
4 All
Perc
enta
ge o
f ind
ivid
uals
Age group
Latest wave only
2 waves
3 waves
All 4 waves

Unsecured household debt in Great Britain
© Institute for Fiscal Studies 21
those who had debts when last observed had debts on the past four occasions they were interviewed (spanning a period of six years). The figure shows that debt is more persistent at younger ages – while over 60% of those in their 20s and 30s who were in debt in wave 4 of WAS had held debt in all four waves, this figure was around 40% for those in their 70s.
While the persistence of debts does differ by age, there is no clear pattern across the income distribution. However, that is not the case if one looks instead at the persistence of net debt – that is, whether an individual is in a household whose debts are larger than their financial assets. Figure 2.8 shows, for each income decile and overall, the proportion of individuals who were in a household in net debt in wave 4 of WAS, and then splits these individuals by the number of waves in which they were in a household in net debt. It shows that being in net debt is less persistent than being in gross debt. While 58% of those in a household with some debt in wave 4 of WAS had been in a household with some debt in all four waves, this figure was only 36% for net debt. There are at least two reasons for this being the case. First, a household’s level of net debt is at most equal to its level of gross debt, and so leaving net debt requires a smaller change in the amount of debt it has. Second, households’ net debt positions are likely to be more variable over time than their gross debt holdings, as the former are also affected by changes in asset holdings.
Figure 2.8 also shows that net debt is more likely to persist for low-income households than for higher-income ones. While 63% of those in the lowest income decile who were in net debt in wave 4 had been in net debt for at least three of the past four waves, this figure was 44% for those in the highest income decile.
Figure 2.8. Distribution of individuals in net debt in wave 4 by number of waves in which they were in a household in net debt, by age-adjusted income decile
Note: Sample contains only those individuals interviewed in all four waves of WAS. Income deciles are calculated at the individual level, where each individual is assigned the level of net equivalised income of the household to which they belong. Decile rankings are made within four age groups: 29 and below, 30–44, 45–59, and 60 and over.
Source: Authors’ calculations using data from waves 1 to 4 of WAS.
0%
5%
10%
15%
20%
25%
30%
35%
40%
Low
est 2 3 4 5 6 7 8 9
Hig
hest
All
Perc
enta
ge o
f ind
ivid
uals
Age-adjusted equivalised income decile
1 wave
2 waves
3 waves
4 waves

Problem debt and low-income households
22 © Institute for Fiscal Studies
3. The immediate term: ‘debt servicing pressure’
Key findings
The proportion of individuals spending more than a quarter of their income on servicing unsecured debts is relatively similar for different income groups.
From the second-lowest to the top income decile, the proportion remains between 5% and 7%. The rate is higher in the lowest income decile, at 12%.
Being in arrears on debts or other payment obligations (e.g. utility bills) is highly concentrated amongst the lowest-income households – 16% of those in the lowest income decile are in arrears compared with just 1% of those in the highest decile.
As a result, according to a measure of ‘immediate servicing pressure’ defined as spending more than a quarter of current income servicing debts or being in arrears, the proportion of individuals in a household that is under pressure is 25% in the lowest income decile and just 6% in the highest decile.
Low-educated young adults are more likely to face servicing pressure than high-educated young adults due both to higher rates of arrears and to higher costs of servicing their debts.
This is despite the fact that the two groups hold similar amounts of unsecured debt relative to income (student loans are not included). Low-educated individuals hold more of their debt as types such as mail order and hire purchase debt, which have faster repayment rates.
Differences in asset holdings provide one important reason to be more concerned about low-income households that face servicing pressure than high-income ones.
Of those individuals under immediate servicing pressure, 64% in the lowest income decile had financial assets worth less than half their debts, compared with 29% in the highest income decile.

The immediate term: ‘debt servicing pressure’
© Institute for Fiscal Studies 23
We now move from simply describing the debt holdings of households in Great Britain to attempting to assess when those debts may be a problem for those households. In this chapter, we attempt to identify those households for which keeping up with their current debt repayments is a significant financial burden. In subsequent chapters, we consider other senses in which debt may be problematic.
3.1 How does debt become a problem for households?
There are many channels through which a household’s debts can impact the living standards and well-being of its members. In this chapter, we focus on the fact that holding debt has immediate consequences when it requires a household to make payments towards that debt. Simply put, making repayments uses up some of a household’s available disposable income, leaving a smaller amount to spend on other goods and services. In terms of the direct impact on material living standards at a given point in time, there is no difference between paying interest on a debt and repaying the principal sum owed – the immediate impact of debt is through the total amount that a household must pay to keep up its schedule of repayments. This total required payment can be referred to as the debt servicing cost. Box 3.1 details the ways in which we measure households’ debt servicing costs using WAS.
Box 3.1. Measuring the servicing costs of debt
WAS includes a range of questions that we can use to construct a measure of the debt servicing costs of households. As outlined in Chapter 2, unsecured debt can be separated into those debts with fixed monthly repayments and those without such structure. In the former case (loans, hire purchase and credit agreements, and mail order debt), WAS asks the holders of these debts the size of the repayments they are required to make and the frequency with which these must be made. This allows us to construct a value for the monthly servicing cost for each of these types of debt. One exception is that individuals are not asked about the repayment terms of commercial student loans. In this case, we impute monthly repayment amounts using the information we have about the repayment terms for comparable formal loans.a
For debts without fixed monthly repayments (credit and store cards, overdrafts, and arrears), determining a debt servicing cost is less straightforward, both conceptually and in terms of the information we have available. In the case of credit and store cards, we assume that the cost of servicing this debt is the amount that was repaid on the previous statement. If the minimum payment on the credit or store card has not been made for the previous two statements, then we instead use the current minimum repayment as the servicing cost for that card. If the amount of debt outstanding on the card is less than the amount repaid on the previous statement, then we simply say that the servicing cost is the total amount outstanding.
For overdrafts and arrears, we do not create any measure of debt servicing costs as we do not know the terms on which these must be repaid. For example, we do not know whether an overdraft is interest free – in which case it could reasonably be assumed to have a servicing cost of zero. Our approach means that we are likely to underestimate the servicing costs of overdraft debt in some cases. While 21% of individuals are in a household with some overdraft debt, since overdrafts make up just 5% of the total debt

Problem debt and low-income households
24 © Institute for Fiscal Studies
that we examine this underestimation is unlikely to be quantitatively significant. We are also likely to underestimate the cost of servicing arrears but, as we will see, whether or not a household is deemed to be under ‘repayment pressure’ will not depend on what is assumed about the repayment terms for arrears.
a Using all formal loans in repayment, we run a regression of monthly repayment on the outstanding loan amount and a quadratic term in the age of the loan holder. We do this separately for individuals of each of three education levels. Using the estimated relationship, we generate the predicted monthly repayment for each student loan. We impute with ‘error’ by assigning to each student loan a randomly drawn residual from the loans regression.
Different types of debt may have very different repayment terms. Even within types of debt, repayment terms may also vary across households depending on their perceived creditworthiness or choices about how to structure their debt holdings. This means that two households holding similar levels of debt may face very different servicing costs. Figure 3.1 shows the median debt and debt servicing costs among holders of certain types of debt. We can see that there is indeed a lot of variation in the relationship between amounts of debt and the cost of servicing that debt. While the median level of debt held varies from £200 in the case of mail order debt to £5,400 in the case of formal loans, the median repayment amounts for each of formal loans, hire purchase and credit cards are very similar, at around £150 per month, implying very different rates of repayment across these different types of debt. While credit card and hire purchase debts are much smaller than formal loan debts on average, they tend to be repaid at much faster rates. The median monthly repayment rate as a percentage of the median formal loan debt is 3%, and the figure for hire purchase is 5%.By comparison, that for credit cards is 9% and for mail order is 18%. As a result, a small amount of credit card debt may have just as significant an impact on the living standards of a household as holding a much larger
Figure 3.1. Median debt and debt servicing costs amongst debt holders
Source: Authors’ calculations using data from waves 3 and 4 of WAS.
£0
£30
£60
£90
£120
£150
£180
£0
£1,000
£2,000
£3,000
£4,000
£5,000
£6,000
Formal loans in payment
Hire purchase
Credit cards
Mail order
All debt in
payment
Repa
ymen
t
Deb
t
Median level of debt (LHS)
Median level of debt servicing cost (RHS)

The immediate term: ‘debt servicing pressure’
© Institute for Fiscal Studies 25
formal loan. To give a sense of scale, households in the lowest-income fifth spend an average of £76 per month servicing credit card debt out of a total debt servicing bill of £111 per month, compared with an average income of £1,055 a month.11
3.2 A definition of ‘immediate servicing pressure’
Intuitively, debt is an immediate problem for a household’s material standard of living if the costs of servicing that debt are taking up ‘too large’ a proportion of its income. Our measure of ‘immediate servicing pressure’ seeks to identify individuals who are living in households where debt has the potential to cause such problems.
The core of our definition of ‘immediate servicing pressure’ (or simply ‘servicing pressure’ in this chapter) is to say that those households that spend more than a certain proportion of their monthly income on debt servicing costs are under servicing pressure. Of course, spending the same share of income on debt servicing costs may be more or less difficult to cope with for different households depending on their particular circumstances. In financial terms, the most obvious and relevant circumstances are the household’s income level and whether or not it has any assets that it could use to repay its debts – things we explore in detail in this chapter. Beyond these immediate financial factors, other determinants of a household’s cost of living will determine the exact effect of high debt servicing costs on its members.12
In addition to this ‘debt servicing costs’ element of our measure, we also categorise a household as being under immediate servicing pressure if it is two or more payments in arrears for one or more loans, hire purchase or credit agreements, or household bills. This is on the basis that falling behind on bills can be thought of as a direct indicator that the household may be struggling to deal with its debt obligations.13
Hence, we deem a household to be under immediate servicing pressure if either
it is currently spending more than 25% of its monthly net (after-tax-and-benefit) income on debt servicing
and/or
it is in arrears for two or more consecutive payments on one or more loans, hire purchase or credit agreements, or household bills.
11 The remainder of the average debt servicing bill is made up of formal loan costs (£19 per month), hire-
purchase costs (£10 per month) and mail-order costs (£4 per month). 12 For related discussion of objective measures of over-indebtedness and their relation to financial difficulties,
see Del-Rio and Young (2005), Disney, Bridges and Gathergood (2008) and Bryan, Taylor and Veliziotis (2010). 13 Some households may ‘rationally’ choose to enter arrears if it represents a form of credit on relatively
favourable terms or where other credit is unavailable (see Bridges and Disney (2004)). Even in such cases, households will be required to clear these arrears in a relatively short time frame. The condition that the household is two or more repayments in arrears ensures that the household is highly likely to face pressure to clear these arrears in the immediate or very near future.

Problem debt and low-income households
26 © Institute for Fiscal Studies
Box 3.2. Comparison with ONS’s definition of liquidity problem debt
In April 2017, the Department for Work and Pensions published Improving Lives: Helping Workless Families in which it drew on analysis of the ONS measure of ‘problem debt’. ONS produces definitions of both ‘liquidity’ problems and ‘solvency’ problems and defined a problem debt household as one experiencing problems of either type. Here we compare the ONS ‘liquidity’ problems measure with the measure of immediate servicing pressure set out in this chapter.
The ONS definition of liquidity problem debt is similar to the servicing pressure measure set out in this chapter in that it includes components based on high servicing costs relative to income and on arrears on bills and credit agreements. Specifically, ONS defines a household as having liquidity problems if either
• at least one adult reports falling behind with bills or credit commitments and household debt repayments represent at least 25% of the household’s net monthly income
or
• at least one adult reports falling behind with bills or credit commitments and at least one adult is currently in two or more months’ consecutive arrears on bills or credit commitments.
The ONS definition differs from the servicing pressure definition presented in this chapter in that it requires at least one adult in the household to report being behind with bills or credit commitments. This means that households that are spending large proportions of their income on debt repayments but do not report being behind with any bills or credit agreements will be captured as part of the servicing pressure measure set out in this chapter but not by the ONS definition of liquidity problem debt.
The 25% cut-off for the servicing cost element of our definition is inevitably arbitrary; there is no clear-cut answer about what this threshold should be. We illustrate the way in which varying this threshold changes our analysis in Appendix A. Our measure of immediate servicing pressure is similar to the ONS’s measure of liquidity problem debt. While we focus on objective characteristics of households in identifying servicing pressure, ONS’s definition of problem debt also takes into account households’ reports of their subjective experience of their situation. More detail on the comparison between these two measures is given in Box 3.2.
3.3 Characteristics of individuals in households under servicing pressure
We now turn to look at how prevalent immediate servicing pressure is on our definition, and how that prevalence varies with income and age.

The immediate term: ‘debt servicing pressure’
© Institute for Fiscal Studies 27
Figure 3.2. Percentage of individuals in households facing servicing pressure, by age-adjusted income decile
Note: ‘Servicing costs greater than 25% of income’ includes all individuals in households where monthly spending on debt repayments is greater than 25% of monthly net income. The ‘... or in arrears’ category includes all those individuals who are under ‘immediate servicing pressure’, i.e. either have ‘servicing costs greater than 25% of income’ or are in arrears. Income deciles are calculated at the individual level, where each individual is assigned the level of net equivalised income of the household to which they belong. Decile rankings are made within four age groups: 29 and below, 30–44, 45–59, and 60 and over.
Source: Authors’ calculations using data from waves 3 and 4 of WAS.
To be under servicing pressure on our measure, a household needs to either be spending more than 25% of its income on servicing its debts or be in arrears. Figure 3.2 shows how each of these aspects of our measure contributes to the overall proportion of individuals in each income decile living in households under servicing pressure. 7% of individuals are in households that spend more than 25% of their income on servicing their debts. This fraction is, perhaps surprisingly, relatively similar for different income groups, except for a higher rate in the bottom income decile (of 12%). In contrast, as shown in Section 2.2, the phenomenon of falling into arrears with bills or credit agreements is concentrated among poorer households. As a result, once those individuals living in households with arrears (but not high servicing costs) are included in our measure, the rate of servicing pressure is strongly related to income. 25% of individuals in households in the lowest income decile (and 22% of those in the bottom quintile) are under servicing pressure on our measure, compared with 6% in the top income decile.14 Overall, 13% of individuals are in households under servicing pressure on this measure.
Figure 3.3 plots the prevalence of servicing pressure by age. It shows that the likelihood that an individual lives in a household that is under servicing pressure declines steadily with age, falling from 15–17% amongst those in their 20s and 30s to 7% of those aged 60–64 and to 1% of those aged 80–84. This decline makes sense given that the evidence
14 To give a sense of scale, those in the bottom quintile who are under servicing pressure spend an average of
£457 per month on debt repayments, compared with an average income of £1,012 per month.
0%
5%
10%
15%
20%
25%
30%
Low
est 2 3 4 5 6 7 8 9
Hig
hest
All
Perc
enta
ge o
f ind
ivid
uals
Age-adjusted equivalised income decile
Servicing costs greater than 25% of income
... or in arrears

Problem debt and low-income households
28 © Institute for Fiscal Studies
Figure 3.3. Percentage of individuals under servicing pressure, by age group
Note: ‘Servicing costs greater than 25% of income’ includes all individuals in households where monthly spending on debt repayments is greater than 25% of monthly net income. The ‘... or in arrears’ category includes all those individuals who are under ‘immediate servicing pressure’, i.e. either have ‘servicing costs greater than 25% of income’ or are in arrears.
Source: Authors’ calculations using data from waves 3 and 4 of WAS.
Figure 3.4. Percentage of individuals under servicing pressure, by age group and age left full-time education
Source: Authors’ calculations using data from waves 3 and 4 of WAS.
0%
2%
4%
6%
8%
10%
12%
14%
16%
18%
20–2
4
25–2
9
30–3
4
35–3
9
40–4
4
45–4
9
50–5
4
55–5
9
60–6
4
65–6
9
70–7
4
75–7
9
80–8
4 All
Perc
enta
ge o
f ind
ivid
uals
Age group
Servicing costs greater than 25% of income
... or in arrears
0%
5%
10%
15%
20%
25%
30%
20–2
4 25
–29
30–3
4 35
–39
40–4
4 45
–49
50–5
4 55
–59
60–6
4 65
–69
70–7
4 75
–79
80–8
4 All
Perc
enta
ge o
f ind
ivid
uals
Age group
Aged 16 or below
Aged 17 or 18
Aged 19 or over
Left full-time education:

The immediate term: ‘debt servicing pressure’
© Institute for Fiscal Studies 29
presented in Chapter 2 suggested that younger individuals are more likely to be affected by both components of our measure: they are more likely to be in households that hold debt and they are more likely to be in households that are in arrears.
Young individuals with low levels of education are particularly likely to be living in households under servicing pressure. Figure 3.4 shows that of those individuals who left full-time education at age 16 or below, 24% aged 25–29 are in a household under servicing pressure, falling somewhat to 18% for those aged 35–39. Of those who left education aged 17 or 18, these figures are 16% at both ages. For the most highly educated group – those who remained on in full-time education to age 19 or above – the equivalent figures are just 9% and 10% respectively. It is perhaps particularly interesting that servicing pressure is more prevalent among low-educated than among high-educated individuals even among those aged 20–24, despite the fact that the latter group will have spent much less time in the labour market.
Part of the explanation is that this pattern of higher servicing pressure for lower-educated groups is not driven by higher levels of debt holdings among those groups. In fact, those individuals in their 20s and 30s who stayed in education to age 19 or above have significantly more debt on average than those who left education before the age of 17 – and the size of debt holdings as a share of income is comparable between the two groups. Instead, the higher rates of servicing pressure among low-educated individuals are explained by two things: these people are paying back their debt at a faster rate than average and they are more likely to be in arrears. The primary reason that individuals with
Figure 3.5. Distribution of mean household debt holdings by type for individuals aged 20–39
Source: Authors’ calculations using data from waves 3 and 4 of WAS.
Formal loans 42%
Informal loans 3%
Store cards
1%
Credit cards 21%
Hire purchase
23%
Mail order
3%
Overdraft 4%
Arrears 3%
Low-educated (27%)
Formal loans 54%
Informal loans 3%
Store cards
0%
Credit cards 21%
Hire purchase
15%
Mail order
0%
Overdraft 5%
Arrears 0%
High-educated (38%)

Problem debt and low-income households
30 © Institute for Fiscal Studies
lower education have faster repayment rates is that they tend to hold debt types that are repaid more quickly, such as hire purchase and mail order debt, as opposed to longer-term debt such as formal loans. Figure 3.5 illustrates this by comparing the composition of average debt holdings for those in their 20s and 30s between those with a low level of education (left education at age 16 or below) and those with a high level of education (left education aged 19 or above). It shows that whereas 54% of debt holdings of the high-educated group are formal loans, the figure is 42% for the low-educated group. By contrast, the figures for hire purchase are 16% and 23% respectively. For a given type of debt, there are not large differences in repayment terms across education groups, at least on average.
3.4 The role of assets
Within the group of households identified by our measure as being under servicing pressure, there may be some households that are more of a cause for concern than others, due to differences in other important circumstances. One such circumstance is the amount of assets a household has. If assets are large relative to debts, one might be less concerned about the fact that a household is spending a large share of income on repayments, or in arrears, as it has the potential to use its assets (if sufficiently liquid) to help deal with its servicing pressure.
Figure 3.6. Classification of individuals under servicing pressure according to financial asset holdings of their household (expressed as a percentage of debt holdings)
Note: The four categories of financial asset holdings are: (i) greater than or equal to 100% of debts; (ii) greater than or equal to 50% but less than 100% of debts; (iii) greater than or equal to 10% but less than 50% of debts; and (iv) less than 10% of debts. Income deciles are calculated at the individual level, where each individual is assigned the level of net equivalised income of the household to which they belong. Decile rankings are made within four age groups: 29 and below, 30–44, 45–59, and 60 and over.
Source: Authors’ calculations using data from waves 3 and 4 of WAS.
0%
5%
10%
15%
20%
25%
30%
Low
est 2 3 4 5 6 7 8 9
Hig
hest
All
Perc
enta
ge o
f ind
ivid
uals
Age-adjusted equivalised income decile
≥100%
≥50%, <100%
≥10%, <50%
<10%
Financial assets as % of debts:

The immediate term: ‘debt servicing pressure’
© Institute for Fiscal Studies 31
Of course, it is not always the case that having a large amount of financial assets relative to debts is an indication that debts are unlikely to be a problem for a household. Whether or not assets may be used by a household to meet its debt repayments will depend on whether or not the debts and assets concerned are held by the same individual or by individuals who jointly manage (to some extent) their financial resources and obligations. And even if a household has some financial assets, it may be holding them for some reason, such as if it is anticipating some unusual expenditure in future, or may only be willing to use them if particular situations arise. For these reasons, assets do not feature within our definition of servicing pressure.
In Figure 3.6, we divide individuals in households under servicing pressure into groups depending on the financial assets their household has relative to the household’s debts. We focus here on financial assets as these are most likely to be sufficiently liquid to meet debt repayment obligations in the short term (in a way that housing wealth, for example, is not).15
The figure shows that those with high incomes who are under servicing pressure are likely to have financial assets that could offset a substantial portion, if not all, of their outstanding debts. 58% of those in the highest income decile who are under servicing pressure are in a household with financial assets sufficient to entirely clear its debts, and a further 13% are in a household with financial assets sufficient to clear at least half of its debts. On the other hand, in the lowest income decile, only 27% of those in households under servicing pressure are in a household with financial assets sufficient to clear all debts, and 40% are in a household with financial assets worth less than 10% of its debts.16
Those households that are under servicing pressure and have a small amount of financial assets compared with their outstanding debts might reasonably be seen as the most concerning when thinking about the potential consequences of immediate servicing pressure. In this case, differences in asset holdings provide one reason to be more concerned about low-income households that face servicing pressure on our measure than high-income ones. There may, of course, be other reasons to be more concerned about low-income households under servicing pressure. First, the ‘crowding out’ of other spending by high levels of debt repayments might have a more damaging effect for low-income households, who are less able than higher-income ones to respond by cutting back only on ‘luxury’ or non-essential items. Second, and as a consequence of the first point, low-income households may find it more difficult to make adjustments to their spending in order to clear arrears, which may have further damaging consequences such as restricting future access to credit.
3.5 Summary
In this chapter, we have defined and analysed a measure of ‘immediate servicing pressure’. We have seen that younger and lower-income individuals are more likely to be
15 Adjusting the financial assets used in our analysis by, for example, excluding less liquid assets, such as stocks
and bonds, makes little difference to this picture. 16 Of those who are under servicing pressure and do not have sufficient financial assets to repay their
outstanding debts (40% of those in problem debt), 33% are in households with some defined contribution pension wealth and 18% have sufficient such wealth that, when combined with financial assets, they could repay all of their outstanding debts.

Problem debt and low-income households
32 © Institute for Fiscal Studies
in a household facing immediate servicing pressure: these groups are more likely to be in arrears and young adults are more likely to be spending a high proportion of their income on debt repayments. There is a higher prevalence of servicing pressure among young adults with low levels of education in particular, in large part because they tend to hold more debt with faster repayment terms, such as hire purchase and mail order debt.
We may have more reason to be concerned about certain sorts of individuals who face servicing pressure. Those who have low incomes are much less likely to have significant financial assets (which may help households to meet repayments without cutting back on essential expenditures) and may struggle more generally to reduce their spending to meet servicing pressure. This is borne out by individuals’ reported experiences of debts – lower-income households facing servicing pressure are more likely to report that their debt is a heavy burden: around one in five (21%) individuals in the bottom income decile who faced servicing pressure reported that their debt was a ‘heavy burden’, compared with one in twenty (5%) in the top income decile. When we focus on individuals in households with financial assets less than 10% of their outstanding debts, these figures rise to just over one in three (35%) and one in nine (11%) respectively.17
17 While the majority of individuals under servicing pressure do not report that their debt is a heavy burden, this
reflects the fact that, on average, individuals are more than twice as likely to be under servicing pressure as to report that their debt is a heavy burden.

The dynamics of ‘servicing pressure’
© Institute for Fiscal Studies 33
4. The dynamics of ‘servicing pressure’
Key findings
Low-income households are significantly more likely to enter servicing pressure than those with higher incomes.
Entry rates fall from 11% in the lowest income quintile to 4% in the highest. This difference is entirely driven by lower-income households being much more likely to fall into arrears.
Those with lower incomes are more likely to get stuck in servicing pressure than those with higher incomes.
44% of those in the bottom income quintile under servicing pressure were still under servicing pressure two years later, compared with 34% of those in the top income quintile. This is driven by the fact that low-income individuals who are in arrears are more likely to be in arrears two years later than those on high incomes.
Entry into servicing pressure is much more likely to be explained by a rise in debt servicing costs than by a fall in income.
58% of those who entered servicing pressure due to their repayment-to-income ratio rising saw their servicing costs rise by at least a quarter of their income. By contrast, only 15% had income falls that were alone sufficient for entry into servicing pressure.
Those remaining under servicing pressure due to persistently high repayments have higher debt-to-income ratios and are more likely to take out additional debt when already under pressure.
27% of those who remained under servicing pressure saw their credit card debt rise by at least a tenth of their income, compared with just 12% of those who left servicing pressure.
In the previous chapter, we looked at what kind of individuals live in households facing immediate servicing pressure. This was defined as being in a household that is either spending more than 25% of its monthly income on debt repayments or is in arrears. Clearly, households making debt repayments of more than a certain share of income will not always find their debts are a problem, nor does our definition imply that these households are acting irrationally; people’s circumstances, and the reasons for acquiring

Problem debt and low-income households
34 © Institute for Fiscal Studies
debt, are far more complicated than that. For example, if a household has just suffered an unexpected fall in income, or expects its income to rise considerably in future, a high level of debt repayment relative to income may be entirely sensible.
The circumstances under which servicing pressure arises will therefore be important for whether or not such a situation will be problematic for a household. Furthermore, how long the period of servicing pressure persists is another potentially important factor. In this chapter, we look to address these issues by exploring the circumstances in which individuals enter and leave servicing pressure.
4.1 Entry into immediate servicing pressure
We first consider individuals moving into servicing pressure. We do this by examining individuals who were not in a household under servicing pressure (according to our measure) when interviewed in 2010–12, but were under servicing pressure when interviewed in 2012–14. In our sample, 7% of individuals moved into servicing pressure between these two surveys. Mechanically, we register a movement into servicing pressure when the household of which the individual is a member sees the cost of servicing its debts rise above 25% of its net income, or when the household enters arrears for two consecutive payments on one or more debts, or if both of these changes occur.
Figure 4.1. Percentage of individuals entering immediate servicing pressure, by type of entry and age-adjusted income quintile pre-entry
Note: Individuals are classified according to their 2010–12 (wave 3) income quintile. Income quintiles are calculated at the individual level, where each individual is assigned the net equivalised level of income of the household to which they belong. Decile rankings are made within four age groups: 29 and below, 30–44, 45–59, and 60 and over.
Source: Authors’ calculations using data from waves 3 and 4 of WAS.
0%
2%
4%
6%
8%
10%
12%
Lowest 2 3 4 Highest All
Perc
enta
ge o
f ind
ivid
uals
Age-adjusted equivalised income quintile
Entry due to both servicing costs and arrears Entry due to arrears
Entry due to servicing costs

The dynamics of ‘servicing pressure’
© Institute for Fiscal Studies 35
Figure 4.1 shows the rate of entry into servicing pressure overall and by income quintile, and breaks that down into the three ‘types’ of entry into servicing pressure. Overall, of those individuals moving into servicing pressure over the period we examine, 60% do so only because of debt servicing costs increasing relative to income, 37% do so only due to entering arrears, and 3% enter due to both of these changes. The figure also makes clear that the majority of the individuals entering into servicing pressure because of arrears are in low-income households – something that is unsurprising given that lower-income households are more likely to be in arrears in general. By contrast, there is no clear pattern by income in the likelihood of entering servicing pressure due to high servicing costs.
The role of income When looking to explain entry into servicing pressure, it is natural to consider the role that might be played by fluctuations in income. In particular, a fall in income could lead to a household entering servicing pressure in two main ways. First, for a given set of debt repayment obligations, if a household sees its income fall, its repayments will consume a larger share of its income. If the fall in income is sufficiently large, the household will enter servicing pressure on the basis that its repayments now consume more than 25% of its income. This is the direct channel through which income falls may lead to servicing pressure. Second, a fall in income may have the indirect impact of leading to additional debt or arrears: a household may respond by taking out more debt in order to maintain levels of expenditure or it may fall behind on bills or credit agreements.
We look first at the direct channel. The WAS data reveal that only 15% of individuals moving into servicing pressure would have done so if their debt servicing costs had remained constant in cash terms and they had not fallen into arrears. This figure is only marginally higher (21%) when we exclude those who moved into servicing pressure due to entering into arrears. In this sense, falling incomes are not a major direct cause of entry into servicing pressure.
Despite only a small direct role for income falls in this sense, it is nevertheless true that a sizeable proportion of individuals who entered servicing pressure between 2010–12 and 2012–14 saw a significant income fall over that period. Figure 4.2 presents the distribution of changes in income for those who entered servicing pressure, and compares it with the distribution for those who did not. It shows that 19% of individuals who moved into servicing pressure saw a fall in income of 35% or more. This indicates that there is potential for income falls to play some indirect role in entry. However, the figure also reveals that while those entering servicing pressure are somewhat more likely to experience an income fall – 51% of those entering servicing pressure saw their household income fall over the two-year period examined, compared with 41% of those who did not – the overall pattern of income changes is not dramatically different between these two groups.
It therefore seems that income changes do not, by themselves, explain a large fraction of entry into servicing pressure. In fact, half of individuals who entered servicing pressure saw their household income rise at the same time. Nevertheless, it is possible that a fall in income is an event that some households are more able to withstand without entering servicing pressure than are others, for reasons not captured in our data. For example, it may be that the income changes experienced by those not entering servicing pressure

Problem debt and low-income households
36 © Institute for Fiscal Studies
Figure 4.2. Cumulative distribution of changes in household income for individuals who entered servicing pressure and for those who did not, 2010–12 to 2012–14
Note: Individuals are classified according to the percentage change in the income of the household to which they belong.
Source: Authors’ calculations using data from waves 3 and 4 of WAS.
were anticipated and therefore more easily accommodated, whereas falls in income that lead to servicing pressure may be more likely to represent genuine ‘shocks’.18
The role of servicing costs In contrast to falls in income, we find that rises in the costs of servicing debt are a key driver of entry into servicing pressure. Even if individuals’ incomes had been unchanged (but servicing costs changed as observed) over the period 2010–12 to 2012–14, 56% of those who were observed to enter servicing pressure would have done so purely as the result of a rise in servicing costs. Excluding those who entered servicing pressure due to arrears, that figure is 87%. As noted earlier, these rises in debt servicing could have been triggered by other particular events, but they are the proximate explanation for entry into servicing pressure in the large majority of cases.
Figure 4.3 shows in more detail the significant rises in the costs of servicing debts experienced by those moving into servicing pressure, contrasting them with the changes experienced by debt holders overall. 58% of individuals entering servicing pressure due to a rise in their servicing-costs-to-income ratio had seen their servicing costs rise by at least 25% of their initial household income. The equivalent figure among all debt holders is just 1%. On the other hand, those who entered into arrears are only slightly more likely to have seen their debt servicing costs rise than is the average debt holder.
18 Del-Rio and Young (2005) find that, holding debt-to-income levels constant, income changes that came as a
surprise were associated with greater changes in the likelihood of self-reporting debt problems than expected income changes.
0%
10%
20%
30%
40%
50%
60%
70%
80%
90%
100%
-100% -75% -50% -25% 0% 25% 50% 75% 100%
Cum
ulat
ive
perc
enta
ge o
f in
divi
dual
s
Percentage change in income
Entered servicing pressure
Did not enter servicing pressure

The dynamics of ‘servicing pressure’
© Institute for Fiscal Studies 37
Figure 4.3. Increase in debt servicing costs between 2010–12 and 2012–14 as a percentage of initial income
Note: The category ‘0% or less’ denotes those who saw their debt servicing costs fall in nominal terms between 2010–12 and 2012–14; the category ‘0–10%’ denotes those who saw a rise in their debt servicing costs of up to 10 percentage points of their initial income; and so on.
Source: Authors’ calculations using data from waves 3 and 4 of WAS.
Increases in credit card repayments are the most significant driver of this sharp increase in servicing costs seen by those entering servicing pressure. 47% of those who entered servicing pressure due to high servicing costs saw increases in their credit card debt servicing costs of 25% or more of their initial income, compared with just 3% of the overall debt-holding population.19
The role of ‘life events’ We have seen that those who enter servicing pressure typically fall into one of two groups: those who see significant rises in debt servicing costs and those who fall into arrears. To what extent are these changes driven by identifiable ‘life events’?
In Table 4.1, we examine the role in explaining entry into servicing pressure of a number of ’life events’: the ending of marriage or cohabitation (due to the death of a partner, divorce or separation), the arrival of a new child, and moving out of work. In each case, we look both at whether these events occurred in the two-year period during which the individual moved into servicing pressure and at whether these events had happened at any point in the six-year period during which individuals are observed.
19 Given that, in almost all cases, credit card debt repayment does not follow a structured schedule, increases in
debt servicing costs may be due to households being interviewed on occasions where they happen to have made an unusually large, but not generally representative, repayment. We cannot determine the extent to which this drives our results, but the fact that credit card debt does rise by over 500% on average for those entering servicing pressure indicates that there is a significant role for ‘real’ rises in households’ debt burdens.
0%
10%
20%
30%
40%
50%
60%
70%
80%
90%
100%
Debt holders Entered servicing pressure due to servicing costs
Entered servicing pressure due to
arrears
Perc
enta
ge o
f ind
ivid
uals
0% or less
0–10%
10–25%
25% or more
Increase in servicing costs as % of initial income:
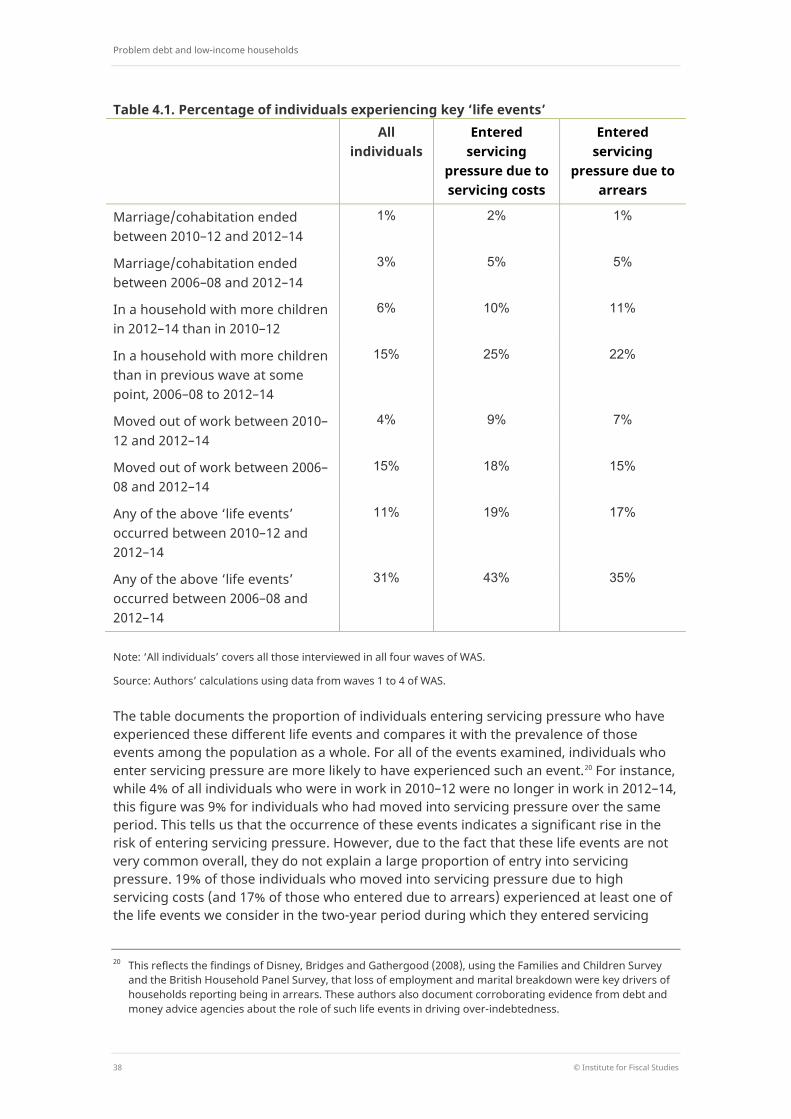
Problem debt and low-income households
38 © Institute for Fiscal Studies
Table 4.1. Percentage of individuals experiencing key ‘life events’ All
individuals Entered
servicing pressure due to servicing costs
Entered servicing
pressure due to arrears
Marriage/cohabitation ended between 2010–12 and 2012–14
1% 2% 1%
Marriage/cohabitation ended between 2006–08 and 2012–14
3% 5% 5%
In a household with more children in 2012–14 than in 2010–12
6% 10% 11%
In a household with more children than in previous wave at some point, 2006–08 to 2012–14
15% 25% 22%
Moved out of work between 2010–12 and 2012–14
4% 9% 7%
Moved out of work between 2006–08 and 2012–14
15% 18% 15%
Any of the above ‘life events’ occurred between 2010–12 and 2012–14
11% 19% 17%
Any of the above ‘life events’ occurred between 2006–08 and 2012–14
31% 43% 35%
Note: ‘All individuals’ covers all those interviewed in all four waves of WAS.
Source: Authors’ calculations using data from waves 1 to 4 of WAS.
The table documents the proportion of individuals entering servicing pressure who have experienced these different life events and compares it with the prevalence of those events among the population as a whole. For all of the events examined, individuals who enter servicing pressure are more likely to have experienced such an event.20 For instance, while 4% of all individuals who were in work in 2010–12 were no longer in work in 2012–14, this figure was 9% for individuals who had moved into servicing pressure over the same period. This tells us that the occurrence of these events indicates a significant rise in the risk of entering servicing pressure. However, due to the fact that these life events are not very common overall, they do not explain a large proportion of entry into servicing pressure. 19% of those individuals who moved into servicing pressure due to high servicing costs (and 17% of those who entered due to arrears) experienced at least one of the life events we consider in the two-year period during which they entered servicing
20 This reflects the findings of Disney, Bridges and Gathergood (2008), using the Families and Children Survey
and the British Household Panel Survey, that loss of employment and marital breakdown were key drivers of households reporting being in arrears. These authors also document corroborating evidence from debt and money advice agencies about the role of such life events in driving over-indebtedness.

The dynamics of ‘servicing pressure’
© Institute for Fiscal Studies 39
pressure, compared with 11% across all individuals. Once we consider the full six-year period for which data are available, a higher proportion of entrants due to servicing costs (43%) have experienced one or more of these ‘life events’ prior to entry into servicing pressure, compared with 31% in the population at large.
To summarise, while each of these ‘life events’ is associated with an increased risk of entry into servicing pressure, they have the potential to explain only a modest proportion of entry into servicing pressure, for the simple reason that the majority of those who enter servicing pressure have not experienced any of these events in the relevant time period. This is to be expected given that individuals will take out debt under a diverse range of circumstances, only some of which may be in response to ‘life events’. Furthermore, there may be other important triggers in individuals’ lives that lead to them entering servicing pressure but which are not easily captured in these data.
4.2 Exit from immediate servicing pressure
We now consider individuals who exit from servicing pressure. Figure 4.4 shows the ‘exit rate’ from servicing pressure between 2010–12 and 2012–14, split by income quintile and the reason for being under servicing pressure (high debt servicing costs or arrears). Overall, 62% of individuals who were under servicing pressure when observed in 2010–12
Figure 4.4. Exit rates for individuals in households facing servicing pressure, by initial age-adjusted income quintile and servicing pressure ‘type’, 2010–12 to 2012–14
Note: ‘Under servicing pressure due to arrears only’ includes all those individuals under servicing pressure in 2010–12 who were in arrears but had servicing costs of no more than 25% of monthly income. ‘Under servicing pressure due to servicing costs only’ includes all those individuals under servicing pressure in 2010–12 who had servicing costs greater than 25% of monthly income but were not in arrears. Individuals are classified according to their 2010–12 (wave 3) income quintile. Income quintiles are calculated at the individual level, where each individual is assigned the net equivalised level of income of the household to which they belong. Decile rankings are made within four age groups: 29 and below, 30–44, 45–59, and 60 and over.
Source: Authors’ calculations using data from waves 3 and 4 of WAS.
0%
10%
20%
30%
40%
50%
60%
70%
80%
90%
100%
Lowest 2 3 4 Highest All
Perc
enta
ge o
f ind
ivid
uals
Age-adjusted equivalised income quintile
Under servicing pressure due to arrears only Under servicing pressure due to servicing costs only Under servicing pressure

Problem debt and low-income households
40 © Institute for Fiscal Studies
were no longer under servicing pressure by the time of their second interview, in 2012–14. Being in arrears seems to be an especially good predictor of servicing pressure turning out to be persistent. Of those under servicing pressure due to the cost of servicing their debt, over 70% are no longer under servicing pressure two years later. For those under servicing pressure due to arrears, this figure is a little over a half.
We have already seen that lower-income people under servicing pressure are the most likely to be there as a result of being in arrears. Additionally, even among those who are under servicing pressure due to arrears (represented by the light green line in Figure 4.4), those with higher incomes are less likely to remain under servicing pressure two years later. In combination, this means that individuals are less likely to exit from servicing pressure if they have a lower income – as shown by the dark green line in the figure. Among those under servicing pressure in the bottom income quintile, 56% are no longer under servicing pressure two years later, compared with 76% of those in the fourth income quintile and 66% in the highest income quintile.
In the previous section, we showed that falls in income are not the key driver of entry into our measure of servicing pressure. We see, however, that there is a larger role for income growth when looking at exit from servicing pressure. In the same way as with entry, we can ask for what proportion of individuals the direct effect of their income changing was sufficient to take them out of servicing pressure. We find that this direct effect is large: 48% of individuals who exited from servicing pressure between 2010–12 and 2012–14 would have done so even if their debt servicing costs were constant over this period.
Figure 4.5. Cumulative distribution of changes in income for those who did and did not exit from servicing pressure, 2010–12 to 2012–14
Note: Individuals are classified according to the percentage change in the income of the household to which they belong. Those who did not exit servicing pressure include all those not under servicing pressure and all those who were under servicing pressure and remained in that state in 2012–14.
Source: Authors’ calculations using data from waves 3 and 4 of WAS.
0%
10%
20%
30%
40%
50%
60%
70%
80%
90%
100%
-100% -75% -50% -25% 0% 25% 50% 75% 100%
Cum
ulat
ive
perc
enta
ge o
f in
divi
dual
s
Percentage change in income
Did not exit servicing pressure
Exited servicing pressure

The dynamics of ‘servicing pressure’
© Institute for Fiscal Studies 41
This fact makes sense in the context of Figure 4.5, which compares the distributions of income changes seen by those exiting servicing pressure and by those who did not exit servicing pressure. We can see that, in general, a significant proportion of those who exited from servicing pressure saw sizeable increases in their income over this two-year period and that those who exited were somewhat more likely to see such rises than were other individuals. 46% of individuals under servicing pressure who exited from servicing pressure between 2010–12 and 2012–14 saw their household income rise by 15% or more over the two-year period, compared with 33% of those who did not exit.
As one might expect, falling debt servicing costs also play a significant role in explaining exit from servicing pressure. Figure 4.6 shows the distribution of changes in debt servicing costs for those individuals who were under servicing pressure in wave 3 of WAS, split into the group of individuals who were still under servicing pressure in wave 4, those who had exited and been under servicing pressure due to high servicing costs, and those who had exited and been under servicing pressure due to arrears. Among the group with high debt servicing costs, two-thirds (66%) of those who subsequently exited servicing pressure saw their debt servicing costs fall by at least 25% of their household income.
Why do some households remain under servicing pressure, while others exit as a result of large falls in their servicing costs? First, those households that do not exit tend to have more debt relative to their income than those that subsequently exit servicing pressure. Amongst those under servicing pressure due to high servicing costs, the median debt level as a percentage of annual income was 32% for those who subsequently exited servicing pressure over the next two years, compared with 55% for those who did not. This
Figure 4.6. Decrease in debt servicing costs between 2010–12 and 2012–14 as a percentage of initial income
Note: The category ‘0% or less’ denotes those who saw their debt servicing costs rise in nominal terms between 2010–12 and 2012–14; the category ‘0–10%’ denotes those who saw a fall in their debt servicing costs of up to 10 percentage points of their initial income; and so on.
Source: Authors’ calculations using data from waves 3 and 4 of WAS.
0%
10%
20%
30%
40%
50%
60%
70%
80%
90%
100%
Did not exit servicing pressure
Exited servicing pressure due to servicing costs
Exited servicing pressure due to
arrears
Perc
enta
ge o
f ind
ivid
uals
25% or more
10–25%
0–10%
0% or less
Decrease in servicing costs as % of initial income:

Problem debt and low-income households
42 © Institute for Fiscal Studies
is explained by the simple fact that, for a fixed rate of repayment, those with higher debt-to-income ratios are more likely to still be making significant debt repayments as a share of their income two years later and so are more likely to remain under servicing pressure. Second, those who remain under servicing pressure sometimes do so because they take out additional debt, particularly credit card debt. 12% of those who were under servicing pressure in 2010–12 and exited by 2012–14 saw their credit card debt increase by at least 10% of their income over those two years. For those who remained under servicing pressure, the equivalent figure is 27%.
4.3 Summary
In this chapter, we have seen that lower-income households are more likely to enter servicing pressure than are high-income households, and that this is driven primarily by the fact that they are more likely to fall into arrears. Entry into servicing pressure on account of rising debt repayments relative to income is largely driven by increases in those repayments, rather than being the direct result of falls in income.
Turning to exits from servicing pressure, those who remain under servicing pressure on account of servicing costs tend to do so because they have higher stocks of debt compared with their income and are more likely to take on new debt, especially credit card debt. For the most part, those under servicing pressure due to arrears are less likely to exit servicing pressure than those who have high levels of servicing costs. Exit rates from arrears are lowest at low levels of income and this drives an overall lower exit rate from servicing pressure amongst those with lower household income.
Figure 4.7. Percentage of individuals in a household under servicing pressure in 2012–14, by whether or not they were in a household under servicing pressure in 2010–12
Note: Income deciles are calculated at the individual level, where each individual is assigned the level of net equivalised income of the household to which they belong. Decile rankings are made within four age groups: 29 and below, 30–44, 45–59, and 60 and over.
Source: Authors’ calculations using data from waves 3 and 4 of WAS.
0%
5%
10%
15%
20%
25%
30%
Low
est 2 3 4 5 6 7 8 9
Hig
hest
All
Perc
enta
ge o
f ind
ivid
uals
Age-adjusted equivalised income decile
Persistent servicing pressure
New servicing pressure

The dynamics of ‘servicing pressure’
© Institute for Fiscal Studies 43
Our findings about entry and exit patterns help us to understand why lower-income households are more likely to be under servicing pressure. Figure 4.7 splits those under servicing pressure in 2012–14 according to whether that pressure is persistent or new (whether they were also under servicing pressure in 2010–12 or have newly entered servicing pressure since 2010–12). As shown above, those with lower incomes are more likely to enter servicing pressure, and so we see more individuals in new servicing pressure in lower income deciles.
Looking at those who are persistently under servicing pressure, we have a much stronger relationship with income. The proportion of individuals under servicing pressure for two consecutive waves reflects not only the rate of entry into servicing pressure but also the rate of exit. Because those lower down the income distribution are both more likely to be in arrears – a generally more persistent form of servicing pressure – and have a lower exit rate from this kind of servicing pressure, servicing pressure is much more persistent at lower levels of income: 50% of those under servicing pressure in the bottom income decile are in persistent servicing pressure, compared with 38% in the top income decile. We therefore see that the pattern of servicing pressure across the income distribution is a product both of lower-income individuals being more likely to enter servicing pressure and of their being less likely to exit from it.

Problem debt and low-income households
44 © Institute for Fiscal Studies
5. The medium term: ‘repayment pressure’
Key findings
When considering whether unsecured debts might pose problems for a household, it is important to consider not just servicing pressure (which may arise temporarily) but also whether unsecured debts will be a struggle to repay over the medium term.
Defining a measure of ‘repayment pressure’, we identify households whose total debt burden, less any financial assets, is greater than 20% of household income. Using this measure, 9% of individuals were in a household under repayment pressure in 2012–14.
As with immediate servicing pressure, it is low-income and younger households that look most likely to struggle to repay their debts over the longer term.
The percentage of individuals under repayment pressure (on the measure above) falls from 14% of those aged 20–24 to 1% of those aged 80–84 and from 13% in the lowest income decile to 3% in the highest income decile.
Taking account of the facts that debt will be repaid out of future income, and that incomes tend to grow over time, does tend to make repayments look more manageable for some groups.
The debt repayments of younger adults look slightly more manageable once one accounts for the fact that their incomes are expected to increase, but there is almost no impact on repayment pressure among older working-age adults.
Accounting for the fact that some people are only temporarily on low incomes reduces the percentage of low-income households expected to be under repayment pressure.
The percentage of individuals in the lowest income decile in a household under repayment pressure falls from 15% to 9% when taking this uncertainty into account. However, doing this makes little difference to the rate of repayment pressure for low-income households with children.

The medium term: ‘repayment pressure’
© Institute for Fiscal Studies 45
In Chapter 3, we set out a measure of ‘immediate servicing pressure’ that attempted to identify households for which servicing debt obligations may be a significant current financial burden. In this chapter, we consider a different respect in which debt may put pressure on households, by looking at the longer term. The focus is not on whether people can manage the flow of debt servicing costs right now, but on whether the stock of debt that they hold looks like an amount that they will find manageable to repay over time. Precisely, we assess ‘repayment pressure’ by comparing the debt repayments that they must make over the coming years with the income they may receive over the same period, along with any financial assets they currently hold.
Taking a slightly longer-run view of households’ debt positions is helpful for a number of reasons. First, whether or not a household looks likely to struggle to repay its debts over the medium term may indicate the extent to which it is able to cope with more immediate servicing problems, and whether those problems are likely to persist. For example, if a household faces high servicing costs right now compared with its current income, but anticipates income growth (or a reduction in debt repayments) in the near future, then it may be able to temporarily delay spending on items in a way that will mean it avoids having to cut back on essential spending today, but which doesn’t make sense if it will be under servicing pressure for an extended period of time. Second, if an individual knows that they will struggle to repay their debts, then the burden of this knowledge could have direct psychological and mental health consequences, even if current repayments are manageable.21
A simple way to think about ‘repayment pressure’ is to compare a household’s outstanding debts and its current income. This is the approach taken by the Office for National Statistics, as described below. In this chapter, we will go beyond this approach in two key ways. First, we will take into account the fact that whether or not a household will struggle to repay its debts will depend on how its future income compares with its future debt repayments: we will look at a measure of ability to repay debts that uses information we have about the likely future development of people’s incomes, as well as their debt repayment obligations. This is because we would typically be more concerned about someone in a household with a high debt-to-income ratio if their income is expected to stagnate in future than if their income is expected to grow strongly. Second, we will recognise the fact that this future income growth is uncertain, and hence each household faces a probability of struggling to pay back its debts, rather than simply being solvent or insolvent. This reflects the fact that repayment pressure may in fact arise precisely when the unexpected, such as a job loss, occurs. We assess whether taking a more sophisticated approach to assessing repayment pressure in these ways is important in practice, by looking at whether it changes the apparent levels of repayment pressure and the types of people who are in such situations.
5.1 A benchmark measure of repayment pressure
In this section, we present and analyse a measure of repayment pressure based on the ratio of debt to current income. This tells us which individuals look to be in households that are struggling with debt on the basis of their current circumstances and is a useful benchmark measure. We say that a household is under repayment pressure if
21 See Gathergood and Guttman-Kenney (2016) for an analysis of links between debt-to-income ratios, financial
distress, and well-being.

Problem debt and low-income households
46 © Institute for Fiscal Studies
its total stock of debt is greater than financial assets plus 20% of current annual net (after-tax-and-benefit) income.
The 20% cut-off in this definition is inevitably arbitrary; there is no clear-cut answer about what this threshold should be. We illustrate the way in which varying this threshold changes our analysis in Appendix A. Of our repayment pressure definitions, this benchmark measure comes closest to the ONS solvency problem debt measure. A key difference is that, because we are now effectively considering a medium- or long-term horizon by asking whether the total stock of a household’s debt looks manageable, we treat financial assets (e.g. current and savings accounts, stocks and shares) as a resource that can be used to repay debts. We compare this definition and the ONS measure in more detail in Box 5.1.
Figure 5.1 shows the percentage of individuals under repayment pressure according to our benchmark measure, and compares this with our servicing pressure measure from Chapter 3. 9% of individuals are in households facing repayment pressure according to our definition, with the rate of repayment pressure declining from 14% amongst those aged 20–24 to 1% amongst those aged 80–84. The proportion of individuals in a household under repayment pressure is lower than the figure for servicing pressure at all ages, but the two measures follow similar profiles by age. This reflects the fact that younger individuals are more likely to be in households that have some debt. The figure also shows what our repayment pressure measure would look like if financial assets were not included as a resource available to repay debts. The impact of including assets is to almost halve the rates of repayment pressure, which fall from 16% to 9% overall. The impact is largest in absolute terms at younger ages – with repayment pressure among 30- to 34-year-olds falling from 23% to 13% – but most important in proportional terms at older
Box 5.1. Comparison with ONS’s measure of solvency problems
In April 2017, the Department for Work and Pensions published Improving Lives: Helping Workless Families. This drew upon the ONS measure of ‘problem debt’. ONS produces definitions of both ‘liquidity’ problems and ‘solvency’ problems and defined a problem debt household as one experiencing problems of either type. Here we compare the ONS ‘solvency’ problems measure with the definition of repayment pressure set out in this chapter.
The ONS definition is as follows. A household is in solvency problems if
• at least one adult considers debt a heavy burden and household debt represents at least 20 per cent of the household’s net annual income.
This definition is similar to the static measure set out in this chapter in that it includes a comparison of debts and current income. However, while the definition in this chapter considers debts net of financial assets, the ONS condition does not consider the role of assets. In addition, the ONS definition requires that a household declare its debts to be a heavy burden in order to be considered to have solvency problems. No such subjective component is included in the definition in this chapter.

The medium term: ‘repayment pressure’
© Institute for Fiscal Studies 47
Figure 5.1. Percentage of individuals in households facing repayment pressure, by age group
Note: ‘Repayment pressure (no assets)’ includes all those individuals in households that would be under repayment pressure if they had financial assets of zero.
Source: Authors’ calculations using data from wave 4 of WAS.
Figure 5.2. Percentage of individuals in households facing repayment pressure, by age-adjusted income decile
Note: ‘Repayment pressure (no assets)’ includes all those individuals in households that would be under repayment pressure if they had financial assets of zero. Income deciles are calculated at the individual level, where each individual is assigned the level of net equivalised income of the household to which they belong. Decile rankings are made within four age groups: 29 and below, 30–44, 45–59, and 60 and over.
Source: Authors’ calculations using data from wave 4 of WAS.
0%
5%
10%
15%
20%
25%
30%
20–2
4
25–2
9
30–3
4
35–3
9
40–4
4
45–4
9
50–5
4
55–5
9
60–6
4
65–6
9
70–7
4
75–7
9
80–8
4 All
Perc
enta
ge o
f ind
ivid
uals
Age group
Repayment pressure (no assets) Servicing pressure
Repayment pressure
0%
5%
10%
15%
20%
25%
30%
Low
est 2 3 4 5 6 7 8 9
Hig
hest
All
Perc
enta
ge o
f ind
ivid
uals
Age-adjusted equivalised income decile
Servicing pressure
Repayment pressure
Repayment pressure (no assets)

Problem debt and low-income households
48 © Institute for Fiscal Studies
ages – the proportion of 75- to 79-year-olds facing repayment pressure falls from 5% to 2%.
Figure 5.2 shows the proportion of individuals under repayment pressure within each income decile and compares this with our servicing pressure measure. It shows that repayment pressure is more prevalent amongst those in lower income deciles, with the rate of repayment pressure on this measure being 13% in the lowest income decile and 3% in the highest. This gradient by income is not as dramatic as that for servicing pressure – in part because the high rate of servicing pressure among those in low-income households is driven largely by arrears (which do not directly trigger being under repayment pressure). Again, the figure also shows the repayment pressure measure if financial assets are not included as a resource to repay debts. Including financial assets halves the rate of repayment pressure but has a larger impact for those in higher income deciles than for those in lower ones. For example, the rate of repayment pressure falls by 5–6 percentage points in the bottom three income deciles, when assets are added, and by 8–10 percentage points in the fourth to ninth deciles. This reflects the fact that higher-income debt holders are more likely to hold offsetting financial assets, as we saw in Chapter 2.
5.2 Accounting for income growth and the timing of repayments
We now focus on a measure of repayment pressure that is more forward-looking, reflecting the facts that whether debt is a burden to repay will depend on the way in which future income compares with future repayment obligations and that the best estimate of future income may not simply be current income. On this definition, we say that a household is under repayment pressure if
the total value of its future debt repayments is greater than financial assets plus 20% of average net annual income over the next five years.
In order to construct this forward-looking measure of repayment pressure, we need to make an estimate of future debt repayments and future income for the household of which the individual is a member. When estimating future debt repayments, we exploit the fact that WAS contains information about future repayments for debts with structured repayment terms and enough information for us to construct expected future repayments for other forms of debt (as described in Box 5.2).
Box 5.2. Information on debt repayments over time
In Chapter 3, we set out the information that we have about households’ debt repayments in the month they are interviewed. To construct our forward-looking repayment pressure measure, we need to look forwards in time and construct a series of debt repayments for each household for each month in the future.
As when looking at current repayments, the information that we have about households’ debt repayments varies by the type of debt being examined. For structured forms of debt such as formal loans, hire purchase and mail order debts, individuals are asked about the duration of their repayment period as well as the size of repayments. This

The medium term: ‘repayment pressure’
© Institute for Fiscal Studies 49
allows us to construct the total amount that will be repaid on these types of debt holdings for each future month. One exception to this is formal loans and hire purchase agreements for which the individual owes an amount of money but has not begun to make repayments. In this case, WAS does not include information about the size and frequency of repayments and so we assume that the overall value of the stream of payments is simply equal to the outstanding amount of debt.
For non-structured debt holdings, we do not have any information about future debt repayments per se as individuals of course have discretion in most cases about how they repay these debts. By far the most significant category of these debts in terms of financial value is credit card debt. From the perspective of assessing individuals against our forward-looking measure of repayment pressure, we need to estimate: (i) the rate of monthly repayment of outstanding balances; and (ii) the rate of interest charged on any balances carried over from month to month – as this will determine for how long individuals will be paying off their credit card debt. WAS includes data on the first of these two things, and it also includes information on whether individuals can carry over some outstanding credit card balance interest free. If this is the case, we assume that all balances on this card can be carried over interest free (this is a somewhat conservative assumption in the sense that individuals may only be able to carry over up to a certain amount interest free). In the case where the individual says that there is no amount that can be carried over interest free, we assume that individuals face an annualised rate of 15% (this is an illustrative figure based on the average rate for new credit cards over the period 2014Q1 to 2015Q2 according to the Financial Conduct Authority (2016)) in the absence of more detailed information. Turning to the rate of monthly repayments, we assume that individuals pay off the same amount in nominal terms in each future month. We assume that this nominal amount is equal to the largest of: (i) their most recent monthly repayment; (ii) the minimum monthly payment for the card; and (iii) the minimum amount of repayment required to repay the outstanding balance within five years (accounting for interest accrued over the repayment period).
The remaining debts without a repayment structure are overdrafts, arrears and store cards. For store cards, we do not have information about whether balances are held interest free. We assume that repayments are equal to the most recent repayment in all future months (this means that 99% of store cards have their balances cleared within five years) and that all cards are interest free. For overdrafts and arrears, we make the assumption that the value of the flow of repayments is equal to the current stock of debt. While this assumption is somewhat ad hoc, these debts make a small contribution to overall household debt holdings and so alternative assumptions would not have a qualitative impact on our conclusions.
When looking at future incomes, we estimate projected household income growth for each individual for the next five years. We do this in the following way. First of all, we assign to each person the average level of income growth across the whole economy according to data on actual income growth up to 2016 and using the most recent Office for Budget Responsibility forecast for nominal income growth in subsequent years (from November 2017). We then add an age- and education-specific component to this growth, based on income growth rates over the years from 1991 to 2008 using data from the

Problem debt and low-income households
50 © Institute for Fiscal Studies
British Household Panel Survey (BHPS).22 We focus on individuals aged 25–49 – the vast majority of whom have left full-time education and have not left the labour market. As we are estimating expected growth in household income, these growth rates encapsulate not only growth in individual earnings from work but also the effects on income of changes in household composition, changes in the receipt of benefits and other changes. Further details of the data and estimation procedure used are given in Appendix B.
One implication of this method is that any two individuals with the same age and education level in wave 4 of WAS will be projected to see the same rate of income growth over the five years following the survey. Of course, individuals may have different levels of income to begin with and so still have a different level of income in each of the next five years.
Figure 5.3 shows the proportion of individuals under repayment pressure according to our forward-looking repayment pressure measure (using these estimates of future debt repayments and future incomes) and compares it with our benchmark measure. It reveals the impact of taking into account the forward-looking nature of repayments on the relative prevalence of repayment pressure across ages. Those aged 45–49 are expected to see only a very small growth in their income on average and so less than 0.1% of individuals in this age group are under repayment pressure on our benchmark but not our forward-looking measure. Income growth is around four times higher, in percentage terms, for those in their 30s than for those aged 45–49 and moving to a forward-looking
Figure 5.3. Percentage of individuals in households facing repayment pressure, by age group
Source: Authors’ calculations using data from wave 4 of WAS and waves 1 to 18 of BHPS.
22 While these data do cover a long period, it is of course possible that age- and education-specific components
of income growth will differ in future from those observed. However, sensitivity analysis available from the authors on request shows that differences in average income growth have only a small impact on our forward-looking measure of repayment pressure.
0%
2%
4%
6%
8%
10%
12%
14%
25–29 30–34 35–39 40–44 45–49 All
Perc
enta
ge o
f ind
ivid
uals
Age group
Benchmark measure
Forward-looking measure

The medium term: ‘repayment pressure’
© Institute for Fiscal Studies 51
measure reduces the proportion of individuals judged to be under repayment pressure by around 1 percentage point for each age group from 30–34 to 40–44.23
5.3 Accounting for different possible income paths
The analysis in the previous section assessed individuals under the assumption that they would see an average rate of household income growth for someone of their age and education. In this section, we account for the fact that future income may follow a number of different paths. We therefore move from asking whether an individual will enter repayment pressure if they proceed along an average income growth path and instead ask, ‘What are the chances that an individual’s income will evolve in such a way that they end up under repayment pressure?’.
Our approach is to estimate the probability that an individual will experience income changes of different sizes – and in particular how these probabilities of different income changes vary between individuals of different ages, education levels and income levels. The basic idea is as follows. We group individuals in our data defined by their age and education level – for example, low-educated 45-year-olds. Because our data follow the same individuals over time, we are able to say, for each individual, what their income is at age 45 and what their income is a year later at age 46. This then allows us to calculate the proportion of individuals in that group who moved from one point of the income distribution to another point – for example, we can calculate the chances that someone who has income in the top 5% for their education group at age 45 will still be in the top 5% at age 46, or the chances that they will have fallen to the second 5% or even the bottom 5%. With this kind of information, we are then able to estimate, for individuals of a given age, education level and initial level of income, the chances that they will experience a certain income path in the future. For each possible income path, we calculate whether an individual would be under repayment pressure were their income to take that path, based on our forward-looking definition. The percentage of paths on which the individual is under repayment pressure then tells us the probability that that individual will end up under repayment pressure. Appendix B gives more details of the estimation and simulation procedure.
Having estimated the probability that each individual will end up under repayment pressure, we look at the difference that accounting for income variability makes to the relative expected prevalence of repayment pressure across different groups.
Figure 5.4 illustrates the consequences of taking into account the fact that there are a range of possible paths of future income for the proportion of individuals expected to be under repayment pressure across the income distribution. The most significant impact is in the bottom half of the income distribution. When we assume that future income follows an average path, 15% of individuals in the bottom income decile are judged to be under repayment pressure, but this falls to 9% once we account for the range of income paths that could materialise. This is because the lower an individual’s level of income for their age and education, the greater the chance that they will move up the income distribution,
23 While average income growth for those aged 25–29 is similar to that for those aged 30–34, taking account of
income growth has a smaller impact on the former group, indicating that many of those who are under repayment pressure in our benchmark measure have sufficiently high levels of repayments that even once income growth is taken into account, they are still assessed as being under repayment pressure.

Problem debt and low-income households
52 © Institute for Fiscal Studies
and hence see above-average income growth. The impact of allowing for multiple income paths becomes smaller as we move up towards the middle of the income distribution. In the top two income deciles, the percentage of individuals expected to be under repayment pressure is higher when we account for the possibility of multiple future income paths. This is because these individuals face a substantial chance of moving down the income distribution.
We can see from Figure 5.4 that there is a smaller impact of accounting for the range of possible income paths at the top of the income distribution than there is at the bottom. This reflects the fact that it is more likely that someone in a low income decile will move up the income distribution than it is that someone near the top will move down the income distribution. For example, we estimate that over the period 1991–2009, there was a 63% chance that a high-educated individual who had income in the top 5% for someone of their age and education would still be in the top 5% one year later, whereas for someone in the bottom 5% there was only a 50% chance that they would still be in the bottom 5%.24
While taking account of multiple future income paths improves the overall outlook for individuals in low-income households, there are significant differences between different types of individuals. One prominent difference is that individuals in households that have a low equivalised income because they have a large number of children in the household, rather than because cash income is low, will not expect to move up the income
Figure 5.4. Percentage of individuals in households facing repayment pressure for different income paths, by age-adjusted income decile (25- to 49-year-olds only)
Note: Income deciles are calculated at the individual level, where each individual is assigned the level of net equivalised income of the household to which they belong. Decile rankings are made within four age groups: 29 and below, 30–44, 45–59, and 60 and over.
Source: Authors’ calculations using data from wave 4 of WAS and waves 1 to 18 of BHPS.
24 This reflects the finding of Levell, Roantree and Shaw (2015) that income is more persistent at the top end of
the income distribution.
0%
2%
4%
6%
8%
10%
12%
14%
16%
Low
est 2 3 4 5 6 7 8 9
Hig
hest
All
Perc
enta
ge o
f ind
ivid
uals
Age-adjusted equivalised income decile
If incomes grow in line with average
Account for different income paths

The medium term: ‘repayment pressure’
© Institute for Fiscal Studies 53
distribution as much as those in smaller low-income households. We see, for example, that amongst those who are in the bottom income quintile and are in a household with no children, accounting for multiple income paths halves the proportion of individuals expected to experience repayment pressure – from 16% to 8% – whereas for households with two or more children, the fall is from 13% to 10%.25 This tells us that when looking at low-income households with high levels of debt repayments compared with their equivalised income, households with children are more likely to face repayment pressure.
Figure 5.5 shows the proportion of individuals under repayment pressure by age on our forward-looking measure of repayment pressure, both assuming an average income path and accounting for the possibility of multiple future income paths. Accounting for multiple income paths has a bigger effect on the rate of measured repayment pressure among older age groups: repayment pressure falls from 11.3% to 10.7% among those aged 30–34, but from 10.3% to 8.8% among those aged 45–49. There are two reasons for the larger impact. First, the variability of income from year to year increases with age, meaning low-income older individuals are more likely to see a change in income that is sufficiently large to take them out of repayment pressure.26 Second, debts are more concentrated towards the bottom of the income distribution at older ages, and so the incorporation of uncertainty makes a bigger difference at those ages.
Figure 5.5. Percentage of individuals in households facing repayment pressure, by age group (25- to 49-year-olds only)
Source: Authors’ calculations using data from wave 4 of WAS and waves 1 to 18 of BHPS.
25 Even when controlling in a regression for differences due to age and education levels amongst these two
groups, having one child in a household compared with none is associated with a 4 percentage point higher probability of facing repayment pressure, and the figure for two children is 6 percentage points.
26 This reflects the finding of Blundell, Graber and Mogstad (2014) that the variance of permanent labour income shocks is increasing with age, particularly for low- and medium-educated individuals.
0%
2%
4%
6%
8%
10%
12%
14%
25–29 30–34 35–39 40–44 45–49 All
Perc
enta
ge o
f ind
ivid
uals
Age group
Average future income path Multiple future income paths

Problem debt and low-income households
54 © Institute for Fiscal Studies
5.4 Summary
This chapter has set out a measure of ‘repayment pressure’ that attempts to capture households that may have problems repaying their debts. It has also emphasised the impact of taking into account the forward-looking nature of whether households can make repayments and the possibility of multiple possible future paths for income.
Looking at a benchmark measure of repayment pressure, there are similar age patterns for our servicing pressure and repayment pressure measures. On the benchmark measure of repayment pressure, low-income people are more likely to have debts that look problematic, although the differences by income are not as strong as the pattern that we saw for servicing pressure – a difference that is accounted for by the fact that arrears (which are concentrated among the lowest-income households) automatically lead to a household being under servicing pressure, but do not automatically mean that household is under repayment pressure.
When we move to a forward-looking repayment pressure measure that accounts for the impact of projected income growth, we see that the overall levels of repayment pressure fall slightly as debt repayments fixed in nominal terms become more manageable. This difference is smaller for older individuals as their household income growth will, on average, be lower than that for younger individuals.
It is important also to account for not only projected income growth but also for the possibility that income could follow various different future paths. Taking into account the fact that individuals can see income growth that is above or below the average for someone of their age and education (and so move up or down the income distribution) means that we expect fewer individuals in lower-income households to struggle to repay their debts than if we look at average paths for future income alone. However, some low-income households are more likely to benefit from above-average income growth than others. Households with several children have a low equivalised income because of household size, rather than because their cash incomes are much lower than average for their age and education, and so are less likely to see significant growth in their income in future.

Conclusion
© Institute for Fiscal Studies 55
6. Conclusion Much of the conversation and concern around unsecured household debt is focused on the total amount of such debt – now in excess of £200 billion according to the Bank of England’s measure. This could certainly be important from the perspective of financial stability in the UK economy; and there are, of course, households for which this debt causes real problems. But there are also many situations in which holding debt can be perfectly sensible for a household, and indeed can help improve its living standards. A key challenge for policy is to identify with some degree of precision when debt is, and is not, a problem. This report has demonstrated that if one is interested in the impact of unsecured debt on household living standards, one should look in more detail at the distribution of that debt across households, the other economic characteristics of the households that hold it, and how the debt positions of particular households evolve over time.
In terms of the economic characteristics of households, one important thing to consider is the financial assets held by households with unsecured debt. Using the proxy for being under immediate ‘debt servicing pressure’ developed in this report, based on servicing costs relative to income and whether or not a household is behind with its bills, 58% of those under servicing pressure in the highest income decile are in households with enough financial assets to clear their debts, but that figure is just 27% for those in the bottom decile. Accounting for assets has similar effects on our impression of which households look able to clear their debts over the medium term. This has at least two implications for policymakers. When measuring and assessing ‘problem debt’, financial assets should be considered as part of the analysis. On the other hand, the fact that even among low-income households it is not uncommon to have significant financial assets alongside potentially problematic unsecured debt suggests that higher levels of savings may not always be used to clear debts.
Looking at the dynamics of ‘problem debt’ has also provided a number of other insights. First, the greater persistence of servicing pressure for low-income households provides a further reason to be more concerned about those households than those with higher incomes also under servicing pressure according to our measure. Second, looking at entry into servicing pressure reveals that it is relatively rare for a fall in income alone to explain a household moving into servicing pressure – with increases in debt repayments a much more common proximate cause. Third, the risk of difficulties clearing debts over the medium term is somewhat less sharply concentrated on those with the lowest current incomes than one might think. This is because some low income is temporary.
These findings on the role of financial assets and the dynamics of ‘problem debt’ suggest a number of areas where future research may be best focused in order to be of most assistance to policymakers. For example, it would be extremely valuable to understand better why a number of households with significant financial assets do not use those assets to repay potentially problematic unsecured debt. Similarly, a deeper understanding of why households take on new debt would be especially useful, given that this (rather than falls in income) is the main reason why households move into situations where the cost of debt servicing looks difficult to maintain.

Problem debt and low-income households
56 © Institute for Fiscal Studies
Appendix A In this appendix, we show the impact of changing the thresholds used in our definitions of ‘immediate servicing pressure’ and ‘repayment pressure’.
Alternative thresholds for immediate servicing pressure
Our main definition of ‘immediate servicing pressure’ used a threshold for debt servicing as a proportion of monthly income of 25%. Figure A.1 shows alternative measures of ‘immediate servicing pressure’ with higher (35%) and lower (15%) thresholds by income decile. Increasing the threshold to 35% decreases the overall proportion of individuals under servicing pressure from 13% to 10% and has a fairly uniform impact across the income distribution. This small and uniform impact tells us that there are only a small number of households with very high servicing cost ratios who are not in arrears. Decreasing the threshold to 15% increases the proportion of individuals under servicing pressure to 19%. The largest impact is for those in the fourth to ninth deciles, where the percentage of individuals under servicing pressure increases by between 7 and 9 percentage points. This tells us that there are more households with moderately high levels of debt repayments, but who are not in arrears, in these deciles.
Figure A.1. Percentage of individuals in households facing ‘servicing pressure’ with alternative servicing costs thresholds
Note: ‘15%’ corresponds to a definition where an individual is under ‘servicing pressure’ if they are in a household that is either spending more than 15% of its monthly income on debt servicing or is in arrears. Analogously for ‘25%’ and ‘35%’.
Source: Authors’ calculations using data from waves 3 and 4 of WAS.
0%
5%
10%
15%
20%
25%
30%
Low
est 2 3 4 5 6 7 8 9
Hig
hest
All
Perc
enta
ge o
f ind
ivid
uals
Age-adjusted equivalised income decile
15%
25%
35%
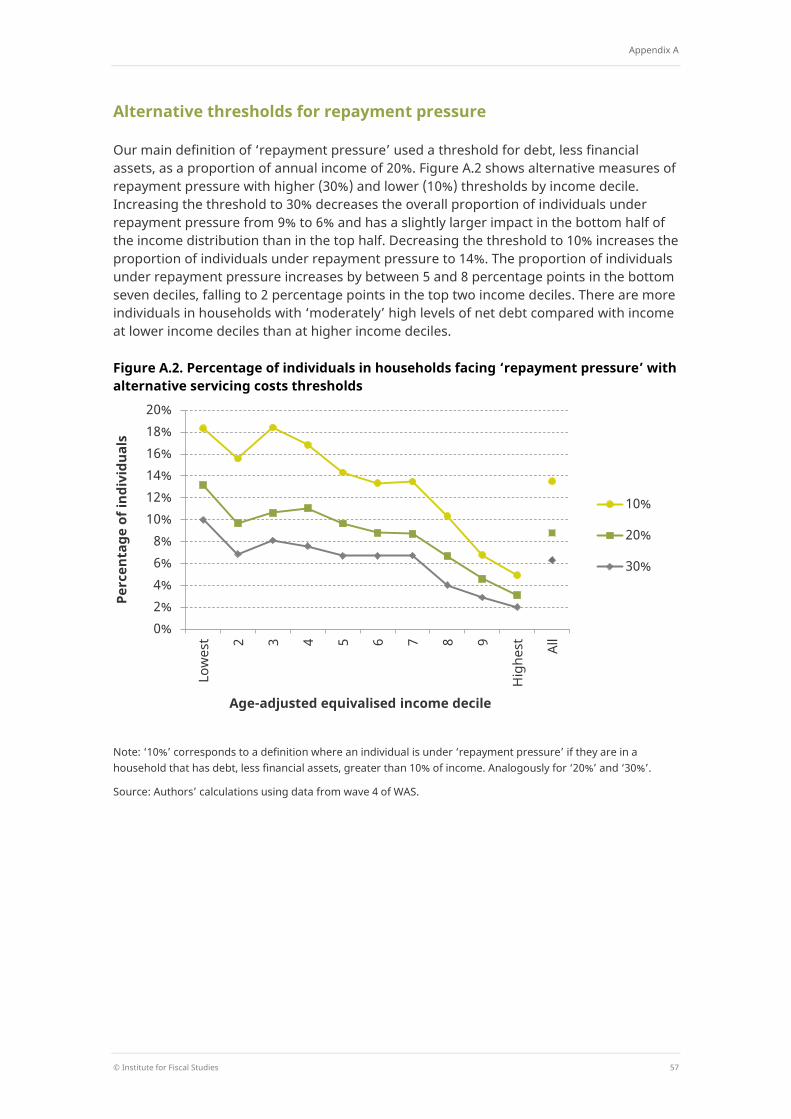
Appendix A
© Institute for Fiscal Studies 57
Alternative thresholds for repayment pressure
Our main definition of ‘repayment pressure’ used a threshold for debt, less financial assets, as a proportion of annual income of 20%. Figure A.2 shows alternative measures of repayment pressure with higher (30%) and lower (10%) thresholds by income decile. Increasing the threshold to 30% decreases the overall proportion of individuals under repayment pressure from 9% to 6% and has a slightly larger impact in the bottom half of the income distribution than in the top half. Decreasing the threshold to 10% increases the proportion of individuals under repayment pressure to 14%. The proportion of individuals under repayment pressure increases by between 5 and 8 percentage points in the bottom seven deciles, falling to 2 percentage points in the top two income deciles. There are more individuals in households with ‘moderately’ high levels of net debt compared with income at lower income deciles than at higher income deciles.
Figure A.2. Percentage of individuals in households facing ‘repayment pressure’ with alternative servicing costs thresholds
Note: ‘10%’ corresponds to a definition where an individual is under ‘repayment pressure’ if they are in a household that has debt, less financial assets, greater than 10% of income. Analogously for ‘20%’ and ‘30%’.
Source: Authors’ calculations using data from wave 4 of WAS.
0% 2% 4% 6% 8%
10% 12% 14% 16% 18% 20%
Low
est 2 3 4 5 6 7 8 9
Hig
hest
All
Perc
enta
ge o
f ind
ivid
uals
Age-adjusted equivalised income decile
10%
20%
30%

Problem debt and low-income households
58 © Institute for Fiscal Studies
Appendix B This appendix covers further details underlying the estimation and simulation procedures involved in projecting future income described in Chapter 5.
Projecting future income
To project future income for each individual in wave 4 of WAS, we take the actual and forecast rates of average income growth and then adjust for the fact that the incomes of different age–education groups grow at different rates.
Data We use data from the British Household Panel Survey (BHPS) for the years 1991–2009 on a representative sample of the British household population. We classify individuals as low-, mid- or high-educated based on the highest qualification they have achieved (up to and including GCSEs, A levels or higher, respectively).
Estimation We estimate a linear regression model using ordinary least squares (OLS) where the outcome variable is the natural logarithm of household income. The independent variables are dummy variables for the individual’s education level, and interaction terms between these dummies for education level and the individual’s age, age squared and age cubed. We also use dummy variables for the year of observation to control for differences in income due to economy-wide factors. It is possible to further control for education-level-specific differences over time (to account, for example, for a time-varying graduate premium), but whether or not we do so makes little difference to our results and so we do not include this in our estimation. We restrict our estimation to individuals aged 25–49, to capture people who in almost all cases have finished education and have not yet retired. This specification means that we estimate a cubic age trend for income which is allowed to differ by education level.
Projecting income To project forward income, we begin with each individual’s wave 4 level of income. We apply a rate of increase for future years that incorporates both the rate of growth from the estimation process that corresponds to the individual’s age and education level and the average overall level of income growth, taken from out-turn data and the Office for Budget Responsibility’s forecasts for the relevant years.
Validity of assumptions One concern that we might have with this analysis is that it implicitly assumes that individuals who are making debt repayments have the same growth rate of income as those without debt, on average. This assumption would be violated if, for example, individuals take on debt to try to smooth out their consumption over time when they expect their income to grow in future – and hence those with debt see systematically higher income growth than those without debt. By using an average growth rate across debt holders and non-debt holders as we do, we would overestimate the extent of repayment pressure.

Appendix B
© Institute for Fiscal Studies 59
We use WAS to investigate whether debt holders have different income growth rates from non-debt holders, after accounting for any age and education differences between these groups. We first estimate an education-specific age profile of log income using waves 3 and 4 of WAS. Then for each individual who is present in both wave 3 and wave 4, we obtain the difference between their log income and its predicted value, based on the age profile (their ‘residual’). We can think of the change in the value of this residual between waves 3 and 4 as the growth rate of log income for the individual, once age and education effects have been stripped out. We run an OLS regression of the value of this wave 4 residual on the value of the wave 3 residual and a dummy for whether or not the individual was in a debt-holding household in wave 3. We find that the dummy for debt holding is not statistically significantly different from zero. We conclude that we find no evidence of differences in growth rates between debt holders and non-debt holders, conditional on age and education level.
Accounting for multiple possible future income paths
The process of accounting for multiple future paths of income follows a version of the method set out in De Nardi, Fella and Paz Pardo (2016). The principle underlying the estimation is to estimate – specific to each age and education level – the probability of moving from one point of the income distribution to another.
We again use the BHPS data in our estimation. Within each age and education group, we divide the income distribution into nine quantiles. Starting from the bottom of the income distribution, the quantiles cover the following percentages of individuals: 5%, 5%, 10%, 20%, 20%, 20%, 10%, 5%, 5%. This ‘discretising’ of the income distribution is symmetric and is ‘finer’ in the tails of the distribution, to improve the accuracy of the overall estimation. Within each of these quantiles, we calculate mean log income. Next, we calculate the probability of moving between two quantiles of the income distribution at each age and education level, i.e. we calculate the quantile transition matrices for each age and education level. Given an individual’s predicted value of income given by the projected income process, we can obtain the income residual quantile for each individual in each period they are observed and so calculate the proportion of individuals of a given age and education level that moved between any two residual quantiles. Due to sample size issues, we calculate the transition matrix for age X by using the transitions for all individuals aged between X–2 and X+2.
With these quantile transition matrices, we are able to simulate paths for future income quantiles for each individual in WAS. To do this, we calculate the residual quantile for their wave 4 income. We then take a random draw from the cumulative distribution implied by the corresponding row of the quantile transition matrix for their age and education level to obtain their next year’s simulated quantile. We then iterate forward for four further periods. This gives us a simulated path for the individual’s future income quantiles. We add the relevant within-quantile average residual to the projected income profile in each year to obtain a path for future log income. We can convert this into a path for cash-terms income in a way analogous to the projected income profile. We repeat this process 1,000 times to obtain 1,000 possible future income paths for each individual. On each path, we determine whether the individual is under repayment pressure, giving an overall percentage of paths – or probability – of being under repayment pressure for each individual.

Problem debt and low-income households
60 © Institute for Fiscal Studies
References Blundell, R., Graber, M. and Mogstad, M. (2014), ‘Labor income dynamics and the insurance from taxes, transfers, and the family’, Journal of Public Economics, 127, 58–73.
Bridges, S. and Disney, R. (2004), ‘Use of credit and arrears on debt among low-income families in the United Kingdom’, Fiscal Studies, 25, 1–25.
Bryan, M., Taylor, M. and Veliziotis, M. (2010), Over-Indebtedness in Great Britain: An Analysis Using the Wealth and Assets Survey and Household Annual Debtors Survey, Report to the Department for Business, Innovation and Skills.
Del-Rio, A. and Young, G. (2005), ‘The impact of unsecured debt on financial distress among British households’, Bank of England, Working Paper 262.
De Nardi, M., Fella, G. and Paz Pardo, G. (2016), ‘The implications of richer earnings dynamics for consumption, wealth, and welfare’, National Bureau of Economic Research (NBER), Working Paper 21917.
Department for Work and Pensions (2017), Improving Lives: Helping Workless Families.
Disney, R., Bridges, S. and Gathergood, J. (2008), Drivers of OverIndebtedness, Report to the Department for Business, Enterprise and Regulatory Reform.
Financial Conduct Authority (2016), Credit Card Market Study: Final Findings Report.
Financial Conduct Authority (2017), Understanding the Financial Lives of UK Adults: Findings from the FCA’s Financial Lives Survey 2017.
Gathergood, J. and Guttman-Kenney, B. (2016), Can We Predict which Consumer Credit Users Will Suffer Financial Distress?, Occasional Paper 20, Financial Conduct Authority.
Levell, P., Roantree, B. and Shaw, J. (2015), ‘Redistribution from a lifetime perspective’, Institute for Fiscal Studies (IFS), Working Paper W15/27.
Office for National Statistics. Social Survey Division. (2017). Wealth and Assets Survey, Waves 1-4, 2006-2014. [data collection]. 5th Edition. UK Data Service. SN: 7215, http://doi.org/10.5255/UKDA-SN-7215-5