Probing the Reaction Dynamics of Thermite Nanolaminatesmrz/pdfs/2015_JPC_ncstate.pdf · Probing the...
8
Probing the Reaction Dynamics of Thermite Nanolaminates Garth C. Egan, † Edward J. Mily, ‡ Jon-Paul Maria, ‡ and Michael R. Zachariah* ,† † Department of Chemical and Biomolecular Engineering and Department of Chemistry and Biochemistry, University of Maryland, College Park, Maryland 20742, United States ‡ Department of Materials Science and Engineering, North Carolina State University, Raleigh, North Carolina 27606, United States * S Supporting Information ABSTRACT: Al/CuO reactive nanolaminate ignition was studied using temperature jump (T-Jump) heating for rates greater than 10 5 K/ s. Multilayer samples were sputter deposited onto thin platinum filaments in alternating layers of Al and CuO. The filaments were resistively heated in a time-of-flight mass spectrometer (ToF-MS), while ignition and reaction were observed with high-speed video. A total deposited thickness of 1800 nm was maintained for all samples, while the number of bilayers was varied from 1 to 12. Increasing this value decreased the diffusion distances and increased the amount of interfacial area across which reaction could occur, while keeping the overall energy of the system constant. From 2 to 6 bilayers, the ignition temperature decreased from 1250 to 670 K and the overall reactivity increased. Past 6 bilayers, the ignition temperature only decreased slightly and there was little impact on the overall reactivity. This behavior is consistent with a mass-transport model where the predominant diffusing species exhibits a low activation energy (50 kJ/mol). Ignition temperature, which depends upon bilayer thickness, is found to be a good predictor of flame speed. ■ INTRODUCTION Incorporating nanomaterials into thermite systems significantly improves the strongly exothermic oxygen exchange reaction between the metal fuel and metal oxide oxidizer. Nanoscale materials offer decreased diffusion distances and high interfacial surface area compared to traditional micron scale powders. 1−3 As a result, nanostructured thermite compositions have lower ignition temperatures and react faster, with flame speeds up to 1 km/s. 4 Most formulations involve nanoscale powders, but an alternative approach that offers great control of the resultant architecture is physical vapor deposition (PVD), in which alternating layers of fuel and oxidizer are stacked into planar structures, referred to commonly as reactive multilayers or nanolaminates. 5−8 Such structures are tunable and can be readily incorporated into MEMS processing, which makes them of interest for a variety of micropyrotechnic applications. 9,10 Regardless of the physical embodiment, much remains unknown about the processes and kinetics that control thermite ignition and reaction. Thus, the idealized form factor of nanolaminates provides a valuable avenue to explore this behavior. While reactive nanolaminates have been studied extensively at slower heating rates (∼10 K/min) in differential scanning calorimetry or thermogravimetric experiments, complementary work is needed for heating regimes that more accurately reflect the combustion conditions that will exist during application. In order to quantify the behavior of these materials under rapid heating, a temperature jump (T-Jump) technique (∼10 5 K/s) was applied to Al−CuO reactive nanolaminates. This approach involves resistively heating thin platinum filaments that have been coated with the reactive multilayers. The ignition and reaction behavior of this material was observed with high-speed video and high temporal resolution time-of- flight mass spectrometry (ToF-MS). The total thickness and the fuel-oxidizer equivalence ratio (experimental fuel to oxidizer mass ratio divided by stoichiometric fuel to oxidizer mass ratio) of the samples were kept constant so that the total energy of reaction of each sample (assuming each goes to completion) was the same. The number of layers was varied from 1 bilayer (i.e., one pair of a fuel layer and an oxidizer layer) up to 12 bilayers. This allowed us to probe the influence of interface-to- volume ratio and the average diffusion distance on the reaction properties. The simple planar geometry of these systems is ideal for understanding and modeling the kinetics of the diffusion processes that controls reaction. Because of this, we were able to fit a straightforward, diffusivity-based model for ignition to our results. Such models create a foundation for condensed phase thermite reactions, which is important to a wide range of thermite applications. For example, arrested reactive milled (ARM) materials are also dense and restricted to condensed phase reaction and recent work has shown that porous nanopowder thermites follow a condensed phase pathway as well. 11−15 While the exact nature of the interfaces can vary Received: April 29, 2015 Revised: August 13, 2015 Published: August 13, 2015 Article pubs.acs.org/JPCC © 2015 American Chemical Society 20401 DOI: 10.1021/acs.jpcc.5b04117 J. Phys. Chem. C 2015, 119, 20401−20408
Transcript of Probing the Reaction Dynamics of Thermite Nanolaminatesmrz/pdfs/2015_JPC_ncstate.pdf · Probing the...
Probing the Reaction Dynamics of Thermite NanolaminatesGarth C. Egan,† Edward J. Mily,‡ Jon-Paul Maria,‡ and Michael R. Zachariah*,†
†Department of Chemical and Biomolecular Engineering and Department of Chemistry and Biochemistry, University of Maryland,College Park, Maryland 20742, United States‡Department of Materials Science and Engineering, North Carolina State University, Raleigh, North Carolina 27606, United States
*S Supporting Information
ABSTRACT: Al/CuO reactive nanolaminate ignition was studiedusing temperature jump (T-Jump) heating for rates greater than 105 K/s. Multilayer samples were sputter deposited onto thin platinumfilaments in alternating layers of Al and CuO. The filaments wereresistively heated in a time-of-flight mass spectrometer (ToF-MS),while ignition and reaction were observed with high-speed video. Atotal deposited thickness of 1800 nm was maintained for all samples,while the number of bilayers was varied from 1 to 12. Increasing thisvalue decreased the diffusion distances and increased the amount ofinterfacial area across which reaction could occur, while keeping theoverall energy of the system constant. From 2 to 6 bilayers, the ignitiontemperature decreased from 1250 to 670 K and the overall reactivityincreased. Past 6 bilayers, the ignition temperature only decreasedslightly and there was little impact on the overall reactivity. Thisbehavior is consistent with a mass-transport model where the predominant diffusing species exhibits a low activation energy (50kJ/mol). Ignition temperature, which depends upon bilayer thickness, is found to be a good predictor of flame speed.
■ INTRODUCTIONIncorporating nanomaterials into thermite systems significantlyimproves the strongly exothermic oxygen exchange reactionbetween the metal fuel and metal oxide oxidizer. Nanoscalematerials offer decreased diffusion distances and high interfacialsurface area compared to traditional micron scale powders.1−3
As a result, nanostructured thermite compositions have lowerignition temperatures and react faster, with flame speeds up to1 km/s.4 Most formulations involve nanoscale powders, but analternative approach that offers great control of the resultantarchitecture is physical vapor deposition (PVD), in whichalternating layers of fuel and oxidizer are stacked into planarstructures, referred to commonly as reactive multilayers ornanolaminates.5−8 Such structures are tunable and can bereadily incorporated into MEMS processing, which makes themof interest for a variety of micropyrotechnic applications.9,10
Regardless of the physical embodiment, much remainsunknown about the processes and kinetics that control thermiteignition and reaction. Thus, the idealized form factor ofnanolaminates provides a valuable avenue to explore thisbehavior. While reactive nanolaminates have been studiedextensively at slower heating rates (∼10 K/min) in differentialscanning calorimetry or thermogravimetric experiments,complementary work is needed for heating regimes that moreaccurately reflect the combustion conditions that will existduring application.In order to quantify the behavior of these materials under
rapid heating, a temperature jump (T-Jump) technique (∼105K/s) was applied to Al−CuO reactive nanolaminates. This
approach involves resistively heating thin platinum filamentsthat have been coated with the reactive multilayers. Theignition and reaction behavior of this material was observedwith high-speed video and high temporal resolution time-of-flight mass spectrometry (ToF-MS). The total thickness andthe fuel-oxidizer equivalence ratio (experimental fuel to oxidizermass ratio divided by stoichiometric fuel to oxidizer mass ratio)of the samples were kept constant so that the total energy ofreaction of each sample (assuming each goes to completion)was the same. The number of layers was varied from 1 bilayer(i.e., one pair of a fuel layer and an oxidizer layer) up to 12bilayers. This allowed us to probe the influence of interface-to-volume ratio and the average diffusion distance on the reactionproperties.The simple planar geometry of these systems is ideal for
understanding and modeling the kinetics of the diffusionprocesses that controls reaction. Because of this, we were ableto fit a straightforward, diffusivity-based model for ignition toour results. Such models create a foundation for condensedphase thermite reactions, which is important to a wide range ofthermite applications. For example, arrested reactive milled(ARM) materials are also dense and restricted to condensedphase reaction and recent work has shown that porousnanopowder thermites follow a condensed phase pathway aswell.11−15 While the exact nature of the interfaces can vary
Received: April 29, 2015Revised: August 13, 2015Published: August 13, 2015
Article
pubs.acs.org/JPCC
© 2015 American Chemical Society 20401 DOI: 10.1021/acs.jpcc.5b04117J. Phys. Chem. C 2015, 119, 20401−20408

between these materials, the results of this study may beapplicable to a broader field than just the study of reactivenanolaminates.
■ EXPERIMENTAL SECTIONSample Preparation. Nanolaminate layers were deposited
onto a 76 μm diameter platinum filament using a dualmagnetron sputtering chamber, previously described in anotherpublication.7 Multilayer films were fabricated by alternating theAl and CuO depositions allowing for 15 min between eachdeposition for the sputtering heat to dissipate. The sputtersources were 2″ in diameter oriented 180° from one anotherwith shuttered confocal sources. The sputter targets (Al andCuO) were acquired from Kurt Lesker. The CuO target wasindium bound to a copper backing plate to assist in heatdissipation during the sputtering. CuO was sputtered using anRF power supply with 100 W of power with a sputter pressureof 0.27 Pa of argon (purity > 99.9999%). Aluminum wassputtered using a DC power supply at 20 W of power with asputter pressure of 0.4 Pa of argon. In order to prepare radiallyuniform thin multilayer thermite films, the Pt wire substrateswere rotated on an axis perpendicular to the plane of themagnetron sputter guns at a rotation rate of 6 rpm. Prior todeposition, the wires were cleaned via 15 min of sonication inacetone and were then rinsed with deionized water, isopropylalcohol, and methanol. They were mounted vertically and thecenter 10 mm of the wires were exposed to deposition where∼5 mm of the wire ends were masked to allow for Pt electricalcontact needed by T-Jump analysis. The laminate morphologyand thickness were characterized by scanning electron micro-copy (SEM) cross section analysis to obtain accurate depositionrates. The combination of small substrate diameter and rotationyielded deposition rates which were 40% lower in comparisonto planar deposition on a flat surface. The deposition rates were3.7 nm/min and 3.3 nm/min for Al and CuO respectively.Reference samples prepared on flat surfaces using identicaldeposition parameters were analyzed by X-ray photoelectronspectroscopy (XPS) to estimate copper valence. We routinelyfound that the Cu 2p3/2 peak was shifted from 932.4 to 933.6eV, which is consistent with CuO. Furthermore, we foundsatellite peaks at 961, 941, and 943 eV which are onlyconsistent with Cu in its 2+ valence. X-ray diffraction (XRD)on the wire deposited samples (1 and 12 bilayer) confirmedthat the phases were consistent with planar samples andinvariant to number of bilayers.All samples were deposited starting with the metal layer first
and all had a total thickness of 1800 nm. At each interfacebetween Al and CuO a prereacted barrier forms (typically 2−4nm).16,17 So while the total thickness of each sample was thesame, the samples with more interfaces featured more barriermaterial, which would decrease the overall energy of thesystem. However, the impact of this was ignored as even for thesample with the most bilayers (12), this accounted for only a5% decrease. The fuel-oxidizer equivalence ratio was main-tained at 1.4, which is fuel rich.Characterization. The T-Jump/ToF-MS experimental set
up was the primary means to investigate ignition, the details ofwhich can be found in previous papers.18−20 The nanolaminatecoated Pt filaments were heated resistively with 3 ms DCelectrical pulses to ∼1600 K. These pulses produced roughlylinear heating rates of ∼4 × 10⁵ K/s. The voltage and currentmeasured from the wire were used to determine the time-resolved temperature based on the well-known relationship
between Pt resistivity and temperature.21 This temperature wascorrelated to the behavior observed simultaneously with a highspeed camera (Phantom v12.0, 67 000 frames per second) andToF-MS with spectra taken every 100 μs. The imaging allowsfor observation of visible combustion dynamics includingoverall optical intensity and ignition, which was considered asthe first frame of sustained optical emission from the sample.After the first heating pulse and subsequent cooling, the wireswere heated a second time to provide a background signal forvideo intensity and temperature.Since Al deposited onto the platinum increases the net
conductivity and the temperature is calculated from resistance,it is important to consider the impact of adding this initial layer.The cross-sectional area of a wire was 4.5 × 10⁻⁹ m2, and thearea of the thickest Al films (1 bilayer case) was 1.9 × 10⁻¹⁰ m2,so the inclusion of the film represents only a 4% increase inarea. But, given that the resistivity of Pt is ∼5 times higher thanthat of bulk Al, this can decrease the overall resistance by 12%,which is significant, although the grain structure of the thinfilms may increase the resistivity and lessen the impact of thiseffect. Regardless, no ignition measurement was made for 1bilayer (as will be discussed below), and the potential impact ofthis effect decreases to 6%, 4%, and 2% for the 2, 3, and 6bilayers, respectively. Additionally this effect can be measuredexperimentally, with a comparison of the temperature of theexperimental heating pulses and background pulses. Thecontinuity and morphology of the Al layer would be destroyedby the experimental heating, so any effect on resistance wouldbe removed for the background run. Thus, if the diminishedresistance from Al was significant, the experimental temperaturereading at the start of the heating pulse would be lower than thebackground case. This effect was noticed in the 1 bilayer case(∼35 K difference in starting temperatures) and to a smallerdegree in the 3 bilayer case (∼15 K difference), but not in anyof the other cases. As we did not use any temperature data fromthe 1 bilayer case, and the difference in 3 bilayers was smallrelative to experimental variation, we ignored this effect.
■ RESULTSA set of cross-sectional SEM images for the Al/CuOnanolaminate samples typical of this study is shown in Figure1. The cross sections, prepared by cutting a coated wire withscissors, reveal microstructures with a columnar appearance andcoarse interface roughness. The roughness and degree ofcolumnarity in the present samples is larger than is typical ofAl/CuO films prepared on semiconductor substrates like Si.5,8
Microstructures in the present samples have a coarsenedmorphology as result of the wire surfaces, which are orders ofmagnitude rougher than a Si substrate, and from the fact thatsome fraction of the deposition occurs off-axis (i.e., depositionoccurs on the sides and back side of the wire, but at a muchslower rate than the leading surface). The kinetic energy of thespecies that deposit off-axis is lower and does not benefit fromthe additional atom mobility afforded by mild bombardment.The combination of these two effects produces this course grainmorphology. Irrespective, the films are dense and continuous. Itshould also be noted that the delamination visible in Figure 1aand d occurred during the cross sectioning process. Film furtherback from the cross sectioned edge was well adhered to the Ptsubstrate as in Figure 1b and c.For every sample, except the 1 bilayer nanolaminates, a
clearly visible ignition and reaction could be observed from thehigh speed video. Figure 2 shows some frames taken from the
The Journal of Physical Chemistry C Article
DOI: 10.1021/acs.jpcc.5b04117J. Phys. Chem. C 2015, 119, 20401−20408
20402

high-speed video of experiments performed on 3, 6, and 10bilayer samples. Each sample was subjected to a similar heatingpulse, which means that the times indicated for each frame areproportional to the temperature of the wire at that instant. Ascan be seen, the 3 bilayer sample only reacted very weakly andat high temperatures. Comparatively, both the 6 and 10 bilayersamples reacted far more violently and at significantly lowertemperatures. Based on these observations, the samples couldbe grouped into two categories: weak and violent. The weakgroup was made up of the 1, 2, and 3 bilayer samples and wascharacterized by minimal emission and ejection of materialfrom the wire. The violent group contained the 6, 8, 10, and 12bilayer sample, which all rapidly ejected large amounts of hotmaterial from the wire surface as shown in Figure 2.The point of ignition is shown in the first frames for both the
6 and 10 bilayer samples in Figure 2. By correlating the time ofthis frame with the temperature data of the wire, the ignition
temperature can be determined. For 2, 3, and 6 bilayers, theignition temperatures (±50 K) were 1250, 1130, and 680 K,respectively. The 8, 10, and 12 bilayer samples ignited at lowertemperatures of 650, 670, and 620 K, respectively. There is ageneral trend of decreasing ignition temperatures withincreasing number of bilayers that appears to saturate forsamples that have high interfacial area to volume ratios. As thetotal thickness of all samples was constant, the number ofbilayers is inversely proportional to bilayer thickness, which hasbeen found to be a controlling property for nanolaminatereaction.16,22,23 In those terms, the weakly reactive 1, 2, and 3bilayer samples had bilayer thicknesses of 1800, 900, and 600nm, respectively, while the violently reactive 6−12 bilayersamples had thicknesses of 300−150 nm. Thus, thecomparative change in bilayer thickness was much lesssignificant from 6 to 12 bilayers, which could help explain thesimilar reactivity in the violent group and diminishing change inignition temperature.In order to better quantify the reactivity, the integrated
intensity of each frame of the high speed videos wasdetermined. This data was normalized by the peak intensityof the background run taken with a second pulse of each wire.Examples of this data as plotted temporally are shown in Figure3. It should be noted that that there was some run-to-runvariation in the shape and size of the peaks, but the ones shownare representative of the general trends observed. As mentionedpreviously, for 1 bilayer, there was no ignition, which isreflected by the lack of any peaks in the intensity plot that aredistinct from the background heating. Instead the signal has thesame general shape as the background but slightly brighter. Theincreased brightness implies that some degree of exothermicreaction did occur, which led to a hotter wire. This was alsoreflected in the temperature profiles for these runs. Theintensity profiles of 2 and 3 bilayer samples were similar to the1 bilayer sample except with their ignition reflected by the smallbut distinct peaks prior to the end of the 3 ms heating pulse.They also reach higher peak intensities, suggesting morereaction occurring faster.The transition between the weak group and the violent group
is apparent with the extreme jump in reactivity from 3 to 6bilayers. Rather than the peak intensity coinciding with the endof the heating pulse, the samples with more bilayers hademission occurring prior to 2 ms that was 5−10 times largerthan the background. One interesting feature of these plots is
Figure 1. SEM image of Al/CuO nanolaminates coated Pt wires thatwere cleaved to show a cross section. Panel (a) shows the curvature ofthe films as deposited. The visible deformation of the wire is a result ofthe cross-sectioning process. Higher magnification images of 1, 3, and6 bilayer samples are shown in panels (b), (c), and (d), respectively.All samples were deposited Al first and with CuO as the outermostlayer.
Figure 2. Frames from the high speed video of samples with 3, 6, and10 bilayers. The brightness and contrast of the images for the 3 bilayersample were digitally enhanced to make the reaction more visible.Frames shown were taken 0.2 ms apart and with 14 μs exposure time.The same scale was used for all images, with the bright wire in the 3bilayer case being ∼10 mm long.
Figure 3. Integrated intensity taken from the frames of the high speedvideos. Note the difference in scales between the two rows. The bluelines represent the heating and reaction of each sample, the green linerepresents a second run of the same wire, and the red line representsthe difference between those two results. All data is normalized by thepeak of the background run.
The Journal of Physical Chemistry C Article
DOI: 10.1021/acs.jpcc.5b04117J. Phys. Chem. C 2015, 119, 20401−20408
20403

that the 6 bilayer samples featured the highest intensity, eventhough one might expect that the samples with the mostbilayers would be the brightest and most reactive. Closerinspection of the images in Figure 2 reveals that while the 6 and10 bilayer samples look similar, the visible material ejected fromthe 6 bilayer sample is coarser than that ejected by the 10bilayer sample. Because of the camera settings, many of thepixels at the center of reaction were fully saturated. This meansthat the material thrown off the wire makes a disproportionatecontribution to the integrated intensity measurement. Addi-tionally, with finite camera resolution, finer bright material canget lost and larger bright material will contribute more to theoverall intensity. As such, caution must be exercised wheninterpreting absolute intensity trends.The transition in reactivity from weak to violent is also
apparent in the mass spectra taken with the ToF-MS. Figure 4shows the signal intensity of several species, along with thetemperature of the wire for 3 and 6 bilayer sample runs. Themass spectra for the weak group (1−3 bilayer) were allqualitatively similar to the 3 bilayer case shown in Figure 1a,with a major O2 peak, whose onset (defined as 5% ofmaximum) occurred at 1050 (±50) K and preceded ignition(vertical dashed line). Samples that ignited prior to this O2release threshold (6−12 bilayer samples), showed no or muchless significant O2 signals, which implies that the oxygen reactedwith aluminum instead of being released to the chamber. It islikely that the oxygen signal observed for low bilayer samplesresulted from the decomposition of the outermost layer of CuO(2CuO → Cu2O + 1/2O2). Such behavior has been observedto occur at 975 K in CuO nanoparticles under similar heatingconditions, and is consistent with the relative stabilities of CuOand Cu2O at high temperatures and low pressures.19 Anothersignificant feature of the low bilayer mass spectrum is the lackof significant peaks for the species that normally indicate
reaction (e.g., Cu, Al2O, AlO).18,20 While Figure 4a does show
some intensity for m/z = 27 (labeled Al), there are organiccompounds with that m/z (e.g., HCN, C2H3) that are morelikely to be responsible, as there were significant C, H, and Nspecies detected at that same time (e.g., m/z = 2, 12, 28, 44).The reason for this was likely surface contamination thatoccurred during handling.In comparison, the violent samples all showed spectra similar
to the 6 bilayer case shown in Figure 4b. These samplesfeatured only minimal O2 but had significant amounts of Al, Cu,and Al2O. The onset of these peaks coincided with visibleignition observed with the high-speed camera. Since all thepeaks shared the same profile, we can reasonably assume thatall these species were the supposed reaction products ratherthan organic contamination discussed above. For all sampleswith 6 or more bilayers, Al is the most significant vapor phasereaction species, which may at first seem unusual consideringthat CuO was the terminal layer in each case. However, atsimilar temperatures, the equilibrium vapor pressure of Al isabout twice that of Cu. Combining this information with theobservation of violent delamination upon ignition of thesemore reactive samples (see Figure 2) leads to a self-consistentunderstanding that upon ignition most of the multilayermaterial is ejected from the wire surface and the “history” ofthe initial layering sequence is lost. Thus, the high temperatureproperties of the constituent elements predominate theexperiment.In order to better understand the material being ejected,
product collection was performed in a manner similar to thatfound in a previous paper.12 A carbon tape substrate waspositioned ∼3 mm from the Pt filament, which was then heatedat ∼105 K/s. The product was analyzed using scanning electronmicroscopy (SEM) as is shown in Figure 5 for a 10 bilayersample. Figure 5a shows the general product morphology,which are roughly spherical particles with average diameter of∼4 μm. Figure 5b shows a higher magnification of the productusing backscattered electrons (BSE), which cause the heavierelements (Cu) to show up brighter. Energy dispersive X-rayspectroscopy (EDS) was used to confirm that the bright phasewas copper and the darker phase was oxidized aluminum. Thenear spherical shape of the product particles indicate they areformed in a molten state, which is to be expected given that theadiabatic flame temperature for this system (∼2800 K) is muchhigher than the melting point of Al2O3 (2345 K).
24 Also visiblein this image, decorating the surface of the larger particle, aresmall nanoparticles (<50 nm) that were likely formed from
Figure 4. TOF-MS results from experiments for samples with (a) 3bilayers and (b) 6 bilayers. The vertical dashed line indicates the timeof ignition as determined from high-speed video.
Figure 5. SEM images of product collected ∼3 mm away from a 10bilayer sample. Panel (a) gives a view of the general morphology of theproduct. Panel (b) is an image of a single product particle taken usingbackscattered electrons (BSE), which show heavier elements (Cu) asbrighter.
The Journal of Physical Chemistry C Article
DOI: 10.1021/acs.jpcc.5b04117J. Phys. Chem. C 2015, 119, 20401−20408
20404

vapor phase condensation.12 This experiment was alsoperformed on the 3 bilayer case, which showed the samecharacteristic morphologies but with far less material collecteddue to the less violent reaction.
■ DISCUSSIONA primary benefit realized when studying reactive nano-laminates is that their geometrically simple embodimentfacilitates studying and understanding the processes thatcontrols reaction. Further since they are dense, reaction canonly occur through condensed phase diffusion. With thesefeatures in mind, we developed a model based on 1D diffusionfor nanolaminate ignition. We focus only on the reactionleading up to the point of ignition, because as discussed abovethe violence of the ignition process destroys the morphologyand changes the amount of interfacial area.For this model, we assume a planar geometry as the thickness
of the film (1.8 μm) is small compared to the diameter of thewire substrate (76 μm). We also assume that the entirety of thenanolaminate is isothermal with the wires. This is reasonablebecause there is good interfacial contact between the layers andthe wire. Using the reported thermal diffusivities of Al and CuO(8.3 × 10⁻⁵ and 5.1 × 10⁻⁶ m2/s), a 1800 nm thick layer willhave a characteristic time to thermal equilibrium (defines aslength scale squared divided by the diffusivity) of ∼40 and 640ns for Al and CuO respectively.25 This is much faster than the 3ms heating time scale of the wire. We also assume that reactionis controlled by a diffusivity with Arrhenius behavior. Thismodel focuses on the interfacial reaction that occurs leading upto the point of ignition, which is only a small portion of theoverall reaction. Because of this we can neglect the oxygen lossthat occurred prior to ignition in the 2 and 3 bilayer cases andthe effect that the loss could have on the overall energy releaseof reaction. Any oxygen loss should occur from the surfacesopen to the environment, which are farther than 100 nm fromthe reaction interfaces and thus should not affect the localinterfacial oxygen concentration during the short time scaleleading to ignition. Therefore, we can treat all samples the samedespite the differences in reactivity discussed above.From this basic framework we can model the change in
temperature with the following three equations:
= Tt C
Qdd
1
prxn
(1)
= ΔQ nA H Jrxn rxn (2)
= ∇ −J cD e E RT0
( / )a (3)
Equation 1 relates the temporal change in temperature to therate of heat generation by reaction (Qrxn) divided by the heatcapacity (Cp). The heat generated is evaluated in eq 2, where nis the number of interfaces, A (m2) is the surface area of eachinterface, ΔHrxn (J/mol) is the energy released from each molof reaction, and J (mol/(s·m2)) is the flux of oxygen througheach interface. The interfacial area, A, can be calculated basedon a cylinder with the diameter of the wire to be 2.4 × 10⁶ m2
for a 10 mm long film. The number of interfaces is related tothe number of bilayers (N) through n = 2N − 1. While heatcapacity is temperature dependent, the change is relatively smallover the range of ignition temperatures determined here. Forsimplicity, the value at the average ignition temperature (830K) was used for all cases. Equation 3 is the Fickian diffusion flux
through each interface, where ∇c (mol/m4) is the concen-tration gradient across the interface, D0 is the pre-exponentialto the diffusivity, and Ea is its activation energy. Theconcentration gradient is based on O anions going from zeroto the concentration in CuO over the length of a typicalinterfacial AlxOy barrier layer (Δxb ∼ 4 nm) to be 2.0 × 10¹³
mol/m4.16
The process of achieving ignition is not well-defined, but inthese experiments ignition was observed as localized, very rapidincreases in brightness that occurred discontinuously from thewire heating. As such, ignition marks a decoupling of wire andfilm temperatures, with the film temperature rapidly increasingabove that of the wire. For this reason, we chose to defineignition temperature (Tign) as the point at which thetemperature rise from reaction (eq 1) exceeds the heatingrate from the wire (5 × 10⁵ K/s). Combining eqs 1−3 andsolving for ignition temperature gives
= −×∇ Δ
−⎛⎝⎜⎜
⎛⎝⎜⎜
⎞⎠⎟⎟⎞⎠⎟⎟T
ER
C
n c H ADln
(5 10 K/s)ign
a5
p
rxn 0
1
(4)
Apart from the two variables that define diffusivity (D0 andEa), all other constants are well-defined or can be reasonablyestimated. Diffusivity is not as well-known, because there is awide range in the available data, and it is unclear which speciesis the primary diffusant. Therefore, the fit to the experimentaldata used D0 and Ea as tunable parameters. Additionally, allthese values are temperature independent, except forconcentration gradient (∇c), which would change as thebarrier layer (Δxb) grows from reaction with ∇c(T) = Δc/Δxb(T). The growth of the barrier layer is determined by theflux of oxygen ions, which thickens the Al2O3 side of the barrierand depletes oxygen from the CuO side. Therefore, the changein barrier thickness can be written as
Δ= +
xt
J V Vd
d(3 )b
mAl O
mCuO2 3
(5)
Here, VmAl2O3 and Vm
CuO are the molar volumes (m3/mol) ofAl2O3 and CuO, respectively, and J (mol/(s·m2)) is the flux asgiven in eq 3. From this, with a known D0 and Ea, the barrierlayer thickness can be modeled by numerically integrating withthe constant heating rate. However, as we are starting withunknown values of D0 and Ea, we employed an iterative modelrefinement approach to determining these parameters. To start,a constant concentration gradient was assumed and eq 4 was fitto the experimental data, giving the values Ea = 20 kJ/mol andD0 = 9.0 × 10⁻¹³ m2/s. Then the barrier layer growth wasdetermined by numerically integrating eq 5 with theseparameters. Then a new fit was made based on a modifiedindependent variable (n∇c) that combined the experimentalnumber of bilayers with the concentration gradient predictedby the model for that value of n. This generated a new set of D0and Ea that was used to start the next iteration. This processwas continued until convergence, when the values for Ea and D0remained constant through further iterations. More details onthis procedure can be found in the Supporting Information.The modeled ignition temperature is shown with the
experimental data in Figure 6a. The black solid line is the fitmade from the assumption of a constant concentration gradient(Ea = 20 kJ/mol, D0 = 9.0 × 10⁻¹³ m2/s), and the dashed grayline is the result of the iterative refinement (Ea = 49 kJ/mol, D0= 2.9 × 10⁻¹⁰ m2/s) that takes into account the barrier layer
The Journal of Physical Chemistry C Article
DOI: 10.1021/acs.jpcc.5b04117J. Phys. Chem. C 2015, 119, 20401−20408
20405
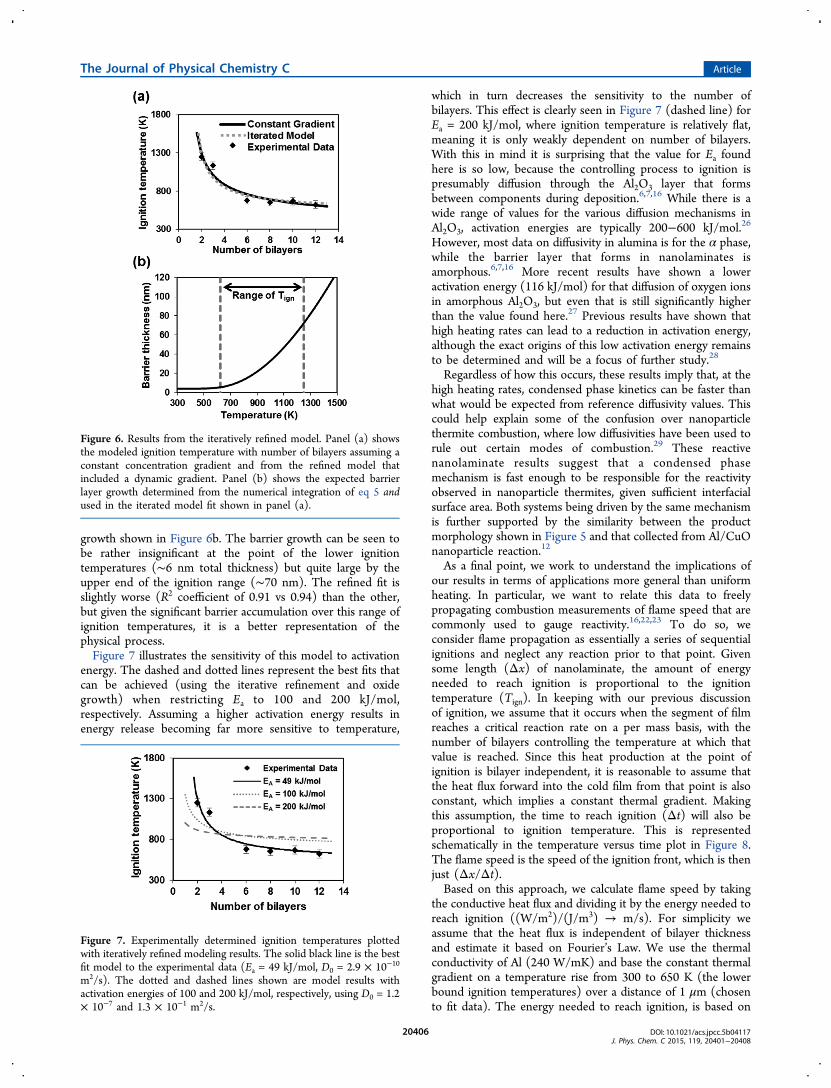
growth shown in Figure 6b. The barrier growth can be seen tobe rather insignificant at the point of the lower ignitiontemperatures (∼6 nm total thickness) but quite large by theupper end of the ignition range (∼70 nm). The refined fit isslightly worse (R2 coefficient of 0.91 vs 0.94) than the other,but given the significant barrier accumulation over this range ofignition temperatures, it is a better representation of thephysical process.Figure 7 illustrates the sensitivity of this model to activation
energy. The dashed and dotted lines represent the best fits thatcan be achieved (using the iterative refinement and oxidegrowth) when restricting Ea to 100 and 200 kJ/mol,respectively. Assuming a higher activation energy results inenergy release becoming far more sensitive to temperature,
which in turn decreases the sensitivity to the number ofbilayers. This effect is clearly seen in Figure 7 (dashed line) forEa = 200 kJ/mol, where ignition temperature is relatively flat,meaning it is only weakly dependent on number of bilayers.With this in mind it is surprising that the value for Ea foundhere is so low, because the controlling process to ignition ispresumably diffusion through the Al2O3 layer that formsbetween components during deposition.6,7,16 While there is awide range of values for the various diffusion mechanisms inAl2O3, activation energies are typically 200−600 kJ/mol.26
However, most data on diffusivity in alumina is for the α phase,while the barrier layer that forms in nanolaminates isamorphous.6,7,16 More recent results have shown a loweractivation energy (116 kJ/mol) for that diffusion of oxygen ionsin amorphous Al2O3, but even that is still significantly higherthan the value found here.27 Previous results have shown thathigh heating rates can lead to a reduction in activation energy,although the exact origins of this low activation energy remainsto be determined and will be a focus of further study.28
Regardless of how this occurs, these results imply that, at thehigh heating rates, condensed phase kinetics can be faster thanwhat would be expected from reference diffusivity values. Thiscould help explain some of the confusion over nanoparticlethermite combustion, where low diffusivities have been used torule out certain modes of combustion.29 These reactivenanolaminate results suggest that a condensed phasemechanism is fast enough to be responsible for the reactivityobserved in nanoparticle thermites, given sufficient interfacialsurface area. Both systems being driven by the same mechanismis further supported by the similarity between the productmorphology shown in Figure 5 and that collected from Al/CuOnanoparticle reaction.12
As a final point, we work to understand the implications ofour results in terms of applications more general than uniformheating. In particular, we want to relate this data to freelypropagating combustion measurements of flame speed that arecommonly used to gauge reactivity.16,22,23 To do so, weconsider flame propagation as essentially a series of sequentialignitions and neglect any reaction prior to that point. Givensome length (Δx) of nanolaminate, the amount of energyneeded to reach ignition is proportional to the ignitiontemperature (Tign). In keeping with our previous discussionof ignition, we assume that it occurs when the segment of filmreaches a critical reaction rate on a per mass basis, with thenumber of bilayers controlling the temperature at which thatvalue is reached. Since this heat production at the point ofignition is bilayer independent, it is reasonable to assume thatthe heat flux forward into the cold film from that point is alsoconstant, which implies a constant thermal gradient. Makingthis assumption, the time to reach ignition (Δt) will also beproportional to ignition temperature. This is representedschematically in the temperature versus time plot in Figure 8.The flame speed is the speed of the ignition front, which is thenjust (Δx/Δt).Based on this approach, we calculate flame speed by taking
the conductive heat flux and dividing it by the energy needed toreach ignition ((W/m2)/(J/m3) → m/s). For simplicity weassume that the heat flux is independent of bilayer thicknessand estimate it based on Fourier’s Law. We use the thermalconductivity of Al (240 W/mK) and base the constant thermalgradient on a temperature rise from 300 to 650 K (the lowerbound ignition temperatures) over a distance of 1 μm (chosento fit data). The energy needed to reach ignition, is based on
Figure 6. Results from the iteratively refined model. Panel (a) showsthe modeled ignition temperature with number of bilayers assuming aconstant concentration gradient and from the refined model thatincluded a dynamic gradient. Panel (b) shows the expected barrierlayer growth determined from the numerical integration of eq 5 andused in the iterated model fit shown in panel (a).
Figure 7. Experimentally determined ignition temperatures plottedwith iteratively refined modeling results. The solid black line is the bestfit model to the experimental data (Ea = 49 kJ/mol, D0 = 2.9 × 10⁻¹⁰
m2/s). The dotted and dashed lines shown are model results withactivation energies of 100 and 200 kJ/mol, respectively, using D0 = 1.2× 10⁻⁷ and 1.3 × 10⁻¹ m2/s.
The Journal of Physical Chemistry C Article
DOI: 10.1021/acs.jpcc.5b04117J. Phys. Chem. C 2015, 119, 20401−20408
20406

the change in standard enthalpy of formation from roomtemperature to the ignition point. The results of thesecalculations are plotted in Figure 9 along with flame speeddata for sputter deposited Al/CuO nanolaminates reported byBahrami et al.16 The values calculated here from ignitiontemperature show the same trend as the experimentallydetermined values. This suggests the flame speed, ignitiontemperature, and bilayer thickness can all be directly correlatedto one another. As the amount of interfacial area per unit massincreases, ignition temperature falls while flame speed risesrapidly. This trend occurs because thinner bilayers have lessmass per reacting interface, which promotes faster self-heatingat lower temperatures. Further, the agreement shown in Figure9 reflects that the heating rates used in these experiments (∼105K/s) sufficiently reproduce the kinetics of combustion.
■ CONCLUSIONSAl/CuO reactive nanolaminates of a constant thickness butvaried number of bilayers were sputter deposited onto Ptfilaments. These filaments were heated at ∼4 × 10⁵ K/s and thereactivity was characterized with high speed video and ToF-MS.Increasing the number of bilayers, and thus deceasing bilayerthickness, was found to enhance reactivity and lower ignitiontemperature. For samples with fewer than 3 bilayers, only O2and no other species expected from reaction were detected withmass spectroscopy. In comparison, the strongest signals forsamples with 6 or greater bilayers were Al, Al2O, and Cu. Asimple diffusion based model was developed and fit to theexperimentally determined ignition temperatures. From thismodel, it was determined that a low activation energy (50 kJ/mol) was likely controlling the ignition process. With similaranalysis, the experimentally determined ignition temperatures
were used to calculate flames speeds. The results of thesecalculations were found to be in good agreement withexperimentally determined values.
■ ASSOCIATED CONTENT*S Supporting InformationThe Supporting Information is available free of charge on theACS Publications website at DOI: 10.1021/acs.jpcc.5b04117.
Details of the iterative refinement of the model (PDF)
■ AUTHOR INFORMATIONCorresponding Author*E-mail: [email protected] authors declare no competing financial interest.
■ ACKNOWLEDGMENTSWork conducted by M.R.Z and G.C.E. has been supported bythe Army Research Office (Ralph Anthenien) and the DefenseThreat Reduction Agency. J.-P.M. and E.J.M. acknowledgeRalph Anthenien and the U.S. Army Research Office forfinancial support under contract W911NF1310493. Weacknowledge the support of the Maryland NanoCenter andits AIMLab.
■ REFERENCES(1) Dreizin, E. L. Metal-based Reactive Nanomaterials. Prog. EnergyCombust. Sci. 2009, 35, 141−167.(2) Rogachev, A. S.; Mukasyan, A. S. Combustion of HeterogeneousNanostructural Systems (Review). Combust., Explos. Shock Waves2010, 46, 243−266.(3) Yetter, R. A.; Risha, G. A.; Son, S. F. Metal Particle Combustionand Nanotechnology. Proc. Combust. Inst. 2009, 32, 1819−1838.(4) Weismiller, M. R.; Malchi, J. Y.; Lee, J. G.; Yetter, R. A.; Foley, T.J. Effects of Fuel and Oxidizer Particle Dimensions on the Propagationof Aluminum Containing Thermites. Proc. Combust. Inst. 2011, 33,1989−1996.(5) Blobaum, K. J.; Reiss, M. E.; Plitzko, J. M.; Weihs, T. P.Deposition and Characterization of a Self-Propagating CuOx/AlThermite Reaction in a Multilayer Foil Geometry. J. Appl. Phys. 2003,94, 2915−2922.(6) Petrantoni, M.; Rossi, C.; Salvagnac, L.; Conedera, V.; Esteve, A.;Tenailleau, C.; Alphonse, P.; Chabal, Y. J. Multilayered Al/CuOThermite Formation by Reactive Magnetron Sputtering: Nano VersusMicro. J. Appl. Phys. 2010, 108, 084323.(7) Kwon, J.; Ducere, J. M.; Alphonse, P.; Bahrami, M.; Petrantoni,M.; Veyan, J.-F.; Tenailleau, C.; Esteve, A.; Rossi, C.; Chabal, Y. J.Interfacial Chemistry in Al/CuO Reactive Nanomaterial and Its Rolein Exothermic Reaction. ACS Appl. Mater. Interfaces 2013, 5, 605−613.(8) Mily, E. J.; Oni, A.; LeBeau, J. M.; Liu, Y.; Brown-Shaklee, H. J.;Ihlefeld, J. F.; Maria, J. P. The Role of Terminal Oxide Structure andProperties in Nanothermite Reactions. Thin Solid Films 2014, 562,405−410.(9) Rossi, C.; Esteve, D. Micropyrotechnics, a New Technology forMaking Energetic Microsystems: Review and Prospective - Review.Sens. Actuators, A 2005, 120, 297−310.(10) Rossi, C.; Esteve, A.; Vashishta, P. Nanoscale EnergeticMaterials. J. Phys. Chem. Solids 2010, 71, 57−58.(11) Egan, G. C.; LaGrange, T.; Zachariah, M. R. Time-ResolvedNanosecond Imaging of Nanoscale Condensed Phase Reaction. J.Phys. Chem. C 2015, 119, 2792−2797.(12) Sullivan, K. T.; Piekiel, N. W.; Wu, C.; Chowdhury, S.; Kelly, S.T.; Hufnagel, T. C.; Fezzaa, K.; Zachariah, M. R. Reactive Sintering:An Important Component in the Combustion of NanocompositeThermites. Combust. Flame 2012, 159, 2−15.
Figure 8. Schematic representation of the temperature profiles ofsome segment (Δx) of reactive foil as the flame front moves across it.The different lines represent the effect of different ignitiontemperatures on the time scale of ignition. ΔtL, ΔtM, and ΔtH arethe time needed for a foil segment to reach a low, moderate, and highignition temperature, respectively.
Figure 9. Flame speeds as calculated from the experimentallydetermined ignition temperatures. Also shown are experimentalflame speed results as reported by Bahrami et al.16
The Journal of Physical Chemistry C Article
DOI: 10.1021/acs.jpcc.5b04117J. Phys. Chem. C 2015, 119, 20401−20408
20407

(13) Stamatis, D.; Ermoline, A.; Dreizin, E. L. A Multi-Step ReactionModel for Ignition of Fully-Dense Al-CuO Nanocomposite Powders.Combust. Theory Modell. 2012, 16, 1011−1028.(14) Schoenitz, M.; Ward, T. S.; Dreizin, E. L. Fully Dense Nano-Composite Energetic Powders Prepared by Arrested Reactive Milling.Proc. Combust. Inst. 2005, 30, 2071−2078.(15) Jacob, R. J.; Jian, G.; Guerieri, P. M.; Zachariah, M. R. EnergyRelease Pathways in Nanothermites Follow Through the CondensedPhase. Combust. Flame 2015, 162, 258−264.(16) Bahrami, M.; Taton, G.; Conedera, V.; Salvagnac, L.; Tenailleau,C.; Alphonse, P.; Rossi, C. Magnetron Sputtered Al-CuO Nano-laminates: Effect of Stoichiometry and Layers Thickness on EnergyRelease and Burning Rate. Propellants, Explos., Pyrotech. 2014, 39,365−373.(17) Mily, E. J. Thermite at the Nano-Scale. Ph.D. Thesis, NorthCarolina State University, May 2015.(18) Jian, G.; Piekiel, N. W.; Zachariah, M. R. Time-Resolved MassSpectrometry of Nano-Al and Nano-Al/CuO Thermite under RapidHeating: A Mechanistic Study. J. Phys. Chem. C 2012, 116, 26881−26887.(19) Zhou, L.; Piekiel, N.; Chowdhury, S.; Zachariah, M. R. Time-Resolved Mass Spectrometry of the Exothermic Reaction betweenNanoaluminum and Metal Oxides: The Role of Oxygen Release. J.Phys. Chem. C 2010, 114, 14269−14275.(20) Jian, G.; Chowdhury, S.; Sullivan, K.; Zachariah, M. R.Nanothermite Reactions: Is Gas Phase Oxygen Generation from theOxygen Carrier an Essential Prerequisite to Ignition? Combust. Flame2013, 160, 432−437.(21) Childs, P. R. Practical Temperature Measurement; Butterworth-Heinemann: Woburn, MA, 2001.(22) Alawieh, L.; Weihs, T. P.; Knio, O. M. A Generalized ReducedModel of Uniform and Self-Propagating Reactions in ReactiveNanolaminates. Combust. Flame 2013, 160, 1857−1869.(23) Mann, A. B.; Gavens, A. J.; Reiss, M. E.; VanHeerden, D.; Bao,G.; Weihs, T. P. Modeling and Characterizing the PropagationVelocity of Exothermic Reactions in Multilayer Foils. J. Appl. Phys.1997, 82, 1178−1188.(24) Sullivan, K. T.; Kuntz, J. D.; Gash, A. E. The Role of FuelParticle Size on Flame Propagation Velocity in Thermites with aNanoscale Oxidizer. Propellants, Explos., Pyrotech. 2014, 39, 407−415.(25) Edwards, A. L. Compilation of Thermal Property Data forComputer Heat-Conduction Calculations; California Univ., Livermore,Lawrence Radiation Lab: Livermore, CA, 1969.(26) Heuer, A. H. Oxygen and Aluminum Diffusion in Alpha-Al2O3:How Much Do We Really Understand? J. Eur. Ceram. Soc. 2008, 28,1495−1507.(27) Nabatame, T.; Yasuda, T.; Nishizawa, M.; Ikeda, M.; Horikawa,T.; Toriumi, A. Comparative Studies on Oxygen Diffusion Coefficientsfor Amorphous and Gamma-Al2O3 Films Using O-18 Isotope. Jpn. J.Appl. Phys., Part 1 2003, 42, 7205−7208.(28) Jian, G.; Zhou, L.; Piekiel, N. W.; Zachariah, M. R. Low EffectiveActivation Energies for Oxygen Release from Metal Oxides: Evidencefor Mass-Transfer Limits at High Heating Rates. ChemPhysChem 2014,15, 1666−1672.(29) Levitas, V. I.; Pantoya, M. L.; Dikici, B. Melt Dispersion versusDiffusive Oxidation Mechanism for Aluminum Nanoparticles: CriticalExperiments and Controlling Parameters. Appl. Phys. Lett. 2008, 92,011921.
The Journal of Physical Chemistry C Article
DOI: 10.1021/acs.jpcc.5b04117J. Phys. Chem. C 2015, 119, 20401−20408
20408