
Probing the Chemical Structure of Monolayer Covalent ... · Probing the Chemical Structure of...
11
0 Probing the Chemical Structure of Monolayer Covalent-Organic Frameworks Grown via Schiff-Base Condensation Reactions Ya Hu, Niall Goodeal, Ying Chen, Alex M. Ganose, Robert G. Palgrave, Hugo Bronstein and Matthew O. Blunt* Department of Chemistry, University College London (UCL), 20 Gordon Street, London WC1H 0AJ, U.K. *Contact email: [email protected] Table of Contents: S.1 Experimental Details S.1.1 Raw materials: S.1.2 2D-COF synthesis: S.1.3 STM/AFM experiments: S.1.4 XPS experiments: S.2 XPS Data Analysis S.3 Additional STM / AFM Data S.4 Additional XPS Data S.5 References Electronic Supplementary Material (ESI) for ChemComm. This journal is © The Royal Society of Chemistry 2016
Transcript of Probing the Chemical Structure of Monolayer Covalent ... · Probing the Chemical Structure of...
0
Probing the Chemical Structure of Monolayer Covalent-Organic Frameworks Grown via Schiff-Base Condensation Reactions
Ya Hu, Niall Goodeal, Ying Chen, Alex M. Ganose, Robert G. Palgrave,
Hugo Bronstein and Matthew O. Blunt*
Department of Chemistry, University College London (UCL), 20 Gordon Street, London WC1H 0AJ, U.K.
*Contact email: [email protected]
Table of Contents:
S.1 Experimental Details
S.1.1 Raw materials:
S.1.2 2D-COF synthesis:
S.1.3 STM/AFM experiments:
S.1.4 XPS experiments:
S.2 XPS Data Analysis
S.3 Additional STM / AFM Data
S.4 Additional XPS Data
S.5 References
Electronic Supplementary Material (ESI) for ChemComm.This journal is © The Royal Society of Chemistry 2016
1
S.1 Experimental Details:
S.1.1 Raw materials:5,10,15,20-tetrakis-(4-aminophenyl) porphyrin (TAPP) and 5,10,15,20-tetrakis-(4-aminophenyl) porphyrin-Zinc(II) (Zn-TAPP) were synthesized according to a previously published method.S1 Bezene-1,4-dicarboxaldehyde (BDA); copper(II) sulfate pentahydrate (CuSO4·5H2O); toluene (anhydrous, 99.8%); chloroform (anhydrous> 99%); and 1,2,4-trichlorobenzene (anhydrous> 99%) where purchased from Sigma-Aldrich and used without further purification. Highly-oriented pyrolytic graphite (HOPG) substrates (12 mm, grade ZYB) where purchased from Bruker AXS. Glass reaction tubes were 15 mL pressure tubes with PTFE screw cap and CAPFE O-ring seal purchased from ACE Glass Inc.
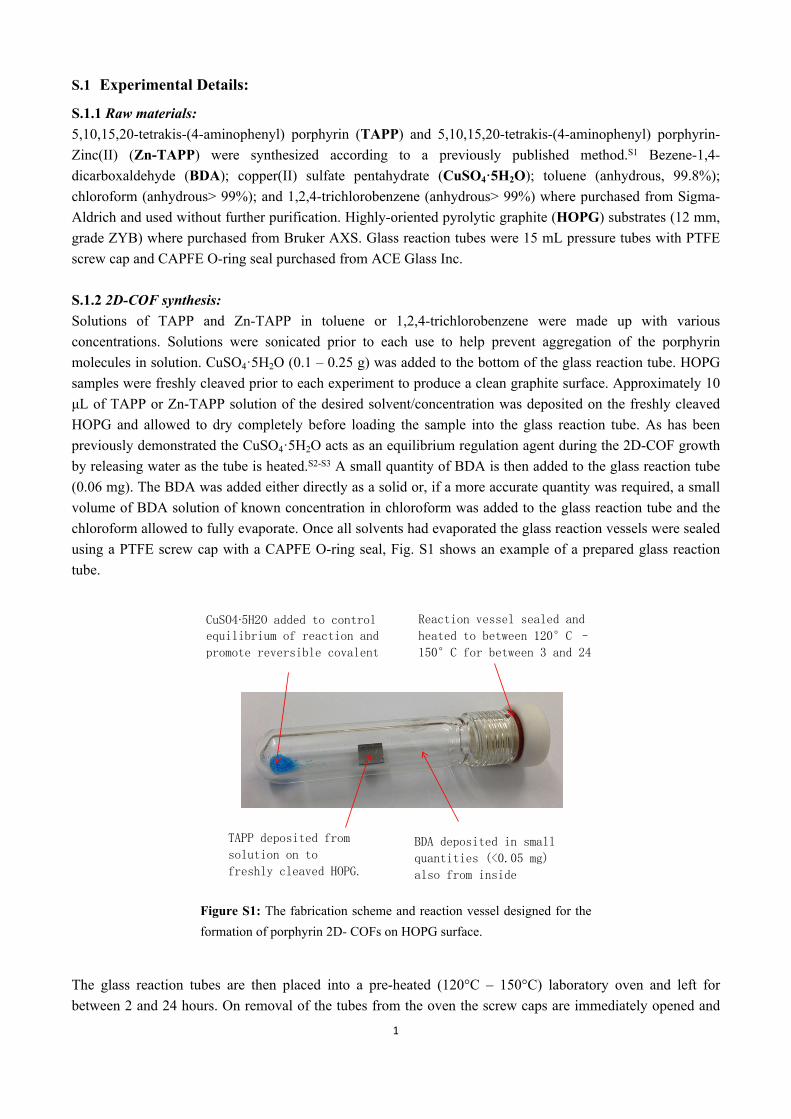
S.1.2 2D-COF synthesis:Solutions of TAPP and Zn-TAPP in toluene or 1,2,4-trichlorobenzene were made up with various concentrations. Solutions were sonicated prior to each use to help prevent aggregation of the porphyrin molecules in solution. CuSO4·5H2O (0.1 – 0.25 g) was added to the bottom of the glass reaction tube. HOPG samples were freshly cleaved prior to each experiment to produce a clean graphite surface. Approximately 10 μL of TAPP or Zn-TAPP solution of the desired solvent/concentration was deposited on the freshly cleaved HOPG and allowed to dry completely before loading the sample into the glass reaction tube. As has been previously demonstrated the CuSO4·5H2O acts as an equilibrium regulation agent during the 2D-COF growth by releasing water as the tube is heated.S2-S3 A small quantity of BDA is then added to the glass reaction tube (0.06 mg). The BDA was added either directly as a solid or, if a more accurate quantity was required, a small volume of BDA solution of known concentration in chloroform was added to the glass reaction tube and the chloroform allowed to fully evaporate. Once all solvents had evaporated the glass reaction vessels were sealed using a PTFE screw cap with a CAPFE O-ring seal, Fig. S1 shows an example of a prepared glass reaction tube.
TAPP deposited from
solution on to
freshly cleaved HOPG.
CuSO4∙5H2O added to controlequilibrium of reaction and
promote reversible covalent
BDA deposited in small
quantities (<0.05 mg)
also from inside
Reaction vessel sealed and
heated to between 120°C –
150°C for between 3 and 24
Figure S1: The fabrication scheme and reaction vessel designed for the formation of porphyrin 2D- COFs on HOPG surface.
The glass reaction tubes are then placed into a pre-heated (120°C – 150°C) laboratory oven and left for between 2 and 24 hours. On removal of the tubes from the oven the screw caps are immediately opened and
2
the HOPG samples removed. This rapid cooling process was used to attempt to ‘quench’ the growing structure of the 2D-COFs. S.1.3 STM/AFM Experiments:All scanning tunnelling microscopy (STM) imaging on the 2D-COF structures on HOPG was performed using an Agilent 5500 SPM system operating in constant-current STM mode. All measurements were carried out under ambient conditions. STM tips were formed from mechanically cut PtIr wire (Pt(80)/Ir(20); temper hard; diameter 0.25 mm) purchased from Advent Research Materials Ltd. Most of the STM images were obtained at the solid-air interface of the HOPG substrate. A few of the STM images presented were collected at the solid-liquid interface between the HOPG and 1-phenyloctane after a drop of phenyl octane had been applied to the HOPG surface. Where it has been noted in figures captions some of the high-resolution STM images have been drift corrected using the underlying HOPG lattice as a calibration. The drift correction process was applied using the SPIP software from Image Metrology. All atomic force microscopy (AFM) imaging was performed using a Bruker Multimode 8 AFM in PeakForce Tapping mode. Cantilevers used for imaging were silicon tips on a nitride lever SCANASYST-AIR from Bruker: resonant frequency f0 = 70 kHz and force constant k = 0.4 N m-1. In addition to the drift correction mentioned above all SPM images have had a 2nd order flattening process applied to them and no further image processing.
S.1.4 XPS Experiments:Following growth and subsequent STM/AFM imaging, the chemical structure/composition of the porphyrin 2D-COFs samples was analysed using X-ray photoelectron spectroscopy (XPS). XPS experiments were performed using a Thermo Scientific K-Alpha instrument equipped with a monochromatic Al Kα X-ray source (1486.6 eV). A low-energy argon-ion gun (≤ 10 eV) was used to neutralize charge build-up on the samples during XPS experiments. For each 2D-COF sample high resolution data was acquired for the C1s, N1s and O1s regions of binding energy and a survey scan carried out showing the entire binding energy spectrum. In addition to this, for 2D-COF samples grown using Zn-TAPP, high resolution data was also collected for the Zn2p region of binding energies. In addition to the 2D-COF samples control samples for unreacted TAPP and Zn-TAPP were studied. These samples consisted of a HOPG sample with deposited TAPP or Zn-TAPP produced using the same method as for the 2D-COF samples but with no heating step applied.
S.2 XPS Data Analysis
Analysis of the XPS data was carried out using the Casa XPS program. All of the XPS spectra presented in the main paper, and all subsequent data analysis were performed following subtraction of a Shirley background from the region of interest. The N1s XPS spectra were fitted using components with Gaussian/Lorentzian line-shapes and with full-width-half-maximum (FWHM) values constrained within the range 0.8 – 1.2 eV. Neither the energy nor the relative area of the components was constrained. This range was chosen based on fitting to the intense C1s peak (FWHM ~ 1.0 eV). The binding energy position of the C1s peak (284.7 eV) was consistent across every sample studied negating the need for any further correction when comparing binding energies between samples. The number of components used to fit each spectrum was chosen based on the number of expected N species. In total for all samples there are 6 different N species expected:
NA = protonated nitrogen in the core of the TAPP molecule. NB = unprotonated nitrogen in the core of the TAPP molecule. NC = nitrogen coordinated to Zn in the core of the Zn-TAPP. ND = nitrogen in unreacted amine groups.

3
NE = nitrogen in imine groups formed during 2D-COF growth. NF = nitrogen in hemiaminal groups formed during 2D-COF growth.
Each N1s spectrum also had one additional satellite peak in the binding energy range 401 – 402 eV. This peak was constrained to have a FWHM in the range 1 – 2 eV and is a commonly observed feature in XPS studies of porphyrins.S2 The chemical structures of the different N species can found below in Figure S2. In order to quantify the % composition of the different N species in the various different samples the following procedure was used. After background subtraction the area of the satellite peak at high binding energies was removed from the total area of the fit and the % of the remaining area corresponding to each of the other components was calculated. These % are shown in the tables below for TAPP in Table S1; and Zn-TAPP in Table S2.
The growth parameters for the samples studied by XPS were as follows: Unreacted TAPP: 10 μl TAPP in toluene (0.065 mg ml-1) deposited on HOPG and allowed to dry. TAPP 2D-COF: 10 μl TAPP in toluene (0.065 mg ml-1) deposited on HOPG and allowed to dry. Placed
in sealed reaction tube with 0.06 mg of BDA and 0.15 g of CuSO4·5H2O. Placed in an oven at 130°C for 15 hr.
Unreacted Zn-TAPP: 10 μl Zn-TAPP in toluene (0.09 mg ml-1) deposited on HOPG and allowed to dry. Zn-TAPP 2D-COF: 10 μl TAPP in toluene (0.09 mg ml-1) deposited on HOPG and allowed to dry.
Placed in sealed reaction tube with 0.06 mg of BDA and 0.15 g of CuSO4·5H2O. Placed in oven at 130°C for 15 hr.
Figure S2: Molecular structure for the different N species observed in the XPS spectra of TAPP and Zn-TAPP samples. NA = protonated nitrogen in the core of the TAPP molecule; NB = unprotonated nitrogen in the core of the TAPP molecule; NC = nitrogen coordinated to Zn in the core of the Zn-TAPP; ND = nitrogen in unreacted amine groups; NE = nitrogen in imine groups formed during 2D-COF growth; and NF = nitrogen in hemiaminal groups formed during 2D-COF growth.
Sample:Unreacted
TAPPTAPP 2D-
COF N species
NA 29.0 % 30.0 %NB 23.8 % 19.4 %ND 47.2 % 18.6 %NE — 18.6 %NF — 13.4 %
Table S1: Percentage contributions of the different nitrogen species (NA, NB, ND, NE and NF) for samples containing TAPP molecules. The TAPP 2D-COF sample contains all 5 N species while the unreacted TAPP sample only contains the 2 N species within the porphyrin core and unreacted amines.
Sample:Unreacted Zn-TAPP
Zn-TAPP 2D-COF
N speciesNC + NE 48.6 % 61.0 %
ND 51.4 % 17.6 %NF — 21.4 %
4
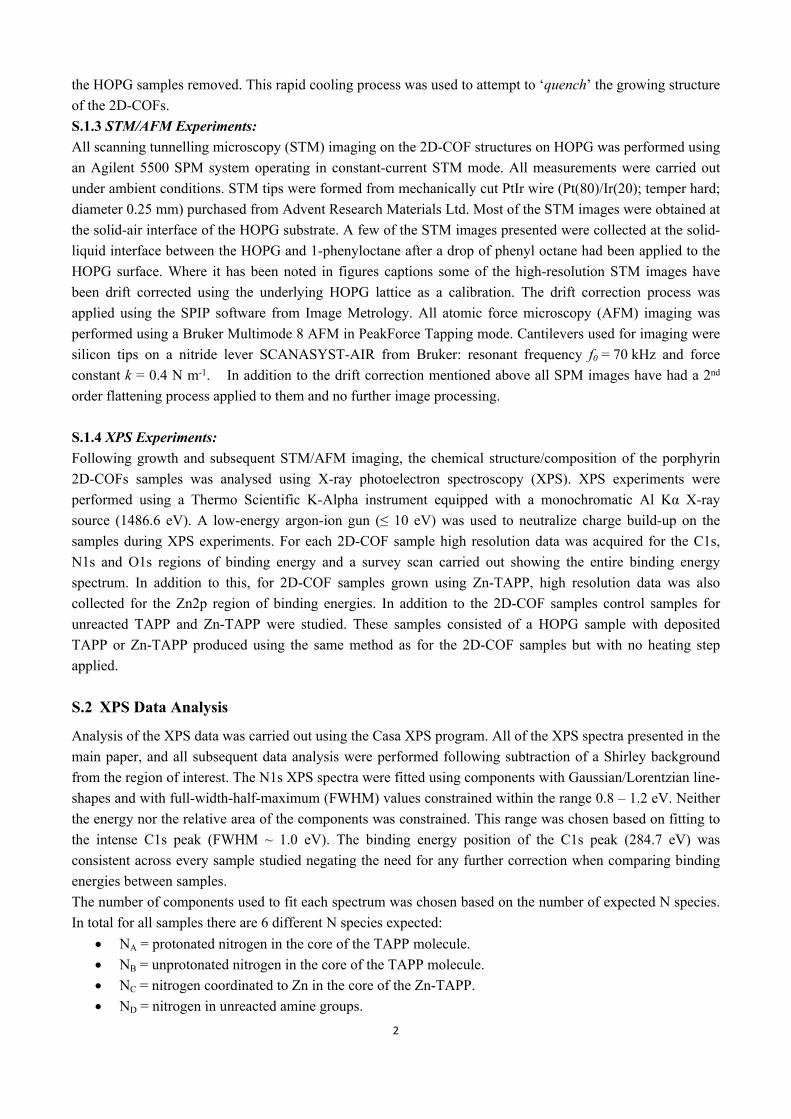
Table S2: Percentage contributions of the different nitrogen species (NC + NF, ND and NE) for samples containing Zn-TAPP molecules. The Zn-TAPP 2D-COF sample contain all 4 N species while the unreacted TAPP sample only contains the N coordinated to Zn within the porphyrin core (NC) and unreacted amines (ND). The nitrogen coordinated to Zn (NC) and the imine groups (NE) have almost identical binding energies and therefore their individual contributions to the XPS spectra cannot be separated.
The % for the unreacted TAPP and Zn-TAPP both show ~50% for the unreacted amine (ND) and ~50% for the N species within the porphyrin core, exactly as expected from the structure of these molecules as given in figure 1 of the main text. For the TAPP 2D-COF sample the % composition corresponding to the N species within the porphyrin cores remains largely unchanged. The % associated with the unreacted amine (ND) reduces from 47.2% to 18.6%. Correspondingly the components associated with the imine and hemiaminal groups (NE and NF) increased to 18.6% and 13.4 % respectively. This is as expected given that the amine groups react to form these two types of links between TAPP molecules. A similar trend is observed for the Zn-TAPP 2D-COF sample. The unreacted amine component (ND) reduces from 51.4% to 17.6% suggesting significant reaction of the amine groups. The component associated with hemiaminal links (NF) increases from 0% to 21.4%. The binding energy of the imine component is an almost perfect match to that for the nitrogen coordinated to the Zn within the Zn-TAPP core. We can estimate the % contribution of the imine component by assuming that the contribution of the nitrogen coordinated to the Zn (NC) remains unchanged following 2D-COF growth. This leads to a % contribution for the imine component of 12.4 %.
S.3 Additional STM / AFM Data
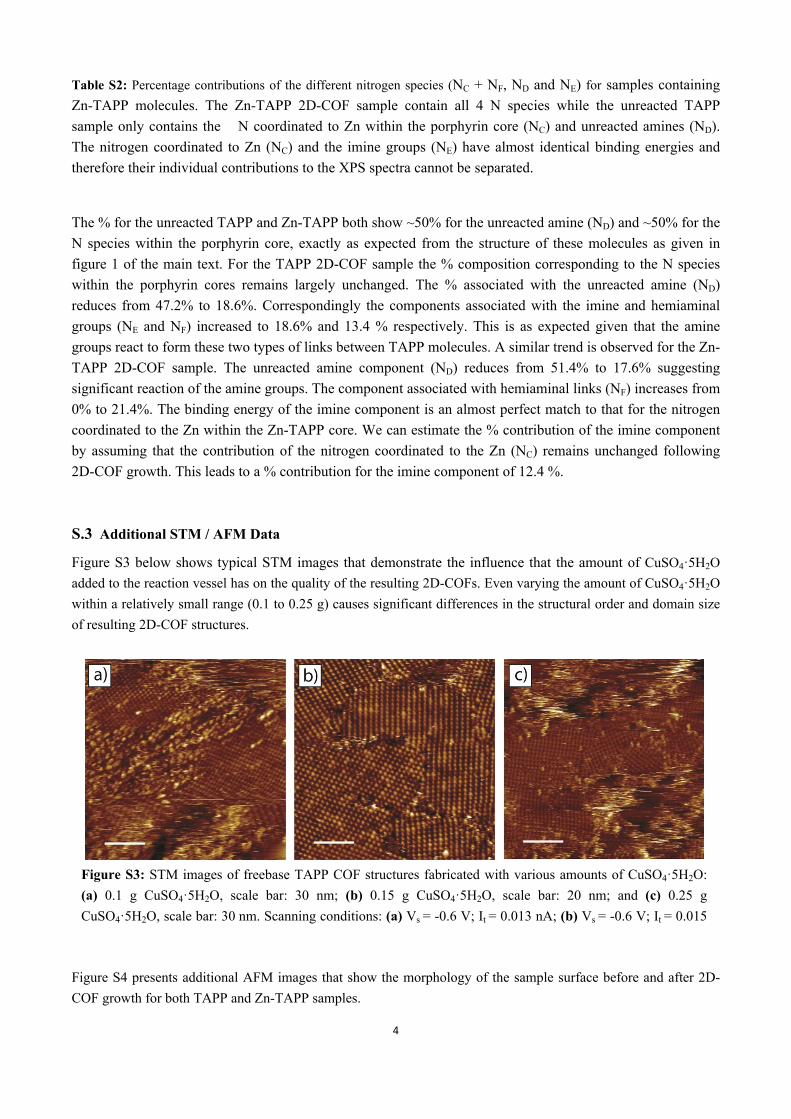
Figure S3 below shows typical STM images that demonstrate the influence that the amount of CuSO4·5H2O added to the reaction vessel has on the quality of the resulting 2D-COFs. Even varying the amount of CuSO4·5H2O within a relatively small range (0.1 to 0.25 g) causes significant differences in the structural order and domain size of resulting 2D-COF structures.
Figure S3: STM images of freebase TAPP COF structures fabricated with various amounts of CuSO4·5H2O: (a) 0.1 g CuSO4·5H2O, scale bar: 30 nm; (b) 0.15 g CuSO4·5H2O, scale bar: 20 nm; and (c) 0.25 g CuSO4·5H2O, scale bar: 30 nm. Scanning conditions: (a) Vs = -0.6 V; It = 0.013 nA; (b) Vs = -0.6 V; It = 0.015 nA; (c) Vs = -0.85 V; It = 0.01 nA.
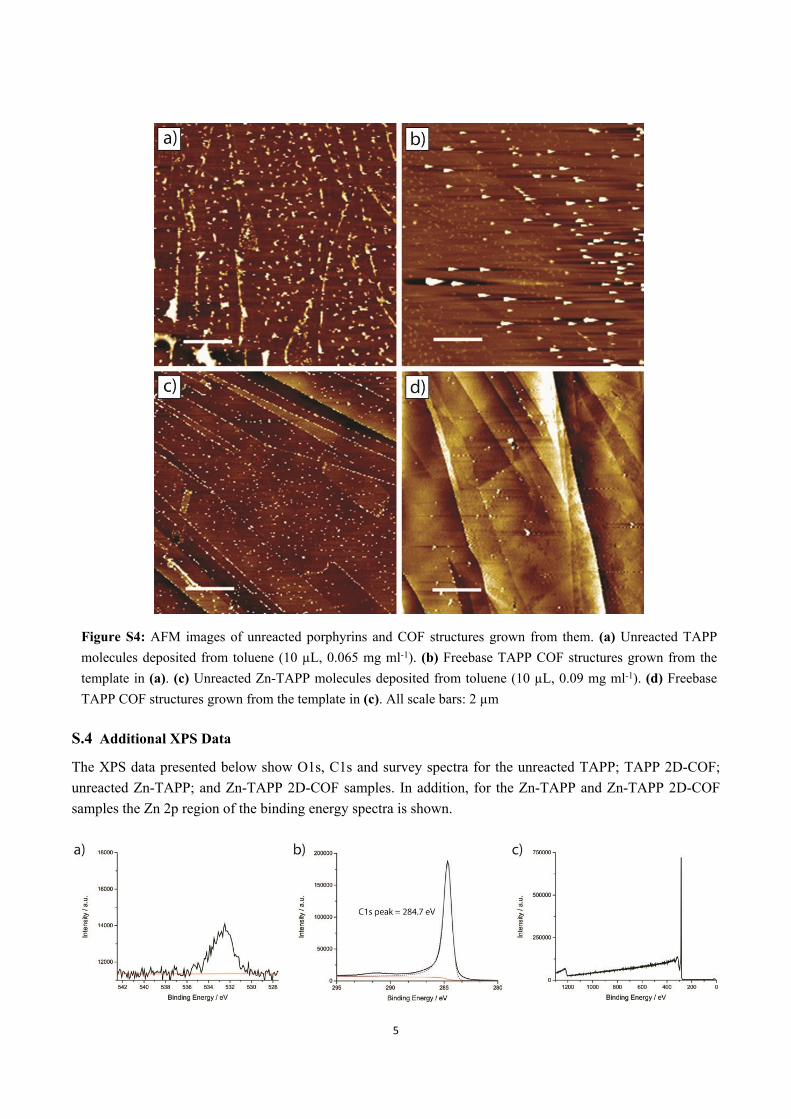
Figure S4 presents additional AFM images that show the morphology of the sample surface before and after 2D-COF growth for both TAPP and Zn-TAPP samples.
5
Figure S4: AFM images of unreacted porphyrins and COF structures grown from them. (a) Unreacted TAPP molecules deposited from toluene (10 µL, 0.065 mg ml-1). (b) Freebase TAPP COF structures grown from the template in (a). (c) Unreacted Zn-TAPP molecules deposited from toluene (10 µL, 0.09 mg ml-1). (d) Freebase TAPP COF structures grown from the template in (c). All scale bars: 2 µm
S.4 Additional XPS Data
The XPS data presented below show O1s, C1s and survey spectra for the unreacted TAPP; TAPP 2D-COF; unreacted Zn-TAPP; and Zn-TAPP 2D-COF samples. In addition, for the Zn-TAPP and Zn-TAPP 2D-COF samples the Zn 2p region of the binding energy spectra is shown.
6
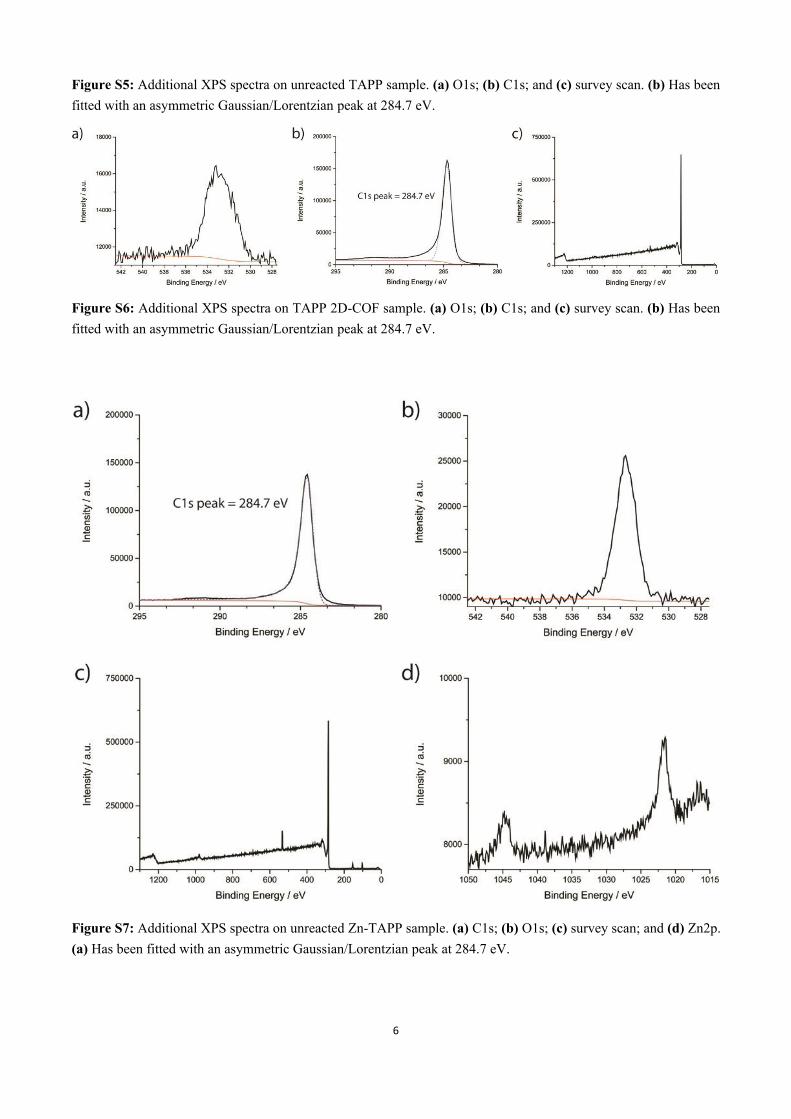
Figure S5: Additional XPS spectra on unreacted TAPP sample. (a) O1s; (b) C1s; and (c) survey scan. (b) Has been fitted with an asymmetric Gaussian/Lorentzian peak at 284.7 eV.
Figure S6: Additional XPS spectra on TAPP 2D-COF sample. (a) O1s; (b) C1s; and (c) survey scan. (b) Has been fitted with an asymmetric Gaussian/Lorentzian peak at 284.7 eV.
Figure S7: Additional XPS spectra on unreacted Zn-TAPP sample. (a) C1s; (b) O1s; (c) survey scan; and (d) Zn2p. (a) Has been fitted with an asymmetric Gaussian/Lorentzian peak at 284.7 eV.
7
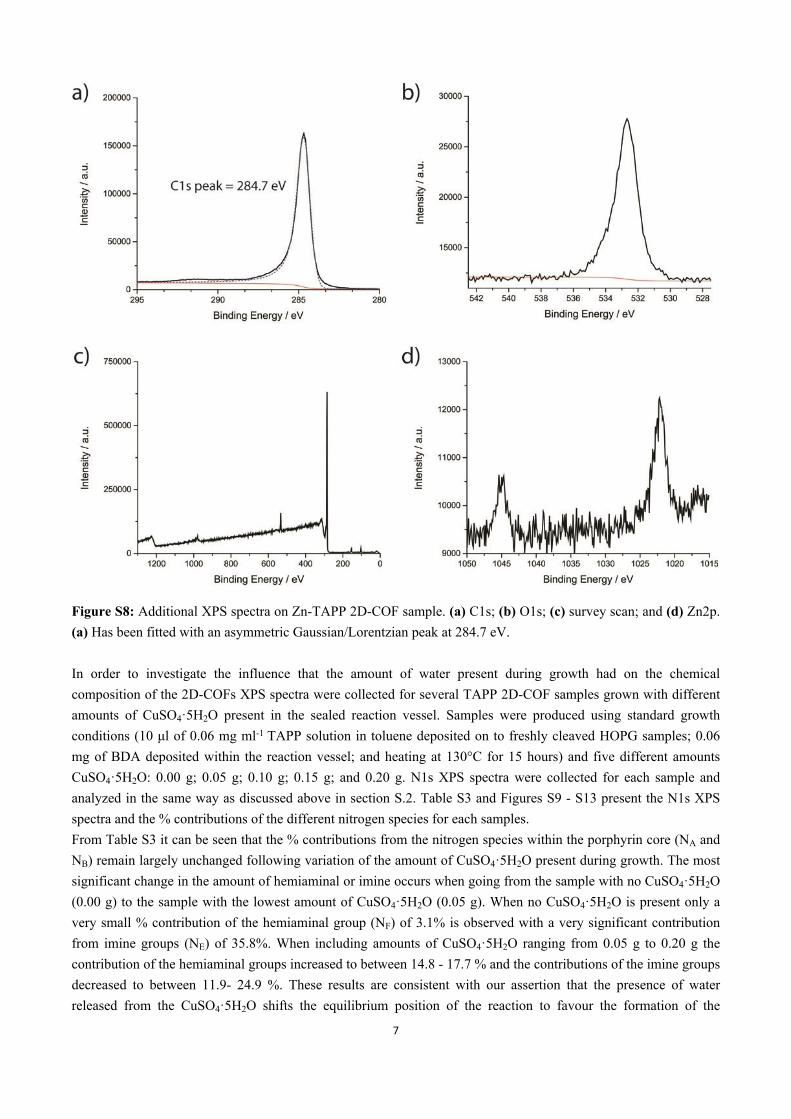
Figure S8: Additional XPS spectra on Zn-TAPP 2D-COF sample. (a) C1s; (b) O1s; (c) survey scan; and (d) Zn2p. (a) Has been fitted with an asymmetric Gaussian/Lorentzian peak at 284.7 eV.
In order to investigate the influence that the amount of water present during growth had on the chemical composition of the 2D-COFs XPS spectra were collected for several TAPP 2D-COF samples grown with different amounts of CuSO4·5H2O present in the sealed reaction vessel. Samples were produced using standard growth conditions (10 μl of 0.06 mg ml-1 TAPP solution in toluene deposited on to freshly cleaved HOPG samples; 0.06 mg of BDA deposited within the reaction vessel; and heating at 130°C for 15 hours) and five different amounts CuSO4·5H2O: 0.00 g; 0.05 g; 0.10 g; 0.15 g; and 0.20 g. N1s XPS spectra were collected for each sample and analyzed in the same way as discussed above in section S.2. Table S3 and Figures S9 - S13 present the N1s XPS spectra and the % contributions of the different nitrogen species for each samples.From Table S3 it can be seen that the % contributions from the nitrogen species within the porphyrin core (NA and NB) remain largely unchanged following variation of the amount of CuSO4·5H2O present during growth. The most significant change in the amount of hemiaminal or imine occurs when going from the sample with no CuSO4·5H2O (0.00 g) to the sample with the lowest amount of CuSO4·5H2O (0.05 g). When no CuSO4·5H2O is present only a very small % contribution of the hemiaminal group (NF) of 3.1% is observed with a very significant contribution from imine groups (NE) of 35.8%. When including amounts of CuSO4·5H2O ranging from 0.05 g to 0.20 g the contribution of the hemiaminal groups increased to between 14.8 - 17.7 % and the contributions of the imine groups decreased to between 11.9- 24.9 %. These results are consistent with our assertion that the presence of water released from the CuSO4·5H2O shifts the equilibrium position of the reaction to favour the formation of the
8
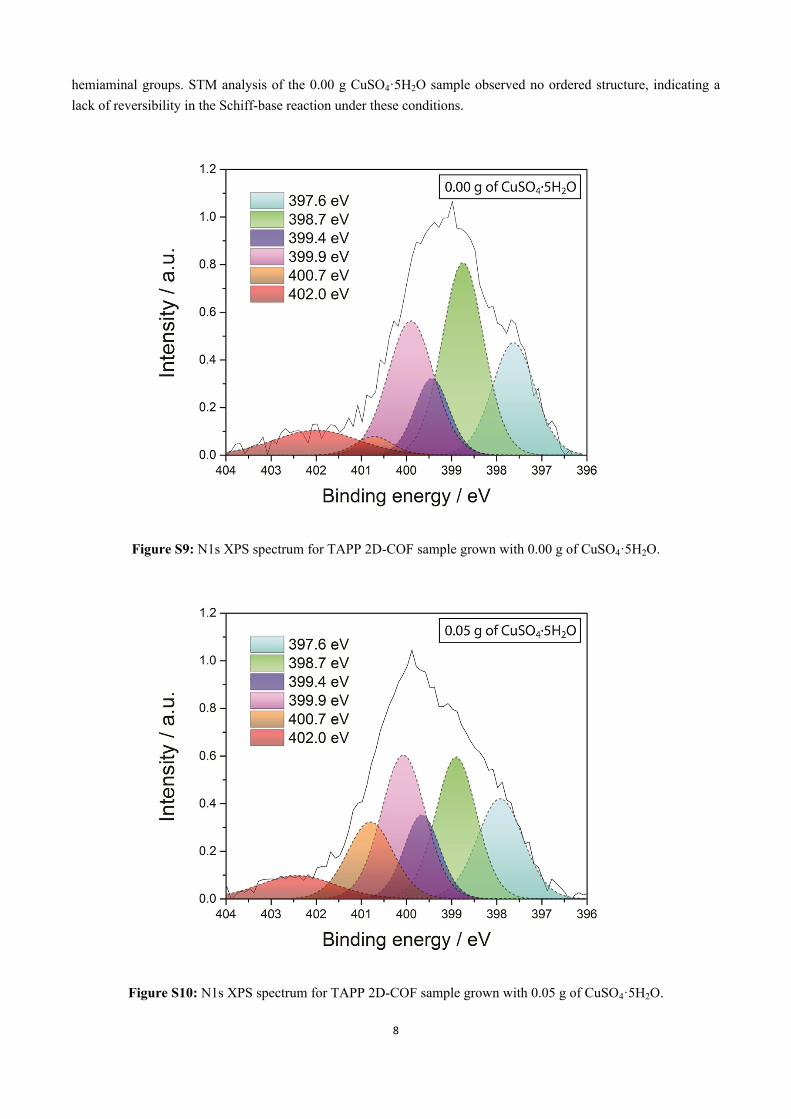
hemiaminal groups. STM analysis of the 0.00 g CuSO4·5H2O sample observed no ordered structure, indicating a lack of reversibility in the Schiff-base reaction under these conditions.
Figure S9: N1s XPS spectrum for TAPP 2D-COF sample grown with 0.00 g of CuSO4·5H2O.
Figure S10: N1s XPS spectrum for TAPP 2D-COF sample grown with 0.05 g of CuSO4·5H2O.
9
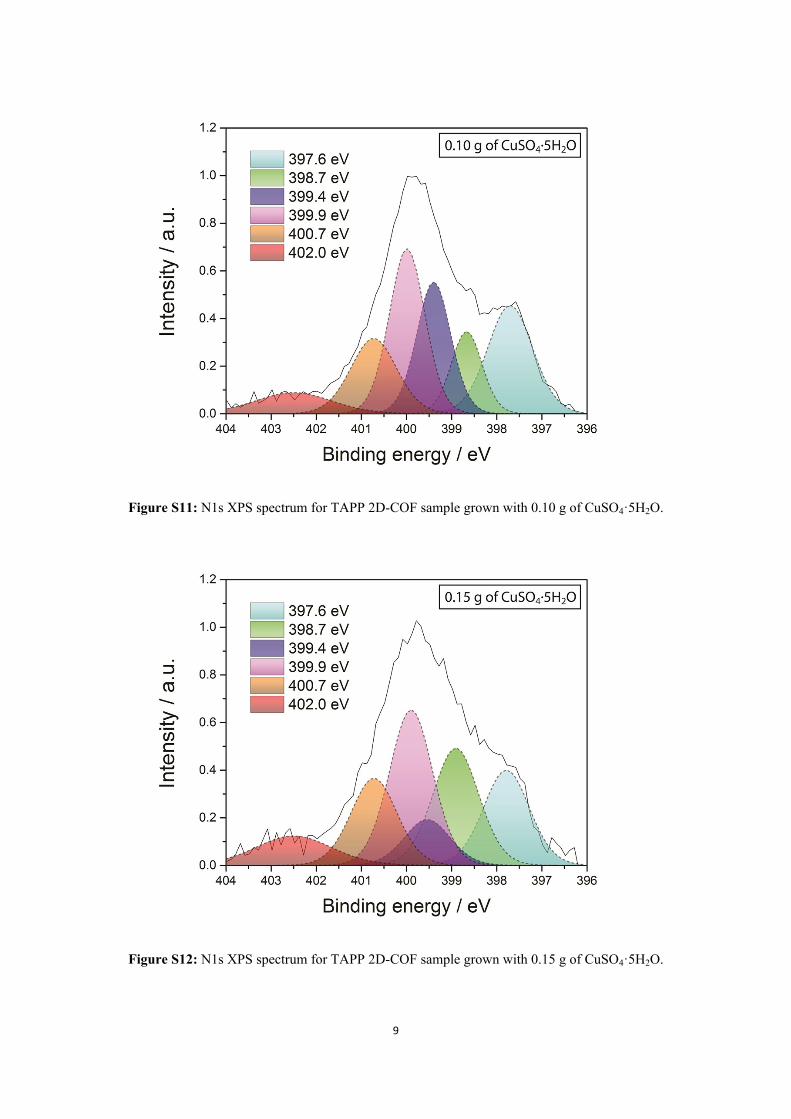
Figure S11: N1s XPS spectrum for TAPP 2D-COF sample grown with 0.10 g of CuSO4·5H2O.
Figure S12: N1s XPS spectrum for TAPP 2D-COF sample grown with 0.15 g of CuSO4·5H2O.

10
Figure S13: N1s XPS spectrum for TAPP 2D-COF sample grown with 0.20 g of CuSO4·5H2O.
Sample: (CuSO4·5H2O)
TAPP 2D-COF (0.00 g)
TAPP 2D-COF (0.05 g)
TAPP 2D-COF(0.10 g)
TAPP 2D-COF(0.15 g)
TAPP 2D-COF(0.20 g)
N speciesNA 21.5 % 19.8 % 23.0 % 19.4 % 21.7 %NB 27.7 % 27.2 % 27.6 % 29.8 % 27.4 %ND 11.9 % 13.0 % 21.2 % 9.4 % 15.3 %NE 35.8 % 24.9 % 11.9 % 23.8 % 20.8 %NF 3.1 % 15.2 % 16.3 % 17.7 % 14.8 %
Table S3: % contributions of the different nitrogen species (NA, NB, ND, NE and NF) for TAPP 2D-COF samples grown with different amounts of CuSO4·5H2O present inside the reaction vessel. The area of the satellite peak (red) has been removed from the total fitted area prior to calculating the % contributions of the different nitrogen species.
S.5 References:
[S1] M. Yuasa , K. Oyaizu , A. Yamaguchi ,and M. Kuwakado. J. Am. Chem. Soc., 2004, 126, 11128–11129.[S2] V. N. Nemykin, P. Galloni, B. Floris, C. D. Barrett, R. G. Hadt, R. I. Subbotin, A. G. Marrani, R. Zanoni
and N. M. Loim. Dalton Trans., 2008, 4233-4246.