PROBABLE FATIGUE LIFE OF PRESTRESSED CONCRETE BEAMSdigital.lib.lehigh.edu/fritz/pdf/223_24C1.pdf ·...
39
,! PROBABLE FATIGUE LIFE OF PRESTRESSED CONCRETE BEAMS PART I: BEAM TESTS by .. , I , R. F. Warner C. L. Hu1sbos Part of an Investigation Sponsored by: Pennsylvania Department of Highways U. S. Department of Connnerce Bureau of Public Roads Reinforced Concrete Research Council Fritz Engineering Laboratory Department of Civil Engineering Lehigh University Bethlehem, Pennsylvania June, 1964 Fritz Engineering Laboratory Report No. 223.24C1
Transcript of PROBABLE FATIGUE LIFE OF PRESTRESSED CONCRETE BEAMSdigital.lib.lehigh.edu/fritz/pdf/223_24C1.pdf ·...

,!
PROBABLE FATIGUE LIFE
OF
PRESTRESSED CONCRETE BEAMS
PART I: BEAM TESTS
by
..,I,
R. F. Warner
C. L. Hu1sbos
Part of an Investigation Sponsored by:
Pennsylvania Department of HighwaysU. S. Department of Connnerce
Bureau of Public RoadsReinforced Concrete Research Council
Fritz Engineering LaboratoryDepartment of Civil Engineering
Lehigh UniversityBethlehem, Pennsylvania
June, 1964
Fritz Engineering Laboratory Report No. 223.24C1

,I
PROBABLE FATIGUE LIFE
OF
PRESTRESSED CONCRETE BEAMS
PART I:
by
BEAM TESTS
R. :F. WarnerC. L. Hulsbos
SYNOPSIS
An investigation was conducted into the fatigue life of pre-
tensioned prestressed concrete flexural members failing by fatigue of
the prestressing steel. The work consisted of a series of static and
fatigue tests on prestressed concrete beams, an experimental study of
the fatigue properties of 7/l6-inch diameter seven-wire prestressing
strand, and a theoretical analysis of the stresses and deformations in
prestressed concrete members subjected to repeated flexural loadings.
The results of the study of the strand fatigue properties, together
with the theoretical analysis, provide a method for estimating probable
-1-
...' ~ ,

..
'.
-2-
fatigue life of beams subjected to repeated loadings of either constant
or varied magnitude.
The investigation will be described in four pa·rts. In this
first part, static and fatigue tests on eight prestressed concrete beams
of rectangular section are reported. The prime purposes of these tests
were to provide detailed information on the behavior of flexural members
under repeated loadings and to obtain test data to check the accuracy ofI
the method presented in succeeding parts for estimating beam fatigue life.
<l
INTRODUCTION
When prestressed concrete was introduced as a new method of
construction, the possibility of its having poor fatigue properties
was a matter of concern to many engineers. A number of beam fatigue
tests were therefore conducted in Europe(1,2,3) and later in the United
States(4,5). Although these initial investigations were little more
than acceptance tests, they indicated that fatigue failure would not
be a practical problem provided that the repeated loadings do not
cause cracking of the concrete. Since this condition was realized in
the designs at that time, intere.t in fatigue failure declined and sub-
sequent work has not been sufficiently extensive to provide answers to
the many questions concerning the effects of fatigue loading •
Unfortunately, the lack of information on the fatigue resist-
ance of prestressed concrete members has made necessary the retention

-3-
in design specifications of the stipulation of no cracking under load.
This in turn places restrictions on possible improvements ~nd refine
ments to design· procedures. At present, for ·example, the economic use
of partial prestressing techniques is often impossible because of code
limitations on allowable bottom fiber concrete stresses.
Before current code requirements can be changed, additional
information must be obtained on the behavior of prestressed concrete
under fatigue loading. Knowledge of fatigue failure - which until
recently was almost completely contained in the negative statement
that fatigue failure will not occur if the loads do not cause crack
ing - must obviously be broadened to allow quantitative estimates to
be made of fatigue life and safety under general loading conditions.
The possibi~;ritodes of failure in fatigue of prestressed con
crete flexural members are comparable in some ways to the corresponding
modes of failure under static loading. Thus, beams may be described as
"under-reinforced", "over-reinforced", or "balanced", depending upon
whether the primary failure takes place in the steel, in the concrete,
or in the two materials more or less simultaneously. It should be
noted that an under-reinforced beam with respect to fatigue failure. is
not necessarily under-reinforced from the point of view of static ulti
mate strength.
In certain circumstances it may be possible also for a pro
gressive bond failure to occur along the length of the beam as a result
of fatigue loading. Bond-fatigue failure, like bond failure under static
loading, will occur only in regions where relatively steep moment gra-

-4-
dients exist; it is therefore unlikely in flexural. members in which the
moment-to-shear ratio is large-,- and is more conveniently treated in
association with a study of shear failure. In dealing with the basic
modes of fatigue failure in flexure, attention may therefore be re~
stricted to fatigue in the tension steel and in the concrete compression
region.
In 1958, a bibliography and review of research on concrete
fatigue was published(6) which indicates that earlier studies of fatigue
failure in prestressed concrete beams have consisted, in the main, of
small experimental programs of beam fatigue tests. Because of the iso-
lated nature of this work, the conclusions have often been limited to
the performance of a particular type of beam under a particular condi-
tion of loading.
Probably the most significant conclusion which can be drawn~
from previous experimental work is that if a fatigue failure occurs in
a beam of normal design it is likely to be due'to a fatigue fai.lure of
the prestressing strand. A shear fatigue failure is the next most com-
mon type of failure reported in the literature.
Previous research into fatigue failure of prestressed concrete
beams has been restricted to the rather idealized situation of constant".
cycle repeated loadings. In practice, it is far more usual for succes-
sive loadings to differ in magnitude. Consequently, a typical load
history consists of a number of different loads each with a different
frequency of occurrence. Studies of the fatigue properties of pre-
stressed concrete members under varied loading patterns have not pre-

-5-
viously been made, and important practical questions concerning the
effect on .fa-tigue life ofa re-latively small .number of high overloads
regularly mixed with the design loadings have not been answered.
An investigation of the fatigue life of prestressed concrete
beams failing by fatigue of the prestressing steel is described in this
and three succeeding papers. From an experimental study of the fatigue
properties of prestressing strand and a theoretical analysis of the
stresses and deformations in a concrete flexural member under repeated
loadings, a method is developed for estimating the fatigue life of
beams subjected to either constant-cycle or varied repeated loadings.
In addition, results are given of static and fatigue tests conducted on
eight prestressed concrete beams of rectangular section. The prime pur
pose of the beam tests was to obtain experimental data to check the
accuracy of the method developed for predicting beam fatigue life. The
beam tests are described in this part of this four part paper.
Two beams were tested to failure statically, three were tested
in fatigue under constant cycle loading, and three were tested in fatigue
with varied repeated loading. Beam fatigue test data from previous in
vestigations provide very little quantitative information on behavior
under repeated loadings and so in this investigation particular atten
tion was given to measurements of beam deflections and concrete deforma
tions. Fatigue loading was in all cases continued beyond the first wire
failures to determine also the post-fai~ure behavior of thebeams~
b
d
f'c
Fse
h
p
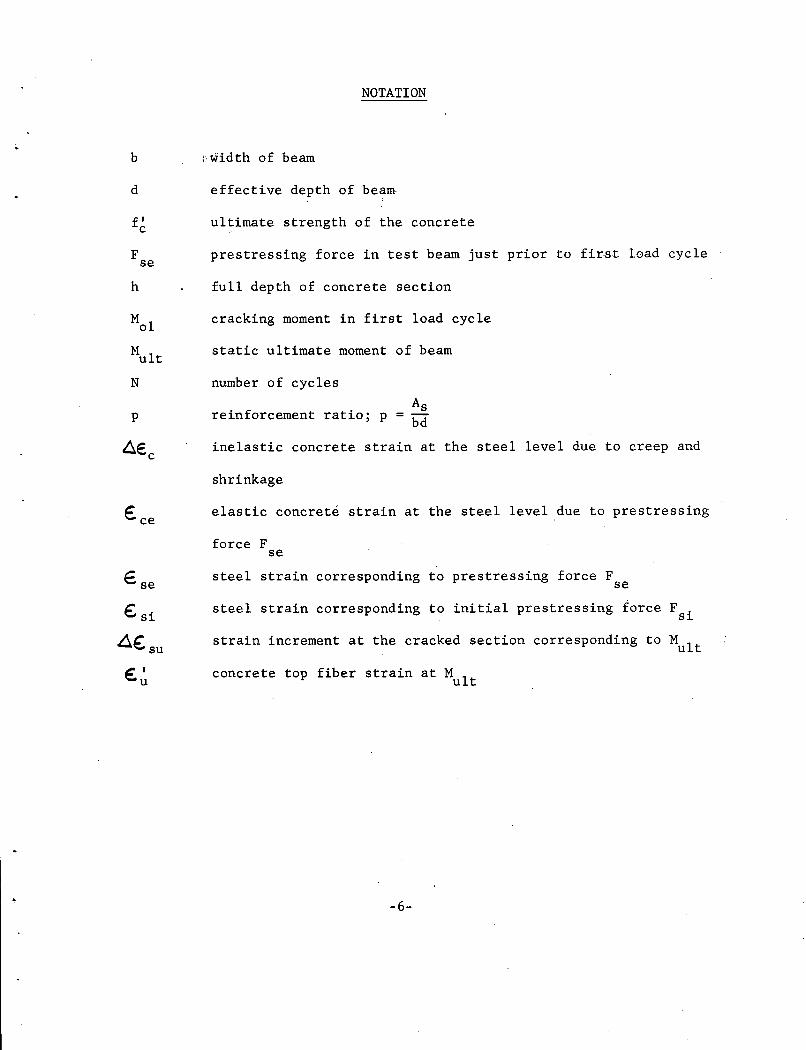
NOTATION
i·width of beam
effective depth of beam
ultimate strength of the concrete
prestressing force in test beam just prior to first load cycle
full depth of concrete section
cracking moment in first load cycle
static ultimate moment of beam
number of cycles
Asreinforcement ratio; p = bd
inelastic concrete strain at the steel level due to creep and
shrinkage
~ elastic concrete strain at the steel level .due to prestressing~ce
force Fse
steel strain corresponding to prestressing force Fse
steel strain corresponding to initial prestressing force F .s~
strain increment at the cracked section corresponding to Mult
concrete top fiber strain at M 1u t
-6-

TEST SPECIMENS
The eight test beanls were all twelve feet long, with a rec-
tangu1ar cross section approximately six inches wide and twelve inches
deep. The longitudinal reinforcement consisted of three 7/16-inch dia-
meter prestressing strands placed at the depth of eight inches below the
top surface of the beam. In the first four beams manufactured, the nomi-
na1 effective prestressing force in the strand was 60 percent of its
static strength; in the other four beams the nominal value was 40 per-
cent. The specimens were thus divided into two groups of four: F1
through F4, and F5 through F8. Apart from static tests to failure on one
specimen from each group, the beams in the first group were used for the
constant cycle fatigue tests, those in the second for the cumulative'
damage tests.
Full details of the specimens are contained in Fig. 1 and
Table 1. Actual dimensions of the beams given in Table 1 vary slightly
from the nominal values. The effective prestressing forces, shown as
F in Table 1, also differ somewhat from the nominal values because ofse
variability of creep and shrinkage effects in the concrete. Strains in
the steel due to initial and effective prestressing forces, ~ and € ,I::osi se, '.
are shown in Table 1 together with elastic and creep strains in the con-
crete at the steel level, e and t1E. Since it was impossible to testce c
all the beams at the same time, the effect of variations in age was mini-
m:i:zed by commencing the tests approximately 150 days after manufacture of
the specimens. Actual ages at time of commencement of test are shown in
Table 4.
-7-

-8-
Six two-leg stirrups of 3/4-inch intermediate grade reinforc
ing bar were placed in the end regions of each beam at six inch spacings,
as shown in Fig. 1.
Materials
The concrete used in the beams was made from 3/4-inch maximum
size crushed limestone, Lehigh river sand, and type III, high early
strength Portland Cement. Sieve analyses of the aggregates are shown as
grading curves in Fig. 2. The fineness modulus of the sand was 2.65.
The specific gravities of sand and coarse aggregate were 2.65 and 2.69,
respectively.
The same 'nominal concrete mix was used throughout, although
slight changes were made in the water content of different mixes to ad
just for variations in the moisture content of the sand. An attempt
was made to keep the slump at approximately two inches. The concrete was
mixed in six cubic foot batches in a horizontal drum, positive action
mixer for three minutes and then transported in buggies to the prestress
ing bed. Five batches of concrete were used in the manufacture of each
group of four beams.
In Table 2, details are given of the mix quantities and the
regions in the test beams were the different batches were used. In
order to obtain greater uniformity, concrete from only one batch was
placed in the test 'region of each beam. Results of static tests con
ducted at the time of the beam tests on three cylinders from each batch
are also contained in Table 2.
-9-
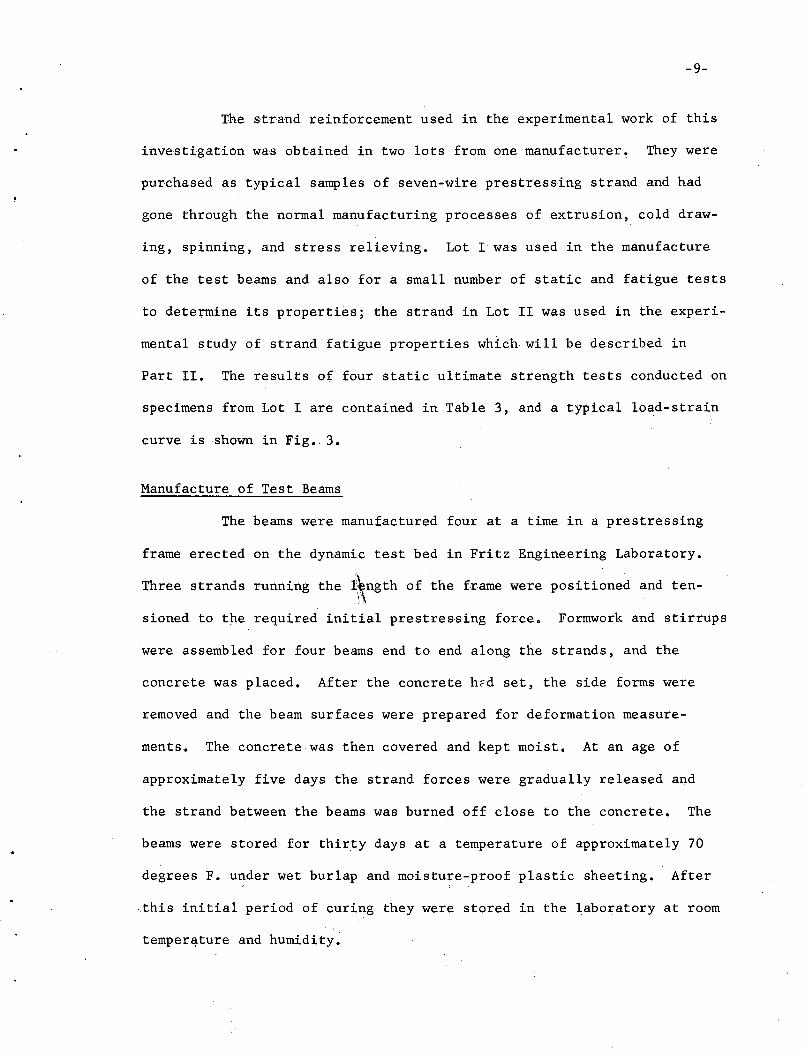
The strand reinforcement used in the experimental work of this
investigation was obtained in two lots from one manufacturer. They were
purchased as typical samples of seven-wire prestressing strand and had
gone through the normal manufacturing processes of extrusion, cold draw-
ing, spinning, and stress relieving. Lot I was used in the manufacture
of the test beams and also for a small number of static and fatigue tests
to determine its properties; the strand in Lot II was used in the experi-
mental study of strand fatigue properties which will be described in
Part II. The results of four static ultimate strength tests conducted on
specimens from Lot I are contained in Table 3, and a typical load-strain
curve is shown in Fig •. 3.
Manufacture of Test Beams
The beams were manufactured four at a time in a prestressing
frame erected on the dynamic test bed in Fritz Engineering Laboratory.
Three strands running the t\ngth of the frame were positioned and ten'~'\
sioned to the required initial prestressing force. Formwork and stirrups
were assembled for four beams end to end along the strands, and the
concrete was placed. After the concrete he'd set, the side forms were
removed and the beam surfaces were prepared for deformation measure-
ments. The concrete was then covered and kept moist. At an age of
approximately five days the strand forces were gradually released and
the strand between the beams was burned off close to the concrete. The
beams were stored for thirty days at a temperature of approximately 70
degrees F. under wet burlap and moisture-proof plastic sheeting. After
.this initial period of curing they were stored in the laboratory at room
temper~ture and humidity.

-10-
Measurement of Prestressing Force and Losses
During the prestressing operations the force in each strand
was measured with dynamometers placed at both ends of the strands.
A ten inch gage length Whittemore deformeter was used to mea
sure elastic, creep, and shrinkage strains on the sides of the beams.
When the concrete had hardened, grids of small aluminum t~rgets were
cemented to both sides of the beams in the test region in the pattern
shown in Fig. 4. The beams lay in an east-west direction during cast
ing and testing and the regions covering the gage lengths for deforma
tion measurements were labelled Rl to R6 as shown in Fig. 4. Grid points
were placed at the steel level on the north and south sides of the beam
in the six regions. Additional grip points were placed in Regions R3
and ~4 at six different levels, as shown in Fig. 4, so that the vertical
distribution of strain could also be measured. Elastic and inelastic
strains in the concrete, obtained from deformeter readings made before
and after release and during the curing process, were used to determine
the elastic and inelastic concrete prestress losses. The same grid of
points was used for deformation measurements during testing of the beams.
TEST PROCEDURE
All static and fatigue tests were conducted in the loading
frame shown in Fig. 5. The beams were supported on a ten foot span with
a pin support at one end and a rocker at the other. Two equal loads were

-11-
applied symmetrically to the beams through steel distributor plates four
inches wide and three-quarters of an inch thick which were grouted to the
top surface of the concrete at sections three fe~t from each support. Two
twenty-two kip capacity Amsler jacks with sphericaliseatings at each end
were used to apply both the static and dynamic loadings.
Static ultimate strength tests were conducted on beams F3 and
F6; beams Fl, F2, and F4 were tested in fatigue with constant cycles of
loading; beams F5, F7 and F8 were tested in fatigue with a varied pattern
of loading.
Static Ultimate Strength Tests
For the static tests to failure, a pendulum dynamometer was
connected to the loading jacks to deliver pressure and also to measure
load.
Loads were applied to the beams in two kip increments. Concrete
. deformations were measured on the grid shown in Fig. 4 at each load incre
ment; deflections were measured at the load points and at the centerline
. with Ames dial gages in contact with the lower surface of the test beam.
As the loading became high, considerable creep occurred, and in order to
obtain relatively steady readings a period of time was allowed to ellapse
between the application of a load increment and the measurement of de
formations and deflections. The loading. was increased until failure took
place.
Constant Cycle Fatigue Tests
Anfrnsler pulsator was used to apply varying pressure to the
jacks during the beam fatigue tests. All constant cycle loading was

-12-
applied at 250 cycles per minute.
Prior to the commencement of each fatigue test, two static
tests were conducted on the beam to loads slightly higher than the maxi·
mum value to be used in the repeated load cycle. Fatigue loading was
also interrupted at regular intervals in order to make additional static
tests. Deformation and deflection measurements made during the static
load tests indicated accurately the changes in the response of the beam
which had occurred in the previous sequence of fatigue loading. Crack
development was recorded in each static test during an inspection of
the beam while under maximum load. The fatigue loading was continued,
with interruptions only for static tests, until failure.
Ames dial gages were used to measure deflections during both
the st~tic and fatigue loading. When not in use the gages were taped
down out of contact with the moving test beam. Extreme deflections
under dynamic load were obtained by untaping the gage, holding the
plunger, and allowing it to extend slowly upwards until it made con-
tact with the lower surface of the test beam in its position of maximum
deflecti\or·';:\,
In order to preserve the centering of the jacks on the dis-
tributor plates and the beam on its supports, a minimum load of 4.5 kips
per jack was always maintained on the beam. An attempt was made to
obtain the ,same load cycle in all three constant cycle tests so that
three replications would be obtained of the one fatigue test. A com-
parison of dynamic deflection readings with the load deflection curves
obtained during the static tests provided an accurate measure of the
-13-
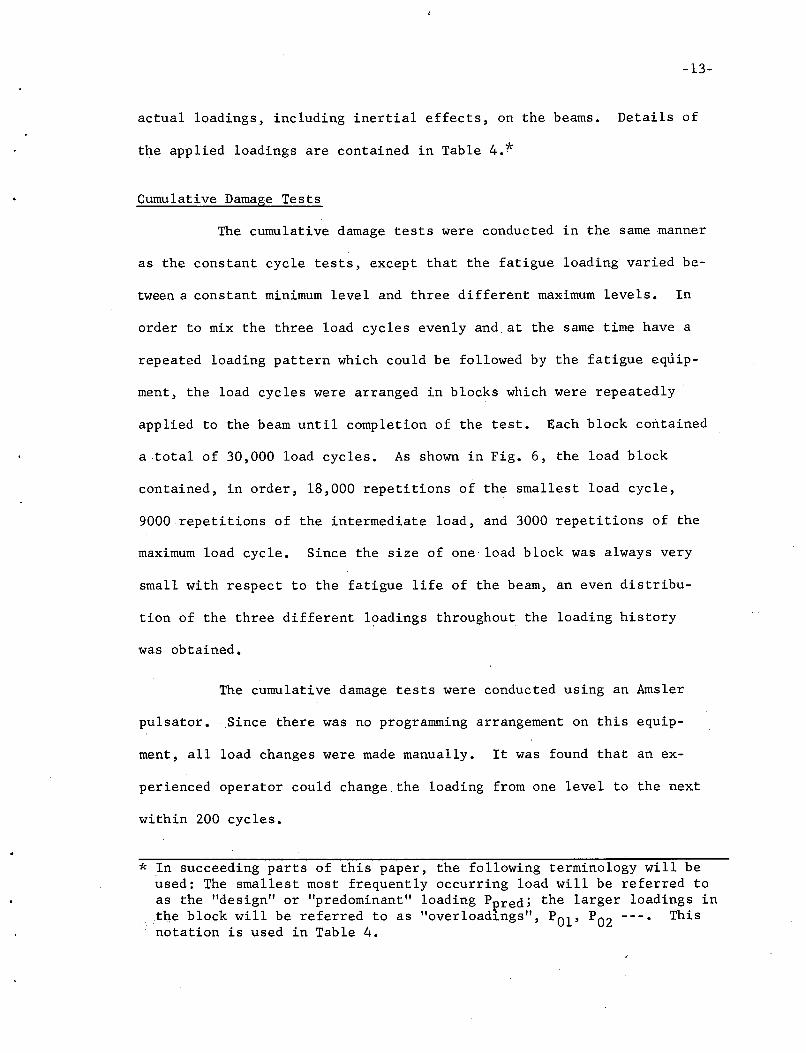
actual loadings, including inertial effects, on the beams. Details of
the applied loadings are contained in Table 4.*
Cumulative Damage Tests
The cumulative damage tests were conducted in the same manner
as the constant cycle tests, except that the fatigue loading varied be-
tween a constant minimum level and three different maximum levels. In
order to mix the three load cycles evenly and at the same time have a
repeated loading pattern which could be followed by the fatigue equip-
ment, the load cycles were arranged in blocks which were repeatedly
applied to the beam until completion of the test. Each block contained
a total of 30,000 load cycles. As shown in Fig. 6, the load block
contained, in order, 18,000 repetitions of the smallest load cycle,
9000 repetitions of the intermediate load, and 3000 repetitions of the
maximum load cycle. Since the size of one load block was always very
small with respect to the fatigue life of the beam, an even distribu-
tion of the three different loadings throughout the loading history
was obtained.
The cumulative damage tests were conducted using an Amsler
pulsator. .Since there was no programming arrangement on this equip-
ment, all load changes were made manually. It was found that an ex-
perienced operator could change the loading from one level to the next
within 200 cycles.
* In succeeding parts of this paper, the following terminology will beused: The smallest most frequently occurring load will be referred toas the "design" or "predominant" loading Ppred; the larger loadings in
.. th.e block will be referred to as "over1oadings", POl' P02 ---. Thisnotation is used in Table 4.

-14-
Static tests to loads slightly higher than the maximum load
cycle were conducted prior to, and interspersed through, the fatigue
loading in the manner described for the constant cycle tests. A mini
mum loading of 3.8 kips per jack was maintained on the beams to pre
serve centering. The fatigue loadin~was applied to beams F7 and F8
at the rate of 250 cycles per minute, to beam F5 at 500 cycles per
minute. Apart from the regular static tests, rest period of from four
to six hours were introduced in each 24, hour period.
A comparison of dynamic readings with static load-deflection
curves again provided an accurate measure· of the loadings actually
applied 'to the beams. An attempt was also made in these tests to
obtain the same loadings on all three beams, but the initial theoreti
cal estimate of the inertial loading effect for beam F5, tested at 500
cycles per minute, proved to be slightly inaccurate. The maximum load
cycle applied to F5 was for this reason approximately 0.2 kips smaller
than that used in F7 and F8. Values of the actual loadings are given
in Table 4.
BEAMTRsT RESULTS
Static Tests to Failure
Beams F3 and F6, which were tested statically, failed in a
manner typical of under-reinforced beams by yielding of the steel and
then crushing of the concrete in the compression fibers. Cracking mo-

-15-
ments Mol and ultimate moments Mu1t are given in Table 1.
The centerline deflections of the two beams are plotted. against
load in Fig. 7. In the higher load range, F6, which had the lower pre
stressing force, deflected considerably more than F3, although its ulti
mate load is actually slightly higher.
The crack patterns for the beams are shown in Figs. 8 and 9.
Cracks were restricted almost entirely to the pure moment region. How
ever, one inclined crack formed in the east shear span of each beam, but
never at any time did shear failure appear likely. A strong tendency
was observed in these tests, and also in the initial static tests con
ducted on the fatigue specimens, for the flexural cracks to follow a
more or less vertical path to the level of the steel reinforcement, then
to branch into two opposing inclined cracks. The tendency is clearly
seen in the recorded crack patterns.
The observed crack development on the north and south sides
were quite similar and concrete deformations at corresponding gage
lengths on either side of the beams were nearly equal. Average top
. fiber concrete. strains, extrapolated from the deformation readings
in the Regions R3 and R4 are shown in Fig. 10. Maximum and minimum
values of concrete deformations at the steel level were recorded in
Regions R5 and R6 in beam F3, and in the Regions R3 and R1 in beam F6;
they are plotted against load in Fig. 11. Since at least one crack
had formed within every gage length in each beam tested statically,
measured concrete deformations were distributed approximately linearly
with respect to depth.

-16-
Beam Behavior under Fatigue Loading
Beam behavior under fatigue loading followed a common pattern
in all six fatigue tests and will be described in terms of deflections,
deformations., and cracking patterns. Beams' F2 and F7 have been chosen
as typical, and detailed data for only these beams are presented in this
paper •. Similar test data for the other beams are available in Reference 7.
Deflections increased quite considerably under fatigue loading,
particularly in the early load cycles. Deflections observed during the
periodic static tests on beams F2 and F7 are shown, together with dynamic
deflections, in Figs. 12 and 13. In the figures, triangles are used to
represent test points for the first static load cycle so that they will
not be confused with test points for the second load cycle. Dynamic de
flections are shown by dashed lines. The three dashed lines shown in
Fig •. 13 correspond to the three different maximum load levels used in
the cumulative damage tests. In the constant cycle tests, where the
fatigue loading was more severe, deflections continued to increase,
though at a decreasing rate, until the failure of the first wire. In
the cumulative damage tests there was a tendency for the deflections to
settle down to steady values. During the test of beam F8 deflections
actually began to decrease slightly after 600,000 cycles of loading.
Concrete deformations measured on the sides of the beams were
greatly influenced by the presence or absence of flexural cracks. When
there were no cracks in a particular gage section, tensile deformations
tended to be very small, and were little influenced by fatigue loading.
In beam F7, for example, cracks did not form in Region R3 and at a load

-17-
of 10.5 kips the deformations at the steel level in this gage length were
one-tenth of those in otherregions,as is shown in Fig. 14. Also in
beam F2, absence.of cracks in Region R5 resulted in relatively low de
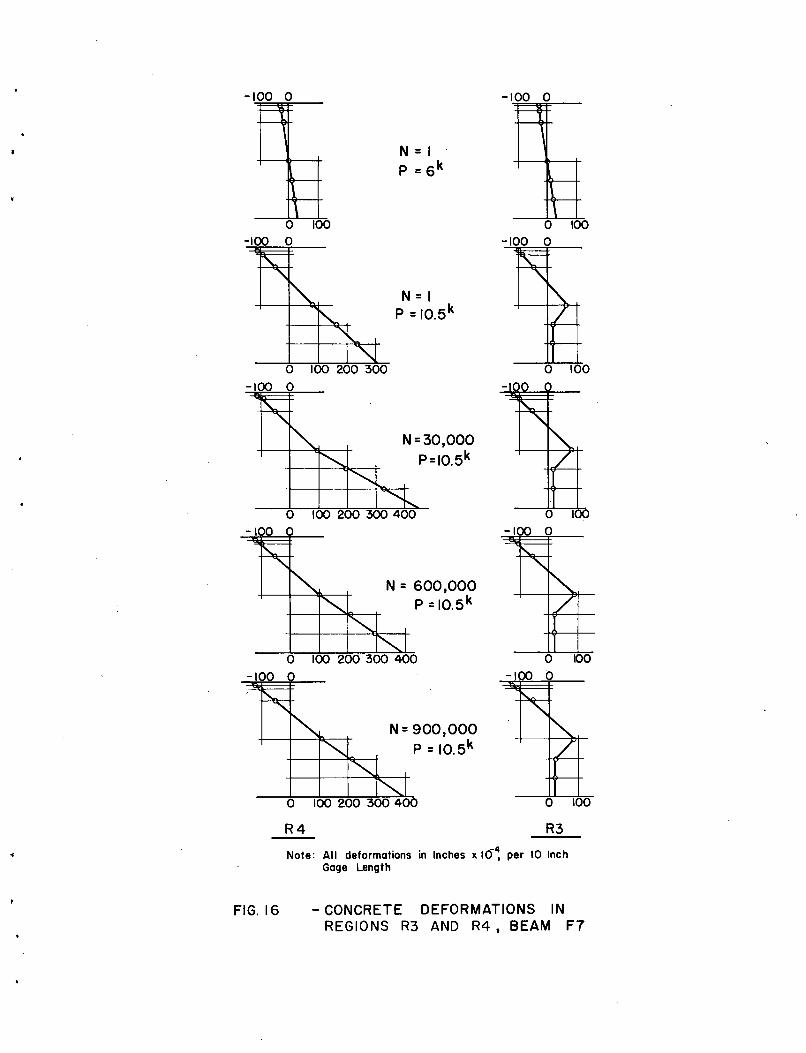
formations, as shown in Fig. 15. In Fig. 16 the distributions of con
crete deformations in beam F7 for the Regions R3 and R4 are plotted.
Whereas the distribution is approximately linear for the section con
taining a flexural crack, there is a sharp discontinuity in the distri
bution below the neutral axis in Region R3 because of the absence of
cracks in this section and the presence of cracks in adjacent sections.
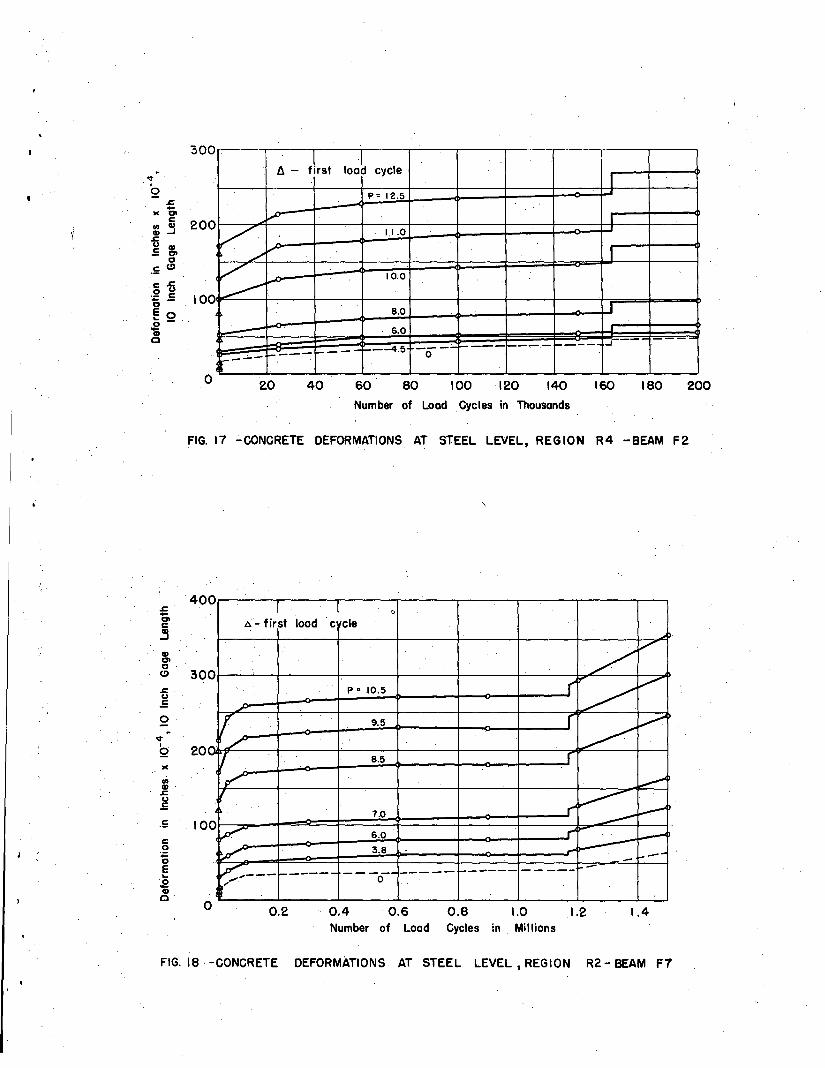
Concrete deformations at the steel level in the failure region at various
stages of fatigue loading are shown in Figs. 17 and 18. Values for
zero load have been obtained by extrapolation a~d are plotted as dashed
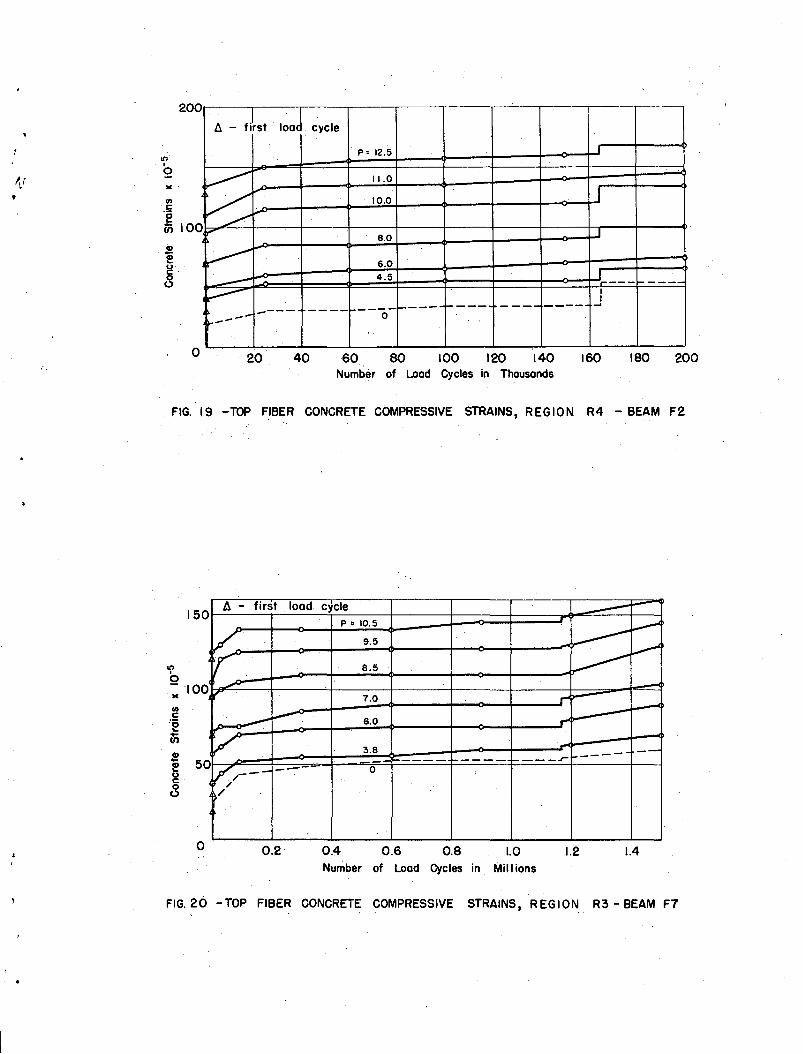
lines •. Average top fiber concrete compressive strains, measured in the
failure region, are shown in Figs. 19 and 20•. Again, values for zero
load have also been obtained by extrapolation and are plotted as dashed
lines.
The patterns·of cracking which formed during the initial static
tests were similar to those observed in the static ultimate tests. Al
though some extension of the existing cracks took place, particularly in
the early load cycl~s, no new cracks formed in any of the beams as a
result of repeated 'loadings. Most of the crack extension had taken
place when approximately thirty thousand cycles of loading had been
applied. Subsequent development was almost nil until after some wires
had snapped. The cracking patterns for all beams are shown in Figs.
8 and 9.

o
-18-
It is thus seen that after a short initial period in which
deflections, deformations, and crack heights increased considerably,
the beams settled down to give a fairly consistent and constant res
ponse to load. This was particularly so for beams F5, 7, and 8, on
which the fatigue loading was less severe. No prior indication was
given in any of the beams of the imminence of wire fatigue failure.
The fracture of one of the wires of the seven-wire strand in
the beam could always be detected by a distinctive sound, together with
a small but sudden increase in maximum deflection and a slight fall-off
in load. The region containing the wire failure was determined from
the deformation readings taken in the next static test. After sudden
increases in deflection and deformations which accompanied the initial
wire failure, the beams again settled down with a consistent response
to loading, but with slightly decreased rigidity. A considerable number
of cycles often separated the first and second wire failures, but the
interval separating successive failures tended to decrease as the number
of failed wires increased. Thus the post-failure behavior of the beams
consisted of an increasing rate of change in deflections, increased perma
nent set, and decreasing rigidity. When the wires began to fail in the
beams the cracking patterns again began to extend. A tendency was noted
for those cracks which had already become inclined during the initial
static loading to take almost horizontal paths and link together to form
a continuous pattern running through a con§iderable portion of the test
section at a level a little below the neutral axis. This tendency was
particularly pronounced in beam Fl and is recorded in the completed

-19-
cracking pattern for that beam in Fig. 8. Fatigue loading was continued
on F7 until so many wires had broken that the static strength of the
specimen had been reduced to the value of the maximum applied dynamic
load. This test was terminated when concrete crushing was observed in
the top fibers of the beam. Another beam, F8, was tested statically to
failure after 5 wires had snapped due to fatigue loading, its static
ultimate strength is recorded in Table 1. The tests were continued on
the other beams unti1:four or five wires had failed.
Beam Fatigue Test Results
The results of the beam fatigue tests are recorded in Table 4.
Values of the applied loading have been obtained by comparing dynamic
deflections with the load-deflection curves obtained at regular intervals
during the static tests, and are average values taken over the entire
history of loading up to failure. The terms N1 , NZ' etc. in Table 4
refer to the number of load cycles at which the first, second, .etc.
wire failure took place.
CONCLUDING REMARKS
The beam fatigue tests have indicated that the response of
a prestressed concrete beam may vary considerably as a result of fatigue
loading. This variation is probably due to creep effects. Changes in
the concrete stress-strain re1ations~ .and progressive bond failure
between the tension steel and the surrounding concrete in the vicinity of
the tensile cracks. Most of the variation in beam response, however,

-20-
occurred in the very early loading cycles, and, after an initial sequence
of repeated loadings representing perhaps ten percent of the fatigue life,
the beam settled down to a fairly regular and consistent response to load.
When the fatigue loading was particularly severe, a continuous
change in beam response may occur up to failure as shown by the test
results of beams Fl, F2, and F4. Such severe fatigue loading would
rarely be encountered under field conditions, and in most cases it can
probably be assumed that the beam response is constant.
Fatigue failure occurred by successive fractures of the in
dividual wires of the strand. A considerable number of load cycles
separated the first and second steel failures, but the interval separat
ing successive failures tended to decrease as the number of failed ele
ments increased. Failure of each steel element was accompanied by a
corresponding decrease in beam rigidity.
When the total area of steel reinforcement is contained in a
small number of elements, it is advisable to associate beam fatigue
failure with failure of the first steel element. When there are a
large number of steel elements present in the section, beam fatigue
failure may better be defined arbitrarily as. the failure of some pro
portion of the elements. The proportion would be chosen from a con
sideration of allowable decreases in beam rigidity and factor of safety
against static load which could be allowed to occur as a result of the
steel failures.
If the fatig~e life of a prestressed concrete beam is governed
by the fatigue life of the tension steel, it should be possible to esti-

-21-
mate the beam fatigue life provided that information is available on
the fatigue properties of the prestressing steel and that the steel
stresses in the beam which result from the applied loading can be
calculated.
The second of this series of papers will describe an
experimental investigation into the fatigue properties of 7/l6-inch
diameter prestressing strand.
ACKNOWLEDGEMENTS
This investigation was conducted in Fritz Engineering
Laboratory, Department of Civil Engineering, Lehigh University under
the sponsorship of the following organizations: Pennsylvania Depart
ment of Highways; Uo S. Department of Commerce, Bureau of Public Roads;
Reinforced Concrete Research Council; American Steel and Wire Division,
United States Steel Corporation.
The authors are deeply endebted to Mr. Felicisimo So Ople, Jr o
for his help in all phases of the work.

-22-
REFERENCES
1. Freyssinet, E.A REVOLUTION IN THE TECHNIQUE OF THE UTILIZATION OF CONCRETEThe Structural Engineer, Vol. 14, No.5, May 1936, pp.242-246
2. Campus, F., Jacquemin, R.ESSAIS D'ENDURANCE SUR TRAVERSES DE VOlES FERREES, ENBETON ARME OU PRECONTRAINTBulletin du Centre d'Etudes de Recherches et d'EssaisScientifiqies des Constructions du G~nie Civil etd 'Hydrauliqie F1uvia1e de 1 'Universite de Liege, Vol. 2,1947, pp. 133-145
3. Abeles, P. W.PRESTRESSED REINFORCED CONCRETE SLEEPERS TESTED AS SIMPLYSUPPORTED BEAMSConcrete~and Constructional Engineering, Vol. 42, No.4,April 1947, pp. 123-132, No.5, May 1947, pp. 155-161
4. Knudsen, K. E., Eney, W. J.ENDURANCE OF A FULL-SCALE PRE-TENSIONED CONCRETE BEAMProgress Report 223.5, April 1953, Lehigh University
5. Smis1ova, A., Roes1i, A., Brown, D. H., Eney, W. J.ENDURANCE OF FULL-SCALE POST-TENSIONED CONCRETE MEMBERProgress Report 223.6, May 1954, Lehigh University
6. Nordby, G. M.FATIGUE OF CONCRETE - A REVIEW OF RESEARCHJournal American Concrete Institute, Vol. 30, No.2,August 1958
7. Warner, R. F., Hu1sbos, C. L.PROBABLE FATIGUE LIFE OF PRESTRESSED CONCRETE FLEXURALMEMBERSFritz:Laboratory Report No. 223.24A, Lehigh University,July 1962

TAB LE 1 - PRESTRESSED CONCRETE TEST BEAM PROPERTIES
b d hft * Fsec E' f su Mult
Beam (in.) (in.) (in. ) (ksi) P ~si fce L\f c f se (kips) Molu
Static
PI 6.12 8.09 12.12 7.04 .00661 670 22 68 580 51.0 309.6
2 6.06 8.09 12.12 7.21 .00669 670 23 71 576 50.6 308.0
3 6.19 8.00 12.06 6.98 .00660 670 24 71 575 50.6 316.6 233 436 536.4
4 6.00 8.00 12.06 6.98 .00681 670 24 70 576 50.6 300.5
F5 6.09 8.12 12.12 6.42 .00660 515 17 62 436 37.8 263.3
6 6.19 8.00 12.06 6.88 .00660 510 16 63 431 37.5 257.5 264 605 545.4
7 6.31 8.00 12.06 6.22 .00648 500 16 70 414 35.6 248.4
8 6.25 8.00 12.06 6.83 .00653 500 16 65 419 36.0 241.2 (503.0)._--_...• - ... __ ._--------
~~Average ft in test sectionc
Notes: All strains in in/in x 10-5
All moments in in-kips

TABLE 2 - DETAILS OF CONCRETE MIXES
I
Fl,5 F2,6 F3,7 F4,8
Concrete Ba.tch Distribution
Static Strength of Cylinders atBeams Batch Cement Water Sand Gravel Slump Time of Beam Tests
lb. lb. lb. lb. in.1 2 3 Mean f~
Fl-4 I 148 66.5 386 386 2 7240 7360 6460 7020
II 148 64.1 386 386 1-3/4 7090 7450 7150 7230
III 148 64.8 386 386 2 6040 6310 6070 6140
IV 148 65.2 386 386 2-1/2 6900 6915 7100 6970
V 148 64.4 386 386 2-1/4 6990 7100 6860 6980
F5-8 I 148 73 386 386 2-5/8 6270 6570 6490 6440
II 148 70 386 386 2 7230 6640 6770 6880
III 148 69 386 386 2-1/4 6550 6610 6560 6570
IV 148 66 386 386 2-1/8 6310 6050 6440 6270
V 148 65.5 386 386 1-7/8 6670 6650 6820 6710

TABLE 3 - STATIC TESTS. LOT I STRAND
Specimen No. Pult, lbs.
BS-l 27,300
BS-2 27,300
BS-3 27,400
BS-4 27,500

TABLE 4 - BEAM FATIGUE TEST RESULTS
Rateof' Jack Loads, kips{~ Wire Failures, Million Cycles
Beam Age Loading Failure(days) cpm Pmin Ppred Pol P02 Section Nl N2 N
3N
4N
5
Fl 167 250 4.50 12.10 - - W 0.225 0.233 0.258 0.258 0.258
2 170 250 4.50 12.10 - - E 0.164 0.200 0.215 0.226 0.226
3 161 (Static Test) L (Crushing of' Concrete Top Fiber)
4 169 250 4.50 12.10 - - W 0.139 0.146 0.164 -- --
F5 180 500 3.80 7.08 9.14 10.17 W 1.947 2.516 2.817 2.817 2.820
6 156 (Static Test) L (Crushing of' Concrete Top Fiber)
7 196 250 3.80 7.05 9.09 10.37 L 1.167 1.437 1.467 1.552 1.580
8 168 250 3.80 7.12 9.08 10.43 E 1.136 1.557 1.586 1.587 --
{~Including dynamic ef'f'ect, estimated f'rom def'lection readings

1-'-1'--"°'-"1--_-"3:....'-....:0::..",----4-+- ..::.4_';.,~0_"__--I-_---:3~'--0~'-'___0-1-1:-0.:[
3 "6 - Va dia. Stirrups
t 6 " .• 0 SPOCI~I
II I I I II I Ii: II I I I I I
=d..d=I=bL-l.
3 3"6" dia.· strands
I I I I I II I I I I I
, I I I I I II I 1 I I I
=.6.d=--~_-J,.,...J.,,~_~
FIG. I - DETAILS OF BEAM TEST SPECIMENS
100
eo
Cl'.SIII
:g 60ll.
...cQ)
~ 40Q)
ll.
20
/~ ~
IV
I/~ine I'J
I /c..".I I
/--- ------10050 30 16 e 4 3/eA.S.T.M. Sieve Sizes
FIG. 2 - GRADING CURVES FOR FINE AND COARSE AGGREGATES

100
80
..:;:)
Q. 60
"0
~ 40...J
20
./V--
V/
/" Pult. = 27.3 kips
Deformations measured over
/50 Inch Gage Length
VV
.002 .004 .006 .008 .01Strain. Inches per Inch
.012 .014 .016
FIG. 3 - LOAD VERSUS STRAIN. 7/16 INCH DIA. STRAND - LOT I
I" 3"
I4'-0"---~~--1
1 ~ p~i c:=:=J 14 1·4
)
-= i I t 12" )I--.;;T
~ I )
~ i )T..... - - - ~ -+-- - - - -~- -.,
6" i(
) 4" -2"1
u ! ))
10" 10" 10" 10" 10" 10"
RI R2 R3 R4 R5 R6
FIG.4 - GRID LAYOUT FOR MEASUREMENT OF CONCRETE DEFORMATIONS(SOUTH FACE)

FIG. 5 - BEAM TEST SET-UP

9000 Cycles I 3000 Cycles
T·~·""::'L..---..,-r----j18000 Cycles
-
I
One Load Block = 30.000 . Cycles --l
L
Pmin.
Ppred.
! •
FIG. 6 - LOAD BLOCK FOR BEAM CUMULATIVE DAMAGE TESTS
16 ,F6
en.~ 12~
.:
~ 800..,...(j)0-
"0 4c0..J
0 0.2 0.4 0.6 0.8 1.0 1.2 1.4 1.6 1.6Deflection in Inches
"FIG. 7 - CENTER- LINE DEFLECTIONS, STATIC ULTIMATE TESTS - F3 I F6

S S
B BNototion
Nletter No. Cycles
Na 1
b 10,000Rl R2 R3 R4 R5 R6
25,000Rl R2 R3 R4 R5 R6c
BEAM FI d 100,000 BEAM F3( Static Test)
e 200,000
f 225,000
z At completion ofS Test S
Note. Crack extensionsB recorded at 12.5 • B
NN
Rl R2 R3 R4 R5 R6 Rl R2 R3 R4 R5 R6
BEAM F2 BEAM F4
FIG. 8 - CRACKING PATTERNS

s S
B B
Notation
N letter No. Cycles N
a
Rl R2 R3 R4 R5 R6 b 30,000 Rl R2 R3 R4 R5 R6
BEAM F5 c 90,000 BEAM F7d 1,200,000
~ At completion ofTest
S Note: Crock extensions Srecorded at 10.5 kips
B B
N N
Rl R2 R3 R4 R5
BEAM F6(StotlC Test)
R6 Rl R2o
R3 R4
BEAM Fe
R5 R6
FIG. 9 - CRACKING PATTERNS

16.-------,-----,-..,-----r---,----,-------r---....".------,
If)
0- 12~
.!:
..a:::u. 80..,...Cj)~
""<01
4-I::l0-~
o .0004 .0008 .0012 .0016 .002
Concrete Strain· (in. / in )
.0024 .0028
FIG. 10 - TOP FIBER CONCRETE COMPRESSIVE STRAINS, STATIC ULTI MATE
TESTS --F3, F6
i6R3,F
If)
.9- 12~
.!:
~
u0 8..,...CD0-
" 40
.3
oDOl D02 D03 D04 D05 D06 DO?
Concrete Deformation ,in Inches per Ten Inch Gage Length.OOB
FIG. II - CONCRETE DEFORMATIONS AT THE STEEL LEVEL, STATIC ULTIMATETESTS - F3, F6

o.
en O.CIls:u.E
8 I If:J. - first load cycle
p = 12.5---,'
6 ---- ---_ ...---- -- -- -
/~,---- ---"" 11.0
~...... 10.0
.~9.0
~-- e.o
~~
6.0
.2 -~. I 4.5 I I~ Dashed Line represents deflection
under dynamic load
IP = Static Load per ,JoCkI
c.- O.c:o~;;:CIl0('\
v.
o 20 40 60 80 100 120 140, 160 180 200 220
Number .of Cycles in Thousands
FIG..12 - MID -SPAN DEFLECTIONS, STATIC AND - DYNAMIC LOADS - BEAM F2
...,I
6.- first load cycle III
"I ,r' ,
!"'-., I
I I
r J I, t
~~_.. I.
.J r__ ..J
P = 10.5.--0 r' ..--- --- ------, ,--- -----
V 9.5 --- ,...--_.. ,. (,.... 1---------~ I
-;..------------- ---- - - ----- -----~-' ---- I
~._--- r--- J, ........ 8.5r J
./'"' ~
V' -=_. ---- --- - ---- ------- -<'l--- --~.gr .L"l
,./"' 3.e
~ Dashed Lines represent deflectionsunder dynamic load
P = ,Static Load per Ja9k
1.0
0.8
II)CIls:u=0.6
.:co
+::~0.400CIlo
0.2
o 0.2 0.4 0.6 0.8 1.0Number of Cycles in
1.2Millions
1.4 1.6 1.8
FIG. 13 - MID - SPAN DEFLECTIONS, STATIC AND DYNAMIC LOADS - BEAM F 7

kkj!0'0.5. P O lo.51
~ s-RI R2 R3 R4 R5 R6
300,..-'---,---r----,---,'-'---r'----,
2....~.s.5 '001-.Jff--+----m~_j1f_-_t--__+-__i
<:.51<;E~
..I
Q
s;~ 2001-----1I1HMI\,-t----+--hL7f'-----'W--~_M_=_l·9 x 10
5
9 9 x 10⁴
FIG.I4 -CONCRETE DEFORMATIONS AT THE STEELLEVEL - BEAM F7
kkl P='2.5 P='2.51
-e::~ <;>
RI R2 R3 R4 R5 R6
300,..---.----,.---,-----,,.---,-----,
2I
8-~. N'15<10
4
s; 6 <104
~ 2001---\--1----I----J'IH'-\'\\--4---+---II-.~2.5 x 10⁴
Q
....S;
~.S 1001---+-Y-4'1---+----\\-'\\\-'-1IHJf---j
.~
~.ec'!:.
0'----'--......L.--.1.-.-~----I.----'
FIG. 15 -CONCRETE DEFORMATIONS AT THE STEELLEVEL - BEAM F2
a 100
a 100
-\
N=30,000
P=10.5k
N = I
P =6 k
N = IP = 10.5k
a \00-100 a
N= 900,000
P =10.5k
N = 600,000P =10.5 k
100
a
a
-\00
-100 a
R4 R3
Note: All deformations in Inches x 16; per 10 InchGage Length
FIG. 16 - CONCRETE DEFORMATIONS INREGIONS R3 AND R4, BEAM F7
tJ.- fIrst loa~ cycleI
p= 12.5
~ I
V 1,1.0
./V" I
V ...., 10.0
~8.0 I
6.0
. '- "- t-. 1-- ~
- - - _. -4.50...--...;...-
300
~,Q
o 20 40 60 80 100 120 140 160 180 200
Number of Load ,Cycles in Thousands
FIG. 17 -CONCRETE DEFORMATIONS AT STEEL LEVEL, REGION R4 -BEAM F2
1.41.21.0in Millions
0.8Cycles
0.4 0.6Number of Load
0.2
0 I I 0
t:.- first load c cle
/V
0P=10.5 ('
~V"
.;r
~9.5 r
~V
....."" rr 8.5 r~ l.,....-"
1/~
7.0 ..... ---I--'0v- 6.0 ....."""
~~
V 3.8 -'....--.. -------- ---0------- ---...,..-- -----~---"". - .
~...
o
40
coCE...~o
.= \0
.r::~0,
.,.Q 20
,M
<J>cp.r::u.E
'cpCJ>CC) 30
FIG. 18, -CONCRETE DEFORMATIONS AT STEEL LEVEL, REGION R2 - BEAM F7
200
fi~st . looe
I ,--.-._-
I:i - cycle
p: 12.5
~, 11.0
0~10.0 I
.,..8.0 J
~. 6.0--- 4.5 I - .-~
I
f---- f---- ---- ---- J---- ---- ------- 0110--
lOI0
I.J ...,U>C'0<7S
.!?l!!
8(.)
100
o 20. 40 60 80 100 120 140Number of Lood Cycles in· Thousonds
160 180 200
FIG. 19 -TOP FIBER CONCRETE COMPRESSIVE STRAINS, REGION R4 - BEAM F2
A - first load cycle ---p: 10.5~
V 9.5 -~l..--'r 8.5 ~"..., -~ 7.0 .... ;,-- --~---- 6.0 ~~
V 3.8 - .-_. i- ..-1-
V>--- -- 0
//
150
lO
Q... 100
U>C'0..~
~! 50uc·o(.)
o 0.2 0.4 0.6 0.8Number of Lood Cycles in
1.0Millions
1.2 1.4
FIG. 20 -TOP FIBER CONCRETE COMPRESSIVE STRAINS, REGION R3 - BEAM F7