Probability of Failure and Risk Assessment of Propulsion ...Probability of Failure and Risk...
12
NASA Technical Memorandum 102323 Probability of Failure and Risk Assessment of Propulsion Structural Components , ! f/ • Michael C. Shiao Sverdrup Technology, Inc. NASA Lewis Research Center Group Cleveland, Ohio and Christos C. Chamis National Aeronautics and Space Administration Lewis Research Center Cleveland, Ohio Prepared for the 1989 JANNAF Propulsion Meeting Cleveland, Ohio, May 23-25, 1989 ,] . _ ' i q_LL "_ __' https://ntrs.nasa.gov/search.jsp?R=19910016122 2020-03-02T06:30:51+00:00Z
Transcript of Probability of Failure and Risk Assessment of Propulsion ...Probability of Failure and Risk...

NASA Technical Memorandum 102323
Probability of Failure and RiskAssessment of PropulsionStructural Components
, !
f/ •
Michael C. Shiao
Sverdrup Technology, Inc.
NASA Lewis Research Center Group
Cleveland, Ohio
and
Christos C. Chamis
National Aeronautics and Space Administration
Lewis Research Center
Cleveland, Ohio
Prepared for the
1989 JANNAF Propulsion Meeting
Cleveland, Ohio, May 23-25, 1989
,] . _ ' i q_LL "___'
https://ntrs.nasa.gov/search.jsp?R=19910016122 2020-03-02T06:30:51+00:00Z

T

PROBABILITY OF FAILURE AND RISK ASSESSMENT OF PROPULSION
STRUCTURAL COMPONENTS
Michael C. Shlao
Sverdrup Technology, Inc.NASA Lewis Research Center Group
Cleveland, Ohio 44135
and
Christos C. ChamisNational Aeronautics and Space Administration
Lewis Research CenterCleveland, Ohio 44135
0LC)
Ii,i
SUMMARY
Because of the increasing need to account for the uncertalntles in mate-rial properties, 1oadlng conditions, geometry, etc., a methodology has beendeveloped to determine structural rellabllity and to assess the associatedrisk. The methodology consists of a probabilistlc structural analysls by aprobabilistic finite element computer code NESSUS (Numerlcal Evaluatlon of Sto-chastic Structures Under Stress) and a generic probablllstlc materlal propertymodel. The methodology Is versatile and is equally applicable to structuresoperating at high- and cryogenic-temperature environments. Results obtalneddemonstrate that the issues of structural rellability and risk can be formallyevaluated by using the methodology developed whlch is inclusive of the uncer-tainties in material properties, structural parameters, and loading conditions.The methodology is described in some detail with illustrative examples.
INTRODUCTION
The probabilistic structural analysis methods (PSAM) (ref. I) have beendeveloped to analyze the effects of fluctuatlng loads, varlable material prop-erties, uncertaintles in analytical models and geometry, etc., especially forhigh-performance structures such as space shuttle main engine (SSME) turbopumpblades. In the deterministic approach, uncertainties in the responses are notquantified, and the actual safety margin remains unknown. Risk is calculatedafter extensive servlce experience. However, probabilistic structural analy-sis provides a rational alternative method to quantify uncertainties in struc-tural performance and durabllity. NESSUS (Numerical Evaluation of StochasticStructures Under Stress) is a probabilistic structural analysis computer codedeveloped under the PSAM project which integrates finite element methods andreliability algorithms (refs. 2 and 3). This code is capable of predictingthe scatters of structural response variables (such as stress, dlsplacement,natural frequencies, and buckling loads) subjected to all kinds of uncertain-ties. These are subsequently compared with their probable failure modes toassess the risk of component fracture. Probable failure modes are defined fordifferent structures and thelr respective service environments. For example,failure events (such as stress greater than strength, displacement exceeds

maximum a11owables, or avoidance of resonance) are often used for the reliabil-
ity assessment. Probability of occurrence of those failure events can bedetermined once the probability distributions of the requisite structural
response variables are calculated by NESSUS.
In undertaking a reliability and risk analysis, all suspected sources of
uncertainties must be taken into account in order to control the probability
of failure in service environments within an acceptable range. Structural
reliability and risk obtained by a formal probabiIistic methodology can be
useful in evaluating the traditional design and in setting quality control
requirements, inspection criteria, and retirement for cause. This methodology
can also be used to identify candidate materials and design concepts in the
absence of a technology base. In this report, the methodology developed to
assess the structural reliability and risk/cost is described.
CONCEPT OF PROBABILISTIC STRUCTURAL ANALYSIS
In a probabilistic structural analysis, the primitive variables which
affect the structural behaviors have to be identified. These include tempera-
ture, material properties, structural geometry, loading conditions, etc. and
should be described by their respective probability distributions. A struc-
tural analysis performed by NESSUS with the predetermined probability distribu-
tions of all the primitive (random) variables will produce correspondingscatter (uncertainties) in the structural responses such as displacement,
stress, natural frequencies, etc. The concept is illustrated by figure I.
STRUCTURE OF NESSUS
NESSUS consists of three major modules: NESSUS/PRE, NESSUS/FEM, andNESSUS/FPI. NESSUS/PRE is a preprocessor used for the preparation of the sta-tistical data needed to perform the probabilistic finite element analysis. Itallows the user to describe the uncertainties in the structural parameters(random variables) at nodal points of a finite element mesh. The uncertain-ties in these parameters are specified over this mesh by defining the meanvalue and standard deviation of the random variable at each point, togetherwith an appropriate form of correlation. Correlated random variables are thendecomposed into a set of uncorrelated vectors by a modal analysis. For astrongly correlated random field, the number of dominant random variables inthe set of uncorrelated vectors will be much less than the number in a weaklycorrelated random field. Thus, the computational time required for the analy-
sis will also be reduced significantly.
NESSUS/FEM is a finite element code used for the structural analysis andparameter sensitivity evaluation. It generates a database containing all theresponse information corresponding to a small variation of each independentrandom variable. The algorithm used in NESSUS/FPI requires an explicitresponse function in order to perform a reliability analysis. In complicatedstructural analysis problems, response can only be available implicitlythrough a finite element model. To overcome this difficulty, the responsefunction is expressed parametrically with the database.

NESSUS/FPI (Fast Probability Integrator) is an advance reliability module
(ref. 3). Thls module extracts the database generated by NESSUS/FEM to
develop a response or a performance model in terms of uncorrelated random var-fables. The probabllistic structural response is calculated from the perform-
ance model. For a given response value, the probability of exceeding this
value Is estimated by a reliability method, which treats the problem as a con-
strained minimization. This step is called a point probability estimation.
The cumulative distribution functlon is generated by running FPI at several
response values. One alternative for generating the distribution function for
any given response is to conduct a direct Monte Carlo simulation study. How-ever, In general, It is very costly. NESSUS/FPI provides a method which not
only produces an accurate probability distribution, but also requires less com-
puting time than that required for Monte Carlo simulation, especially in low-
probability regions.
PROBABILISTIC MATERIAL PROPERTIES MODEL
A generic material behavior model (ref. 4) is used to evaluate the scat-ters of material properties for the structures subjected to high-temperatureenvironments and high-cycle loading conditions. The fundamental assumptionfor this model is that the material properties behavior can be simulated byprimitive (random) variables. The general form of this model is shown inequation (I).
IT,-T]n[s,-o]pr,o .I0Mp= Mpo _ T; _FF ;0 L logN,0J <i>
where Mp is the materlal property at current temperature after the applica-tion of fatigue cycles; Mpo is the reference materlal property at referencetemperature TO (usually room temperature), reference stress oO, and refer-ence fatlgue cycles NMO_ TF, SF, and NMF are the final temperature,final material strength, and final mechanical cycle, respectively; T is cur-rent blade temperature; o is the existing blade stress; and NM is thenumber of fatigue cycles to be considered in the failure analysis. The expo-nents n, p, and q are determined from avallable experiment data, or theyare estimated from the anticipated material behavior due to the particularprimitive random variable.
APPLICATION TO A SPACE SHUTTLE MAIN ENGINE (SSME)TURBINE BLADE
The methodology described previously was applied to a SSME turbine blade
(fig. 2) which was subjected to complex mechanical and thermal loads. (Proba-
blIistic Structural Analysis for Select Space Propulsion System Components.
First Annual Report by Southwest Research Institute, Rocketdyne, University ofArizona, Marc Analysis Corp., and Columbia University for NASA Lewis Research
Center under Contract NAS3-24389, March 1986.) Mechanical loads consist of
centrifugal force and the differential pressure across the airfoil. Centrifu-
gal force is induced by rotational speed. Since it is difficult to maintain a
constant rotational speed, the centrifugal force has to be considered as a ran-
dom variable. Differential pressure _s also random because of pressure fluctu-
ation. Random thermal loads are due to combustion irregularities which causea random temperature dlstribution in the blade. Uncertainties in the blade
geometry arise during the manufacturing process.
3

The scatter in material properties is caused by nonuniformities in thematerial.
The turbine blade is modelled by 40 4-node shell elements with 55 nodalpoints. In this study, seven random fields were considered as listed intable I. In previous analysis (ref. 5), the probability density function ofmaterial properties such as Young's modulus, thermal expansion coefficient,and material strength are assumed. In the present study, they are simulatedby the probabilistic material property model as defined by equation (l). Thematerial property is a function of its reference value, temperature, andfatigue cycles. The statistics of the primitlve random variables are listedin table II. Since the material is a functlon of stress, and stress is a func-tion of material property in an implicit way, an iterative procedure is neces-sary to obtain a convergent solution for stress and material properties.
To start the iteration procedure, the probability distributions of thematerial properties were predicted by equation (1) with its reference valueand the blade temperature only, since the variations of the blade stresseswere unknown. A probabilistic structural analysis using NESSUS was performed,and the probability distributlons of stresses were determined. The genericprobabilistic material property model was applied again at the given fatiguecycle with these newly estimated stress variations. The probability distribu-tlons of material properties were updated, and NESSUS was rerun. The proce-dure was repeated until the probability distributions of the materialproperties and stress converged. During the iteration process, the jointcumulative distribution functions of nodal stresses were also calculated Inorder to apply the generic probabillstic material property model on the entlreblade. It was found that only a few iterations were needed for a convergence.
The blade is assumed to be subjected to I00 000 constant amplitude loadcycles which degrade the modulus and strength. The critical points of thelarge displacement and high stress are depicted in figure 3. As shown in fig-ure 4, at the root of the leading edge, the probability distribution of modu-lus is reduced significantly after the application of cyclic loads, where theinitial distribution is that without the fatigue load, and the final distribu-tion is the one after the application of the fatigue load. Changes in theprobability density function of tip displacement with and without the applica-tion of cyclic loads are also shown in figure 5. As expected, the tip dis-placements are increased after the application of cyclic loads because theblade becomes softer. Material strength degradation after cyclic loads is cal-culated with the converged stress by the probabilistic material Droperty modelas shown in figure 6. Once the stress-strength relationships are determinedat a given fatigue cycle, the probability that the stress is greater than thecorresponding material strength will be determined. The probability is calcu-lated by
Pf = I. fs(s)ds f (x)dx (2)0
where fa is the probability density function (pdf) of effective stress calcu-lated by the probabilistic structural analysis using NESSUS, and fs is thepdf of material strength simulated by the probabilistic material propertymodel. By varying the number of cycles and repeating the procedure describedpreviously, a Risk-Fatigue cycle curve is developed for critical locations asshown in figure 7. This curve is useful for assessing the risk of structural
4

fracture. For instance, at a given acceptable risk level, the numberoffatigue cycles to initial local failure can be determined. With this informa-tion available, criteria can be set for quality control, inspection intervals,and retirement for cause.
The risk-cost assessment is the evaluation of the relationship betweenstructural reliability and total cost associated with the structure. Totalcost is the sumof initial cost and a fraction of consequential cost asdefined in equation (3). The fraction is weighted by the probability of fail-ure. The initial cost is the cost for componentservice readiness. The conse-quentlal cost is the cost incurred due to failure.
Ct = Ci . Pf x Cf (3)
where Ct represented total cost, Ci represented initial cost, Pf is theprobability of failure, and Cf is the consequential cost. Since the lowerinitial cost is often associated with higher risk for the structural failure,and higher initial cost will normally reduce the risk, the total cost can beminimized for an acceptable structural reliability. For example, the initialcost is a function of the mean strength of the material as shown in figure 8.The greater the strength, the more reliable the structure. However, high ini-tial cost is needed to improve the mean strength. Total cost is shown in fig-ure 9. There exists a point of diminishing return. Thls can be identified asthe lowest total cost with no loss of structural reliability. A similarresult was also obtained for the case of strength quality improvement as shownin figures I0 and II.
SUMMARY OF RESULTS
In summary, a reliability and risk cost methodology has been developed.It consists of a probabilistic structural analysis by NESSUS and a genericprobabilistic material model. The methodology is versatile and equally appli-cable to hot and cold structures where data is difficult to obtain. The meth-odology is demonstrated by uslng it to assess the risk associated with fatiguecycles to initiate local failure in SSME blades.
REFERENCES
I. Chamis, C.C.: Probabilistic Structural Analysis Methods for Space Propul-sion System Components. NASA TM-88861, 1986.
2. Lind, N.C.; Krenk, S.; and Madsen, H.O.: Methods of Structural Safety.Prentice-Hall, 1985.
3. Wu, Y.T.: Demonstration of a New, Fast Probability Integration Method forReliability Analysis. Advances in Aerospace Structural Analysis, O.H. Burn-side and C.H. Parr, eds., ASME, 1985, pp. 63-73.
4. Boyce, L.; and Chamis, C.C.: Probabilistic Constitutive Relationships forCyclic Material Strength Models. 29th Stuctures, Structural Dynamics andMaterials Conference, Part 3, AIAA, 1988, pp. 1299-1306.
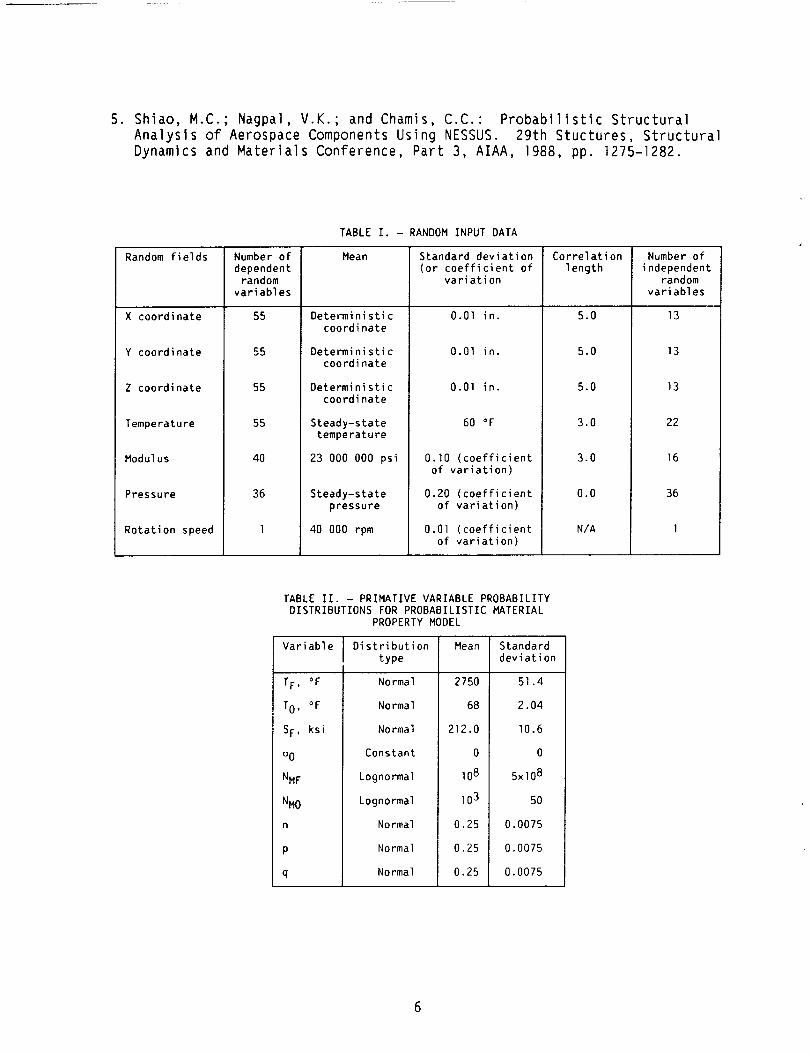
° Shiao, M.C.; Nagpal, V.K.; and Chamis, C.C." Probabilistic StructuralAnalysls of Aerospace Components Using NESSUS. 29th Stuctures, StructuralDynam|cs and Materials Conference, Part 3, AIAA, 1988, pp. 1275-1282.
TABLE I. - RANDOM INPUT DATA
Random fields
X coordinate
Y coordinate
Z coordinate
Temperature
Modulus
Pressure
Rotation speed
Number of
dependentrandom
variables
55
55
55
55
4O
36
1
Mean
Deterministiccoordinate
Deterministiccoordinate
Deterministiccoordinate
Steady-statetemperature
23 000 000 psi
Steady-statepressure
40 000 rpm
Standard deviation(or coefficient of
variation
0.01 in.
0.01 in.
0.0] in.
60 °F
0.10 (coefficientof variation)
0.20 (coefficientof variation)
O.Ol (coefficientof variation)
Correlation
length
5.0
5.0
5.0
3.0
3.0
0.0
N/A
Number of
independentrandom
variables
13
13
13
22
16
36
1
TABLE II. - PRIMATIVE VARIABLE PROBABILITYDISTRIBUTIONS FOR PROBABILISTIC MATERIAL
PROPERTY MODEL
Variable
TF, °F
TO, °F
SF, ksi
o0
NMF
NMO
n
Distribution Mean Standard
type deviation
Normal 2750 51.4
Normal 68 2.04
Normal 212.0 I0.6
Constant 0 0
Lognormal 108 5xlO 8
Lognormal lO3 50
Normal 0.25 0.0075
Normal 0.25 0.0075
Normal 0.25 0.0075

C,
INPUT PDF
(LOAD, MATERIAL, GEOMETRY,BOUNDARYCONDITIONS)11'
IsTRuctUrAL_ODELIt
Y
_:I::]_ P(Y<y) = f Py(_ )d_
Y
OUTPUT PDF
(DISPLACEMENT, STRAIN, STRESS)
FIGURE I. - CONCEPTOF PROBABILISTIC STRUCTURAL
ANALYSIS.
_-.-X
STOCHAST I C
THERMOMECHAN I CAL
I OADS-,, #DYNAMIC
STOCHASTIC _ X, _ /RESPONSE
MAterIAL r/h,_ _ _ _ i
stress rK " .'_K\ _.---_-- /-._-_"
CONCEntRAT,ON-_--_.T__._._._<"k_%'_-"..._
UNCErtAIN / '_lk . J_jx_)I STRUCTURAL
_OUNDARY.,, ._ j .;_.._1 S_APECONDItlons-_'.C_ _
FIGURE 2. UNCERTAINTIES IN PROBABILISTIC STRUCTURE ANALYSIS.
cf u
GLOBAL /
DISPLACEMENTS /
/
LOCAL
STRESSES B
A
FIGURE 3, - SSME BLADE SHOWINGLOCATIONS WHEREPROBABILISTIC STRUCTURAl RESPONSEWASEVALUATED
(RANDOM LOADINGS: PRESSURE, TEMPERATURE, AND RO-
TATIONAL SPEED: RANDOM GEOMETRY: RANDOM MATER-
IAL PROPERIIES: MECHANICAL CYCLE ]000 000).
.GO --
_ .,s - - ....._J
e g .3o -c_
o
INITIAL
FINAL
.,<j<',\ ,II IG 21 2G G
MODULUS
,/",/"x.,'1 /',L XI,.
11 16 21
I26
CA) NODE A, (MEAN STRESS (B) NODE B. (MEAN STRESS
STRENGTH RAIlO 0.83). STRENGTH RATIO = 0.82).
FIGURE 4. - PROBABILISTIC MODULUS SIMULATED BY USING THE
GENERIC PROBABILISTIC MATERIAL PROPERTY MODEL _ (MPSI).

'GO I INITIAL_ .45 ...... FINAL
.30 ,/_.
.15 x\
0 4 8 t2
I16
B
m
7 10 13 16
DISPLACEMENF
(A) NODE C. (B) NODE D.
FIGURE 5. - PROBABILISTIC DISPLACEMENTS CALCULATED BY
NESSUS _ (10-3 IN.).
.100 F STRESS
_-'_--'_.075.050_ ......//_/'""'\STRENGTH
o |/I ./'1,. I_.,70 90 110 130
f /_ /"\
t-- I V ',I lY_Y",K t,. l
150 70 90 ! 10 130 150
STRESS/STRENGTH
(A) NODE A. (MEAN STRESS (B) NODE B. (MEAN STRESS
STRENGTH RATIO - 0.83). STRENGTH RATIO = 0.82).
FIGURE 6. - PROBABILISTIC FATIGUE STRESS/STRENGTH SIMULATED
BY USING THE GENERIC PROBABILISTIC MATERIAL PROPERTY MODEL,
KSI.
10_i
10_2
i 10_3
10-4 I I I I4.0 4.5 5.0 5.5 6.0
LOG OF FATIGUE CYCLES
FIGURE 7. - PROBABILITY OF LOCAL FAILURE DUE TO FATIGUE
CYCLES AT NODE A.
4
8
I.--
z-- 2
5 k 0 COST --- ,300.225--i
_J
.075 '_
1 o110 120 130 140 150
MEAN STRENGTH
FIGURE 8. - INITIAL COST AND STRUCTURALRELIABILITY
QUANTIFIED IN TERMS OF MEAN STRENGTH (GIVEN QUALITY).
5
4
3
2
I I I I110 120 130 140 150
MEAN STRENGTH
FIGURE 9. - TOTAL COST QUANTIFIED IN TERMS OF MEAN STRENGTH
(GIVEN QUALITY).
2.5
2.0!
_: 1.5!
1.0
p
:_ 0 COST
.s- I I _ _o100 80 60 40 20
QUALITY, SCATTERS
FIGURE 10. - INITIAL COST AND STRUCTURAL RELIABILITY
QUANTIFIED IN TERMS OF QUALITY CONTROL (GIVEN MEAN
STRENGTH).
.08
.06 _
.04
.02o=
°t_: 1.5
1.0
o.5 I I I I100 80 40 20GO
QUALITY, SCATTERS
FIGURE 11. - TOTAL COST QUANTIFIED IN TERMS OF QUALITY CONTROL
(GIVEN MEAN STRENGTH).

Na_ol_al Aeronautics andSpace Administration
Report Documentation Page
1. Report No.
NASA TM- 102323
4. Title an/Subtitle
Probability of Failure and Risk Assessment of
Propulsion Structural Components
7. Author(s)
Michael C. Shiao and Christos C. Chamis
9. Performing Organization Name and Address
National Aeronautics and Space Administration
Lewis Research Center
Cleveland, Ohio 44135-3191
2. Government Accession No. 3. Recipient's Catalog No.
5. Report Date
6. Performing Organization Code
8. Performing Organization Report No.
E-5019
10. Work Unit No.
553-13-00
11. Contract or Grant No.
13. Type of Report and Period Covered
Technical Memorandum
14. Sponsoring Agency Code
12. Sponsoring Agency Name and Address
National Aeronautics and Space Administration
Washington D.C. 20546-0001
15. Supplementary Notes
Prepared lbr the 1989 JANNAF Propulsion Meeting, Cleveland, Ohio, May 23-25, 1989. Michael C. Shaio,
Sverdrup Technology, Inc., NASA Lewis Research Center Group, Cleveland, Ohio 44135; Christos C. Chamis,NASA Lewis Research Center.
16. Abstract
Because of the increasing need to account for the uncertainties in material properties, loading conditions, geom-
etry, etc., a methodology has been developed to determine structural reliability and to assess the associated risk.
The methodology consists of a probabilistic structural analysis by a probabilistic finite element computer code
NESSUS (Numerical Evaluation of Stochastic Structures Under Stress) and a generic probabilistic material
property model. The methodology is versatile and is equally applicable to structures operating at high- and
cryogenic-temperature environments. Results obtained demonstrate that the issues of structural reliability and risk
can be formally evaluated by using the methodology developed which is inclusive of the uncertainties in material
properties, structural parameters, and loading conditions. The methodology is described in some detail with
illustrative examples.
17. Key Words (Suggested by Author(s))
Probabilistic; Risk: Cost; Failure; Reliability;
Random; Material
18. Distribution Statement
Unclassified- Unlimited
Subject Category 39
19. Security Classif. (of this report) 20. Security Classif. (of this page) 21. No of pages 22. Price*
Unclassified Unclassified 10 A03
NASA FORM 1626 OCT 86*For sale by the National Technical Information Service, Springfield, Virginia 22161
_L,J_,_IIam'RI011,MJLI PRECEDING PAGE BLANX NOT F{LMEDIt,Atoll'

![High-Confidence, Low- Probability-of-Failure Screening January 11, 2014 RLGM? P[P[Failure|Eq]](https://static.fdocuments.in/doc/165x107/56649de85503460f94ae237b/high-confidence-low-probability-of-failure-screening-january-11-2014-rlgm.jpg)