Probabilistic stability analysis of block toppling failure in rock slopes.pdf
14
Int. J. RockMech.Min.Sci.&Geomech. Abstr. Vol. 27, No. 6. pp. 465~78, 1990 0148-9062/90 $3.00 + 0.00 Printed in Great Britain Pergamon Press plc Probabilistic Stability Analysis of Block Toppling Failure in Rock Slopes C. SCAVIAt G. BARLAt V. BERNAUDO~ A probabilistic model for the analysis of the block toppling failure in rock slopes is described in the present paper. The 2-D limit equilibrium analysis of rock blocks, resting on a stepped failure surface is carried out including both a Monte-Carlo simulation procedure and Markov Chains theory. Accounting for the variability of selected input parameters describing the joints in a rock mass, a number of possible failure paths are generated. For each path, the statistical distribution of the interaction forces is calculated. In both cases, use is made of a Monte-Carlo simulation. Then, by concepts of Markov Chains theory, the probability of failure of one or more rock blocks is assessed. Two examples are discussed. The first is intended to show an idealized slope design problem; the second is a practical application to an open-cast operation, where the stability conditions needed to be assessed. It is shown how the probabilistic model can also be used as an aid in deciding on stabilization procedures. MG ~ g.= MaQ = m,H N= p(i, i), p(i, i 4- 1) = P~, P,= e(i), P(i + 1) = I':,I',= P,(i), Pr(i)= NOMENCLATURE§ bd..... bwb = distances used to take moment of block forces about point O; F D = seismic (pseudostatic) force; H -- slope height; hd, h, -- block height; hw, h,~ = height of water above slice base; K = seismic (pseudostatic) coefficient; L = length along the slope face with distributed pressure q; moment of forces applied at the block centre of gravity; moment of hydrostatic forces S,., S,, and $~; moment of shear force R, and of a stabilizing force Q; number of samples (iterations) and number of blocks; normal force on block base; transition probability for block (i); probability of stability and of instability of a single block; forces transferred from block (i - I) and (i + I) on a block (i) in limiting equilibrium conditions; probability of forming and of instabilityof rock volume Vr; forces transferred from block (i) to block (i - l) in limiting equilibrium conditions for shearing and rotation; Q = external stabilizing force; tDepartment of Structural Engineering, Technical University of Turin (Politecnico), Corso Duca degli Abruzzi 24, 10129 Turin, Italy. :~Dott. lng., Turin, Italy. §See Figs Ai and A2 in the Appendix. Moments are taken about point O of each block. q -- uniformly distributed stabilizing pressure; Rb, Ri, Re -- shear forces on the block sides (b, i) and on the base (s); S^, SB = spacing of discontinuity systems A and B; Swb, S,~, S~ = hydrostatic forces on the block sides (b, i) and on the base (s); Uo, uc = hydrostatic pressure at points O and C; V = volume of block; V r-- potentially unstable volume formed of one of more blocks; X(i), Y(i) -- coordinates of point C; Xo, ¥o = coordinates of block centre of gravity; W ffi weight of block; a,, a 2 = dip angle of slope and of upper slope surface; ~, Yw= unit weight of rock and water; AX -- length of block base; ~, 0 ffi dip of discontinuity planes A and B; H = product; q~b, #l = angle of friction of block base and sides. INTRODUCTION The stability condition of rock slopes is greatly affected by the geometric and strength parameters of joints and discontinuities in a rock mass. The relative orientations of these discontinuities with respect to the slope face deter- mine which mechanisms of instability (plane and 3-D wedge sliding or toppling) are kinematically possible. Methods of analyzing rock slope instability arising from sliding along discontinuities are widely available, including both deterministic and probabilistic pro- cedures. In comparison, the toppling failure mode of 465
-
Upload
fredy-alonso-valeriano-nina -
Category
Documents
-
view
17 -
download
4
Transcript of Probabilistic stability analysis of block toppling failure in rock slopes.pdf
Int. J. Rock Mech. Min. Sci. & Geomech. Abstr. Vol. 27, No. 6. pp. 465~78, 1990 0148-9062/90 $3.00 + 0.00 Printed in Great Britain Pergamon Press plc
Probabilistic Stability Analysis of Block Toppling Failure in Rock Slopes C. SCAVIAt G. BARLAt V. BERNAUDO~
A probabilistic model for the analysis of the block toppling failure in rock slopes is described in the present paper. The 2-D limit equilibrium analysis of rock blocks, resting on a stepped failure surface is carried out including both a Monte-Carlo simulation procedure and Markov Chains theory.
Accounting for the variability of selected input parameters describing the joints in a rock mass, a number of possible failure paths are generated. For each path, the statistical distribution of the interaction forces is calculated. In both cases, use is made of a Monte-Carlo simulation. Then, by concepts of Markov Chains theory, the probability of failure of one or more rock blocks is assessed.
Two examples are discussed. The first is intended to show an idealized slope design problem; the second is a practical application to an open-cast operation, where the stability conditions needed to be assessed. It is shown how the probabilistic model can also be used as an aid in deciding on stabilization procedures.
M G ~
g .= MaQ =
m , H
N = p(i, i), p(i, i 4- 1) =
P~, P,=
e(i), P(i + 1) =
I':,I',=
P,(i), Pr(i)=
N O M E N C L A T U R E §
bd . . . . . bwb = distances used to take moment of block forces about point O;
F D = seismic (pseudostatic) force; H -- slope height;
hd, h, -- block height; hw, h,~ = height of water above slice base;
K = seismic (pseudostatic) coefficient; L = length along the slope face with distributed
pressure q; moment of forces applied at the block centre of gravity; moment of hydrostatic forces S,., S,, and $ ~ ; moment of shear force R, and of a stabilizing force Q; number of samples (iterations) and number of blocks; normal force on block base; transition probabili ty for block (i); probability of stability and of instability of a single block; forces transferred from block (i - I) and (i + I) on a block (i) in limiting equilibrium conditions; probability of forming and of instability of rock volume Vr; forces transferred from block (i) to block (i - l) in limiting equilibrium conditions for shearing and rotation;
Q = external stabilizing force;
tDepar tment of Structural Engineering, Technical University of Turin (Politecnico), Corso Duca degli Abruzzi 24, 10129 Turin, Italy.
:~Dott. lng., Turin, Italy. §See Figs Ai and A2 in the Appendix. Moments are taken about point
O of each block.
q -- uniformly distributed stabilizing pressure; Rb, Ri, Re -- shear forces on the block sides (b, i) and on the
base (s); S^, SB = spacing of discontinuity systems A and B;
Swb, S,~, S~ = hydrostatic forces on the block sides (b, i) and on the base (s);
Uo, u c = hydrostatic pressure at points O and C; V = volume of block;
V r-- potentially unstable volume formed of one of more blocks;
X(i), Y(i) -- coordinates of point C; Xo, ¥o = coordinates of block centre of gravity;
W ffi weight of block; a, , a 2 = dip angle of slope and of upper slope surface; ~, Yw = unit weight of rock and water; AX -- length of block base; ~, 0 ffi dip of discontinuity planes A and B;
H = product; q~b, #l = angle of friction of block base and sides.
I N T R O D U C T I O N
T h e s t a b i l i t y c o n d i t i o n o f r o c k s l o p e s is g r e a t l y a f f e c t e d
by the geometric and strength parameters of joints and discontinuities in a rock mass. The relative orientations of these discontinuities with respect to the slope face deter- mine which mechanisms of instability (plane and 3-D wedge sliding or toppling) are kinematically possible.
Methods of analyzing rock slope instability arising from sliding along discontinuities are widely available, including both deterministic and probabilistic pro- cedures. In comparison, the toppling failure mode of
465
466 SCAVIA et al.: PROBABILISTIC TOPPLING FAILURE
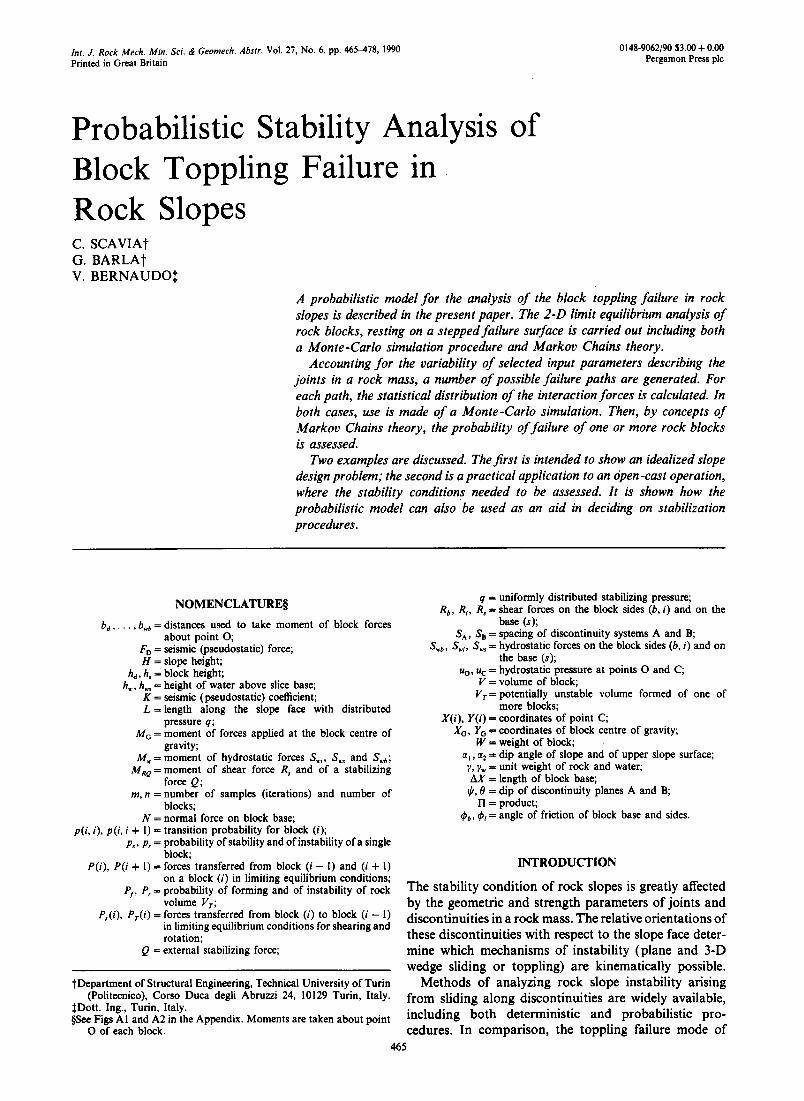
Fig. 1. Idealized slope geometry with a postulated failure surface (stepped base).
instability has received limited attention. Only a few contributions [1-4] to the subject can be found in the rock mechanics literature, following the paper by Goodman and Bray [5], where the fundamentals for the analysis of toppling failures were established.
With this basic procedure, the rock blocks are given the same size and shape. The critical failure surface is chosen a priori. The definition of the factor of safety against the assumed mode of failure is somewhat uncer- tain, and discussions arise with respect to the "required" value for safe design.
This paper is concerned with the block toppling failure in rock slopes. An attempt is made to improve the methods presently available for assessing in such cases the stability conditions. The influence of variability of
selected geometrical and strength parameters is included in the analysis. The results are presented by giving the probability distribution of rock volumes which are most likely to form and be unstable.
METHOD OF ANALYSIS
Geometry of problem Figure 1 shows a cross section of the rock slope with
a system of blocks on a stepped failure surface. Two discontinuity systems A and B with 100% persistence are assumed to be present in the rock mass as follows:
• Discontinuity system A: --the direction is close to that of the slope face and
the dip angle ~k is "steep".
f
if.-•
J
M4~rl l la
C a r l o
,® H ,/e
L 'A"B .I Fig. 2. Generation of the failure surface.
SCAVIA et al.: PROBABILISTIC TOPPLING FAILURE 467
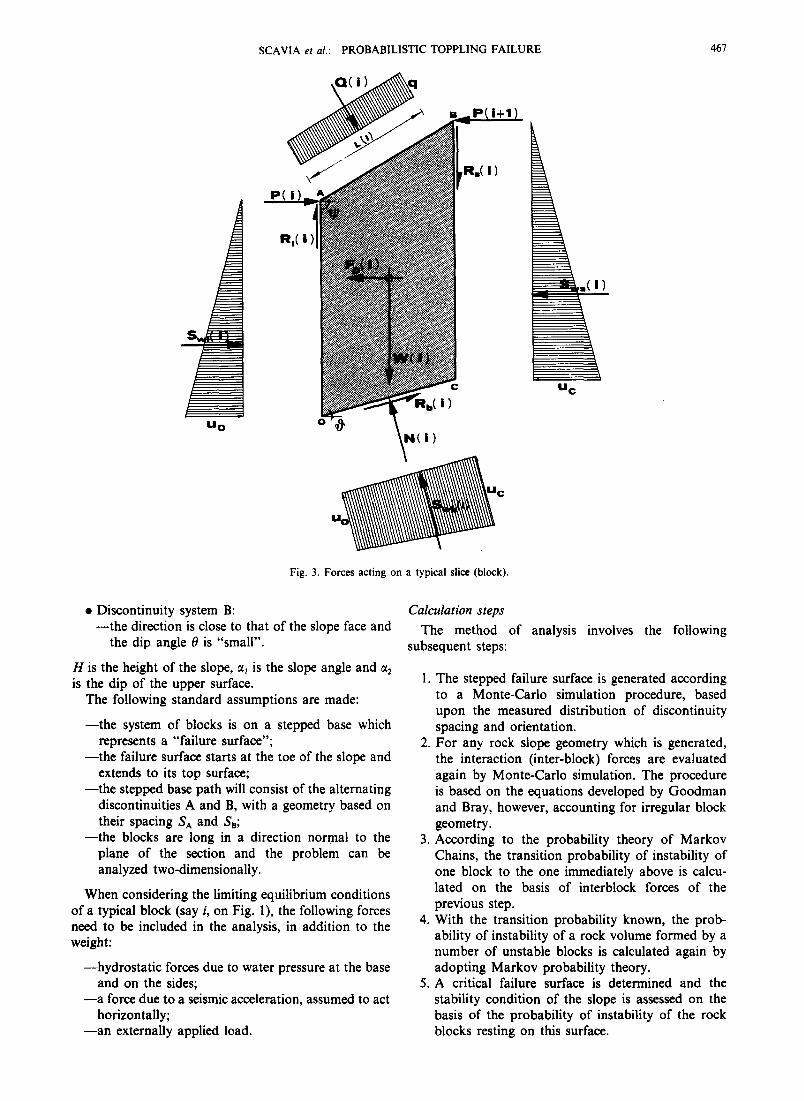
P(
U o
Fig. 3. Forces acting on a typical slice (block).
U C
• Discontinuity system B: -- the direction is close to that of the slope face and
the dip angle 0 is "small".
H is the height of the slope, 0t I is the slope angle and 0t2 is the dip of the upper surface.
The following standard assumptions are made:
-- the system of blocks is on a stepped base which represents a "failure surface";
-- the failure surface starts at the toe of the slope and extends to its top surface;
-- the stepped base path will consist of the alternating discontinuities A and B, with a geometry based on their spacing SA and SB;
--the blocks are long in a direction normal to the plane of the section and the problem can be analyzed two-dimensionally.
When considering the limiting equilibrium conditions of a typical block (say i, on Fig. 1), the following forces need to be included in the analysis, in addition to the weight:
--hydrostatic forces due to water pressure at the base and on the sides;
- - a force due to a seismic acceleration, assumed to act horizontally;
- -an externally applied load.
Calculation steps
The method of analysis subsequent steps:
involves the following
1. The stepped failure surface is generated according to a Monte-Carlo simulation procedure, based upon the measured distribution of discontinuity spacing and orientation.
2. For any rock slope geometry which is generated, the interaction (inter-block) forces are evaluated again by Monte-Carlo simulation. The procedure is based on the equations developed by Goodman and Bray, however, accounting for irregular block geometry.
3. According to the probability theory of Markov Chains, the transition probability of instability of one block to the one immediately above is calcu- lated on the basis of interblock forces of the previous step.
4. With the transition probability known, the prob- ability of instability of a rock volume formed by a number of unstable blocks is calculated again by adopting Markov probability theory.
5. A critical failure surface is determined and the stability condition of the slope is assessed on the basis of the probability of instability of the rock blocks resting on this surface.
468 SCAVIA et al.: PROBABILISTIC TOPPLING FAILURE
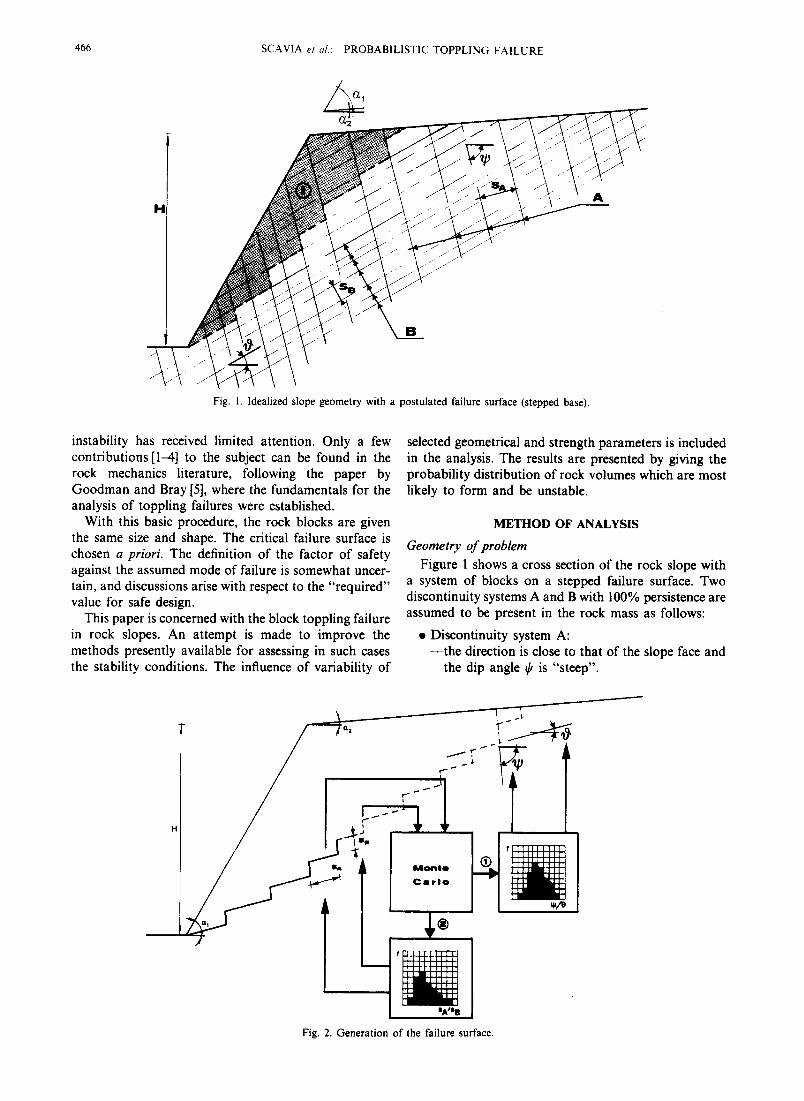
Generation of the failure surface The geometry of the problem is shown on Fig. 2.
The following assumptions are made:
(i) H, cq and ~2 are fixed input parameters; (2) ~b, 0, SA and S, are random variables, with a
measured distribution.
The process of failure surface generation according to a Monte-Carlo simulation involves the following steps (Fig. 2):
--selection at random from its measured distri- bution of single values of the angles ~, and 0, independently;
--similar generation of a series of values for the spacings SA and SB.
For any failure surface which is thus generated, the geometrical parameters of the rock blocks are evaluated according to the procedure shown in the Appendix.
Statistical distribution of inter-block forces For the resulting geometry of rock blocks in the slope,
resting on the estimated stepped failure surface, the n blocks are numbered in sequence starting with the one at the toe. For the (i)th block shown in Fig. 3 the statistical distribution of the forces P(i) transferred to the (i - 1)th block in limiting equilibrium conditions is calculated.
The force P(i) is assumed to be normal to the side of the (i)th block and applied at A, as depicted in Fig. 3. The following additional forces are acting on the same (i)th block:
--the weight W(i); --the hydrostatic forces Swi(i), Sw,(i) and Swb(i), at the
sides and at the base respectively, resulting from the water pressure distributions shown in Fig. 3;
--the shear forces R~(i), R,(i) and Rb(i), acting re- spectively, on the sides and on the base; these forces are related to the friction angles ~b~, at the sides, and q~b, at the base;
--the normal force N(i) acting on the base; --the seismic force FD(i), which is as usual given by
KW(i), with K being the seismic coefficient; --the force P(i + 1), transferred from the
(i + l)th slice, taken as normal to the side and applied at B;
--the forces Q(i) resulting from a stabilizing pressure distribution as shown in Fig. 3.
The following forces are assumed to be ran- domly selected variables: P(i + 1), R,., R,, Rb and FD. The shear forces are selected from the measured distri- bution of the friction angles ~bt and ~bb. The seismic force is selected from a known distribution of the seismic coefficient K.
r
S T A R T )
...,..m,n,.,,o/ n¢l r a n d o m / v m r l e b l e s /
J-1 _1
[ , , . ,oo. I
Isemplln, J ]
S l m p l l n S
o f 'IRICIom v a r l l b l l l
P ( I ' i )" MPdt( I~lr' Ps) 1
l-J*1
S I I I I I l l c S i m p l e of P
lul-1 t
( .o . )
L _/'
M.C. : M o n t e C a r l o
S i m u l a t i o n
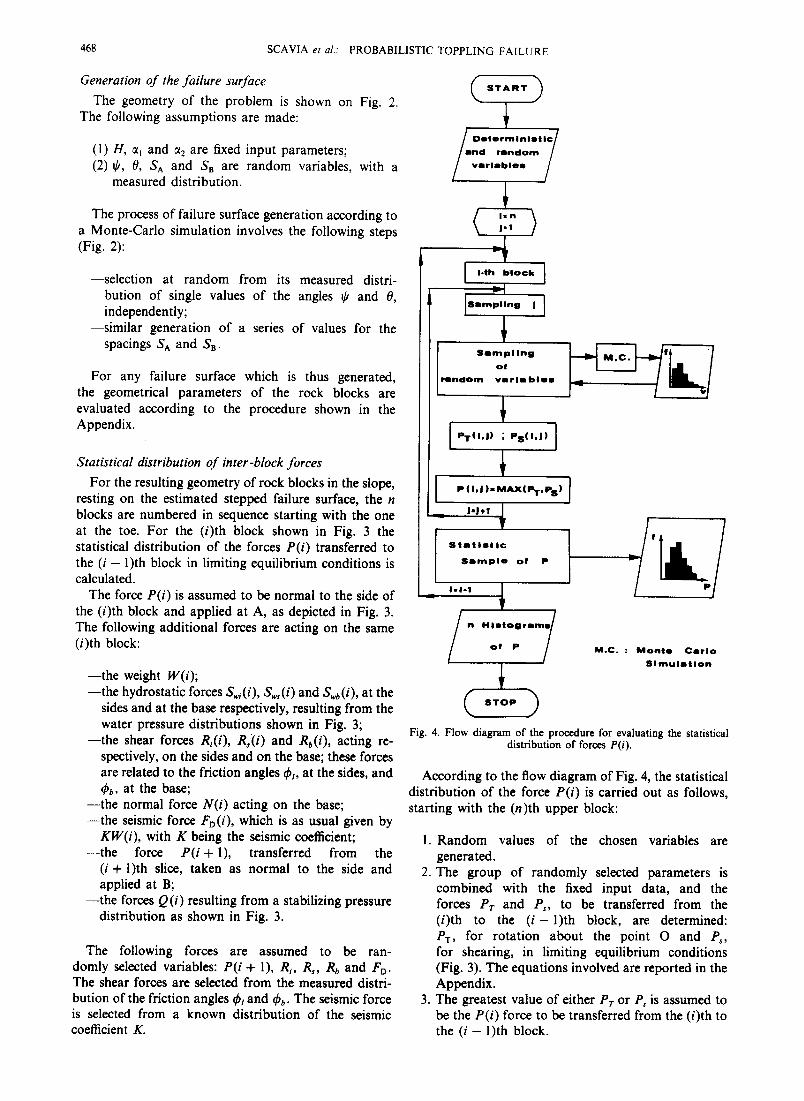
Fig. 4. Flow diagram of the procedure for evaluating the statistical distribution of forces P(i) .
According to the flow diagram of Fig. 4, the statistical distribution of the force P(i) is carried out as follows, starting with the (n)th upper block:
1. Random values of the chosen variables are generated.
2. The group of randomly selected parameters is combined with the fixed input data, and the forces Pr and P,, to be transferred from the (i)th to the ( i - 1 ) t h block, are determined: PT, for rotation about the point O and P,, for shearing, in limiting equilibrium conditions (Fig. 3). The equations involved are reported in the Appendix.
3. The greatest value of either PT or Ps is assumed to be the P(i) force to be transferred from the (i)th to the (i - l)th block.
SCAVIA et al.: PROBABILISTIC TOPPLING FAILURE 469
®
Pr " -
®
p(i)
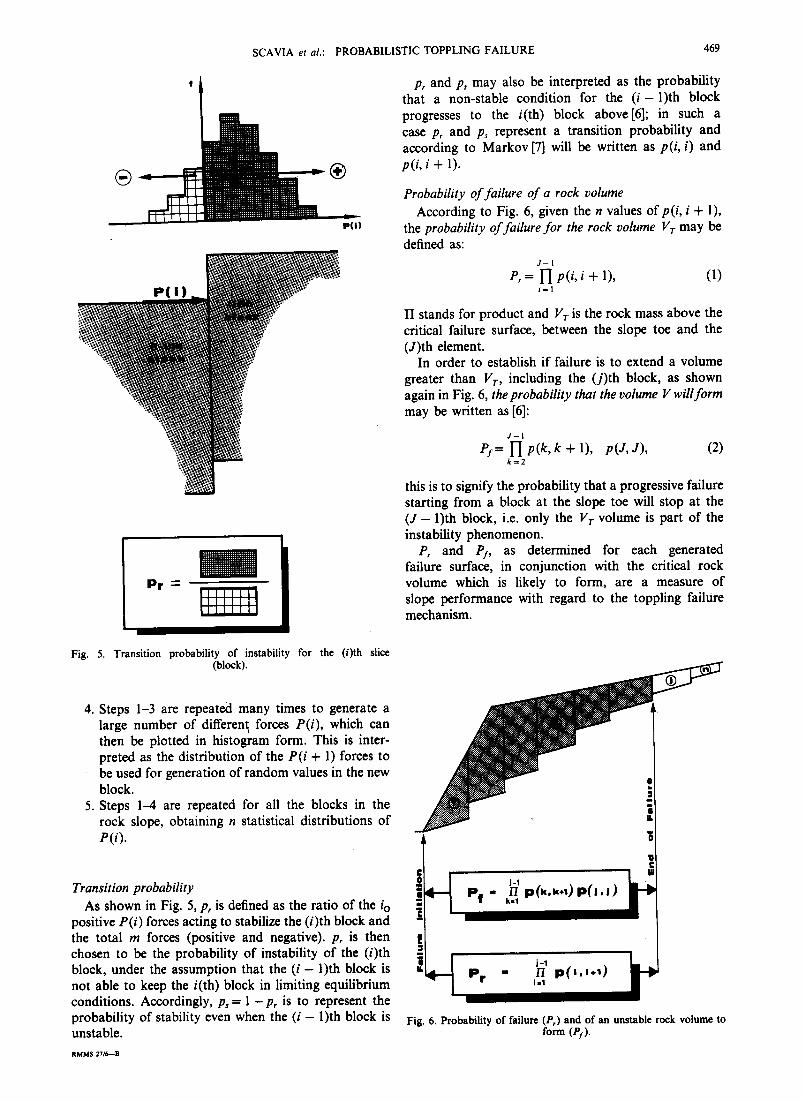
pr and p, may also be interpreted as the probability that a non-stable condition for the ( i - 1)th block progresses to the i(th) block above[6]; in such a case p, and p, represent a transition probability and according to Markov [7] will be written as p(i, i) and p(i, i + 1).
Probability of failure of a rock volume According to Fig. 6, given the n values ofp( i , i + 1),
the probability of failure for the rock volume Vr may be defined as:
J - I
P~ = 1-I p(i, i + 1), (1) i - I
I1 stands for product and Vr is the rock mass above the critical failure surface, between the slope toe and the (J)th element.
In order to establish if failure is to extend a volume greater than Vr, including the (j) th block, as shown again in Fig. 6, the probability that the volume V will form may be written as [6]:
J - I
Pf= VI p(k, k + 1), p(J, J), (2) kffi2
this is to signify the probability that a progressive failure starting from a block at the slope toe will stop at the (J - 1)th block, i.e. only the Vr volume is part of the instability phenomenon.
P, and PI, as determined for each generated failure surface, in conjunction with the critical rock volume which is likely to form, are a measure of slope performance with regard to the toppling failUre mechanism.
Fig. 5. Transition probability of instability for the (i)th slice (block).
4. Steps 1-3 are repeated many times to generate a large number of different forces P(i), which can then be plotted in histogram form. This is inter- preted as the distribution o f the P(i + 1) forces to be used for generation of random values in the new block.
5. Steps 1-4 are repeated for all the blocks in the rock slope, obtaining n statistical distributions of P(i).
Transition probability As shown in Fig. 5, p, is defined as the ratio of the iv
positive P(i) forces acting to stabilize the (i)th block and the total m forces (positive and negative), p, is then chosen to be the probability of instability of the (i)th block, under the assumption that the (i - l)th block is not able to keep the i(th) block in limiting equilibrium conditions. Accordingly, p~ = 1 - p , is to represent the probability of stability even when the (i - 1)th block is unstable.
RMMS 27/6---B
j-1 pf - p (" . ' " ) p( , .J)
j-1
P r = /-/ p ( : , l ÷ l ) i-1
Fig. 6. Probability of failure (P,) and of an unstable rock volume to form (el).
I M . C .
S T A R T )
I N P U T /
L.
F l l l l u r e ]
S u r f II C e JJ
I_
I - . " t .... . . r - - n . . ,
J T r e n l l t l o n , , , , ~mq
******* ** . ee l , - J . • P r o b a b i l i t y Pr( I )
I I ' M e r k o v T
,* P r o b l b l l l l y o f
r o Q k v o l u m e * * * * g . 0 * * * * f o r m i n S Pf l i n d
f l l l u l r o Pr
S u r f a c o o f F l i l u r e
I-i-l.~_ J
I I - i i * l
M . C . : M o n t e C e r l o S i m u l m t i o n
I L L . : L i m i t IEquI I I I0r lum
S T O P ) M e l h o d
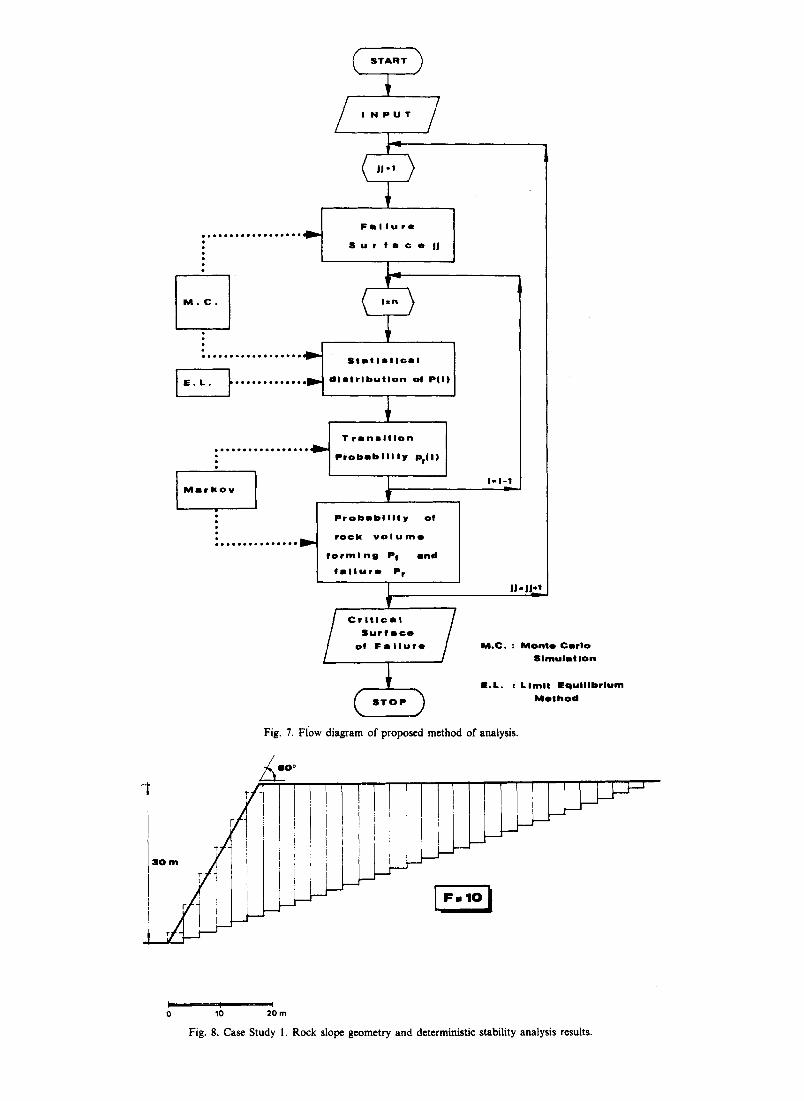
Fig. 7. Fl'ow diagram of proposed method of analysis.
i 3O m
, i
//• 00°
/ 'I
~ / ~ I i i ,̧
0 10 20 m
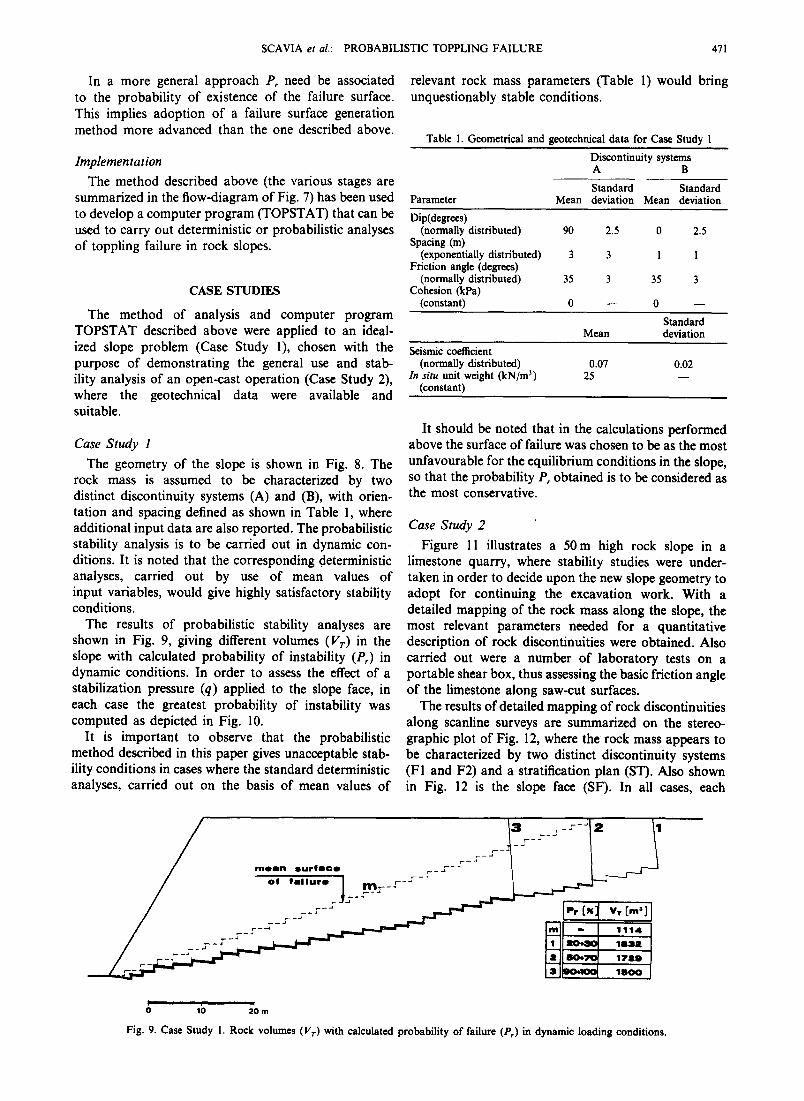
Fig. 8. Case Study I. Rock slope geometry and deterministic stability analysis results.
SCAVIA et al.: PROBABILISTIC TOPPLING FAILURE 471
In a more general approach P, need be associated to the probability of existence of the failure surface. This implies adoption of a failure surface generation method more advanced than the one described above.
lmplernentation The method described above (the various stages are
summarized in the flow-diagram of Fig. 7) has been used to develop a computer program (TOPSTAT) that can be used to carry out deterministic or probabilistic analyses of toppling failure in rock slopes.
C A S E S T U D I E S
The method of analysis and computer program TOPSTAT described above were applied to an ideal- ized slope problem (Case Study 1), chosen with the purpose of demonstrating the general use and stab- ility analysis of an open-cast operation (Case Study 2), where the geotechnical data were available and suitable.
Case Study 1 The geometry of the slope is shown in Fig. 8. The
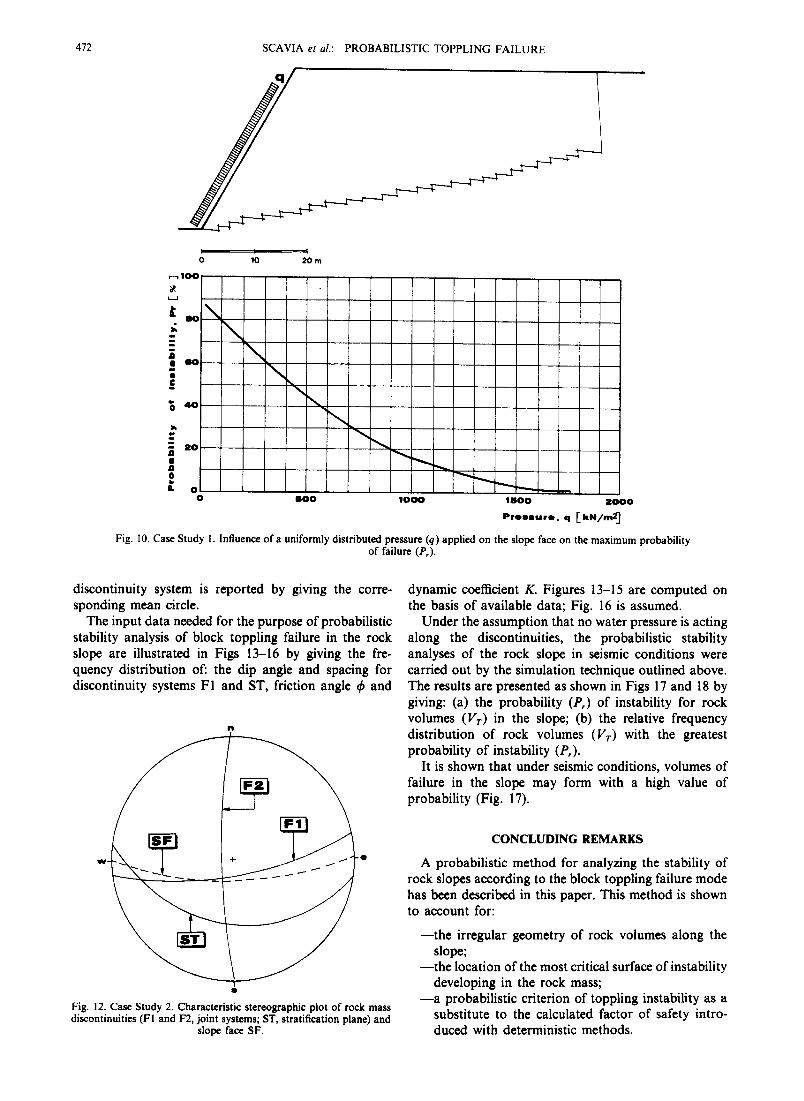
rock mass is assumed to be characterized by two distinct discontinuity systems (A) and (B), with orien- tation and spacing defined as shown in Table 1, where additional input data are also reported. The probabilistic stability analysis is to be carried out in dynamic con- ditions. It is noted that the corresponding deterministic analyses, carried out by use of mean values of input variables, would give highly satisfactory stability conditions.
The results of probabilistic stability analyses are shown in Fig. 9, giving different volumes (V r) in the slope with calculated probability of instability (Pr) in dynamic conditions. In order to assess the effect of a stabilization pressure (q) applied to the slope face, in each case the greatest probability of instability was computed as depicted in Fig. 10.
It is important to observe that the probabilistic method described in this paper gives unacceptable stab- ility conditions in cases where the standard deterministic analyses, carried out on the basis of mean values of
relevant rock mass parameters (Table 1) would bring unquestionably stable conditions.
Table 1. Geometrical and geotechnical data for Case Study 1
Parameter
Discontinuity systems A B
Standard Standard Mean deviation Mean deviation
Dip(degrees) (normally distributed) 90 2.5 0 2.5
Spacing (m) (exponentially distributed) 3 3 1 1
Friction angle (degrees) (normally distributed) 35 3 35 3
Cohesion (kPa) (constant) 0 - - 0 - -
Standard Mean deviation
Seismic coefficient (normally distributed) 0.07 0.02
In situ unit weight (kN/m 3) 25 - - (constant)
It should be noted that in the calculations performed above the surface of failure was chosen to be as the most unfavourable for the equilibrium conditions in the slope, so that the probability P, obtained is to be considered as the most conservative.
Case Study 2
Figure 11 illustrates a 50m high rock slope in a limestone quarry, where stability studies were under- taken in order to decide upon the new slope geometry to adopt for continuing the excavation work. With a detailed mapping of the rock mass along the slope, the most relevant parameters needed for a quantitative description of rock discontinuities were obtained. Also carried out were a number of laboratory tests on a portable shear box, thus assessing the basic friction angle of the limestone along saw-cut surfaces.
The results of detailed mapping of rock discontinuities along scanline surveys are summarized on the stereo- graphic plot of Fig. 12, where the rock mass appears to be characterized by two distinct discontinuity systems (F1 and F2) and a stratification plan (ST). Also shown in Fig. 12 is the slope face (SF). In all cases, each
gr' m ~ a . _ _ Z - X - - "
,,.-
I 0 1() 20 m
Fig. 9. Case Study 1. Rock volumes (Vr) with calculated probability of failure (P,) in dynamic loading conditions.
472 SCAVIA et al.: PROBABILISTIC TOPPLING FAILURE
l 0
1 0 0
L~J
.o!\
m £
"~ 4 o
- Z O & | & ! It o
o
I I 10 20 m
\ \
\ \
\
6 0 0 1 0 0 0 1 8 0 0 2 0 0 0
P r o • • u r e , q F k N / n z 2 ~
Fig. 10. Case Study 1. Influence of a uniformly distributed pressure (q) applied on the slope face on the maximum probability of failure (P,).
discontinuity system is reported by giving the corre- sponding mean circle.
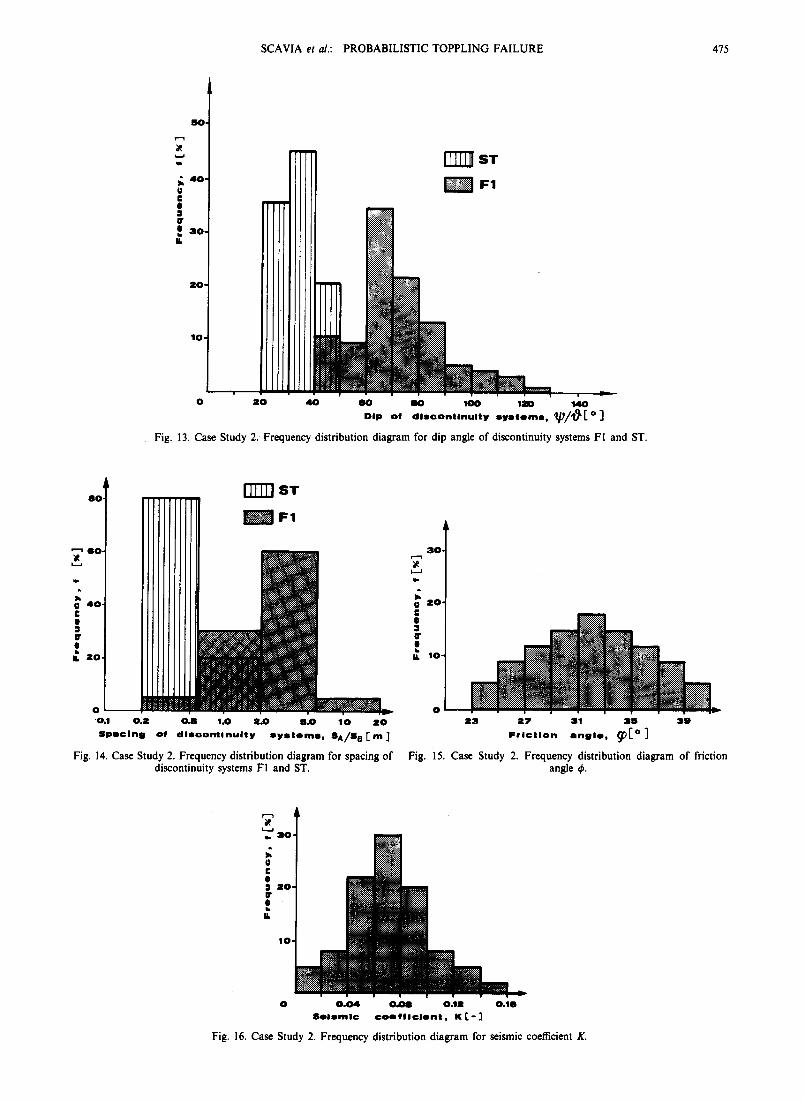
The input data needed for the purpose of probabilistic stability analysis of block toppling failure in the rock slope are illustrated in Figs 13-16 by giving the fre- quency distribution of: the dip angle and spacing for discontinuity systems F1 and ST, friction angle ~b and
n
w •
1
Fig. 12. Case Study 2. Characteristic stereographic plot of rock mass discontinuities (FI and F2, joint systems; ST, stratification plane) and
slope face SF.
dynamic coefficient K. Figures 13-15 are computed on the basis of available data; Fig. 16 is assumed.
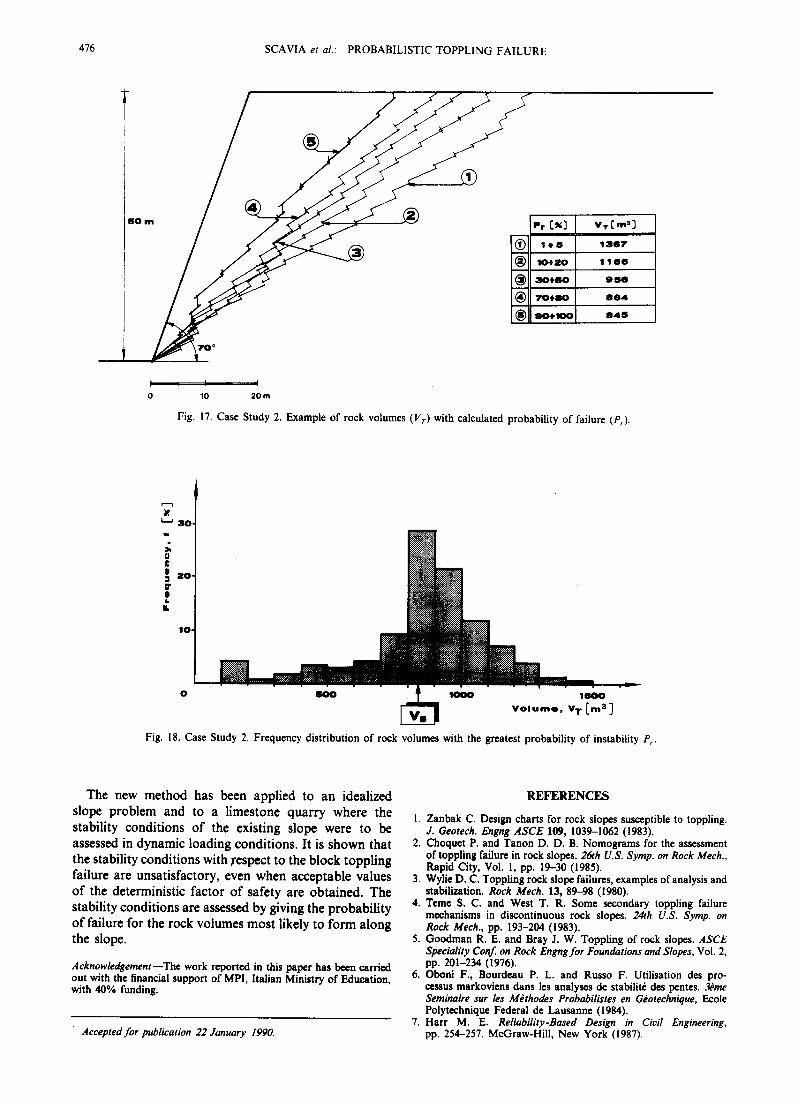
Under the assumption that no water pressure is acting along the discontinuities, the probabilistic stability analyses of the rock slope in seismic conditions were carried out by the simulation technique outlined above. The results are presented as shown in Figs 17 and 18 by giving: (a) the probability (Pr) of instability for rock volumes (V r) in the slope; (b) the relative frequency distribution of rock volumes (V r) with the greatest probability of instability (P,).
It is shown that under seismic conditions, volumes of failure in the slope may form with a high value of probability (Fig. 17).
CONCLUDING REMARKS
A probabilistic method for analyzing the stability of rock slopes according to the block toppling failure mode has been described in this paper. This method is shown to account for:
-- the irregular geometry of rock volumes along the slope;
-- the location of the most critical surface of instability developing in the rock mass;
- - a probabilistic criterion of toppling instability as a substitute to the calculated factor of safety intro- duced with deterministic methods.
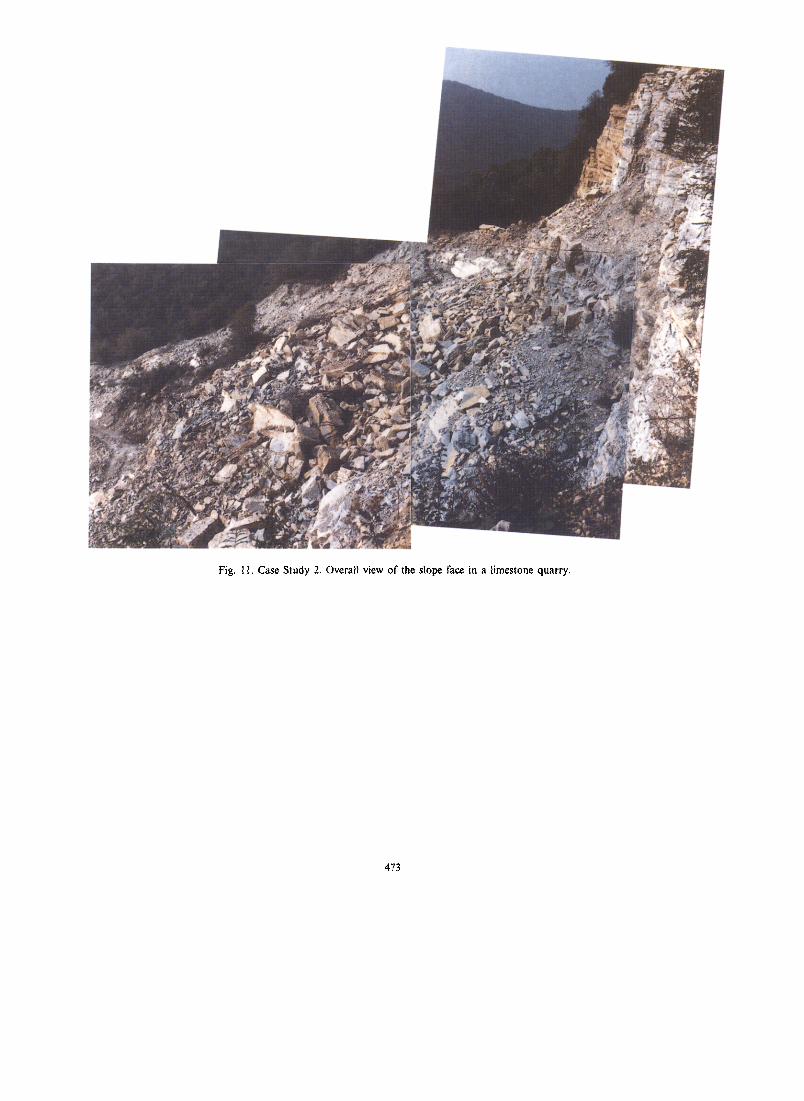
Fig. I I. Case Study 2. Overall view of the slope face in a limestone quarry.
473

SCAVIA etal.: PROBABILISTIC TOPPLING FAILURE 475
4 0 - O g !
ST
2 0 -
l O -
0 2 0 4 0 8 0 S O 100 1~0 140
Dip Of d i s c o n t i n u i t y s y s t e m s , ~ ) / ~ [ o ]
Fig. 13. Case Study 2. Frequency distribution diagram for dip angle of discontinuity systems FI and ST.
.I
($O- t..-a
U 4 O g t
cr t b U. 2 0
~ ' ~ ST
0.1 OJ O.S 1.0 g.O S.O 10 ZO S p a c i n g o f d i s c o n t i n u i t y s y s t e m s , SA/S B [ m ]
Fig. 14. Case Study 2. Frequency distribution diagram for spacing of
! M F 1
T 0 ~ 0 g e
~r ! ~- 1 0 -
F r i c t i o n a n g l e , ~ [ o ]
Fig. 15. Case Study 2. Frequency distribution diagram of friction discontinuity systems FI and ST. angle ~b.
3 0 ,
0 g e :l ~O" Ir !
1 0 .
::,<...:=:.~= ::::::::::::::::::::::: ::::::::::::::::::::::
!i!~iii!iii~i!i!il i!ii!iiiii~iiiiiiiiiiii iiiiiiiii!iii~i~iiiill
~!~:.!:. ~:.: ~i ~ :~!::: : ~: ~: : i~ /
0 0 . 0 4 O.Oe 0 .12 0 . 1 6 S e i s m i c c o e f f i c i e n t , K [ - ]
Fig. 16. Case Study 2. Frequency distribution diagram for seismic coefficient K.
476 SCAVIA et al.: PROBABILISTIC TOPPLING FAILURE
l
8 0 m
J
®
® ,o . -o
( ~ I S~D.I.IO0
r o 0
V,r [ ' m l ]
131$7
1 1 e 6
s ) s e
8 e 4
8 4 8
I t 10 20 m
Fig. 17. Case Study 2. Example of rock volumes (Vr) with calculated probability of failure (P,).
r---1
t -~ 3 0 . ql.
o e
0" e t .
IL
o 8 o o T lOOO 1 B o o V o l u m e , Y T I m 3
Fig. 18. Case Study 2. Frequency distribution of rock volumes with the greatest probability of instability P,.
The new method has been applied to an idealized slope problem and to a limestone quarry where the stability conditions of the existing slope were to be assessed in dynamic loading conditions. It is shown that the stability conditions with respect to the block toppling failure are unsatisfactory, even when acceptable values of the deterministic factor of safety are obtained. The stability conditions are assessed by giving the probability of failure for the rock volumes most likely to form along the slope.
Acknowledgement--The work reported in this paper has boon carried out with the financial support of MPI, Italian Ministry of Education, with 40% funding.
Accepted for publication 22 January 1990.
REFERENCES
1. Zanbak C. Design charts for rock slopes susceptible to toppling. J. Geotech. Engng ASCE 109, 1039-1062 (1983).
2. Choquet P. and Tanon D. D. B. Nomograms for the assessment of toppling failure in rock slopes. 2(xh U.S. Syrup. on Rock Mech., Rapid City, Vol. l, pp. 19-30 0985).
3. Wylie D. C. Toppling rock slope failures, examples of analysis and stabilization. Rock Mech. 13, 89-98 (1980).
4. Teme S. C. and West T. R. Some secondary toppling failure mechanisms in discontinuous rock slopes. 24th U.S. Syrup. on Rock Mech., pp. 193-204 0983).
5. Goodman R. E. and Bray J. W. Toppling of rock slopes. ASCE Speciality Conf. on Rock Engng for Foundations and Slopes, Vol. 2, pp. 201-234 (1976).
6. Oboni F., Bourdeau P. L. and Russo F. Utilisation des pro- ccssus markoviens clans les analyses de stabilit~ des pentes..~me Seminaire sur les M~thodes Probabilistes en G~otechnique, Ecole Polytcchnique Federal de Lausanne (1984).
7. Harr M. E. Reliability-Based Design in Civil Engineering, pp. 254-257. McGraw-Hill, New York (1987).
SCAVIA e t al.: PROBABILISTIC TOPPLING FAILURE 477
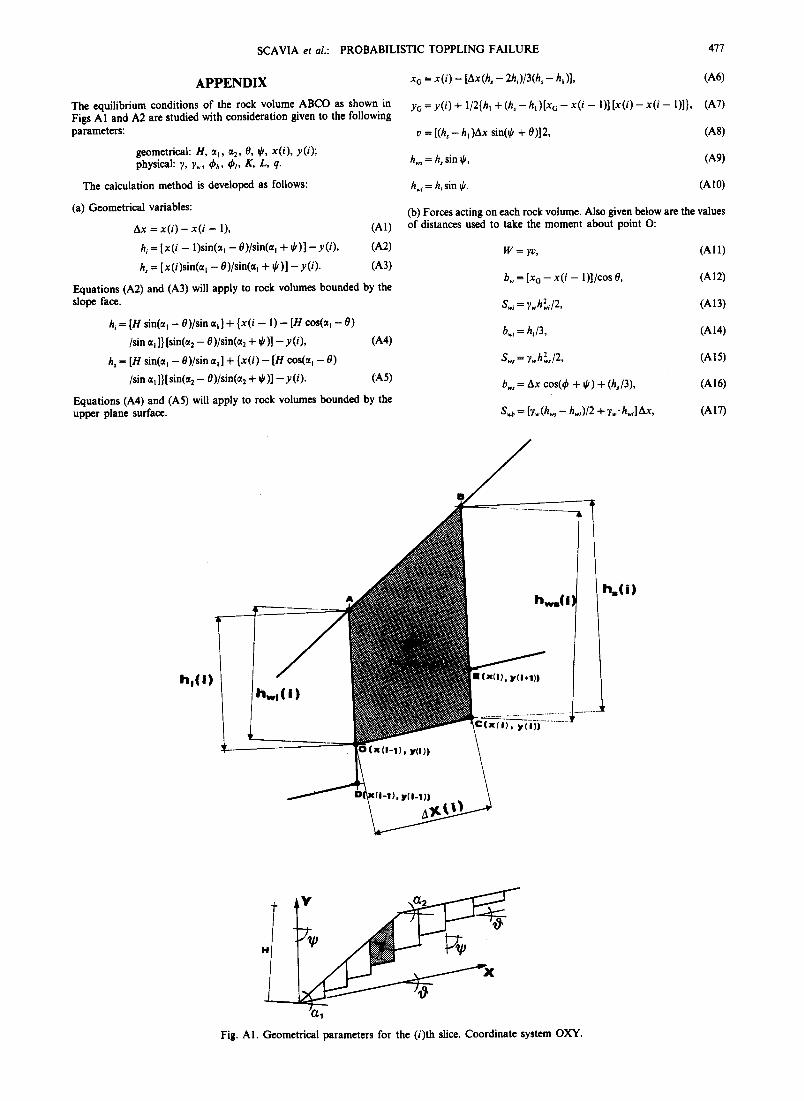
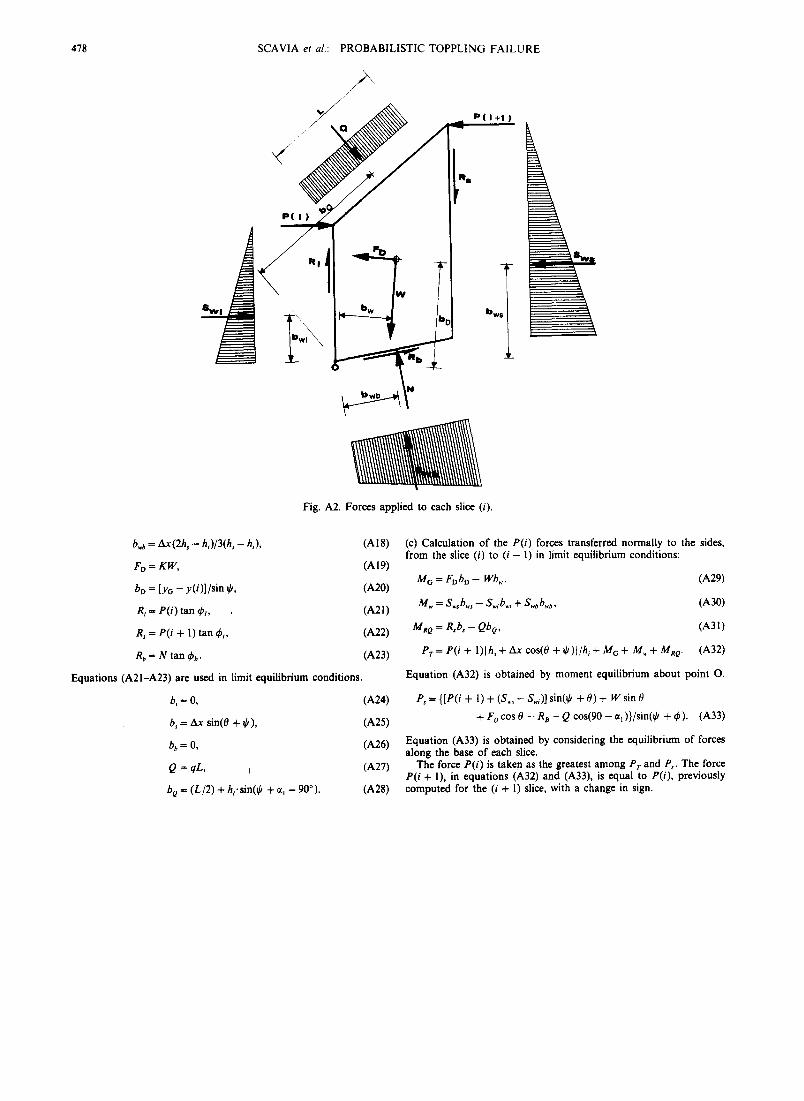
APPENDIX
The equilibrium conditions of the rock volume ABCO as shown in Figs A 1 and A2 are studied with consideration given to the following parameters:
geometrical: H, a I , a 2, 0, ~b, x(i), y(i); physical: ~,, ~,~, qbb, ~l, K, L, q.
The calculation method is developed as follows:
(a) Geometrical variables:
A x = x ( i ) - x ( i - - l), (A1)
hi = [ x ( i - 1)sin(a I - 0)/sin(hi + ~k)] - y ( i ) , (A2)
hs = [x ( i ) s in (a l - 0)/sin(a1 + ~,)] - y ( i ) . (A3)
Equations (A2) and (A3) will apply to rock volumes bounded by the slope face.
h~-- [H sin(a I - 0)/sin at] + { x ( i - I) - [H cos(a, - 0)
/sin a i] } [sin(a2 - 0 )/sin(a2 + ¢, )] - y (i), (A4)
h s = [H sin(al - 0)/sin al] + {x(i) - [H cos(a t - 0)
/sin al]}[sin(a2 - 0)/sin(a2 + ~)] - y ( i ) . (A5)
Equations (A4) and (A5) will apply to rock volumes bounded by the upper plane surface.
x G = x ( i ) - (Ax(h, - 2 h , ) / 3 ( h , - h i )], (A6)
y G = y ( i ) + l/2{h, + ( h , - h ~ ) [ x G - x ( i - l ) ] [ x ( i ) - x ( i - 1)]}, (A7)
v = [(hs- h~ )Ax sin(g, + 0)]2, (AS)
h~s = h~ sin •, (A9)
hwi = hi sin ~b. (AI0)
(b) Forces acting on each rock volume. Also given below are the values of distances used to take the moment about point O:
W = yv, (AI 1)
bw = [ x o - x ( i - l)]/cos 0, (A12)
S . i = •wh2i/2, (AI3)
b.i = h i/3, (A 14)
S , . = ? w h L / 2 , (AIS)
b. , = Ax cos(~b + ~,) + (hfl3), (AI6)
S . b = [~,.(h., - h. , , ) /2 + ?. . h~i] Ax, (AI7)
hw.(i)l / h ' ( i )
h,(I) h,. , ( I )
yo))
I (X(I), y(l+l))
, y(i})
I(1-I), y(I- l ) )
H
Fig. Ai . Geometrical parameters for the (i)th slice. Coordinate system OXY.
478 SCAVIA et al.:
/
P R O B A B I L I S T I C TOPPLING F A I L U R E
/ /
- - P ( I + | )
n~
S w I
P ( I )
J 1
Fig. A2. Forces applied to each slice (i).
b,,b = Ax (2h , - h,)/3(h, - hi),
F o = K W ,
b o = [y~ - y ( i )] / s in ~k,
R i = P( i ) tan 4),
Rs = P( i + 1) tan 4)1,
Rb = N tan 4)b.
(A18)
(A19)
(A20)
(A21)
(A22)
(A23)
Equations (A21-A23) are used in limit equilibrium conditions.
b i ~ 0~
b~ = Ax sin(0 + ~k),
b b = 0,
Q = qL, i
b e = (L/2) + h~.sin(~b + "l - 90°) •
(A24)
(A25)
(A26)
(A27)
(A28)
(c) Calculation of the P(i ) forces transferred normally to the sides, from the slice (i) to (i - 1) in limit equilibrium conditions:
M G = FDbD - Wb~,, (A29)
g . , = S . , b . . ~ - S . , b ~ + S.bb.,o, (A30)
Mt~ 0 = R,b~ - Qbo , (A31)
P r = P( i + l ) lh , + A x cos(O + ~b )l/h~ + MG + Mw + MRo. (A32)
Equation (A32) is obtained by moment equilibrium about point O.
P, -- { [P( i + 1) + (S . s - S.,,)] sin(~, + 0) + W sin 0
+ Focos 0 - R B - Q cos(90 - a~)}/sin(~k + 4)). (A33)
Equation (A33) is obtained by considering the equilibrium of forces along the base of each slice.
The force P( i ) is taken as the greatest among P r and Ps. The force P( i + I), in equations (A32) and (A33), is equal to P(i) , previously computed for the (i + I) slice, with a change in sign.