Probabilistic Seismic Soil Structure Interaction Analysis ... 2... · Deterministic and...
26
www.sgh.com Deterministic and Probabilistic Seismic Soil Structure Interaction Analysis of the Mühleberg Nuclear Power Plant SUSAN Building David K. Nakaki, Simpson Gumpertz & Heger Philip S. Hashimoto, Simpson Gumpertz & Heger James J. Johnson, James J. Johnson & Associates Yahya Bayraktarli, BKW FMB Energie AG Olivier Zuchuat, BKW FMB Energie AG Soil Structure Interaction Knowledge and Effect on the Seismic Assessment of NPP Structures and Components October 6-8, 2010 Ottawa, ON, Canada
Transcript of Probabilistic Seismic Soil Structure Interaction Analysis ... 2... · Deterministic and...
www.sgh.com
Deterministic and Probabilistic Seismic
Soil Structure Interaction Analysis of the Mühleberg Nuclear Power Plant SUSAN
Building
David K. Nakaki, Simpson Gumpertz & Heger
Philip S. Hashimoto, Simpson Gumpertz & Heger
James J. Johnson, James J. Johnson & Associates
Yahya Bayraktarli, BKW FMB Energie AG
Olivier Zuchuat, BKW FMB Energie AG
Soil Structure Interaction Knowledge and Effect on the
Seismic Assessment of NPP Structures and Components
October 6-8, 2010 Ottawa, ON, Canada

Overview of the Presentation
• Introduction
• Summary of the deterministic and probabilistic seismic
response analysis methodology
• Application to Mühleberg SUSAN Building
2
Introduction
• Seismic probabilistic safety assessment (PSA) of
Mühleberg Nuclear Power Plant (KKM) is currently being
updated.
• New seismic response analyses were performed using
current methods to determine median structure
responses for seismic fragility evaluation of structures,
systems, and components.
• Deterministic and probabilistic seismic response
analyses was performed for the KKM SUSAN Building
3

Methodology
• Establish Free Field Ground Motion
• Develop Median Earthquake Strain Compatible Site Soil
Properties
• Develop Fixed Base Structure Model
– Determine natural frequencies and mode shapes
• Determine SSI Parameters
– Foundation impedances
– Scattering matrices
• Perform SSI Response Analysis
4

Seismic SSI Response Analysis
• Deterministic SSI Response Analysis
– Single median-centered response analysis using CLASSI
– Results used to understand the soil-structure system dynamic
behavior.
• Probabilistic SSI Response Analysis
– Perform statistical sampling and Latin Hypercube Simulation
(LHS) experimental design
– Execute Seismic Methodology Analysis Chain with Statistics
(SMACS) methodology documented in NUREG/CR-2015.
– N = 30 simulations using LHS approach
– Perform SSI analyses for N = 30 simulations
– Compute median (50%) and 84% in-structure response spectra
(ISRS)
5
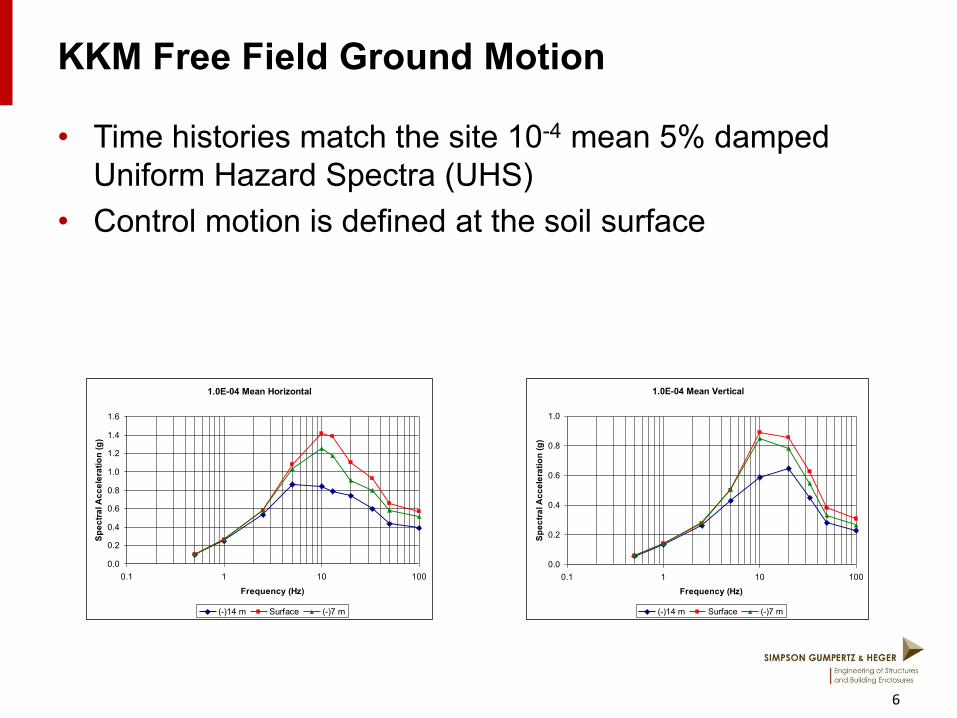
KKM Free Field Ground Motion
• Time histories match the site 10-4 mean 5% damped
Uniform Hazard Spectra (UHS)
• Control motion is defined at the soil surface
6
1.0E-04 Mean Horizontal
0.0
0.2
0.4
0.6
0.8
1.0
1.2
1.4
1.6
0.1 1 10 100
Frequency (Hz)
Sp
ec
tra
l A
cc
ele
rati
on
(g
)
(-)14 m Surface (-)7 m
1.0E-04 Mean Vertical
0.0
0.2
0.4
0.6
0.8
1.0
0.1 1 10 100
Frequency (Hz)
Sp
ec
tra
l A
cc
ele
rati
on
(g
)
(-)14 m Surface (-)7 m

Time Histories for Deterministic Analysis
• Two horizontal components and one vertical component
developed in general compliance with requirements of
ASCE 43-05
7

Time Histories for Probabilistic Analysis
• Thirty time history sets generated such that the median
spectral acceleration of the ensemble matched the
1.0E-04 UHS
• Ensemble was conditioned such that the spectral
acceleration coefficient of variation (COV) was
approximately 0.2 over the frequency range of interest (2
to 20 Hz).
• Additional variability included for horizontal and vertical
peak variability in accordance with recommendations of
EPRI TR-103959
8

Ensemble of Thirty Time Histories
0.0
0.5
1.0
1.5
2.0
2.5
1 10 100
Spe
ctra
l Acc
ele
rati
on
(g)
Frequency (Hz)
H1
9
0.0
0.2
0.4
0.6
0.8
1.0
1.2
1.4
1 10 100
Spec
tral
Acc
eler
atio
n (
g)
Frequency (Hz)
V
0.0
0.5
1.0
1.5
2.0
2.5
1 10 100
Spe
ctra
l Acc
ele
rati
on
(g)
Frequency (Hz)
H2

Median-Centered Soil Properties
• General site conditions consist of soil overburden on
rock substrate
• Low strain soil properties based on existing available site
data.
• Site response analysis was performed to establish
earthquake strain compatible soil properties for the
layered site.
– Shear wave velocity
– Soil damping
– Poisson’s ratio
– Density
10

Median-Centered Shear Wave Velocity Profile
11
0
50
100
150
200
250
300
350
400
450
500
0 1000 2000 3000 4000 5000 6000 7000D
ep
th (f
t)Shear Wave Velocity (ft/sec)
Low Strain Median Centered Strain Compatible

SUSAN Building Configuration
• Squat, rectangular, embedded reinforced concrete
structure
• Nominal grade elevation: 0 m
• Foundation plan dimensions: 19 m (EW) x 27.5 m (NS)
• Top of foundation located at Elevation (-)11 m
• Nominal floor elevations at
Elevations (-)7.3 m, (-)4 m, 0 m, 3.5 m, and 7.5 m.
• Very robust structural system
• Includes an interface structure on the east side which
provides access to the Reactor Building.
12

SUSAN Building Fixed Base Model
• SAP2000 Fixed Base Model – Beam and plate elements
– Median material properties
– 200 modes extracted
• Significant Fixed Base Modes – 9.40 Hz Fundamental EW (Y) mode
– 10.83 Hz Fundamental NS (X) mode
– 15.33 Hz Torsional mode
– 17.90 Hz Interface Structure Vertical
(Z) mode
– 19.82 Hz Fundamental Vertical (Z)
mode
• Output – Nodal geometry
– Mass matrix
– Natural frequencies and mode shapes
13

Development of SSI Parameters
• Hybrid method employed to calculate the embedded
foundation impedances and scattering matrices.
• The embedded foundation is modeled in SASSI2000
with the median soil properties.
• The unconstrained (flexible) impedances from the
SASSI2000 model are generated.
• The embedded region is idealized as rigid relative to the
surrounding soil.
• Scattering and impedance functions of the rigid
embedded foundation are generated by imposing rigid
body constraints within the embedded region.
14
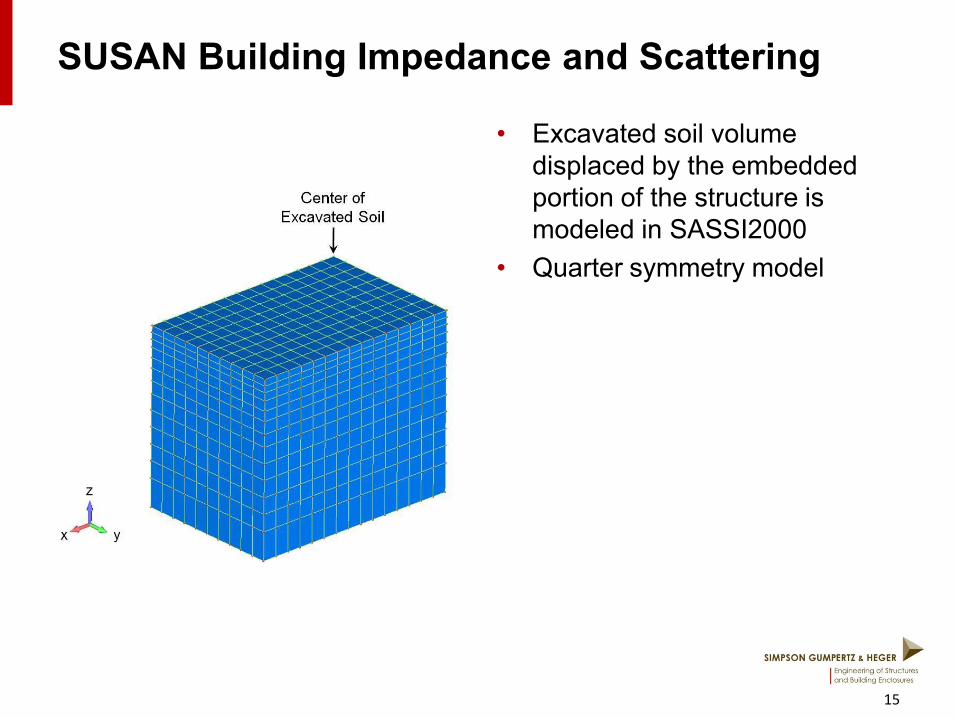
SUSAN Building Impedance and Scattering
• Excavated soil volume
displaced by the embedded
portion of the structure is
modeled in SASSI2000
• Quarter symmetry model
15

Deterministic Median In-Structure Response Spectra
X (NS) Direction, centers of floors Y (EW) Direction, centers of floors
16

Probabilistic SSI Response Analysis
• Consider variability of soil/foundation behavior, structure
dynamic properties, and input motion
• Statistical sampling and Latin Hypercube Simulation
experiment design
• SMACS analysis
– SSI response analysis of the N = 30 simulations
– Compute ISRS and probability distributions
17

Statistical Sampling and Latin Hypercube Simulation
• Model variability of the soil/foundation behavior by
modifying soil stiffness (shear modulus) and damping
through scale factors in the simulations
• Model variability in the structure dynamic properties by
shifts in fixed-base frequencies (stiffness) and modal
damping
18

Latin Hypercube Simulation Design
• Input
– Lognormal distribution of input parameters
– Soil shear modulus COV = 0.40
– Soil damping COV = 0.40
– Structure frequency COV = 0.15
– Structure damping COV = 0.35
• Analysis Techniques
– Latin Hypercube Simulation with 30 simulations
• Output
– Set of input scale factors for the earthquake simulations
– Scale factors are applied to parameters above
– Scale factors have median values of 1.0 and COV’s above
19

SMACS Analysis
• Perform response simulations using the ensemble of 30
earthquake acceleration time histories with the 30
combinations of soil stiffness and damping and structure
frequency and damping.
• Output in-structure response spectra and calculate
probability distributions
20

SUSAN Building In-Structure Response Spectra
21
0
0.2
0.4
0.6
0.8
1
1.2
1.4
1.6
0.1 1 10 100Sp
ect
ral A
cce
lera
tio
n, g
Frequency, Hz
SUSAN Building Probabilistic, Elevation 0 m, Center of Floor, Z-Direction
Median84%

Probabilistic Median In-Structure Response Spectra
X (NS) Direction, centers of floors Y (EW) Direction, centers of floors
22
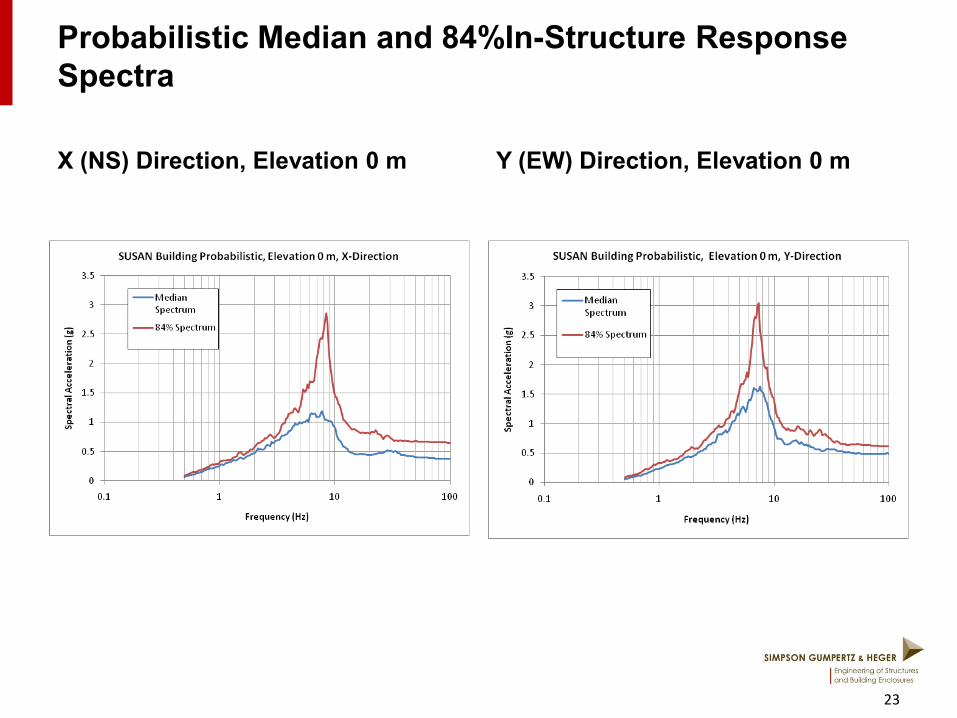
Probabilistic Median and 84%In-Structure Response
Spectra
X (NS) Direction, Elevation 0 m Y (EW) Direction, Elevation 0 m
23

Comparison of Median Deterministic and Probabilistic
In-Structure Response Spectra
Y (EW) Direction, Elevation 0 m Z (Vertical) Direction, Elevation 0 m
24

Advantages of the SMACS Approach
• Development of the fixed base structure model and
calculation of the modal properties represents most of
the engineering effort. Greater effort can be dedicated to
developing detailed models.
• Calculation of the impedance and scattering functions of
the embedded foundation represents significant
computation time, but is only done once using the hybrid
approach.
• By using SMACS to perform the SSI response analysis,
the thirty LHS SSI simulations were completed in
minutes.
25

Summary and Conclusions
• Deterministic and probabilistic SSI analysis were
performed for the KKM SUSAN Building
• The deterministic SSI analysis were used to benchmark
the probabilistic analysis.
• Deterministic and probabilistic methods produced
consistent results.
• Sharp spectral acceleration peaks in the deterministic
analysis are reduced by the probabilistic analysis.
• High variability was obtained at resonant frequencies of
the structure/soil system in the probabilistic analysis.
26